Abstract
Renewable sources play a crucial role in the decarbonisation process of the current linear economy, aimed at reaching the 2030 climate objectives and fulfilling the EU’s long-term strategy of achieving carbon neutrality by 2050. All economic subjects, including households, can contribute to the Green Deal goals. The main goal of this paper is to evaluate households’ consumption of energy sources for heating purposes in the Czech Republic in the period 2003–2020 and depict possible drivers of switching to biomass. For this, various data were collected, such as data published by the Czech Statistical Office, ministries, and other national authorities, as well as data from Eurostat. Concerning methods, data analysis, correlation analysis, and regression analysis were used. Different models focus on the substitution effect, rebound effect, and behaviour of different kinds of households. The results show a substitution effect connected with the consumption of coal, electricity, and biomass for heating purposes. Many households substituted coal for biomass in the observed period. On the other hand, the environmental impact of such substitution is not significant, as carbon emissions and emissions of other pollutants are stable. The substitution of fuels should be accompanied by technological change, e.g., improvement of combustion boilers. Moreover, households of pensioners are the key economic subjects with the highest impact on biomass consumption for heating purposes. Against this background we recommend policies to support households in replacing their boilers for more environmentally friendly ones.
1. Introduction
The concentration of atmospheric carbon dioxide has steadily been increasing since the beginning of the pre-industrial era. It is unequivocal that atmospheric carbon dioxide concentrations and global surface temperature are strongly coupled [1]. Global warming has resulted in an increased frequency, intensity, and duration of extreme weather events, such as heat-related events and droughts [2]. Human activities have rapidly changed the climate system in recent decades. Human-induced climate change already causes modifications across an enormous number of climate system components [3]. Simultaneously, anthropogenic sources of greenhouse gases such as the current fossil-based economic regime and linear flows of materials and energy, contribute to accelerating and intensifying the ongoing climate change [4].
In an effort to reverse the above-mentioned trend, a number of initiatives have been set up to decarbonise economies around the world. Generally, to frame climate-neutral policies and agendas, the carbon budget [5], which is defined as the cumulative amount of carbon dioxide emissions allowed to keep within a temperature target, is adhered to. In 2015 sustainable development goals [6] were developed to ensure prosperity for people and the planet. The Paris Agreement [7] was drawn up to reduce greenhouse gas emissions and limit the global temperature rise. Subsequently, the European Green Deal was created to meet the challenges of climate change. The European Union’s vision is a climate-neutral European economy by 2050 [8]. The transformation process requires rethinking policies for clean energy, industry, production and consumption, large-scale infrastructure, transport, etc. Regarding [8], more than 75 per cent of European greenhouse-gas emissions originate from the production and use of energy across the economy. There is a need to prioritise energy efficiency and decarbonise the energy sector. The legal target of achieving climate neutrality by 2050 is further set out in the European Climate Law [9]. The Fit for 55 package [10] defines milestones with the ambition to reduce greenhouse gas emissions by 55 per cent by 2030. Regarding forestry and wood biomass, a recent legislation revision contains various directions, such as increasing the adaptability of forests and the natural restoration of forests, as well as financially supporting sustainable forest management across European economies. The New EU Forest Strategy for 2030 [11] can be considered as part of the package and calls for the principle of cascading use of biomass and financial support for forest owners and rural areas. The sustainable economy policy package is complemented by the EU Bioeconomy Strategy [12] and the New EU Circular Economy Action Plan [13]. Altogether, bioeconomy is a bridge between the above-mentioned concepts, and it seems to be an area with an enormous ability to resolve a set of global challenges. The synergistic effect of the different concepts then provides an opportunity to transform economies more effectively. For example, the most common links can be observed in fields such as innovations, the principle of cascading use of materials, and change in business practices [14].
Circular economy and bioeconomy hold a crucial position in the transformation towards a more sustainable economy that respects both the social and ecological aspects of society. Bioeconomy, as a renewable segment of circular economy, includes forestry as one of its priorities. Bioeconomy can generate significant carbon savings in the form of carbon sequestration in soil, forests, and wood products, and also by replacing fossil and non-renewable resources with biomass. Several definitions of bioeconomy can be found in the literature [15,16,17]. Bioeconomy consists of traditional sectors, such as agriculture, forestry, aquaculture, and the production of paper and wood-related goods. On the other hand, innovative sectors emerged, especially bioenergy, biofuels, biochemicals, etc. The updated EU Bioeconomy Strategy [12] tries to achieve sustainable management of natural resources; reduce dependence on non-renewable, unsustainable resources; mitigate and adapt to climate change; and create new jobs. Bioeconomy strategies and policies at the national level are available in Germany [18] (p. 60), Finland [19] (p. 24), Sweden [20] (p. 26), Italy, [21] or the Netherlands [22].
Forestry bioeconomy is a necessary element of climate-neutral transformation. Forests represent essential carbon sinks and provide the largest source of renewable biomass. However, human conduct related to biomass production and its subsequent use for bioenergy purposes can introduce additional benefits as well as conflicting side effects and risks in several areas, such as land degradation, food insecurity, or greenhouse gas emissions [23]. In this sense, cleaner energy sources and technologies can propel adaptation while mitigating the climate-change impact, and boost the range of energy supplies as well as socio-economic and health benefits. A study by [24] points out that climate change can lead to divergent climatic scenarios in the world’s major forest areas. The authors of [25] examined the global supply and demand for biomass and biomass energy. For forestry bioeconomy, the most critical challenges lie in innovative forest-resource management which simultaneously escalates wood and non-wood production [26]. Scientific literature by [27] summarised types of innovations in forest-based bioeconomy, for example the development of production methods, innovations in goods and services, and innovations in later stages of development.
Enormous quantities of agricultural biomass can be transformed into biofuels [28]. Nonetheless, aspects such as damage to the environment, and competing applications for agricultural biomass require exploration regarding their effects on soil and biofuel conservation. Application of the principle of conversion of agricultural biomass waste into biochar can offer huge benefits to the environment and restore carbon deposits in soil [29].
Regarding energy from agricultural biomass, low-quality biomass coming from the production of food, feed and/or fibre, is the most promising area [30]. Simultaneously, organic agriculture seems to be a sustainable practice to avert negative consequences on the environment caused by the activities of conventional agriculture [31]. Energy production from biomass coupled with wind power and solar plants may represent a promising combination for moving away from fossil fuels. The authors of ref. [32] proposed how agriculture can assist in bioenergy production and identified the optimal land use solutions between farmers’ income and biomass energy production. To achieve circular bioeconomy targets, there should be sufficient biomass of adequate quality to ensure food security of the growing population as well as the production of bioenergy [33].
Generally, there is pristine biomass waste originating from industry, agriculture and forestry, that represents an enormous possibility for the production of liquid biofuel, electric energy, and heat energy [34]. For example, ref. [35] provided results of potential for developing biomass heating systems based on agriculture and forestry biomass.
Generally, the Czech Republic is classified as a non-specialised bioeconomy [36]. In the Czech Republic, the first strategic framework for circular economy [37] (p. 160) has been approved with a necessary role of bioeconomy within the circular economy model. By 2040, the Czech Republic will rely primarily on the use of waste for energy purposes and the use of wood as a renewable raw material. Ultimately, there will be an attempt to ensure the sustainable production of biomass for materials, energy, and fuels. The Concept of State Forestry Policy until 2035 [38] (p. 32) deals with increasing biodiversity and ecological stability of forest ecosystems while maintaining industrial production in the face of ongoing climate change. The long-term goal is to develop sustainable forest management and financially support owners to manage forests sustainably. For example, ref. [39] analysed the present direction of bioeconomy in the Czech Republic. Regarding [40], opportunities for sustainable forest biomass and high-added-value products opened up in the forestry market in the Czech Republic. In addition, health conditions in traditional economic sectors such as forestry, agriculture, and food industries seem to be necessary for the development of a circular economy [39]. Currently, the bark beetle calamity [41] has affected forestry bioeconomy in the Czech Republic. Both ecological and economic impacts are noticeable. From an ecological perspective, Czech forests became a source of carbon dioxide emissions for the first time in 2018 [42]. According to the imports and exports of the Czech Republic [43] (p. 47), exports of raw timber have been on the rise and in 2019 reached a value of more than 19 billion CZK (800 million USD) with a total volume of around 16.4 million cubic meters. The main elements were spruce timber and pulpwood. Moreover, 81.5 per cent of total Czech exports flowed to the EU-28, with the highest shares going to Austria (38.8 per cent), Germany (21 per cent), Slovakia (7.1 per cent), and Poland (5.7 per cent). A report by [43] noted extreme timber harvesting, a drastic drop in the wood price, and hectares of recently planted mixed forests.
With the energy sector in the spotlight, renewable sources play a central role in the process of decarbonising the current linear economy. Energy efficiency and renewable energies have great potential for economic development in Europe’s regions by boosting energy security, creating jobs, and increasing regional autonomy, as well as helping to fight climate change [44]. The European Union has contributed greatly to the growth of these sectors in Europe, with the Europe 20/20/20 targets setting the mid-term policy framework, and a variety of programmes and tools providing funding and support for regional development.
Regarding scientific studies, we discovered mainly studies analysing and evaluating public policies and public support of renewable energy sources and their success in Europe as a whole [45,46] or in selected federal states of the USA [47,48]; however, most of those studies are based on national case studies evaluating domestic economic instruments and on state public policies supporting renewable energy sources, for example in Romania [49], Lithuania [50], Spain [51], or China [52].
In the coming years, energy production will require an increasing volume of biomass. According to [53], woody biomass residues, agricultural biomass, and purpose-grown biomass crops will be increasingly utilised for energy production. Other than that, biomass waste played a crucial role in emphasizing the importance of biorefinery processes within circular bioeconomy [54]. Moreover, charcoal is agreeably a sustainable biofuel and a substantial product of forestry bioeconomy [55]. A few national-level cases can be studied, e.g., [56] who carried out an analysis of regional charcoal production in Sub-Saharan Africa. In addition, a study by [57] offers an analysis of the utilisation of renewable energy sources, focusing on biomass. A paper by [58] offers the depiction of several transformation scenarios in Austria towards a low-carbon bioeconomy, integrating the energy sector, biomass flows, and land use.
The behaviour of households is central for powering the structural changes in the energy market, as this sector remains responsible for a considerable portion of the consumption of fuels for heating purposes. The behaviour of households in the area of making choices considering fuels used for heating, is the focus of the present research.
The motivation to undertake this effort stems from the following reasons:
- (1)
- Non-existent written knowledge of the problem: during our review of scientific research publications in the form of peer-reviewed journals, research studies, and research papers, it became apparent that, so far, no author confronted the problem. The four parameters of our research (fuel consumption issues, household segments, regional localisation, and behavioural aspects) are not analysed together in any research paper. At least two of the parameters are always missing;
- (2)
- Economic relevance and urgency of the issue addressed.
The main goal of this paper is to evaluate households’ consumption of energy sources for heating purposes in the Czech Republic in the period 2003–2020 and depict possible drivers of switching from solid fossil fuels to biomass.
The following research questions underline the main goal:
- RQ1
- Focusing on households’ consumption of fuels for heating purposes in the Czech Republic in 2003–2020, is there a substitution effect of coal for biomass?
- RQ2
- Can a rebound effect be observed in this period?
- RQ3
- Is the consumption behaviour of various households similar or different during the observed period?
2. Materials and Methods
2.1. Materials
For the period 2003–2020, we collected detailed data connected with the consumption of households (consumption of solid fuels, such as biomass, brown coal, black coal, coke, and brown coal briquettes); energy prices (price of coal, wood, electricity, and natural gas); general socio-economic indicators (GDP, wages, environmental investments); and data concerning consumption of different kinds of households (households of employees, self-employed and pensioners). Various data sources were used, mainly from the Eurostat database [59], the Ministry of Industry and Trade [60,61], the Czech Statistical Office [62], the Czech press monitoring agency [63] and the IEA [64].
Table 1 shows an overview of all data/variables used for correlation and/or regression analyses presented in this paper, including abbreviations, units, and the roles of the variables.

Table 1.
List of variables.
The key dependent variable was “BIO”, i.e., biomass-consumption of households, in total, in GJ. Regarding independent variables, they were chosen based on their expected influence on consumption of households. Keeping our research questions in mind, independent variables are represented by characteristics of substitutes of biomass, such as coal, coke, coal briquettes, electricity, and natural gas. For the analysis, price and consumption indicators were used. Regarding price, we expected a positive impact of an increase in price of substitutes on consumption of biomass (see Table 2). In case of consumption of substitutes (coal and related coal products), we expected a negative impact on consumption of biomass. These assumptions are based on economic theories, described for example in [65]. Concerning the impact of socio-economic indicators, the impact of an increase in GDP, wage, and environmental investments on consumption of biomass is not clear. This assumption is based on [66]. Focusing on behaviour of different kinds of households, including households of pensioners, net money expenditure for solid fuels is observed. The expected impact on consumption of biomass is not clear. Time represents the control variable, based on the statistics the expected impact is positive (consumption of biomass for heating purposes increased in the selected period).
Table 2.
Expected impact of variables.
The following Table 3 summarizes parameters of the variables described in Table 1. For each variable, minimum and maximum values, standard deviation, and median are indicated.
Table 3.
Overview of the data statistics.
2.2. Methods
The main goal of this paper is to evaluate households’ consumption of energy sources for heating purposes in the Czech Republic in the period 2003–2020 and depict possible drivers of switching to biomass. To achieve the main goal, the following research questions are discussed:
- RQ1
- Focusing on households’ consumption of fuels for heating purposes in the Czech Republic in 2003–2020, is there a substitution effect of coal for biomass?
- RQ2
- Can a rebound effect be observed in this period?
- RQ3
- Is the consumption behaviour of various households similar or different during the observed period?
To achieve the goals of the research, the authors used the following methods: literature review, data analysis, correlation analysis, and regression analysis. Correlation analysis (Pearson’s correlation coefficient) and regression analysis were carried out based on the data described above (Table 1 and Table 3). The authors used linear regression models which calculate the relation between dependent variable and all other variables.
The general regression equation of MOD is as follows:
where:
Y = β0 + β1X1 + β2X2 + ……… βnXn + u
YBIO (biomass-consumption of households for heating purposes, in total, in GJ); β0 to βn—regression coefficients that reflect the impact of the independent variable on the dependent variable; u—random element of the model.
With respect to our research questions, we created and tested the following models:
- (1)
- Substitution model;
- (2)
- Price model;
- (3)
- Households model.
Substitution model (1) represents the relationship between biomass consumption for heating purposes (Y—BIO) and its substitutes: brown coal, black coal, coke, and brown coal briquettes. The regression equation of such model is as follows:
where:
Y = β0 + β1X1 + β2X2 + β3X3 + β4X4 + u
Y—BIO (biomass-consumption of households for heating purposes, in total, in GJ); X1—CBL (consumption of households, black coal); X2—CBR (consumption of households, brown coal); X3—COCO (consumption of households, coke); X4—COBRI (consumption of households, brown coal briquettes); u—random element of the model.
Price model (2) represents the relationship between biomass consumption for heating purposes (Y—BIO) and prices of energy sources, such as coal, wood, electricity, and natural gas. The regression equation of such model is as follows:
where:
Y = β0 + β1X1 + β2X2 + β3X3 + β4X4 + u
Y—BIO (biomass-consumption of households for heating purposes, in total, in GJ); X1—PRCO (price of coal for households); X2—PRWO (price of wood for households); X3—PREL (price of electricity for households); X4—PRNG (price of natural gas for households).
Households model (3) represents the relationship between biomass consumption for heating purposes (Y—BIO) and expenditures of various kinds of households, such as households of employees, self-employed, and pensioners. The regression equation of such model is as follows:
where:
Y = β0 + β1X1 + β2X2 + β3X3 + u
Y—BIO (biomass-consumption of households for heating purposes, in total, in GJ); X1—HEMP (expenditures of households of employees); X2—HSELF (expenditures of households of self-employed); X3—HPEN (expenditures of households of pensioners).
3. Results
3.1. Correlation Analysis
For correlation analysis, all selected variables which can influence the consumption of biomass by households for heating purposes were used. These variables are described in the above chapter, Table 1, Table 2 and Table 3, in more detail. The following Table 4 shows the results of the correlation analysis.
Table 4.
Correlation analysis.
Based on the results of the correlation analysis, we can observe statistically significant negative correlations between BIO (consumption of biomass for heating purposes), COBR (consumption of households: brown coal) and COCO (consumption of households: coke). There are also negative correlations in the cases of COBL (consumption of households: black coal), COBRI (consumption of households: brown coal briquettes), and PRWO (wood price). However, their statistical significance is lower.
Concerning statistically significant positive correlations, these are visible in the case of PRCO (coal price), PREL (electricity price), PRNG (natural gas price), HEMP (expenditure of households of employees), HPEN (expenditure of households of pensioners), and the control variables GDP, WAGE, and TIME. In addition to these relationships, there are other positive correlations with lower statistical significance, such as BPRES (biomass in press), HSELF (expenditure of households of self-employed), and INV (environmental investments).
3.2. Substitution Effect
For analysis of the substitution effect, the following models consider consumption of various kinds of fuels and price of fuels (substitutes).
First, consumption of fossil solid fuels in relation to consumption of biomass is observed, using regression model 1, the substitution model. First, we tested the model containing consumption of all possible substitutes (solid fuels), such as black coal, brown coal, coke, and briquettes. Following that, we tested various models in order to find the most statistically significant model with a high index of determination.
The results are presented in the following Table 5.
Table 5.
Regression analysis—substitution model.
MOD 1 consists of all independent variables (COBL, COBR, COCO, COBRI, and TIME). The whole model is statistically significant (see significance F), but not all selected variables are statistically significant.
MOD2 represents selected variables with statistical significances of p < 0.05. This model is the statistically significant model—all variables are statistically significant and the whole model is also statistically significant. The results from Table 5 illustrate that both presented models have a high coefficient of determination, which means that in the case of MOD2, the general formula that is specified explains almost 96% of the variance with less than 5% of random deviations. Variables with a p-value of below 5% are COBR, COCO, and the constant. According to the outcomes of the overall F-test, the estimated regression model of substitution is statistically significant at 1% level of significance. The result of Durbin–Watson test (DW) is also acceptable (1.595). This value expresses that MOD2 shows no autocorrelation.
Based on the results presented in Table 5, there is a statistically significant negative relationship between consumption of biomass and consumption of both brown coal and coke. We can write the following regression equation:
Y = 89031063.08 − 13837.273 COBR − 432222.380 COCO + u
Secondly, the relationship between prices of substitutes and consumption of biomass is observed. For this, we used regression model 2, the price model. Analogous to the substitution model, we tested the more general model and then the specific ones. First, we tested the model containing prices of all possible substitutes, such as coal, electricity, and natural gas. Following that, we tested various models in order to find the most statistically significant model with a high coefficient of determination.
The results are presented in Table 6.
Table 6.
Regression analysis—price model.
MOD3 consists of all independent variables (PRCO, PREL, PRNG, and TIME). The whole model is statistically significant (see significance F), but not all selected variables are statistically significant.
MOD4 represents selected variables with statistical significances of p < 0.01. This model is the statistically significant model—all variables are statistically significant and the whole model is also statistically significant. The result of the F-test leads to the conclusion that the estimated regression model is statistically significant at the 1% level of significance. Variables with a p-value of below 5% are PREL, TIME and the constant. The values of the F-test are normal with a high coefficient of determination. The result of the Durbin–Watson test (DW) is also acceptable (1.214). Such value expresses that MOD4 shows no autocorrelation.
Based on the results presented in Table 6, there is a statistically significant positive relationship between consumption of biomass and price of electricity, and the influence of the time is also positive. We can write the following regression equation:
Y = −2801304477 + 2661.194 PREL + 1412435.463 TIME + u
3.3. Rebound Effect
As Czech households substituted fossil solid fuels with biomass during the time period of 2010–2020 where disaggregated data is available, the level of total energetic throughput remained stable (with two peaks due to temperature lows), while total CO2 emission production stemming from heating increased slightly, as woody biomass has been reported to emit higher emission levels per unit of energy when compared to coal-related fuels during stationary combustion [67]. A slight rebound effect in a sense of increased emissions due to switching consumption patterns for biomass can hence be observed in Figure 1 which is further elaborated on in the discussion of the present research.
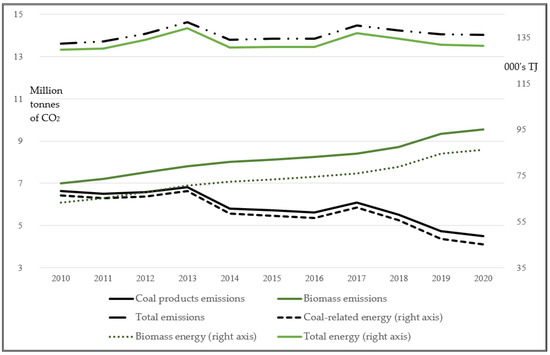
Figure 1.
Emissions and energy obtained (various fuels, 2010–2020, Czech households). Source: authors’ calculations based on the data reported in [60,61,67].
3.4. Households of Pensioners
Based on the correlation analysis, increase in biomass consumption should be connected with an increase in net expenditures of all kinds of households, specifically households of employed, self-employed, and pensioners. For this, we used regression model 3, the households model. Analogous to the models presented above, we first tested the general model containing expenditures of households of employees, households of self-employed, and households of pensioners. Following that, we tested various specific models for finding the most statistically significant model with a high determination index.
The results are presented in Table 7.
Table 7.
Regression analysis—households model.
MOD5 consists of all independent variables (HEMP, HSELF, HPEN, and TIME). The whole model is statistically significant, but not all selected variables are statistically significant.
MOD6 represents selected variables with statistical significances of p < 0.05. This model is the statistically significant model—all variables are statistically significant and the whole model is also statistically significant. The results from Table 7 illustrate that both presented models have a high determination index, which means that in the case of MOD6, the general formula that is specified explains more than 99% of the variance with less than 1% of random deviations. Variables with a p-value of below 5% are HEMP, HPEN, TIME and the constant. According to the outcome of the overall F-test, the estimated regression model of substitution is statistically significant at the 1% level of significance. The result of the Durbin–Watson test (DW) is also acceptable (1.285). This value expresses that MOD6 shows no autocorrelation.
Based on the results presented in Table 7, there is a statistically significant positive relationship between consumption of biomass and both net expenditures of households of pensioners and time. We can observe simultaneous negative influence of net expenditures of employees on the consumption of biomass. The following regression equation can be written:
Y = −3239872214 − 3753.124 HEMP + 3790.121 HPEN + 1634380.265 TIME + u
4. Discussion
Although the total energetic throughput of Czech households for heating purposes remained stable during the timeline studied herein, the composition of its sources changed considerably and such trend bears noteworthy implications.
Firstly, and perhaps most importantly, when households substituted solid fossil fuels for renewable sources of heating (biomass) in this scenario, they were making a choice oftentimes perceived as environmentally conscious. While a move in a sustainable direction certainly seems eco-friendly, as trees can be grown while coal is finite, the assumption does not hold when considering CO2 emission levels. As depicted in Figure 1, the level of CO2 emissions rose due to households behaving in this manner as the stationary combustion of woody biomass tends to be “dirtier” than that of any coal-related fossil fuel [59]. Hence, the forces which allured households into switching their consumption patterns in favour of biomass did not produce a Jevons paradox, as the motivation for substitution was not mainly powered by price advantageousness and the total throughput remained stable over time. A by-product of this transition, however, is a rebound effect of a type where “green” behaviour tends to have unforeseen negative consequences in the form of increased emissions. This situation provides opportunity for policy intervention in the form of support for more emission-effective boilers.
Secondly, this transition engenders another negative impact in the form of deforestation. According to [68], the Czech Republic experienced a net loss of 75 kilohectares of tree cover from 2000 to 2020 whereby over 98% of this change occurred due to forestry (the reminder was caused by urbanization and agriculture). The country is a major exporter of both cut and rough wood [43,69] and was a subject to a severe bark beetle calamity recently, but the switching patterns of (not only domestic) household consumption doubtlessly contribute to the forest loss. Every hectare of forest not planted back after being harvested produces the following missed opportunity concerning carbon capture: with trees planted approximately 2.5 m apart in order to allow thinning approximately 15 years thereafter, 1600 trees can be planted. According to the measures provided by [70], if trees are replanted and left to grow for 15 years, every hectare of conifer forest (the type of tree mostly harvested in the Czech Republic [62] ) has a potential to capture 127 tonnes of CO2 under a moderate scenario for sequestration. With proper care, bringing the survival rate to 85% from the initial 52%, the figure grows to 210 tonnes. Every kilohectare not replanted therefore creates a carbon-capture-deadweight loss of 210 300 tonnes of CO2 not captured in a 15-year horizon—an amount of yearly output of 22 100 Czech dwellers who had, according to the study by [71], a yearly output of 9.5 tonnes of CO2 per capita on average during the last decade. Excessive logging proves to be a concern on a larger scale as well, given, e.g., that research by the European Commission shows a growing cleavage between being able to trace the origin of wood and the volume actually being put to use. An unenviable 118 million m3 of woody biomass were reported by [72] (p. 47) to be of unknown origin. Again, this situation serves as firm ground for targeting unintended (and likely negative) outcomes of the currently ongoing rush for renewables. Here again, a tighter control of loggers balancing the carbon cycle by replanting forest populations and harvesting in a way which actually enables effective replanting could be an area of concern for policymakers aiming to minimize societally negative impacts of the green transition. This recommendation applies to every country with an abundance of forest area.
Thirdly, one of the sub-objectives was to investigate possible motivations why households switch from solid fossil fuels to biomass. Based on the finding that retired households play a key role in this transition, it can be deduced that convenience and environmental perspective are the main reasons. In fact, in general, the behavioural change of pensioners can be seen as a manifestation of a desire to simplify operations or awareness [73,74,75].
In general, the following basic assumptions (motivations) for switching from solid fossil fuels to biomass can be identified:
- −
- Price of substitutes—as shown in Table 6;
- −
- Environmental awareness—since the rebound effect was not confirmed and pensioner households played a key role in the switch to biomass, the motivation to switch to biomass in the form of environmental awareness is crucial. Based on [73,74,75,76,77], it can be inferred that there is a very significant causality between environmental awareness and old age. This connection is highly underestimated and could play a significant role particularly in estimating potential motivations to switch to biomass (but at the same time this motivation is often accompanied by nescience of the context, see below);
- −
- Convenience (handling biomass is physically lighter than handling fossil solid fuels)—as pensioner households have played a pivotal role in biomass switching, this is one possible motivation [78,79,80,81].
It is worth reflecting on whether nescience (in the sense of ignorance, lack of information, lack of awareness, or lack of promotion) is a concomitant of biomass switching. This fact is not directly apparent from our results but can be inferred. Given the desire to grasp the issue at hand comprehensively, it is appropriate to have a discussion on this ignorance. Although people switched to environmental fuels in good faith, the environmental effect did not occur due to the use of inappropriate (outdated) technology. The households should be aware that up-to-date technology is important to achieve the environmental goals.
A deeper reflection on the reasons why people switch to biomass; why some groups of households switch to a greater extent (pensioners); how to motivate society to switch even more, with a special focus on those groups of households that have not yet switched to eco-friendly combustion; and how to combine the environmental effort with the knowledge of the necessary technologies (so that the environmental effect actually occurs), creates a demand for further scientific research activity in this problematic area the current research addressed. Moreover, it would be worthy to extend the analysis to other states of Central and Eastern Europe, or at least other members of the Visegrád Group, such as Slovakia, Poland, and Hungary. Behavioural economics and behavioural management methods, such as sunk cost aversion, crowd behaviour effect in decision making, anchoring effect, or hidden costs, could be very useful in exploring these issues.
5. Conclusions
The main goal of this paper was to evaluate households’ consumption of energy sources for heating purposes in the Czech Republic in the period 2003–2020 and depict possible drivers of switching to biomass. For this, various models were created and tested, i.e., the substitution model, the price model, and the households model.
The methodological approach used in this paper is suitable; however, there are limits connected with the structure and availability of underlining data. We used various data sources providing a varying time range, therefore, the time series used in the particular models do not cover the same period (time series for 11, 17 and 18 years). On the other hand, the research questions can be answered using such data sources. Based on the results, and answering the research questions, households in the Czech Republic substituted coal for biomass in the period 2003–2020 (RQ1). On the other hand, the environmental impact of such substitution is not significant, as carbon emissions and emissions of other pollutants are stable (RQ2).
To achieve environmental goals, the substitution of fuels should also be accompanied by technological change, e.g., improvement of combustion boilers. In this place, the socio-economic aspects are important, because households of pensioners are the ones with the highest impact on biomass consumption for heating purposes (RQ3). Therefore, it would be worthy to support households in replacing their boilers for more environmentally friendly ones. This recommendation for policymakers in their effort to achieve the Green Deal targets stems from the present research.
Author Contributions
Conceptualization, J.Z. and R.S.; methodology, J.Z.; software, M.P.; validation, R.S., M.P. and O.A.; formal analysis, J.Z.; investigation, R.S.; resources, R.S., M.P. and O.A.; data curation, R.S.; writing—original draft preparation, J.Z., R.S., M.P. and O.A.; writing—review and editing, J.Z. and R.S.; visualization, O.A.; supervision, J.Z.; project administration, R.S.; funding acquisition, J.Z. All authors have read and agreed to the published version of the manuscript.
Funding
This research received no external funding.
Data Availability Statement
Data are available from the authors upon request.
Acknowledgments
Our team is sincerely thankful that editors keep providing a platform for research to be reviewed by seasoned professionals. Their comments and recommendations helped to improve our work. Richard Smilnak participated as part of a research effort to pursue doctoral studies at the Faculty of Economics, Prague University of Economics and Business.
Conflicts of Interest
The authors declare no conflict of interest.
References
- Pachauri, R.K.; Allen, M.R.; Barros, V.R.; Broome, J.; Cramer, W.; Christ, R.; Church, J.A.; Clarke, L.; Dahe, Q.; Dasgupta, P.; et al. Climate Change 2014: Synthesis Report. Contribution of Working Groups I, II and III to the Fifth Assessment Report of the Intergovernmental Panel on Climate Change; Core Writing Team, Pachauri, R.K., Meyer, L.A., Eds.; Intergovernmental Panel on Climate Change (IPCC): Geneva, Switzerland, 2015; p. 151. ISBN 978-92-9169-143-2.
- Pörtner, H.-O.; Roberts, D.C.; Tignor, M.; Poloczanska, E.S.; Mintenbeck, K.; Alegría, A.; Craig, M.; Langsdorf, S.; Löschke, S.; Möller, V.; et al. (Eds.) Climate Change 2022: Impacts, Adaptation, and Vulnerability. Contribution of Working Group II to the Sixth Assessment Report of the Intergovernmental Panel on Climate Change; Cambridge University Press: Cambridge, UK; New York, NY, USA, 2022; pp. 3–33. [Google Scholar]
- Giorgi, F. Thirty Years of Regional Climate Modeling: Where Are We and Where Are We Going Next? J. Geophys. Res. Atmos. 2019, 124, 5696–5723. [Google Scholar] [CrossRef]
- United Nations Environment Programme. Emissions Gap Report 2020; United Nations Environment Programme: Nairobi, Kenya, 2020. Available online: https://www.unep.org/emissions-gap-report-2020 (accessed on 25 November 2022).
- Matthews, H.D.; Landry, J.-S.; Partanen, A.-I.; Allen, M.; Eby, M.; Forster, P.M.; Friedlingstein, P.; Zickfeld, K. Estimating Carbon Budgets for Ambitious Climate Targets. Curr. Clim. Chang. Rep. 2017, 3, 69–77. [Google Scholar] [CrossRef]
- United Nations. Sustainable Development Goals. Available online: https://sdgs.un.org/ (accessed on 25 November 2022).
- United Nations. The Paris Agreement. Available online: https://unfccc.int/sites/default/files/english_paris_agreement.pdf (accessed on 25 November 2022).
- European Commission. The European Green Deal; COM/2019/640 Final; Document 52019DC0640; European Commission: Brussels, Belgium, 2019.
- European Commission. Regulation (EU) 2021/1119 of the European Parliament and of the Council of 30 June 2021 Establishing the Framework for Achieving Climate Neutrality and Amending Regulations (EC) No 401/2009 and (EU) 2018/1999 (‘European Climate Law’); Document 32021R1119; European Commission: Brussels, Belgium, 2021.
- European Commission. Communication from the Commission to the European Parliament, the Council, the European Economic and Social Committee and the Committee of the Regions ‘Fit for 55’: Delivering the EU’s 2030 Climate Target on the Way to Climate Neutrality; COM/2021/550 Final; European Commission: Brussels, Belgium, 2021.
- European Commission. Communication from the Commission to the European Parliament, the Council, the European Economic and Social Committee and the Committee of the Regions New EU Forest Strategy for 2030; COM/2021/572 final; European Commission: Brussels, Belgium, 2021.
- European Commission. A Sustainable Bioeconomy for Europe: Strengthening the Connection between Economy, Society and the Environment; Update Bioeconomy Strategy; Publications Office of the European Union: Luxembourg, 2018; p. 107.
- European Commission. A New Circular Economy Action Plan. Document 52020DC0098. Available online: https://eur-lex.europa.eu/legal-content/EN/TXT/?uri=COM%3A2020%3A98%3AFIN (accessed on 25 November 2022).
- Ronzon, T.; Piotrowski, S.; Tamosiunas, S.; Dammer, L.; Carus, M.; M’barek, R. Developments of Economic Growth and Employment in Bioeconomy Sectors across the EU. Sustainability 2020, 11, 4507. [Google Scholar] [CrossRef]
- D’Amato, D.; Droste, D.; Allen, B.; Kettunen, M.; Lähtinen, K.; Korhonen, J.; Leskinen, P.; Matthies, B.D.; Toppinen, A. Green, circular, bio economy: A comparative analysis of sustainability avenues. J. Clean. Prod. 2017, 168, 716–734. [Google Scholar] [CrossRef]
- Global Bioeconomy Summit. Communiqué 2018. Available online: http://gbs2018.com/fileadmin/gbs2018/Downloads/GBS_2018_Communique.pdf (accessed on 14 July 2021).
- FAO. Sustainable and Circular Bioeconomy. Available online: http://www.fao.org/in-action/sustainable-and-circularbioeconomy/en/ (accessed on 14 July 2021).
- Federal Ministry of Education and Research (BMBF); Federal Ministry of Food and Agriculture (BMEL). National Bioeconomy Strategy; Federal Ministry of Education and Research (BMBF); Federal Ministry of Food and Agriculture (BMEL): Berlin, Germany, 2020; p. 60.
- Luoma, P.; Vanhanen, J.; Tommila, P. Distributed Bio-Based Economy—Driving Sustainable Growth; Finnish Innovation Fund (SITRA): Helsinki, Finland, 2011; p. 24. [Google Scholar]
- FORMAS. Swedish Research and Innovation Strategy for a Bio-Based Economy; FORMAS: Stockholm, Sweden, 2018; p. 36. ISBN 978-91-540-6068-9.
- Comitato Nazionale per la Biosicurezza, le Biotecnologie e le Scienze della Vita (CNBBSV). BIT II Bioeconomy in Italy. A New Bioeconomy for a Sustainable Italy; CNBBSV: Rome, Italy, 2019.
- Langeveld, J.W.A.; Meesters, K.P.H.; Breure, M.S. The Biobased Economy and the Bioeconomy in the Netherlands; Biomass Research: Wageningen, The Netherlands, 2016; 59015257. [Google Scholar]
- Intergovernmental Panel on Climate Change (IPCC). Special Report on Climate Change and Land. Summary for Policymakers; Intergovernmental Panel on Climate Change (IPCC): Geneva, Switzerland, 2022; p. 36.
- Kim, J.B.; Monier, E.; Sohngen, B.; Pitts, G.S.; Drapek, R.; McFarland, J.; Ohrel, S.; Cole, J. Assessing climate change impacts, benefits of mitigation, and uncertainties on major global forest regions under multiple socioeconomic and emissions scenarios. Environ. Res. Lett. 2017, 12, 045001. [Google Scholar] [CrossRef]
- Popp, J.; Kovács, S.; Oláh, J.; Divéki, Z.; Balázs, E. Bioeconomy: Biomass and biomass-based energy supply and demand. New Biotechnol. 2021, 60, 76–84. [Google Scholar] [CrossRef]
- Marchetti, M.; Vizzarri, M.; Lasserre, B.; Sallustio, L.; Tavone, A. Natural capital and bioeconomy: Challenges and opportunities for forestry. Ann. Silvic. Res. 2014, 38, 62–73. [Google Scholar] [CrossRef]
- Lovrić, N.; Lovrić, M.; Mavsar, R. Factors behind development of innovations in European forest-based bioeconomy. For. Policy Econ. 2020, 111, 102079. [Google Scholar] [CrossRef]
- Saleem, M. Possibility of utilizing agriculture biomass as a renewable and sustainable future energy source. Heliyon 2022, 8, e08905. [Google Scholar] [CrossRef]
- Kwoczynski, Z.; Čmelík, J. Characterization of biomass wastes and its possibility of agriculture utilization due to biochar production by torrefaction process. J. Clean. Prod. 2021, 280, 124302. [Google Scholar] [CrossRef]
- Lunnan, A. Agriculture-based biomass energy supply—A survey of economic issues. Energy Policy 1997, 25, 573–582. [Google Scholar] [CrossRef]
- Durusoy, I.; Turker, M.F.; Keleş, S.; Kaygusuz, K. Sustainable Agriculture and the Production of Biomass for Energy Use. Energy Sources Part A Recovery Util. Environ. Eff. 2011, 33, 938–947. [Google Scholar] [CrossRef]
- Ballarin, A.; Vecchiato, D.; Tempesta, T.; Marangon, F.; Troiano, S. Biomass energy production in agriculture: A weighted goal programming analysis. Energy Policy 2011, 39, 1123–1131. [Google Scholar] [CrossRef]
- Cardoen, D.; Joshi, P.; Diels, L.; Sarma, P.M.; Pant, D. Agriculture biomass in India: Part 1. Estimation and characterization. Resour. Conserv. Recycl. 2015, 102, 39–48. [Google Scholar] [CrossRef]
- Jasiulewicz, M. Possibility of Liquid Bio-Fuels, Electric and Heat Energy Production from Biomass in Polish Agriculture. Pol. J. Environ. Stud. 2010, 19, 479–483. [Google Scholar]
- Soltero, V.; Chacartegui, R.; Ortiz, C.; Lizana, J.; Quirosa, G. Biomass District Heating Systems Based on Agriculture Residues. Appl. Sci. 2018, 8, 476. [Google Scholar] [CrossRef]
- Ronzon, T.; Santini, F.; M’Barek, R. The Bioeconomy in the European Union in Numbers, Facts and Figures on Biomass, Turnover and Employment; European Commission: Brussels, Belgium; Joint Research Centre: Ispra, Italy; Institute for Prospective Technological Studies: Seville, Spain, 2015; p. 4.
- Ministry of the Environment of the Czech Republic. Strategic Framework for the Circular Economy in the Czech Republic in 2040. A maximally circular Czech Republic in 2040; The Ministry of the Environment of the Czech Republic: Prague, Czech Republic, 2021; p. 160. Available online: https://www.mzp.cz/C1257458002F0DC7/cz/cirkularni_cesko/$FILE/OODP-Cirkularni_Cesko_2040_web-20220201.pdf (accessed on 25 November 2022).
- Ministry of Agriculture of the Czech Republic. The Concept of State Forestry Policy until 2035; The Ministry of Agriculture of the Czech Republic: Prague, Czech Republic, 2020; p. 32. Available online: https://eagri.cz/public/web/file/646382/Koncepce_statni_lesnicke_politiky_do_roku_2035.pdf (accessed on 25 November 2022).
- Hájek, M.; Holecová, M.; Smolová, H.; Jeřábek, L.; Frébort, I. Current state and future directions of bioeconomy in the Czech Republic. New Biotechnol. 2021, 61, 1–8. [Google Scholar] [CrossRef] [PubMed]
- Purwestri, R.C.; Hájek, M.; Šodková, M.; Sane, M.; Kašpar, J. Bioeconomy in the National Forest Strategy: A Comparison Study in Germany and the Czech Republic. Forests 2020, 11, 608. [Google Scholar] [CrossRef]
- Hlásny, T.; Zimová, S.; Merganičová, K.; Štěpánek, P.; Modlinger, R.; Turčáni, M. Devastating outbreak of bark beetles in the Czech Republic: Drivers, impacts, and management implications. For. Ecol. Manag. 2021, 490, 119075. [Google Scholar] [CrossRef]
- Ministry of the Environment of the Czech Republic. Report on the Environment of the Czech Republic 2019; CENIA: Prague, Czech Republic, 2021; ISBN 978-80-87770-99-3.
- Ministry of Agriculture of the Czech Republic. Zpráva o Stavu Lesa a Lesního Hospodářství České Republiky v Roce 2020; The Ministry of Agriculture of the Czech Republic: Prague, Czech Republic, 2019; p. 47.
- Hunkin, S.; Barsoumian, S.; Krell, K.; Severin, A.; Corradino, G. Thematic Study on Energy Efficiency and Renewable Energies; CENTRAL EUROPE Programme, April 2014; Association of European Border Regions: Gronau, Germany, 2014. [Google Scholar]
- Albrecht, J.; Laleman, R.; Vulsteke, E. Balancing demand-pull and supply-push measures to support renewable electricity in Europe. Renew. Sustain. Energy Rev. 2015, 49, 267–277. [Google Scholar] [CrossRef]
- Marques, A.C.; Fuinhas, J.A. Are public policies towards renewables successful? Evidence from European countries. Renew. Energy 2012, 44, 109–118. [Google Scholar] [CrossRef]
- Bedsworth, L.W.; Hanak, E. Climate policy at local level: Insights from California. Glob. Environ. Chang. 2013, 23, 667–677. [Google Scholar] [CrossRef]
- Bhanot, S. Isolating the effect of injunctive norms on conservation behavior: New evidence from a field experiment in California. Organ. Behav. Hum. Decis. Process. 2021, 163, 30–42. [Google Scholar] [CrossRef]
- Zamfir, A.; Colesca, S.E.; Corbos, R.A. Public policies to support the development of renewable energy in Romania: A review. Renew. Sustain. Energy Rev. 2016, 58, 87–106. [Google Scholar] [CrossRef]
- Bobinaite, V.; Tarvydas, D. Financing instruments and channels for the increasing production and consumption of renewable energy: Lithuanian Case. Renew. Sustain. Energy Rev. 2014, 38, 259–276. [Google Scholar] [CrossRef]
- Ortega, M.; Del Rio, P.; Montero, E.A. Assessing the benefits and costs of renewable electricity. The Spanish case. Renew. Sustain. Energy Rev. 2013, 27, 294–304. [Google Scholar] [CrossRef]
- Mattison, S.M.; Hare, D.; MacLaren, N.G.; Reynolds, A.Z.; Sum, C.Y.; Liu, R.; Shenk, M.K.; Blumenfield, T.; Su, M.; Li, H.; et al. Context Specificity of Market Integration among the Matrilineal Mosuo of Southwest China. Curr. Anthropol. 2022, 63, 118–124. [Google Scholar] [CrossRef]
- Antar, M.; Lyu, D.; Nazari, M.; Shah, A.; Zhou, X.; Smith, D.L. Biomass for a sustainable bioeconomy: An overview of world biomass production and utilization. Renew. Sustain. Energy Rev. 2021, 139, 110691. [Google Scholar] [CrossRef]
- Ubando, A.T.; Felix, C.B.; Chen, W.-H. Biorefineries in circular bioeconomy: A comprehensive review. Bioresour. Technol. 2020, 299, 122585. [Google Scholar] [CrossRef]
- Nyarko, I.; Nwaogu, C.; Hájek, M.; Peseu, P.O. Socio-Economic Analysis of Wood Charcoal Production as a Significant Output of Forest Bioeconomy in Africa. Forests 2021, 12, 568. [Google Scholar] [CrossRef]
- Mensah, K.E.; Damnyag, L.; Kwabena, S.N. Analysis of charcoal production with recent developments in Sub-Sahara Africa: A review. Afr. Geogr. Rev. 2020, 41, 35–55. [Google Scholar] [CrossRef]
- Jekayinfa, S.O.; Orisaleye, J.I.; Pecenka, R. An Assessment of Potential Resources for Biomass Energy in Nigeria. Resources 2020, 9, 92. [Google Scholar] [CrossRef]
- Kalt, G.; Baumann, M.; Lauk, C.; Kastner, T.; Kranzl, L.; Schipfer, F.; Lexer, M.; Rammer, W.; Schaumberger, S.; Schriefl, E. Transformation scenarios towards a low-carbon bioeconomy in Austria. Energy Strategy Rev. 2016, 13–14, 125–133. [Google Scholar] [CrossRef]
- Eurostat. Macroeconomic Indicators. 2022. Available online: https://ec.europa.eu/eurostat/en/ (accessed on 25 November 2022).
- Ministry of Industry and Trade. Obnovitelné Zdroje Energie v Roce 2020 (Renewable Energy Sources in 2020). 2021. Available online: https://www.mpo.cz/assets/cz/energetika/statistika/obnovitelne-zdroje-energie/2021/9/Obnovitelne-zdroje-energie-2020.pdf (accessed on 25 November 2022).
- Ministry of Industry and Trade. Uhlí v České republice 2010–2020 (Coal in the Czech Republic 2010–2020). 2022. Available online: https://www.mpo.cz/assets/cz/energetika/statistika/tuha-paliva/2022/2/Uhli-2010-2020.pdf (accessed on 25 November 2022).
- Czech Statistical Office (CZSO). Česká Republika od Roku 1989 v Číslech. (Czech Republic in Numbers since 1989). 2022. Available online: https://www.czso.cz/csu/czso/ceska-republika-od-roku-1989-v-cislech-aktualizovano-2682022#01 (accessed on 25 November 2022).
- Anopress Media Monitoring. 2022. Available online: https://monitoring.anopress.cz/ (accessed on 25 November 2022).
- International Energy Agency. Energy Prices and Taxes for OECD Countries 2020; OECD Publishing: Paris, France, 2006. [Google Scholar] [CrossRef]
- Samuelson, P.A.; Nordhaus, W.D. Economics, 19th ed.; McGraw-Hill: New York, NY, USA, 2009. [Google Scholar]
- Sekanabo, D.; Nyandwi, E.; Dieu, H.K.J.D.; Thomas, V.M. The relationship between GDP and biomass energy per capita in Sub-Saharan Africa. Int. J. Energy Econ. Policy 2022, 12, 528–541. [Google Scholar] [CrossRef]
- Eggleston, H.S.; Buendia, L.; Miwa, K.; Ngara, T.; Tanabe, K. 2006 IPCC Guidelines for National Greenhouse Gas Inventories; Institute for Global Environmental Strategies (IGES): Hayama, Japan, 2006. [Google Scholar]
- Global Forest Watch. Czechia Country Profile. 2022. Available online: https://www.globalforestwatch.org/dashboards/country/CZE/ (accessed on 25 November 2022).
- Atlas of Economic Complexity. Czechia Country Profile, Harvard Growth Lab. 2022. Available online: https://atlas.cid.harvard.edu/countries/59/export-basket (accessed on 25 November 2022).
- Energy Information Administration. Method for Calculation Carbon Sequestation by Trees in Urban and Suburban Settings. 1998. Available online: https://www3.epa.gov/climatechange/Downloads/method-calculating-carbon-sequestration-trees-urban-and-suburban-settings.pdf (accessed on 25 November 2022).
- World Bank. CO2 Emissions (Metric Tons per Capita)—Czechia. 2022. Available online: https://data.worldbank.org/indicator/EN.ATM.CO2E.PC?locations=CZ (accessed on 25 November 2022).
- Camia, A.; Giuntoli, J.; Jonsson, K.; Robert, N.; Cazzaniga, N.; Jasinevičius, G.; Avitabile, V.; Grassi, G.; Barredo Cano, J.I.; Mubareka, S. The Use of Woody Biomass for Energy Production in the EU; EUR 30548 EN; Publications Office of the European Union: Luxembourg, 2020; p. 47. [Google Scholar] [CrossRef]
- Bushway, L.J.; Dickinson, J.L.; Stedman, R.C.; Wagenet, L.P.; Weinstein, D.A. Motivations, and Barriers Related to Environmental Volunteerism for Older Adults: Developing a Research Agenda. Int. J. Aging Hum. Dev. 2011, 72, 189–206. [Google Scholar] [CrossRef]
- Dickinson, J.L. The people paradox: Self-esteem striving, immortality ideologies, and human response to climate change. Ecol. Soc. 2009, 14, 34. Available online: http://www.ecologyandsociety.org/vol14/iss1/art34/ (accessed on 25 November 2022). [CrossRef]
- Raghu, S.; Rodrigues, L. Behavioral aspects of solid waste management: A systematic review. J. Air Waste Manag. Assoc. 2020, 70, 1268–1302. [Google Scholar] [CrossRef]
- Shen, M.; Lu, Y.; Kua, H.; Cui, Q. Eco-feedback delivering methods and psychological attributes shaping household energy consumption: Evidence from intervention program in Hangzhou, China. J. Clean. Prod. 2020, 265, 121755. [Google Scholar] [CrossRef]
- Spandagos, C.; Yarime, M.; Baark, E.; Ng, T.L. Triple Target policy framework to influence household energy behavior: Satisfy, strengthen, include. Appl. Energy 2020, 269, 115117. [Google Scholar] [CrossRef]
- Changizi, M.; Kaveh, M. Effectiveness of the mHealth technology in improvement of healthy behaviors in an elderly population-a systematic review. mHealth 2017, 3, 51. [Google Scholar] [CrossRef]
- Cohen-Mansfield, J.; Marx, M.; Thein, K.; Dakheel-Ali, M. The impact of past and present preferences on stimulus engagement in nursing home residents with dementia. Aging Ment. Health 2010, 14, 67–73. [Google Scholar] [CrossRef] [PubMed]
- Cunningham, C.; O’Sullivan, R.; Caserotti, P.; Tully, M.A. Consequences of physical inactivity in older adults: A systematic review of reviews and meta-analyses. Scand. J. Med. Sci. Sports 2020, 30, 816–827. [Google Scholar] [CrossRef] [PubMed]
- Wittenberg, I.; Blobaum, A.; Matthies, E. Environmental motivations for energy use in PV households: Proposal of a modified norm activation model for the specific context of PV households. J. Environ. Psychol. 2018, 55, 110–120. [Google Scholar] [CrossRef]

Disclaimer/Publisher’s Note: The statements, opinions and data contained in all publications are solely those of the individual author(s) and contributor(s) and not of MDPI and/or the editor(s). MDPI and/or the editor(s) disclaim responsibility for any injury to people or property resulting from any ideas, methods, instructions or products referred to in the content. |
© 2022 by the authors. Licensee MDPI, Basel, Switzerland. This article is an open access article distributed under the terms and conditions of the Creative Commons Attribution (CC BY) license (https://creativecommons.org/licenses/by/4.0/).