Abstract
An important requirement of the power grid with high penetration of renewable energy sources is the mitigation of potential harmonic interactions between different distributed large grid-tie inverters and the mains. This work presents the harmonic interaction between multiple multilevel photovoltaic (PV) inverters based on the well-known T-type neutral-point-clamped inverter (3L-TNPC). The multiple 3L-TNPC is connected in parallel to a common ac bus by using distribution voltage feeders. The analysis is performed by using the Norton equivalence model of each power circuit, its admittance matrix modeling, and the potential overall impedance resonances with the ac grid. The main contribution of this work is the development of a current harmonic injection model of the system operating under a polluted voltage grid for harmonic analysis, while overall filtering design restrictions due to impedance limits based on current and voltage standards are considered. The proposed impedance Norton model is compared with the electromagnetic transient model (EMT model) by using comprehensive simulations, showing good match between both models.
1. Introduction
Commercial power converter designs for photovoltaic (PV) farms have been developed ranging from small- to large-scale systems by using string, multistring, ac-module, and central inverter configurations [1]. Central inverters are mainly used for utility-scale PV (USPV) plants, commonly with a two-level voltage source inverter (2L-VSI) topology [2]. Currently, USPV plants are well established into the hundred MW range. Compared to 2L-VSI, multilevel converters can reach higher voltages and power ratings, they have lower common-mode voltages, and lower switching frequency without compromising power quality due to an inherent increase of output voltage levels, consequently reducing the total harmonic distortion (THD) and the voltage stress across semiconductor devices [3,4].
The above technical features have made the use of multilevel converters very popular over the last decades for high-power medium-voltage motor drive applications. In the last years, three-level neutral-point-clamped (3L-NPC) converters have been used for interfacing PV systems into the grid [5,6], where higher PV penetration brings along considerable requirements on efficiency, power quality, and grid code compliance [7]. However, recently, the T-type neutral-point-clamped inverter (3L-TNPC), also known as neutral-point piloted converter (3L-NPP), has gained a wide presence in the industry sector due to several advantages, such as symmetrical loss distribution, higher overall efficiency, small footprints, and low harmonic injection in relation with the conventional 3L-NPC [8]. The increase in the efficiency and power density of multilevel converters has resulted in significant increases in the power ratings of inverter modules. In some cases, the rated power of one inverter module can reach megawatt level [9].
According to the literature review, 2L-VSI topology is still preferred for LV/MV large-scale PV inverters due to the inverter cost and control simplicity. However, multilevel converters have been gaining interest with attractive industrial solutions. For example, in [10], a losses comparison is performed between two multilevel converter candidates: the 3L-NPC (NPC inverter) and 3L-TNPC (T-type inverter). The comparison concludes that when combining the conduction losses and switching losses for both configurations, the 3L-TNPC configuration is 30% more efficient than the 3L-NPC. This reduction in overall losses compared to the 3L-NPC topology brings forth better conversion efficiency, which reduces the cooling requirements and helps improve the converter reliability. In this paper, a dc–ac PV central inverter configuration based on 3L-TNPC is selected as a case of study. The selection of a 3L-TNPC inverter is motivated by its high power density, while the analysis can be extrapolated to other power configurations.
Power quality and grid interaction of grid-tie inverters is a high-priority concern for utility operators [11,12]. In PV grid-connected systems, an important requirement of USPV or utility-interactive converters is the mitigation of potential harmonic interactions between the different distributed large grid-tie inverters and the utility. Thus, the harmonic interaction quantification is a critical point under polluted grids, due to the fact that in the presence of a distorted voltage grid, the inverter output current will be also polluted, increasing the harmonics injections and affecting the rest of the equipment [13]. To reduce these harmonic interactions between grid-tie converters and polluted grids, each individual converter connected to the mains should have an accurate current control design in order to control the injection of harmonic currents and comply with the grid codes [14]. According to the new requirements of the power grid [15], the USPV units must be equipped with multifunctional control tasks such as regulated active and reactive power injection, load and grid voltage harmonic compensation, power curtailment, load shifting, and others. The key aspect is to generate the adequate grid current references in a cooperative control algorithm to comply with the those so-called ancillary services [16,17].
In general, the harmonic impedance models (HIM) can be classified into three categories: (i) invasive methods, (ii) noninvasive methods, and (iii) simulation methods [18]. In the invasive methods, the harmonic impedance seen from the grid or power unit is measured online with experimental equipment located at the point of common coupling (PCC). Despite that the accuracy of this equipment is high, the exact location of the studied harmonic source or nonlinear load is not straightforward. The second category is based on noninvasive methods, where harmonic impedance is computed offline based on voltage and current data measurements. This method is useful for already installed equipment or PV plants. However, for new large installation, a priori knowledge of the harmonic impedance model and its effects is required. Thus, an attractive third category for the community is the simulation methods [19], which are based on switching models or are well known in the industry as electromagnetic transient models [20,21,22]. Furthermore, couplings among paralleled generators or loads which create resonant interactions can be considered [23,24]. The accuracy of the simulation results in the low-frequency range is enough for harmonic load modeling purposes. However, system nonlinearities cannot be represented due to unknown exact real-time system parameters [25], where the system accuracy is limited by inter- and subharmonics and the impedance ratio fluctuations [18].
In this paper, system parameters are designed according to the level of harmonic pollution at the point of common coupling (PCC) and to avoid potential resonances between converters and the grid. Thus, with a comprehensive system design and Norton equivalent impedance modeling, a bus admittance matrix modeling is developed [26]. The above approach is used to develop an accurate model of the current harmonic injection of the parallel system connected to a polluted voltage grid. Furthermore, potential resonances introduced by interactions between each converter and its feeder are analyzed [27]. Thus, the main contributions of this paper are as follows:
- The development of a comprehensive switching model of the multiple multilevel PV inverters.
- The filter interface between the PV generators and the grid is designed by filtering design restriction due to static impedance limits based on current and voltage standards.
- The development of a current harmonic injection model of the overall system operating under a polluted voltage grid.
- Finally, the developed impedance Norton model is compared with the EMT model by using comprehensive simulations, illustrating the effectiveness of the approach.
The rest of the document is organized as follows: Section 2 gives a detailed review of the control scheme for the 3L-TNPC converter based on multiresonant controllers, while Section 3 summarizes the Norton impedance modeling and Section 4 presents the bus admittance matrix modeling for the whole system. Simulation results are presented in Section 6 for time and frequency domains. Finally, in Section 5, the conclusions of the paper summarize the work performed.
2. Power Converter and Control System Description
The converter under study corresponds to the parallel connection of four 3L-TNPC inverters by using feeders. The power configuration under study is illustrated in Figure 1, while the fundamental control loops were previously introduced in [10,28].
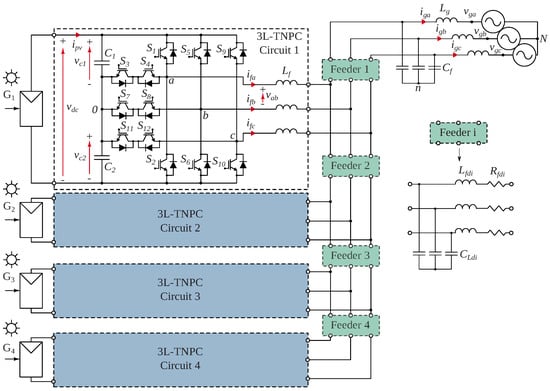
Figure 1.
Multiple utility-interactive 3L-TNPC converter PV central inverter.
2.1. 3L-TNPC Inverter
According to the literature, many semiconductor manufactures have commercial T-type legs to be used in central PV inverters and motor drive applications [29,30,31]. In the three-level inverter based on T-type leg, as presented thirty-five years ago for motor drives, the bidirectional medium switch was realized with thyristors and improved with GTO-thyristors [32]. After some years, many configurations based on the well-known 3L-TNPC leg can be found in the literature [33].
To develop the model of the whole system, a simplified circuit is used. The above circuit is based on the fundamental power configuration 3L-TNPC inverter depicted in Figure 2. The inverter is connected to the grid by using an LCL filter. The fundamental operation of one leg of the 3L-TNPC is based on the switching states defined according to gate signals , where three switching states can be generated to produce three different voltage levels with respect to the neutralpoint {, 0, } or {, 0, }, assuming a balanced voltage operation. The above switching operation generates a five-level line-to-line voltage.
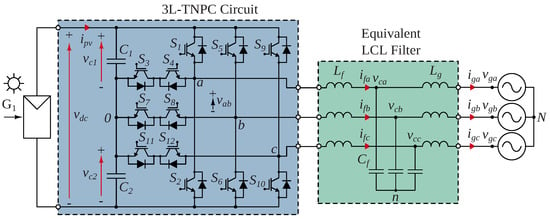
Figure 2.
3L-TNPC converter power unit.
2.2. Control Scheme
The control scheme implemented for this study is based on the well-known voltage-oriented control (VOC), where an inner current control loop is implemented in stationary -frame based on proportional multiresonant (PMR) controllers. The active current reference is provided by an external voltage control loop, where the dc-link voltage is controlled according to a voltage reference imposed by an MPPT scheme. The used MPPT is based on the well-known perturb-and-observe P&O algorithm, with a fixed step voltage of 10 V and running at every 0.05 s. The above parameters were selected according to [34]. On the other hand, the reactive current reference is imposed, in part, by the user and compensation value according to an external closed-loop PQ-controller [14]. The overall implemented control scheme is depicted in Figure 3. Furthermore, a synchronous-reference-frame phase-locked-loop (SRF-PLL) with some adequate filters was implemented. Finally, a simple virtual active damping strategy was included into the current reference generation stage in order to reduce the potential losses of well-known passive damped LCL filters [35] and to compensate the potential resonances produced by the voltage grid harmonic components [14]. Relevant control loops and their respective considerations used in the control design stage are explained in detail in the following subsections.
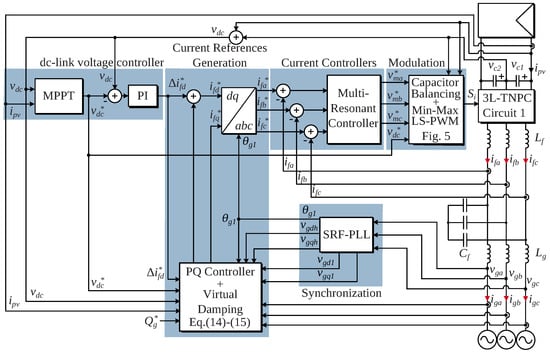
Figure 3.
Enhanced VOC for 3L-TNPC converter.
2.3. Modulation Stage
The conventional modulation of the 3L-TNPC is based on the level-shifted pulse-width-modulation (LS-PWM), where two carriers and a simple logic circuit are used to generate the firing pulses of the leg (phase a) [36]. Figure 4 illustrates the conventional LS-PWM applied to this converter. The conventional LS-PWM was improved by including a third-harmonic injection or min–max sequence to increase the dc-link voltage utilization ratio to . On the other hand, the conventional LS-PWM was used as a step-up transformer provides galvanic isolation, avoiding leakage current issues [10].
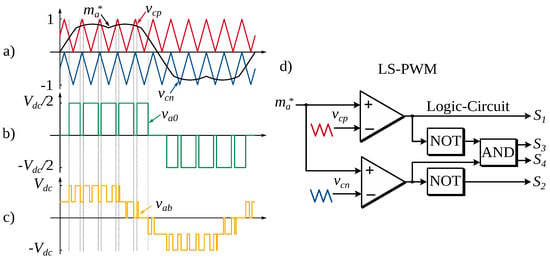
Figure 4.
LS-PWM applied to a 3L-TNPC leg: (a) Triangular carriers and modulation signal, (b) generated phase voltage, (c) generated line-to-line voltage, and (d) analog implementation.
Finally, the modulation scheme is complemented by a simple capacitor voltage balance control by adding an offset to the voltage reference vector commanded by the current control loop, which regulates the use of the upper () or lower () capacitor voltage according to the existing unbalance. To find an expression for the capacitor voltage balancing control, the neutral-point potential must be defined,
where the dynamic of the neutral-point voltage is
where is the inverter current vector and . The transfer function of this neutral-point potential with respect to compensation signal is a nonlinear expression with a complex structure, where a complete analysis for NPC converters is reported in [37]. However, the main dependence of this variable is the capacitor voltage dynamic. To help withthis problem, a simplified model, based on (3), is used to design this control loop.
Finally, due to the low-frequency harmonic presence in the ac side and dc-link reference due to MPTT operation, some harmonic components are affecting the modulation stage. To compensate this issue and avoid the generation of low-frequency components in the current generation, a dc-link ripple feedforward compensation is included in Figure 5 [38].

Figure 5.
LS-PWM with min-max sequence and ripple feedforward compensation.
2.4. Multiresonant Current Controller
The current control scheme was implemented based on the PMR controllers, where a stationary system is used to find the transfer functions of the controlled current with respect to the inverter voltage actuation . The following relation can be easily derived from the three-phase circuit of Figure 2. Then, the current dynamic is associated with the ac side of the converter:
where is the inverter current vector (controlled current), is the capacitor filter voltage vector with respect to the point n, is the inverter voltage (voltage actuation) with respect to the neutral-point 0, is the grid current vector (current to be compensated), is the grid voltage vector with respect to the point N, is a vector of ones, and and are the respective common-mode voltages with respect to the capacitor filter and grid neutral wire, which can be computed assuming balanced operation as
Finally, by applying Laplace transform in (4)–(6) and by neglecting the feedforward variables, the following transfer function with respect to the actuation at phase a can be stated [14],
In the above expression, the inverter side inductance is selected according to [39], while the grid side inductance is selected according to , which is an optimal design in terms of resultant low-order harmonics, as was recently proposed in [40]. Note that a detailed LCL filter design considering the potential harmonic voltage level permitted by PV standards is included in Section 3.3. The structure of each implemented PMR controller in the Laplace domain is presented as follows:
where is the resonant controller at the h-th frequency, , , and are the proportional gain, resonant gain, and resonant frequency, while the parameter is a parameter introduced to avoid unstable issues by using conventional discretization methods. Finally, the PMR controller is considered by adding different controllers at fundamental, 5th, 7th, 11th, and 13th harmonic frequencies:
Note that the above resonant controllers were considered to achieve selective harmonic impedance enhancement according to [26]. As an example, the tuning design of the fundamental controller is included here, where an initial design is based on , , rad/s, and rad/s. The factor is a gain factor to each harmonic controller defined as . The used plant model was previously presented in (9). In this design, the damping ratio of each controller is 0.808, while the closed-loop bandwidth is tuned to 1 kHz; due to multiple harmonic compensation, it is required to be over 650 Hz.
The discrete PMR controller structure is improved by including an anti-wind-up mechanism to avoid controller wind-up due to input saturation [41]. Note that the saturation value is retained accordingly [42]. On the other hand, a correct implementation is required to obtain the designed control dynamic.
2.5. Grid Current References Generation
An external power controller is included to generate the compensated current references to be injected. This controller is based on the PQ control theory, where the direct current component proportional to the active power is generated by using a PQ controller [14]. This controller computes the direct and quadrature grid current references according to active and reactive power references:
where and are the direct and quadrature components of the fundamental grid voltage obtained with the SRF-PLL. Note that the reactive power reference is imposed by the user allowing reactive power control, while the active power reference is commanded by the dc-link voltage reference generated by the MPPT () and the dynamic direct current reference () by the dc-link voltage controller; thus,
On the other hand, the terms and are the direct and quadrature current reference to be compensated by the inverter. The first reference is added to the dynamic direct current reference generated by the dc-link voltage controller. Furthermore, this grid current reference generation (CRG) is enhanced by including a voltage harmonic compensation () based on a virtual damping resistor in parallel to the voltage grid. Theoretical details of active damping approach are fully included in [14]. The virtual resistor is designed according to an empirical process by measuring the grid current THD under grid voltage harmonics. Thus, the total direct current reference component is
To compute the total quadrature current reference component, a reactive power controller is implemented. This control is preferred to obtain a fine dynamic control of the injected reactive power. Finally, the is added to the quadrature current reference generated by the PQ controller and the virtual damping term; thus, the total quadrature current reference component is
3. Norton Impedance Model
In this section, a Norton impedance model is developed to obtained an accurate current harmonic injection model of the system operating under a polluted voltage grid. Aspects such as the above control scheme and the filter design are relevant due to the fact that the general output impedance of a grid-tied converter depends on the current controller transfer function [9,25,26].
3.1. Harmonic Interactions
A single-phase converter is used to analyze harmonic interaction issues, where each converter emulates one leg of the three-phase converter in Figure 2. Considering that the control of the dc-link voltage has a ten-times-slower dynamic than grid currents, this voltage dynamic regulation is considered constant for this analysis. Furthermore, symmetrical voltage is assumed by implementing the capacitor voltage balancing controller.
The inverter is connected to the grid through an LC filter at the PCC, as is shown in Figure 6a. Since each single-phase inverter is controlled to inject current into the grid, this inverter is represented by a Norton model, i.e., a current source and a parallel impedance , as is depicted in Figure 6b. Finally, harmonic quasi-resonance between the output impedance of an inverter and the input impedance at the PCC should be considered. The quasi-resonance term means that the harmonic frequency could be near to the resonant frequency of the impedance grid. Thus, series and parallel potential resonances are illustrated in Figure 6c,d, respectively. The subscript h denotes the harmonic order. Note that the impedance of the grid () and the resonant frequencies change because several other converters or voltage transformers can be connected here and different loads can affect its dynamic behavior [26].
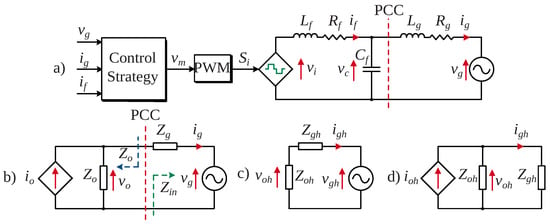
Figure 6.
Impedance representation: (a) single-phase model, (b) Norton model approach, (c) series resonance, and (d) parallel resonance.
3.2. Output Impedance Model
The main requirement is to derive an accurate model for harmonic analysis interaction of low-frequency line voltage harmonic components. To describe an inverter, an average model is enough to achieve similar results as a switching circuit model when the switching frequency is much higher than the frequency of interest. The average circuit model of the inverter is illustrated in Figure 7a, where the control of the filter current reference () is derived from an external power control loop (PQ controller, MPPT loop, and dc-link voltage control) which is omitted by this model since its bandwidth is considered lower than the current control loop. Thus, the filter current control of the inverter () is controlled by a single-loop inductor current feedback .
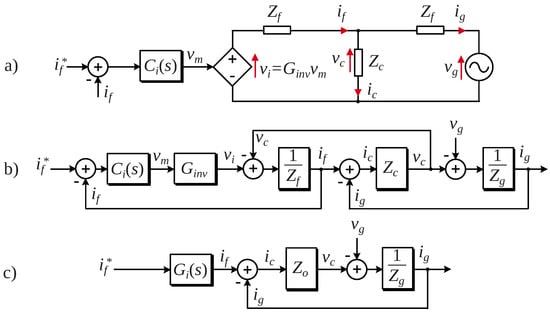
Figure 7.
Output impedance model: (a) average circuit model, (b) simplified control model, (c) derived Norton model.
On the other hand, as the switching frequency of the inverter (8 kHz) is higher than the 40th harmonic, each switching period can be averaged and the PWM inverter can be represented by a simple unitary gain . Therefore, the control structure diagram of the inverter is drawn in Figure 7b, where its representation is based on the simplification of Equations (4)–(6) and expressed as follows:
Finally, a Norton model can be obtained based on small-signal analysis around an operation point, as is illustrated in Figure 7c, where the output impedance of the inverter can be easily computed as
where , , , and the inverter output current generated by a function of the current reference is represented by
As an important remark, the inverter output impedance in (19) and the Norton model of Figure 7c is a structure highly dependent on the applied controller. Since each inverter is controlled to inject current into the grid, this inverter is represented by a Norton model with , i.e., a current source and a parallel impedance in Figure 7b.
3.3. LCL Filter Design
The design of a filter inverter is driven by the need to comply with some current harmonic limits allowed by standards. To satisfy these levels under a distorted grid, the control parameters are usually tuned empirically to minimize the harmonic components of grid currents, based on harmonic analysis of simulations or measurement results. Therefore, to obtain acceptable current harmonic levels, this section introduces output impedance constraints as a reference for the inverter control design. The output impedance limits are computed by using two examples of PV systems standards, the IEEE Std. 929-2000 and the EN 50160, which are used to fix the harmonic current and voltage harmonics injected into the grid [43]. Thus, the lower magnitude limit of the inverter output impedance within the frequency of interest is expressed as
where and are the relative limit currents and voltages given by standards, V is the fundamental voltage where the inverter under study is connected, and A is the rated fundamental current obtained under STD conditions and zero reactive power of a single inverter unit. Thus, is the minimum desirable value for one inverter’s output impedance at the h-th harmonic order. Finally, to obtain a good impedance design, the output impedance must be lower than under the h-th frequency of interest.
The output impedance can be adjusted by increasing the gain and control bandwidth for a specific harmonic frequency. Thus, the Norton impedance analysis is performed by using the controller of (10). The parameters used in (10) were selected comparing the output impedance of the inverter with the grid limit impedance, as is shown in Figure 8. Note that the impedance of 5th, 7th, 11th, and 13th harmonics are increased according to each aggregated resonant controller. Then, an impedance enhancement is allowed until the 22nd harmonic, where, unavoidably, the output impedance has an intersection with the limit at rated and half output power.
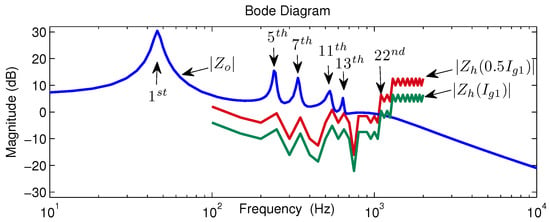
Figure 8.
Magnitude of the output impedance with MPR current controllers and the output harmonic impedance limit at rated and half power.
Finally, the potential resonance of the LCL filter design is analyzed. The computation of the overall transfer function of the equivalent filter current with respect to the converter voltage is performed by using [44], thus
where the first term is the relation between the equivalent filter inductor current and the inverter voltage, while the second transfer function is the relation between the grid current and the inverter voltage. Thus, the term is included to mitigate the potential resonances of this LCL filter. This term is computed as
where is the equivalent filter inductor. To evaluate the potential resonance of the LCL filter, it is necessary to introduce the system direct transfer function defined as
where the is the PMR defined in (11). To complete a wide analysis, the term was changed as depicted in Figure 9, where the resonant results show that with = 0, the natural system resonance frequency is obtained in 1.72 kHz. This value is computed assuming a very large grid inductor and is between 1 to 2 kHz, as is suggested in [8]. The second evaluated case is with = 0.75, i.e., = /12. The last case is evaluated by using = 0.4286, i.e., = /3, which is the case used along all the previous simulations. The natural system resonance frequency obtained with = /3 is = 2.28 kHz. Note that with this value the potential LCL filter resonances are fully avoided and the current control design can be fixed [40]. Finally, the equivalent filter current inductance is computed as the parallel of four inductors.
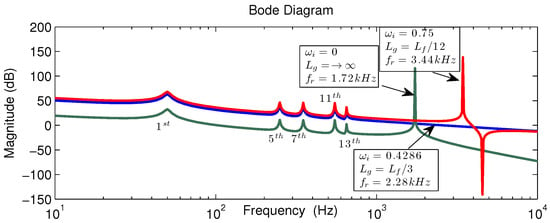
Figure 9.
Resonance analysis of proposed LCL filter design.
Note that, in accordance with the literature review, the consideration of the implementation delay effect increases the effective range of the capacitive current feedback active damping method, increases the range of the active damping coefficient, and increases the phase at the open-loop cutoff frequency [45]. Another option to improve the active damping range is to design the LCL filter by considering the virtual resistor in the control structure, where a different inductance ratio of = 2/3 is considered [46]. In this work, we preferred to reduce the value of grid inductance with respect to the inverter inductance and concentrate the LCL filter design by using the lower magnitude limit of the inverter output impedance .
4. Multiple Inverter Harmonics Model
A simplified model with multiple inverters is presented in this section, where each connected inverter system is represented by impedance models, as presented in Figure 10.
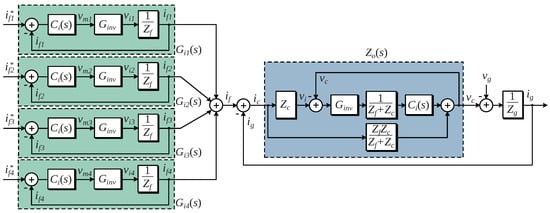
Figure 10.
Norton model of whole converter.
4.1. Bus Admittance Matrix Model
To compute the output and input impedances in each converter, the model of Figure 10 for each converter can be represented as an admittance network, as is depicted in Figure 11. The bus bar or voltage feeder of Figure 11a is composed of a capacitive component , which emulates the line distribution capacitances of each inverter circuit introduced by the bus bar, while the impedance emulates the line distribution losses of the converter. Both impedances are represented by
where i = 1, …, 4. In accordance with [26], the value of is between 0.5 to 10 µF for low-voltage PV grid-connected systems. However, this value is used to emulate linear loads connected to the distributed system. In this case, this capacitance is used to emulate the line distribution capacitances of each inverter circuit introduced by the bus bar only, which is a small value and assumed to be fixed as 1 nF. Furthermore, for simplification, feeder impedances between each pair of adjoining buses are set to 0.5 m and 1 µH. These feeder parameters are considered as preliminary estimations for harmonic interaction.
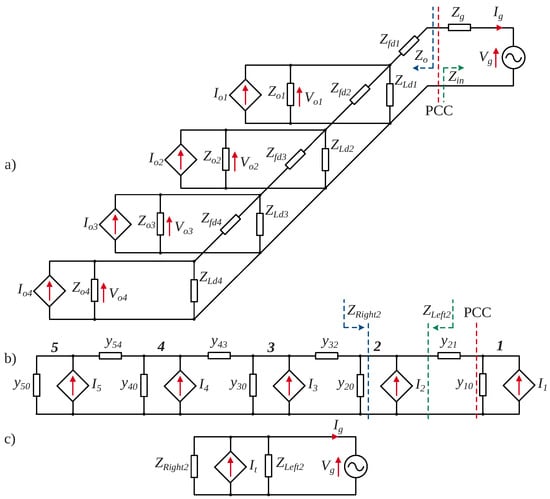
Figure 11.
Impedance model representation of a distributed system with multiple connected inverter systems: (a) physical connection, (b) impedance, and (c) equivalent resonant models.
To compute the output and input impedances in each node of the feeder, the network of Figure 11a can be represented as a single-line admittance model, which is depicted in Figure 11b, where each node of the feeder bus bar (node) is numerated from to . As a result, the transformation between Figure 11a,b is performed by computing each current source connected to the bus, thus
where and represent the grid voltage and impedance of the grid line, and represents the output current model of each inverter by using the Norton model representation according to Figure 7b. By following the same procedure, the parallel admittances of Figure 11b can be computed as
where i = 2, …, 4. represents the output impedance of the inverter, as was previously computed in (19). Finally, series admittances of the feeder are computed in (31). Now, applying Kirchhoff current law (KCL) to each bus in Figure 11b, it is possible to write the following system:
where are the node voltages from bus to . The above system (32)–(36) can be written in a matrix form, and the output or input impedances at any node can be derived. However, as the interactions between the converter and the grid are required, the bus is considered as the main admittance model to be studied, where and represented in Figure 11c must be computed to know the resonance interactions between the converters and the grid. Then, by dividing the network of Figure 11b into two admittance matrix subsystems,
which in matrix notation are represented as
Then, the systems represented by (39) and (40) can be solved inverting the admittance matrix, where the resultant impedance model is computed as
Finally, the values of the impedances at bus are now calculated as
This leads to the equivalent circuit model in Figure 11c, where the current represents the contribution of all the inverters. Finally, for harmonic resonance analysis, only the values of and and the sum of both () are necessary to know, with
4.2. Simplified Model
The analytical expression of (45) is a bit complex, due to that several parameters are involved. However, if some considerations, such as and , are taken, the estimation of impedances at bus number are expressed as follows:
Finally, Figure 12 depicts an approximation of the impedance , as was computed in (48), where a good match is achieved in the low-frequency range. The comparison with the real value shows that this model serves as a very simple approximation to know the overall impedance of bus with a simple computation.
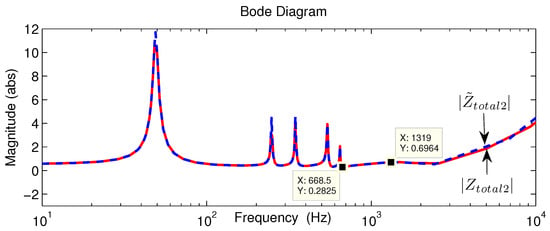
Figure 12.
Magnitude of the impedances of bus 2 and its model with = 1 nF, = 0.5 m, and = 1 µH.
The resonance analysis uses a small line distribution capacitance of each inverter circuit introduced by the bus bar, which is assumed to be fixed as = 1 nF. Furthermore, for simplification, feeder impedances between each pair of adjoining buses are configured to = 0.5 m and 1 µH. The above parameters are considered as a preliminary estimation of harmonic interactions illustrated in Figure 12, where the lowest magnitude of is 0.283 at 668.5 Hz, which is very close to the 13th harmonic. This frequency can be potentially amplified, and then, as is expected, a resonant current controller tuned at this frequency is highly recommended to avoid this phenomenon. Note that the impedances in Figure 12 were plotted by using parameters of Table 1. Finally, with the presented method, the input and output impedances at bus are computed in order to observe potential resonances in the system of Figure 11c, with different feeder impedances.

Table 1.
System parameters.
5. Conclusions
An impedance model of the converter 3L-TNPC was carried out. The control strategy was based on an enhanced VOC, which was implemented by using PMR controllers. The simulated scenario considers different values of feeder impedances under a conservative distorted voltage grid. By considering all the harmonic constraints assumed during the design stage, the obtained results show that Norton impedance model is an effective tool for low-frequency harmonic modeling of the current harmonic injection, where the controller design process is a relevant step to allow good performance. Furthermore, the results show that the feeder inductance must be well designed to avoid transmission resonances. Finally, the results show that the bus admittance matrix modeling is an effective tool for low-frequency harmonic modeling of the current harmonic injection produced by multiple utility-interactive converters.
6. Results
Simulation results were obtained in accordance with the impedance enhancement and PMR current controllers. Simulation was carried out in PLECS due to its flexibility and processing time. The simulation mainframe parameters are reported in Table 1. The control system was programmed in C code by using the C Block provided by PLECS.
6.1. Dynamic Results under Clean Grid
The first result is obtained with an irradiance change from 0.6 to 1 kW/m2 in order to verify the proposed control operating under a clear voltage grid. Temperature and irradiance variables are presented in Figure 13a, the dc-link voltage tracking and balanced capacitor voltages are plotted in Figure 13b, and line-to-line five-level converter voltage is included in Figure 13c. Finally, the grid current control tracking and its synchronization with the grid phase voltage are presented in Figure 13d. Note that the input PV and total active and reactive power are included in Figure 13e.
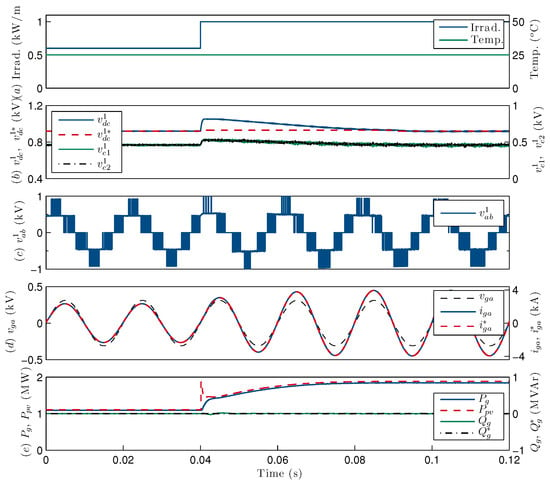
Figure 13.
Dynamic results during an irradiance step from 0.6 to 1.0 kW/m2 under clean grid: (a) Irradiance and temperature levels; (b) capacitor and dc-link voltages; (c) converter output voltage; (d) voltage and current grid with its reference; (e) active and reactive with their references.
6.2. Steady-State Results under Distorted Grid
The second result is obtained at standard test conditions (STC), i.e., 1 kW/m2 of irradiance and 25 °C of temperature to verify the controller design. Both variables are presented in Figure 14a. In Figure 14b the dc-link voltage tracking and both capacitor voltages are illustrated, which are dynamically balanced. On the other hand, the line-to-line converter voltage is depicted in Figure 14c, where the five-level voltage waveform is appreciable, as expected. The grid current control tracking and its synchronization with the grid phase voltage is shown in Figure 14d. Finally, the input PV of hlrthe converter and total active and reactive power are included in Figure 14e. Note that during 0 to 0.04 s, grid voltage is clean, then at t = 0.04 s, a harmonic grid voltage profile detailed in Table 2 is activated. To evaluate the reactive power control, its reference is set as zero ( = 0) at 0.04 to 0.08 s, while at t = 0.08 s, a reactive power reference of = −0.5 MVAr is applied.
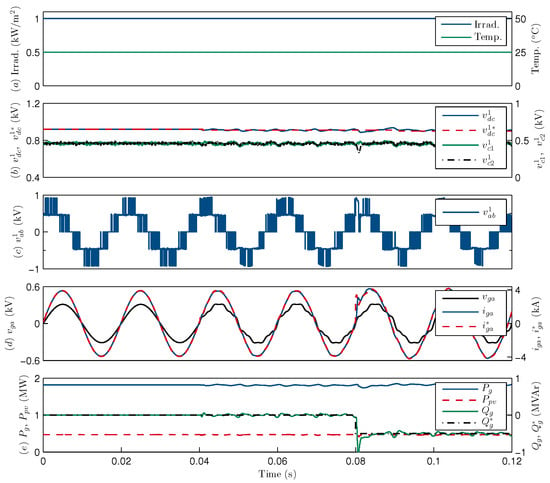
Figure 14.
Steady-state results operating at STC conditions under distorted grid: (a) Irradiance and temperature levels; (b) capacitor and dc-link voltages; (c) converter output voltage; (d) voltage and current grid with its reference; (e) active and reactive with their references.

Table 2.
Harmonic voltage profile under test.
6.3. Harmonic Injection Level under Distorted Grid
The third result is obtained by using the same harmonic profile of Table 2. Some comprehensive simulations were carried out based on the Norton equivalent model of Figure 10 and the EMT model, where the results under a clean to polluted grid voltage transition at 0.04 s for rated power are illustrated on the left side of Figure 15, while the FFT analysis is presented on the the right side of Figure 15. Finally, the harmonic analysis under rated power shows that the current grid code is correctly satisfied, due to the 5th and the rest of the harmonics being under the code limit, as was expected according to Figure 8.
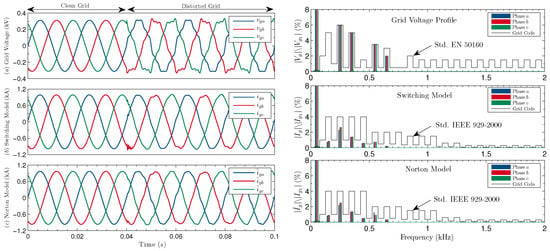
Figure 15.
Output current of whole converter by using switching and Norton models under rated power and distorted grid, time (left), and harmonic (right) responses: (a) grid voltage and its harmonic response; (b) switching model and its harmonic response; (c) Norton model and its harmonic response.
6.4. Brief Harmonic Comparison Analysis
A summary table of injected current THD levels under distorted grid voltage is presented in Table 3. The current harmonic injection level at PCC was computed for two power conditions: summarized as Case 1, distorted grid voltage with rated and equal irradiance level of 1 kW/m2 in each converter; and Case 2, distorted grid voltage with different irradiance levels [ ] = [1 0.5 0.33 0.25] kW/m2 in Figure 1. Note that the Norton equivalent harmonic model in comparison with the switched model is an accurate approximation and can be used for estimation of current harmonic injection at PCC.

Table 3.
Current harmonic injection levels at PCC under Case 1 and Case 2.
The correct operation under grid voltage operation by using well-known proportional–integral (PI) controllers is not straightforward. In fact, the industry is using stationary controllers to improve the performance of PV inverters under distorted grid [28]. In order to compare the derived models with proposed PMR controllers with respect to conventional PI controllers, Table 4 is presented. This table presents the current harmonic injection levels at PCC of derived models for 3L-TNPC Circuit 1.

Table 4.
Current harmonic injection levels at PCC of derived models for 3L-TNPC Circuit 1 by using PI and proposed PMR controllers.
Finally, from time and frequency domains it is possible to conclude that the Norton equivalent harmonic model, in comparison with the switched model, is an accurate and simple approximation.
6.5. Brief Resonance Analysis
Based on the generated model, some results in the time and frequency domain are shown in Figure 16 and Figure 17. In Figure 16, the inductance feeder is considered as = 1 µH, as previously reported in Figure 12, showing that sinusoidal grid current waveforms are retained when a distorted voltage is applied. The feeder parameters are included in Table 5. Thus, in accordance with the obtained spectrum on the right side of Figure 16, the analyzed resonance is correctly avoided by including an adequate current controller. On the other hand, this good condition can be potentially changed if more than four converters are connected to the ac feeder or if the impedance feeder is changed. This condition is evaluated in Figure 17, where the inductance feeder is changed from = 1 µH to = 8.5 µH. Note that an amplified resonance at 1.30 kHz appears on the injected grid current as is plotted on the right side of Figure 17. Finally, as a recommended parameter design to avoid local LCL filter resonances, the nominal relation between the filter inductor and the grid inductor must be = /3, while to avoid feeder resonances the feeder inductor must be below 8.5 µH with a very low feeder resistance to avoid transmission power losses.

Figure 16.
Simulation results of bus 2 with parameters of Feeder 1, time (left) and harmonic (right) responses. (a) grid voltage and its harmonic response; (b) Norton model and its harmonic response.

Figure 17.
Simulation results of bus 2 with parameters of Feeder 2, time (left) and harmonic (right) responses. (a) grid voltage and its harmonic response; (b) Norton model and its harmonic response.

Table 5.
Feeder parameters under test.
Future work will validate the proposed model by using a low-power-scale system under a laboratory-controlled scenario, where key challenges such as electromagnetic interference, leakage currents, common-mode voltage generation, grid impedance estimation, and adaptive controllers would be potentially resolved.
Author Contributions
Formal analysis, C.A.R. and S.K.; Investigation, C.A.R., R.I. and Y.M.; Funding acquisition, A.M.A. All authors have read and agreed to the published version of the manuscript.
Funding
The authors gratefully acknowledge the financial support provided by ANID + FONDECYT Regular 1210757, AC3E (ANID/BASAL/FB0008), and SERC Chile (ANID/FONDAP/15110019). Abraham Marquez gratefully acknowledges the financial support provided by Contratación de Personal Investigador Doctor. (Convocatoria 2019) 43 Contratos Capital Humano Línea 2. Paidi 2020, supported by the European Social Fund and Junta de Andalucía.
Data Availability Statement
No new data were created or analyzed in this study. Data sharing is not applicable to this article.
Conflicts of Interest
The authors declare no conflict of interest.
References
- Kouro, S.; Leon, J.I.; Vinnikov, D.; Franquelo, L.G. Grid-Connected Photovoltaic Systems: An Overview of Recent Research and Emerging PV Converter Technology. IEEE Ind. Electron. Mag. 2015, 9, 47–61. [Google Scholar] [CrossRef]
- Bolinger, M.; Seel, J. Utility-Scale Solar 2015: An Empirical Analysis of Project Cost, Performance, and Pricing Trends in the United States; Lawrence Berkeley National Laboratory: Berkeley, CA, USA, 2016.
- Choudhury, S.; Bajaj, M.; Dash, T.; Kamel, S.; Jurado, F. Multilevel Inverter: A Survey on Classical and Advanced Topologies, Control Schemes, Applications to Power System and Future Prospects. Energies 2021, 14, 5773. [Google Scholar] [CrossRef]
- Monopoli, V.G.; Marquez, A.; Leon, J.I.; Liserre, M.; Buticchi, G.; Franquelo, L.G.; Vazquez, S. Applications and Modulation Methods for Modular Converters Enabling Unequal Cell Power Sharing: Carrier Variable-Angle Phase-Displacement Modulation Methods. IEEE Ind. Electron. Mag. 2022, 16, 19–30. [Google Scholar] [CrossRef]
- Dargahi, V.; Abarzadeh, M.; Corzine, K.A.; Enslin, J.H.; Sadigh, A.K.; Rodriguez, J.; Blaabjerg, F.; Maqsood, A. Fundamental Circuit Topology of Duo-Active-Neutral-Point-Clamped, Duo-Neutral-Point-Clamped, and Duo-Neutral-Point-Piloted Multilevel Converters. IEEE J. Emerg. Sel. Top. Power Electron. 2019, 7, 1224–1242. [Google Scholar] [CrossRef]
- Liu, J.; Shen, X.; Alcaide, A.M.; Yin, Y.; Leon, J.I.; Vazquez, S.; Wu, L.; Franquelo, L.G. Sliding Mode Control of Grid-Connected Neutral-Point-Clamped Converters Via High-Gain Observer. IEEE Trans. Ind. Electron. 2022, 69, 4010–4021. [Google Scholar] [CrossRef]
- Craciun, B.I.; Kerekes, T.; Sera, D.; Teodorescu, R.; Timbus, A. Benchmark networks for grid integration impact studies of large PV plants. In Proceedings of the IEEE Grenoble PowerTech, Grenoble, France, 16–20 June 2013; pp. 1–6. [Google Scholar]
- Schweizer, M.; Kolar, J.W. Design and Implementation of a Highly Efficient Three-Level T-Type Converter for Low-Voltage Applications. IEEE Trans. Power Electron. 2013, 28, 899–907. [Google Scholar] [CrossRef]
- Shamseh, M.B.; Inzunza, R.; Kinoshita, M.; Ambo, T. Comparison between Norton Impedance Model and Frequency Scan Analysis of 3.36MW Inverter. In Proceedings of the 2019 8th International Conference on Renewable Energy Research and Applications (ICRERA), Brasov, Romania, 3–6 November 2019; pp. 827–832. [Google Scholar]
- Inzunza, R.; Okuyama, R.; Tanaka, T.; Kinoshita, M. Development of a 1500Vdc photovoltaic inverter for utility-scale PV power plants. In Proceedings of the 2015 IEEE 2nd International Future Energy Electronics Conference (IFEEC), Taipei, Taiwan, 1–4 November 2015; IEEE: Piscataway, NJ, USA, 2015; pp. 1–4. [Google Scholar]
- He, Y.; Chung, H.S.H.; Lai, C.T.; Zhang, X.; Wu, W. Active Cancelation of Equivalent Grid Impedance for Improving Stability and Injected Power Quality of Grid-Connected Inverter Under Variable Grid Condition. IEEE Trans. Power Electron. 2018, 33, 9387–9398. [Google Scholar] [CrossRef]
- Yin, Y.; Vazquez, S.; Marquez, A.; Liu, J.; Leon, J.I.; Wu, L.; Franquelo, L.G. Observer-Based Sliding-Mode Control for Grid-Connected Power Converters Under Unbalanced Grid Conditions. IEEE Trans. Ind. Electron. 2022, 69, 517–527. [Google Scholar] [CrossRef]
- Ali Khan, M.Y.; Liu, H.; Yang, Z.; Yuan, X. A Comprehensive Review on Grid Connected Photovoltaic Inverters, Their Modulation Techniques, and Control Strategies. Energies 2020, 13, 4185. [Google Scholar] [CrossRef]
- Teodorescu, R.; Liserre, M.; Rodriguez, P. Grid Converters for Photovoltaic and Wind Power Systems; John Wiley & Sons: Hoboken, NJ, USA, 2011. [Google Scholar]
- Liserre, M.; Perez, M.A.; Langwasser, M.; Rojas, C.A.; Zhou, Z. Unlocking the Hidden Capacity of the Electrical Grid Through Smart Transformer and Smart Transmission. Proc. IEEE 2022, 1–17. [Google Scholar] [CrossRef]
- Chilipi, R.; Al Sumaiti, A.; Singh, B. Control of Grid-Tied Multiple Distributed Generation Systems with Cooperative Compensation Capabilities. IEEE J. Emerg. Sel. Top. Ind. Electron. 2022, 3, 821–833. [Google Scholar] [CrossRef]
- Paulo Bonaldo, J.; Lessa Tofoli, F.; Vitor Arantes Monteiro, R.; Kelis Morales-Paredes, H. Comparative analysis of techniques for the limitation of compensation currents in multifunctional grid-tied inverters. Int. J. Electr. Power Energy Syst. 2021, 126, 106574. [Google Scholar] [CrossRef]
- Zhang, J.; Yang, S.; Song, K.; Wang, Y.; Zhang, S.; Konstantinou, G. Accurate Identification of Harmonic Impedance of Traction Power Supply Systems Considering Harmonic Lateral Propagation. IEEE Trans. Ind. Electron. 2022, 1–10. [Google Scholar] [CrossRef]
- Ray, I. Review of Impedance-Based Analysis Methods Applied to Grid-Forming Inverters in Inverter-Dominated Grids. Energies 2021, 14, 2686. [Google Scholar] [CrossRef]
- Wang, C.; Yu, C.; Shu, Q. An Algorithm for Estimating Time-varying Impedance at PCC Based on Numerical Variation. IEEE Trans. Instrum. Meas. 2022, 1. [Google Scholar] [CrossRef]
- Torabi Milani, M.; Khodabakhchian, B.; Mahseredjian, J. Detailed EMT-Type Load Modeling For Power System Dynamic and Harmonic Studies. IEEE Trans. Power Deliv. 2022, 1–9. [Google Scholar] [CrossRef]
- Arguello, A.; Torquato, R.; Rosado, B.; Freitas, W. Modeling of Single-Phase Photovoltaic Generators for System-Wide Harmonic Power Flow Studies. IEEE Trans. Energy Convers. 2022, 1–11. [Google Scholar] [CrossRef]
- Du, W.; Ma, Z.; Wang, Y.; Wang, H.F. Harmonic oscillations in a grid-connected PV generation farm caused by increased number of parallel-connected PV generating units and damping control. CSEE J. Power Energy Syst. 2020, 1–9. [Google Scholar] [CrossRef]
- Meng, X.; Liu, Z.; Liu, Y.; Zhou, H.; Tasiu, I.A.; Lu, B.; Gou, J.; Liu, J. Conversion and SISO Equivalence of Impedance Model of Single-Phase Converter in Electric Multiple Units. IEEE Trans. Transp. Electrif. 2022, 1. [Google Scholar] [CrossRef]
- Singh, R.S.; Ćuk, V.; Cobben, S. Measurement-Based Distribution Grid Harmonic Impedance Models and Their Uncertainties. Energies 2020, 13, 4259. [Google Scholar] [CrossRef]
- Wang, F.; Duarte, J.L.; Hendrix, M.A.; Ribeiro, P.F. Modeling and Analysis of Grid Harmonic Distortion Impact of Aggregated DG Inverters. IEEE Trans. Power Electron. 2011, 26, 786–797. [Google Scholar] [CrossRef]
- Rojas, C.A.; Kouro, S.; Inzunza, R.; Okuno, K.; Mitsugi, Y. Harmonic Interaction Modelling of Multiple Utility-Interactive Multilevel Photovoltaic Systems. In Proceedings of the IEEE Southern Power Electronics Conference (SPEC), Puerto Varas, Chile, 4–7 December 2017; pp. 1–6. [Google Scholar]
- Inzunza, R.; Tawada, Y.; Furukawa, M.; Shibata, N.; Sumiya, T.; Tanaka, T.; Kinoshita, M. Behavior of a photovoltaic inverter under sudden increase in irradiance due to reflection in clouds. In Proceedings of the 2015 International Conference on Renewable Energy Research and Applications, ICRERA, Palermo, Italy, 22–25 November 2015; pp. 851–855. [Google Scholar]
- Semikron: 3L NPC and TNPC Topology. 2015. Available online: https://www.semikron-danfoss.com/dl/service-support/downloads/download/semikron-application-note-3l-npc-tnpc-topology-en-2015-10-12-rev-05.pdf (accessed on 6 December 2022).
- Infineon: 3-Level Configurations. 2016. Available online: https://www.infineon.com/cms/en/product/power/igbt/igbt-modules/f3l400r12pt4_b26/ (accessed on 6 December 2022).
- OnSemiconductor: Q0PACK Modules. 2018. Available online: https://www.onsemi.cn/pdf/datasheet/nxh80t120l3q0s3g-d.pdf (accessed on 6 December 2022).
- Joetten, R.; Gekeler, M.; EIBEL, J. AC drive with three level voltage source inverter and high dynamic performance micropocessor control. Proc. Eur. Conf. Power Electron. Appl. 1985, 85, 3.1–3.6. [Google Scholar]
- Salem, A.; Abido, M.A. T-Type Multilevel Converter Topologies: A Comprehensive Review. Arab. J. Sci. Eng. 2018, 44, 1713–1735. [Google Scholar] [CrossRef]
- Schmidt, H.; Burger, B.; Bussemas, U.; Elies, S. How Fast Does an MPP Tracker Really Need To Be? In Proceedings of the 24th European Photovoltaic Solar Energy Conference (EUPVSEC), Hamburg, Germany, 21–25 September 2009; pp. 3273–3276. [Google Scholar]
- Temiz, H.; Demirok, E.; Keysan, O.; Türkay, A.; Çetinkaya, B. Performance comparison of passive series R and shunt R-C damped LCL filter for grid-connected inverters. J. Eng. 2019, 2019, 4698–4702. [Google Scholar] [CrossRef]
- Verdugo, C.; Kouro, S.; Rojas, C.A.; Perez, M.A.; Meynard, T.; Malinowski, M. Five-Level T-type Cascade Converter for Rooftop Grid-Connected Photovoltaic Systems. Energies 2019, 12, 1743. [Google Scholar] [CrossRef]
- Bendre, A.; Venkataramanan, G.; Rosene, D.; Srinivasan, V. Modeling and design of a neutral-point voltage regulator for a three-level diode-clamped inverter using multiple-carrier modulation. IEEE Trans. Ind. Electron. 2006, 53, 718–726. [Google Scholar] [CrossRef]
- Kouro, S.; Lezana, P.; Angulo, M.; Rodriguez, J. Multicarrier PWM with DC-Link Ripple Feedforward Compensation for Multilevel Inverters. IEEE Trans. Power Electron. 2008, 23, 52–59. [Google Scholar] [CrossRef]
- Wu, Y.; Zeng, G.; Liu, J.; Song, G.; Sun, J. Design and Implementation of a 125kW T-NPC PV Inverter. In Proceedings of the PCIM Asia 2015; International Exhibition and Conference for Power Electronics, Intelligent Motion, Renewable Energy and Energy Management, Nuremberg, Germany, 19–21 May 2015; pp. 1–8. [Google Scholar]
- Kim, Y.J.; Kim, H. Optimal inductance ratio of LCL filter for grid connected inverters considering with low order harmonics. In Proceedings of the Annual Conference of the IEEE Industrial Electronics Society, IECON, Florence, Italy, 23–26 October 2016; pp. 2355–2360. [Google Scholar]
- Goodwin, G.; Graebe, S.; Salgado, F. Control System Design; Prentice-Hall: Hoboken, NJ, USA, 2001. [Google Scholar]
- Hackl, C.M. On the equivalence of proportional-integral and proportional-resonant controllers with anti-windup. CoRR 2016, abs/1610.07133. [Google Scholar]
- Do, D.T.; Hirsch, H. Harmonic Resonance Risk Assessment of Photovoltaic Applications in Low Voltage Grid. In Proceedings of the 2020 IEEE 29th International Symposium on Industrial Electronics (ISIE), Delft, The Netherlands, 17–19 June 2020; pp. 868–873. [Google Scholar]
- Wang, F.; Duarte, J.L.; Hendrix, M.A.M. Grid-Interfacing Converter Systems With Enhanced Voltage Quality for Microgrid Application-Concept and Implementation. IEEE Trans. Power Electron. 2011, 26, 3501–3513. [Google Scholar] [CrossRef]
- Wang, X.; Wang, S.; Wang, S.; Yang, C.; Zhao, X. A Digital Delay Compensation Method to Improve the Stability of LCL Grid-Connected Inverters. Energies 2021, 14, 2730. [Google Scholar] [CrossRef]
- Sgro, D.; Souza, S.A.; Tofoli, F.L.; Leão, R.P.S.; Sombra, A.K.R. An integrated design approach of LCL filters based on nonlinear inductors for grid-connected inverter applications. Electr. Power Syst. Res. 2020, 186, 106389. [Google Scholar] [CrossRef]
Publisher’s Note: MDPI stays neutral with regard to jurisdictional claims in published maps and institutional affiliations. |
© 2022 by the authors. Licensee MDPI, Basel, Switzerland. This article is an open access article distributed under the terms and conditions of the Creative Commons Attribution (CC BY) license (https://creativecommons.org/licenses/by/4.0/).