Abstract
In recent years, CO2 huff and puff has become one of the most important methods developed for unconventional shale oil reservoirs and has been widely used in all major shale oil fields. However, the microscopic mechanism of CO2 contacting with crude oil is complex, and the change law of the residual oil occurrence after CO2 injection is unclear. In this paper, a micro visualization fluid flow simulation experiment (microfluidic experiment) under high temperatures and high pressure of a shale reservoir was conducted to reveal the micro mechanism of CO2 and crude oil after contact at the microscale. This allows conclusion of more precise results than any experiment conducted in a room environment. Combined with gas–oil two-phase micro flow characteristics, the production mechanisms of crude oil by CO2 huff and puff at the pore scale are clarified, and the change characteristics of the remaining oil occurrence state after CO2 injection are quantified. The results show that CO2 mainly produces crude oil in macropores and microfractures in the injection stage of huff and puff, improves the mobility of crude oil through diffusion dissolution in the soaking stage, and that the driving of dissolved gas is dominant in depressurization production. The major micro-mechanisms for CO2 to improve shale oil are extraction and dissolution expansion, accompanied by a variety of secondary mechanisms, such as the miscibility effect, oil expansion, viscosity reduction and other contact effects, as well as the improvement of crude oil properties. The simulation results of huff and puff development show that soaking is an important stage to enhance oil recovery. With increasing soaking time or the soaking pressure, the recovery degree of crude oil will increase positively.
1. Introduction
Compared with conventional gas injection huff and puff, CO2 huff and puff mechanism of shale reservoir is more complex, due to the strong heterogeneity of the shale reservoir and the development of microfractures, pores and throats [1]. To improve CO2 huff and puff recovery, it is urgent to determine the mechanism of crude oil production of fluids in a shale reservoir, the flow law of oil and gas and to clarify the changes in the occurrence state of crude oil during huff and puff. Reasonable injection and production parameters are formulated [2], which refers to the influence law of huff and puff parameters on shale production.
Conventional reservoir huff and puff injection gas can directly enter the matrix to achieve the production of crude oil [3]. However, shale develops a large number of micro- and nano-scale pores, which makes it difficult for gas to directly enter the matrix to produce crude oil. Existing studies show that the mobilization mechanism of crude oil in the huff-and-puff process mainly occurs in the soaking stage [2]. CO2 enters the matrix from the fracture through diffusion in the contact between oil and gas and separates the crude oil on the rock wall through competitive adsorption with alkanes [4]. In addition, CO2 extracts the light components in crude oil, reduces the oil–gas interfacial tension [5], resulting in oil–gas miscibility and the increase of oil fluidity caused by the reduction of crude oil viscosity [6]. Relevant studies show that the miscibility can increase CO2 huff and puff by 18%, thereby greatly improving oil recovery [7]. During the production process, gas can be released due to the pressure reduction, which triggers the driving of dissolved gas [8].
At present, the experiments of CO2 huff and puff mechanism of shale reservoirs have been carried out, but the traditional methods for studying CO2 huff and puff shale oil are mostly core scale experiments [9,10]. This proves that CO2 huff and puff technology can effectively improve the recovery of shale oil [11]. However, there is less research relating to the microscopic mechanism of crude oil mobilization in CO2 huff and puff process. Previous methods used to study the remaining oil are generally done through environmental scanning electron microscopy, laser focusing and micro fluorescence methods [12]. These methods can only be used for qualitative analysis through static observation. In contrast, the micro visualization experimental technology has the advantages of dynamic description and quantitative analysis, which can accurately and quickly improve knowledge on the seepage law of oil, gas and water and enhance the oil recovery mechanism of CO2 in fractures and micro- and nano-scale matrices.
In this paper, a microscopic visualization experiment is conducted to describe the real dynamic huff and puff displacement process and the mechanism of oil–gas seepage at the pore scale. The process of oil upgrading with various mechanisms is analyzed respectively and the influence of pore structure on oil movement of shale oil is concluded. The mechanisms of oil mobilization in different situations are quantized by the shape of the oil and the degrees of exertion by different mechanisms. The migration characteristics of fluids with different properties in micro- and nano-scale channels and the enrichment law of remaining oil under the formation conditions are explored from the microscopic pore structure. Sensitivity analysis, including soaking pressure and soaking time, are conducted. The variation of the oil occurrence state is qualitatively and quantitatively characterized. This has a theoretical significance for the application of CO2 huff and puff technology in shale reservoirs. As the huff and puff development proceeds, the phase of oil transforms from the continuous phase to the discontinuous phase. The flow of crude oil becomes more and more dispersed with intensified discontinuity. The sensitivity analysis shows that cumulative oil recovery has a positive relationship with both soaking pressure and soaking time.
2. Materials and Methods
2.1. Material
In this experiment, after extraction, noise reduction, threshold segmentation and correction of field emission scanning electron microscope (FE-SEM) images of shale cores, the pore throat structure of shale cores was divided, representative pore throat structures were selected, and a micro visualization model that can fully reflect the pore throat distribution of shale reservoirs was produced.
2.2. Specific Experimental Parameters and Conditions
- Microscopic visualization model (shown in Figure 1): the material is glass with hydrophilic characteristics, high temperature and high-pressure resistance, changeable wettability (hydrophilic/oil film plating), strong bonding ability, good transmission imaging effect, etc.; Model size (L × wide × Thickness) is 75 mm × 75 mm × 3 mm, with a minimum diameter of 10 μm. The overall hole throat diameter of the chip is distributed in the range of 10–200 μm. Crude oil viscosity is 12.58 MPa·s and crude oil density is 0.86 g/cm3.
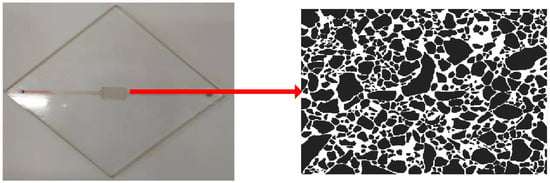 Figure 1. The realized microscopic visual model.
 - The experimental crude oil was ground-degassed crude oil mixed with dye. According to the experimental results, Sudan III was selected to dye the transparent yellow crude oil red. The experimental temperature was 110 °C, and the well-plugging pressure and time at different points were set. This allows the identification of the status of oil and gas at different times. This technique allows a dynamic description of CO2 injection process at shale oil reservoir condition, in comparison to the static observation such as environmental scanning electron microscopy, laser focusing and micro fluorescence methods.
2.3. Instrument
The high temperature and high-pressure microfluidic experimental device is shown in Figure 2. It included a high-pressure injection and production system, high temperature and high-pressure environment loading system, high-precision image recognition, and a data acquisition system. The experimental temperature that the device can reach was 150 °C, and the pressure could reach 70 MPa.
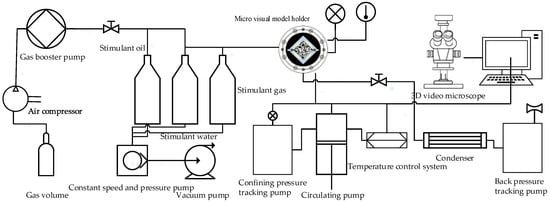
Figure 2.
Flow chart of the micro visualization experimental device.
The injection pump injected the displacement medium into the microchannel chip at a constant speed and pressure, simulated the temperature and pressure conditions of the real reservoir through the confining pressure tracking pump, circulating pump and temperature control system, and used a high precision back pressure pump to control the outlet pressure. The image of developing time elapsing in the displacement process in the micro-scale channel was recorded by video microscope, and the experimental results were analyzed quantitatively by image processing technology.
2.4. Methods
The research process was as follows:
- The model was vacuumed and saturated. The model level was put in the supporting system. The kerosene was saturated after vacuuming the model, and the model temperature and pressure were gradually raised to the original formation conditions. Then, the target reservoir crude oil to the model was saturated;
- Gas injection process. Gas was injected into the inlet of the model by the same injection method to capture and record the microscopic interaction time and the change process of gas and shale oil;
- Soaking process. After the gas enters, the inlet end and outlet end were closed. Well-soaking was conducted for 15–45 min. Meanwhile, microscopic changes in the gas and shale oil during the well plugging process were recorded;
- The above steps were repeated to carry out CO2 huff and puff experiments under different conditions of well-soaking pressure and time;
- The experiment ended. The displacement medium was replaced, either with petroleum ether or toluene. The visualization model was cleaned to the fluid in all pore structure was removed. The image and video of fluid flow in the channel were recorded with the matching software of the microscope, and the flow behavior of fluid in the model was observed in real time on the computer.
- The remaining oil was estimated by image processing and the crude oil was classified and concluded directly by shape including angular, dropwise, membranous, columnar and cluster.
- Through image processing, the chip after oil saturation was scanned, and the number of oil pixels in the saturated oil area was identified. After CO2 huff and puff, the number of remaining oil pixels was identified again. The number of eventually remaining oil pixels was divided by the number of original saturated oil pixels, and the remaining residual saturation was obtained.
3. Results and Discussion
3.1. Microscopic Interaction Mechanism between CO2 and Crude Oil
Based on the high temperature and high-pressure micro-scale flow experiments, CO2 huff and puff shale oil experiments (15 MPa/20 MPa/25 MPa/35 MPa, 110 °C) were conducted to characterize the microscopic visualization process of CO2 huff and puff shale oil.
In the process of gas injection at the closed outlet end, as the pressure and the injected gas increases, the gas gradually enters the etching area of the pore structure (as shown in Figure 3). With the increase of pressure, more gas enters the crude oil [13]. CO2 can then displace a portion of the crude oil into the macropores and microfractures, which could also cause gas channeling in the macropores.
Figure 3.
Gas injection process.
In the soaking stage, the color of crude oil becomes lighter as the amount of gas dissolved in shale oil gradually increases through diffusion [14,15]. This reduces the viscosity of crude oil and increases the fluidity of crude oil [16]. CO2 molecules diffuse into the oil phase and light hydrocarbons are released into CO2 from the oil phase [15,17], a very slow process. Therefore, there must be sufficient time for CO2 molecules to fully diffuse into the oil phase (as shown in Figure 4).
Figure 4.
The color of crude oil becomes lighter (Soaking process).
With depressurization production begins, CO2 escapes from the liquid, generating a gas driving force in the liquid, which improves the oil displacement effect [18]. However, due to the barrier of the rock matrix, it is difficult for gas to enter all the small pores along the normal track. Once the pores with a small pore throat radius receives pressure from other directions, they will be blocked at the throat and enter the throat in the form of bubbles. At the same time, the divided bubbles quickly gather, gradually expand and fill the whole pores, by squeezing the crude oil to induce outflow. At the same time, some CO2 displaces oil, occupying a certain pore space and becomes bound gas.
Under the experimental pressure of 35 MPa, CO2 reduces the relative density of the crude oil by extracting and vaporizing the light components of different components in the crude oil, and the color of the crude oil gradually becomes lighter. Then, heavy hydrocarbons are vaporized and produced [19], and finally reach stability; with the increase of pressure, the oil–gas interface contact angle increases, the interfacial tension decreases [20] and gradually becomes miscible, forming a miscible zone of CO2 and light hydrocarbons. The movement of the miscible zone is the most effective oil displacement process, which can greatly improve oil recovery. Asphaltene precipitation and extraction are more obvious when heavy crude oil mixes with CO2 and light components are extracted. The miscible and extraction phenomena are shown in Figure 5.
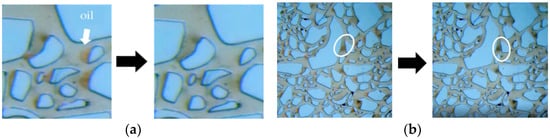
Figure 5.
(a) Miscibility and (b) Extraction.
3.2. The Mechanism of Oil Mobilization
Based on the microscopic visualization experimental research, the four mechanisms of CO2 mobilization were explored. As shown in Figure 6a, the residual oil adhering to one side of the matrix experiences shear force of CO2 flow on both sides, which focuses in one place, and the drop-like residual oil is motivated [21,22]. There is a certain amount of water in the development of shale after fracturing. As shown in Figure 6b at the pores with poor fluidity, funnel-shaped CO2 extracts the light components of crude oil and CO2 flows to carry out crude oil. As shown in Figure 6c, for deep crude oil with large molecular weights, CO2 and crude oil will be mixed by multiple contacts at the void with good fluidity, and a plume-like stepwise mixing state of CO2 crude oil and crude oil will appear. Figure 6d CO2 contacts with the formation fluid and surrounds the crude oil, causing the volume of the crude oil to swell and increasing the formation energy.
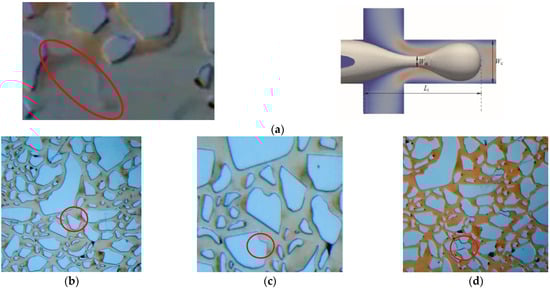
Figure 6.
Oil mobilization: (a) Flow aggregation; (b) CO2 funnel extraction of crude oil; (c) Plume stepwise miscibility; (d) Swelling effect.
The remaining oil can be classified into two types, according to differences in the shape and size: the remaining oil in flake form and the remaining oil in the dispersed phase, mainly including cluster, porous, columnar, membranous and drop-like remaining oil. Cluster residual oil is essentially a large oil block surrounded by small throats, including several pore throats. During gas injection, due to the heterogeneity of rocks and other factors like the large mobility ratio of the displacing phase to the displaced phase, the gas first passes through the large pores which later forms channels. This causes the original oil in the small pores to remain in the original pores. The film-like residual oil is located in the inner walls of the pore and throat, where there is relatively high resistance to flow. The columnar residual oil is equivalent to the pore throat characteristics, either with one end closed or with one end in which it is very difficult to have flow. In the late stage of huff and puff, a small oil block can deform and pass through the large throat under the driving force of gas. Due to the viscosity of oil and the effect of oil–gas interfacial tension, this small oil block cannot pass through other small throats, even under the driving force of gas [23]. This causes the small oil block to stay in the pores and form drop-like residual oil. Cluster residual oil is in the continuous phase with strong production capacity, while the other four are in the discontinuous phase residual oil with weak production capacity.
The essence of enhancing the CO2 recovery mechanism is extraction and dissolution expansion, which shows in phenomena such as the miscibility effect, expansion [24], viscosity reduction, improvement of mobility ratio and reduction of interfacial tension. As shown in Figure 7, CO2 gas directly contacts crude oil to extract its light components. CO2 dissolves into the crude oil and the crude oil expands. The micro experiment of gas flooding after hydraulic fracturing is used to quantitatively characterize the action weights of the two mechanisms. The mobilization mechanism of residual oil in different shapes is divided into extraction and dissolution expansion. After processing with the software ImageJ, different mechanisms of micro residual oil were obtained. As shown in Figure 8 and Figure 9, the production of crude oil by CO2 extraction reached 75.95%. The dissolution rate was only 24.05%.
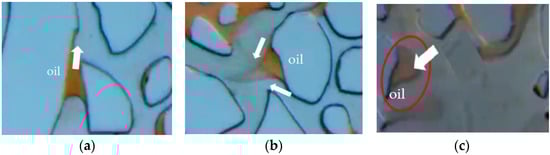
Figure 7.
Flow pattern of residual oil in discontinuous phase: (a) Columnar; (b) Membranous; (c) Dropwise.
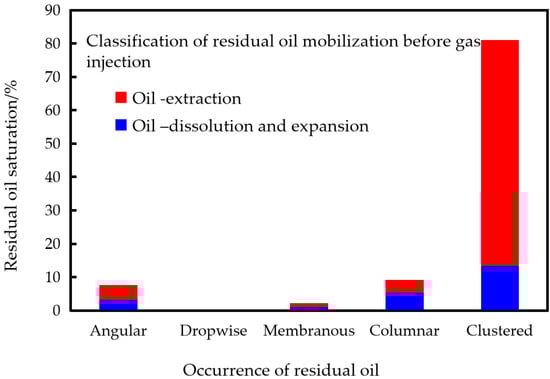
Figure 8.
Mobilization classification of residual oil before gas injection.
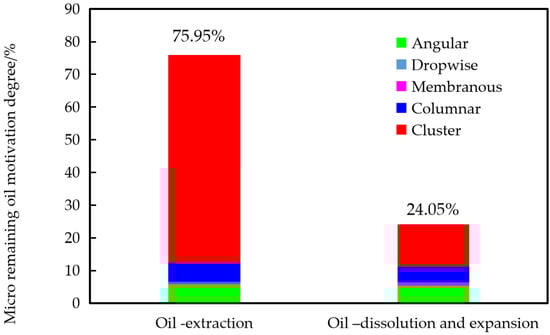
Figure 9.
Mobilization degree of remaining oil under different mechanisms.
CO2 contacts and dissolves into crude oil, which leads to crude oil swelling. The volume expansion ability of crude oil in different occurrence states is quantitatively characterized, as shown in Equation (1). The expansion areas of corner-1, membrane-2, membrane-3, membrane-4, column-5 and porous-6 at different times were measured, and their volume expansion coefficients were calculated.
The results of the calculation are shown in Figure 10. As residual oil saturation decreases rapidly in the early stage of huff and puff, the frequency will be larger in the early stage, are last about 5 s each time. Then, as the residual oil saturation decreases slowly in the later stage, the frequency changes to 30 s each time. With the increase of time, the volume expansion rate increases linearly. CO2 can continuously interact with crude oil and dissolve in it. The smaller the storage volume, the more fully the crude oil can contact CO2, and the larger the expansion coefficient under the action of CO2. As a result, membrane-3 shows the largest expansion capacity.
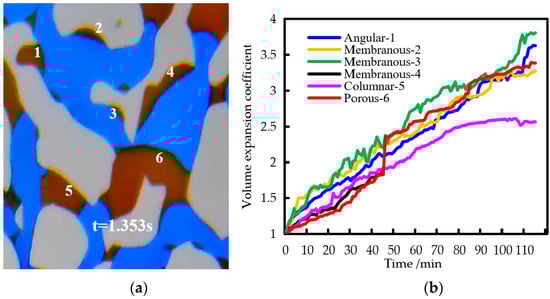
Figure 10.
Variation of volume expansion coefficient of crude oil: (a) Variation states of remaining oil; (b) Volume expansion coefficient of different crude oil.
3.3. Occurrence State and Influencing Factors of Remaining Oil after Huff and Puff
3.3.1. Soaking Pressure
As shown in Figure 11, when the soaking pressure is 10 MPa, the color change of crude oil is not obvious, the volume of CO2 dissolved into the crude oil is small and a large amount of CO2 still exists in the form of gas in the pores. Due to the pressure gap between the inlet and outlet, CO2 migrates in the pores, and CO2 migrates between the pores and throats in a “compression–release” cycle, squeezing the crude oil and diffusing around. In the cross-distribution area of multiple throats, the converged CO2 will plunge along one of the throats with less resistance, resulting in a decrease in the pressure at the converging point. After the pressure is reduced, the CO2 at the convergence point does not have enough pressure to force CO2 into other throats, so insufficient pressure will reduce the swept area of CO2. The process of gas flooding is a step-by-step displacement process. Under the condition of sufficient soaking pressure, gas will enter the next pore step-by-step, which improves the recovery of crude oil. As shown in Figure 12a, the cluster-like residual oil accounts for more than 80% of total residual oil under 10 MPa. During the production stage, non-wetting phase displaces the wetting phase. There is a large interfacial tension between gas and liquid, and there is a large number of Haines jump phenomena occurring [25]. Gas fingers in and out, forming a gas channel. The sweep coefficient is small. After the experiment, the residual oil mostly exists in a sheet shape.
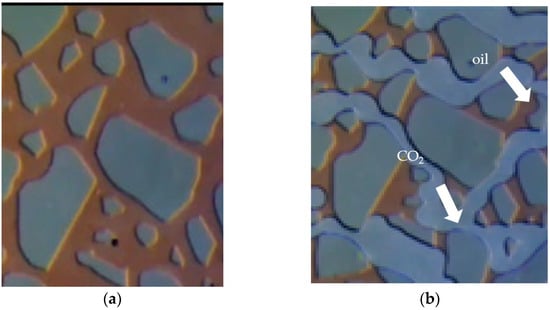
Figure 11.
10 MPa 110 °C Microscopic experiment chart: (a) Before gas injection; (b) After flowback.
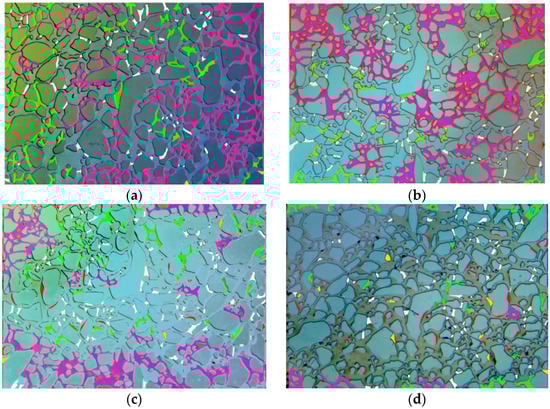
Figure 12.
Occurrence state of remaining oil after different soaking pressures: (a) 10 MPa; (b) 15 MPa; (c) 25 MPa; (d) 35 MPa.
With an increase of pressure, the solubility coefficient of CO2 in crude oil gradually increases and the liquid color becomes noticeably lighter. As shown in Figure 12b, at 15 MPa, the cluster residual oil forms account for about 80% of the total residual oil, with a small amount of porous and columnar residual oil, but almost no film and corner dispersed phase residual oil. The recovery degree of crude oil is improved compared with that of 10 MPa, but it is still less than 60%. The molecular diffusion dissolution of CO2 in crude oil is relatively slow and the effect of improving the recovery degree of crude oil is not obvious. As shown in Figure 12c, with the increase of the soaking pressure to 25 MPa, more CO2 will dissolve into the crude oil, the color of the crude oil will become lighter, the recovery degree of the crude oil will gradually increase and the oil phase will be divided. Due to the large volume of remaining oil in the sheet, though there is still more than half of the remaining oil in the sheet, the remaining oil in the cluster is mainly concentrated in the surrounding corners, and the evolution of the dispersed phase from the cluster to the porous one takes place. The degree of discontinuity will be intensified, which is characterized by a large quantity, small volume and strong dispersion. The CO2 swept area becomes larger, and the recovery degree of crude oil significantly increases compared with that of 10 MPa and 15 MPa.
CO2 contacts with the discontinuous residual oil, diffuses and dissolves into the crude oil, which could reduce the viscosity of crude oil and the viscosity between the oil and the rock wall. CO2 extracts light hydrocarbon components in crude oil to reduce oil–gas interfacial tension. In addition, the gas flow experiences shear and driving forces. A large number of discontinuous phase residual oil is displaced by gas, droplet residual oil is carried out by gas extraction wiredrawing, film residual oil is carried out by gas stretching and stripping and column residual oil is carried out by gas extrusion. The displacement effect is good. The remaining oil after huff and puff mainly stays in the reservoir in the forms of film, corner and column. As shown in Figure 12d, when the multiple miscible pressure reaches 35 MPa [26], the occurrence state of the remaining oil will also change. The porous remaining oil is as high as 40%, while the clustered remaining oil is only 20%. The drop-like remaining oil will change into the film-like remaining oil when it touches the matrix surface during the flow process. The corner, drop-like and film-like residual oil will gather into the column-like remaining oil at the small throat, and the film-like, column-like and corner-like discontinuous phase residual oil will increase significantly. CO2 and crude oil dissolve each other, eliminating the interfacial tension, extracting and vaporizing the light hydrocarbon components in the crude oil. This forms a mixed zone of CO2 and light hydrocarbons, which causes heavy component precipitation in the pores. The movement of the mixed zone greatly improves the recovery of crude oil up to 90%.
The enrichment law of residual oil under different well-soaking pressures is shown in Figure 13. With the increase of huff and puff pressure, the residual oil changes from the flaky to the discontinuous phase. The research shows that, when the huff and puff pressure is lower than the miscible pressure, the residual oil is mainly stored in the shale reservoir in clusters and pores, with less residual oil content in drops, films and columns. During the production process, the remaining oil in noncontinuous phases such as porous, membranous, columnar and angular is transformed into a cluster. When the huff and puff pressure is higher than the miscible pressure, the remaining oil saturation is less than 10%, and most of the remaining oil is stored in porous, columnar, membranous and other discontinuous phases. During the production, the remaining oil in the discontinuous phase flows and accumulates to the cluster-like remaining oil.
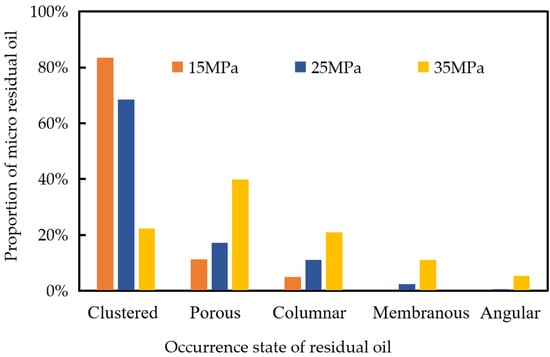
Figure 13.
Percentage of the micro remaining oil occurrence state under different pressures after huff and puff.
As shown in Figure 14, it is found that the increase in the soaking pressure leads to the gradual increase of the crude oil recovery. Under the miscible pressure, the soaking pressure is 15 MPa, which only increases the crude oil recovery by 4.94% compared with 10 MPa. When the soaking pressure increases by 10 MPa, the crude oil recovery increases by 12.41%. When the gas injection pressure is higher than the miscible pressure, the recovery of crude oil at 35 MPa is significantly increased by 23.74% compared with 25 MPa, and the recovery of crude oil is as high as 91.22%.
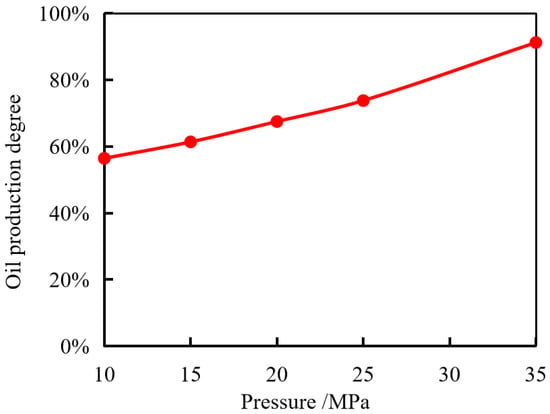
Figure 14.
Relationship between crude oil recovery degree and pressure.
3.3.2. Soaking Time
In this experiment, the soaking pressure was 20 MPa, which does not reach the miscible pressure. Thus, the influence of the miscible phase on the recovery degree of crude oil was not considered.
When the miscible pressure is lower than 20 MPa, a large amount of CO2 dissolves in the crude oil after the well is soaked for 15 min, and the color of the crude oil becomes lighter. The diffusion process of CO2 molecules is very slow, and the 15 min soak time fails to fully diffuse CO2 molecules into the oil phase. As shown in Figure 14, the recovery of crude oil only increases by 5.85% compared with 15 MPa and 30 min soaking time. A large amount of clustered and porous residual oil was retained, and a wide range of gas channels were formed through gas fingering and breakthrough. The swept area was small and the remaining oil saturation was high. The soak time was increased to 45 min, as shown in Figure 15. CO2 was fully diffused into the crude oil. Compared with the conditions of 15 MPa and 30 min, the recovery of crude oil increased by 14.61%. Compared with the conditions of 20 MPa and 15 min, the recovery degree of crude oil increased from 67.22% to 75.98%, with an increase of 8.75%. Therefore, the recovery is positively related with well-soaking time [18].
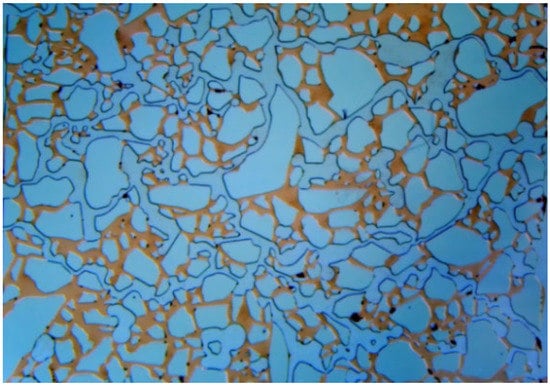
Figure 15.
Remaining oil occurrence at 20 MPa and 15 min.
By comparing the distribution of the remaining oil at different soaking times of 20 MPa, it was found in Figure 16 that, with the increase of soaking time, the remaining oil mainly exists in the shale reservoir in porous, columnar and cluster forms, and the remaining oil content of discontinuous phases such as film and drop is lower. With the increase of pressure, the cluster-like residual oil of the continuous phase has strong mobility, the oil phase is divided, the discontinuous phase increases and the flow of crude oil becomes more and more dispersed, as shown in Figure 17.
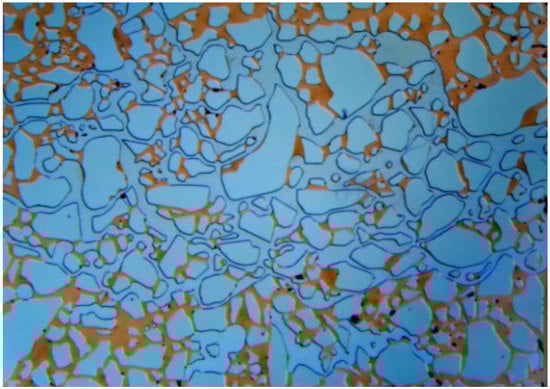
Figure 16.
Remaining oil occurrence at 20 MPa and 45 min.
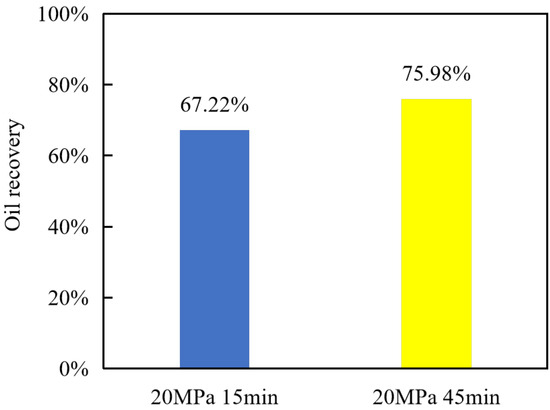
Figure 17.
Relationship between recovery degree and soaking.
3.4. Further Research Plan
For further research, a component test experiment about the contact of CO2 and crude oil is planned to be carried out to study the CO2 extraction component. Since the scale of this micro experiment was so small, the oil volume was not satisfactory for the component test. Therefore, core scale CO2 and crude oil contact experiments are necessary to verify the extraction effect of CO2 on the oil components. Further, the experimental results show that the distribution of the remaining oil in CO2 huff and puff is relatively concentrated. This was because it was easy for CO2 to form gas channeling during the recovery process. The subsequent effective plugging of gas channels can be combined with nano particles to further improve the utilization of CO2 for remaining oil [27].
4. Conclusions
In this paper, the mechanisms of the oil–gas flow of CO2 huff and puff in shale reservoirs were studied by microscopic visualization experiments and the effects of different CO2 huff and puff pressures and different well-soaking times on the degree of crude oil recovery were analyzed. The main conclusions are as follows:
- The mechanisms of CO2 huff and puff include CO2 diffusion dissolution, miscibility with crude oil, dissolved gas flooding, extraction, etc. Gas–liquid miscibility can improve the recovery of crude oil. The extraction effect of CO2 on crude oil is more obvious than that of solution expansion;
- The mobilization mechanisms of crude oil mainly comprise four aspects, and different movability mechanisms correspond to different occurrence of states of crude oil. (1) The residual oil adhered to the matrix transforms from film to drop due to shear force formed by the flow of CO2 on both sides. The oil peels off the surface of the matrix under the continuous action of the shear force; (2) For the crude oil existing in the corner with poor fluidity, CO2 is mostly funnel-shaped to extract the light components of crude oil; (3) At pores with good flow capacity, CO2 and crude oil are miscible after multiple contacts, which decreases the interfacial tension between oil and gas and increases the flow capacity of oil; (4) When the gas content is high, CO2 contacts with the formation fluid and surrounds the crude oil, causing the crude oil to expand;
- With the increase of pressure, the recovery degree of crude oil gradually increases. When the gas injection pressure is higher than the miscible pressure, the recovery degree of crude oil at 35 MPa is significantly higher than that at 25 MPa by 23.74%, and the recovery degree of crude oil is as high as 91.22%; With the increase of the soaking time, the recovery degree of crude oil increases. Under 20 MPa, CO2 can fully diffuse into the crude oil with 45 min of soaking time. Compared with 15 min of soaking time at the same pressure, the crude oil recovery increased from 67.22% to 75.98%, an increase of 8.75%;
- With increase of pressure, the oil phase is divided and the remaining oil, in the form of cluster flow, transforms into a discontinuous phase, in the form of porous flow. The flow of crude oil becomes increasingly dispersed and the degree of discontinuity is intensified;
- In this experiment, the minimum pore throat is 10 μm. The results do not cover all type of shale reservoirs because there are shale reservoirs that have pore throats at the nanometer scale. In order to have comprehensive understanding about the mechanism of CO2, an experiment accurate to the nanometer scale is needed.
Author Contributions
Z.L. designed the research; L.L. performed the research; Y.Z. collected the data; Y.L. (Yuqi Liu) and Y.L. (Yishan Liu) analyzed the data and wrote the paper; R.W. contributed to the paper revisions. All authors have read and agreed to the published version of the manuscript.
Funding
This work was supported by the Chinese National Natural Science Foundation (No. 51974356).
Institutional Review Board Statement
Not applicable.
Informed Consent Statement
Not applicable.
Data Availability Statement
The data used to support the findings of this study are intersection within the article.
Acknowledgments
The authors acknowledge support from Heilongjiang Province for the funding of the Jiebangguashuai project “Research on Gulong Shale Oil Phase Behavior, Seepage Mechanism and Integration of Geological Engineering to Increase Production“ and the help of Daqing Oilfield Academician Workstation.
Conflicts of Interest
The authors declare no conflict of interest.
References
- Alfarge, D.; Wei, M.; Bai, B. CO2 EOR mechanisms in huff and puff operations in shale oil reservoirs based on history matching results. Fuel 2018, 226, 112–120. [Google Scholar] [CrossRef]
- Huang, X.; Li, X.; Zhang, Y.; Li, T.; Zhang, R. Microscopic production characteristics of crude oil in nano-pores of shale oil reservoirs during CO2 huff and puff. Pet. Explor. Dev. 2022, 49, 557–564. [Google Scholar] [CrossRef]
- Yu, H.; Song, X.M.; Yang, S.Y.; Chen, D.F. Experimental and Numerical Simulation Study on Single Layer Injectivity for CO2 Flooding in Low Permeability Oil Reservoir. In Proceedings of the SPE Enhanced Oil Recovery Conference, Kuala Lumpur, Malaysia, 19–21 July 2011. [Google Scholar]
- Lei, L.; Sheng, J.J.; Xu, J. Gas Selection for huff and puff EOR in Shale Oil Reservoirs Based upon Experimental and Numerical Study. In Proceedings of the SPE Unconventional Resources Conference, Calgary, AB, Canada, 15–16 February 2017. [Google Scholar]
- Yuan, L.; Liu, S.; Zhang, J.; Zhang, Y.; Song, Y. Molecular Insight into the Extraction Behaviors of Confined Heavy Oil in the Nanopore by CO2/C3H8 in huff and puff Process. Energy Fuels 2022, 36, 3062–3075. [Google Scholar] [CrossRef]
- Li, L.; Su, Y.; Sheng, J.J.; Hao, Y.; Wang, W.; Lv, Y.; Zhao, Q.; Wang, H. Experimental and Numerical Study on CO2 Sweep Volume during CO2 huff and puff EOR Process in Shale Oil Reservoirs. Energy Fuels 2019, 33, 4017–4032. [Google Scholar] [CrossRef]
- Zhu, J.; Chen, J.; Wang, X.; Fan, L.; Nie, X. Experimental Investigation on the Characteristic Mobilization and Remaining Oil Distribution under CO2 Huff-n-Puff of Chang 7 Continental Shale Oil. Energies 2021, 14, 2782. [Google Scholar] [CrossRef]
- Tang, M.; Zhao, H.; Ma, H.; Lu, S.; Chen, Y. Study on CO2 huff and puff of horizontal wells in continental tight oil reservoirs. Fuel 2017, 188, 140–154. [Google Scholar] [CrossRef]
- Song, Z.; Song, Y.; Li, Y.; Bai, B.; Hou, J.; Song, K.; Jiang, A.; Su, S. A Critical Review of CO2 Enhanced Oil Recovery in Tight Oil Reservoirs of North America and China. In Proceedings of the SPE/IATMI Asia Pacific Oil & Gas Conference and Exhibition, Bali, Indonesia, 29–31 October 2019. [Google Scholar]
- Enab, K.; Emami-Meybodi, H. Effects of Diffusion, Adsorption, and Hysteresis on huff and puff Performance in Ultratight Reservoirs with Different Fluid Types and Injection Gases. Energies 2021, 14, 7379. [Google Scholar] [CrossRef]
- Alfarge, D.; Wei, M.; Bai, B. Factors Affecting CO2-EOR in Shale-Oil Reservoirs: Numerical Simulation Study and Pilot Tests. Energy Fuels 2017, 31, 8462–8480. [Google Scholar] [CrossRef]
- Wang, Q.; Jiang, H.; Han, J.; Wang, D.; Li, J. Adaptive Prediction of Enhanced Oil Recovery by N2 huff-n-puff in Fractured-Cavity Reservoir Using an FNN-FDS Hybrid Model. Appl. Sci. 2021, 11, 8871. [Google Scholar] [CrossRef]
- Su, X.; Yue, X.A.; Moghanloo, R.G. Interplay between Rock Permeability and the Performance of huff and puff CO2 Injection. ACS Omega 2020, 5, 16575–16583. [Google Scholar] [CrossRef]
- Ghasemi, M.; Astutik, W.; Alavian, S.A.; Whitson, C.H.; Sigalas, L.; Olsen, D.; Suicmez, V.S. Determining Diffusion Coefficients for Carbon Dioxide Injection in Oil-Saturated Chalk by Use of a Constant-Volume-Diffusion Method. SPE J. 2017, 22, 505–520. [Google Scholar] [CrossRef]
- Alfarge, D.; Wei, M.; Bai, B.; Almansour, A. Effect of Molecular-Diffusion Mechanism on CO2 huff and puff Process in Shale-Oil Reservoirs. In Proceedings of the SPE Kingdom of Saudi Arabia Technical Symposium & Exhibition, Dammam, Saudi Arabia, 24–27 April 2017. [Google Scholar]
- Sanaei, A.; Abouie, A.; Tagavifar, M.; Sepehrnoori, K. Comprehensive Study of Gas Cycling in the Bakken Shale. In Proceedings of the 2018 Unconventional Resources Technology Conference, Houston, TX, USA, 23–25 July 2018. [Google Scholar]
- Ding, M.; Wang, Y.; Wang, Y.; Gao, M.; Liu, D.; Chen, W. Experimental investigation of bypassed-oil recovery via CO2 soaking and huff and puff injection: Effects of miscibility and bypassed-oil size. Fuel 2019, 248, 152–160. [Google Scholar] [CrossRef]
- Cheng, C.; Ming, G. Investigation of cyclic CO2 huff-and-puff recovery in shale oil reservoirs using reservoir simulation and sensitivity analysis. Fuel 2017, 188, 102–111. [Google Scholar] [CrossRef]
- Meng, X.; Sheng, J.J. Experimental Study on Revaporization Mechanism of huff and puff Gas Injection to Enhance Condensate Recovery in Shale Gas Condensate Reservoirs. In Proceedings of the SPE Improved Oil Recovery Conference, Tulsa, OK, USA, 11–13 April 2016. [Google Scholar]
- Hemmati-Sarapardeh, A.; Ayatollahi, S.; Ghazanfari, M.H.; Masihi, M. Experimental Determination of Interfacial Tension and Miscibility of the CO2–Crude Oil System; Temperature, Pressure, and Composition Effects. J. Chem. Eng. Data 2014, 59, 946–955. [Google Scholar] [CrossRef]
- Qian, K.; Yang, S.; Dou, H.; Wang, Q.; Wang, L.; Huang, Y. Experimental Investigation on Microscopic Residual Oil Distribution During CO2 Huff-and-Puff Process in Tight Oil Reservoirs. Energies 2018, 11, 2843. [Google Scholar] [CrossRef]
- Orabi, F.; Firouz, A.Q.; Kavousi, A.; Asghari, K. Comparative evaluation of immiscible, near miscible and miscible CO2 huff and puff to enhance oil recovery from a single matrix-fracture system (experimental and simulation studies). Fuel 2012, 93, 443–453. [Google Scholar]
- Wang, H.; Tian, L.; Chai, X.; Wang, J.; Zhang, K. Effect of pore structure on recovery of CO2 miscible flooding efficiency in low permeability reservoirs. J. Pet. Sci. Eng. 2021, 208, 109305. [Google Scholar] [CrossRef]
- Abedini, A.; Mosavat, N.; Torabi, F. Determination of Minimum Miscibility Pressure of Crude Oil–CO2 System by Oil Swelling/Extraction Test. Energy Technol. 2014, 2, 431–439. [Google Scholar] [CrossRef]
- Zacharoudiou, I.; Boek, E.S. Capillary filling and Haines jump dynamics using free energy Lattice Boltzmann simulations. Adv. Water Resour. 2016, 92, 43–56. [Google Scholar] [CrossRef]
- Hou, G.; Ma, X.; Zhao, W.; Diwu, P.; Liu, T.; Hou, J. Synergistic Modes and Enhanced Oil Recovery Mechanism of CO2 Synergistic Huff and Puff. Energies 2021, 14, 3454. [Google Scholar] [CrossRef]
- Kong, X.; Wang, H.; Yu, W.; Wang, P.; Miao, J.; Fiallos-Torres, M. Compositional Simulation of Geological and Engineering Controls on Gas Huff-n-Puff in Duvernay Shale Volatile Oil Reservoirs, Canada. Energies 2021, 14, 2070. [Google Scholar] [CrossRef]
Publisher’s Note: MDPI stays neutral with regard to jurisdictional claims in published maps and institutional affiliations. |
© 2022 by the authors. Licensee MDPI, Basel, Switzerland. This article is an open access article distributed under the terms and conditions of the Creative Commons Attribution (CC BY) license (https://creativecommons.org/licenses/by/4.0/).