Article

Effect of Residual Water in Sediments on the CO2-CH4 Replacement Process

1
Guangzhou Institute of Energy Conversion, Chinese Academy of Sciences, Guangzhou 510640, China
2
State Key Laboratory of Natural Gas Hydrate, Beijing 100028, China
3
Guangdong Provincial Key Laboratory of New and Renewable Energy Research and Development, Guangzhou 510640, China
4
University of Chinese Academy of Sciences, Beijing 100049, China
5
School of Energy Science and Technology, University of Science and Technology of China, Guangzhou 510640, China
*
Authors to whom correspondence should be addressed.
Energies 2023, 16(7), 3154; https://doi.org/10.3390/en16073154
Submission received: 23 February 2023 / Revised: 28 March 2023 / Accepted: 28 March 2023 / Published: 31 March 2023

Abstract

:
CO2 replacement is a promising method of gas hydrate recovery. However, the influence of residual water in the replacement process and selections of a suitable mining area remain uncertain. To better understand this method, we examined the influence of the particle size and initial hydrate saturation on the replacement process while using the same amount of residual free water. The results showed that during the replacement process, two stages of rapid reaction and slow reaction occurred, which were manifested by the speed of pressure change in the reactor. The CO2 sequestration ratio decreased with the increase in sediment particle size and increased with the increase in initial hydrate saturation. During the replacement process, two reactions occurred: CH4 was replaced by CO2 and CO2 hydrate was formed, and the replacement amount and recovery efficiency of CH4 increased with a decrease in sediment particle size. When the sediment particle size was less than 166 μm, the CH4 recovery efficiency was significantly affected by the particle size. The replacement amount of CH4 increased with the increase in initial hydrate saturation, and the recovery efficiency decreased. This study provides a basis for selecting suitable hydrate-accumulation areas for on-site mining.

Graphical Abstract

1. Introduction

Natural gas hydrate is a crystalline compound similar to ice that is formed by small molecular gas and water molecules in high-pressure and low-temperature environments [1,2]. Since natural gas hydrate is found to have a huge reservoir in seabed and permafrost regions and the major component of natural gas hydrate is methane (CH4), it is considered as an unconventional energy source and has received growing attention worldwide [3,4]. The common hydrate mining methods include depressurization, thermal stimulation, and chemical injection. All these methods recover natural gas by promoting hydrate dissociation [5,6]. In recent years, a new method for natural gas hydrate recovery has attracted the attention of researchers as a CO2-CH4 replacement. This method can replace the methane molecules in natural gas hydrates and capture CO2 molecules in the seabed or permafrost in the form of hydrates, ultimately achieving a “win-win” situation for economic development and environmental protection [7].
Feasibility of the CO2-CH4 replacement method has been proved and the behaviors of CO2-CH4 replacement are now being intensively investigated. Ota et al. [8] studied the effects of temperatures from 272.15–275.15 K and found that under certain pressures, the replacement efficiency and rate increase with an increase in temperature. The replacement rate was relatively high in the initial 12 h, but reduced gradually after that. Li et al. [9] measured the gas composition in the CO2-CH4 replacement and noted that the amount of CH4 replaced and the consumption of CO2 had basically the same trend. Zhou et al. [10] studied CO2-CH4 replacement at a temperature of 274.15 K and a pressure range of 3.97–6.26 MPa. The results showed that the replacement rate and the amount of CH4 replaced increased with an increase in the replacement pressure; however, when the pressure was close to the liquefaction pressure at the experimental temperature, the amount of CH4 replaced decreased instead. Zhou et al. [11] used liquid CO2 emulsions to enhance the efficiency of CO2-CH4 replacement and found that the amount of the replaced CH4 was about 1.5 times higher than liquid CO2. Lee et al. [12] studied the effect of the particle size of sediment on the replacement rate and noted that the CO2-CH4 replacements performed in small particles (75–90 μm) was 1.4 times higher than those in large particles (125–150 μm). A simulation study conducted by Bai et al. [13] revealed that the CO2-CH4 replacement would get promoted with an increase in CO2 concentration. The formation of CO2 hydrates was assumed to eliminate the mass transfer barrier of the amorphous CO2 hydrate layer on CH4 hydrate and improve the replacement efficiency. The effect of hydrate saturation on CO2-CH4 replacement were studied by Zhou et al. [14], and they noted the replacement efficiency would decrease with an increase in hydrate saturation. Wang et al. [15] found that the smaller the sediment particle size, the greater the replacement efficiency; however, the effect of the sediment particle size on the replacement efficiency was not obvious. As CH4 hydrate is stored in complex marine sediments, it is affected by many factors in the actual replacement mining process, including initial hydrate saturation [16], temperature [17,18] pressure [8,19,20], salinity [21], the CO2-injected state [11], particle size [22], and sediment type [23].
However, the CH4-CO2 replacement in hydrate-bearing sediments is still complicated to predict. In 2012, ConocoPhillips and the U.S. Department of Energy [20] carried out a field test of CH4-CO2 replacement in hydrate reservoir located in the Alaska area of the United States. A total volume of 6114 m3 of gas containing 22.5% CO2 and 77.5 N2 was injected into the reservoir where the pressure and temperature were controlled at around 9.8 MPa and 278 K, respectively. After 48 days, 1421 m3 N2 and 826 m3 CO2 remained in the reservoir, while a total of 24,410 m3 CH4 was recovered. Although the investigation of the sequestrated gas indicated a preferential retention of CO2 in the hydrate-bearing sediment, it was not clear if the sequestrated CO2 was participated in the CH4-CO2 replacement. This could also be attributed to the adsorption of porous media or the formation of CO2 hydrate from residual water in the sediment.
Generally, there are at least four phases in methane hydrate-bearing sediments: hydrate, gas, water, and grain. Free water not involved in hydrate formation is residual water, which exists together with methane hydrate in the sediment matrix, and this residual water plays an important role in the process of CO2 injection into CH4 hydrate-bearing sediments [24]. It has been documented that when CO2 is injected, CO2 first interacts with residual water at the gas-liquid interface to form a CO2 hydrate film instead of participating in the reaction. The affinity of CO2 to form a CO2 hydrate film at the gas-liquid interface reduces the availability and selectivity of CO2 to reach the surface of the CH4 hydrate-bearing sediment [25], resulting in the reduction in CO2 infiltrating into the CH4 hydrate-bearing sediment and affecting the replacement effect [26]. In addition, there is still controversy regarding the displacement mechanism, especially regarding the microscopic mechanism. Furthermore, whether CH4 hydrate dissociation occurs before the formation of CO2 hydrate, or if CO2 molecules directly replace the trapped CH4 in the hydrate cages remains unclear.
To elucidate the influence of residual pore water in hydrate bearing sediment, CH4-CO2 replacements were carried out in synthesized hydrate-bearing sediments in 277.15 K, 3 MPa. The CO2 captured by the hydrate bearing sediments and the CH4 recovered were calculated by sampling the gas composition during CH4-CO2 replacements. The effect of initial hydrate saturation and particle size on replacement efficiencies were analyzed. The results revealed the advantages of residual water for CO2 sequestration and the side effects on CH4 recovery efficiency, which would provide a possible path to describing the CO2 behavior in CH4 hydrate reservoir and lay a theoretical basis for selecting suitable hydrate–bearing sediments.

2. Materials and Methods

2.1. Experimental Apparatus

A schematic of the experimental apparatus is shown in Figure 1. The main part of this apparatus is composed of a high-pressure reactor with an effective volume of 492 mL, an effective height of 150 mm, an inner diameter of 65 mm. The reactor is equipped with a buffer tank with an effective volume of 1117 mL. Their design pressures were 15 MPa and 20 MPa, respectively. Devices for measuring temperature and pressure were arranged in both the reaction kettle and the buffer tank. The thermometer was made of Pt100 platinum with an accuracy of ±0.1 K. The pressure transducer had a range of 0–20 MPa and an accuracy of 0.1% F.S. The constant-temperature water bath has an adjustment range of 270.15–303.15 K. The data were collected every 10 s using an Aigent34970 acquisition instrument. To simulate the environment of natural gas hydrate reservoirs, a cylindrical mold was used, and the wet sand was put into the mold for multiple beating and compaction times, and then placed in the refrigerator for 6 h to form a cylindrical sand column with a diameter of 50 mm, height of 65 mm, and effective volume of 127.6 cm3.

2.2. Experimental Materials

Methane and carbon dioxide with a mole fraction of 0.999 were supplied by the Foshan Huate Gas Industry Corporation, and the experimental distilled water was made in the laboratory with a resistance of 18 MΩ/m. Reservoir sediments were composed of four different median particle sizes of natural river sand, the properties of which are shown in Table 1.
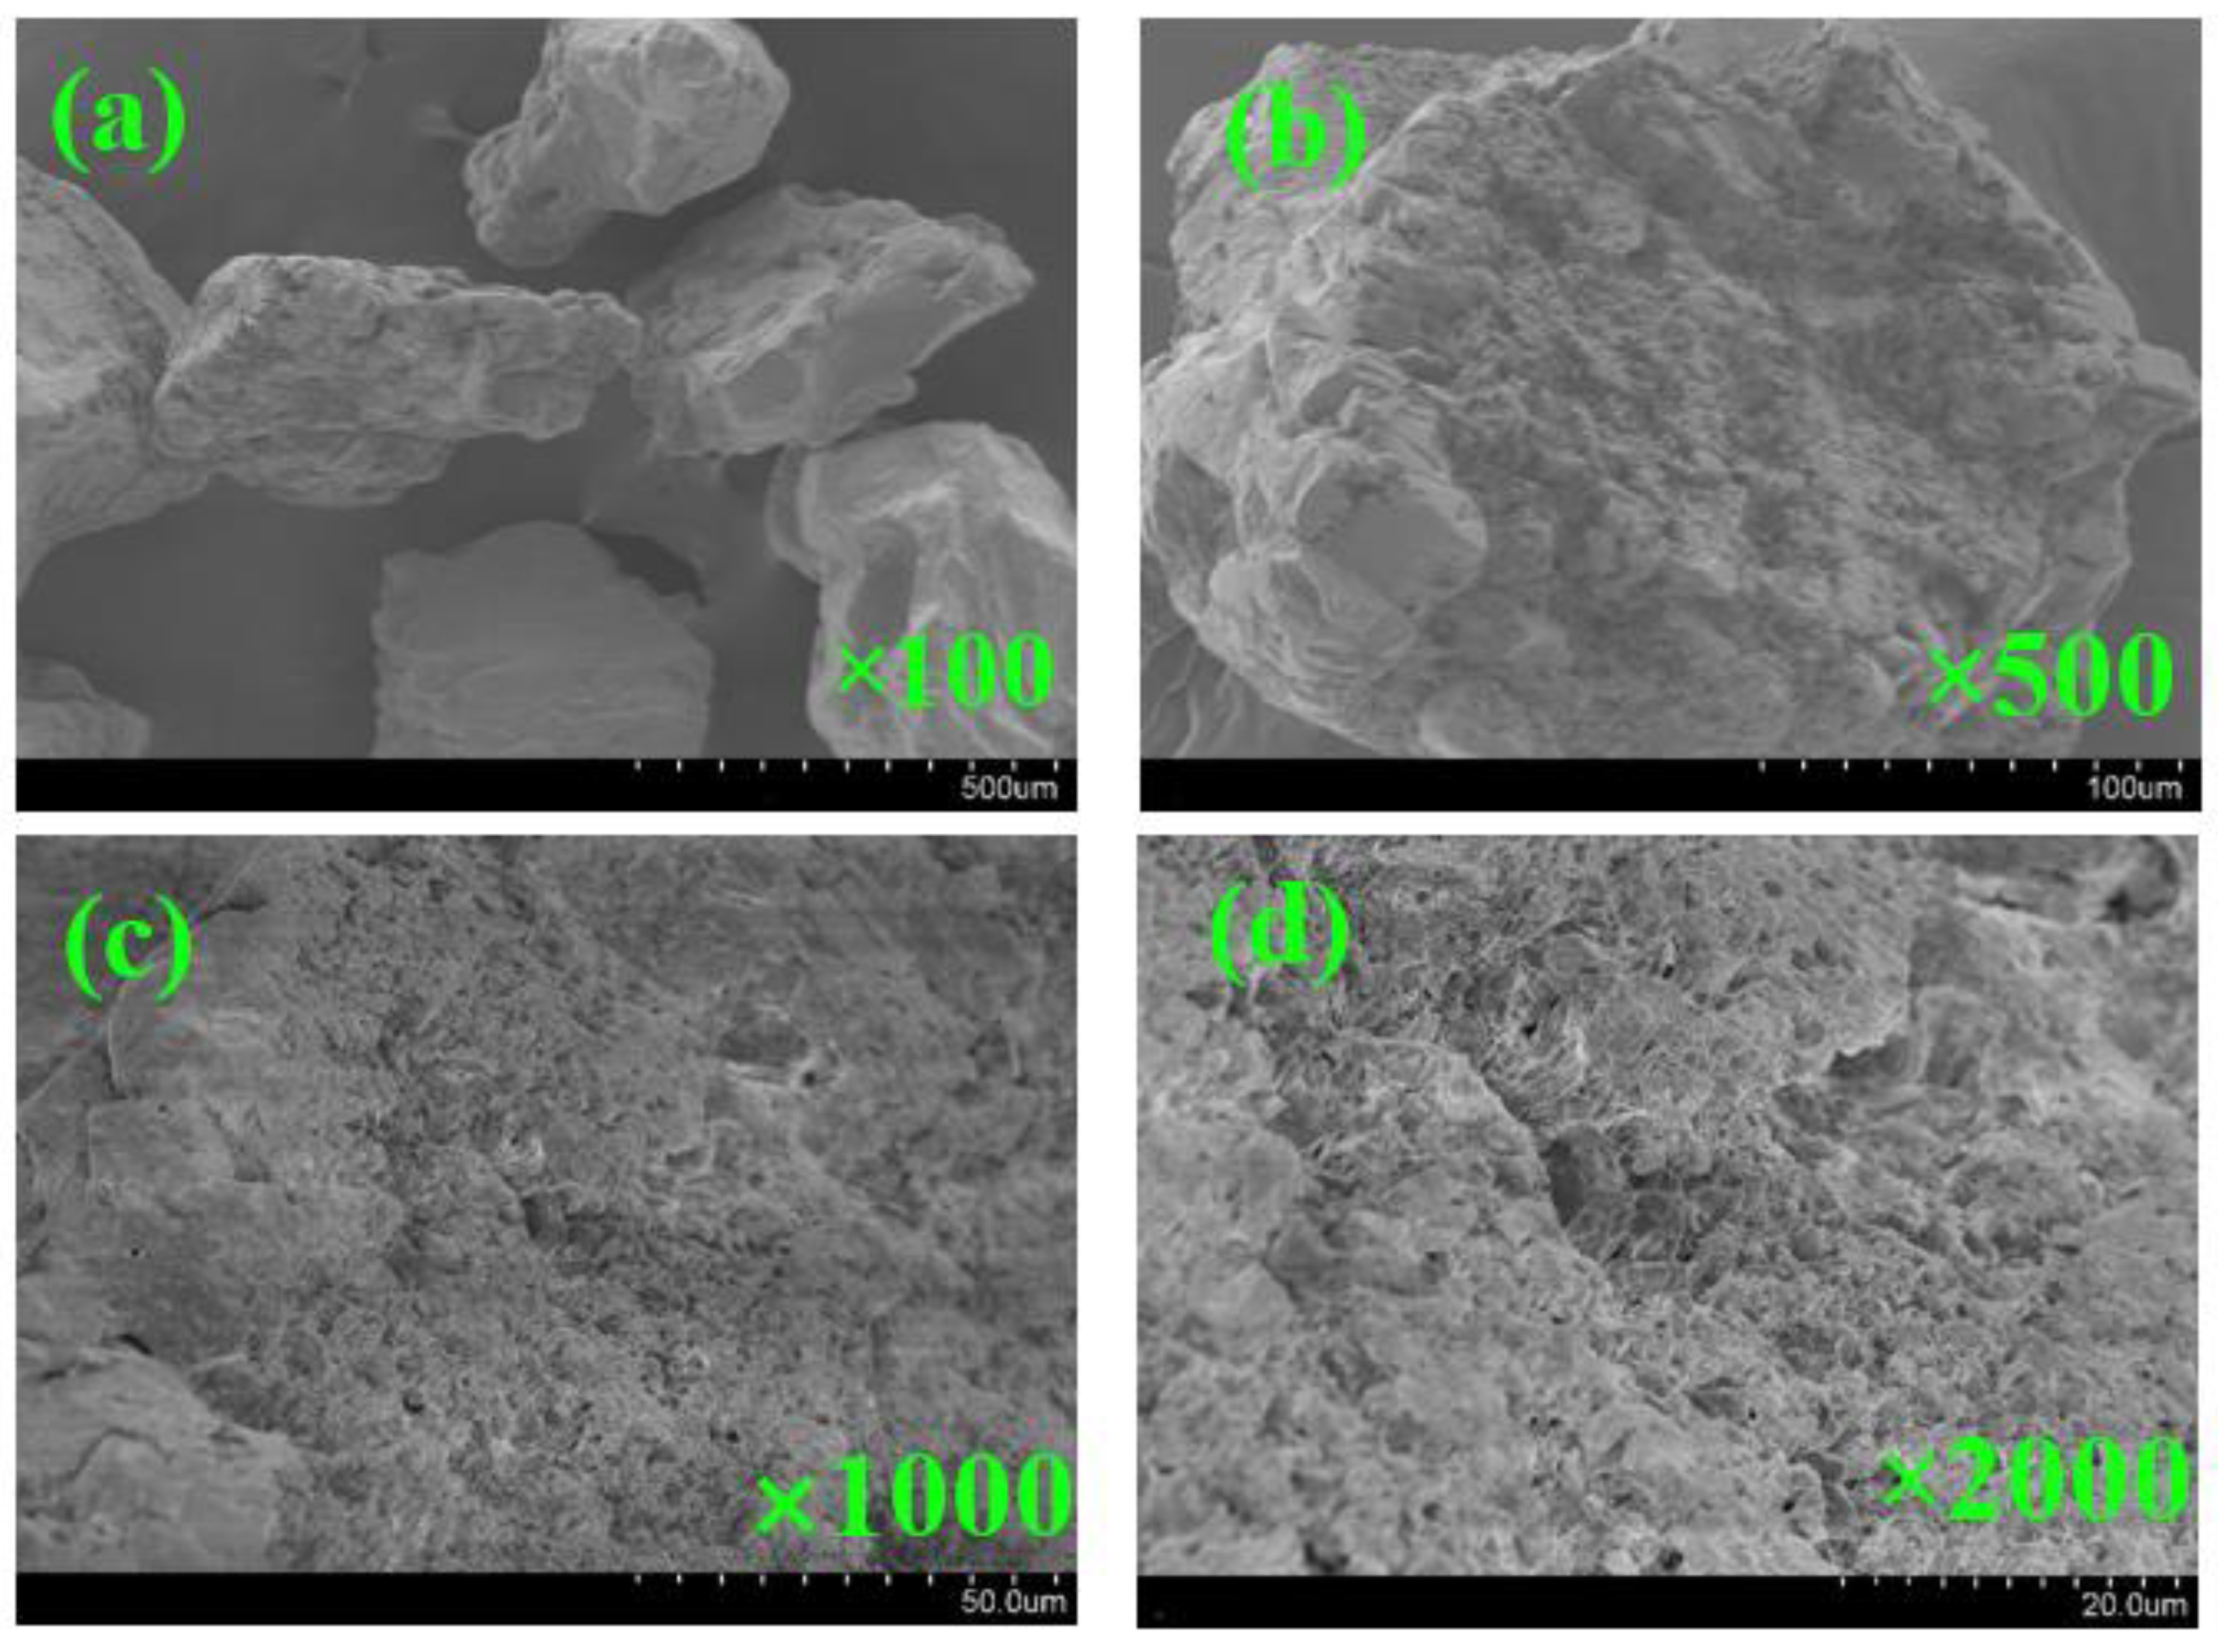
Figure 2 shows scanning electron microscopy (SEM) images of natural sand at different magnifications. There are many voids and textures on the surface of the sand, which provide good reaction sites for the formation of hydrates [27].

2.3. Experimental Procedures

The experimental process consisted of two steps: the preparation of methane-containing hydrate sediment materials and the replacement reaction of CO2-CH4.

2.3.1. Preparation of Methane Hydrate in Porous Media

Before the experiment, 150 g of dried natural sand was mixed with 8.13, 12.12, 16.04, or 20.05 g of distilled water to prepare 20, 30, 40, or 50% of the initial water saturation of the wet sand. Then, the wet sand was placed into a mold, beat, and compacted. The mold was placed into a refrigerator to form a cylindrical sand column at 263.15 K for 6 h. After that, the frozen sand column was placed into the reactor. The reactor was set to a temperature of 277.15 K using the water bath. Finally, valve 11 was opened, and CH4 was slowly fed into the reactor to form CH4 hydrate. The reaction was stopped when the weight of residual water in the sediment was approximately 6.2 g (the calculation process is described in Section 2.4.). Table 2 and Table 3 show the hydrate formation conditions for eight groups of experiments.
We selected sand with a median particle size of 101,166,279,377 μm and an initial water saturation of 30% to prepare sediments containing methane hydrate and to explore the effect of sediment size on replacement.
Similarly, we selected sand with initial water saturations of 20, 30, 40, and 50% and a median particle size of 377 μm to prepare methane hydrate-containing sediments and study the effect of the initial hydrate saturation on displacement.

2.3.2. Replacement Reaction Process

The replacement reaction process was divided into three steps:
  • Gaseous CO2 injection. The remaining CH4 in the reactor was quickly discharged, valve 11 was opened, and the reactor was purged with CO2 for 15 s to ensure that the CH4 gas in the reactor was completely discharged to the emptying pressure, and then valve 12 was closed. Subsequently, gaseous CO2 was injected for one minute. When the pressure was stable at 3 MPa, valve 11 was closed. This moment was recorded as time zero of the replacement reaction.
  • Gas sample analysis. Gas samples were collected at time zero, and a gas chromatograph (GC9790, USA) was used to measure the gas sample components and content, record it as the content before the reaction, and then collect gas samples and measurements at time intervals. The volume of the single gas sample did not exceed 20 mL. The effects on temperature and pressure were negligible.
  • Replacement reaction process. The replacement temperature was 277.15 K, the replacement pressure was 3 MPa, the replacement time was set to 4 days for each set of experiments, the temperature fluctuation during the reaction process did not exceed 0.1 K, and the pressure drop at the end of the reaction did not exceed 0.1 MPa.

2.4. Calculations

2.4.1. Calculation of Methane Hydrate Saturation

During the experiment, the skeleton structure of the sediment was almost incompressible; therefore, it can be assumed that the initial porosity in the natural sand remained unchanged, CH4 gas was basically insoluble in water, and methane hydrate was formed uniformly in the sediment. Therefore, we believe that all the methane consumed is used to form CH4 hydrates, and the molar ratio of methane hydrate in the sediment can be calculated by Equation (1) [28]:
n = V g P 0 Z 0 R 0 T 0 V g P 1 Z 1 R 1 T 1 ,
where △n is the CH4 gas consumption during the formation process (mol), R is the gas constant, 8.134 J·mol−1·K, Z0 and Z1 are the compressibility factors of CH4 gas under the corresponding temperature and pressure conditions, P0 and P1 are the initial and final pressures (MPa), T0, and T1 are the initial and final reactor temperatures (K), and Vg is the volume of the gas phase in the cell, which can be determined by the volume of the sediment layer, the volume of the sediment void, and the volume of the reactor. The volume expansion caused by the phase transitions is negligible. Therefore, it can be expressed by Equation (2):
V g = V t V s V w + V k ,
where Vt is the effective volume of the reactor (mL), Vs is the volume of sand added to the reactor (mL), Vw is the volume occupied by the residual water (mL), and Vk is the deposition void volume (mL), which can be expressed by Equation (3):
V k = V s · φ ,
where φ is the initial porosity of natural sand with the corresponding particle size (%). The saturation of methane hydrate can be described by Equation (4):
S h = N H D n · M w ρ H · V k ,
where NH is the hydration number of methane. In this study, we chose 6.0 as the hydration number of methane. Mw is the molar mass of water (g/mol), and ρH is the density of methane hydrate, 0.925 g/cm3.

2.4.2. Recovery Efficiency of CH4

The recovery efficiency(η) of CH4 is calculated using Equation (5):
η = ( n C H n C H , 0 ) / n ,
where nCH is the number of moles of methane in the gas phase in the reactor (mol), nCH,0 is the number of moles of methane in the gas phase of the reactor at zero time (mol), and nCH is determined by Equation (6):
n C H = x C H Z C H P V g / ( R T ) ,
where xCH is the mole fraction of methane in the gas phase in the reactor, which is determined after analyzing the gas sample by gas chromatography; P and T represent the temperature and pressure inside the reactor one second before the gas takes, respectively. ZCH is the compression factor of CH4. It can be calculated using the P-R equation.

2.4.3. Weight of Residual Water in the Sediment

The weight of residual water (wr) in the sediment can be calculated using Equation (7):
w r = w 0 ( 1 C w ) ,
where w0 is the weight of the water added to the sediment (g) and Cw is the water conversion ratio, which can be described by Equation (8):
C w = N H · n · M w w 0 .

2.4.4. CO2 Storage Efficiency

The moles of carbon dioxide in the gas phase of the reactor can be calculated using Equation (9):
n C O = x C O Z C O P V g / ( R T ) ,
where xCO is the mole fraction of carbon dioxide in the gas phase in the reactor, which is determined after analyzing the gas sample by gas chromatography; P and T represent the temperature and pressure inside the reactor one second before the gas takes, respectively. ZCO is the compression factor of CO2. It can be calculated using the P-R equation.
The moles of carbon dioxide sequestered in sediments can be expressed by Equation (10):
n C O = n C O , 0 n C O ,
where nCO,0 is the number of moles of carbon dioxide gas in the reactor at time zero.
The CO2 storage efficiency(ε) is defined as the ratio of the moles of CO2 consumed to the total moles of CO2 injected, which can be calculated using Equation (11):
ε = n C O / n C O .

3. Results and Discussion

3.1. Variation in Pressure during the Replacement Process

The variation in pressure inside the reactor for different particle sizes with time during the replacement reaction is shown in Figure 3.
In the initial stage (the first 10 h), the pressure in the reactor drops rapidly in Experiments 2–4 because the rate of CO2 hydrate formation between the injected CO2 and the residual water in the sediment is much greater than the rate of replacement of CH4; that is, the consumption of CO2 is greater than the generation of CH4, resulting in a decrease in the total pressure in the reactor. On the contrary, it also shows that in the replacement reaction, the priority of the formation of CO2 hydrate in Experiments 2–4 is higher than that of CO2 replacement of CH4 hydrate [29].
The variation in pressure in Experiment 1 is opposite to that of Experiments 2–4. In the initial stage, the pressure in the reactor in Experiment 1 increased rapidly. This was because the amount of CH4 gas replaced during the reaction in the first 10 h is greater than the sum of the CO2 gas consumed in the replacement reaction and the CO2 gas consumed in the generation of CO2 hydrate with water, so the total pressure in the reactor tends to rise. The reason is that the specific surface area of the porous medium is larger when the particle size is smaller, and the area of the CO2 replacement reaction surface is larger, which means the effective area of the replacement reaction is larger, so the amount of CH4 replaced will be more. The particle sizes used in Experiment 1 was the smallest among the four experiments, which has the largest effective area of the replacement reaction [30]. When CO2 is injected, the replacement reaction occurs rapidly, and the reaction speed is faster than that of CO2 hydrate formation, which eventually leads to a pressure increase in the initial stage of the reaction.
In the later stage, the pressure of Experiments 1–4 showed a slow pressure drop, which can be explained as follows. First, during the replacement process, both the CO2-CH4 replacement reaction on the sediment surface, and the reaction of the residual water with CO2 to form CO2 hydrate, occurred at the same time [31]. Both reactions form a dense CO2 hydrate film on the sediment surface [24]. As the thickness of the CO2 hydrate layer gradually increased, the reaction became more difficult because of the increased diffusion barrier of CO2 molecules into the CH4 hydrate in the sediment and CH4 molecules passing through the CO2 hydrate layer. Second, as the replacement process proceeds, the fugacity difference between CO2 and CH4 in the gas and hydrate phases decreases [20], which means that the driving force of the replacement reaction decreases; thus, the reaction becomes slower. Thus, the diffusivity of gas molecules in the sediment plays a crucial role in the displacement reaction.
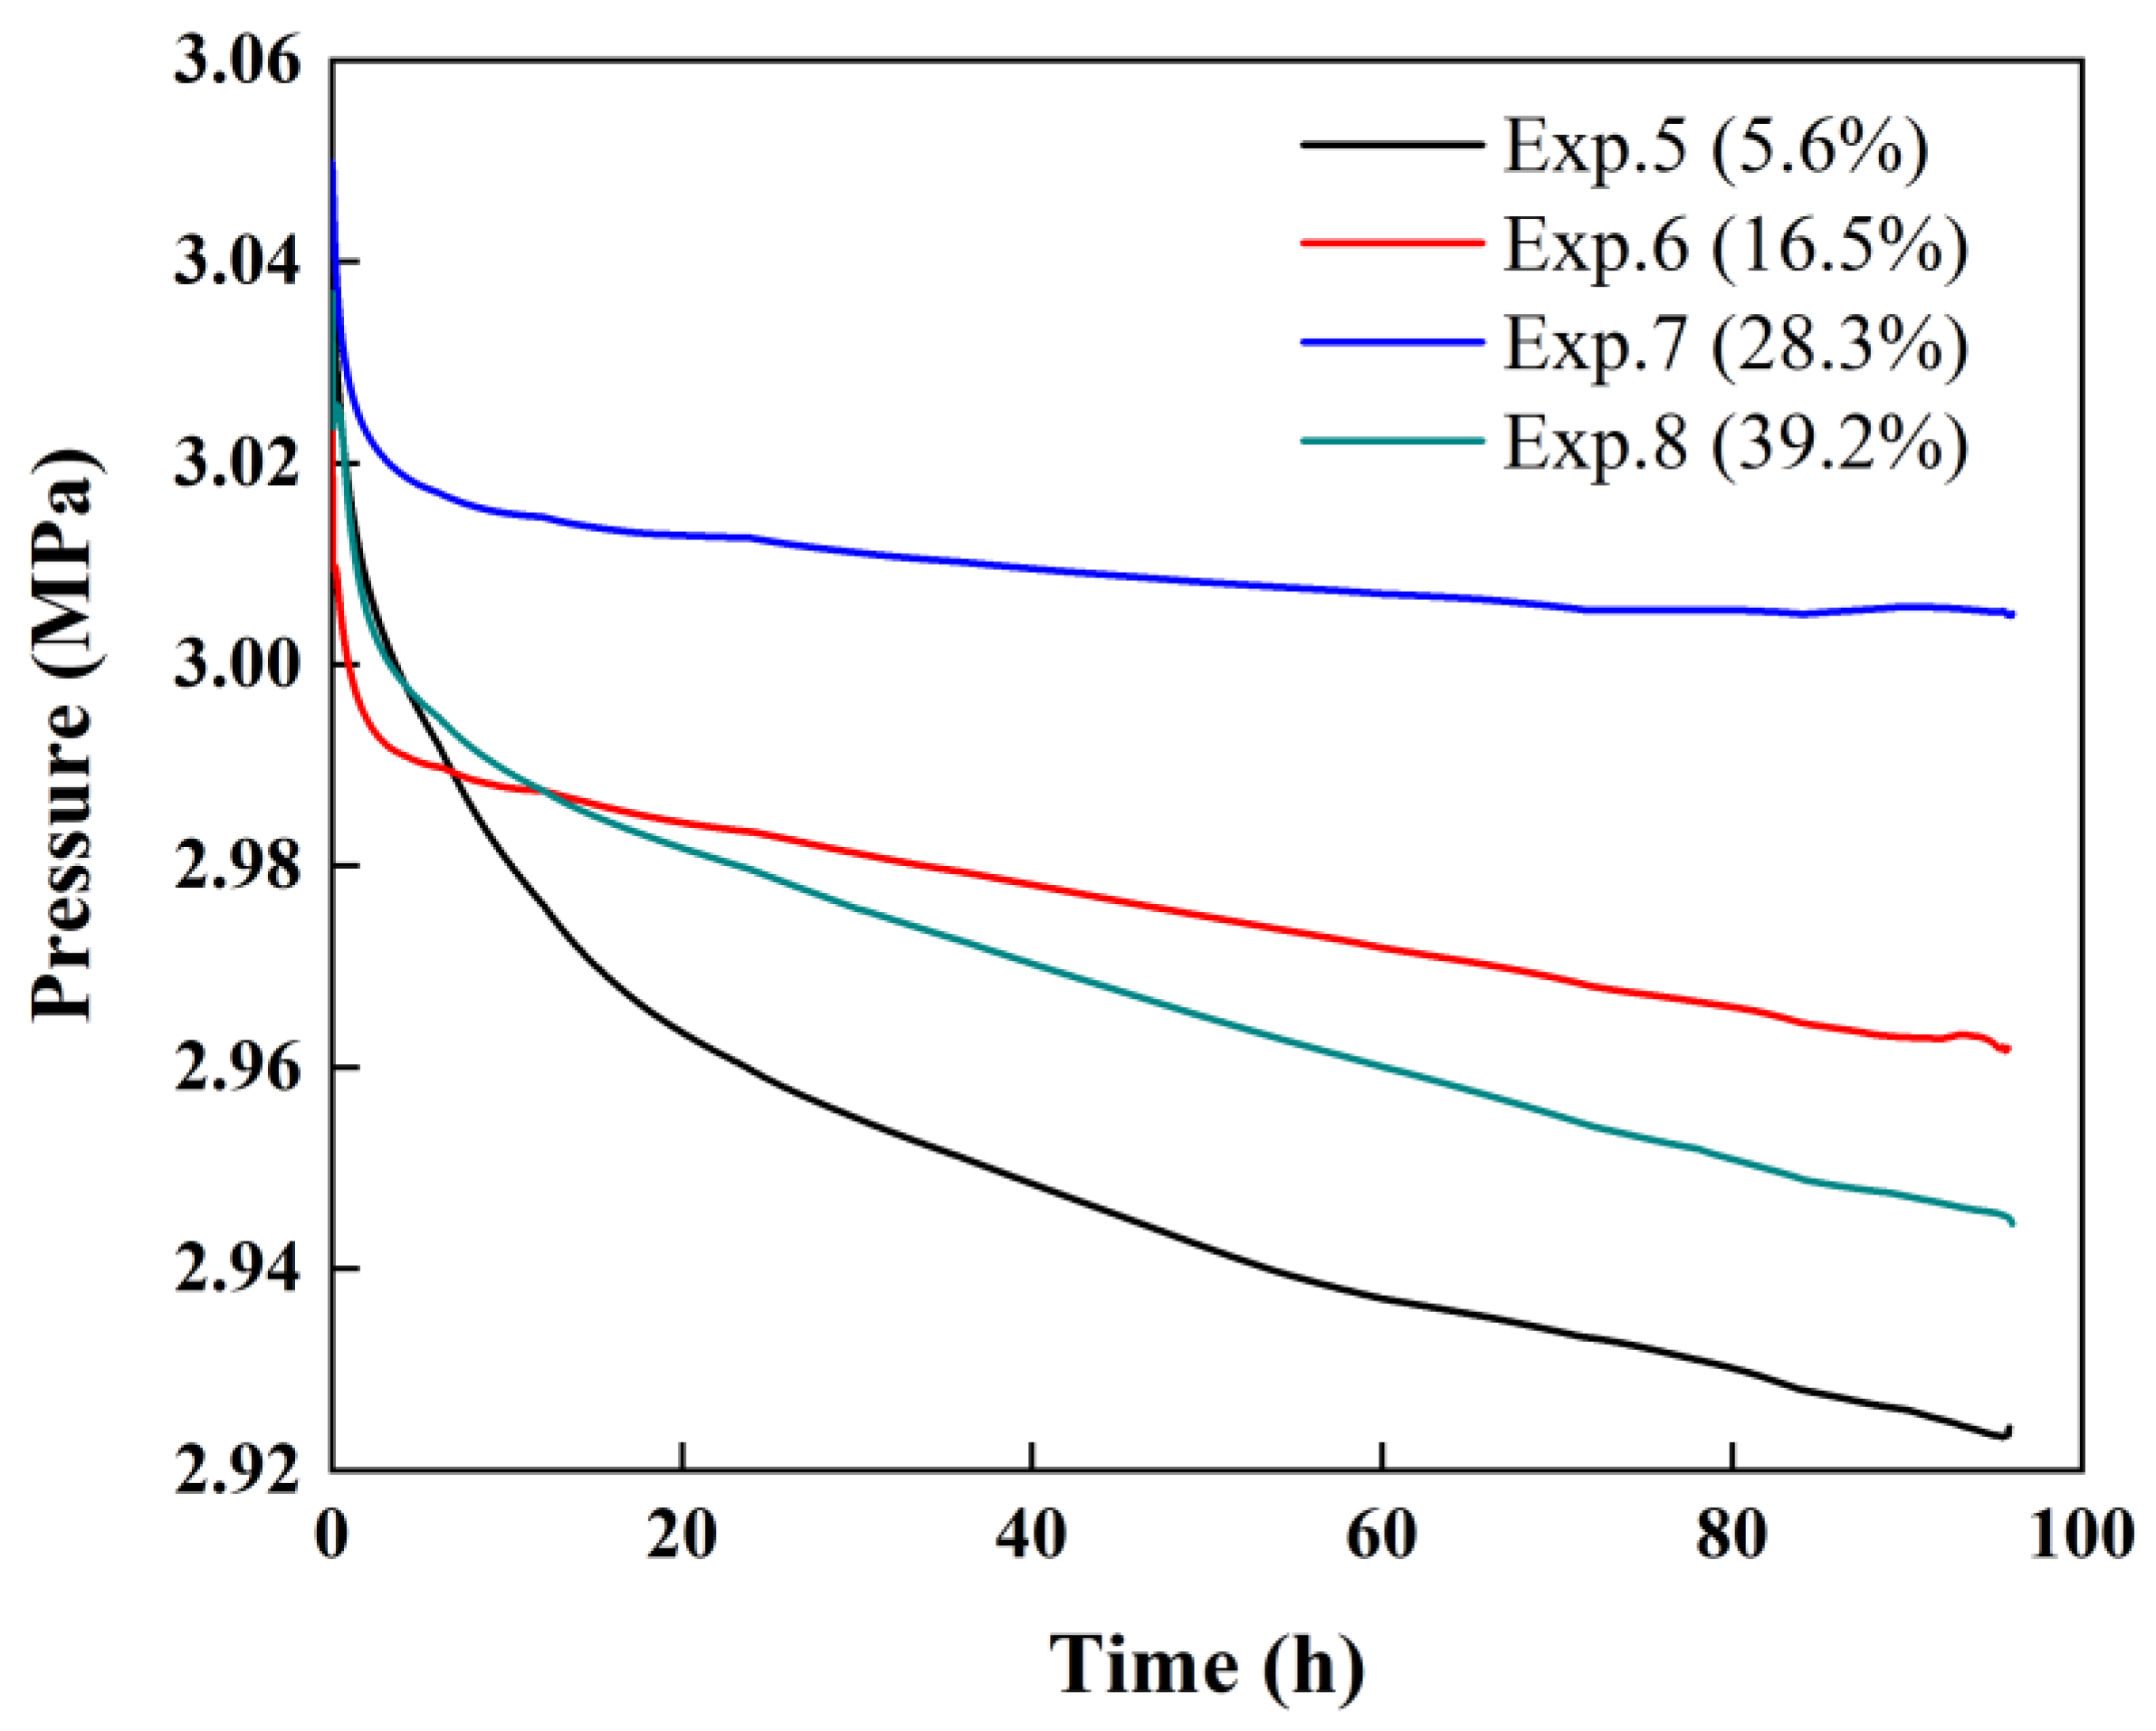
The pressure curves in the reactor over time at different initial hydrate saturations are shown in Figure 4.
Figure 4 shows that the pressure changes during the displacement process in Experiments 5–8 dropped sharply in the initial stage of the reaction and decreased slowly in the later stage. It also shows that the replacement reaction mainly occurred on the surface of the sediment. The CO2 hydrate layer formed in the initial stage was thinner and the reaction speed was faster, resulting in a large pressure drop. However, as the reaction progressed, the CO2 hydrate film formed around the sediment surrounded the entire sediment surface, and its thickness continued to increase, which eventually led to an increase in the channel resistance for CO2 molecules to enter the sediment to participate in the reaction; thus, the pressure curve in the later period did not decrease significantly.

3.2. CO2 Storage Efficiency

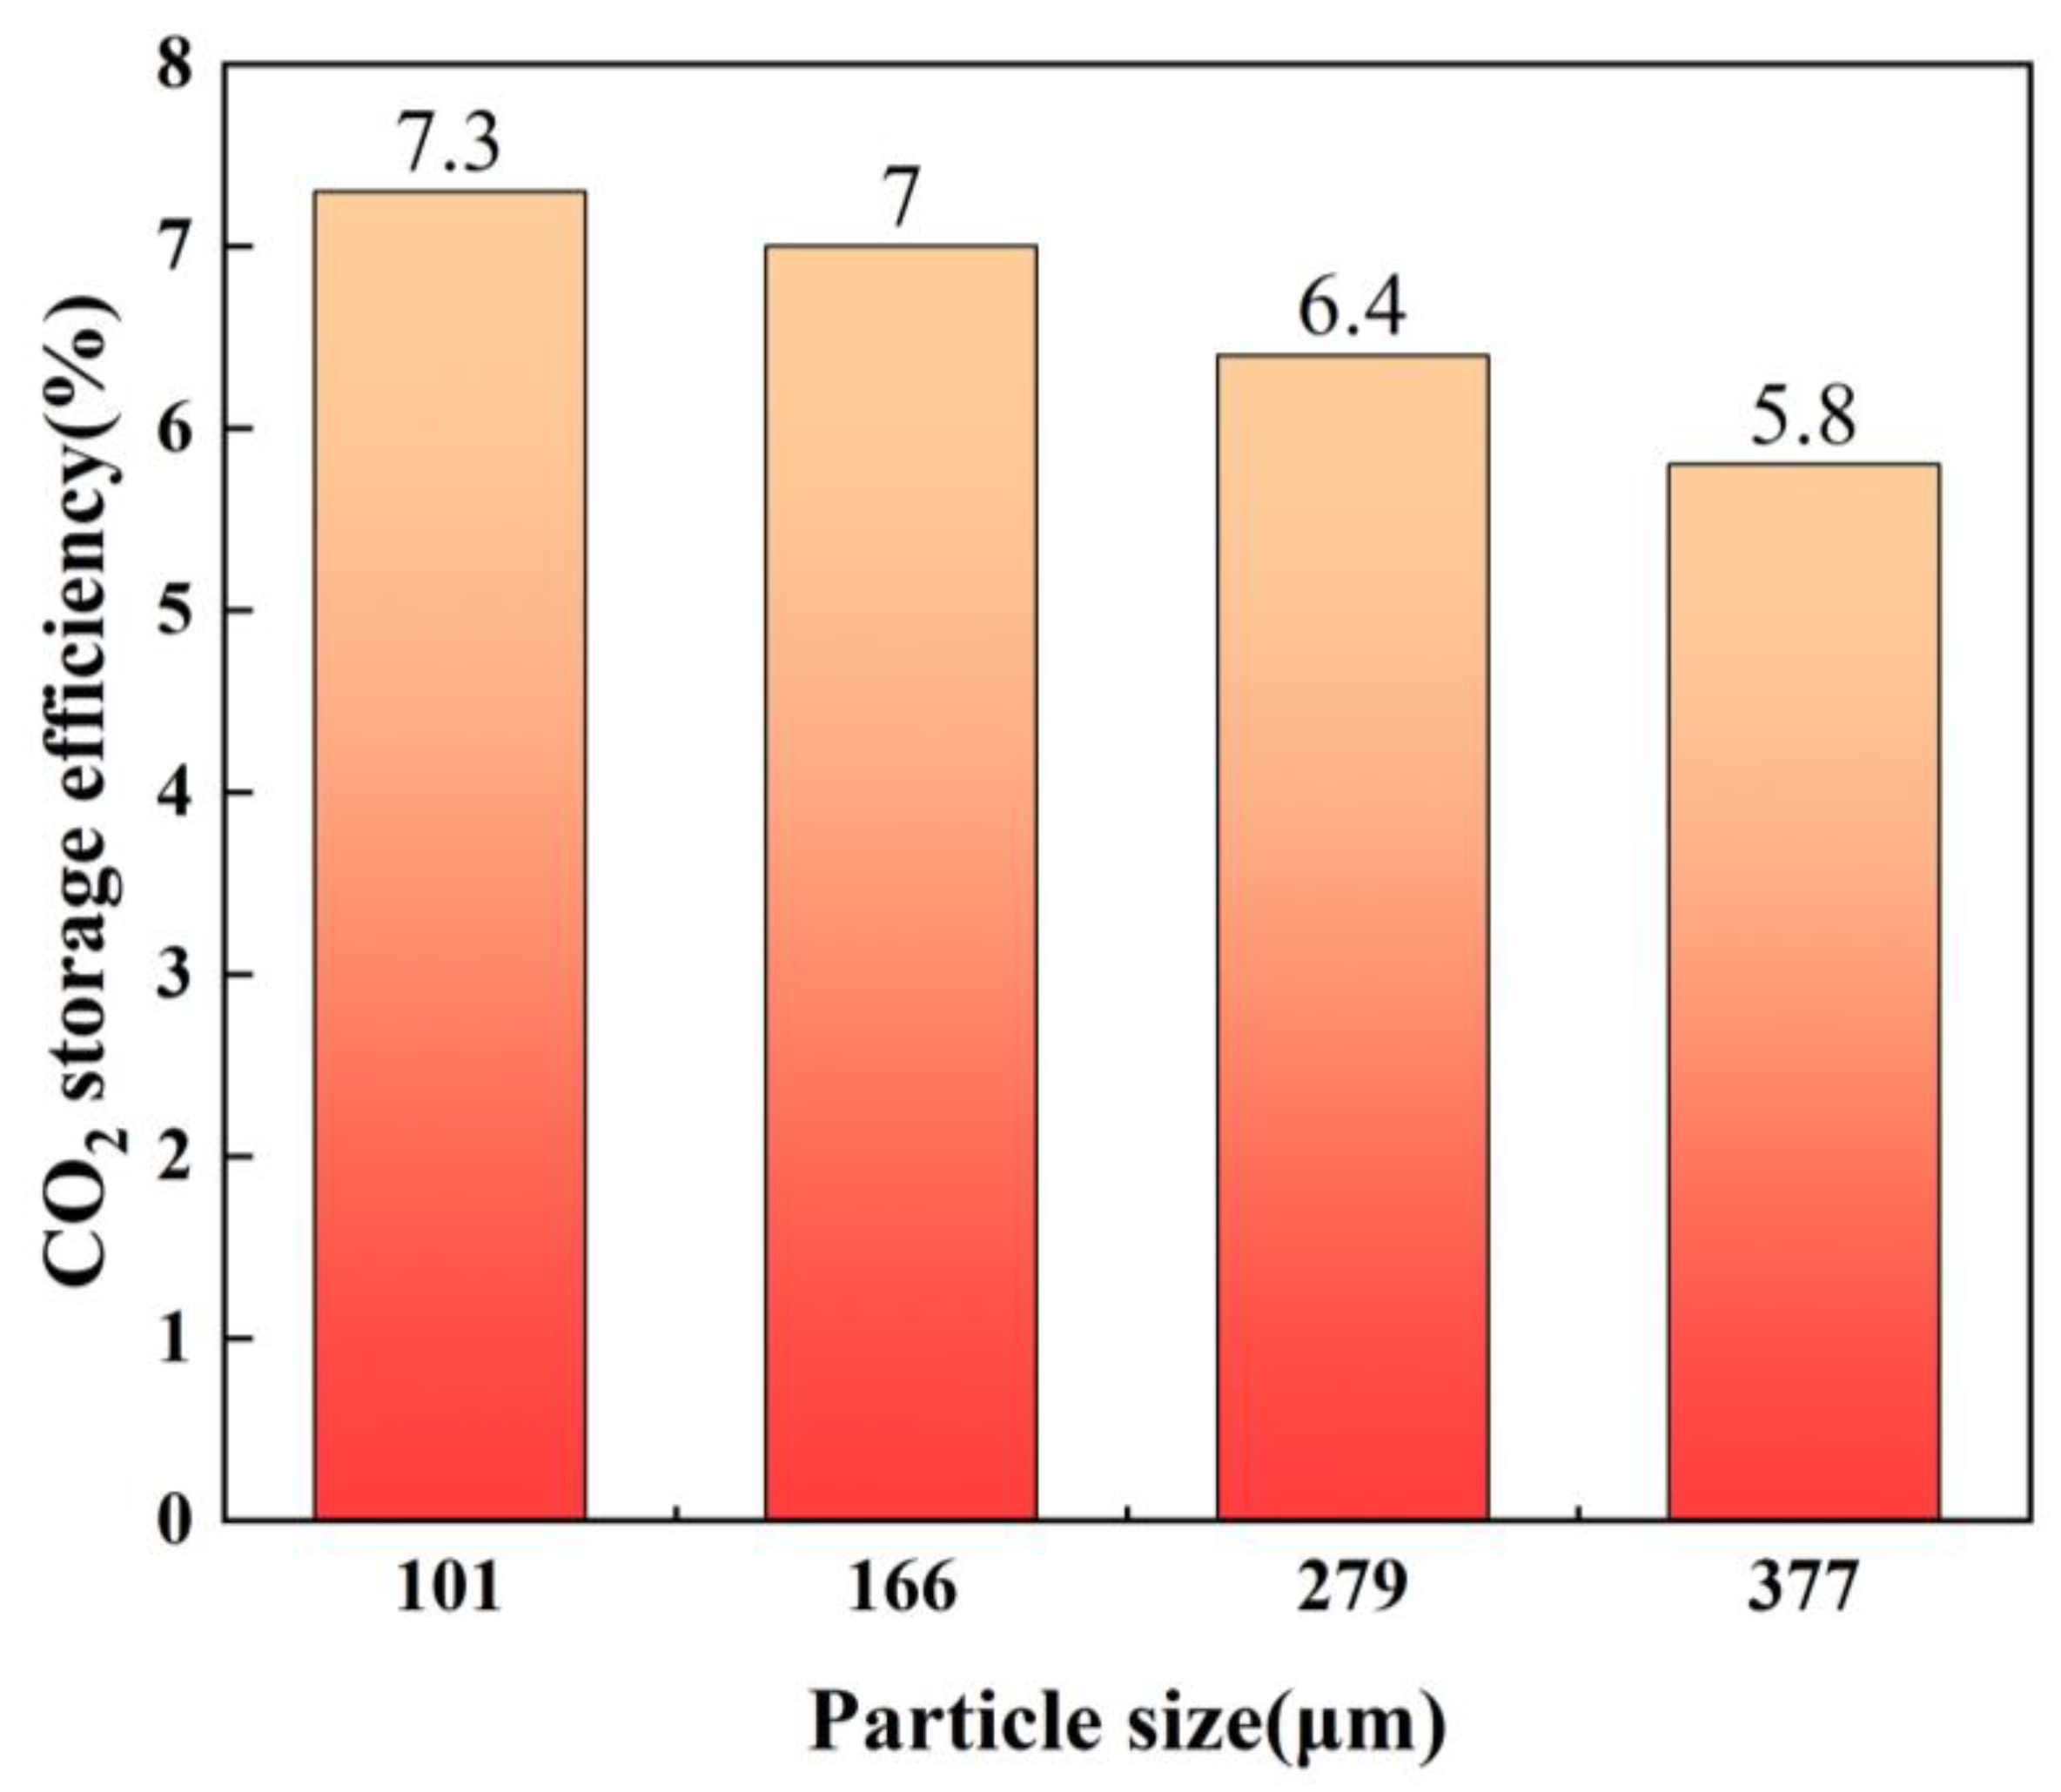
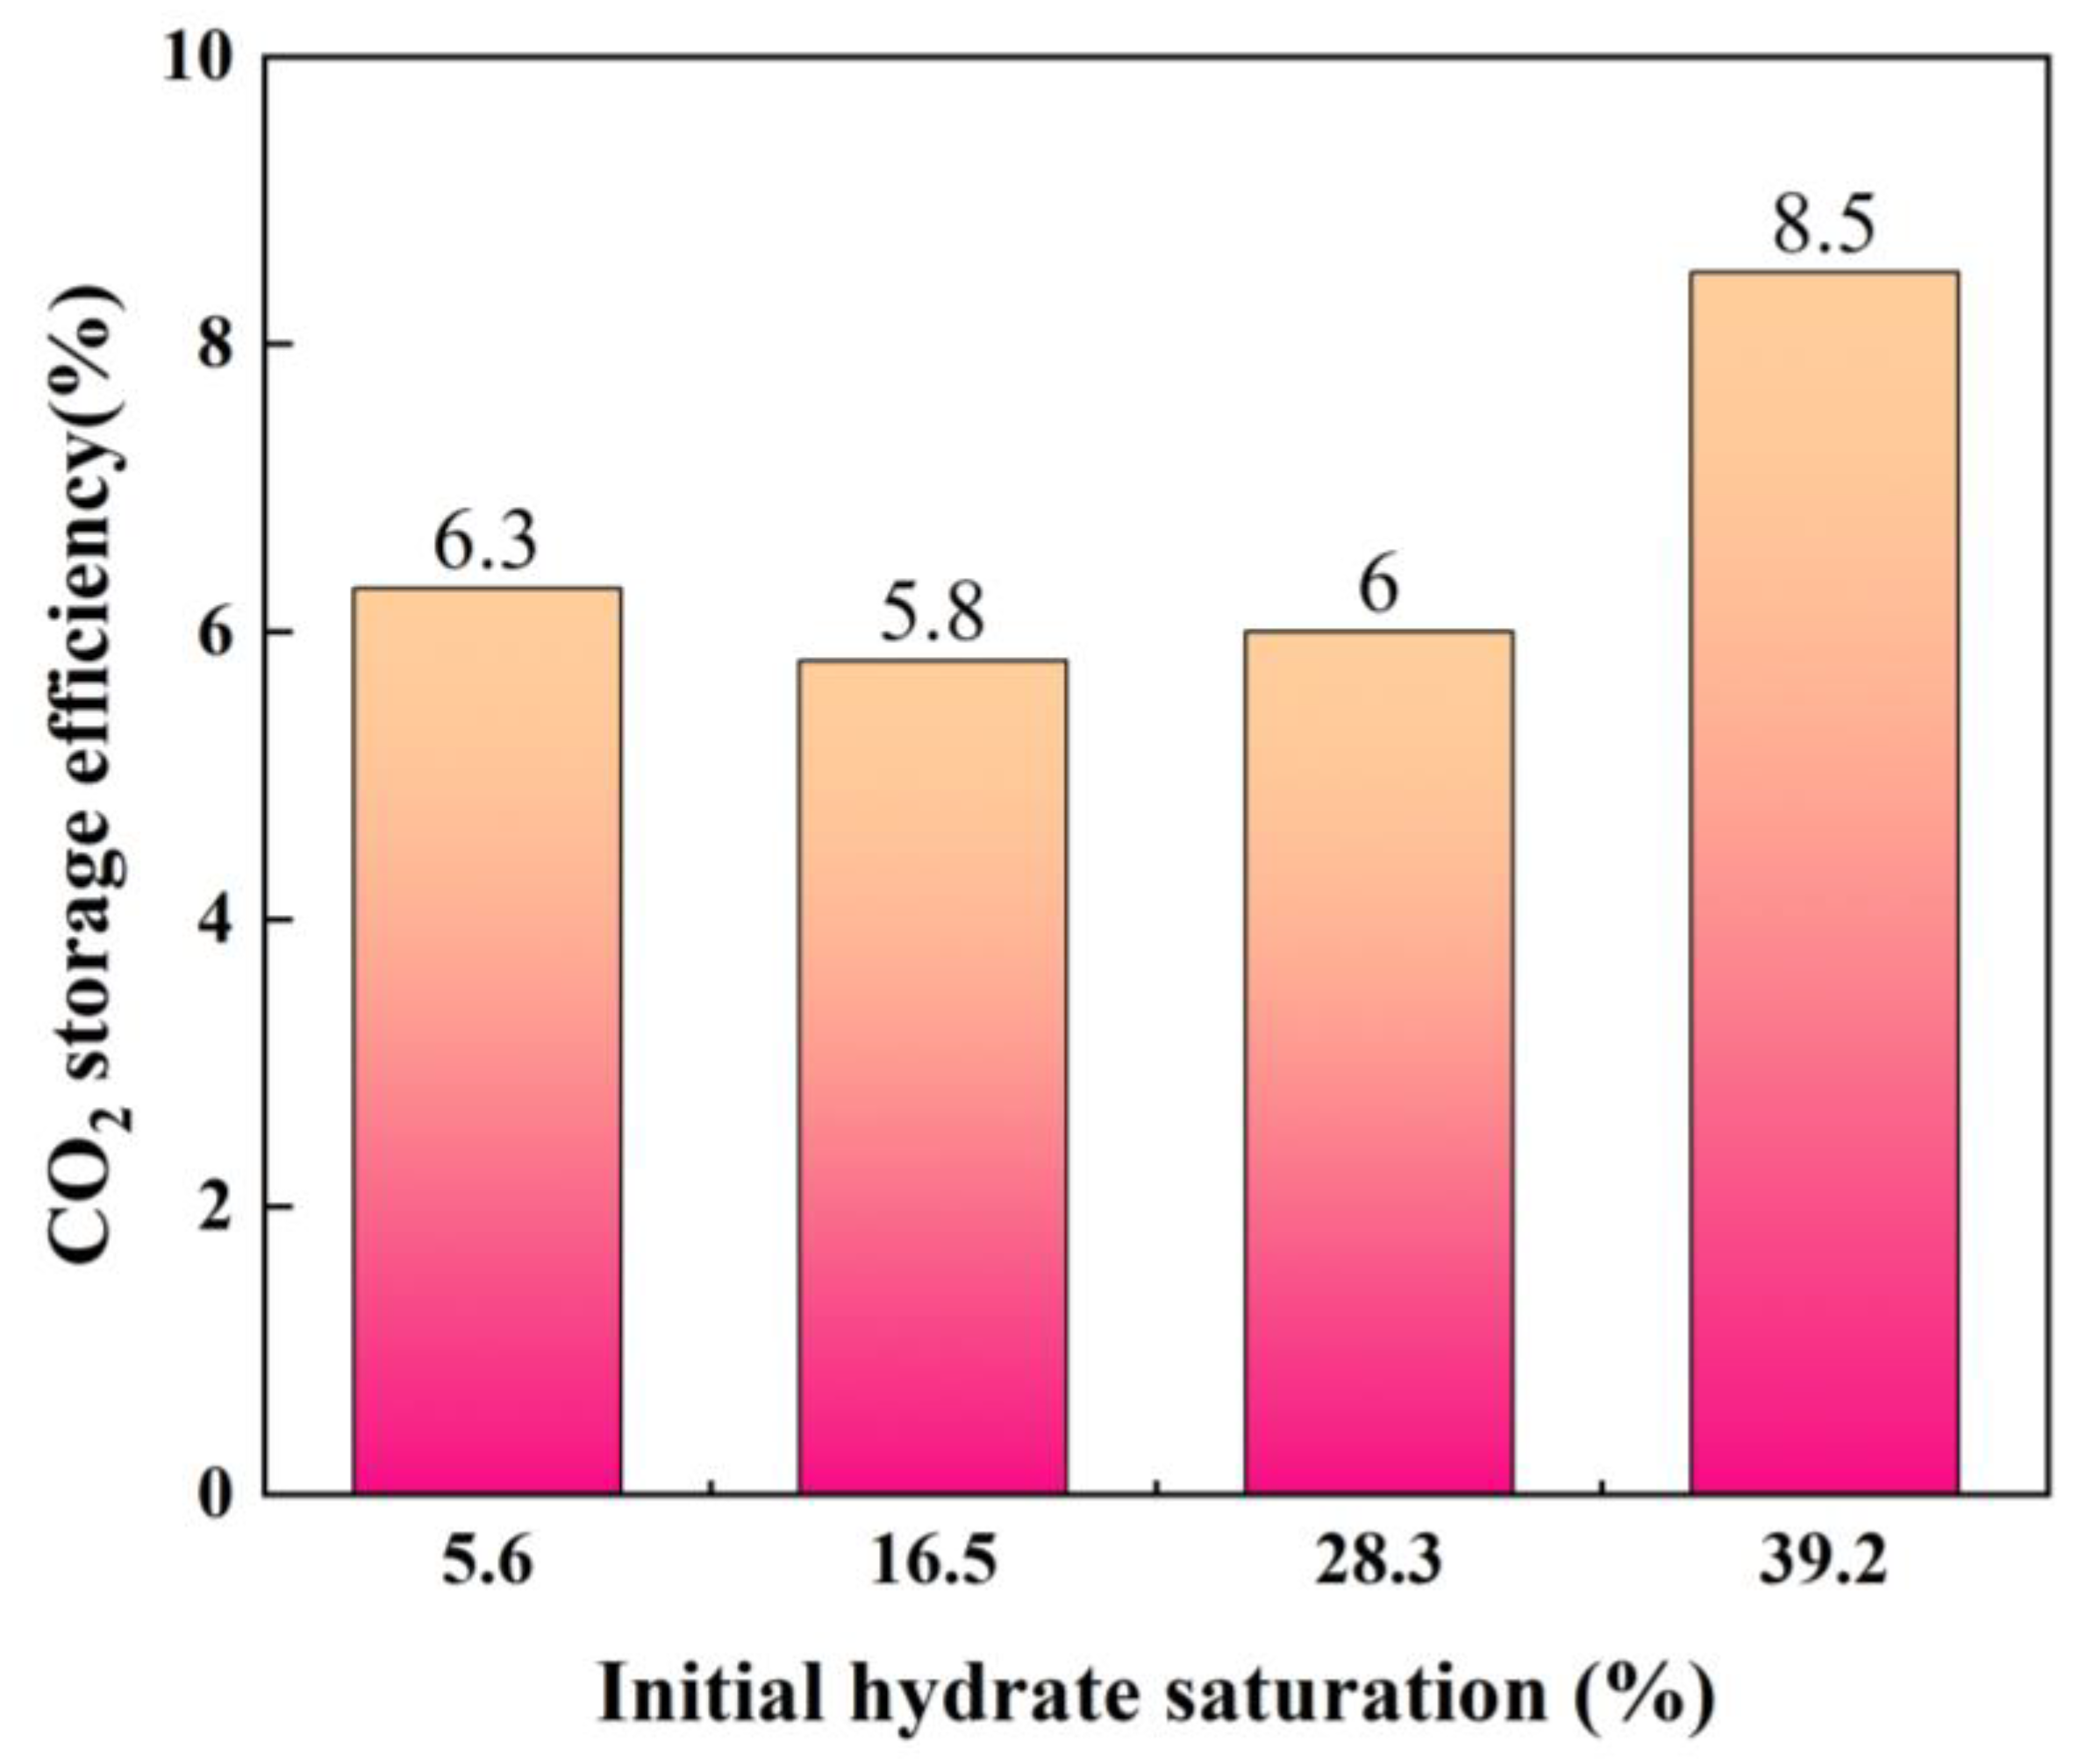
Figure 5 and Figure 6 show the storage efficiency of CO2 in the replacement reactions of Experiments 1–4 and Experiments 5–8, respectively.
As the residual water quality was approximately equal in all experiments, it can be assumed that the amount of CO2 dissolved in the residual water was the same. Therefore, the influence of residual water on the results was consistent. As shown in Figure 5, there is little difference in the storage efficiency of CO2 for different particle sizes, and the smaller the particle size, the greater the storage efficiency. There are two possible explanations: one is that the smaller the particle size, the greater the porosity, and the relatively smaller the resistance for CO2 molecules to enter the sediment to participate in the reaction [32]; second, the smaller the particle size, the larger the specific surface area, and with more CO2 hydrates generated on the surface, more CO2 needs to be consumed. As a result, the storage efficiency would increase.
Figure 6 shows that the CO2 storage efficiency of Experiments 5–7 is not significantly different, because the formation of CH4 hydrate in the sediment is grain-coating, and the CO2 consumption at this time is only affected by the hydrate saturation. As the hydrate saturation decreases, the permeability of the sediment increases, which is conducive to the diffusion of CO2 into the sediment. However, when the hydrate saturation is greater than 35%, CH4 hydrate exists in the form of pore-filling [33,34], whose permeability is greatly increased compared with grain-coating; thus, the CO2 storage rate in Experiment 8 is significantly increased. However, it also shows that the influence of hydrate morphology difference on gas permeability is greater than that of hydrate saturation on gas permeability.

3.3. Variation in CO2 and CH4 in the Gas Phase

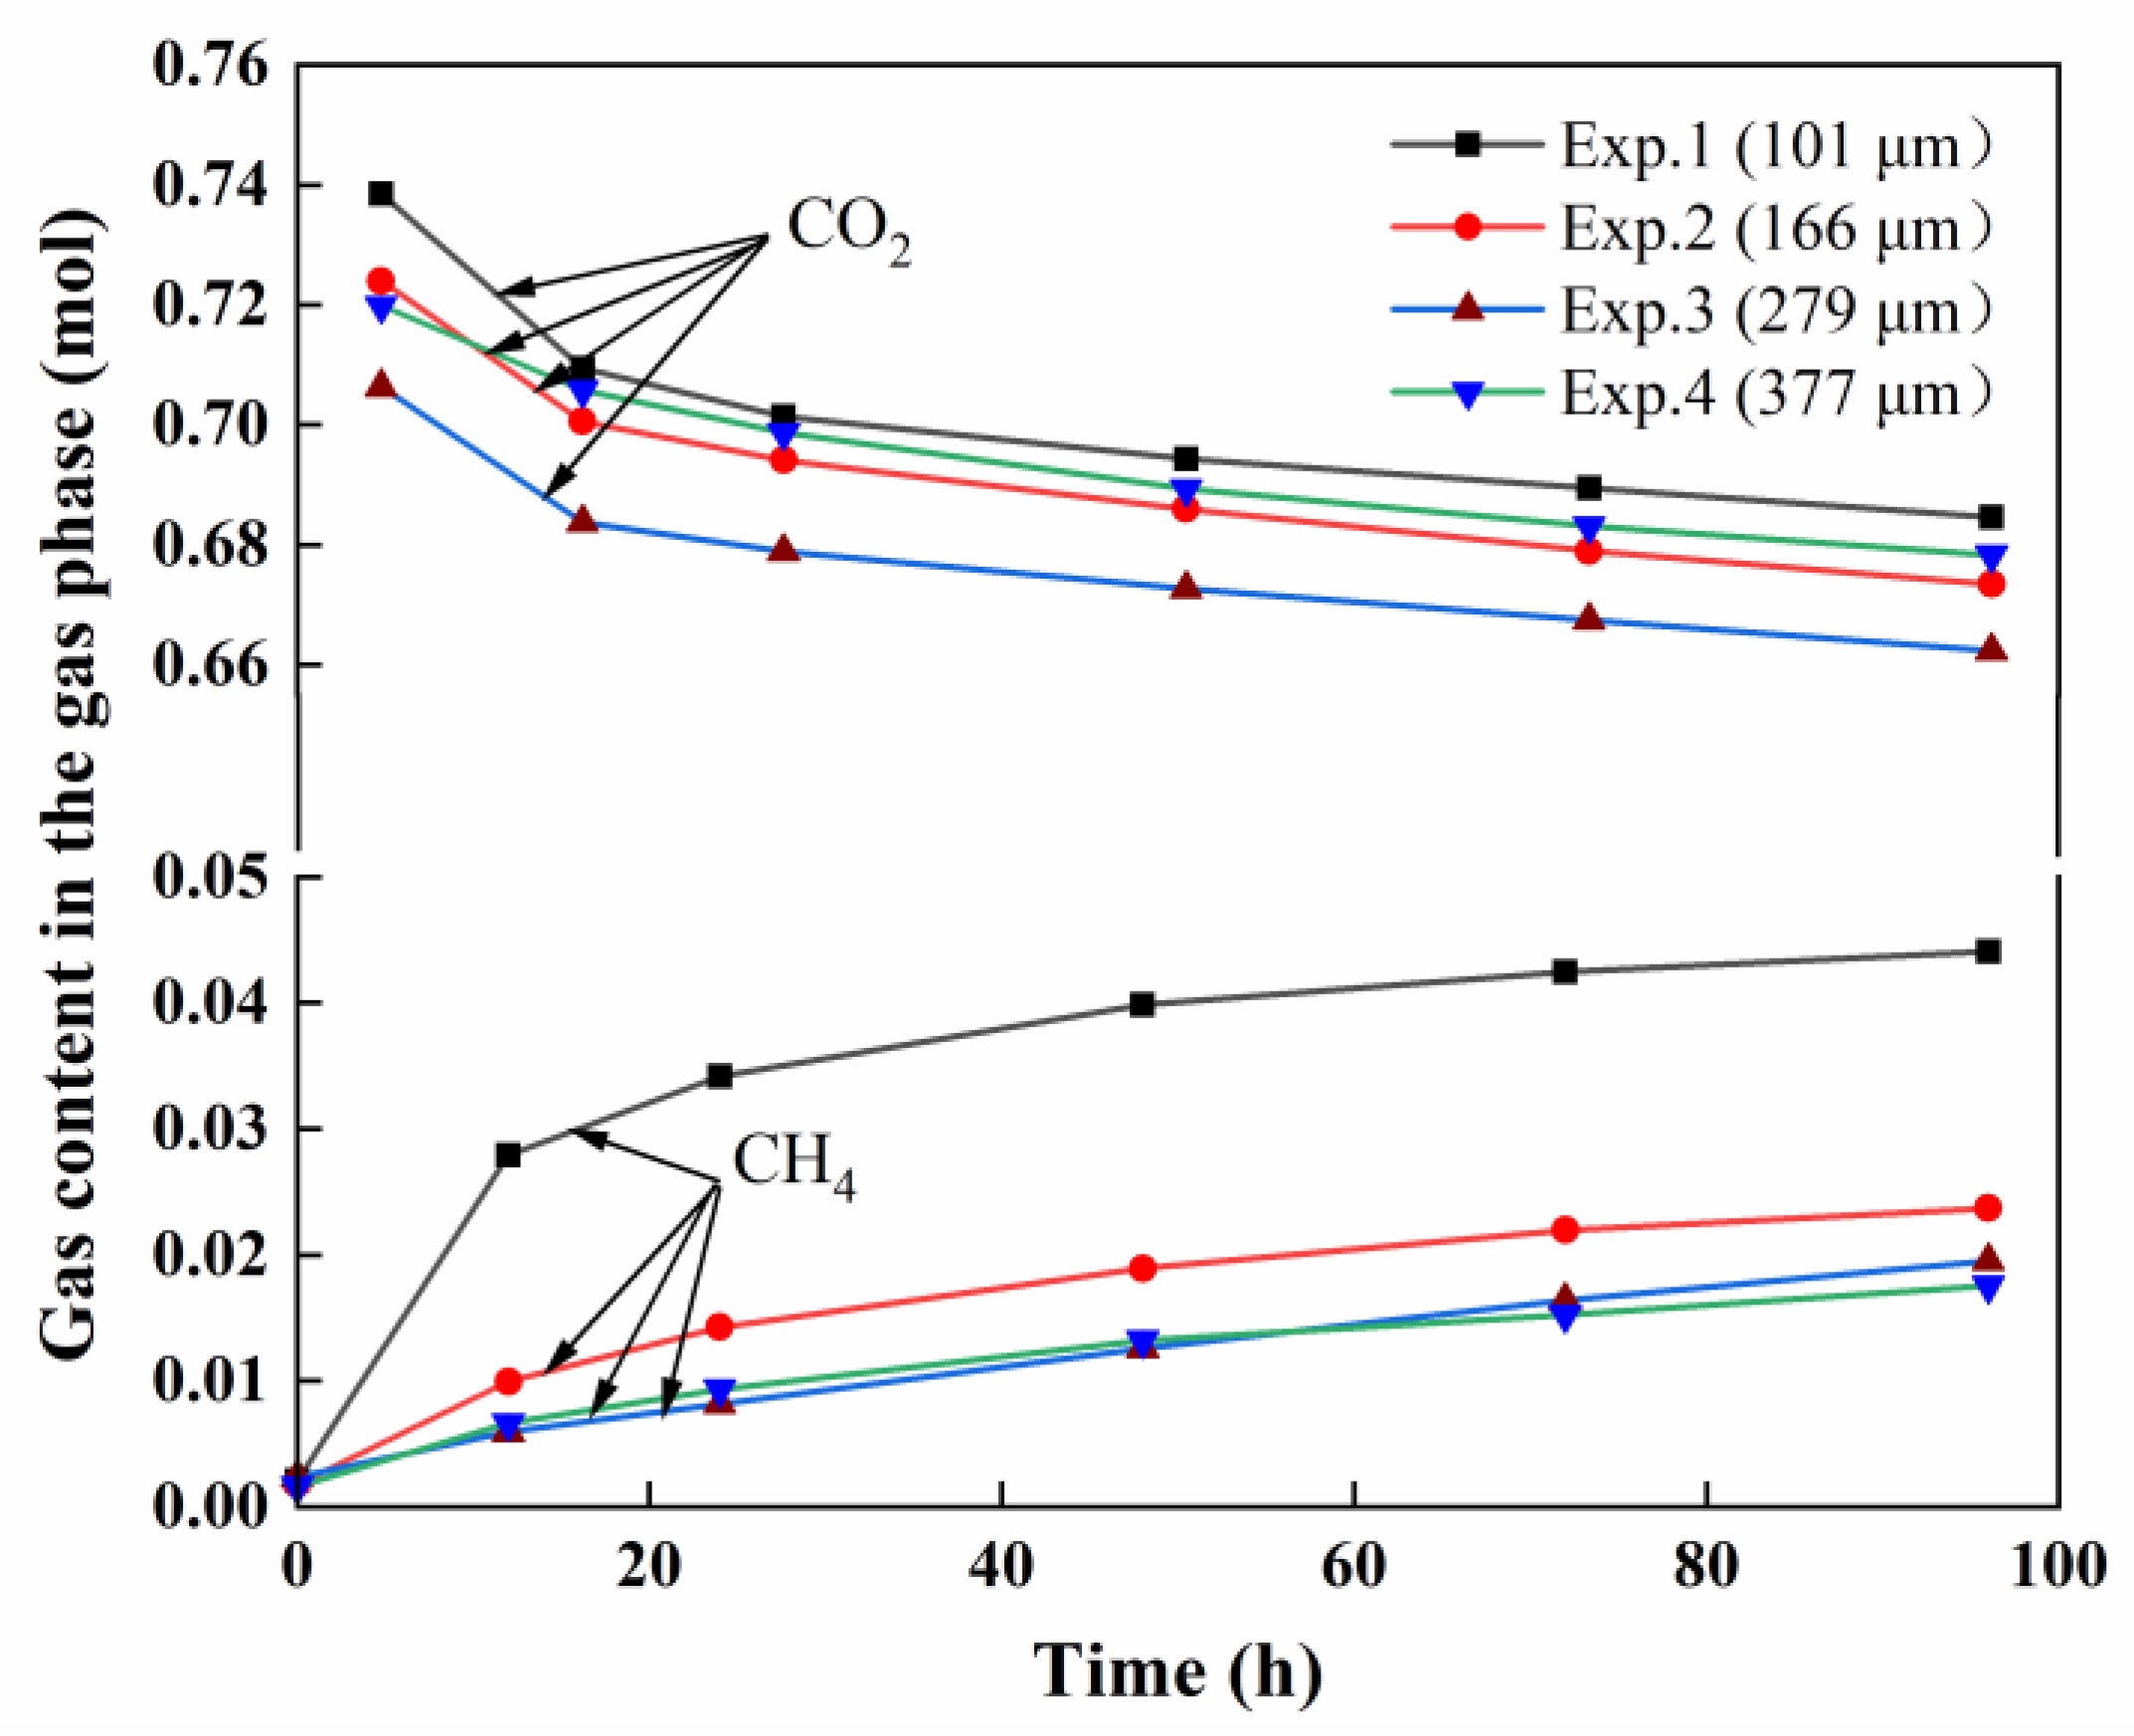
Figure 7 and Figure 8 show the variation in the total gas content in the reactor and the gas phase, respectively, during the replacement process of Experiments 1–4.
Calculated by Equation (1), the reduction in gas in the reactors for Experiments 1–4 were 0.0118, 0.0286, 0.0268, and 0.0256 mol, respectively. These values represent the amount of gas consumed by the newly formed CO2 hydrates during the replacement process. The variation in the total gas content in the reactor of Experiment 1 was the smallest within the same replacement time, but the content of the gas component CH4 increased the most, reaching 0.042 mol. From this, it can be concluded that the cumulative replacement of CH4 and the consumed CO2 are not significantly different, which means that CO2 alone is less involved in the process of forming CO2 hydrate and mainly participates in the process of replacing CH4, which is beneficial to replacement mining.
The gas content in Experiments 2–4 changed significantly with time, indicating that CO2 was mainly involved in the formation of CO2 hydrate, while the CO2-CH4 replacement reaction was not dominant, so the cumulative replacement amount of CH4 was less than that in Experiment 1. The replaced CH4 in Experiments 2–4 was 0.022, 0.017, and 0.015 mol, respectively. Under the same conditions, the replaced CH4 increased with a decrease in the sediment particle size.
This can be explained as follows. First, owing to the formation of vein-like hydrates in fine sediments [35,36], the effective area of the interface between CO2 gas and hydrates is large, while the hydrates formed by coarse sediments are pore-filled hydrates, and the effective area of the reaction is small. Second, with smaller particle size, there is greater permeability, making it easier for CO2 to enter the sediment for replacement reactions.
Through the comparison and comprehensive analysis of Figure 7 and Figure 8, it can be concluded that the reaction shows a trend of decreasing total gas content as the reaction proceeds, during which CO2 is decreasing, CH4 is increasing, and the decrease in CO2 is greater than the increase in CH4. Therefore, in the replacement reaction, CO2 does not simply replace CH4 in equal amounts but also forms new CO2 hydrates due to the combination of CO2 and residual water.
Figure 9 shows the variation in the total gas content in the reactor over time during the replacement process of Experiments 5–8.
Calculated by Equation (1), the reductions in gas in the reactor for Experiments 5–8 are 0.038, 0.0256, 0.0183, and 0.0321 mol, respectively, which is the amount of gas consumed by the newly formed CO2 hydrate during the replacement process. As shown in Figure 9, with an increase in the initial hydrate saturation, the reduction range of the total gas content in the reactor first decreased, and when the initial hydrate saturation reached a certain value, the reduction range of the total gas content increased. This can be explained by the fact that hydrate saturation and morphology control the CO2 flow into the sediment and the effective reaction area. This is because they directly control the relative gas permeability in CH4 hydrate-containing sediments. The difference in the hydrate morphology affects the relative permeability of the gas and the contact interface of the CO2 gas hydrates. According to experimental records [34], when the initial hydrate saturation is less than 35%, CH4 hydrate exists in the form of a grain-coating (mainly nucleated on the sediment surface; it grows along the sediment surface [37]). When the initial hydrate saturation is greater than 35%, and CH4 hydrate exists in the form of pore-filling (mainly nucleating in the pores between the sediments [35,38], hydrate crystals are suspended in the pores and not in contact with the sediments, and there is no interaction). Based on this, it can be inferred that the hydrate formed in Experiments 5–7 is grain-coated, and the hydrate structure has the same effect on the permeability, so the permeability of the sediment will be determined by the hydrate saturation. In Experiment 5–7, the hydrate saturation gradually increases, so the permeability of the sediment is gradually decreasing [39]. This hinders the occurrence of the replacement reaction, and finally leads to a decrease in the reduction range of the total gas content in the reactor. Although the hydrate saturation in Experiment 8 was the highest, the gas relative permeability in the sediment was improved due to the formation of pore-filling hydrate, so the final gas reduction increased.
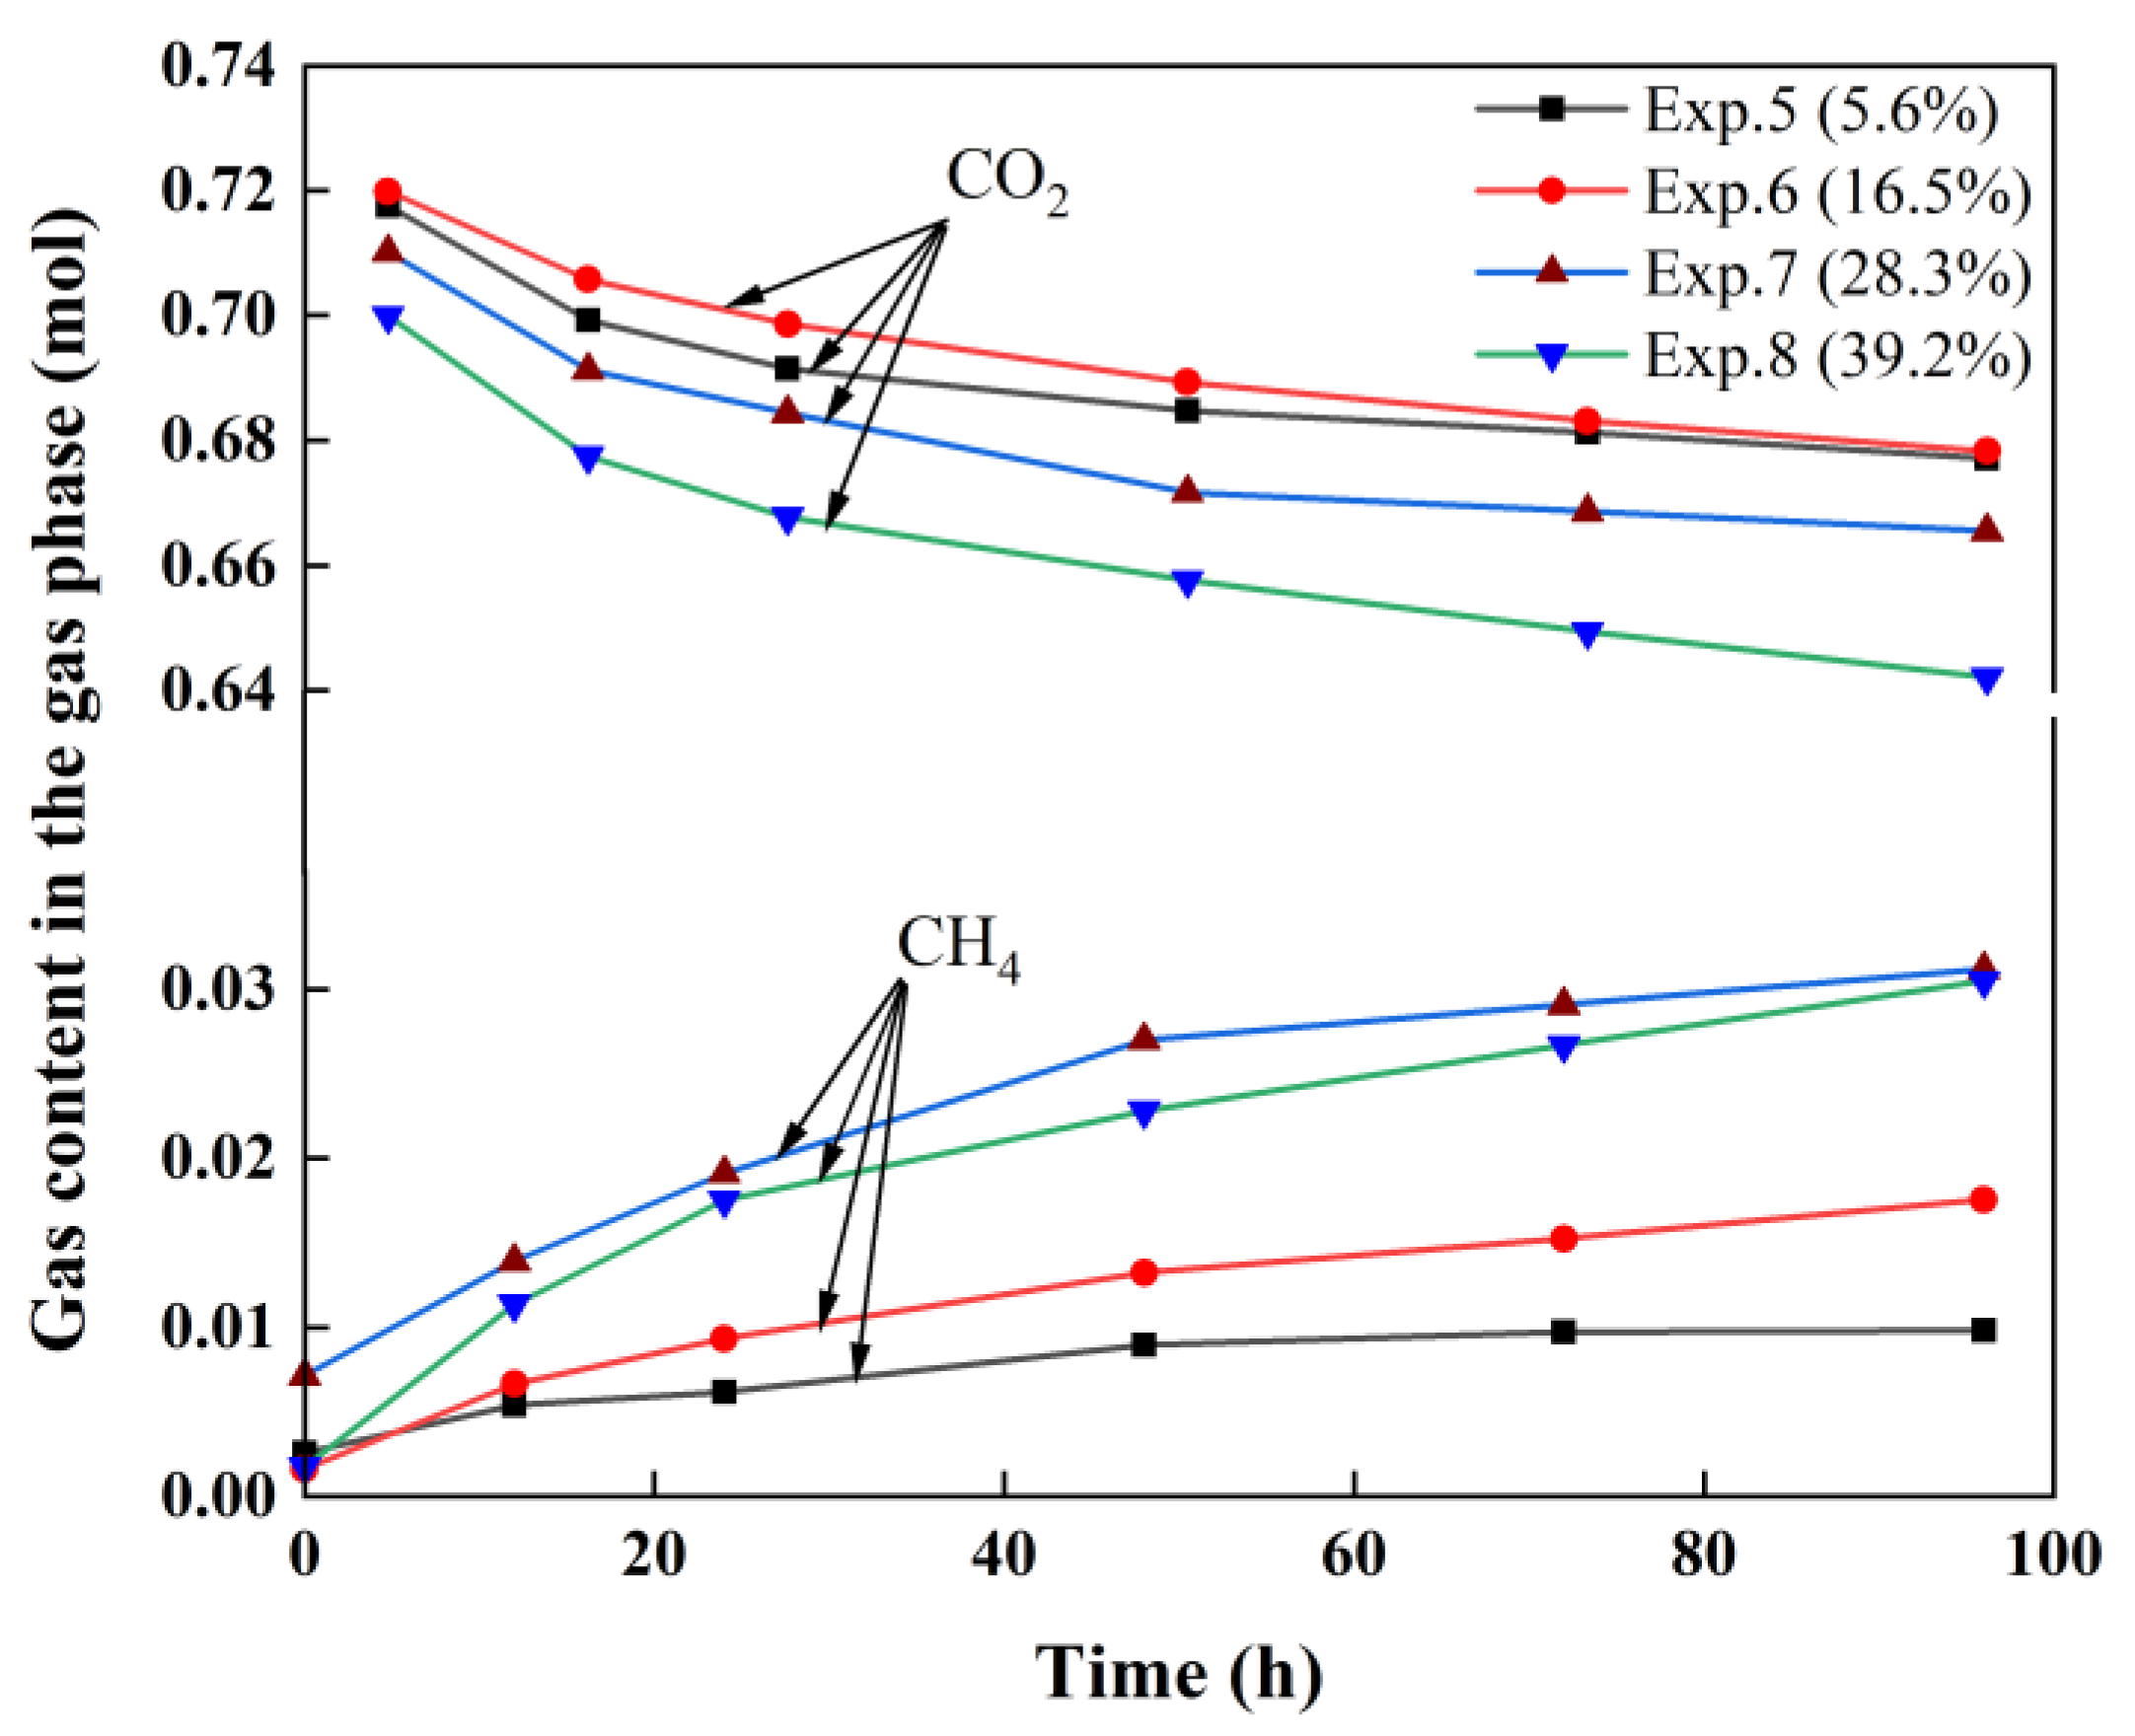
Figure 10 shows the variation in the gas component content in Experiments 5–8 with time.
Calculated from Equation (1), the accumulated amounts of CH4 replaced in Experiments 5–8 were 0.007, 0.015, 0.024, and 0.028 mol, respectively. It can be concluded that under the same conditions, with an increase in the initial hydrate saturation, more CH4 was replaced. This is because with higher hydrate saturation, there are more CH4 hydrates in the sediment, which results in a larger interface area between CO2 gas and the hydrate. This implies that there is a larger effective area for the reaction. The results demonstrate that in addition to the exchange of CO2 and CH4 molecules, the replacement process will also be accompanied by the process of CO2 combined with residual water to form new CO2 hydrates. Compared to the exchange of CH4 molecules, CO2 molecules form CO2 hydrates more easily at the gas-liquid interface.

3.4. CH4 Recovery Efficiency

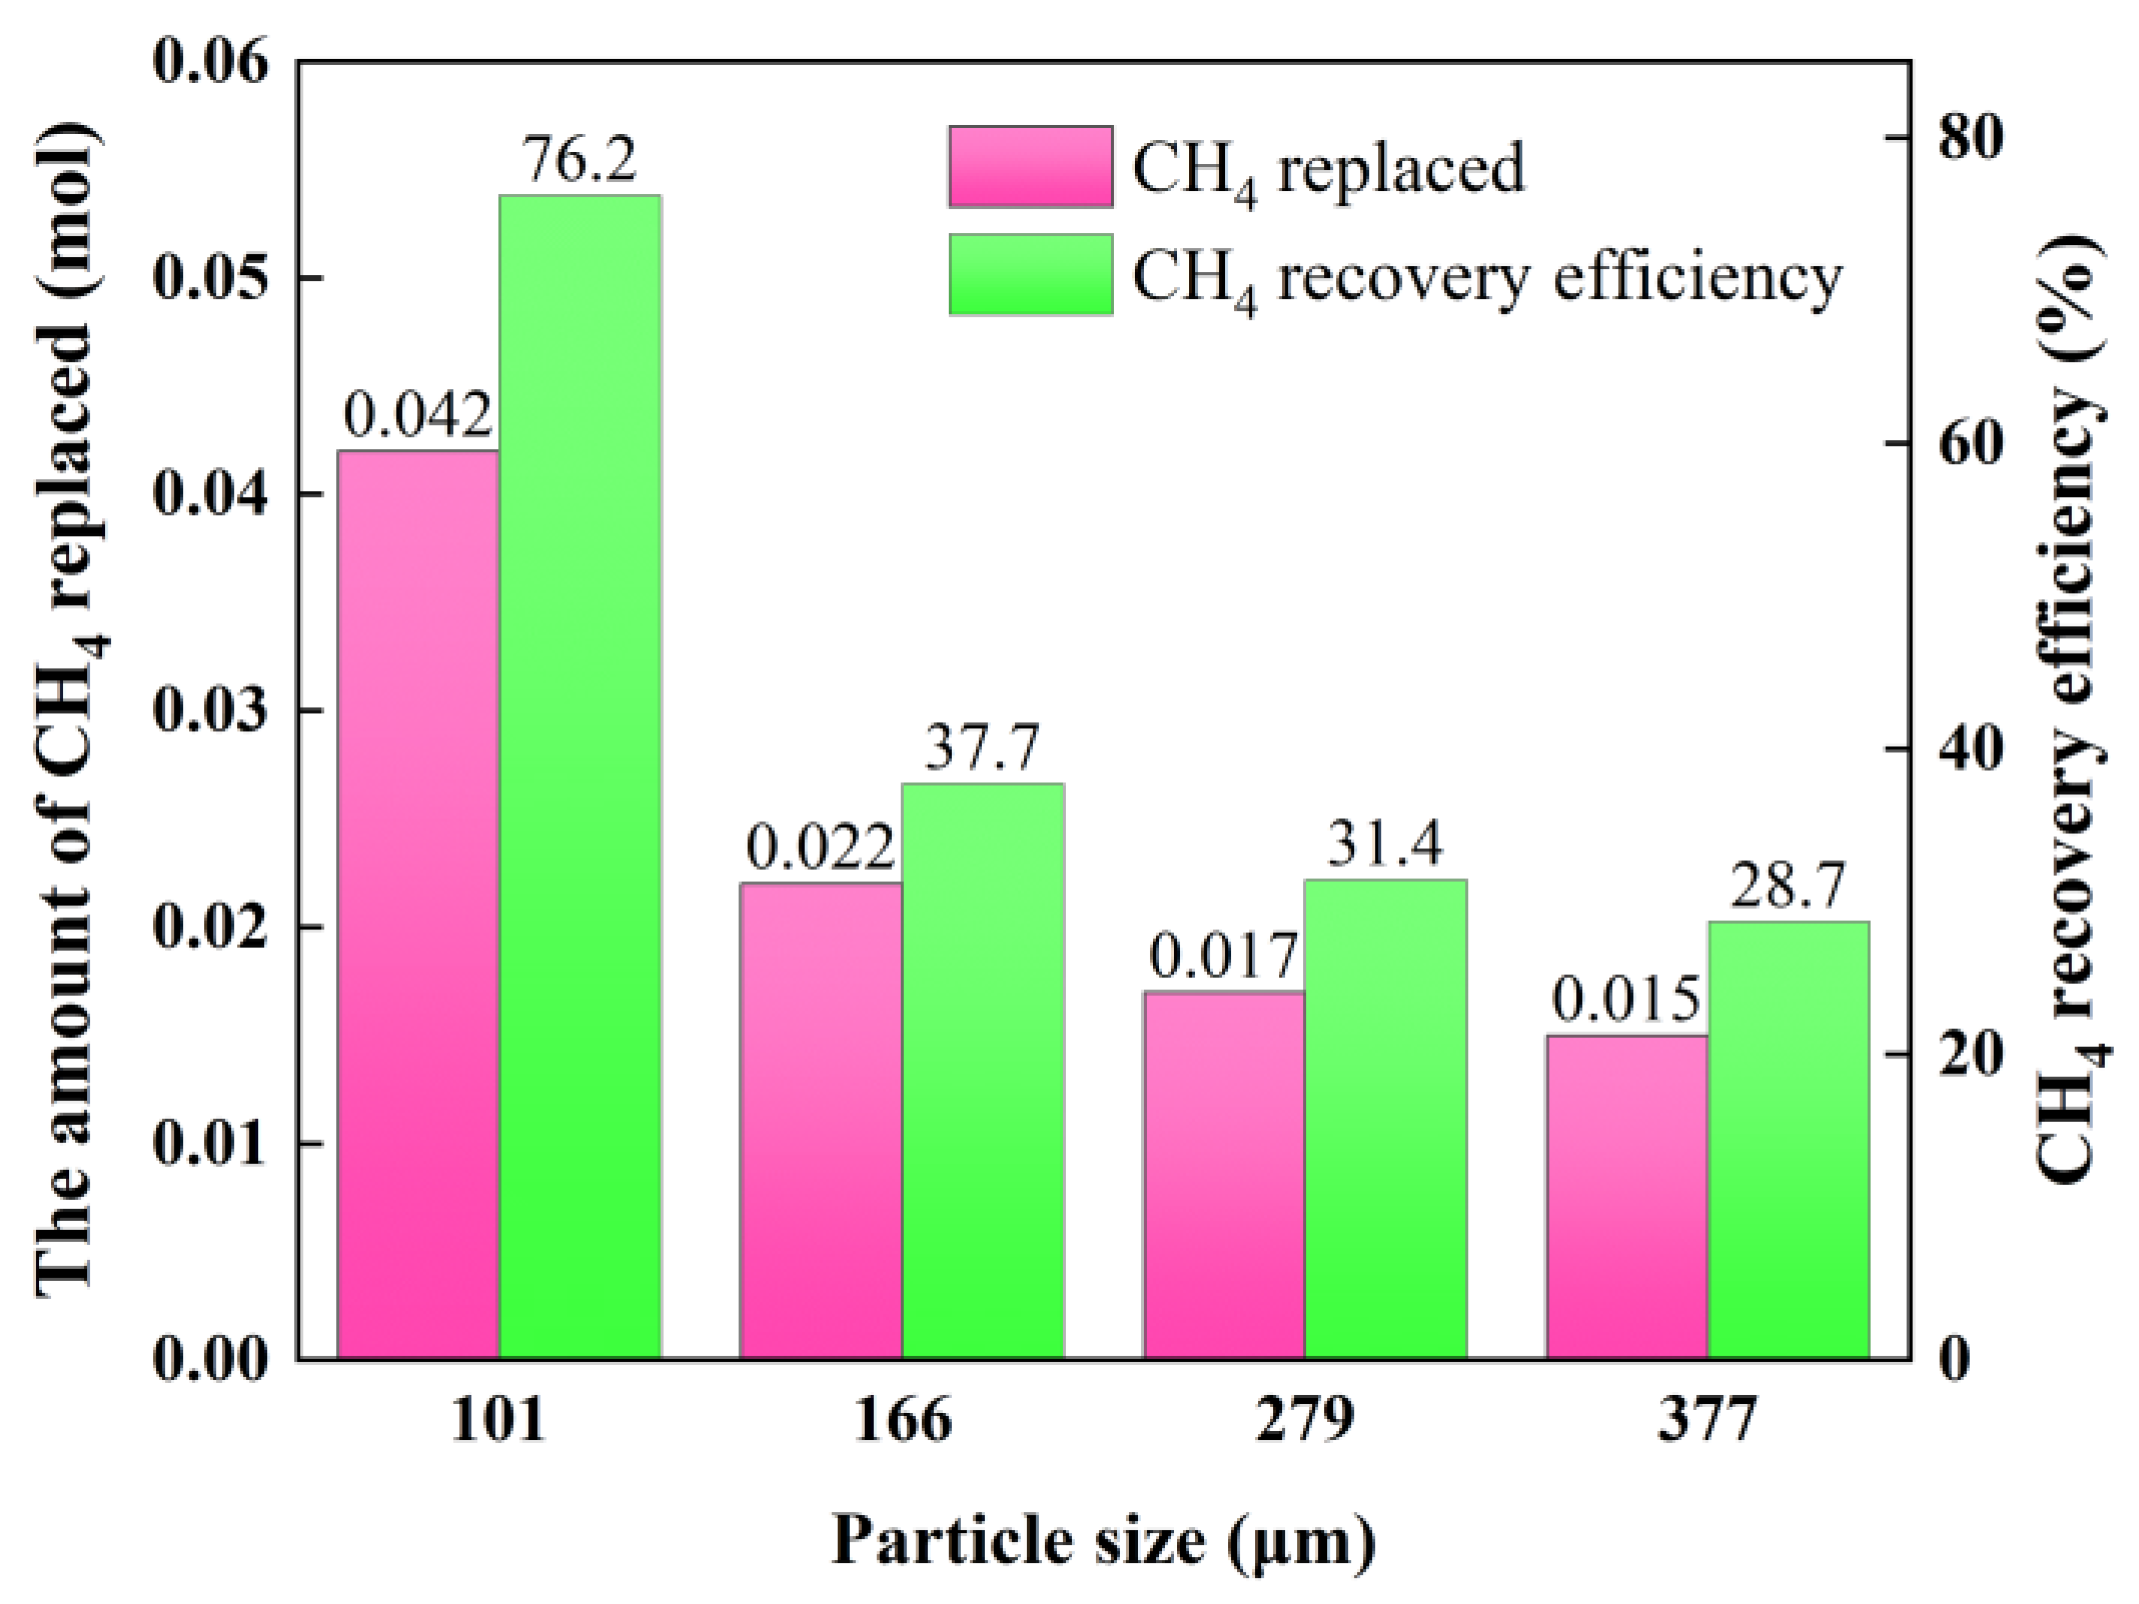
The calculated recovery efficiency and replacement amount of CH4 for Experiments 1–4 is shown in Figure 11.
The replacement amount and recovery efficiency of CH4 increases with a decrease in particle size. However, the median particle sizes of 166, 279, and 377 μm had little effect on the recovery efficiency, whereas the recovery efficiency of the median particle size of 101 μm was much greater than that of other particle sizes. A possible reason for this is that according to the microscopic distribution of hydrate formation, CH4 forms pore-filling hydrates in sediments with larger particle sizes, whereas it forms vein-like hydrates in sediments with smaller particle sizes. The surface area of vein-like hydrates was larger than that of pore-filling hydrates, and the interface area between CO2 gas and CH4 hydrates was larger during the replacement process. In addition, the porosity and permeability of the sediment increased as the particle size decreased, and the diffusion of CO2 gas in the sediment improved accordingly. Therefore, the replacement and recovery efficiencies of CH4 were higher.
The calculated recovery efficiency of CH4 hydrate for Experiments 5–8 is shown in Figure 12.
The replacement of CH4 increases with an increase in the initial hydrate saturation, whereas the recovery efficiency decreases with an increase in the initial water saturation. It is possible that the recovery efficiency is mainly controlled by CO2 permeation into the interface between CH4 and CO2 hydrate. The CH4 hydrate attached to the surface of the sediment increases with an increase in the initial hydrate saturation; therefore, the higher the hydrate saturation, the more CH4 is replaced. However, as the reaction progresses, the hydrate film layer becomes thicker, and the resistance of CO2 molecules to penetrate the sediment and participate in the replacement reaction increases, thereby reducing the recovery efficiency. When the hydrate saturation was greater than 35%, the amount of replaced CH4 was more significantly affected by hydrate saturation. When the hydrate saturation was less than 35%, the amount of replaced CH4 was less affected by hydrate saturation. This is because when the hydrate saturation is greater than 35%, CH4 hydrate exists in the form of pore-filling, whereas when the hydrate saturation is less than 35%, it exists in the form of grain-coating. The permeability of pore-filling is known to be greater than that of grain-coating [35]. Therefore, it is easier for CO2 to permeate the sediment and react to replace more CH4.

4. Conclusions

Based on the consistency of the amount of residual water for all the experiments, the effects of sediment particle size and initial hydrate saturation on CO2-CH4 displacement were discussed using a self-built displacement experimental device. Eight experiments were conducted to examine the effect of displacement under different conditions. The experimental results show that during the replacement process, two stages of rapid reaction and slow reaction occurred, which were manifested by the speed of the pressure change in the reactor. The CO2 sequestration ratio decreased with the increase in sediment particle size and increased with the increase in initial hydrate saturation. During the replacement process, two reactions occurred: CH4 was replaced by CO2 and CO2 hydrate was formed, and the replacement amount and recovery efficiency of CH4 increased with a decrease in sediment particle size. When the sediment particle size was less than 166 μm, the CH4 recovery efficiency was significantly affected by the particle size. When the particle size was greater than 166 μm, the CH4 recovery efficiency was not significantly different. The replacement amount of CH4 increased with the increase in initial hydrate saturation, while the recovery efficiency decreased. When the initial water saturation in the sediment was greater than 35%, the recovery of CH4 was significantly affected by the initial hydrate saturation. When the initial water saturation in the sediment was less than 35%, the CH4 recovery was less strongly affected by the initial hydrate saturation.
In conclusion, in CO2-CH4 replacement production, selecting a storage area with high hydrate saturation, small particle size, and water saturation greater than 35%, will be beneficial to the CO2 storage efficiency and the amount of CH4 replaced.

Author Contributions

Conceptualization, D.L. (Dongliang Li) and D.L. (Deqing Liang); methodology, X.Z.; investigation, F.L. and C.H.; writing—original draft preparation, F.L.; writing—review and editing, X.Z.; supervision, D.L. (Dongliang Li). All authors have read and agreed to the published version of the manuscript.

Funding

This research was funded by the Guangdong Provincial Science and Technology Plan Project (2021A0505030053), Guangdong Provincial Special Fund Project for Promoting Economic Development (GDME-2022D043) and the Special project for marine economy development of Guangdong (six marine industries) (GDNRC[2022]46).

Data Availability Statement

The authors confirm that the data supporting the findings of this study are available within the article.

Acknowledgments

The authors thank Shi-jun Liu for his help in the operation of GC and Jia-mei Mo for her help in the operation of SEM.

Conflicts of Interest

The authors declare that they have no known competing financial interests or personal relationships that could have appeared to influence the work reported in this paper.

References

  1. Sloan, E.D.; Koh, C.A. Clathrates Hydrates of the Natural Gases, 3rd ed.; CRC Press: Boca Raton, FL, USA, 2007. [Google Scholar]
  2. Koh, C.A.; Sloan, E.D.; Sum, A.K.; Wu, D.T. Fundamentals and applications of gas hydrates. Annu. Rev. Chem. Biomol. Eng. 2011, 2, 237–257. [Google Scholar] [CrossRef] [PubMed]
  3. Makogon, Y.F. Natural gas hydrates—A promising source of energy. J. Nat. Gas Sci. Eng. 2010, 2, 49–59. [Google Scholar] [CrossRef]
  4. Wang, Y.; Lang, X.; Fan, S.; Wang, S.; Yu, C.; Li, G. Review on Enhanced Technology of Natural Gas Hydrate Recovery by Carbon Dioxide Replacement. Energy Fuels 2021, 35, 3659–3674. [Google Scholar] [CrossRef]
  5. Collett, T.; Bahk, J.J.; Baker, R.; Boswell, R.; Divins, D.; Frye, M.; Goldberg, D.; Husebø, J.; Koh, C.; Malone, M.; et al. Methane Hydrates in Nature-Current Knowledge and Challenges. J. Chem. Eng. Data ACS J. Data 2015, 60, 329. [Google Scholar] [CrossRef]
  6. Boswell, R.; Collett, T.S. Current perspectives on gas hydrate resources. Energy Environ. Sci. 2011, 4, 1206–1215. [Google Scholar] [CrossRef]
  7. Yongxiu, B.; Shuangyuan, L. The Background, Challenges, Opportunities and Realization Paths of Double Carbon Goals. China Econ. Rev. 2021, 4, 10–13. [Google Scholar]
  8. Ota, M.; Abe, Y.; Watanabe, M.; Smith, R.L.; Inomata, H. Methane recovery from methane hydrate using pressurized CO2. Fluid Phase Equilibria 2005, 228–229, 553–559. [Google Scholar] [CrossRef]
  9. Li, Z.Z.; Guo, X.Q.; Wang, J.B.; Yang, L.Y. Experiment of developing different systems of CH4 hydrate by CO2 displacement method. Nat. Gas Ind. 2008, 28, 129–132. [Google Scholar]
  10. Zhou, W.; Fan, S.S.; Liang, D.Q.; Li, D.L.; Tang, C.P.; Tian, G.L. Effect of carbon dioxide pressure on methane hydrate replacement rate. J. Wuhan Univ. Technol. (Transp. Sci. Eng. Ed.) 2008, 32, 547–550. [Google Scholar]
  11. Zhou, X.; Fan, S.; Liang, D.; Du, J. Replacement of Methane from Quartz Sand-Bearing Hydrate with Carbon Dioxide-in-Water Emulsion. Energy Fuels 2008, 22, 1759–1764. [Google Scholar] [CrossRef]
  12. Lee, B.R.; Koh, C.A.; Sum, A.K. Quantitative measurement and mechanisms for CH4 production from hydrates with the injection of liquid CO2. Phys. Chem. Chem. Phys. 2014, 16, 14922–14927. [Google Scholar] [CrossRef] [PubMed]
  13. Bai, D.; Zhang, X.; Chen, G.; Wang, W. Replacement mechanism of methane hydrate with carbon dioxide from microsecond molecular dynamics simulations. Energy Environ. Sci. 2012, 5, 7033–7041. [Google Scholar] [CrossRef]
  14. Xitang, Z.; Fan, S.; Liang, D. Kinetic Research on Replacement of Methane in Gas Hydrate with Carbon Dioxide Emulsion. Nat. Gas Geosci. 2013, 24, 259–264. [Google Scholar]
  15. Xiaowen, W. Experimental Study on the Influence Factors of Exploiting Methane Hydrate by Replacement with CO2; China University of Petroleum (East China): Qingdao, China, 2014. [Google Scholar]
  16. Yuan, Q.; Sun, C.-Y.; Yang, X.; Ma, P.-C.; Ma, Z.-W.; Liu, B.; Ma, Q.-L.; Yang, L.-Y.; Chen, G.-J. Recovery of methane from hydrate reservoir with gaseous carbon dioxide using a three-dimensional middle-size reactor. Energy 2012, 40, 47–58. [Google Scholar] [CrossRef]
  17. Ren, L.L.; Jiang, M.; Wang, L.B.; Zhu, Y.J.; Li, Z.; Sun, C.Y.; Chen, G.J. Gas hydrate exploitation and carbon dioxide sequestration under maintaining the stiffness of hydrate-bearing sediments. Energy 2020, 194, 116869.1–116869.11. [Google Scholar] [CrossRef]
  18. Zhang, X.; Wang, Y.; Li, J.; Wu, Q.; Yang, L. Recovering CH4 from natural gas hydrate with CO2 in porous media below the freezing point. Pet. Sci. Technol. 2019, 37, 770–779. [Google Scholar] [CrossRef]
  19. Fan, S.; Wang, X.; Wang, Y.; Lang, X. Recovering methane from quartz sand-bearing hydrate with gaseous CO2. J. Energy Chem. 2017, 26, 655–659. [Google Scholar] [CrossRef] [Green Version]
  20. ConocoPhillips. ConocoPhillips Gas Hydrate Production Test; Oil & Natural Gas Technology, Progress Report First Half 2012; Office of Fossil Energy: Anchorage, AK, USA, 2012.
  21. Gambelli, A.M.; Castellani, B.; Nicolini, A.; Rossi, F. Water Salinity as Potential Aid for Improving the Carbon Dioxide Replacement Process’ Effectiveness in Natural Gas Hydrate Reservoirs. Processes 2020, 8, 1298. [Google Scholar] [CrossRef]
  22. Mu, L.; Cui, Q. Experimental Study on the Dissociation Equilibrium of (CH4 + CO2) Hydrates in the (Quartz Sands + NaCl Solution) System. J. Chem. Eng. Data 2019, 64, 5806–5813. [Google Scholar] [CrossRef]
  23. Pan, D.; Zhong, X.; Zhu, Y.; Zhai, L.; Chen, C. CH4 recovery and CO2 sequestration from hydrate-bearing clayey sediments via CO2/N2 injection. J. Nat. Gas Sci. Eng. 2020, 83, 103503. [Google Scholar] [CrossRef]
  24. Zhang, L.; Yang, L.; Wang, J.; Zhao, J.; Dong, H.; Yang, M.; Liu, Y.; Song, Y. Enhanced CH4 recovery and CO2 storage via thermal stimulation in the CH4/CO 2 replacement of methane hydrate. Chem. Eng. J. 2017, 308, 40–49. [Google Scholar] [CrossRef]
  25. Pandey, J.S.; Karantonidis, C.; Karcz, A.P.; von Solms, N. Enhanced CH4-CO2 Hydrate Swapping in the Presence of Low Dosage Methanol. Energies 2020, 13, 5238. [Google Scholar] [CrossRef]
  26. Almenningen, S.; Graue, A.; Ersland, G. Experimental Investigation of Critical Parameters Controlling CH4–CO2 Exchange in Sedimentary CH4 Hydrates. Energy Fuels 2021, 35, 2468–2477. [Google Scholar] [CrossRef]
  27. Yuanxin, Y.; Xuebing, Z.; Dongliang, L.; Deqing, L. Experiments of CO2 gas sequestration on the seabed by hydrate method. Chem. Ind. Eng. Prog. 2021, 40, 3489–3498. [Google Scholar]
  28. Jianye, S.; Lele, L.; Xiaowen, W.; Feifei, W.; Changling, L. CO2 Replacement Experiment of Methane Hydrate in Sediment. Nat. Gas Ind. 2015, 35, 56–62. [Google Scholar]
  29. Yuan, Q.; Sun, C.-Y.; Liu, B.; Wang, X.; Ma, Z.-W.; Maa, Q.-L.; Yang, L.-Y.; Chen, G.-J.; Li, Q.-P.; Li, S.; et al. Methane recovery from natural gas hydrate in porous sediment using pressurized liquid CO2. Energy Convers. Manag. 2013, 67, 257–264. [Google Scholar] [CrossRef]
  30. Kawasaki, T.; Ukita, T.; Fujii, T.; Noguchi, S.; Ripmeester, J.A. Particle size effect on the saturation of methane hydrate in sediments—Constrained from experimental results. Mar. Pet. Geol. 2011, 28, 1801–1805. [Google Scholar]
  31. Birkedal, K.A.; Hauge, L.P.; Graue, A.; Ersland, G. Transport Mechanisms for CO2-CH4 Exchange and Safe CO2 Storage in Hydrate-Bearing Sandstone. Energies 2015, 8, 4073–4095. [Google Scholar] [CrossRef] [Green Version]
  32. Wang, Z.; Wan, Y.; Liu, L.; Qingtao, B.U.; Wang, Z.; Mao, P.; Gaowei, H.U. Research advances in gas-water relative permeability of hydrate-bearing sediments. Mar. Geol. Front. 2022, 38, 14–29. [Google Scholar]
  33. Kuang, Y.; Zhang, L.; Song, Y.; Yang, L.; Zhao, J. Quantitative determination of pore-structure change and permeability estimation under hydrate phase transition by NMR. AIChE J. 2020, 66, e16859. [Google Scholar] [CrossRef]
  34. Kumar, A.; Maini, B.; Bishnoi, P.R.; Clarke, M.; Zatsepina, O.; Srinivasan, S. Experimental determination of permeability in the presence of hydrates and its effect on the dissociation characteristics of gas hydrates in porous media. J. Pet. Sci. Eng. 2010, 70, 114–122. [Google Scholar] [CrossRef]
  35. Dangayach, S.; Singh, D.N.; Kumar, P.; Dewri, S.K.; Singh, J. Thermal instability of gas hydrate bearing sediments: Some issues. Mar. Pet. Geol. 2015, 67, 653–662. [Google Scholar] [CrossRef]
  36. Xu, J.; Bu, Z.; Li, H.; Li, S.; Sun, B. Pore-scale flow simulation on the permeability in hydrate-bearing sediments. Fuel J. Fuel Sci. 2022, 312, 122681. [Google Scholar] [CrossRef]
  37. Winters, W.J.; Pecher, I.A.; Waite, W.F.; Mason, D.H. Physical properties and rock physics models of sediment containing natural and laboratory-formed methane gas hydrate. Am. Mineral. 2004, 89, 00001221–00001227. [Google Scholar] [CrossRef]
  38. Jin, G.; Shuanshi, F.; Deqing, L.; Lihua, W.; Dongliang, L. Overview of Natural Gas Hydrate Exploration and Development. Adv. New Energy Renew. Energy 2019, 7, 10. [Google Scholar]
  39. Li, C.; Liu, C.; Hu, G.; Sun, J.; Hao, X.; Liu, L.; Meng, Q. Investigation on the multi-parameter of hydrate-bearing sands using nanofocus X-ray computed tomography. J. Geophys. Res. Solid Earth 2019, 124, 2296. [Google Scholar] [CrossRef]
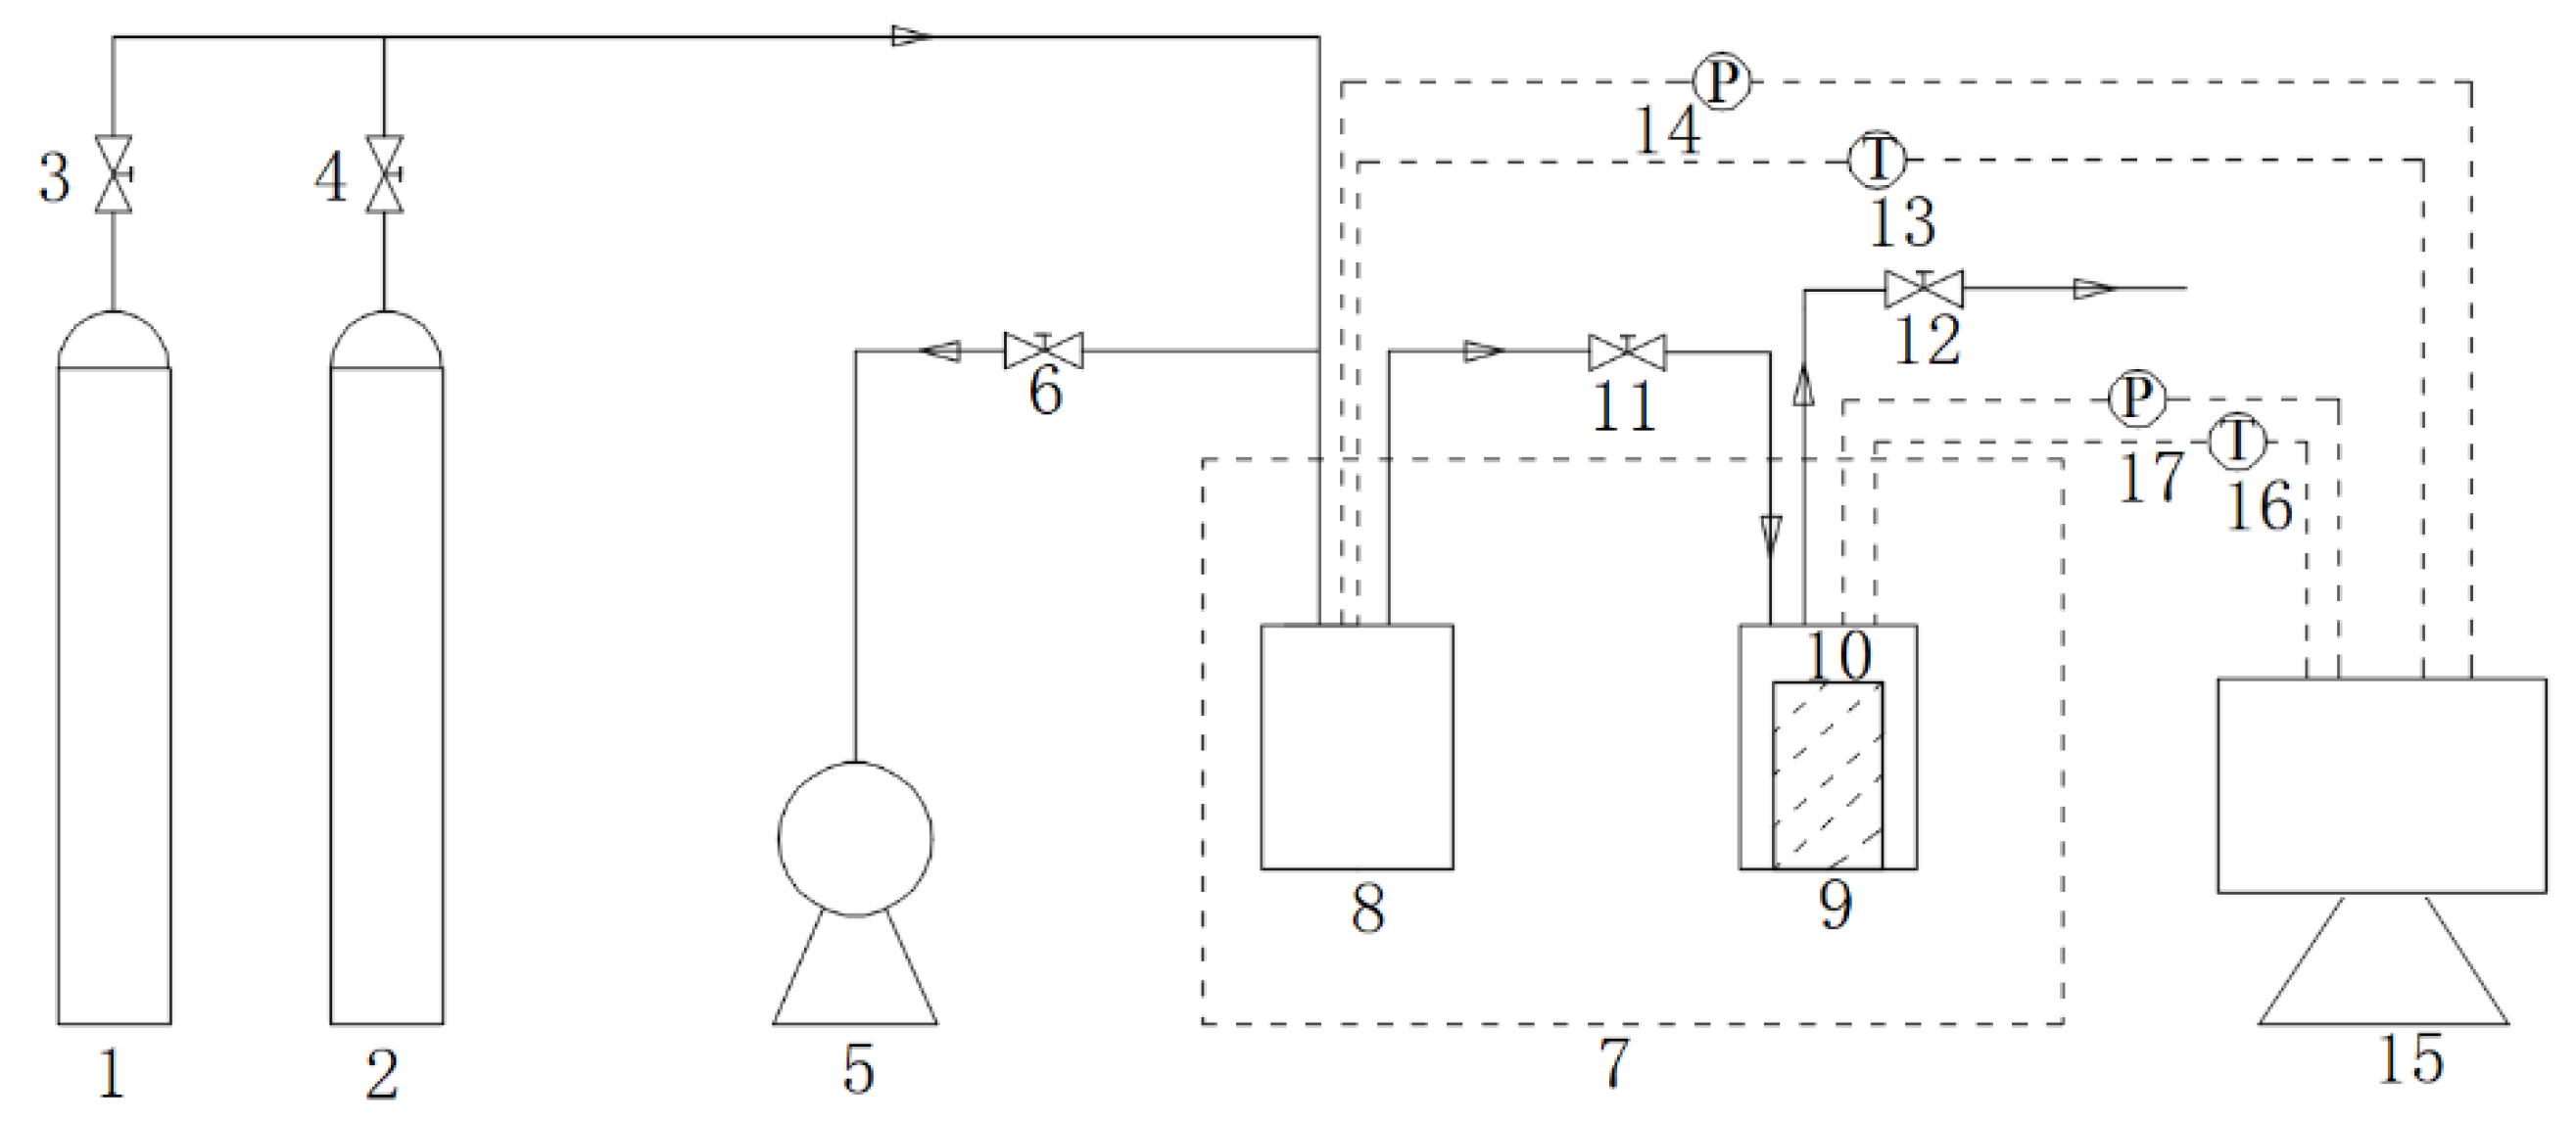
Figure 1. Experimental apparatus for replacing CH4 from hydrate using CO2. 1: methane cylinder; 2: carbon dioxide; 3, 4, 6, 11, and 12: valve; 5: vacuum pump; 7: water bath; 8: buffer tank; 9: reactor; 10: sand; 13 and 16: temperature transducer; 14 and 17: pressure transducer; 15: computer.
Energies 16 03154 g001
Figure 2. Scanning electron microscope (SEM) images of natural sand at different magnifications.
Energies 16 03154 g002
Figure 3. Variation in pressure with time during the replacement process for Experiments 1, 2, 3, and 4.
Energies 16 03154 g003
Figure 4. Variation in pressure with time during the replacement process for Experiments 5, 6, 7, and 8.
Energies 16 03154 g004
Figure 5. Storage efficiency of CO2 in the replacement reaction in Experiments 1, 2, 3, and 4.
Energies 16 03154 g005
Figure 6. Storage efficiency of CO2 in the replacement reaction in Experiments 5, 6, 7, and 8.
Energies 16 03154 g006
Figure 7. Variation in the total gas content in the reactor for Experiments 1, 2, 3, and 4.
Energies 16 03154 g007
Figure 8. Variation in the gas content in the gas phase for Experiments 1, 2, 3, and 4.
Energies 16 03154 g008
Figure 9. Variation in the total gas content in the reactor for Experiments 5, 6, 7, and 8.
Energies 16 03154 g009
Figure 10. Variation in the gas content in the gas phase for Experiments 5, 6, 7, and 8.
Energies 16 03154 g010
Figure 11. The recovery efficiency and replacement amount of CH4 for Experiments 1, 2, 3, and 4.
Energies 16 03154 g011
Figure 12. The recovery efficiency and replacement amount of CH4 for Experiments 5, 6, 7, and 8.
Energies 16 03154 g012
Table 1. Properties of natural river sand.
NumberMedian Particle Size (μm)Porosity (%)
110144.68
216643.08
327942.01
437741.38
Table 2. Hydrate formation at different particle sizes.
NO.Median Particle Size (μm)Water
Saturation (%)
Initial Hydrate Saturation (%)Residual Water Weight (g)CH4
Consumption (mol)
Exp.11013016.26.250.0552
Exp.21663017.16.150.0581
Exp.32793016.06.230.0550
Exp.437730 16.56.20.0556
Table 3. Hydrate formation at different initial water saturations.
NO.Median Particle Size (μm)Water
Saturation (%)
Initial Hydrate
Saturation (%)
Residual Water Weight (g)CH4 Consumption (mol)
Exp.5377205.66.230.0192
Exp.63773016.56.200.0556
Exp.73774028.36.180.0976
Exp.837750 39.26.240.1340
Disclaimer/Publisher’s Note: The statements, opinions and data contained in all publications are solely those of the individual author(s) and contributor(s) and not of MDPI and/or the editor(s). MDPI and/or the editor(s) disclaim responsibility for any injury to people or property resulting from any ideas, methods, instructions or products referred to in the content.