Article

Power Generation and Microbial Community Shift According to Applied Anodic Potential in Electroactive Biofilm Reactors Treating Synthetic and Domestic Wastewater

1
Institute for Environment and Energy, Pusan National University, Busan 46241, Republic of Korea
2
Department of Civil and Environmental Engineering, Pusan National University, Busan 46241, Republic of Korea
3
Busan Health and Environmental Research Center, Busan 46616, Republic of Korea
4
Environmental Technology Team, Key Industry Research Institute, Korea Testing & Research Institute, Ulsan 44412, Republic of Korea
*
Author to whom correspondence should be addressed.
Energies 2022, 15(24), 9459; https://doi.org/10.3390/en15249459
Submission received: 8 November 2022 / Revised: 11 December 2022 / Accepted: 12 December 2022 / Published: 13 December 2022

Abstract

:
This study investigated the effect of initially set anodic potentials (−0.3, −0.2, −0.1 and +0.1 V) on voltage production and microbial community in electroactive biofilm reactors (EBRs) treating synthetic and domestic wastewater (WW). In phase 1, EBRs were acclimated with different anodic potentials for synthetic and domestic WW. EBR (SE4) poised with +0.1 V showed the highest maximum power density (420 mW/m2) for synthetic WW, while EBR (DE3) poised with −0.1 V showed the highest maximum power density (235 mW/m2) for domestic WW. In phase 2, the EBRs were operated with a fixed external resistance (100 Ω for synthetic WW and 500 Ω for domestic WW) after the applied potentials were stopped. The EBRs showed slightly different voltage productions depending on the WW type and the initial anodic potential, but both EBRs applied with +0.1 V for synthetic (SE4) and domestic (DE4) WW showed the highest voltage production. Principal component analysis results based on denaturing gel gradient electrophoresis band profiles showed that the microbial community was completely different depending on the WW type. Nevertheless, it was found that the microbial community of EBRs applied with a negative potential (−0.3, −0.2, and −0.1 V) seemed to shift to those of EBRs applied with a positive potential (+0.1 V) regardless of WW type. Therefore, positive anodic potential is an important operating factor in electroactive biofilm development and voltage generation for rapid start-up.

1. Introduction

Electroactive biofilm reactor (EBR) has received considerable attention as a process that can produce electric energy or useful substances from organic matter in wastewater (WW) using bacteria as catalysts [1]. However, the electricity generation performance of the EBR is very low compared to that of general chemical fuel cells using hydrogen. Accordingly, the goal of the EBR is to expand from the laboratory scale to the real scale, which can be applied to the field and produce stable power when operated for a long period [2,3].
Various factors, including reactor configuration, material (anode, cathode, and separator), operating conditions, substrate type, and electroactive bacteria, affect the EBR performance [3]. In addition, the electricity generation of EBR is affected by the interaction between the electrode surface area and bacteria; therefore, it is important to understand the electroactive bacteria in electroactive biofilms [4,5].
In particular, the anode potential is a very important factor because it is related to the energy that bacteria can theoretically obtain [6]. The higher the anode potential in the total cell voltage, the more energy the bacteria use for metabolism, and consequently, the less the energy that can be recovered from the EBR. Therefore, when the lower anode potential is set, the power recovery rate that can be obtained from the EBR can be increased [5].
However, although various studies on the anode potential have been reported, it has not been clearly determined which potential (negative or positive potential) is better for EBR performance. When a high anode potential was applied, the start-up period was shortened, and a higher power density could be produced compared to the low potential [7]. Among EBR poised with 0, +0.2, +0.35 and +0.5 V (vs. Ag/AgCl), EBR poised with +0.5 V showed the highest current production, but EBR poised with above 0.75 V did not generate current [8]. An EBR applied with a positive anode potential showed rapid start-up [9] and higher current production [10], while among EBR poised with 0, −0.2, and −0.4 V (vs. Ag/AgCl), voltage and current increased at −0.2 V [6]. In another study in which different potential (−0.42, −0.36, −0.25, and +0.1 V vs. Ag/AgCl) were applied, EBR with the lowest potential, −0.42 and −0.36 V, showed high currents and a thick biofilm. In addition, Geobacter sulfurreduces known as electroactive bacteria were predominant in EBR applied −0.42 and −0.36 V [11]. Most recently, the negative potential accelerated the start-up speed and enhanced the EBR performance [12].
Most studies have used a single carbon source such as acetate, which is easy to use by electroactive bacteria, and there is still a lack of research on the effect of applied anode potential on electricity generation and the microbial community when used actual WW are still lacking. Therefore, in this study, the voltage production and microbial community according to initially applied anode potential (−0.3, −0.2, −0.1 and +0.1 V vs. Ag/AgCl) were compared for synthetic and actual WW.

2. Materials and Methods

2.1. EBR Construction

Eight cubic-typed single-chamber EBRs (working volume 260 mL) were constructed as previously described [13]. Graphite felt (30 mm × 30 mm) was used as the anode, a same-sized 30% wet-proof carbon cloth (E-Tek, BASF Fuel Cell Inc., College Station, TX, USA) treated with a Pt/C catalyst (0.5 mg/cm2, anode side) and a Nafion solution (5%, air side) was utilized as the cathode, and a polypropylene non-woven fabric (Korea Non-Woven Tech. Co., Ltd., Busan, Republic of Korea) was used as separator [14]. The anode and cathode were connected with a titanium wire.

2.2. Batch Test

The anode chamber was inoculated with anaerobic digested sludge (3000 mg/L) obtained from an anaerobic digester of a domestic WW treatment plant (Suyoung Wastewater Treatment Plant, Busan, Republic of Korea) and acclimated under anaerobic conditions. To investigate the effect of the initially applied potential on voltage generation and the microbial community, the experiment was conducted in two phases (Table 1 and Figure 1). In phase 1, the EBRs were operated according to initially applied potential (−0.3, −0.2, −0.1 and +0.1 V) for 50 days and then operated with an external resistance of 100 Ω in phase 2. Synthetic and domestic WW (Haeundae Wastewater Treatment Plant, Busan, Republic of Korea) were used as substrates. The substrate was changed when the voltage generation decreased to less than 50 mV. All experiments were performed in duplicate, at room temperature (25 ± 2 °C), in fed-batch mode. The synthetic WW consisted of CH3COONa, 0.18 g/L (as COD 150 mg/L) K2HPO4, 4.35 g/L; KH2PO4, 3.38 g/L; NH4Cl, 0.115 g/L; NaCl, 0.04 g/L; MgSO4·7H2O, 0.01 g/L; CaCl2·2H2O, 0.02 g/L; KCl, 0.02 g/L; and yeast extract, 0.005 g/L.

2.3. Analysis

Chemical oxygen demand (COD) was analyzed using a kit (Humas Co. Ltd., Daejeon, Republic of Korea) according to the standard method (APHA, 2005). The voltage across the external resistor in the EBR circuit was measured using a data acquisition system (2700, Keithley Instruments, Solon, OH, USA) and recorded every 50 s on a personal computer. In phase 1, the initially applied potentials (vs. Ag/AgCl electrode) were controlled using a potentiostat (WMPG 1000, WonATech, Seoul, Republic of Korea). The maximum power density (mW/m2) was determined by the linear sweep voltammetry, which was performed at 10 mV/s using a potentiostat (WMPG1000, WonATech, Seoul, Republic of Korea).

2.4. Microbial Community Analysis

The anodic biofilm of the EBRs was collected and DNA was extracted using a PowerSoilTM DNA extraction kit (Mo Bio Lab., Carlsbad, CA, USA). Bacterial 16S rRNA genes were amplified using the EUB 27F and 518R primers. Denaturing gradient gel electrophoresis (DGGE) was performed. The band profile was visualized using an ultraviolet transilluminator (Uvitec, Cambridge, UK) and photographed using a digital camera (Olympus 720 UZ; Olympus Optical Co., Ltd., Tokyo, Japan). The band positions and intensities in the DGGE profiles were determined using Fingerprinting II Informatix software (Bio-Rad, Hercules, CA, USA).
Principal component analysis (PCA) was performed to identify relationships in the band profile using the SPSS software (version 14.0; SPSS Inc., Chicago, IL, USA). DNA fragments extracted from the DGGE band profile were polymerase chain reaction (PCR) amplified using the same primers as those used for PCR amplification in the DGGE experiments. The fragments were sequenced on an ABI 3730XL capillary DNA sequencer (Applied Biosystems, Waltham, MA, USA) by a professional company (Solgent Co., Daejeon, Republic of Korea). The sequence results were analyzed using the GenBank database, and phylotype identification was performed based on 16S rDNA sequence homology.

3. Results and Discussion

3.1. Voltage Generations in EBRs According to Initially Applied Voltages

EBRs poised with different anodic potentials were acclimated in phase 1 for approximately 50 days. The EBR showed a slightly different performance according to the WW type and applied potential. In the synthetic WW, SE4 showed the highest maximum power density of 450 mW/m2, followed by 231 mW/m2 for SE3, 206 mW/m2 for SE2, and 153 mW/m2 for SE1, while in domestic WW, DE1 showed the highest maximum power density of 250 mW/m2, followed by 155 mW/m2 for DE4, 91.5 mW/m2 for DE3, and 40 mW/m2 for DE2 (Figure 2).
In phase 2, EBRs treating synthetic WW and domestic WW also showed slightly different voltage production trends depending on the initially applied potential (Figure 3). In the case of the synthetic WW (Figure 3a), SE4 showed the highest voltage generation (290 ± 17 mV), followed by SE2 (210 ± 62 mV), SE3 (170 ± 24 mV), and SE1 (106 ± 14 mV). As seen in Figure 3a, in the case of domestic WW, a slightly different trend is observed. DE4 also exhibited the highest voltage generation (140 ± 25 mV), followed by DE1 (62 ± 38 mV), DE2 (25 ± 7 mV), and DE3 (18 ± 4 mV). In this study, regardless of WW type, it is expected to be advantageous to supply a potential of +0.1 V (vs. Ag/AgCl) for the start-up of EBR. Similarly, start-up time was reduced from 59 days to 35 days and current output was increased from 0.42 to 3 mA in EBR poised with +0.2 V (vs. Ag/AgCl) because of the increase in the driving force of substrate oxidation [10].
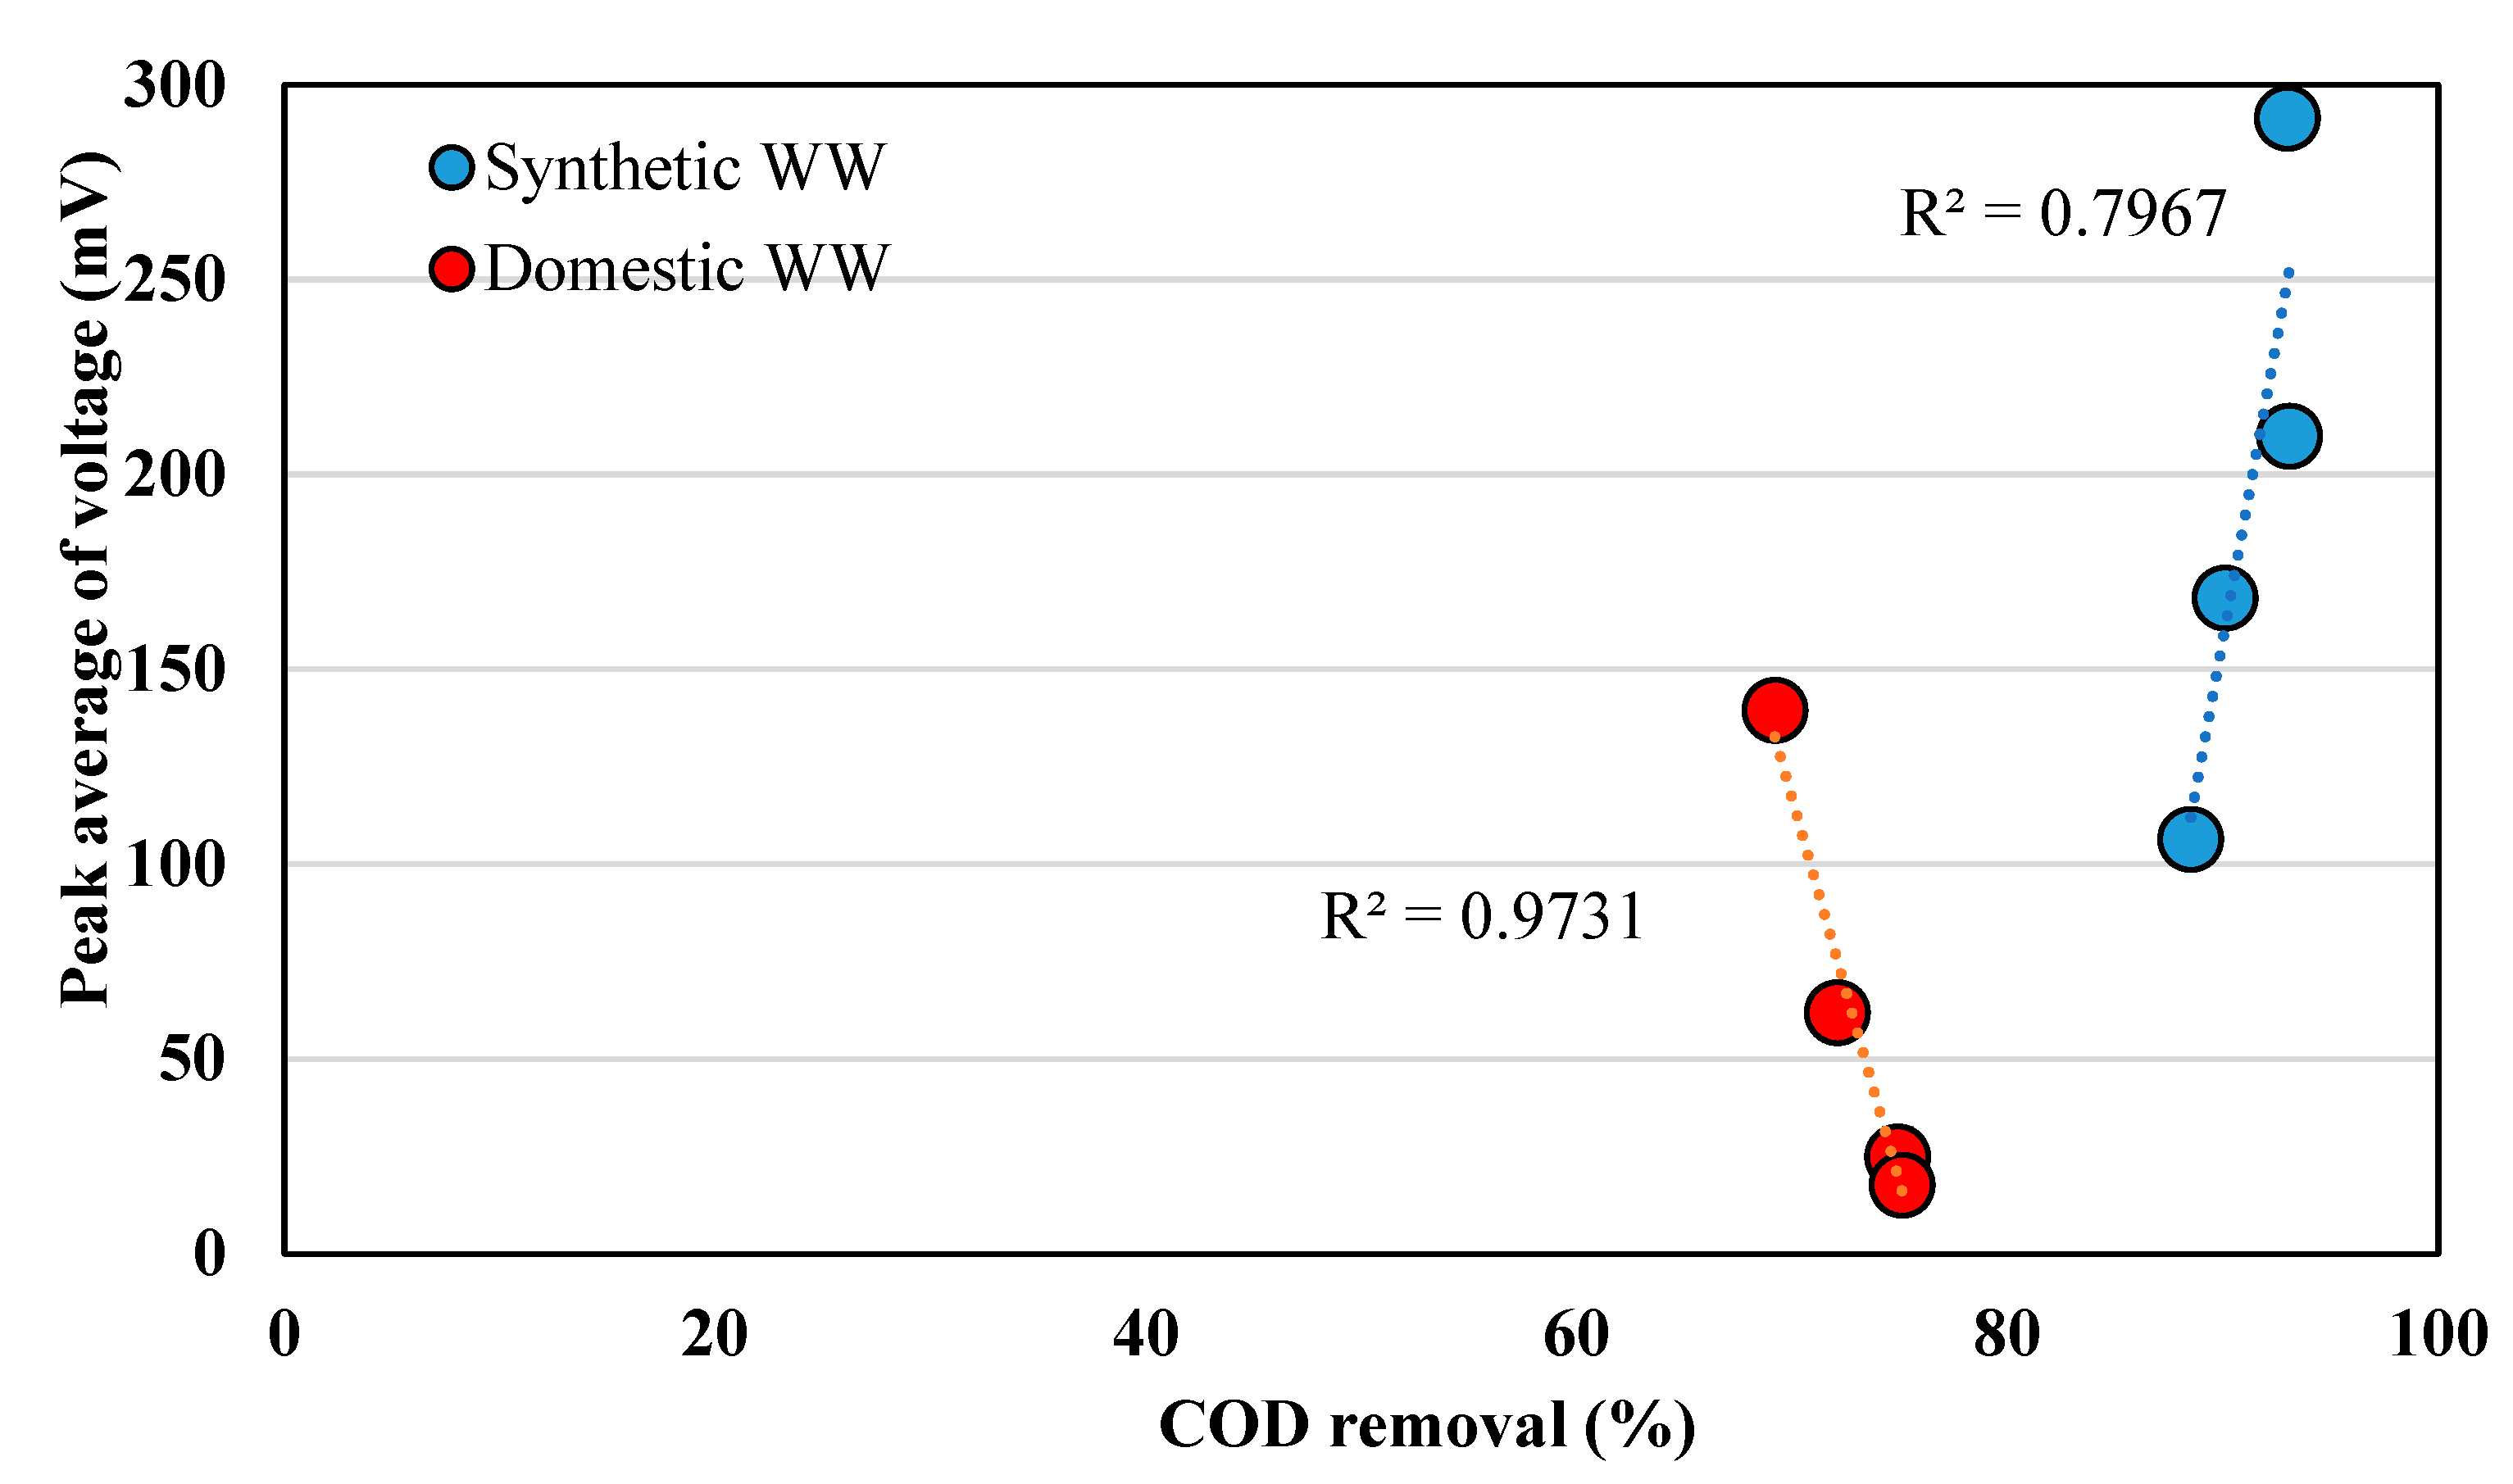
The power generation of EBR treating domestic WW was generally lower than that of EBR treating synthetic WW. This appears to have been limited by complex organic matter (e.g., non-biodegradable organics), low conductivity [15], inhibition of electron acceptors other than the anode [16], and competition with non-electroactive bacteria for organic matter utilization [17]. EBRs (70–75%) treating domestic WW showed lower COD removal than EBRs (89–93%) treating synthetic WW (Figure 3b). As COD removal increased, the voltage of the EBR using synthetic WW increased, but the voltage of the EBR using domestic WW decreased (Figure 4). This means that the COD removed in the EBR using synthetic WW might be utilized for electricity generation, but the COD removed in the EBR using domestic WW does not seem to be utilized well for electricity generation.

3.2. Anodic Microbial Community in EBRs Treating Synthetic WW

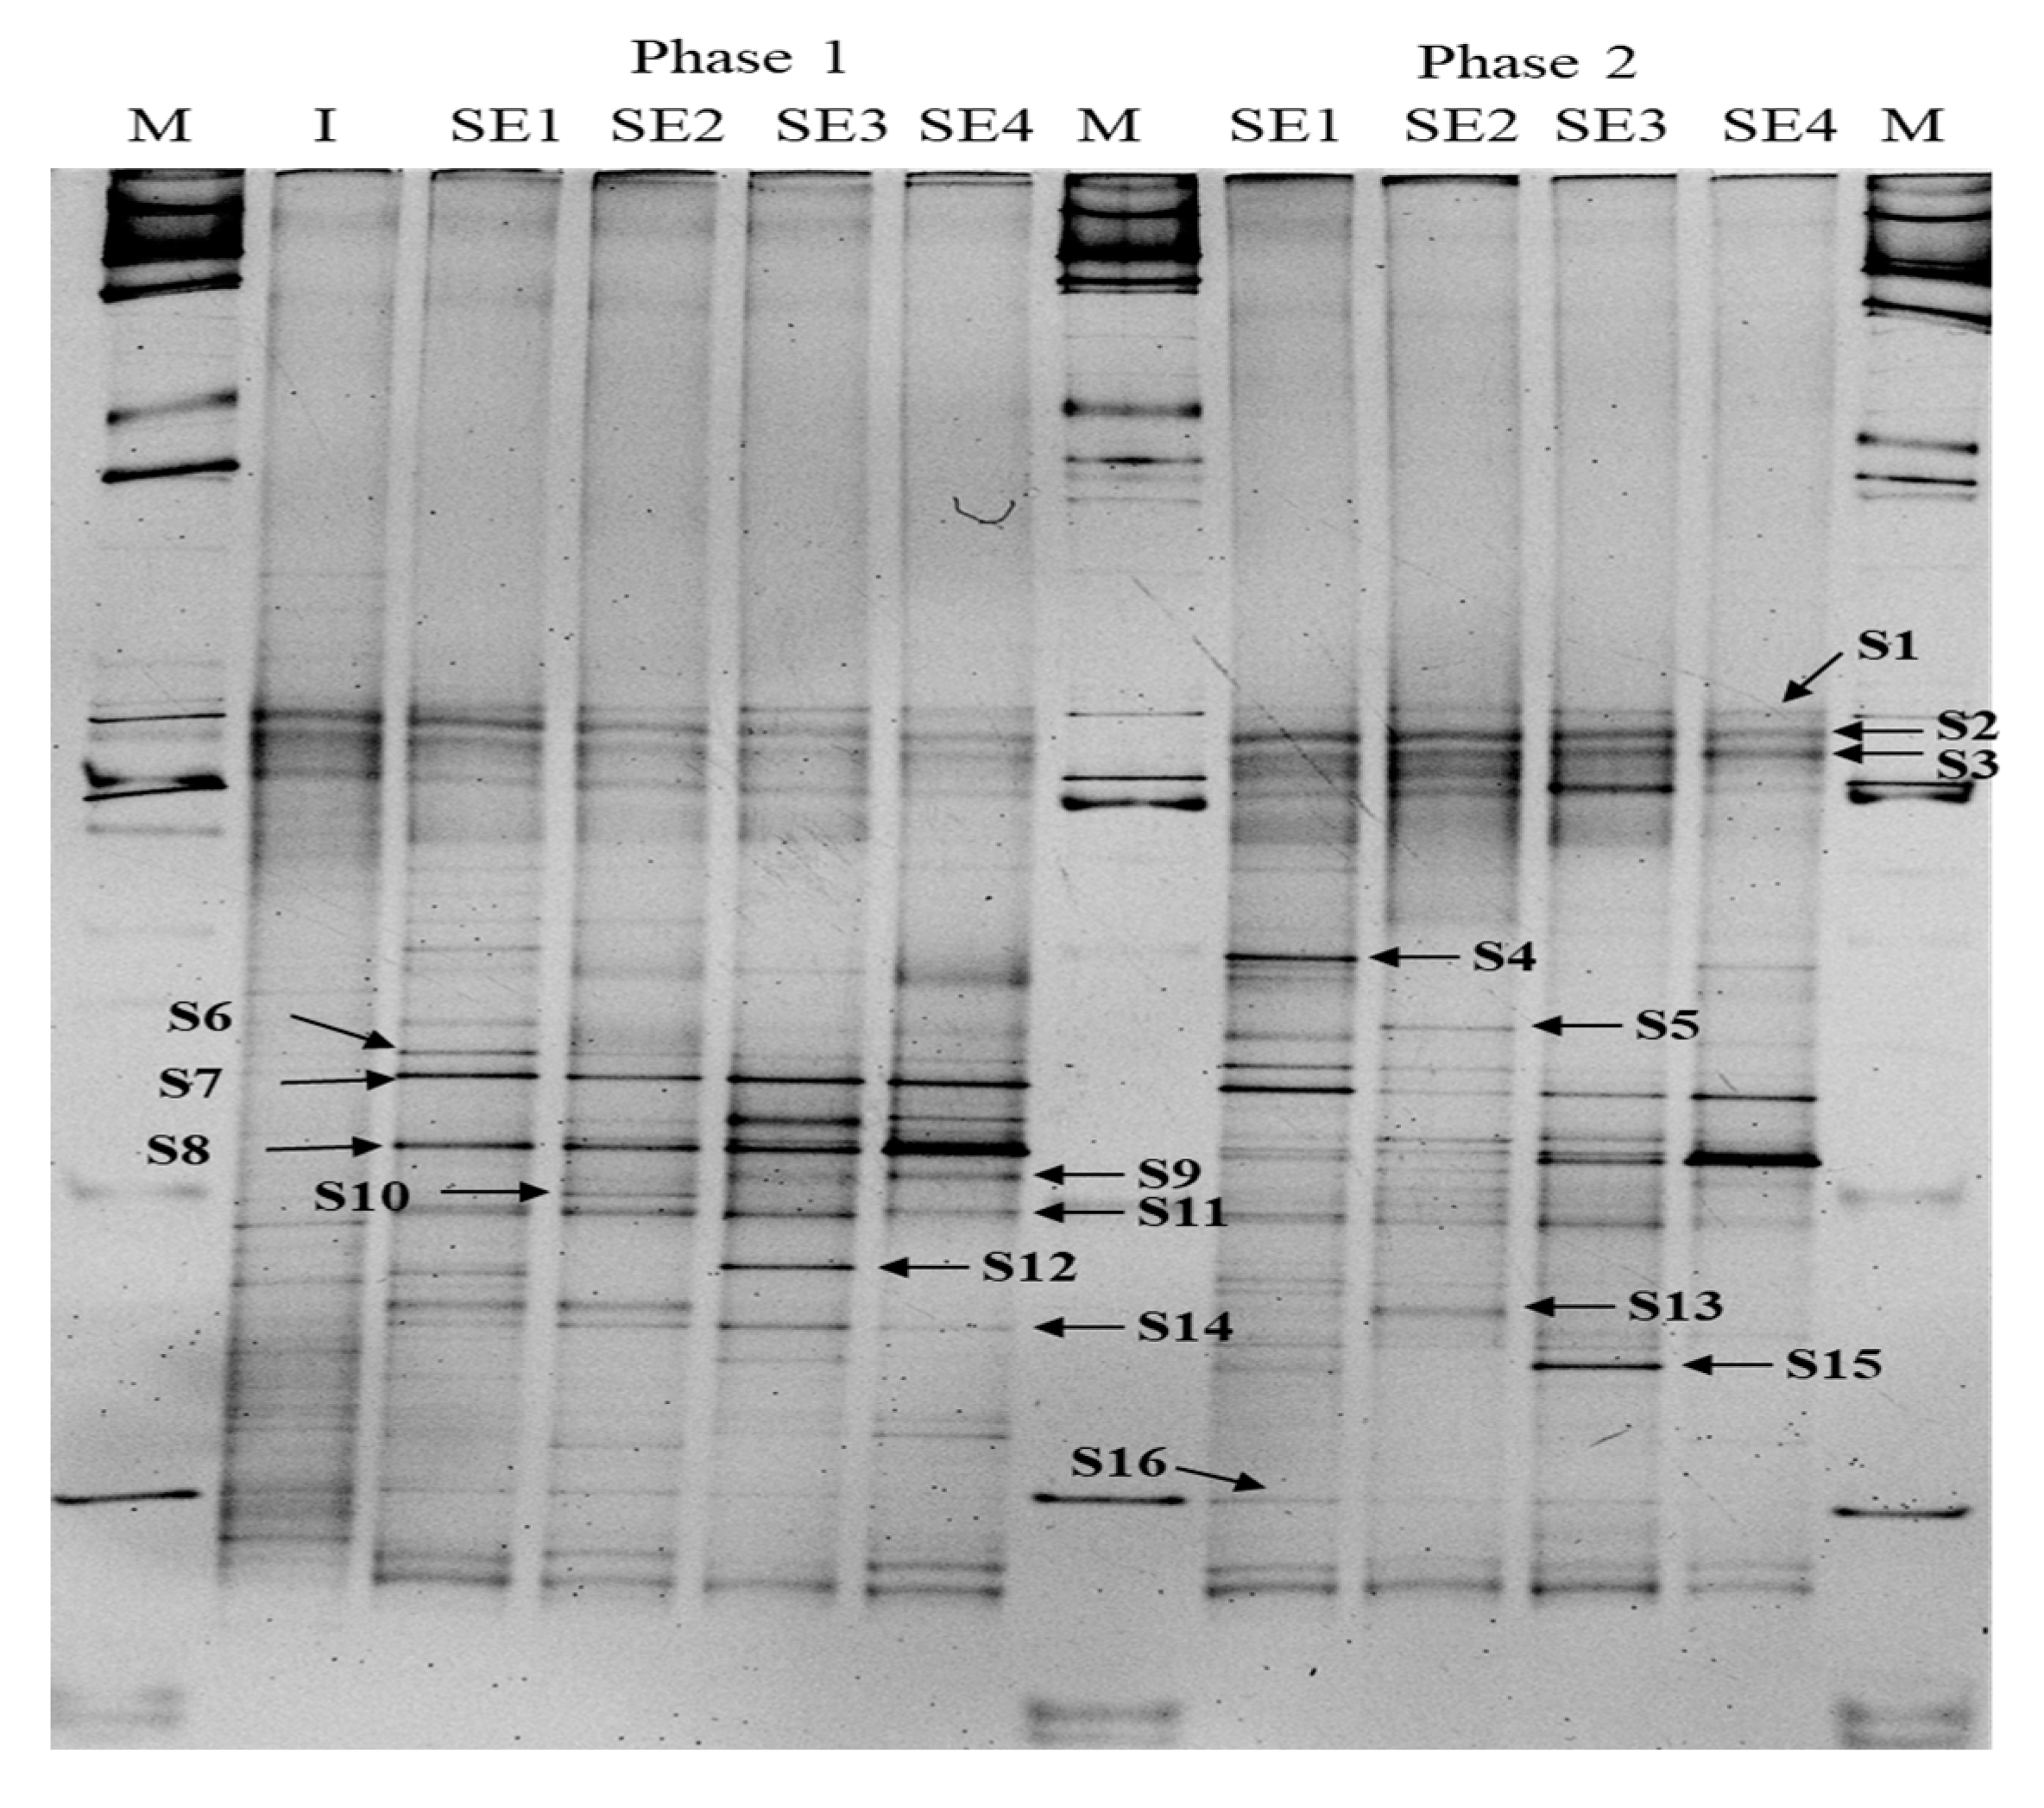
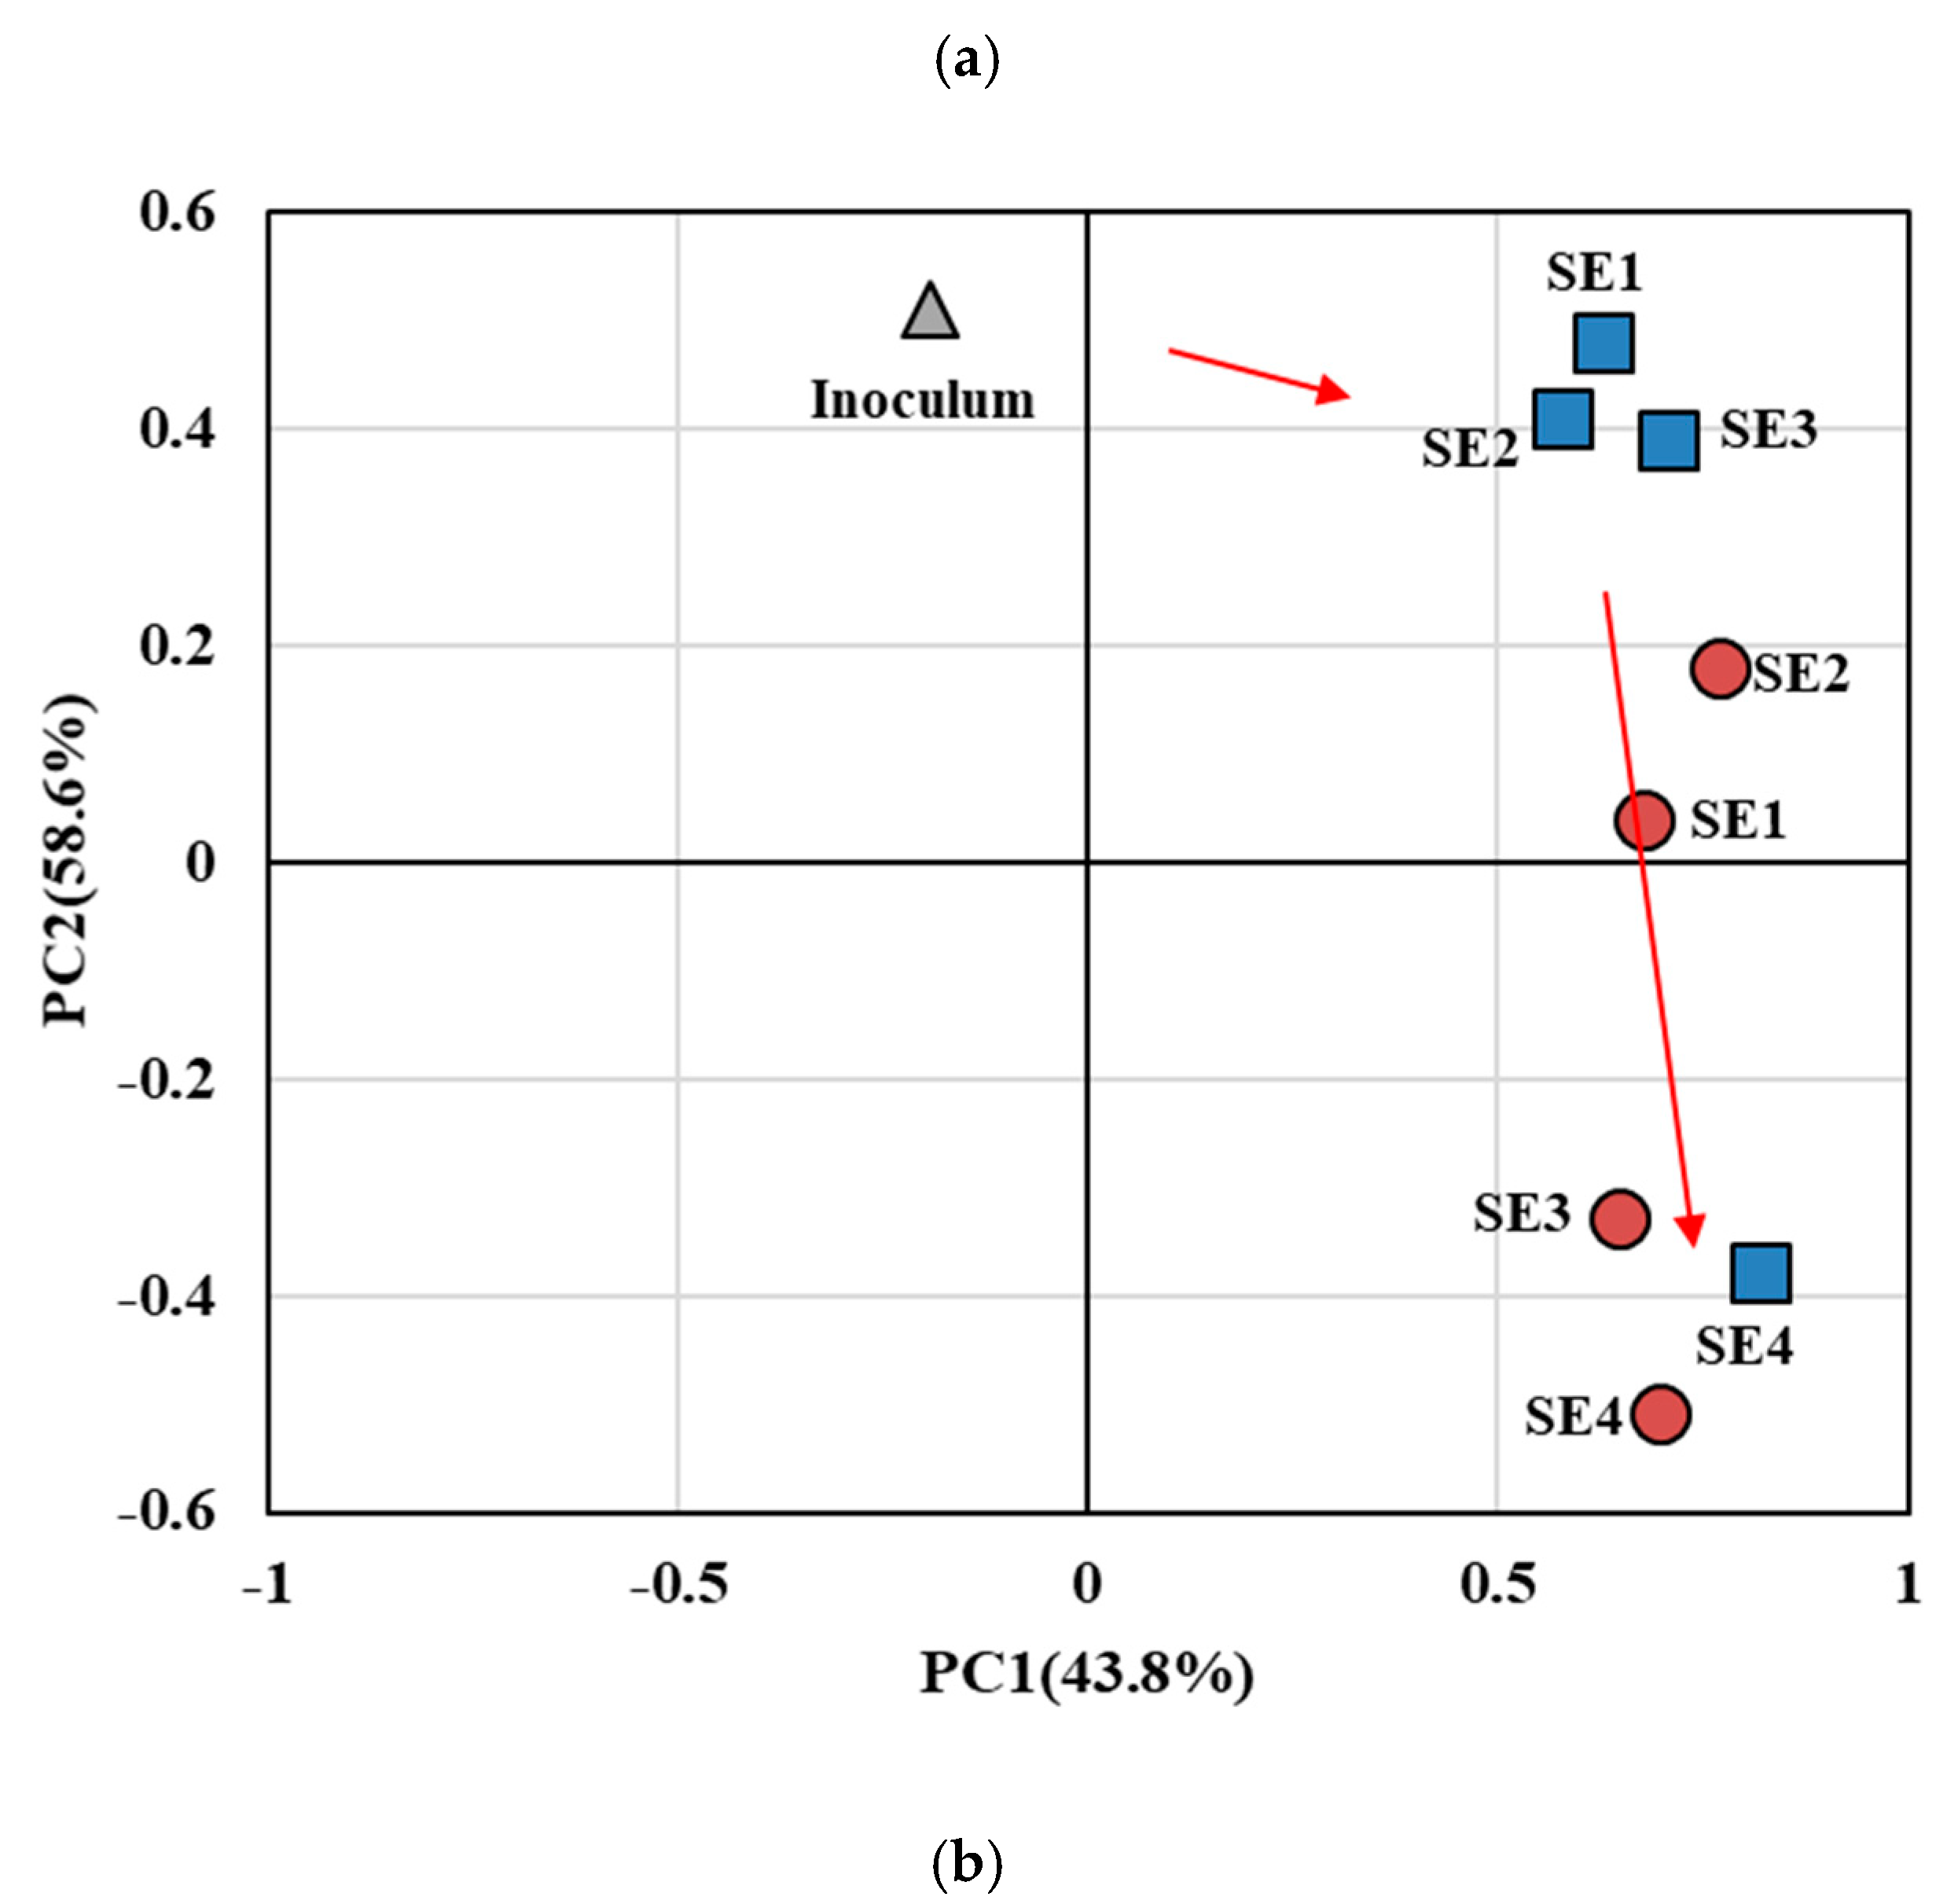
The anodic microbial community in the EBR treating synthetic WW differed in phase 1 and 2 depending on the initially applied potential (Figure 5a). PCA results based on DGGE profiles showed that the microbial communities of SE1, SE2, SE3, and SE4 were completely different in phase 1. In phase 2, the microbial communities of SE1, SE2, and SE3 were similarly shifted. However, the microbial community in SE4 did not significantly change (Figure 5b). This positive potential might contribute to the development of the electroactive biofilms.
As bands S1, S2, S3, and S16 detected in the inoculum were also found in all EBRs, they were related to organic oxidation or fermentation. While other bands were strong only in EBRs, they were involved in electricity generation. However, in the microbial community analysis, both S7 and S8 were dominant in phase 1, whereas in phase 2, S7 was dominant in E1 and S8 in E4. S7, which appeared to be similar to Zoogloea sp., was strongly found in E1, which had the lowest electricity generation, so it is expected to be unrelated to electricity generation (Table 2). On the other hand, S8, similar to Geobacter sp., known as electroactive bacteria, is related to electricity generation because it was found in E4 with the highest electricity generation.
In general, enzymes and electron transport chains can transfer electrons only through their potential for electron transport [6]. From a thermodynamic point of view, the higher the anode potential, the more energy bacteria gain. Therefore, as the potential of the anode increases, the growth rate of bacteria, and the production rate per transferred electron also increase. This intensifies competition among microorganisms for substrate use on the electrode surface, and it was determined that microorganisms with electron transfer ability in a specific potential range dominate.
Therefore, in this study, it is considered that Geobacter sp., known as an electroactive bacteria, was dominant in the competition between bacteria under the potential condition of +0.1 V (phase 1). In addition, because the potential favorable for electron transfer by Geobacter was stably maintained in phase 2, Geobacter sp. appeared to continue to dominate without significant changes in the microbial community.
In addition, uncultured bacterium clone MFC-GIST23, clone MFC GIST252 [18], Sphingomonas paucimobilis [19], and Pseudoxanthomonas [20] were mainly detected in EBR. Interestingly, Sphingomonas and Pseudoxanthomonas mainly detected in the cathode, could use an electrode as an electron acceptor. Some bacteria, such as Zoogloea and Shigella sp., can oxidize the carbon source into acids in the EBR [21].

3.3. Anodic Microbial Community in EBRs Treating Domestic WW

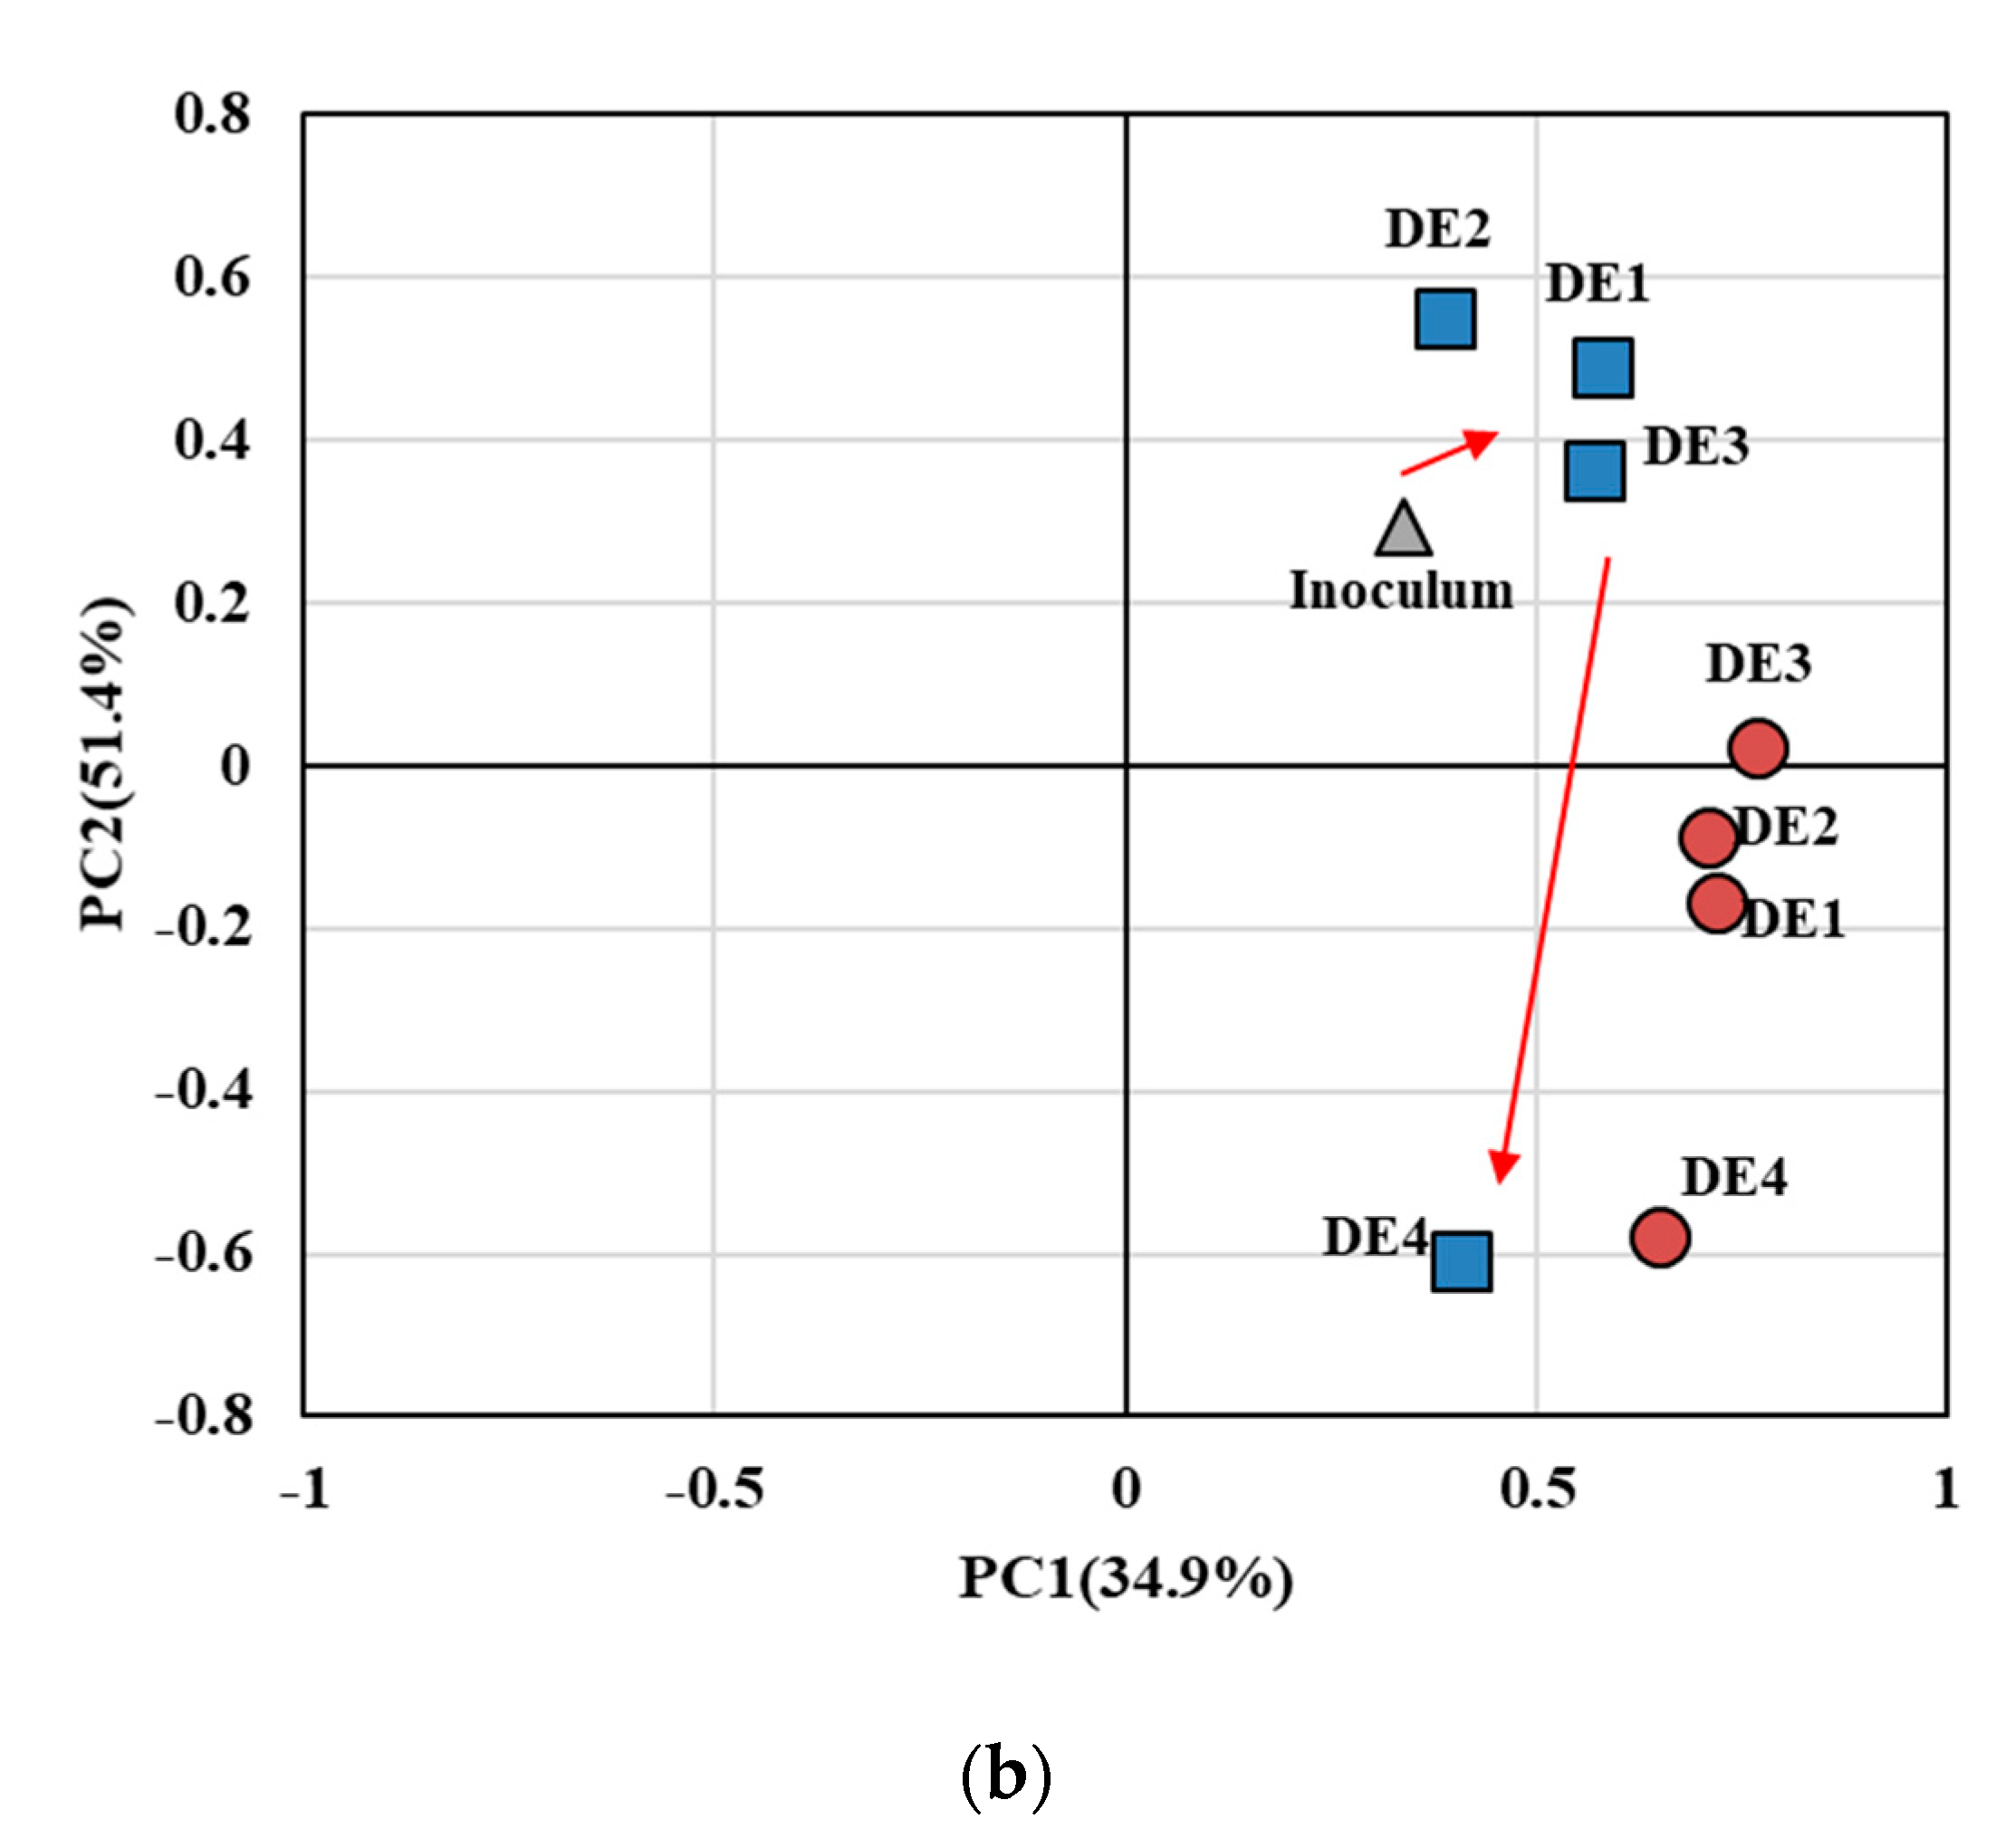
The anodic microbial community in the EBR treating domestic WW was also different in phases 1 and 2 depending on the initially applied potential (Figure 6a). As the applied potential increased, it was indirectly shown that the microbial community diversified because the number of bands increased. The PCA results showed that the microbial communities of DE1, DE2, and DE3 appeared to be similar to each other, but were completely different from the microbial community of DE4. In phase 2, the microbial communities of DE1, DE2, and DE3 were similarly shifted, but the microbial community of DE4 did not change significantly (Figure 6b). It also shows that the positive potential could help to develop electroactive biofilms in EBR treating domestic WW.
Bands R2, R3 and R7 were unlikely to be involved in electricity generation because they were detected in all EBRs in each phase and band R7 was only found in the inoculum. However, as bands R1, R5, R15, and R20 were detected in phase 2 or the band intensity was relatively increased, they seemed to be related to electricity generation. In particular, band R20 was similar to Desulforhabdus sp., which may play a role in electricity production from sulfide oxidation [22]. However, band R1 was similar to Chitinophaga may be related to the anaerobic environment [23] (Table 3).
Bacterial activity was significantly affected by acclimation anode potentials [24]. Previous studies have demonstrated that a positive poised applied potential promotes the enrichment of specific consortia and results in a larger current output [25,26].
As mentioned above, as the higher the anode potential, the more energy the bacteria gain, and the higher anodic potential seemed to contribute to electroactive biofilm development. Although the microbial community differed according to WW type, the microbial community of EBRs applied with negative potential (−0.3, −0.2, and −0.1 V) seemed to shift to the microbial community of EBRs applied with positive applied potential (+0.1 V). Thus, the initially applied potential would be an important factor in electroactive biofilm development in EBR.

4. Conclusions

This study investigated the effect of the initially anodic potential on the microbial community, voltage generation, and COD removal. The COD removal of EBR treating domestic WW was relatively lower than that of EBR treating synthetic WW, but there was little difference in COD removal depending on anodic potentials. EBR poised with a positive potential (+0.1 V) showed the highest voltage generation regardless of the WW type. The microbial community of the EBR applied with negative anodic potentials would be shifted to those of the EBR applied with a positive anodic potential. Therefore, the positive anodic potential may be an important operational factor in electroactive biofilm development and voltage generation for rapid start-up. Further studies on the effect of applied potential on power generation and microbial community shift through long-term operation are required, which will contribute to the practical application of EBR in WW treatment process.

Author Contributions

J.Y.: writing—original draft, visualization, writing—reviewing and editing; H.P.: methodology, writing, formal analysis, investigation; Y.P.: data curation; T.L.: supervision, funding acquisition, writing—reviewing and editing. All authors have read and agreed to the published version of the manuscript.

Funding

This study was supported financially by the National Research Foundation of Korea (NRF) grant funded by the Korea Government (MIST) (No. NRF-2018R1D1A1B07046741 and NRF-2021R1A6A1A03039572).

Data Availability Statement

Not applicable.

Conflicts of Interest

The authors declare no conflict of interest.

References

  1. Yu, J.; Widyaningsih, E.; Park, Y.; Lee, T. Nitrogen removal and microbial community diversity in single-chamber electroactive biofiom reactors with different ratios of the cathode surface area to reactor volume. Sci. Total Environ. 2021, 758, 143677. [Google Scholar] [CrossRef] [PubMed]
  2. Yu, J. Effects of a Hydraulic Series Connection and Flow Direction on Electricity Generation in a Stack Connected with Different Volume MFCs. Appl. Sci. 2021, 11, 1019. [Google Scholar] [CrossRef]
  3. Yu, J.; Park, Y.; Widyaningsih, E.; Lee, T. Microbial fuel cells L: Devices for real wastewater treatment, rather than elelctricity production. Sci. Total Environ. 2021, 775, 145904. [Google Scholar] [CrossRef]
  4. Catania, C.; Karbelkar, A.A.; Furst, A.L. Engineering the interface between electroactive bacteria and electrodes. Joule 2021, 5, 743. [Google Scholar] [CrossRef]
  5. Logan, B.E.; Rossi, R.; Ragab, A.; Saikaly, P.E. Electroactive microorganisms in bioelectrochemical systems. Nat. Rev. Microbiol. 2019, 17, 307–319. [Google Scholar] [CrossRef]
  6. Aelterman, P.; Freguia, S.; Keller, J.; Verstraete, W.; Rabaey, K. The anode potential regulates bacterial activity in microbial fuel cells. Appl. Microbiol. Biotechnol. 2008, 78, 409–418. [Google Scholar] [CrossRef]
  7. Wager, R.C.; Cal, D.F.; Logan, B.E. Optimal set anode potentials vary in bioelectrochemical systems. Environ. Sci. Technol. 2010, 44, 6036–6041. [Google Scholar] [CrossRef]
  8. Cho, E.J.; Ellington, A.D. Optimization of the biological component of a bioelectrochemical cell. Bioelectrochemicstry 2007, 70, 165–172. [Google Scholar] [CrossRef]
  9. Duman, C.; Basseguy, R.; Bergel, A. Electrochmical activity of Geobacter sulfurreducens biofilms on stainless steel anodes. Electrochim. Acta 2008, 53, 5235–5241. [Google Scholar] [CrossRef] [Green Version]
  10. Wang, X.; Feng, Y.; Ren, N.; Wang, H.; Lee, H.; Li, N.; Zhao, Q. Accelerated start-up of two-chambered microbial fuel cells: Effect of anodic positive poised potential. Electrochim. Acta 2009, 54, 1109–1114. [Google Scholar] [CrossRef]
  11. Torres, C.I.; Krajmalnik-Brown, R.; Rarameswaran, P.; Marcus, A.K.; Wanger, G.; Gorby, Y.A.; Rittmann, B.E. Selecting anode-respiring bacteria based on anode potential: Phylogentic, Electrochemical, and Microscopic characterization. Environ. Sci. Technol. 2009, 43, 9519–9524. [Google Scholar] [CrossRef] [PubMed]
  12. Ren, Z.; Ji, G.; Liu, H.; Yang, M.; Xu, S.; Ye, M.; Lichtfouse, E.K. Accelerated start-up and improved performance of wastwater microbial fuel cells in four circuit modes: Role of anodic potential. J. Power Sources 2022, 535, 231403. [Google Scholar] [CrossRef]
  13. Yu, J.; Park, Y.; Cho, H.; Chun, J.; Seon, J.; Cho, S.; Lee, T. Variations of electron flux and microbial community in air-cathode microbial fuel cells fed with different substrates. Water. Sci. Technol. 2012, 66, 748–753. [Google Scholar] [CrossRef] [PubMed]
  14. Yu, J.; Park, Y.; Lee, T. Effect of separator and inoculum type on electricity generation and microbial community in single-chamber microbial fuel cells. Bioprocess Biosyst. Eng. 2014, 37, 667–675. [Google Scholar] [CrossRef] [PubMed]
  15. Cheng, S.; Logan, B.E. Increasing power generation for scaling up single-chamber air cathode microbial fuel cells. Bioresour. Technol. 2011, 102, 4468–4473. [Google Scholar] [CrossRef] [PubMed]
  16. Lu, N.; Zhou, S.; Zhuang, L.; Zhang, J.; Ni, J. Electricity generation from starch processing wastewater using microbial fuel cell technology. Biochem. Eng. J. 2009, 43, 246–251. [Google Scholar] [CrossRef]
  17. Pandey, P.; Shinde, V.N.; Deopurkar, R.L.; Kale, S.P.; Patil, S.A.; Pant, D. Recent advances in the use of different substrates in microbial fuel cells toward wastewater treatment and simultaneous energy recovery. Appl. Energy 2016, 168, 706–723. [Google Scholar] [CrossRef]
  18. Chae, K.-J.; Choi, M.-J.; Lee, J.W.; Kim, K.-Y.; Kim, I.-S. Effect of different substrates on the performance, bacterial diversity, and bacterial viability in microbial fuel cells. Bioresour. Technol. 2009, 100, 3518–3525. [Google Scholar] [CrossRef]
  19. Najera, M.C.; Verea, L.; Lastres, O.; Mejía-López, M.; Hernández-Romano, J.; Sebastian, P.J. Electricity production in a two chamber microbial fuel cell with bioanodes and biocathodes catalyzed with gold. Fuel Cells 2020, 20, 762–768. [Google Scholar] [CrossRef]
  20. Yamamuro, A.; Kouzuma, A.; Abe, T.; Watanabe, K. Metagenomic analyses reveal the involvement of syntrophic consortia in methanol/electricity conversion in microbial cells. PLoS ONE 2014, 9, e98425. [Google Scholar] [CrossRef]
  21. Lay, C.-H.; Kokko, M.E.; Puhakka, J.A. Power generation in fed-batch and continuous up-flow microbial fuel cell from synthetic wastewater. Energy 2015, 91, 235–241. [Google Scholar] [CrossRef]
  22. Sun, M.; Tong, Z.-H.; Sheng, G.-P.; Chen, Y.-Z.; Zhang, F.; Mu, Z.-X.; Wang, H.-L.; Zeng, R.J.; Liu, X.-W.; Yu, H.-Q.; et al. Microbial communities involved in electricity generation from sulfide oxidation in a microbial fuel cell. Biosens. Bioelectron. 2010, 26, 470–746. [Google Scholar] [CrossRef] [PubMed]
  23. Wang, L.; Zhou, Y.; Peng, F.; Zhang, F.; Pang, Q.; Lian, J.; Zhang, Y.; Yang, F.; Zhu, Y.; Ding, C.; et al. Intensified nitrogen removal in the tidal flow constructed wetland-microbial fuel cell: Insight into evaluatino of denitrifying genes. J. Clean Prod. 2020, 264, 121580. [Google Scholar] [CrossRef]
  24. Zhu, X.M.; Tokash, J.C.; Hong, Y.; Logan, B.E. Controlling the occurrence of power overshoot by adapting microbial fuel cells to high anode potentials. Bioelectrochemistry 2013, 90, 30–35. [Google Scholar] [CrossRef] [PubMed]
  25. Finkelstein, D.A.; Tender, L.M.; Zeikus, J.G. Effect of electrode potential on electrode-reducing Microbiota. Environ. Sci. Technol. 2006, 40, 6990–6995. [Google Scholar] [CrossRef] [PubMed]
  26. Srikanth, S.; Mohan, S.V.; Sarma, P.N. Positive anodic poised potential regulates microbial fuel cell performance with the function of open and closed circuitry. Bioresour. Technol. 2010, 101, 5337–5344. [Google Scholar] [CrossRef] [PubMed]
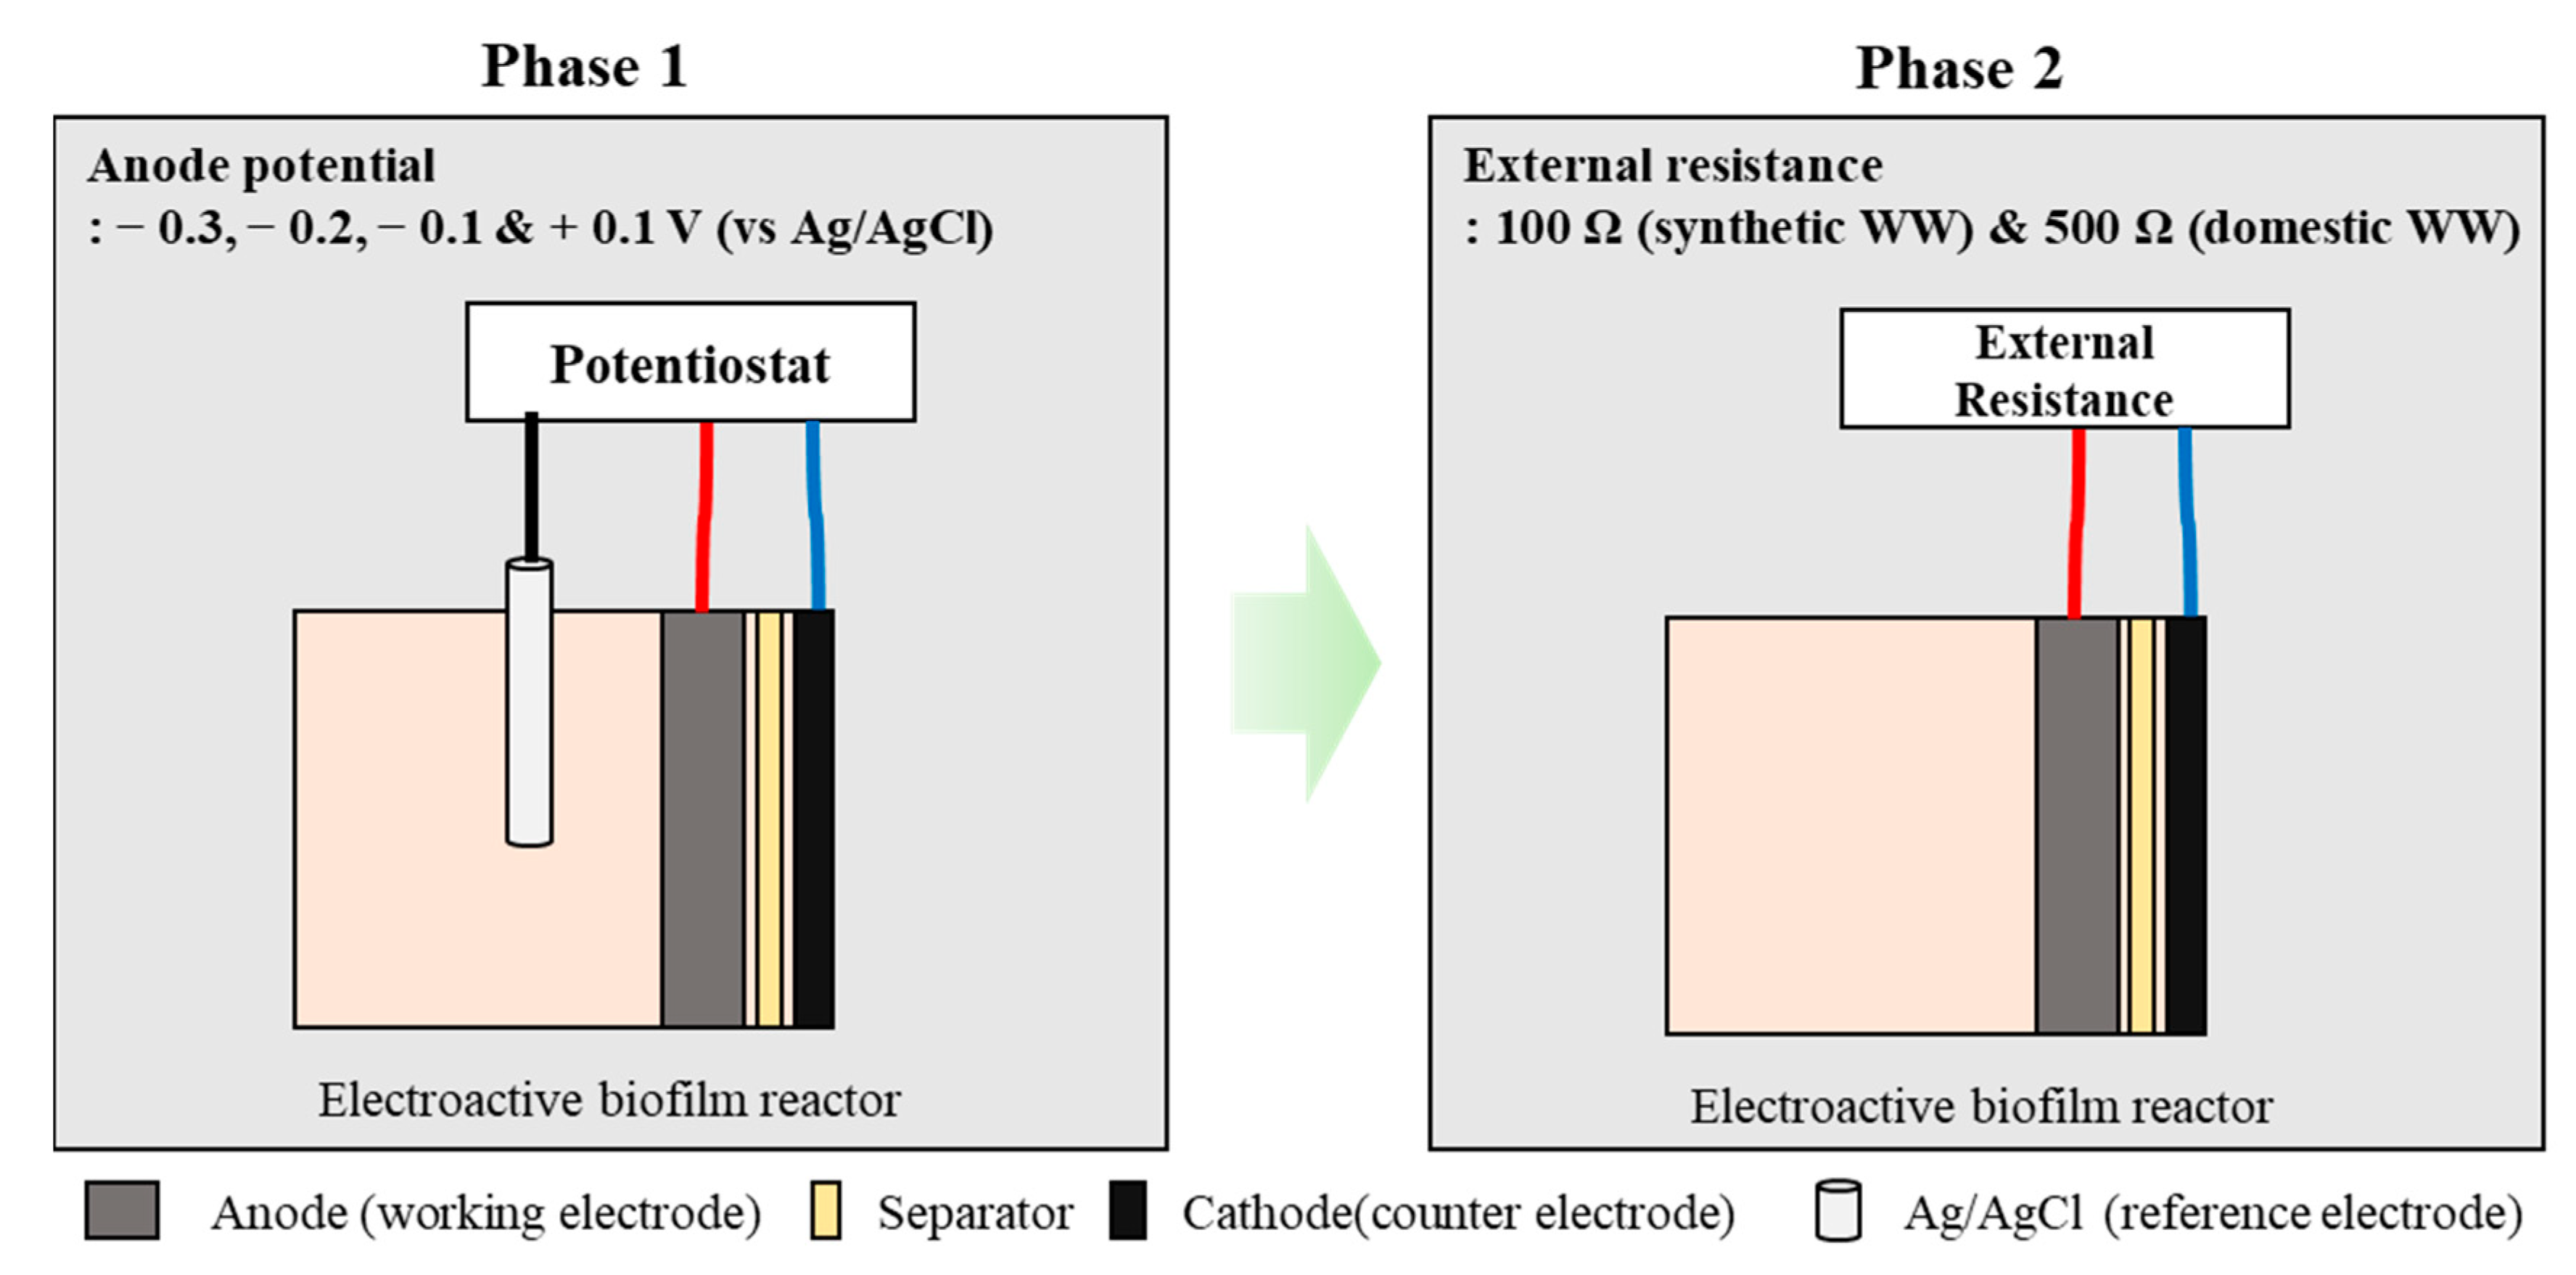
Figure 1. Experimental configuration of this study.
Energies 15 09459 g001
Figure 2. Polarization (a,b) and power (c,d) curves for EBRs treating synthetic (solid line) and domestic (dotted line) wastewater (WW); (a) polarization curve for synthetic WW, (b) polarization curve for domestic WW, (c) power curve for synthetic WW, and (d) power curve for domestic WW.
Energies 15 09459 g002
Figure 3. Peak average of voltage generation (a) and chemical oxygen demand (COD) removal (b) for 20 cycles of EBRs treating synthetic and domestic wastewaters (WWs) at phase 2 depending on initially anode potential.
Energies 15 09459 g003
Figure 4. Correlation between COD removal and peak voltage in EBR treating synthetic (blue) and domestic (red) WW.
Energies 15 09459 g004
Figure 5. Denaturing gradient gel electrophoresis (DGGE) profiles (a) and PCA based on DGGE profiles (b) of EBR treating synthetic wastewater (WW) at phases 1 (square) and 2 (circle); The red arrow indicates the shift direction of the microbial community.
Energies 15 09459 g005aEnergies 15 09459 g005b
Figure 6. DGGE profiles (a) and PCA based on DGGE profiles (b) of EBR using domestic WW at phases 1 (square) and 2 (circle); The red arrow indicates the shift direction of the microbial community.
Energies 15 09459 g006aEnergies 15 09459 g006b
Table 1. Operating conditions of electroactive biofilm reactors (EBRs) treating synthetic and domestic wastewater (WW).
EBRWW TypePhase 1Phase 2
Applied Anode Potential 1
(V)
External Resistance
(Ω)
Applied Anode Potential
(V)
External Resistance
(Ω)
SE1Synthetic WW−0.3NoNo100
SE2−0.2NoNo100
SE3−0.1NoNo100
SE4+0.1NoNo100
DE1Domestic WW−0.3NoNo500
DE2−0.2NoNo500
DE3−0.1NoNo500
DE4+0.1NoNo500
1 vs. Ag/AgCl.
Table 2. Sequence analysis of denaturing gradient gel electrophoresis (DGGE) bands for EBR using synthetic wastewater (WW).
BandThe Closet SequencePhylumSimilarityAcc. No.
S1Uncultured Geobacter sp.Proteobacteria97%AB717104
S2Uncultured bacterium clone MFC-GIST23Environmental samples97%EU704538
S3Uncultured Chloroflexi bacteriumChloroflexi97%JX023230
S4Zoogloea sp.Proteobacteria100%HQ694764
S5Uncultured Hyphomicrobiaceae
bacterium
Proteobacteria98%KF500830
S6Acidovorax sp.Proteobacteria99%Y18617
S7Zoogloea sp.Proteobacteria100%JQ751310
S8Geobacter sp.Proteobacteria99%GQ463728
S9Sphingomonas paucimobilisProteobacteria99%HE800592
S10Uncultured Pseudoxanthomonas sp.Proteobacteria99%JQ328218
S11Uncultured Shigella sp.Gammproteobacteria99%JF833726
S12Uncultured bacterium clone MFC-GIST252Environmental samples995GQ463728
S13Uncultured bacteriumEnvironmental samples98%GU908879
S14Uncultured bacteriumEnvironmental samples97%JX086768
S15ActinobacteriumActinobacteria97%FJ529700
S16Uncultured bacteriumEnvironmental samples98%AF255632
Table 3. Sequence analysis of DGGE bands for EBR using domestic WW.
BandThe Closet SequencePhylumSimilarityAcc. No.
R1Chitinophaga sp.Bacteroidota100%JF710262
R2Zoogloea sp.Proteobacteria99%HQ694764
R3Uncultured Chloroflexi bacteriumChloroflexi97%JX023230
R4Uncultured Hyphomicrobiaceae bacteriumProteobacteria99%KF500830
R5Uncultured bacteriumEnvironmental samples96%JQ096520
R6Uncultured bacteriumEnvironmental samples97%GU934266
R7Uncultured bacterium clone MFC-GIST2Environmental samples99%EU704531
R8Variovorax paradoxusProteobacteria99%AF508103
R9Uncultured bacteriumEnvironmental samples99%JN391943
R10Uncultured bacteriumEnvironmental samples99%FJ375463
R11Uncultured beta proteobacteriumProteobacteria98%GU013679
R12Uncultured bacterium clone MFC-GIST2Environmental samples99%EU704531
R13Uncultured bacteriumEnvironmental samples99%DQ444005
R14Uncultured bacteriumEnvironmental samples99%JX023223
R15Uncultured bacteriumEnvironmental samples99%GQ996483
R16Uncultured Thauera sp.Proteobacteria99%KX914702
R17Uncultured bacteriumEnvironmental samples99%GU083491
R18Thauera sp.Proteobacteria99%AY570693
R19Uncultuyed Aminanaerobia bacteriumEnvironmental samples99%CU926332
R20Desulforhabdus sp. Proteobacteria99%EF442978
Publisher’s Note: MDPI stays neutral with regard to jurisdictional claims in published maps and institutional affiliations.