Abstract
Microbial electrochemical technologies now enable microbial electrosynthesis (MES) of organic compounds using microbial electrolysis cells handling waste organic materials. An electrolytic cell with an MES cathode may generate soluble organic molecules at a higher market price than biomethane, thereby satisfying both economic and environmental goals. However, the long-term viability of bioanode activity might become a major concern. In this work, a 15-L MES reactor was designed with specific electrode configurations. An electrochemical model was established to assess the feasibility and possible performance of the design, considering the aging of the bioanode. The reactor was then constructed and tested for performance as well as a bioanode regeneration assay. Biowaste from an industrial deconditioning platform was used as a substrate for bioanode. The chemical oxygen demand (COD) removal rate in the anodic chamber reached 0.83 g day−1 L−1 of anolyte. Acetate was produced with a rate of 0.53 g day−1 L−1 of catholyte, reaching a maximum concentration of 8.3 g L−1. A potential difference (from 0.6 to 1.2 V) was applied between the bioanode and biocathode independent of reference electrodes. The active biocathode was dominated by members of the genus Pseudomonas, rarely reported so far for MES activity.
1. Introduction
The environmental biorefinery consists of the transformation of organic wastes into resources. According to this concept, recycling and reusing society’s waste to create value-added products is preferable to mineralizing or discharging it [1]. Anaerobic digestion (AD) is a well-established method that converts organic waste into methane. In 2014, Europe generated 1.35 × 10⁷ tons of biogas, corresponding to 3% of its natural gas consumption [2]. In many European countries, AD relies on government grants since biomethane is not a competitive energy source [3]. Will it become competitive in the future? Bioenergy Europe, which used to be called AEBIOM, says that the technical potential of biomethane in the EU is about 78 billion Nm3. This is equivalent to 15.6% of Europe’s annual natural gas consumption of 500 billion Nm3 [4,5]. In other words, an exhaustive exploration of the EU’s biomethane potential would merely fulfill less than 1/6 of the continent’s natural gas requirements. Biomethane will always face competition from other, more cost-effective energy sources. Transforming organic matter into higher-value products may be more interesting. Some biological processes, such as fermentation and microbial electrochemical technologies (MET), can produce carboxylic acids and alcohols from residual organic matter [6].
Intensive research has been devoted to the production of chemicals from organic wastes at the laboratory scale, resulting in a plethora of possibilities [7,8]. Commonly used fermentation processes can produce H2 (sometimes with methane) and different types of soluble organic molecules [9]. The gasification-fermentation process involves syngas generation and gas fermentation, as this energy-consuming process permits the valorization of recalcitrant lignocellulose wastes [10]. The recent development of METs has created new application possibilities by combining biological and electrochemical processes to generate electricity or other products of interest. Electro-fermentation employs a polarized electrode to impact fermentative bacteria and metabolism [9], permitting high-rate cathodic production of H2 and 1,3-propandiol from glucose and glycerol [11,12]. The major challenge with these fermentation processes is that it is hard to treat the waste products since it is still hard to separate low-carbon acids and alcohols. The concept of the microbial fuel cell (MFC) for electricity production from organic matter dates back almost 100 years [13,14]. An MFC can be converted into a microbial desalination cell (MDC) by inserting AEM and CEM between its anodic and cathodic chambers [15]. Microbial electrolysis cells (MECs) were first proposed by two independent groups [16,17] with the intention of producing reduced molecules (mainly H2) at the cathode by biologically oxidizing organic matter at the anode [18]. Microbial electrosynthesis (MES) was discovered in 2010, opening up new possibilities for producing soluble multi-carbon compounds with high selectivity, rate, and energy efficiency from renewable electricity and CO2 [19]. The mechanism of MES remains unclear, but some evidence suggests that it could be highly H2-dependent, implying the involvement of the Wood-Ljungdahl pathway [20]. This cathodic process can produce fatty acids, alcohols, or defined cultures [21]. With a suitable community, acetate may be accumulated efficiently with a 100% electron recovery [22]. MES systems usually use abiotic anodes made of expensive metals that can tolerate high voltages (3–5 V) [23,24]. This configuration has significant investment and operating expenses due to electricity consumption, which is undesirable for large-scale operations [25]. The idea of using waste oxidation at a bioanode (equivalent to a MEC half-cell) to drive an MES biocathode has been mentioned by several authors since 2010 [26,27]. Implementing a technology at a large scale is different from proving an idea in the laboratory [28]. The configuration, materials, dimensions, electrodes, microbial population, temperature, pH, substrate flow, and cost-effectiveness all affect microbial electrochemical system performance. Pilot design and operation are tedious and time-consuming [29]. That may explain this domain’s lack of publishing. Pilot assays may be the only option to apply knowledge on a wider scale and identify unanticipated scaling challenges [30].
In the present work, we would like to highlight two of them here. First, industrial reference electrodes have several drawbacks, including high costs, implementation restrictions, breakage hazards, and imprecision owing to fouling. Given that the anode and cathode potentials should be controlled within a range, the possibility of operating a system with a potential difference is worth investigating. Second, MEC anodic biocatalysts need activation and maintenance. Many publications have explored bioanode inoculum and start-up [31]. Bioanode activity maintenance and regeneration data were few. Anodic microbiota may lose electroactivity over time despite adequate substrate availability and potential. Many reactors have shown bioanodes “aging”. It clearly hinders MEC growth. Restarting or exchanging bioanodes might restore their activity, but it is too slow and expensive for large-scale operations. Procedures for regeneration must be simple and effective [32]. In this work, we designed a 15 L reactor featuring an extraction compartment, a double plate bioanode, and a granular carbon bed MES biocathode. A bioelectrochemical reactor model examined the bioanode’s “aging” impact.
2. Experimental Details
2.1. Reactor Design
A filter-press type reactor named “TRL4” was designed in collaboration with 6TMIC, France (Patent PN001017). A schematic diagram of the principle for the TRL4 reactor is shown in Figure 1. The main material used was polymethyl methacrylate (PMMA). It consists of three main parts, as shown in Figure 2. (i) The reactor body is a 340 × 190 × 420 (exterior) mm container with fixed walls (15 mm thickness) and a bottom (20 mm thickness). On the walls, pipefittings for liquid circulation and gas injection were installed. (ii) An AEM and a CEM frame with pasted gaskets and a hollow central block are disposed inside the reactor body to separate the inner space into three chambers: the anodic chamber (AC) (5.25 L), the inter-membrane chamber (IC) (the space in the central block) (2.5 L), and the cathodic chamber (CC) (5.25 L). (iii) The lid of AC and the lid of CC can be fixed with screws at the top of the reactor body and the central block, with a thick gasket between them ensuring gas tightness. A cross-sectional view of the specific bioelectrochemical reactor and a schematic diagram of the anode and cathode is shown in Figure 2A–D.
Figure 1.
A schematic presentation of the principle of the TRL4 reactor.
Figure 2.
(A): A cross-sectional view of the TRL4 reactor showing the AC, IC, CC, automated controlling systems with: 1, gas pressure control, 2, liquid level control, 3, pH control, 4, temperature control; and 5, overflow chambers for AC and CC. (B) A proportional 3D model of the reactor’s inside configuration. (C,D): schematic diagram of the anode and cathode, respectively, with side and face views. Stainless steel was used for the electrodes’ rod and frame.
The electrode structure is important for the performance of METs. For the anode, Blanchet, et al. [33] showed that the electroactive biofilm is formed only on the electrode surface of biowaste-fed bioanodes. On the other hand, surface cleaning could be a simple but efficient method for bioanode activity regeneration because a clean electrode surface is favorable for the colonization of members of the genus Geobacter. For these reasons, the anode of the TRL4 reactor consists of two removable parallel flat plates, which allows the cleaning of one of the anode plates while the other remains in function. As for the material, carbon felt is often used as a support for bioanodes. It is good for biofilm, but it is not rigid and does not have much shear strength. Meanwhile, stainless steel is a promising bioanode material, according to Pocaznoi, et al. [34]. Therefore, anode plates were made of 316 L stainless steel frames and six carbon tissue strips (260 × 20 mm) (Paxitech, Échirolles, France) that were fixed between two stainless steel grills (Goodfellow, UK), so that the stripes were protected, and electrolyte could circulate freely through the anode plates as shown in Figure 3A–D. On the cathode, H2 produced by water electrolysis is an essential mediator in the MES [20]. On the other hand, no clear evidence shows that MES bacteria are surface attached. For these reasons, a massive carbon granular cathode was chosen to maximize the H2-producing surface, which could improve H2 uptake by MES bacteria such as homo-acetogenic species. Four stainless steel baskets were filled with a total mass of 1.2 kg of carbon granules (SGL carbon, Wiesbaden, Germany) and were fixed on the frame. Each electrode frame had a fixed 2 mm diameter stainless steel rod as a current collector. Each reactor chamber was connected to a recirculation system including a continuously functioning pump and a custom-made 1 L overflow chamber (Belleville SA, France) heated with a hot plate. Pre-programmed pumps ensured periodic injection of liquids (substrate, buffer, or inocula) into the overflow chambers. A security system kept the liquid level in the reactor below a threshold. A solenoid valve (SMC, Tokyo, Japan) governed by a pH meter controlled the injection of CO2 gas into the cathode chamber. Two electronic barometers (VEGA Americas, Lebanon, OH, USA) continuously monitored the gas pressure in the AC and the CC, which were kept below 5 and 10 mbar, respectively. All transmitters were purchased from Ardetem, France. The AC and the CC each contained a reference electrode (ProSense, The Netherlands) inserted in between the anodes and the cathode at about 1 cm from the electrodes. These reference electrodes allowed the measurement of the potential of the anodes and the cathode as well as the Ohmic loss, which was the open circuit voltage between them. These reference electrodes did not participate in the potential difference control. A multichannel potentiostat (VSP model) equipped with a current booster (Bio-Logic Instruments, France) was used for voltage control, current measurement, and continuous recording of the electrode potential of the TRL4 reactor. In this configuration, we have the relationship in Equation (1), in which all values are measured by the potentiostat:
Figure 3.
(A) The integral system, (B) the reactor body with electrodes and membrane frames, (C) the reactor body with liquid injection pipes and gas diffusers and the reactor body with electrodes, (D) membrane frames, and the center block.
2.2. Bioanode Performance Modeling
All potential measurements were made against Ag/AgCl/0.6 mol kg−1 KCl (0.25 V vs. standard hydrogen electrode) unless otherwise indicated. The two faces of the electrode were considered electrochemically active for calculating the current density. COMSOL Multiphysics® was used to provide a model of the cyclic voltammetry (CV) of a fully developed and an “aged” bioanode. The dimension studied was 300 × 120 × 335 mm, which corresponded to the reactor’s hydraulic volume. The modified Nerst-Monod equation [35] used in the model was fitted from experimental CV data. A CV of the fully developed bioanode was obtained on a small (4 cm × 4 cm) carbon tissue, producing 10.5 A m−2 of current density. On the same carbon tissue, a CV of the “aged” bioanode with decreased activity was obtained when its activity decreased by 43% (producing 6 A m−2) under the same conditions. A multichannel potentiostat (VMP3 model) (Bio-Logic Instruments, France) was used in CV measurements with a sweep rate of 0.001 V s−1. These CV data were mathematically adapted and used to fit modified Nernst-Monod equations applied during the modeling as shown in Table 1.

Table 1.
Equation and parameters used for performance modeling of the active bioanode and the “aged” bioanode.
The CV of granular carbon cathode was obtained from the work of Marshall, et al. [36]. As it cannot be fitted with a Nernst-Monod equation, a polynomial equation Equation (2) was proposed by regression:
The CV of the TRL4 reactor was obtained on “aged” bioanodes (day 120) with a sweep rate of 0.001 V s−1.
2.3. Reaction Setup
All chemicals were purchased from Sigma-Aldrich. During the operation, the anode in the slot closest to the CEM (named slot 1) was connected to the anode in the other slot (named slot 2) with a copper cable, except when measuring each anode current. The pH of the AC was maintained at 7 by injecting 30 g L−1 of K2CO3 into the anodic overflow chamber via an automatic pump controlled by a pH meter. The pH-controlled CO2 injection into the cathode chamber was initiated when the pH of the cathodic overflow chamber exceeded 7.5. The injected CO2 gas came from a gas bottle (Linde, Ireland). The injection flux was about 1.5 mL per second. The AC has a temperature of 30 °C, while the CC has a temperature of 25 °C. The recirculation flux between the overflow chambers and the corresponding reactor chambers was 100 L per hour. Liquid samples were taken every two days for chemical analysis and the conductivity measurement (Mettler Toledo, Columbus, OH, USA).
2.3.1. Inoculation
Before inoculation, the AC and its overflow chamber were filled with biochemical methane potential (BMP) medium (NF EN ISO 11734) amended with sodium bicarbonate (8 g HCO3- L−1) to reach a final working volume of 5.25 L in the AC and 500 mL in the overflow chamber. The CC and its overflow chamber were filled with general-acetogen-medium (pH = 7) as described in [37] to reach a final working volume of 5.25 L in the CC and 500 mL in the overflow chamber. For methanogen inhibition, 20 mM of 2-bromoethanesulfonic acid was added to CC. The IC and its overflow chamber were filled with a buffer solution (35 g L−1 of KCl and 32.6 g L−1 of KH2PO4) to a final volume of 2 L in the IC and 500 mL in the overflow chamber. The anodes were inoculated with five 2 cm × 4 cm carbon-tissue-bioanodes from running H-type reactors fed with biowaste. These carbon tissues were deposited on the top edge of the anodes. The cathode inoculum was obtained from a batch reactor of dry dark co-fermentation of synthetic food waste, cardboard, and centrifuged granular sludge of a mesophilic industrial up-flow anaerobic sludge blanket digestion (UASB) reactor treating effluents from a sugar factory [38]. For inoculation, 100 g of the inoculum was suspended in 500 mL of distilled water and added to the CC through a pipe fitting on the lid.
2.3.2. Start-Up Phase
The start-up phase corresponds to the first 17 days of the operation. Sodium acetate was used as a bioanode substrate during the start-up phase. In the beginning, 23.6 g of sodium acetate was added to the AC to achieve a final concentration of 50 mM in the anolyte. A total of 23.6 g of sodium acetate was added each time when the current density fell below 0.1 A m−2 which indicates that all the substrate was consumed (fed-batch mode). The potential difference between the anodes and the cathode was set at 0.6 V. It was gradually increased to 1.2 V with the increase in the current density.
2.3.3. Biowaste Hydrolysate (BH) Feeding
At the end of the start-up phase, BH was added as a substrate instead of sodium acetate. The biowaste came from an industrial deconditioning platform dealing with food waste from the food industry and supermarkets. Sampled biowaste was stored at −20 °C before use. Thawed biowaste was centrifuged at 6000 rpm for 15 min, and the supernatant was used to feed the bioanode (chemical oxygen demand (COD) = 100 g O2 L−1). For the first ten days following the start-up phase (days 17 to 27), 260 mL of BH was added to the AC when the current density fell below 0.1 A m−2, to have a final COD of around 5 g L−1. From day 28, an automatic feeding system was implemented, injecting 45 mL of BH (equivalent to 4.8 g of COD) per day into the AC (except for the 33rd day). The potential difference was 1.2 V in this phase, except during the regeneration experience.
2.3.4. Bioanode Activity Regeneration with N2 Gas Bubbling
The potential difference was set to 0.6 V on the 40th day of operation. The daily injection of BH was stopped for the 39th, 40th, and 41st days to analyze the regeneration effect. N2 gas from a gas bottle at 3 bar pressure was injected at a flux of 670 mL per minute for 30 min to the AC via stainless steel tubes of 320 mm length and 5 mm internal diameter (Figure 2C) under the two anodes. The ends of these tubes were closed. As the gas outlet, six 2 mm diameter apertures were perforated on the tube on a regular basis. On the next day, the potential difference was set to 0.8 V. On the 42nd day, the potential difference was set to 1.2 V and the daily injection of BH restarted. On day 55, the manometer of the CO2 gas bottle loosened, resulting in a gas flux out of control. The CC was emptied due to the gas pressure, and the operation was stopped.
2.3.5. Bioanode Activity Regeneration with the Double Anode Configuration
An independent assay was carried out on the reactor to study bioanode regeneration by biofilm removal. A total of 23.6 g of sodium acetate was added as an anode substrate in fed-batch mode for the first 57 days. The potential difference was set between 0.75–1 V during this period (see Figure 3) and at 0.6 V during days 37 and 57 (Christmas holidays). On day 57, 50 mL of BH was added in fed-batch mode to the AC. The potential difference was gradually increased to 0.9 V. After the occurrence of the aging effect, the anode in slot 1 was removed from the reactor. The stainless-steel grill and the carbon tissue strips were renewed, and the frame was cleaned with water and then 70% ethanol. The anode in slot 2 was moved to slot 1, and the cleaned anode was put in slot 2. During this process, the reactor was always under polarization.
2.4. Chemical Analysis and Calculations
The COD was measured with the LCK514 kit (Hach Lange, Germany). Volatile fatty acid (VFA) concentrations were measured with liquid chromatography (DIONEX, Sunnyvale, CA, USA). Gas compositions (O2, N2, CH4, CO2, H2, and H2S) were determined with gas chromatography (Varian CP4900, Guilford, GT, USA). The anodic and cathodic columbic efficiency (CE) is also measured in this study [39]. The reactor was operated in a continuous mode with constant volume in AC, IC, and CC. The anodic CE was defined as the ratio of total electric charges that entered the circuit during a period t0 to t1 over electron loss of AC substrate, which was estimated by average COD removal of the AC:
where: i = electric current measured in A, t = time in s, = COD of AC effluent minus COD of AC influent in mg·L−1 of O2, = Feeding speed of the AC in L·s−1, = Avogadro constant, e = elementary charge ≈1.602 × 10⁻¹⁹ C, = molar mass of O2
The cathodic CE was defined as the gain of electrons by molecules produced from CO2 during a period t0 to t1 divided by electric charges injected by the circuit:
where: i = electric current measured in A, t = time in s, = variation of acetic acid concentration in CC from t0 to t1 in g·L−1, = Reaction volume of CC in L, = Avogadro constant, e = elementary charge ≈1.602 × 10⁻¹⁹ C, = molar mass of acetic acid.
The overall CE of the reactor was calculated by .
2.5. Microbial Community Analysis
Bioanode samples were taken from the electrode by scratching. Liquid samples were centrifuged at 10,000 rpm for 20 min before removing the supernatant. Total DNA was extracted using the PowersoilTM kit (MoBio Laboratories, Belgium) according to the manufacturer’s instructions. Extracted DNA concentrations were quantified with the Qubit fluorescent dye assay (Invitrogen, Waltham, MA, USA). Bacterial and archaeal 16S rRNA genes were amplified and sequenced as described in previous work [40]. The 515F (5 -GTGCCAGCMGCCGCGGTAA-3) and 928R (5 -CCCGYCAATTCMTTTRAGT-3) primers and the Ion Torrent PGMTM platform (Ion Torrent, Guilford, GT, USA) were used to amplify and sequence bacterial and archaeal 16S rRNA genes. The 16S rDNA tag reads were analyzed with the Galaxy-supported Frogs pipeline [41]. Briefly, sequences with less than “300 bp” or with errors in primers were discarded. The remaining sequences were truncated to 300 bp and dereplicated. With 97% identity, operational taxonomic units (OTUs) were clustered. Chimera was removed. The taxonomy affiliation of OTUs was performed with a minimum confidence of 0.85. The BIOM1 format OTU table was analyzed and visualized by the Shiny Easy 16S interface (http://genome.jouy.inra.fr/shiny/easy16S/, accessed on 24 July 2019) [42]. Briefly, alpha rarefaction, Shannon index, and Bray-Curtis dissimilarity were calculated using the phyloseq R package [43].
3. Results and Discussion
3.1. Pilot Operation and Bioanode Activity Regeneration with N2 Gas Bubbling
The TRL4 reactor had a total volume of 12.5 L ± 1 L, depending on the fill level. If the overflow chambers were included, this volume would reach 14 L ± 1 L. The anode surface in this article was calculated with the projected surfaces of both electrode faces, resulting in 0.18 m2 per anode plate. The surface over volume ratio of the AC was 68.6 m2 m−3. The cathode pH increased to 7.6 during the first day and remained between 7.6 and 8.0 during the whole operation, as shown in Figure 4. The CO2 gas was thus continuously injected into the CC, establishing a permanent 10 mbar overpressure with a CO2 gas partial pressure >8.0 mbar. The pH of the IC was very close to the pH of the CC. This effect could be explained by abiotic water hydrolysis, which produces OH-, which can balance the acidity of the carbonic acid and can cross the AEM. The conductivity evolution, as shown in Figure 4, of the anode and IC followed expected trends. As bioanode activity tends to decrease the pH [44,45], a 5.3 S m−1 K2CO3 solution was injected into the AC when its pH went below 7. The anolyte conductivity was an equilibrium of ion loss due to electric force and gain from the pH buffer and substrate additions, which were both positively correlated to the bioanode activity. The conductivity of the AC slightly decreased during the start-up phase but has constantly increased to 5 S m−1 since the injection of BH (pH = 3.9). The conductivity of the IC received ions from both AC and CC and increased continuously from 3.7 to 9.8 S m−1. It decreased after the N2 bubbling process, probably due to the voltage decrease during this process that decreased the ion migration due to the electric force [46]. The conductivity of the CC also increased drastically during the operation to reach 10 S m−1 on the 30th day. We could not identify the exact cause of this phenomenon. Anions such as OH-, acetate, and CO3- should diffuse from the CC into the IC. With no cation entrance, the catholyte conductivity should slightly decrease during this time because of water hydrolysis, but the contrary was observed. Our hypothesis was that cations entered the CC through a minor leak or the AEM because anion exchange membranes are not completely impervious to monovalent cations. The gas produced by the AC was analyzed on the 18th day (end of the start-up phase) and the 45th day. On the 18th day, the gas phase contained 81% of CO2, 11% of CH4, and 0.5% of O2. No H2 was detected. On the 45th day, the gas phase contained 52% of CO2, 11% of CH4, and 30% of N2, 0.2% of H2 was detected as well. The gas produced by the CC on the same days was 98% CO2 and 1% H2, with little variation over time. These results indicate that AC lost a part of the input substrate due to methanogenesis. In contrast, the methanogen inhibition at CC was successful.
Figure 4.
pH evolution of IC and CC and, conductivity evolution of AC, IC, and CC during the operation.
Figure 5 summarizes the electrochemical data collected during the operation. As neither the anode potential nor the cathode potential was fixed, the voltage and the Ohmic loss determined the electrode potentials. Data presented in Figure 5 confirmed Equation (1) at all moments of the operation. The fraction of energy wasted due to Ohmic loss can be calculated by which is directly correlated to the current density. It approached zero when the current density was low and reached 50% at the maximum current density. The cathode was designed to have a more stable potential than the anodes, which have a significantly larger active surface. As shown in Figure 3, the cathode potential remained at about −0.9 V vs. Ag/AgCl, despite considerable variation in the anodic potential from −0.4 V to 0.2 V. Sudden variations of the cathodic potential appeared during the fed-batch operation (day 0 to day 25) due to AC K2CO3 injection triggered by substrate feeding. The saline solution could significantly lower local Ohmic loss and thus pull up the cathodic potential. This issue is discussed in the next paragraph.
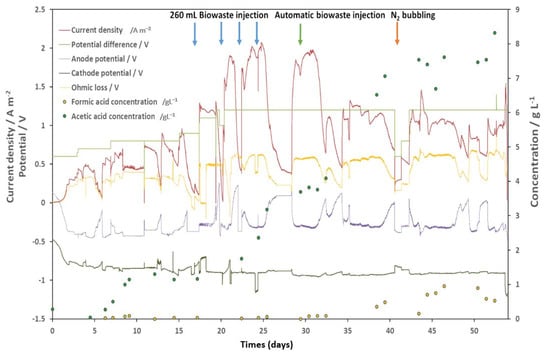
Figure 5.
Performance synthesis of the TRL4 reactor. The y-axis on the left indicates the current density and the potential. The y-axis on the right indicates the concentration. Anode and cathode potentials versus Ag/AgCl electrodes were presented. Concentrations of VFAs detected in the IC are presented.
The anodic potential depends more on its own activity than on the imposed potential difference. As shown in Figure 5, the anodic potential can increase from −0.4 V to 0.2 V if the substrates are used up. When the substrates are available again, the anodic potential drops instantly into a narrow zone between −0.3 V and −0.4 V vs. Ag/AgCl [47], depending on the imposed potential difference. Interestingly, once this zone was reached, the anodic potential became very resistant to any change, unless the substrate was exhausted. This effect can be observed on the 16–17th, the 24th, the 28th, and the 40th days, where the anodic potential stabilized around −0.4 V while the Ohmic loss caused quick changes in the cathodic potential, despite the enormous active surface of the cathode compared to the anodes. Substrate availability seems to be the only important factor that influences the anodic potential. The Ohmic loss was positively correlated to the current density. However, after the 33rd day, the current density significantly decreased while the Ohmic loss remained at the same level as well as the anodic potential. If we focus on the fed-batch mode of operation, a substrate injection has three simultaneous effects: (i) anode potential drop; (ii) current density rise; and (iii) increase of ohmic loss. Knowing that all three were related to the bioanode activity, the potential drop appears to be the cause, while the other two would be the results. This hypothesis is supported by the potential-current relationship after the 35th day: the potential was very similar to the 30th day potential, while the current density decreased by 40% to 50%. These observations show a biofilm “aging” effect which appeared on day 32nd. The same quantity of BH was injected into the AC while all conditions remained the same as the day before. However, the anodic potential decreased only by −0.2 V. The current density peak reached only 55% compared to day 31 and endured only several hours before decreasing as if the substrate was used up. Our first hypothesis was a substrate overload effect. However, the current continued to decrease on day 33 and did not show any sign of stabilization. On day 34, the current increased with BH feed as if no available substrate existed. Chemical analysis revealed 2.13 g L−1 of COD and 0.16 g L−1 of acetate in the anolyte. Our second hypothesis was that the anodic electroactive biofilm was altered, probably due to contaminants in the BH. According to the literature, populations of Geobacter can tightly attach to solid surfaces via a conductive nanowires [48]. Therefore, the shearing force could detach contaminants and expose the electroactive biofilm. Indeed, bubbling is a widely used declogging technique in water treatment facilities. The N2 bubbling efficiently removed anodic biofilm, as indicated by the irregular anodic potential drop on days 42 and 43. The effect was, however, unsustainable possibly due to the fast growth of the contaminant biofilm. The increase in current density and the pattern of anodic potential on day 43 supported the idea that the fast growth of biofilm was due to the electroactive system.
Globally, the development of the bioanode could be divided into three phases. (i) The growth phase, during which the current density peak increased with each feed (See from day 0 to until 25); (ii) the fully developed phase, during which the current density output reached its maximum (see from day 25 to until 32); and (iii) the “aged” phase (see from day 32 to until completion), during which the anodic biofilm was contaminated or altered, as indicated by a sharp drop in the current density peak. Here, the maximum current produced by the double bioanode reached 2 A m−2. The anodic CE was 60.3%, 98.6%, and 49.1% during the growth, fully developed, and “aged” phases, respectively. During the fully developed phase, the COD removal rate was at its highest, at 0.83 g COD/day/L, which was the value set for the automatic BH feeding. Acetate and formate were produced by the biocathode, reaching a maximum concentration of 8.3 g L−1 and 1.0 g L−1 in the extraction chamber, respectively. Acetate accumulation in the IC started on day 5, but temporarily stopped on day 8, probably due to a connection issue visible on the current density curve. The impact of this event lasted until day 17, when the production restarted. The cathodic CE from day 0 to day 15 was 81.1%. During the fully developed phase, there was a rapid accumulation of acetate, with a daily production rate of 0.53 g day−1 L−1 at a CE of 63.7%. As mentioned, H2 production was detected in this period (1% at CC) but was not followed due to the continuous CO2 injection. The acetate accumulation in the CC slowed down after the N2 bubbling in the AC, possibly due to the low current density during day 41 to day 43. As before, this effect lasted about 8 days until the accumulation restarted. During this period of latency, the acetate concentration decreased. Therefore, it is in fact an equilibrium of production and consumption, either by cathodic acetotrophs or by leakage through the CEM. From this point of view, it would be important to maintain the current density over a certain limit. In our case, the empiric value is 0.5 A m2.
3.2. CV Measurements Reveal Complex Response of Bioanodes Facing Potential Change
The modified Nernst-Monod model was a viable approximation of the CV of fully developed and aged carbon tissue bio-anodes, as presented in Figure 6. Jmax represents the maximum current density; the coefficient α determines the maximum slope of the curve. “Aged” bioanodes of the TRL4 reactor produced much lower current densities than the carbon tissue anode and presented a presented in Figure 6, a more complex CV pattern. As shown in Figure 4, anode 1 (defined as the anode closer to the AEM) was clearly a more performant bioanode than anode 2 (defined as the anode closer to the reactor wall). The CV of anode 1 has a distinct peak at E = −0.226 V, beyond which the current density was reversely correlated to the anodic potential until E = −0.290 V. This pattern did not appear on the CV of anode 2, suggesting functional differentiations of the anodes 1 and 2 caused by their positioning. A negative peak appeared near E = −0.5 V only on the CV of anode 2, implying the presence of an Electrotrophic biofilm. A modified Nerst-Monod function with Jmax = 0.65 A m−2 and E0.5 = −0.3 V was also presented in Figure 7. Evidently, this function is not a valid model for any of the bio-anodes of the TRL4 reactor. Nevertheless, the maximum slope of the function, which is defined by the coefficient α is like the maximum slope present on both CVs, and it appeared when E increased from −0.5 V to −0.4 V. On TRL4 anode CV, the slope decreased drastically when E > −0.4 V, but never approached 0. These CV patterns suggest the involvement of various electroactive communities present on each bioanode. Further studies are necessary to clarify the community evolution during the “aging” of the bioanode. The difference in the CV of anodes 1 and 2 implied considerable differences in functional groups.
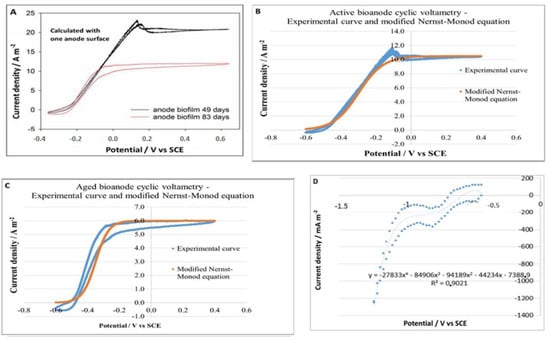
Figure 6.
(A) Cyclic voltammetry of a fully matured and active bioanode (black curve) and an “aged” bioanode (red curve). The dates on the figure are not related to this work but indicate the occurrence time of the “aging” effect. (B) Modification of the Nernst-Monod equation for active bioanode kinetics. (C) Adaptation of the Nerst-Monod equation for the kinetics of “aged” bioanodes (D) adaptation of a polynomial equation for the kinetics of the granular carbon cathode.
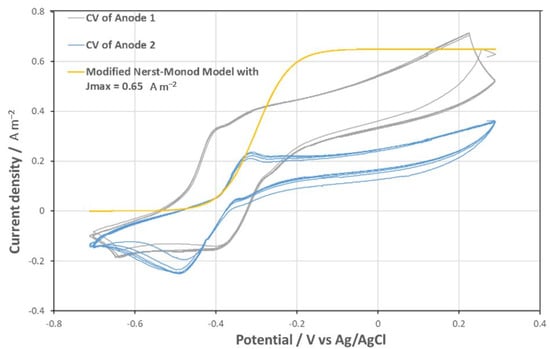
Figure 7.
CV of aged anodes on slots 1 and 2, and a modified Nernst-Monod equation curve with Jmax = 0.65 A m−2 which was not a validated model of the CVs.
3.3. Bioanode Activity Regeneration by Electrode Cleaning and Exchange
Figure 8 shows electrochemical data of bioanode activity acquired during this experiment. The relationship between potential difference, anode potential, current density, and Ohmic loss remained the same as discussed before. When the substrate was available, the bioanode potential decreased to −0.4 V vs. Ag/AgCl regardless of current density, potential difference, or Ohmic loss. However, we can see here that an immature or “aged” bioanode could have a less stable potential. The pattern of the cathode potential curve changed. All CC conditions (pH, CO2 injection, electrolyte, etc.) were kept the same except that no bacterial inoculum was introduced. The cathodic potential was more variable under the influence of the anodic potential and the Ohmic loss voltage when compared to the results presented in Figure 5, while the average potential was similar. This variation cannot be explained by abiotic H2 production, as all physical-chemical conditions were the same. The cathodic film could play an important role in potential stabilization. The current density produced by the bioanode was lower during this run because of a lower potential difference and probably clogging of the membranes. Nevertheless, the “aging” effect appeared 14 days after the BH injection, the same as during the previous operation. The current density and anodic CE also decrease in a very similar manner. The “aged” bioanode could produce around 50% of the maximum current density of a fully developed bioanode. On day 134, anode 1 was cleaned and exchanged with anode 2. Despite the presence of an abiotic anode, the current density peak instantly increased by 30% and continued for 50 days until the next “aging” effect appeared. Average CE increased from 69.0% to 82.9% (average of 7 peaks before and after cleaning). Obviously, this method could not completely restore the bioanode’s activity. Nevertheless, it could be a way to sustain an industrial scale pilot. Moreover, testing the method in continuous operation mode is still needed to make sure it works.
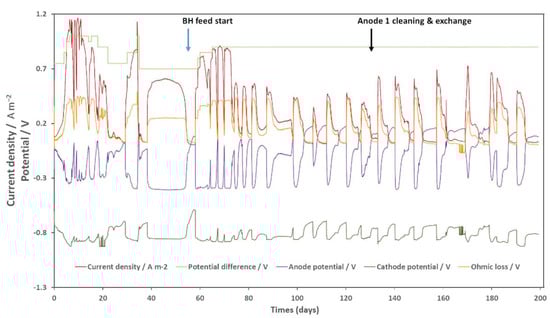
Figure 8.
Performance of the bioanode regeneration experience. The y-axis on the left indicates the current density and the potential. Anode and cathode potential versus Ag/AgCl electrodes were presented.
3.4. Microbial Community Evolution
Samples analyzed by 16S sequencing were (i) the inoculum of the cathode, (ii) the cathode electrode and liquid phase at day 25 of the TRL4 operation, and (iii) anode electrode and liquid phase before and 20 days after the activity regeneration by electrode cleaning and exchange. The number of reads generated varied from 14,746 (cathode liquid phase) to 89 388 (regenerated anode liquid phase), with an average of 46,484 reads per sample. Microbial community composition is shown at the Genus level (Figure 9) and rarefaction curves (Figure 10) confirmed the representativity of the analysis. The Shannon index also indicated considerable alpha diversity in all samples. As shown in Table 2, methanogens were detected in all samples despite the use of 2-bromoethanesulfonic acid at the cathode. They were very rare on the cathode but abundant in the catholyte. This could probably be explained by the adsorption of the methanogen inhibitor by the carbon granules. For the anode, methanogens were more abundant in samples taken 20 days after the regeneration than in samples of “aged” anodes. In contrast, the abundance of the electroactive Geobacteraceae family decreased. In other words, although the electrode cleaning and exchange allowed us to regenerate the bioanode activity and the coulombic efficiency, it did not happen the way we expected. We hypothesized that Geobacter would be able to colonize the clean and polarized surface before other microorganisms. The results proved that the bioanode mechanism was far more complex and that Geobacter abundance is not an indicator for bioanode activity.
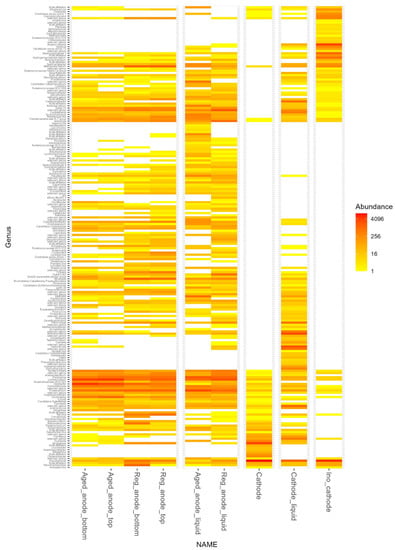
Figure 9.
Heat map of the microbial community composition at Genus level for the different samples analyzed.
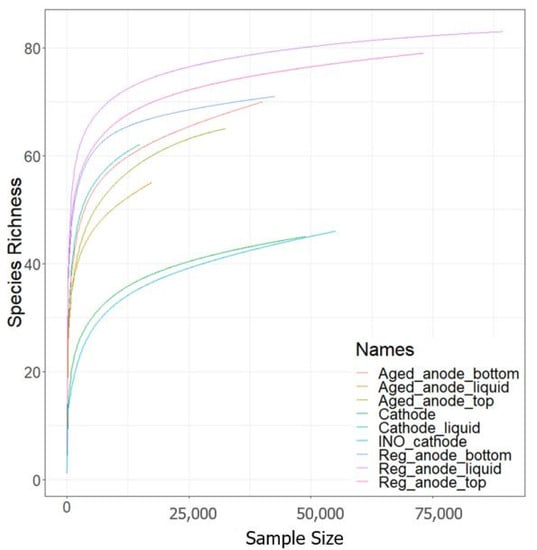
Figure 10.
Rarefaction curves of the sequenced sample.
Table 2.
An overview of the sequencing results. Sampling location was indicated with “top” (top of the electrode), “bottom” (bottom of the electrode” or “liquid” (electrolyte sample). “Aged” or regenerated anode samples were indicated with “Aged” or “Reg”.
Figure 11 presents the Bray-Curtis dissimilarity generated with the multidimensional scaling (MDS) method. Anode samples were concentrated in the top-left zone. The regeneration process changed the microbial community on the cleaned electrode, as mentioned, but not in the anolyte. The cathode community was similar to the inoculum. The catholyte had a distinct microbiota. Further analysis of the OTU table revealed interesting but unexplained results. Lentimicrobiaceae and Dysgonomonadaceae were dominant families in all anodic samples, representing between 10.4–35.9% of the total population. The dominant genus of the Lentimicrobiaceae family was Lentimicrobium, isolated in 2016 from methanogenic granular sludge in a full-scale mesophilic up-flow anaerobic sludge blanket reactor treating high-strength starch-based organic waste [49]. It was known for its fermentative activity, producing acetate, malate, propionate, formate, and H2. The Dysgonomonadaceae contained three dominant genera, Fermentimonas, Petrimonas, and Proteiniphilum, all known for fermentative activities producing acetate [50,51]. The Synergistaceae family (which predominated in anolyte samples) was also involved in the acetogenesis [52]. These bacteria could support the bioanode activity by degrading large organic molecules into smaller ones such as acetate or propionate, which are common substrates for Geobacter. They could thus occupy the same ecological niche in the anode chamber. On the electrosynthetic biocathode, the significant dominance of the Pseudomonadaceae family was surprising. In this family, the only genus detected was Pseudomonas. Its abundance increased to 64.9% on the biocathode when it was immersed in a mineral medium supplied only with CO2. To the best of our knowledge, no significant evidence supports the MES activity of Pseudomonas strains. Clearly, the abundance increase could be due to the death of other Electrotrophic bacteria, but the cathode sample was taken on day 25 (see Figure 5), when the cathodic MES had just entered the most active phase. More repetitions are still necessary to confirm this observation.
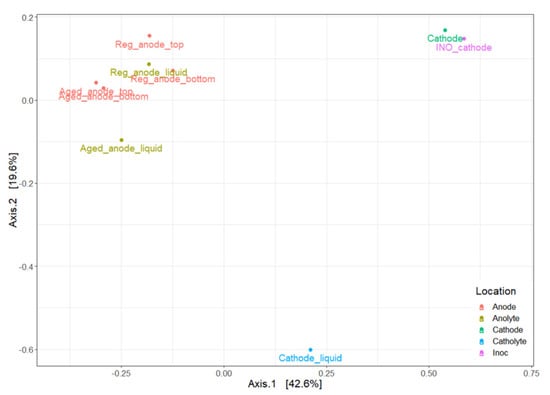
Figure 11.
Bray-Curtis dissimilarity of a sequenced sample. Sampling locations were indicated with “top” (top of the electrode), “bottom” (bottom of the electrode), or “liquid” (electrolyte sample). “Aged” or regenerated anode samples were indicated with “Aged” or “Reg”.
4. Conclusions and Perspective
This study established the feasibility at a laboratory pilot scale (14 L) of the idea of microbial electrosynthesis driven by a microbial electrolyzer comprising a bioanode fed with real biowaste hydrolysates. This concept permits the MES to perform only with a voltage of 0.6–1.2 V, which is a huge advantage compared to existing MES technologies. The underlying reason is that the oxidation of organics at the anode provides part of the energy required for the process and allows the treatment of the residual waste organic matter in the meantime. Moreover, the evolution of bioanode potential and biocathode potential, together with current densities, were documented at the same time thanks to the use of two reference electrodes in the reactor setup. These findings have the potential to shed light on the reasons underlying the activity changes of electroactive biofilms. The loss of catalytic activity of the bioanode was attributed to an increased internal ohmic drop and constitutes a new challenge for the future application of METs. Analysis of the microbial community showed a very diverse bioanode and a biocathode that were dominated by Pseudomonas, a type of bacteria that had never been seen in the MES. As a first attempt at up scaling the novel technology, we were aware of the technical and conceptual difficulties that remained to be solved. First, the biocathode was fragile. Its activity requires a sustained electron flux, which can be challenging and depends on the activity of the bioanode. Maximizing the anodic surface may be a simple solution to this issue. Punctual current deficits could also be compensated by H2 gas, which could be produced and stored when there was excess current. Electrotrophic biofilm maintenance is a major challenge for all MES technologies. As mentioned, the cathodic biofilm tends to disappear in long-term operations. We have no solution for this problem other than strict condition control and periodic re-inoculation. Secondly, the bioanode activity was highly substrate-dependent. An adapted protocol would thus be necessary for each specific substrate, especially heterogeneous organic matters that could have an impact on the activity of the bioanode. Finally, mechanical design is an important element of the upscaling process. We know our design can be optimized in many aspects. With improved design, the anode-cathode distance and the electrode surface over volume ratio can still be improved. The pumping system could also be simplified. Optimization of the cathodic gas circuit, including a storage facility for H2 and CO2 recovery and recycling, would be beneficial for the optimization of the cathodic activity. In any case, even if it is undeniable that many technological steps remain to be taken, this contribution constitutes a step forward in the development of an electromicrobial technology allowing the production of green chemistry precursors by recovering and valorizing the energy and carbon contained in waste organic matter, which undoubtedly represents a highly desirable research target for the advent of a sustainable bioeconomy.
Author Contributions
T.B.: conceptualization. J.-H.T., R.L.: methodology, writing-original draft preparation. C.B.: microbial analysis. E.D.-L.Q.: experimentations, data analysis, visualization. C.M., T.B., A.A.Y.: result interpretation, English editing of the manuscript. T.B.: supervision, funding acquisition. All authors have read and agreed to the published version of the manuscript.
Funding
This research was funded by the French National Research Agency for supporting the BIORARE project (ANR-10-BTBR-02).
Institutional Review Board Statement
Not applicable.
Informed Consent Statement
Not applicable.
Data Availability Statement
The authors confirm that all data underlying the findings are fully available without restriction. Data can be obtained after submitting a request to the corresponding/first author.
Acknowledgments
The authors of this article would like to thank Christian Duquennoi for his assistance in the establishment of the electrochemical model. The authors would also like to thank the French National Research Agency for supporting the BIORARE project (ANR-10-BTBR-02). We are also grateful to the INRAE MIGALE bioinformatics facility (MIGALE, INRAE, 2020). Migale bioinformatics Facility, doi: 10.15454/1.5572390655343293E12 for providing computing and storage resources.
Conflicts of Interest
The authors declare no conflict of interest.
References
- Moscoviz, R.; Trably, E.; Bernet, N.; Carrère, H. The environmental biorefinery: State-of-the-art on the production of hydrogen and value-added biomolecules in mixed-culture fermentation. Green Chem. 2018, 20, 3159–3179. [Google Scholar] [CrossRef]
- Achinas, S.; Achinas, V.; Euverink, G.J.W. A Technological Overview of Biogas Production from Biowaste. Engineering 2017, 3, 299–307. [Google Scholar] [CrossRef]
- Grando, R.L.; Antune, A.M.D.S.; da Fonseca, F.V.; Sánchez, A.; Barrena, R.; Font, X. Technology overview of biogas production in anaerobic digestion plants: A European evaluation of research and development. Renew. Sustain. Energy Rev. 2017, 80, 44–53. [Google Scholar] [CrossRef]
- Scarlat, N.; Dallemand, J.-F.; Monforti-Ferrario, F.; Banja, M.; Motola, V. Renewable energy policy framework and bioenergy contribution in the European Union—An overview from National Renewable Energy Action Plans and Progress Reports. Renew. Sustain. Energy Rev. 2015, 51, 969–985. [Google Scholar] [CrossRef]
- Scarlat, N.; Dallemand, J.-F.; Fahl, F. Biogas: Developments and perspectives in Europe. Renew. Energy 2018, 129, 457–472. [Google Scholar] [CrossRef]
- Foulet, A.; Bouchez, T.; Desmond-Le Quéméner, E.; Giard, L.; Renvoisé, L.; Aissani, L. Life cycle assessment of a bioelectro-chemical system as a new technological platform for biosuccinic acid production from waste. Environ. Sci. Pollut. Res. 2018, 25, 36485–36502. [Google Scholar] [CrossRef]
- Sen, B.; Aravind, J.; Kanmani, P.; Lay, C.-H. State of the art and future concept of food waste fermentation to bioenergy. Renew. Sustain. Energy Rev. 2016, 53, 547–557. [Google Scholar] [CrossRef]
- Idris, M.O.; Noh, N.A.M. Sustainable microbial fuel cell functionalized with a bio-waste: A feasible route to formaldehyde bioremediation along with bioelectricity generation. Chem. Eng. J. 2022, 140781, 1–17. [Google Scholar]
- Moscoviz, R.; Toledo-Alarcón, J.; Trably, E.; Bernet, N. Electro-Fermentation: How To Drive Fermentation Using Electrochemical Systems. Trends Biotechnol. 2016, 34, 856–865. [Google Scholar] [CrossRef]
- Wainaina, S.; Horváth, I.S.; Taherzadeh, M.J. Biochemicals from food waste and recalcitrant biomass via syngas fermentation: A review. Bioresour. Technol. 2018, 248, 113–121. [Google Scholar] [CrossRef]
- Toledo-Alarcón, J.; Moscoviz, R.; Trably, E.; Bernet, N. Glucose electro-fermentation as main driver for efficient H2-producing bacteria selection in mixed cultures. Int. J. Hydrogen Energy 2019, 44, 2230–2238. [Google Scholar] [CrossRef]
- Yaqoob, A.A.; Ibrahim, M.N.M.; Yaakop, A.S.; Ahmad, A. Application of microbial fuel cells energized by oil palm trunk sap (OPTS) to remove the toxic metal from synthetic wastewater with generation of electricity. Appl. Nanosci. 2021, 11, 1949–1961. [Google Scholar] [CrossRef]
- Lovley, D.R. Microbial fuel cells: Novel microbial physiologies and engineering approaches. Curr. Opin. Biotechnol. 2006, 17, 327–332. [Google Scholar] [CrossRef] [PubMed]
- Khalid, U.; Tabassum, P.; Lokhat, D.; Siti, H. A glimpse into the microbial fuel cells for wastewater treatment with energy generation. Desalination Water Treat. 2021, 214, 379–389. [Google Scholar]
- Cao, X.; Huang, X.; Liang, P.; Xiao, K.; Zhou, Y.; Zhang, X.; Logan, B.E. A New Method for Water Desalination Using Microbial Desalination Cells. Environ. Sci. Technol. 2009, 43, 7148–7152. [Google Scholar] [CrossRef] [PubMed]
- Liu, H.; Grot, S.; Logan, B.E. Electrochemically Assisted Microbial Production of Hydrogen from Acetate. Environ. Sci. Technol. 2005, 39, 4317–4320. [Google Scholar] [CrossRef] [PubMed]
- Rozendal, R.A.; Hamelers, H.V.; Euverink, G.J.; Metz, S.J.; Buisman, C.J. Principle and perspectives of hydrogen production through biocatalyzed electrolysis. Int. J. Hydrogen Energy 2006, 31, 1632–1640. [Google Scholar] [CrossRef]
- Bajracharya, S.; Sharma, M.; Mohanakrishna, G.; Benneton, X.D.; Strik, D.P.; Sarma, P.M.; Pant, D. An overview on emerging bioelectrochemical systems (BESs): Technology for sustainable electricity, waste remediation, resource recovery, chemical production and beyond. Renew. Energy 2016, 98, 153–170. [Google Scholar] [CrossRef]
- Nevin, K.P.; Woodard, T.L.; Franks, A.E.; Summers, Z.M.; Lovley, D.R. Microbial Electrosynthesis: Feeding Microbes Electricity To Convert Carbon Dioxide and Water to Multicarbon Extracellular Organic Compounds. Mbio 2010, 1, e00103-10. [Google Scholar] [CrossRef]
- Blanchet, E.; Duquenne, F.; Rafrafi, Y.; Etcheverry, L.; Erable, B.; Bergel, A. Importance of the hydrogen route in up-scaling electrosynthesis for microbial CO2 reduction. Energy Environ. Sci. 2015, 8, 3731–3744. [Google Scholar] [CrossRef]
- Logan, B.E.; Rabaey, K. Conversion of Wastes into Bioelectricity and Chemicals by Using Microbial Electrochemical Technologies. Science 2012, 337, 686–690. [Google Scholar] [CrossRef] [PubMed]
- Jourdin, L.; Grieger, T.; Monetti, J.; Flexer, V.; Freguia, S.; Lu, Y.; Chen, J.; Romano, M.; Wallace, G.G.; Keller, J. High Acetic Acid Production Rate Obtained by Microbial Electrosynthesis from Carbon Dioxide. Environ. Sci. Technol. 2015, 49, 13566–13574. [Google Scholar] [CrossRef] [PubMed]
- Ibrahim, M.N.M.; Guerrero-Barajas, C. Modern trend of anodes in microbial fuel cells (MFCs): An overview. Environ. Technol. Innov. 2021, 23, 101579. [Google Scholar] [CrossRef]
- Marshall, C.W.; Ross, D.E.; Fichot, E.B.; Norman, R.S.; May, H.D. Long-term Operation of Microbial Electrosynthesis Systems Improves Acetate Production by Autotrophic Microbiomes. Environ. Sci. Technol. 2013, 47, 6023–6029. [Google Scholar] [CrossRef]
- Yaqoob, A.A.; Serrà, A.; Bhawani, S.A.; Ibrahim, M.N.M.; Khan, A.; Alorfi, H.S.; Asiri, A.M.; Hussein, M.A.; Khan, I.; Umar, K. Utilizing biomass-based graphene oxide-polyaniline-Ag electrodes in microbial fuel cells to boost energy generation and heavy metal removal. Polymers 2022, 14, 845. [Google Scholar]
- Rabaey, K.; Rozendal, R.A. Microbial electrosynthesis—Revisiting the electrical route for microbial production. Nat. Rev. Genet. 2010, 8, 706–716. [Google Scholar] [CrossRef]
- Yaakop, A.S. Application of oil palm lignocellulosic derived material as an efficient anode to boost the toxic metal remediation trend and energy generation through microbial fuel cells. J. Clean. Prod. 2021, 314, 128062. [Google Scholar]
- Schröder, U. Discover the possibilities: Microbial bioelectrochemical systems and the revival of a 100-year–old discovery. J. Solid State Electrochem. 2011, 15, 1481–1486. [Google Scholar] [CrossRef]
- Cusick, R.D.; Bryan, B.; Parker, D.S.; Merrill, M.D.; Mehanna, M.; Kiely, P.D.; Liu, G.; Logan, B.E. Performance of a pilot-scale continuous flow microbial electrolysis cell fed winery wastewater. Appl. Microbiol. Biotechnol. 2011, 89, 2053–2063. [Google Scholar] [CrossRef]
- Ibrahim, M.N.M.; Rodríguez-Couto, S.; Ahmad, A. Preparation, characterization, and application of modified carbonized lignin as an anode for sustainable microbial fuel cell. Process Saf. Environ. Prot. 2021, 155, 49–60. [Google Scholar]
- Kumar, G.; Bakonyi, P.; Zhen, G.; Sivagurunathan, P.; Koók, L.; Kim, S.-H.; Tóth, G.; Nemestóthy, N.; Bélafi-Bakó, K. Microbial electrochemical systems for sustainable biohydrogen production: Surveying the experiences from a start-up viewpoint. Renew. Sustain. Energy Rev. 2017, 70, 589–597. [Google Scholar] [CrossRef]
- Bridier, A.; Quemener, E.D.-L.; Bureau, C.; Champigneux, P.; Renvoise, L.; Audic, J.-M.; Blanchet, E.; Bergel, A.; Bouchez, T. Successive bioanode regenerations to maintain efficient current production from biowaste. Bioelectrochemistry 2015, 106, 133–140. [Google Scholar] [CrossRef] [PubMed]
- Blanchet, E.; Erable, B.; De Solan, M.-L.; Bergel, A. Two-dimensional carbon cloth and three-dimensional carbon felt perform similarly to form bioanode fed with food waste. Electrochem. Commun. 2016, 66, 38–41. [Google Scholar] [CrossRef]
- Pocaznoi, D.; Calmet, A.; Etcheverry, L.; Erable, B.; Bergel, A. Stainless steel is a promising electrode material for anodes of microbial fuel cells. Energy Environ. Sci. 2012, 5, 9645–9652. [Google Scholar] [CrossRef]
- Marcus, A.K.; Torres, C.I.; Rittmann, B.E. Conduction-based modeling of the biofilm anode of a microbial fuel cell. Biotechnol. Bioeng. 2007, 98, 1171–1182. [Google Scholar] [CrossRef]
- Marshall, C.W.; Ross, D.E.; Fichot, E.B.; Norman, R.S.; May, H.D. Electrosynthesis of Commodity Chemicals by an Autotrophic Microbial Community. Appl. Environ. Microbiol. 2012, 78, 8412–8420. [Google Scholar] [CrossRef]
- Groher, A.; Weuster-Botz, D. General medium for the autotrophic cultivation of acetogens. Bioprocess Biosyst. Eng. 2016, 39, 1645–1650. [Google Scholar] [CrossRef]
- Capson-Tojo, G.; Trably, E.; Rouez, M.; Crest, M.; Bernet, N.; Steyer, J.-P.; Delgenès, J.-P.; Escudié, R. Cardboard proportions and total solids contents as driving factors in dry co-fermentation of food waste. Bioresour. Technol. 2018, 248, 229–237. [Google Scholar] [CrossRef]
- Idris, M.O.; Yaqoob, A.A.; Ibrahim, M.N.M.; Noh, N.A.M.; Daud, N.N.M. Electrochemical Measurements of Microbial Fuel Cells (MFCs). In Microbial Fuel Cells for Environmental Remediation; Springer: Singapore, 2022; Volume 1, pp. 41–64. [Google Scholar]
- Poirier, S.; Quéméner, E.D.-L.; Madigou, C.; Bouchez, T.; Chapleur, O. Anaerobic digestion of biowaste under extreme ammonia concentration: Identification of key microbial phylotypes. Bioresour. Technol. 2016, 207, 92–101. [Google Scholar] [CrossRef]
- Escudié, F.; Auer, L.; Bernard, M.; Mariadassou, M.; Cauquil, L.; Vidal, K.; Maman, S.; Hernandez-Raquet, G.; Combes, S.; Pascal, G. FROGS: Find, Rapidly, OTUs with Galaxy Solution. Bioinformatics 2017, 34, 1287–1294. [Google Scholar] [CrossRef]
- Midoux, C.; Rué, O.; Chapleur, O.; Mariadassou, M.; Bouchez, T.; Loux, V.; Bize, A. Easy16S: A User-Friendly Shiny Interface for Analysis and Visualization of Metagenomic Data. In Proceedings of the Journées Ouvertes Biologie, Informatique et Mathématiques (JOBIM), Marseille, France, 3–6 July 2018; Available online: https://hal.archives-ouvertes.fr/hal-01930383/document#page=539 (accessed on 24 July 2019).
- McMurdie, P.J.; Holmes, S. Phyloseq: An R package for reproducible interactive analysis and graphics of microbiome census data. PLoS ONE 2013, 8, e61217. [Google Scholar] [CrossRef] [PubMed]
- Xiang, Y.; Liu, G.; Zhang, R.; Lu, Y.; Luo, H. High-efficient acetate production from carbon dioxide using a bioanode microbial electrosynthesis system with bipolar membrane. Bioresour. Technol. 2017, 233, 227–235. [Google Scholar] [CrossRef] [PubMed]
- Zeng, X.; Borole, A.P.; Pavlostathis, S.G. Biotransformation of Furanic and Phenolic Compounds with Hydrogen Gas Production in a Microbial Electrolysis Cell. Environ. Sci. Technol. 2015, 49, 13667–13675. [Google Scholar] [CrossRef] [PubMed]
- Cai, R.; Minteer, S.D. Nitrogenase Bioelectrocatalysis: From Understanding Electron-Transfer Mechanisms to Energy Applications. ACS Energy Lett. 2018, 3, 2736–2742. [Google Scholar] [CrossRef]
- Wang, A.; Liu, W.; Ren, N.; Zhou, J.; Cheng, S. Key factors affecting microbial anode potential in a microbial electrolysis cell for H2 production. Int. J. Hydrogen Energy 2010, 35, 13481–13487. [Google Scholar] [CrossRef]
- Reguera, G.; Pollina, R.B.; Nicoll, J.S.; Lovley, D.R. Possible Nonconductive Role of Geobacter sulfurreducens Pilus Nanowires in Biofilm Formation. J. Bacteriol. 2007, 189, 2125–2127. [Google Scholar] [CrossRef] [PubMed]
- Sun, L.; Toyonaga, M.; Ohashi, A.; Tourlousse, D.M.; Matsuura, N.; Meng, X.-Y.; Tamaki, H.; Hanada, S.; Cruz, R.; Yamaguchi, T.; et al. Lentimicrobium saccharophilum gen. nov., sp. nov., a strictly anaerobic bacterium representing a new family in the phylum Bacteroidetes and proposal of Lentimicrobiaceae fam. nov. Int. J. Syst. Evol. Microbiol. 2016, 66, 2635–2642. [Google Scholar] [CrossRef]
- Guerrero–Barajas, C.; Ibrahim, M.N.M.; Umar, K.; Yaakop, A.S. Local fruit wastes driven benthic microbial fuel cell: A sustainable approach to toxic metal removal and bioelectricity generation. Environ. Sci. Pollut. Res. 2022, 29, 32913–32928. [Google Scholar]
- Idris, M.O.; Kim, H.C. Exploring the effectiveness of microbial fuel cell for the degradation of organic pollutants coupled with bio-energy generation. Sustain. Energy Technol. Assess. 2022, 52, 102183. [Google Scholar] [CrossRef]
- Rivière, D.; Desvignes, V.; Pelletier, E.; Chaussonnerie, S.; Guermazi, S.; Weissenbach, J.; Li, T.; Camacho, P.; Sghir, A. Towards the definition of a core of microorganisms involved in anaerobic digestion of sludge. ISME J. 2009, 3, 700–714. [Google Scholar] [CrossRef]


Disclaimer/Publisher’s Note: The statements, opinions and data contained in all publications are solely those of the individual author(s) and contributor(s) and not of MDPI and/or the editor(s). MDPI and/or the editor(s) disclaim responsibility for any injury to people or property resulting from any ideas, methods, instructions or products referred to in the content. |
© 2023 by the authors. Licensee MDPI, Basel, Switzerland. This article is an open access article distributed under the terms and conditions of the Creative Commons Attribution (CC BY) license (https://creativecommons.org/licenses/by/4.0/).