Article

Ammonia Removal by Simultaneous Nitrification and Denitrification in a Single Dual-Chamber Microbial Electrolysis Cell

Department of Environmental Science and Engineering, Kyung Hee University, 1 Seocheon-dong, Yongin-si 446-701, Gyeonggi-do, Republic of Korea
*
Author to whom correspondence should be addressed.
Energies 2022, 15(23), 9171; https://doi.org/10.3390/en15239171
Submission received: 25 October 2022 / Revised: 25 November 2022 / Accepted: 28 November 2022 / Published: 3 December 2022

Abstract

:
Ammonia removal from wastewater was successfully achieved by simultaneous nitrification and denitrification (SND) in a double-chamber microbial electrolysis cell (MEC). The MEC operations at different applied voltages (0.7 to 1.5 V) and initial ammonia concentrations (30 to 150 mg/L) were conducted in order to evaluate their effects on MEC performance in batch mode. The maximum nitrification efficiency of 96.8% was obtained in the anode at 1.5 V, followed by 94.11% at 1.0 V and 87.05% at 0.7. At 1.5 V, the initial ammonia concentration considerably affected the nitrification rate, and the highest nitrification rate constant of 0.1601/h was determined from a first-order linear regression at 30 mg/L ammonium nitrogen. The overall total nitrogen removal efficiency was noted to be 85% via the SND in the MEC operated at an initial ammonium concentration of 50 mg/L and an applied cell voltage of 1.5 V. The MEC operation in continuous mode could remove ammonia (50 mg/L) in a series of anode and cathode chambers at the nitrogen removal rate of 170 g-N/m3.d at an HRT of 15. This study suggests that a standalone dual-chamber MEC can efficiently remove ammonia via the SND process without needing additional organic substrate and aeration, which makes this system viable for field applications.

1. Introduction

Nitrogen is one of the essential nutrients in the aquatic ecosystem. However, unwarranted amounts of nitrogen can promote eutrophication by excessive algae growth [1,2,3]. This can also lead to changes in the aquatic ecosystem, such as depleting dissolved oxygen (DO) in the water bodies by undergoing nitrification. Significant nitrogen contamination in the water comes from manure, fertilizers, industrial wastewater, and domestic sewage [4]. In sewage, nitrogen comprises ammonia and organic nitrogen (ex: proteins). Organic nitrogen is transformed into ammonia nitrogen through proteolysis and hydrolysis by bacteria present in sewage. The removal of ammonia nitrogen in water bodies by a biological process can be attributed to nitrogen assimilation by microbes for their metabolic needs and alternatively the employment of the nitrification/denitrification process [5]. In the nitrification process, ammonia and organic nitrogen are converted into nitric and nitrite nitrogen under specific conditions. Furthermore, nitrate nitrogen is reduced to nitrogen gas during the denitrification process [6].
However, the conventional biological nitrogen removal process is often limited by the dependency on organic carbon (C), C/N ratio, additional aeration, and balance of nitrification and denitrification microbes [5]. Moreover, conventional wastewater treatment plants need separate aerobic nitrification and anaerobic denitrification processes for nitrogen removal [7]. Moreover, in order to derive nitrification, it is essential to pump air externally to maintain the desired concentration of DO to pursue the nitrification process, which can increase operational costs by up to 45% [8]. Therefore, the scientific community is searching for alternative technologies for pursuing efficient nitrification and denitrification processes. In this regard, bioelectrochemical systems (BES) seem attractive due to the requirement of minimal operational energy compared to the wastewater treatment plant and the possibility of modifying the system for power generation and nitrogen removal [9,10,11].
Several researchers have pursued nitrogen removal in BES with algae, which can assimilate the nitrogen for their metabolic needs [12] and use the autotrophic microbes at the cathode for denitrification [13]. The external aerated nitrification for conversion of ammonia nitrogen to nitrites/nitrates and further denitrification using biocathodes of BES was also tested [14]. In BES, denitrification at the biocathode can be pursued using either heterotrophic or autotrophic microbes. Autotrophic denitrification is advantageous due to the independence of the organic carbon requirement for nitrogen reduction and the low biomass generation [15]. In particular, the autotrophic bacteria accept the electron from a poised cathode either via the mediated transfer (by H2 and enzymes) or via the direct electron transfer mechanism as discussed in the literature [16,17,18,19]. Overall, the operation of biocathode in BES for denitrification is sustainable for field-scale applications. However, ammonia nitrogen at higher concentrations in wastewater needs to be handled to achieve complete nitrogen removal.
It is well known that water electrolysis takes place in MEC with the application of external voltage [20,21,22,23], and the generated O2 in this process can be used by aerobic nitrifiers to convert ammonia to nitrate/nitrite. The anodic effluent with nitrate/nitrite then can be supplied to the biocathode, where the autotrophic denitrifying bacteria can reduce them directly to nitrogen gas. In earlier SND applications using MECs, the organic substrate was used at the anode for the nitrifiers to convert ammonia into nitrate, which limits its application only to the removal of ammonia from organic-containing wastewater. Therefore, for the first time, the possibility of SND from synthetic wastewater was explored without organic substrate via the simultaneous nitrification and denitrification (SND) in a two-chamber MEC with an external power supply. The primary operational parameters such as applied voltage (0.7, 1.0, 1.5 V) and initial ammonium concentrations (30, 50, 150 mg NH4-N/L) were selected in order to evaluate their effect on the MEC performance for nitrification at the anode and denitrification of anodic effluent at the cathode. The MEC was also tested in continuous mode for SND at different hydraulic retention times (HRT) viz. 15, 20, and 25 h in order to verify this technology for future scale-up applications.

2. Materials and Methods

2.1. Fabrication and Inoculation of MEC for SND

The schematic diagram of the double chamber MEC reactor for SND used in this study is shown in Figure 1. The MEC reactor was fabricated using polyacrylate sheets, with a total working volume of 420 mL. The anode and cathode chambers of MEC were separated by a cation exchange membrane (MI 7000, Membrane International Inc., Ringwood, NJ, USA) instead of a proton exchange membrane (PEM) due to their high rigidity in the corrosive environment, versatility, and low-cost. A carbon fiber brush having a projected surface area of ~50 cm2 (Φ: 4 cm × 4 cm × 10 cm, Guemsung Brush21, Seoul, Republic of Korea) with stainless-steel wire support was used as an anode and cathode. The anode and cathode chambers of MEC were inoculated with sewage sludge collected from Suwon Sewage Treatment Plant (Hwaseong-si, Gyeonggi-do) [24,25]. The collected sludge was stored in refrigerated conditions at 4 °C and was diluted with an anaerobic medium (containing the desired amount of ammonium nitrogen, 30, 50, and 150 NH4-N mg/L, 0.3 g/L KH2PO4, 1.0 g/L Na2HPO4·12H2O, 0.5 g/L NaCl, 2.0 g/L NaHCO3, 0.1 g/L MgSO4·7H2O, 0.01 g/L CaCl2, and 0.2–0.4 g/L NH4Cl, 1ml/L vitamins, and 10 mL/L trace metal solution) in a volume ratio of 50% (v/v). The necessary nutrients for the growth of microbes are included in ammonium solution, as presented in earlier studies [26,27]. The initial properties of sludge in terms of pH, mixed liquor volatile suspended solids, COD, NH4-N, and DO were 7.2, 1130 mg/L, 13,480 mg/L, 16 mg/L, and 3.2 mg/L, respectively. After inoculation, MEC was operated for one month to develop nitrifiers at the anode and denitrifiers at the cathode. The sludge properties such as chemical oxygen demand (COD), pH, total solids, volatile suspended solids, total ammoniacal nitrogen, etc. were analyzed by the standard methods presented in APHA [28]. Prior to the closing of MEC, the anode and cathode were flushed with argon gas to sustain anaerobic conditions.

2.2. Operation of MEC for SND

The anode and the cathode of MEC were connected to the corresponding voltage terminal of a DC power supply, as presented in earlier studies [29]. The applied potential was regulated in the range 0.7 V, 1.0 V, and 1.5 V to evaluate the SND performance of MECs. DO availability in the anode chamber is crucial for the nitrification process. Thus, prior to the biotic tests, control operations were conducted to estimate the DO availability at the anode at each applied potential. The DO concentrations at different time intervals were measured using an ORION STAR probe (Thermo Scientific, Waltham, MA, USA). After ensuring stable DO concentrations at different impose potentials, the anodic chamber was inoculated with the enriched nitrifiers at an initial ammonium nitrogen of 50 mg/L and an applied voltage of 0.7 V across the electrode. After noting a stable ammonium nitrogen removal, the applied voltages were varied in the range of 0.7 V, 1.0 V, and 1.5 V, and the optimized voltage based on the ammonia nitrogen removal was selected for the next experiment. Later, the effect of different ammonia concentrations ranging from 30, 50, and 150 NH4-N mg/L was tested under optimized voltage conditions, which in this case was noted to be 1.5 V. The MECs were operated in batch mode with a batch cycle time of 100 h. For denitrification studies, the anode chamber was initially filled with the influent containing~50 mg/L ammonia nitrogen concentration, and after achieving a considerable conversion of ammonia nitrogen to nitrate-nitrogen, the effluent was taken out and treated with 1.5 mg/L of L-Cysteine to mitigate the DO. Next, the nitrate-rich effluent without further addition of supplements was added to the cathode chamber for denitrification. Additionally, the solutions at the anode and cathode inlet were purged with argon gas to minimize the interference of external oxygen.
After finishing the batch mode operations, the MEC was operated under continuous mode using a peristaltic pump. The initial ammonia-nitrogen concentration and the applied voltage across the electrodes were fixed at 50 mg/L and 1.5 V, respectively. The performance of MECs was evaluated at different hydraulic retention time of 15 h, 20 h, and 25 h by controlling the flow rate function in the pump. In all the operational conditions (batch or continuous mode), the MECs were operated in a temperature-controlled environment at 35 °C in an incubator. Both the anode and cathode chambers were stirred continuously at 120 rpm.

2.3. Analysis

Nitrogen components in MEC such as ammonia, nitrate, and nitrite, were analyzed by using HS kit (HS-NH3(N)-L kit, HS-NO3(N)-H kit, HS-NO2(N)-L kit, TN(CA)-L kit, Humas, Republic of Korea), as per the protocols provided by the company. Before the measurement, the liquid samples from both chambers were carefully collected at regular time intervals and filtered using a syringe filter (0.2 μm, Sartorius stedim, Göttingen, Germany). The filtrates were properly diluted to match the concentration range and mixed with the reagents provided with kits. Finally, the concentrations were measured the in a spectrophotometer (OPTIZEN™ POP UV-VIS, Daejeon, Republic of Korea) programmed with pre-defined protocols and calibration curves for different ammoniacal nitrogen concentration measurements. The DO concentration in the anode chamber was measured using a DO probe (Orion 3 star, Thermo Scientific, Waltham, MA, USA) fixed with the anode chamber. A pH probe with a datalogger (pH-200L, ISTEK, Seoul, Republic of Korea) was used to measure the influent and effluent pH.

3. Results and Discussion

3.1. Oxygen Generation in the Anode Chamber at Different Applied Voltages

The concentration of dissolved oxygen (DO) needs to be maintained at a certain level for biological ammonia conversion to nitrate by the nitrification process [30]. For biological nitrification, 4.57 g of oxygen is theoretically required for the conversion of one gram of ammonia. Stenstrom and podusko reported a minimum threshold of DO concentration as 0.5 mg/L for the nitrification process although, at this DO, the nitrification rate was limited [31]. They suggested a recommended DO range of 2~4 mg/L to achieve a moderate rate of nitrification. It is also known that the nitrifiers are primarily distributed in activated sludge floc particles, and the DO concentration of flocs is lower than the surrounding liquid [32]. Therefore, maintaining consistent DO concentration throughout the reactor operation is essential to achieve a successful nitrification process.
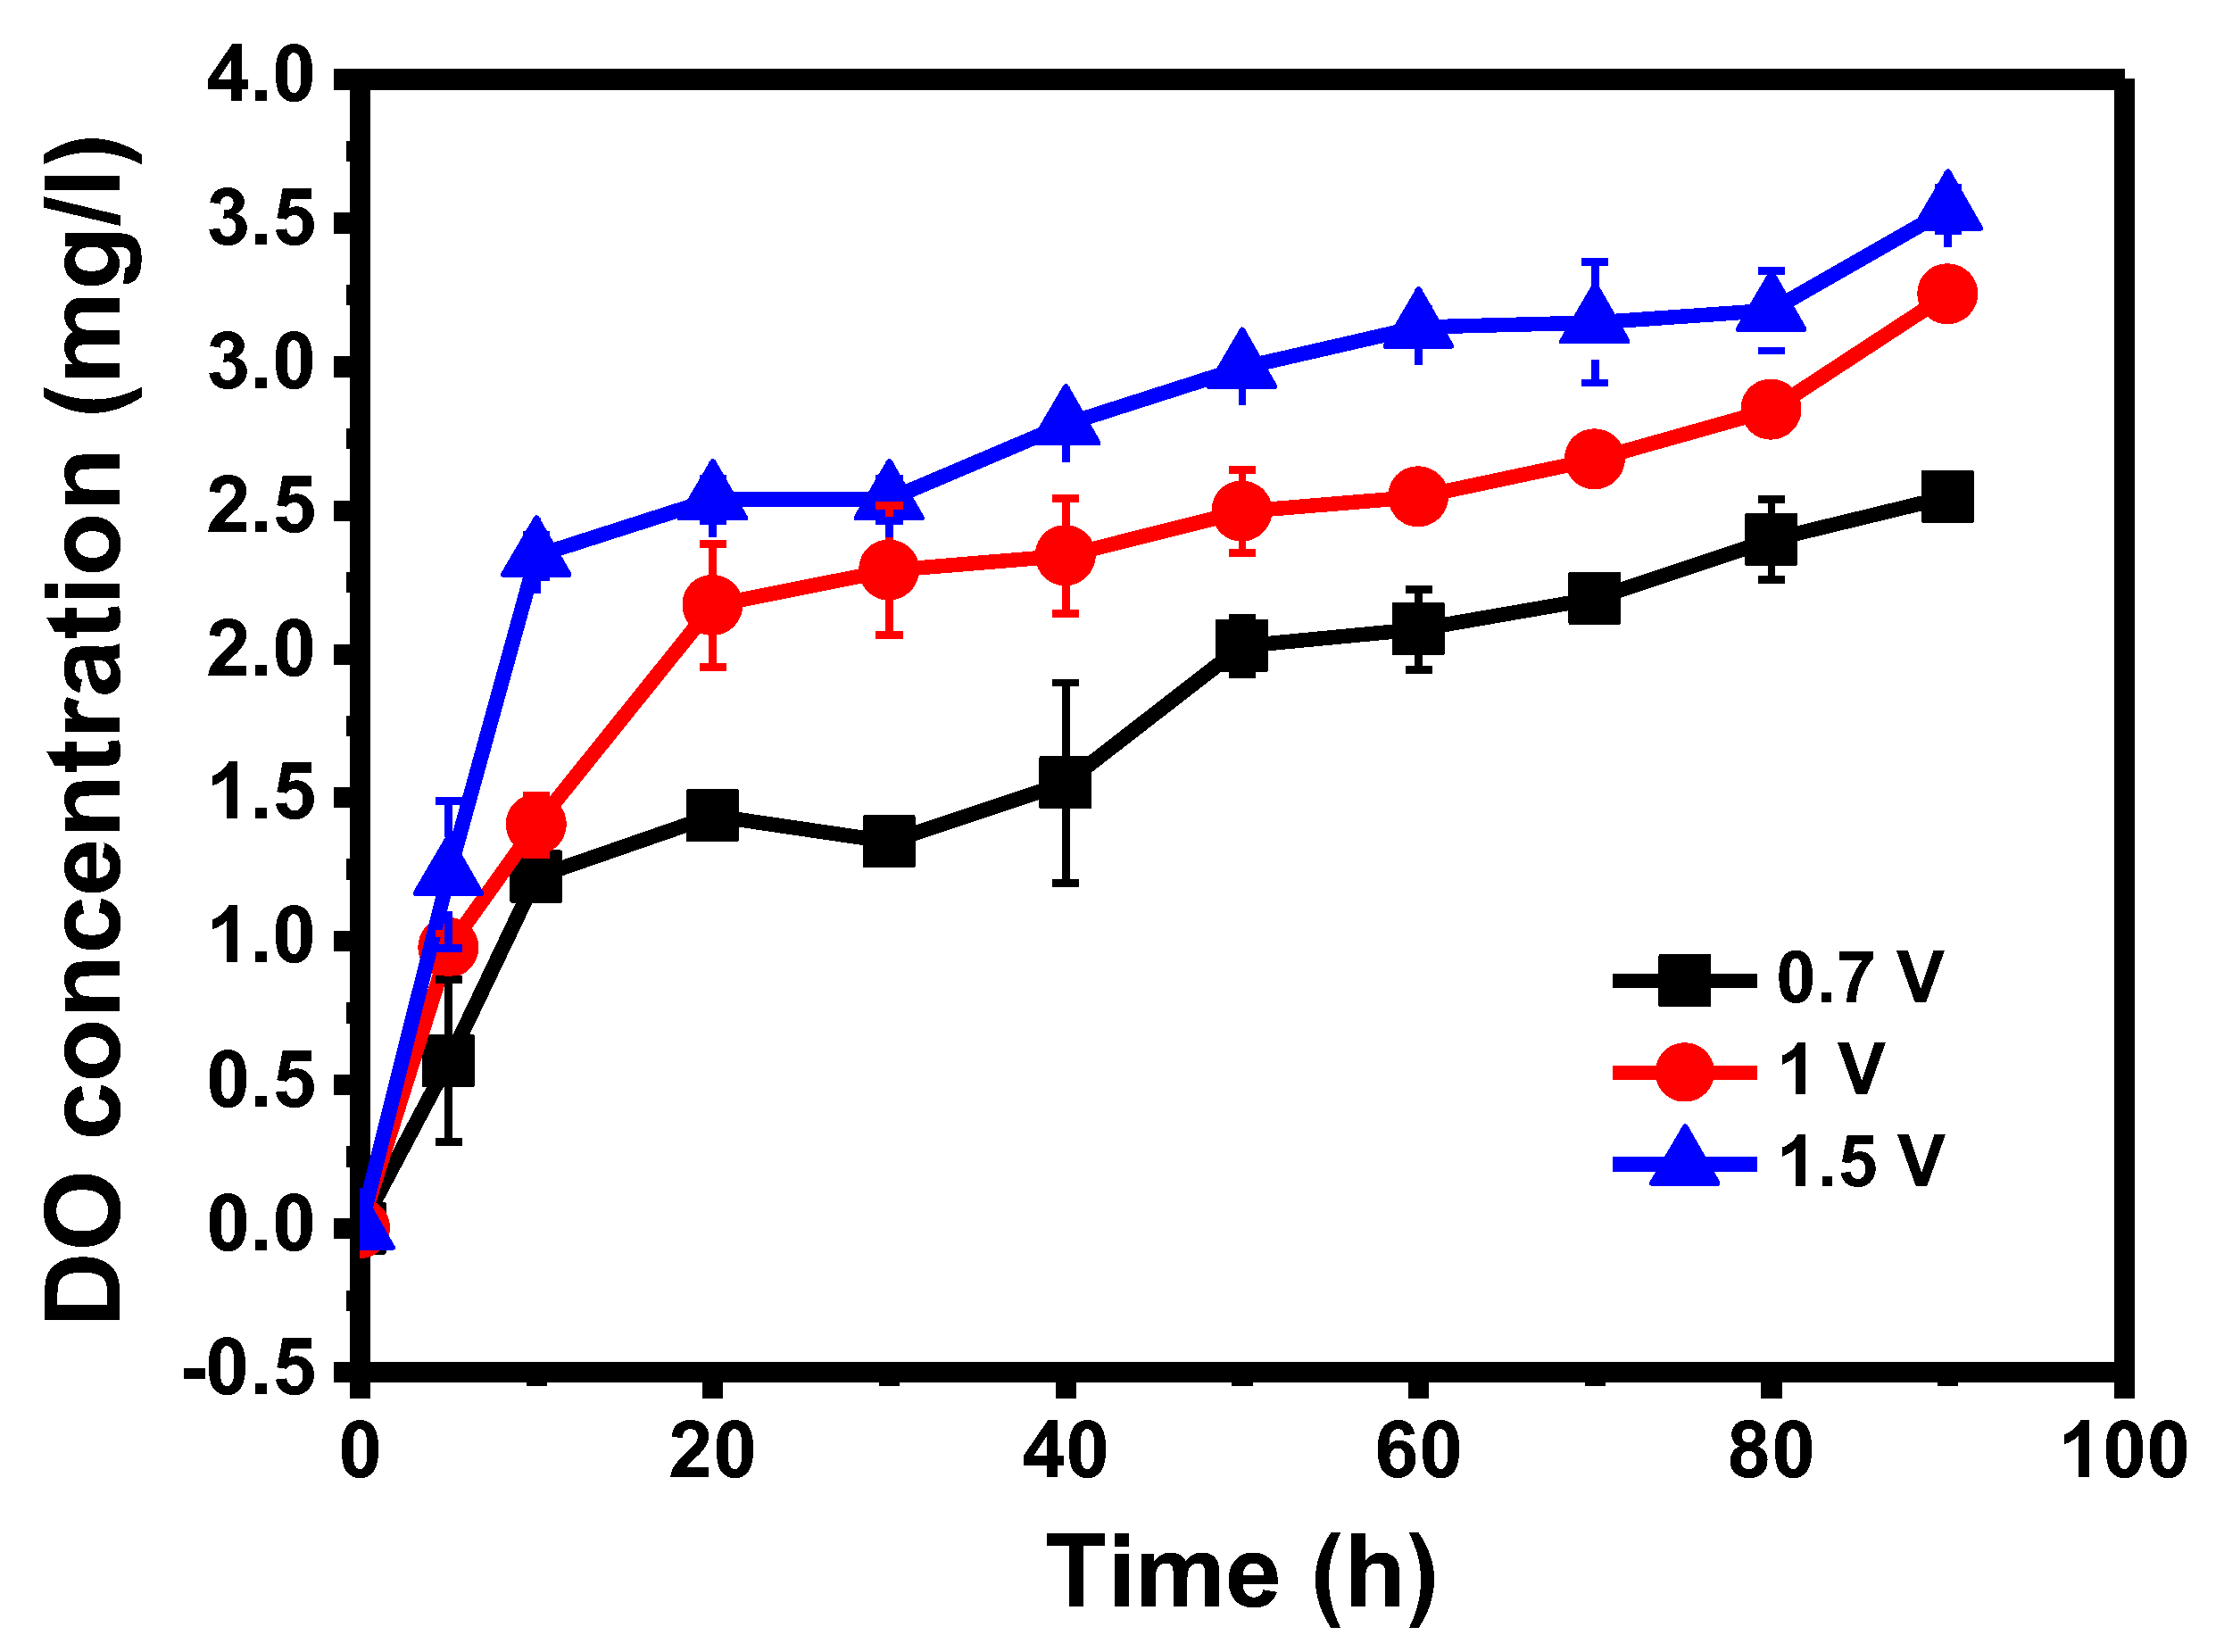
The DO concentrations were noted to increase with an increase in the applied voltage between the anode and cathode due to a high rate of water electrolysis at increased applied voltages (Figure 2). With the time of operation, the DO concentration increased in all the conditions and finally reached to 2.6, 3.0, and 3.1 mg/L at 0.7 V, 1.0 V, and 1.5 V, respectively, after 70 h of the test. This increasing trend of DO might continue until the saturation limit is achieved, which is about 8 mg/L at standard temperature and pressure conditions. The lower limit of recommended DO of 2 mg/L for nitrification was obtained after around 10 h for 1.5 V, 20 h for 1.0 V, and 50 h for 0.7 V [33]. Thus, at all applied voltage conditions, the DO concentrations were higher than 2 mg/L at some point, which is sufficient to pursue a nitrification reaction. With applied voltages of 0.7 V, 1.0 V, and 1.5 V, the DO generation rate was noted to be 0.26, 0.52, and 0.65 mg/l/h, respectively. However, further increase in applied voltage to 2.0 V, the corrosion of stainless-steel wire was observed, which caused the failure of nitrification.

3.2. Nitrification at the Anode of MEC

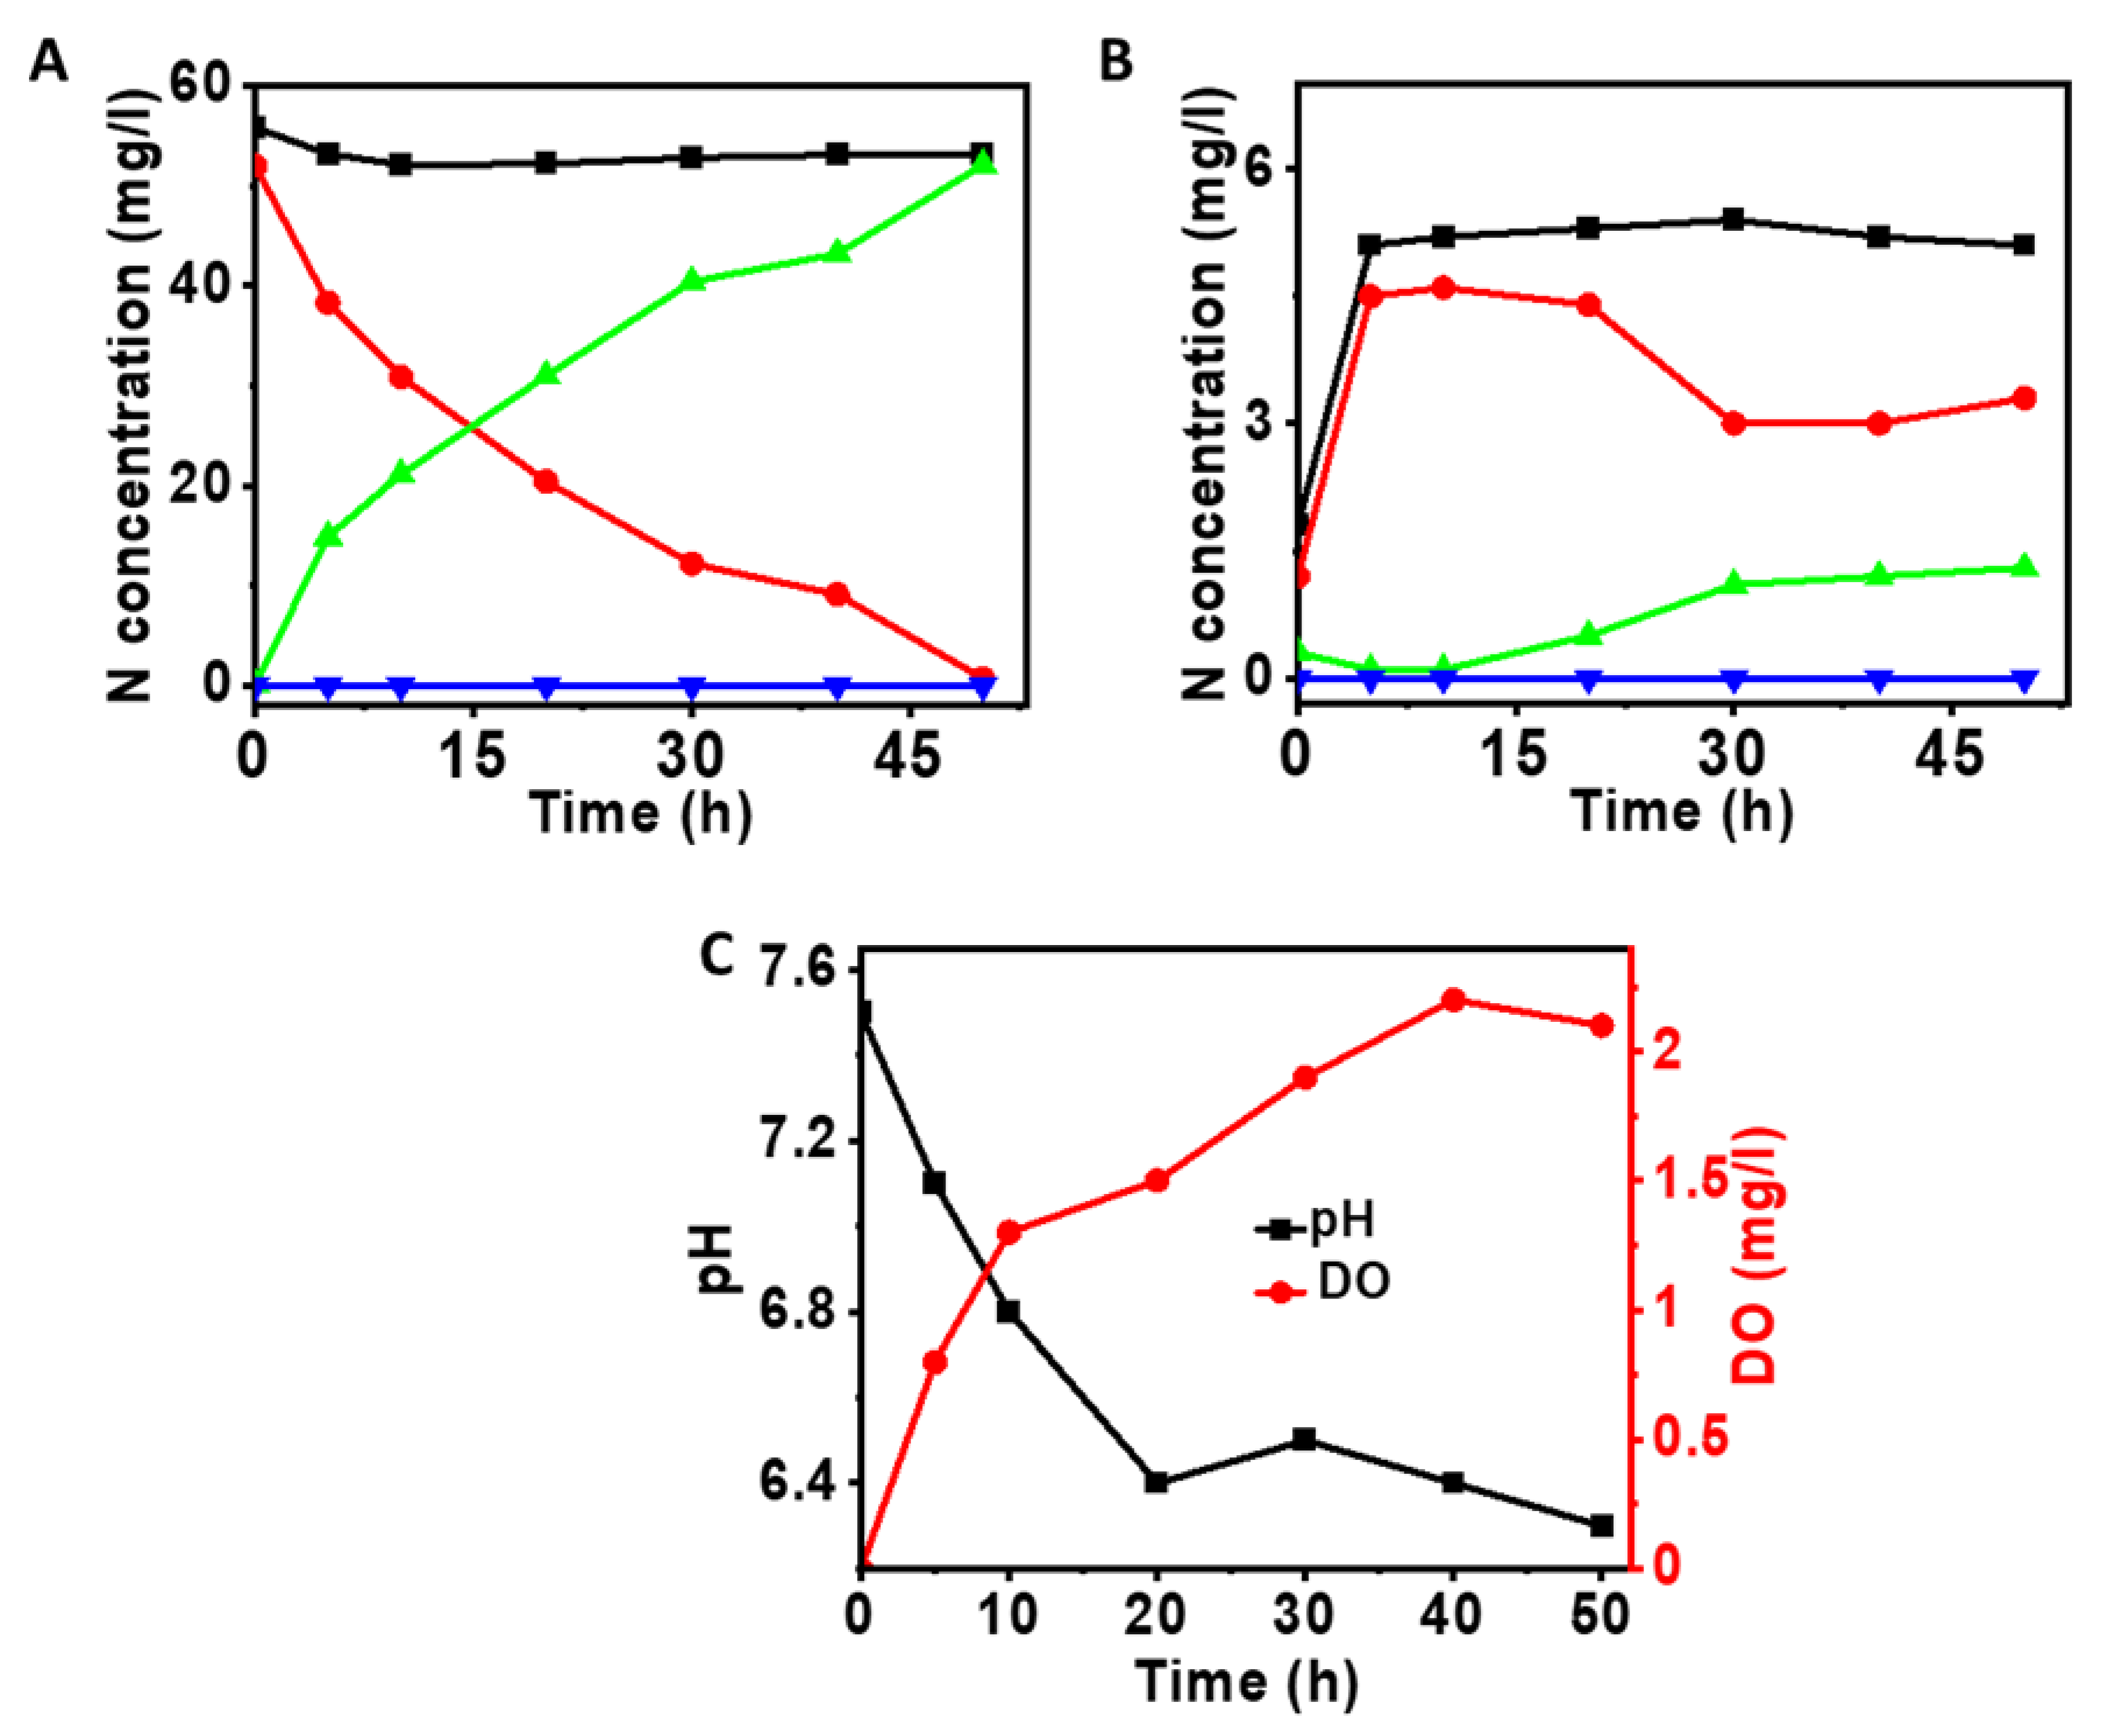
The possible reaction at the anode is the water electrolysis which generates oxygen, proton, and electrons and the conversion of ammonia to nitrite/nitrate by nitrifiers by consuming the oxygen (Table 1). In order to develop nitrifiers at the anode of MEC, the anode chamber was supplemented with sewage sludge as an inoculum along with 50 mg/L of ammonium nitrogen and 0.7 V of applied voltage (Figure 3A). After one month of acclimatization, stable removal of ammonium nitrogen was noted. By utilizing the DO generated by water electrolysis, the nitrifiers catalyzed the decrease in ammonium-nitrogen concentrations with a parallel increase in nitrate-nitrogen. The initial 55.8 mg/L of ammonium nitrogen was decreased to 0.7 mg/L, with a simultaneous increase in nitrate-nitrogen concentrations to 52.1 mg/L. By the end of the operation (50 h), and 93.3% conversion of ammonium nitrogen to nitrate nitrogen was observed. A concentration-based diffusion of ammonia nitrogen and nitrate nitrogen was noted from the anode to the cathode. On average, 5 mg/L of total nitrogen (3.5 mg/L of ammonium nitrogen and 1.5 mg/L of nitrate-nitrogen) was diffused from anode to cathode (Figure 3B). No formations of nitrite nitrogen were recorded. At the same time, the DO concentrations have increased from 0 to 2.1 mg/L, with a generation rate of 0.19 mg/L/h. With the increase in the operation time, a decrease in pH is also noted due to water splitting (Figure 3C). Taken together, the variations in DO, with a change in ammonium and nitrate, suggest the effective nitrification process.
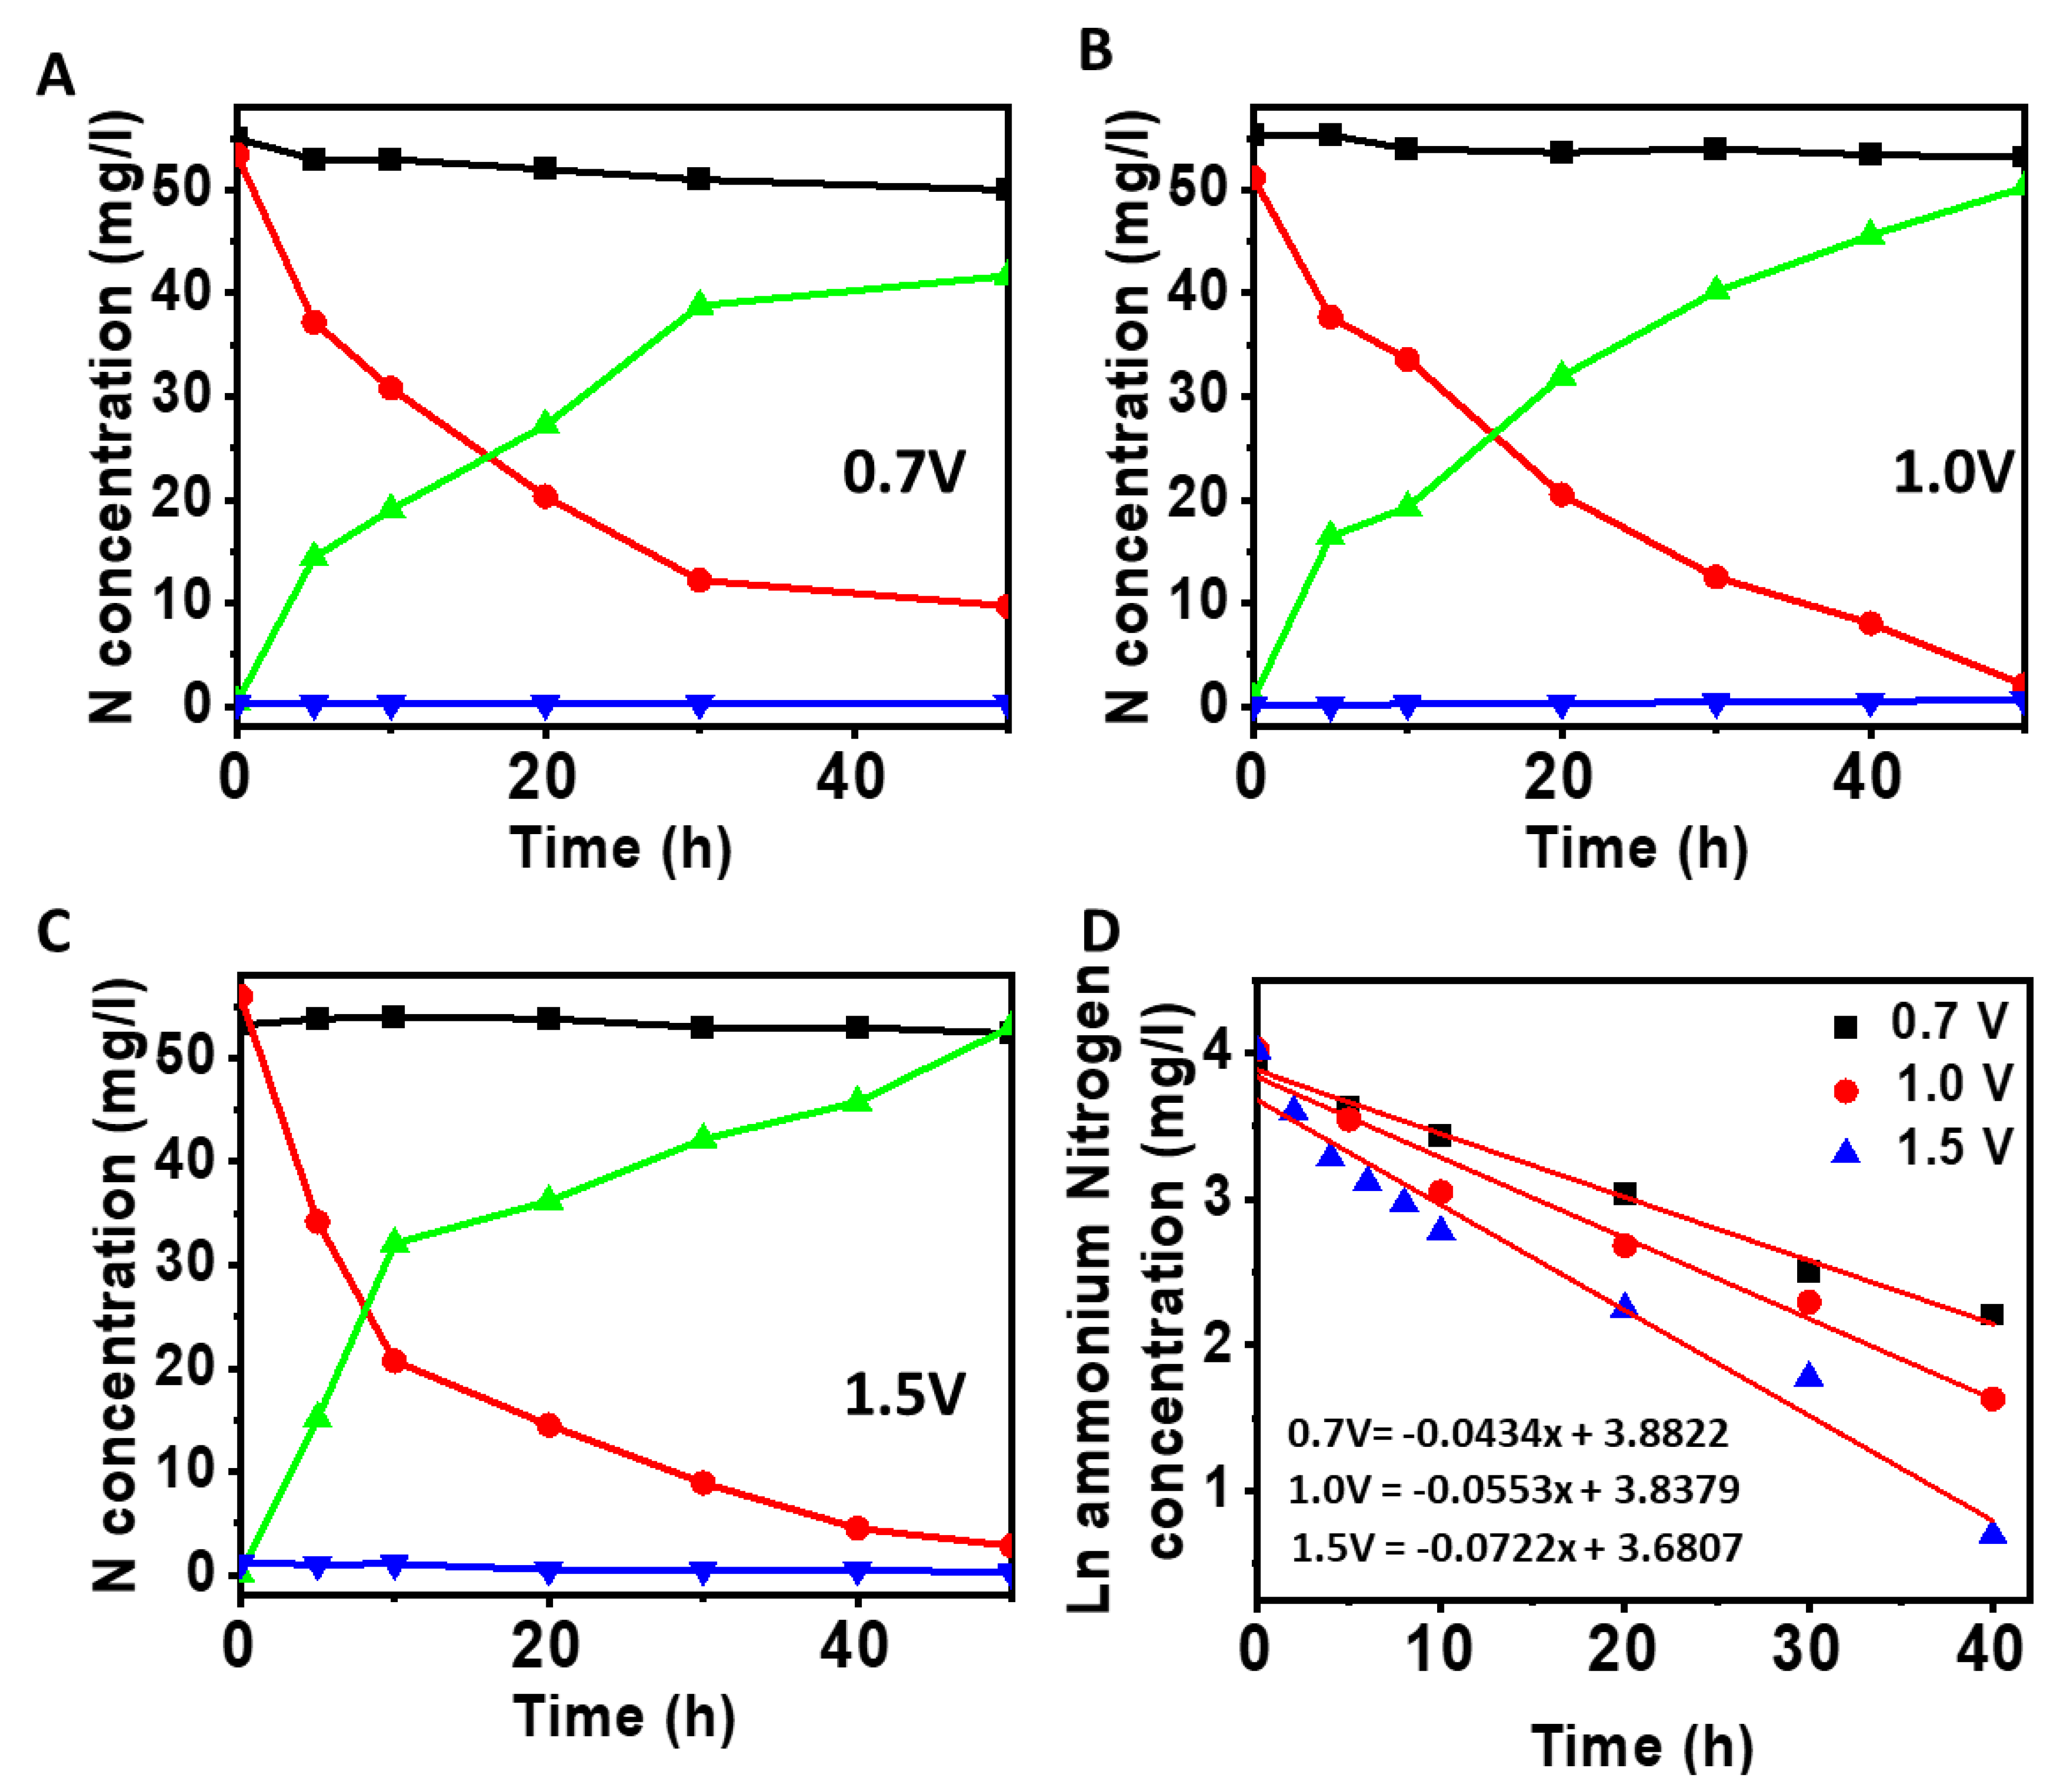
Furthermore, the variation in applied voltage was tested on the nitrification process by maintaining similar ammonium nitrogen concentrations (50 mg/L) (Figure 4). With an increase in applied voltage, a higher conversion of ammonium nitrogen was noted due to the availability of higher DO (Figure 4A–C). A similar phenomenon was noted in other studies of MEC; in their study, the increase in applied current (0 to 0.3 mA/cm2) has led to an increase in DO concentration (0 to 3 mg/L), thereby enhancing nitrification rate by almost 3-times from ~0.11 g-N/m2.h to ~0.34 g-N/m2.h [34]. By applying 0.7 V, 1.0 V, and 1.5 V sequentially on MEC, the nitrification percentages were 87.05%, 94.11%, and 96.80%, respectively. The applied voltage has effectively contributed to the increase of the nitrification rate. By the end of the operation (50 h), all the ammonium nitrogen was nitrified to nitrate at all applied voltage conditions with a high nitrification rate of with corresponding removal rate of 0.95 (57 g/m3.d), 1 (63 g/m3.d) and 1 g-N/m2.h (62.6 g/m3.d) at 0.7, 1.0 and 1.5V, respectively. In some earlier studies, for instance, Watanabe et al., reported ~99% ammonia removal efficiency with a removal rate of 0.34 g-N/m2.h in a MEC using an applied current of 0.1 mA/cm2 [34]. Zhan et al. (2014) reported an ammonia removal rate of 60 g/m3.d in a single chamber MEC with an anodic imposed potential of +800 mV (vs. SHE) [35]. The same group note a relatively lower rate of 25 and 37 g/m3.d in a single chamber MEC at a lower anodic impose potential of +209 mV and +279 mV (vs. SHE), respectively [5]. Moreover, the ammonia removal efficiency in this study was noted to be higher than the rate of 96.6%, 66.6 and 96.8% obtained for the microbial fuel cells (MFC) using activated carbon, zinc, and carbon black as anode materials, respectively [36]. However, MFCs are generally utilized for energy extraction from wastewater in contrast to MECs in this study, which utilized electricity for SND. Therefore, the overall nitrification efficiency based on the energy calculations can be significantly different in both systems. At 20 h, with 0.7 V, 1.0 V, and 1.5 V, the effluent ammonium nitrogen concentrations were 20.4, 13.5, and 10.9 mg/L, respectively. Overall, the total nitrogen concentration was found to be similar. By the increase in applied voltage, no nitrite nitrogen generations were noted. This suggests that enriched denitrifiers are efficient in converting ammonium to nitrate. Overall, the voltage and the nitrification rate showed a positive correlation.
Moreover, no nitrification was noted in control experiments without any applied voltage (Data not shown), thereby suggesting that nitrifiers at the anode efficiently utilized the DO, generated from electrolysis. In general, even at high DO concentrations in the bulk liquid, there are anoxic environments in the deeper region of the aerobic biofilm due to improper oxygen diffusion, thereby limiting the nitrification rate [31]. The oxygen in the MEC can be generated from both sides of the biofilm, namely the anode surface and the bulk solution. This could minimize the anoxic biofilm zone and increase the rate of nitrification. Additionally, the ammonium nitrogen removal kinetics during the nitrifications were pursued and exhibited in Figure 4D. As pointed out in earlier studies, Michaelis–Menten kinetics were implemented to pursue the kinetic evaluation [30]. The ammonium nitrogen removal at the anode of MEC has followed the first-order kinetics. With regard to the linear equations of ammonium nitrogen removal with respect to time and their slopes, the computed constants with the application of 0.7 V, 1.0V, and 1.5 V, are noted to be 0.044, 0.055, and 0.072 L/h, respectively. Moreover, at all applied voltage conditions, the regression coefficients (R2) were in a range of 0.98~0.99. Thereby suggesting a good fit between the experimental data and computed model kinetics.

3.3. Influence of Ammonium Nitrogen Loading on Nitrification
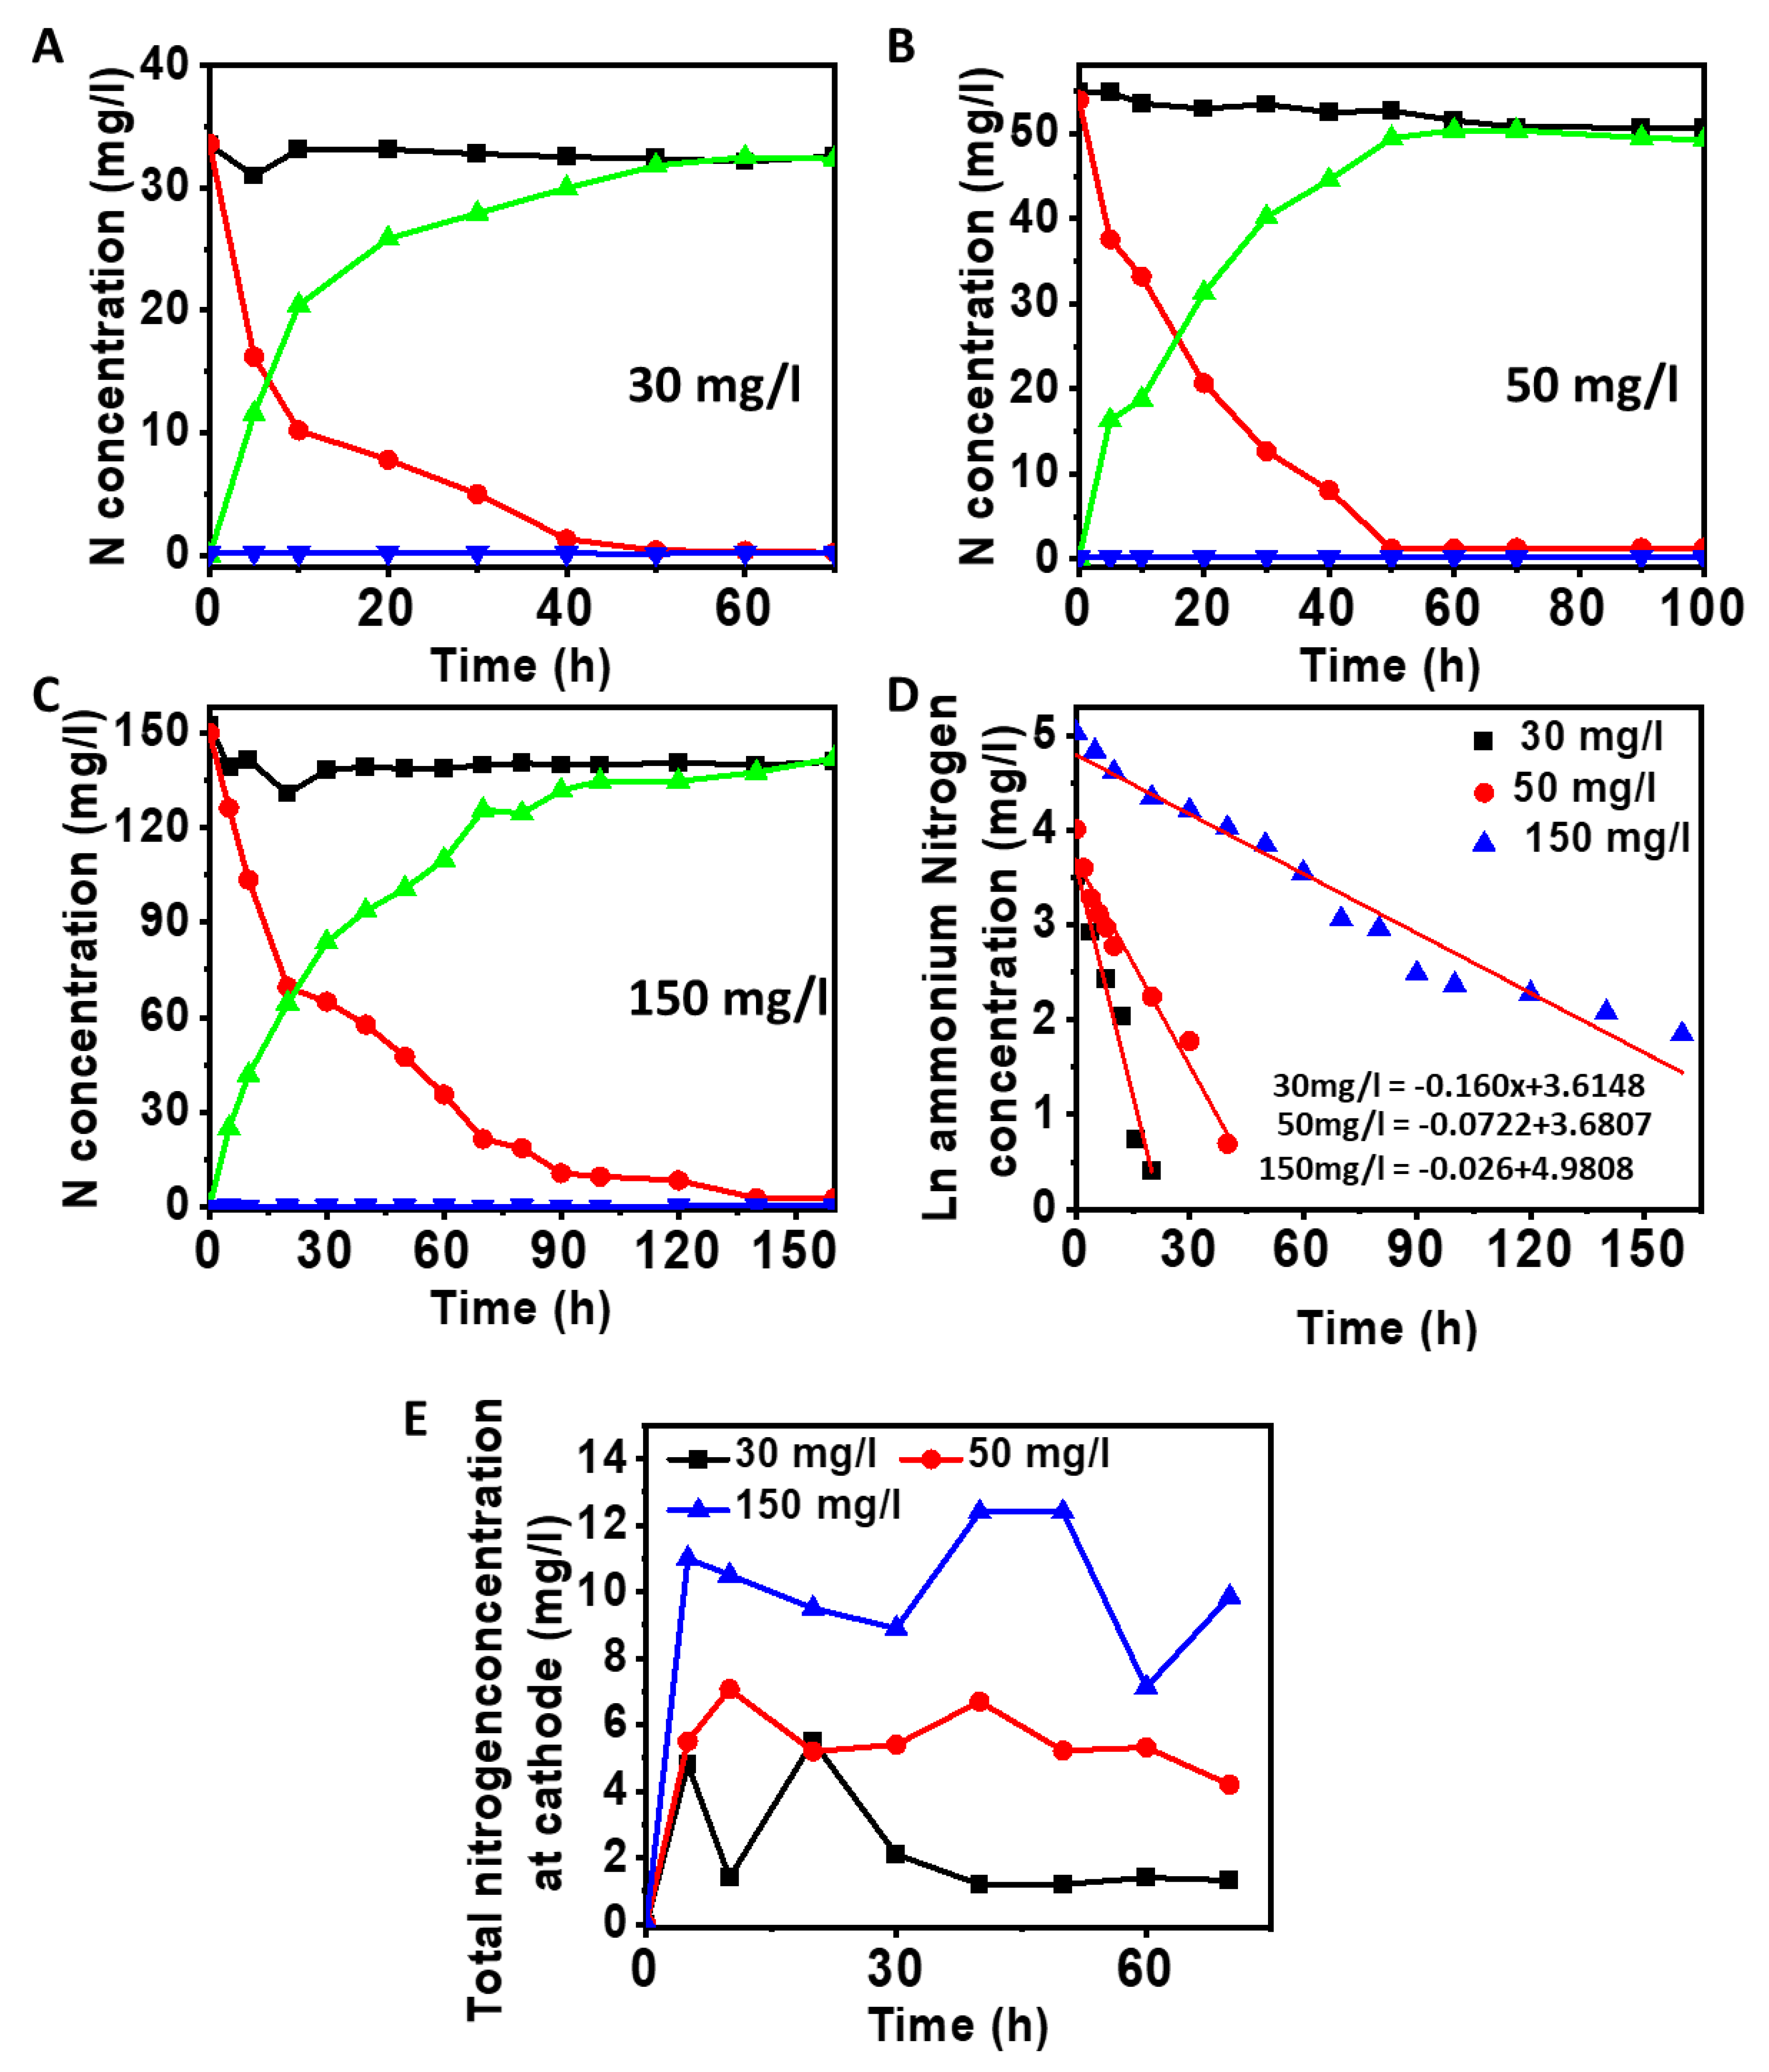
As the application of 1.5 V has achieved higher DO and nitrification rates; therefore, further experiments were pursued with an applied voltage of 1.5 V. Considering the high ammonia concentration in a wide range of wastewater, for example, 429 mg/L for leachate [37], 158 mg/L for poultry slaughterhouse wastewater [38], and 61 mg/L for tannery wastewater [39], it is necessary to test a wide range of ammonia concentration in MECs for their field-scale applications. Maintaining the same applied voltage, with variations in initial ammonium nitrogen concentrations (30, 50, and 150 mg/L), has exhibited different nitrification rates. By using low concentrations of ammonium nitrogen (30 mg/L), complete removal was achieved within a short duration of 20h. The initial 30 mg/L was reduced to 1.5 mg/L. With further increase in influent loading to 50 mg/L and 150 mg/L, the total removal was observed at 50 h and 140 h, with an effluent concentration of 1.8 mg/L and 7.2 mg/L, respectively; this suggests that higher influent ammonium nitrogen concentrations require an apparent more extensive operational time. (Figure 5). The increase in loading rates of ammonium nitrogen has also led to a decrease in nitrification rates. This is possible because of the lower DO availability for the nitrifiers at a higher ammonia concentration. In an earlier study, the decreasing trend of nitrification rate in a conventional nitrification reactor was reported with an increase in the initial concentrations, for example, an ammonia removal rate was noted to 46 mg-N/L.d at an initial ammonia concentration of 50 mg/L, which decreased to 38 mg-N/L.d at 500 mg/L initial ammonia concentration [40]. The nitrification rates of ammonium nitrogen during the initial operation (20 h) with 150 mg/L were noted to be 4.011 mg/L/h (Figure 5A). This was followed by 50 and 150 mg/L of ammonium loading with a nitrification rate of 1.305 and 1.635 mg/L/h, respectively (Figure 5B,C).
The first-order kinetics were implemented on ammonium nitrogen removal with variation in loading at an applied voltage of 1.5 V (Figure 5D). The calculated constants from using 30, 50, and 150 mg/L of ammonium nitrogen in MEC were 0.160, 0.072, and 0.026 L/h, respectively. The rate constants obtained in this study were noted as slightly matching the reported value of 0.06 1/h obtained for the conventional nitrification process with an initial ammonia nitrogen concentration in the range of 200–400 mg/L [41]. However, the nitrification reaction at a higher initial ammonia nitrogen concentration (150 mg/L) was noted as kinetically slow as compared to the other loadings. This is possible because of the lower DO availability for the nitrifiers at a higher ammonia concentration. In an earlier study, the decreasing trend of nitrification rate in a conventional nitrification reactor was reported with an increase in the initial concentrations, for example, an ammonia removal rate was noted to 46 mg-N/L.d at an initial ammonia concentration of 50 mg/L, which decreased to 38 mg-N/L.d at 500 mg/L initial ammonia concentration [40]. Similar to the difference in applied voltage, no change in byproduct formations was varied with a change in ammonium nitrogen loading. In contradiction to earlier studies, no formation of nitrate-nitrogen was noted, which can be due to the selective transformation of nitrifiers [34]. However, diffusion in total nitrogen was noted from anode to cathode with the increase in influent concentrations of ammonium nitrogen (Figure 5E). It was noted that about 11.2, 10.4, and 14.3% diffusion of total nitrogen from anode to cathode was noted when the influent loading concentrations were 30, 50, 150 mg/L, respectively. Thereby suggesting a requirement for the ion-selective membrane that can mitigate nitrogen diffusion or operating in continuous mode to minimize the diffusion.
Figure 5. The variation in N concentrations with variation in ammonium nitrogen loadings. In this case, 30 mg/L (A), 50 mg/L (B), and 150 mg/L (C). The linear regressions (D) noted at different loadings of ammonium nitrogen with an applied voltage of 1.5 V. The diffusion of nitrogen ions in terms of total nitrogen (E) from anode to cathode.
Energies 15 09171 g005

3.4. Denitrification at Cathode Using Nitrified Anode Solution

Denitrification at the biocathode of MEC can be achieved by bioelectrochemical reduction reactions via direct electron transfer or indirect electron transfer with hydrogen. (Table 1) [42,43,44]. The nitrified solutions from the anode of MEC containing 55 mg/L of nitrate-nitrogen are submitted to the cathode to pursue denitrification. At the anode, the nitrification reaction was pursued 100 h with an applied voltage of 1.5 V. Prior to submitting anode effluents to the cathode, the solutions rich in nitrate-nitrogen were sparged with argon gas to remove DO as the presence of DO can limit the denitrification rate. Additionally, L.Cystein was added to anode effluents to mitigate/minimize the DO at 1.5 V [5]. The typical variation in nitrate-nitrogen is presented in Figure 6. By the end of the operation (170 h), the 55 mg/L of nitrate-nitrogen was decreased to 4.2 mg/L, thereby achieving an SND process in MEC. No change in nitrate-nitrogen concentrations was noted in the control experiments without an applied voltage (Data not shown). This suggests that denitrification is dependent on the applied voltage, as it is presumed that denitrifiers require an electron source to convert nitrate to nitrogen [44]. The final concentration of total nitrogen, nitrate, and ammonium nitrogen noted at the cathode after denitrification was 3, 2.5, and 0.3 mg/L, respectively. Therefore, the MEC demonstrated comparable denitrification rate of 0.25 g-N/m2.d (16.4 g-N/m3.d) and an overall total nitrogen removal rate (15.9 g-N/m3.d) to the reported values of 18 g-N/m3.d (initial nitrate-nitrogen ~20 mg/L) in a conventional reactor [45] and higher than the value of 8.2 g-N/m3.d in a single chamber MEC operated at an applied voltage of 0.4 V [5]. Moreover, the obtained ammonia removal rate without any organic substrate in this study was noted to be comparable to the recent studies conducted in microbial fuel cells with organic substrates (Table 2). Throughout the denitrification process, the concentrations of nitrite nitrogen were less than 2.5 mg/L. Additionally, the diffusion of nitrogen ions from the cathode to the anode is also evaluated. The total nitrogen concentrations noted at the anode chamber due to diffusion were less than 2.9 mg/L (Figure 6B). Overall, 44.5 mg/L or 80.9% of total nitrogen was converted to nitrogen gas. Here the residual amount of nitrate-nitrogen and nitrite nitrogen in catholyte can be due to the DO diffusion from anode to cathode (Figure 6C), thus limiting the denitrification. The earlier studies noticed a reduction in the denitrification rate by 85%, with a DO concentration of more than 2 mg/L [34]. A similar phenomenon was noted in other studies of the single-chamber SND process due to increased DO concentration [44].
Table 2. The simultaneous nitrification and denitrification in BESs.
BES TypeVolume, mL *Main SubstrateOperating ConditionsMicrobesNH4-N rem. Rate (g-N/m3.d)NH4-N rem. eff. (%)Ref.
AnodeCathode
Dual chamber MFC3363360.393 g/L CH3COONa and 0.407 g/L NH4ClContinuous, 6.86 h HRTMixed bacteria enrichment10494[46]
Dual chamber MFC4.1 L4.1 Ldecomposed cyanobacteria solution of 800–1000 mg/L COD and 0.06–0.1 g/L NH4-NBatch modeMixed bacteria enrichment64 [47]
Triple chamber with multianode design2.8 L2.8 L1 g/L CH3COONa and 0.06 g/L NH4−Nsequencing batch, 3-day HRTMixed bacteria1278[48]
Triple chamber with multicathode design1201200.55 g/L CH3COONa and 0.05 g/L NH4-NBatch mode, 6-dayMixed bacteria6.496[49]
Single chamber air-cathode MFC150 1.2 g/L CH3COONa and 0.25 g/L NH4ClContinuous mode, 2.5 h HRTMixed bacteria62094[50]
Dual chamber MFC2502500.64 g/L CH3COONa and 0.23 g/L NH4ClBatch mode, 4-dayMixed bacteria enrichment55.2~100[51]
Dual Chamber MEC4204200.030–0.15 g/L NH4-NBatch mode at 1.5 V applied potential, 50 hMixed bacteria enrichment1585This study
Dual Chamber MEC 30–150 mg/L NH4-NContinuous mode at 1.5 V applied voltage, 15 h HRTMixed bacteria enrichment17081This study
* Stated otherwise, MFC-Microbial Fuel Cell, MEC-Microbial Electrolysis Cell.

3.5. MEC Operation in Continuous Mode for Ammonia Removal

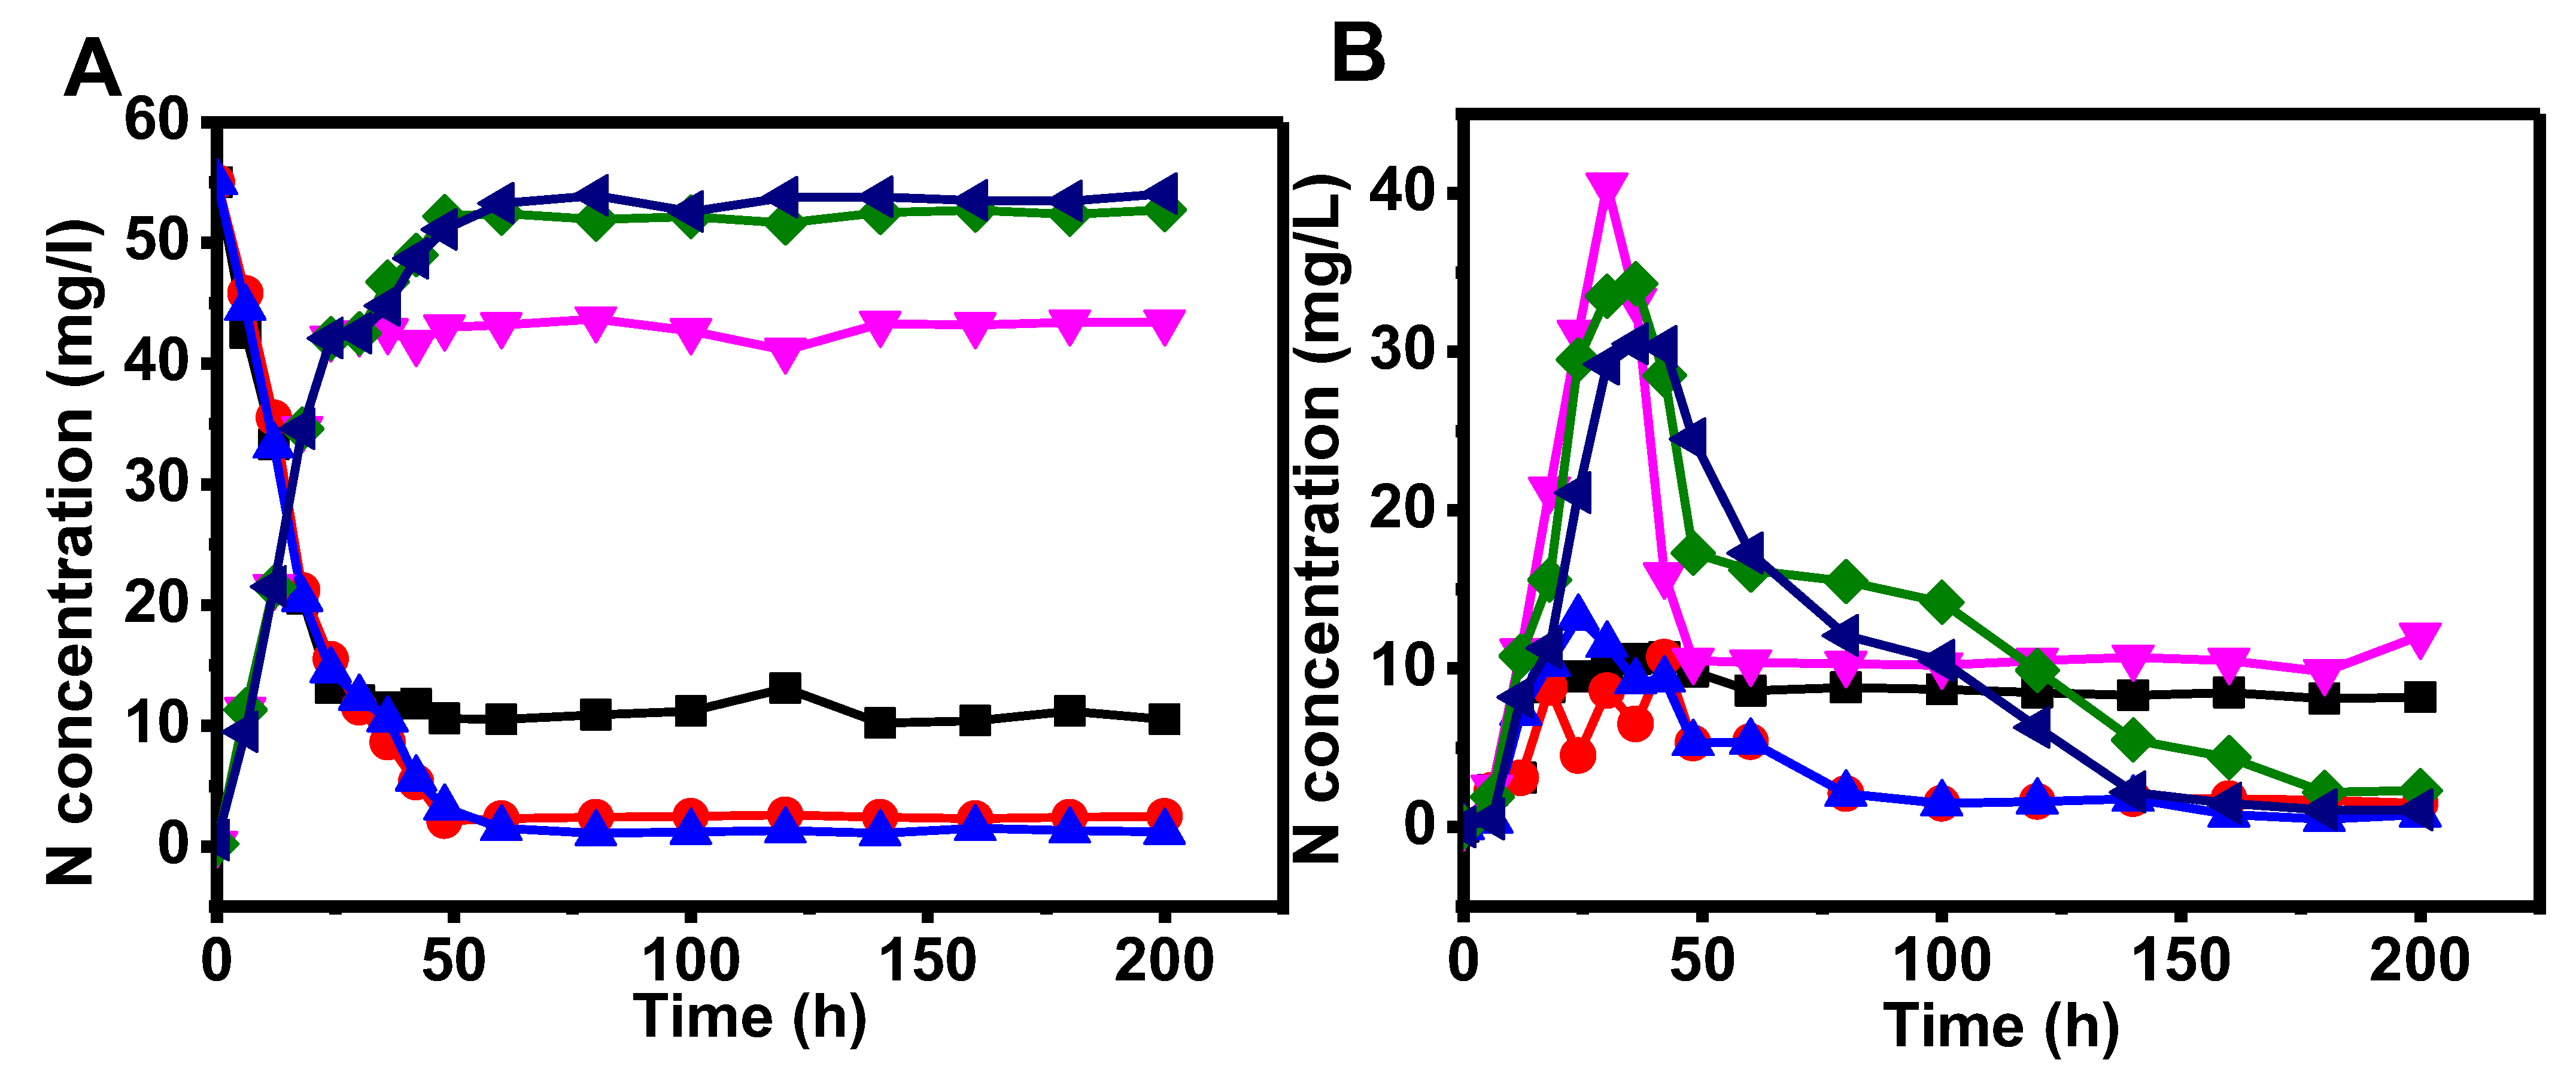
The MEC was further operated in the continuous mode at different HRT of 15, 20, and 25 h with an initial ammonia nitrogen concentration of 50 mg/L and applied voltage of 1.5 V across the electrodes. Under this condition, the SND performance of MEC was evaluated for 200 h. The ammonia and nitrate profiles at different HRT in the anode and cathode chambers are shown in the Figure 7A,B, respectively. In each HRT, the ammonia-nitrogen was less for the first few hours (~50 h) and then became stable at an average removal efficiency of 81%, 95%, and 97.8%, respectively, at an HRT of 15 h, 20 h, and 25 h (Figure 7A). The ammonia oxidation was significantly lower at a lower HRT possibly because of the high flow rate, which limited the nitrification process as also notice in conventional nitrification reactors [38]. For example, Moulick et al., reported a significant decrease in ammonia nitrogen removal from 68% to 28% when the influent flow rate was increased from 3 to 10.5 L/min [38]. Similarly, average nitrate accumulation in the anode at the lower HRT was found to be the least (42.8 mg/L) followed by the HRT 20 (52.3 mg/L) and HRT 25 (53.5 mg/L).
The cathode chamber initially received a low concentration of nitrate-nitrogen at all the HRTs due to low nitrification at the anode which gradually increased in the first few hours and then decreased via the denitrification process (Figure 7B). However, the nitrate-nitrogen concentration became stable to an average value of 10.5 mg/L, 3.8 mg/L, and 1.6 mg/L at 15 h, 20 h, and 25 h, respectively. Similar to ammonia oxidation, the denitrification rate was also noted higher at a high HRT possibly due to the low flow rate, which increased the microbe substrate contact time [39]. However, the overall total nitrogen removal (combining SND) was noted to be higher in HRT 15 at 170 g-N/m3.d as compared to what was obtained for HRT 20 (149 g-N/m3.d) and HRT 25 (122.9 g-N/m3.d). This removal rate at the continuous mode of operation was noted to be higher than the obtained values at the batch mode of operations in this study. This implies that a continuous mode of operation for ammonia removal from wastewater is more efficient than the batch mode of operation. Moreover, the MEC does not require external aeration for nitrification, which makes this system energy efficient. Thus, the apparent ammonia removal cost in MECs is expected to be significantly low as compared to conventional treatment systems. However, additional research on the life-cycle cost analysis to select the best design and operational conditions for SND in MEC is highly warranted for a better understanding of MEC economics [52,53]. Therefore, this novel MEC process utilized in this study is highly feasible for scale-up applications for SND, especially, from wastewater with relatively low COD concentration.
Figure 6. The denitrification at the cathode with an applied voltage of 1.5V and the nitrified solution from the anode. The reduction of nitrate-nitrogen and variation in other nitrogen—containing ions at cathode (A). The diffusion of nitrogen -containing ions from cathode to anode (B). The diffusion of DO was noted from anode to cathode ((C); nitrogen sparging at 20 h). The black, green, blue, and red lines represent total N, NO3-N, NO2-N, NH4-N, respectively.
Energies 15 09171 g006
Figure 7. The nitrification and denitrification at anode and cathode, respectively, under continuous mode at different HRT with an applied voltage of 1.5 V. The ammonia-nitrogen removal and nitrate-nitrogen generation at the anode (A) and ammonia and nitrate-nitrogen profile at the cathode (B). The pink, green, and blue lines represent ammonia nitrogen at HRT of 15, 20, and 25, respectively, and the black, red, and light-blue lines represent nitrate-nitrogen at HRT of 15, 20, and 25, respectively.
Energies 15 09171 g007

4. Conclusions

A dual chamber MEC operated under an imposed voltage could efficiently remove ammonia via the SND process from synthetic wastewater without having an organic substrate for the microbes at the anode and the cathode. The increased nitrification in batch mode was noted when the applied voltage was increased from 0.7 V to 1.5 V across the electrodes, whereas the nitrification rates decreased at higher initial ammonia concentrations. This suggests that low ammonium nitrogen loading with higher applied voltage is beneficial. Upon using the anode effluent enriched with nitrate as catholyte, the total ammonia removal could be reached 85% at an operating voltage of 1.5 V. Under the continuous mode of operation, the MEC could achieve an excellent total nitrogen removal rate of 170 g-N/m3.d at 15 h HRT. This study suggests that a standalone MEC can successfully remove ammonia from wastewater without having organic substrate at a high rate; however, more research on reactor configurations, electrode materials, and cost analysis are warranted to further improve the performance for commercial applications.

Author Contributions

Conceptualization, B.M.; Methodology, D.-H.C.; Formal analysis, B.M.; Investigation, D.-H.C.; Data curation, S.K.; Writing—original draft, S.K.; Writing—review & editing, M.T.N. and B.M. All authors have read and agreed to the published version of the manuscript.

Funding

This study received funding from the National Research Foundation, the Republic of Korea under an NRF grant (2018R1A2B6001507) and a BP fellowship grant (2021H1D3A2A02090873).

Conflicts of Interest

The authors declare no conflict of interest.

References

  1. Shi, J.; Podola, B.; Melkonian, M. Removal of nitrogen and phosphorus from wastewater using microalgae immobilized on twin layers: An experimental study. J. Appl. Phycol. 2007, 19, 417–423. [Google Scholar] [CrossRef]
  2. Noori, T.; Ghangrekar, M.M.; Mitra, A.; Mukherjee, C.K. Conference Proceedings of the Second International Conference on Recent Advances in Bioenergy Research; Springer: Singapore, 2018; pp. 285–294. [Google Scholar] [CrossRef]
  3. Noori, M.T.; Chatterjee, P.; Ghangrekar, M.M.; Mukherjee, C.K. Low-Cost Solutions for Fabrication of Microbial Fuel Cells: Ceramic Separator and Electrode Modifications; Elsevier B.V.: Amsterdam, The Netherlands, 2018; ISBN 978-0-444-64017-8. [Google Scholar]
  4. Clauwaert, P.; Desloover, J.; Shea, C.; Nerenberg, R.; Boon, N.; Verstraete, W. Enhanced nitrogen removal in bio-electrochemical systems by pH control. Biotechnol. Lett. 2009, 31, 1537–1543. [Google Scholar] [CrossRef] [PubMed]
  5. Zhan, G.; Zhang, L.; Li, D.; Su, W.; Tao, Y.; Qian, J. Autotrophic nitrogen removal from ammonium at low applied voltage in a single-compartment microbial electrolysis cell. Bioresour. Technol. 2012, 116, 271–277. [Google Scholar] [CrossRef] [PubMed]
  6. Yan, H.; Saito, T.; Regan, J.M. Nitrogen removal in a single-chamber microbial fuel cell with nitrifying biofilm enriched at the air cathode. Water Res. 2012, 46, 2215–2224. [Google Scholar] [CrossRef]
  7. Zhang, F.; He, Z. Integrated organic and nitrogen removal with electricity generation in a tubular dual-cathode microbial fuel cell. Process Biochem. 2012, 47, 2146–2151. [Google Scholar] [CrossRef]
  8. He, Z. Microbial fuel cells: Now let us talk about energy. Environ. Sci. Technol. 2013, 47, 332–333. [Google Scholar] [CrossRef]
  9. Han, X.; Qu, Y.; Dong, Y.; Chen, D.; Liang, D.; Liu, J.; Zhang, J.; Ren, N.; Feng, Y. Simultaneous electricity generation and eutrophic water treatment utilizing iron coagulation cell with nitrification and denitrification biocathodes. Sci. Total Environ. 2021, 782, 146436. [Google Scholar] [CrossRef]
  10. Noori, M.T.; Ganta, A.; Tiwari, B.R. Recent Advances in the Design and Architecture of Bioelectrochemical Systems to Treat Wastewater and to Produce Choice-Based Byproducts. J. Hazard. Toxic Radioact. Waste 2020, 24, 04020023. [Google Scholar] [CrossRef]
  11. Noori, M.T.; Ezugwu, C.I.; Wang, Y.; Min, B. Robust bimetallic metal-organic framework cathode catalyst to boost oxygen reduction reaction in microbial fuel cell. J. Power Sources 2022, 547, 231947. [Google Scholar] [CrossRef]
  12. Zheng, X.; Wang, H.; Yan, Q.; Zhang, G.; Chen, C. Simultaneous nitrogen removal and methane production from Taihu blue algae against ammonia inhibition using integrated bioelectrochemical system (BES). Sci. Total Environ. 2021, 777, 146144. [Google Scholar] [CrossRef]
  13. Lee, S.H.; Kondaveeti, S.; Min, B.; Park, H.D. Enrichment of Clostridia during the operation of an external-powered bio-electrochemical denitrification system. Process Biochem. 2013, 48, 306–311. [Google Scholar] [CrossRef]
  14. Kondaveeti, S.; Kang, E.; Liu, H.; Min, B. Continuous autotrophic denitrification process for treating ammonium-rich leachate wastewater in bioelectrochemical denitrification system (BEDS). Bioelectrochemistry 2019, 130, 107340. [Google Scholar] [CrossRef]
  15. Huang, B.; Feng, H.; Wang, M.; Li, N.; Cong, Y.; Shen, D. How to ascertain the importance of autotrophic denitrification process in a bioelectrochemical system. Bioresour. Technol. 2013, 146, 525–529. [Google Scholar] [CrossRef] [PubMed]
  16. Hong, S.; Park, Y.; Jo, K.; Lee, T. Autotrophic denitrification performance and bacterial community at biocathodes of bioelectrochemical systems with either abiotic or biotic anodes. J. Biosci. Bioeng. 2015, 119, 180–187. [Google Scholar]
  17. Gavilanes, J.; Noori, M.T.; Min, B. Enhancing bio-alcohol production from volatile fatty acids by suppressing methanogenic activity in single chamber microbial electrosynthesis cells (SCMECs). Bioresour. Technol. Rep. 2019, 7, 100292. [Google Scholar] [CrossRef]
  18. Tabish Noori, M.; Min, B. Highly Porous FexMnOy Microsphere as an Efficient Cathode Catalyst for Microbial Electrosynthesis of Volatile Fatty Acids from CO2. ChemElectroChem 2019, 6, 5973–5983. [Google Scholar] [CrossRef]
  19. Noori, M.T.; Thatikayala, D.; Min, B. Bioelectrochemical Remediation for the Removal of Petroleum Hydrocarbon Contaminants in Soil. Energies 2022, 15, 8457. [Google Scholar] [CrossRef]
  20. Lim, S.S.; Fontmorin, J.M.; Izadi, P.; Wan Daud, W.R.; Scott, K.; Yu, E.H. Impact of applied cell voltage on the performance of a microbial electrolysis cell fully catalysed by microorganisms. Int. J. Hydrogen Energy 2020, 45, 2557–2568. [Google Scholar] [CrossRef]
  21. Yan, C.; Wang, M.; Ma, T.; Yang, S.; Kong, M.; Shen, J.; Yang, L.; Gao, Y. Study on the experimental performance by electrolysis-integrated ecological floating bed for nitrogen and phosphorus removal in eutrophic water. Sci. Rep. 2020, 10, 7619. [Google Scholar] [CrossRef]
  22. Thu, H.N.T.; Noori, M.T.; Min, B. Accelerating anaerobic digestion process with novel single chamber microbial electrochemical systems with baffle. Bioresour. Technol. 2022, 359, 127474. [Google Scholar]
  23. Noori, M.T.; Min, B. Fundamentals and recent progress in bioelectrochemical system assisted biohythane production. Bioresour. Technol. 2022, 361, 127641. [Google Scholar] [CrossRef] [PubMed]
  24. Vu, M.T.; Noori, M.T.; Min, B. Magnetite/zeolite nanocomposite-modified cathode for enhancing methane generation in microbial electrochemical systems. Chem. Eng. J. 2020, 393, 124613. [Google Scholar] [CrossRef]
  25. Noori, M.T.; Mohan, S.V.; Min, B. Microbial electrosynthesis of multi-carbon volatile fatty acids under the influence of different imposed potentials. Sustain. Energy Technol. Assess. 2021, 45, 101118. [Google Scholar] [CrossRef]
  26. Ali, R.B.; Noori, M.T.; Lee, S.-H.; Park, H.-D.; Min, B. Enhancing biogas and electricity recovery using an iron-manganese oxide catalyzed bioanode in an integrated submersible microbial fuel cell-anaerobic digester. Sustain. Energy Technol. Assess. 2022, 52, 102276. [Google Scholar] [CrossRef]
  27. Kondaveeti, S.; Lee, S.H.; Park, H.D.; Min, B. Bacterial communities in a bioelectrochemical denitrification system: The effects of supplemental electron acceptors. Water Res. 2014, 51, 25–36. [Google Scholar] [CrossRef] [PubMed]
  28. APHA. Standard Methods for Examination of Water and Wastewater; American Public Health Association: Washington, DC, USA, 2017; ISBN 9780875530130. [Google Scholar]
  29. Kondaveeti, S.; Min, B. Nitrate reduction with biotic and abiotic cathodes at various cell voltages in bioelectrochemical denitrification system. Bioprocess Biosyst. Eng. 2013, 36, 231–238. [Google Scholar] [CrossRef]
  30. Hossini, H.; Rezaee, A.; Ayati, B.; Mahvi, A.H. Simultaneous nitrification and denitrification using a polypyrrole/microbial cellulose electrode in a membraneless bio-electrochemical system. RSC Adv. 2015, 5, 72699–72708. [Google Scholar] [CrossRef]
  31. Stenstrom, M.K.; Poduska, R.A. The effect of dissolved oxygen concentration on nitrification. Water Res. 1980, 14, 643–649. [Google Scholar] [CrossRef]
  32. Meyer, R.L.; Zeng, R.J.; Giugliano, V.; Blackall, L.L. Challenges for simultaneous nitrification, denitrification, and phosphorus removal in microbial aggregates: Mass transfer limitation and nitrous oxide production. FEMS Microbiol. Ecol. 2005, 52, 329–338. [Google Scholar] [CrossRef] [Green Version]
  33. Wang, J.; Yang, H.; Liu, X.; Chang, J. The impact of temperature and dissolved oxygen (DO) on the partial nitrification of immobilized fillers, and application in municipal wastewater. RSC Adv. 2020, 10, 37194–37201. [Google Scholar] [CrossRef]
  34. Watanabe, T.; Hashimoto, S.; Kuroda, M. Simultaneous nitrification and denitrification in a single reactor using bio-electrochemical process. Water Sci. Technol. 2002, 46, 163–169. [Google Scholar] [CrossRef] [PubMed]
  35. Zhan, G.; Zhang, L.; Tao, Y.; Wang, Y.; Zhu, X.; Li, D. Anodic ammonia oxidation to nitrogen gas catalyzed by mixed biofilms in bioelectrochemical systems. Electrochim. Acta 2014, 135, 345–350. [Google Scholar] [CrossRef]
  36. Alabiad, I.; Ali, U.F.M.; Zakarya, I.A.; Ibrahim, N.; Radzi, R.W.; Zulkurnai, N.Z.; Azmi, N.H. Ammonia removal via microbial fuel cell (MFC) dynamic reactor. In Proceedings of the IOP Conference Series: Materials Science And engineering; IOP Publishing: Bristol, UK, 2017; Volume 206, p. 12079. [Google Scholar]
  37. Oh, J.; Silverstein, J. Oxygen inhibition of activated sludge denitrification. Water Res. 1999, 33, 1925–1937. [Google Scholar] [CrossRef]
  38. Sanjib, M.; Mohd, M.C.K.; Mukherjee, C.K. Evaluation of nitrification performance of a trickling filter with nylon pot scrubber as media. IJSN 2011, 2, 515. [Google Scholar]
  39. Gharasoo, M.; Centler, F.; Van Cappellen, P.; Wick, L.Y.; Thullner, M. Kinetics of substrate biodegradation under the cumulative effects of bioavailability and self-inhibition. Environ. Sci. Technol. 2015, 49, 5529–5537. [Google Scholar] [CrossRef]
  40. Princic, A.; Mahne, I.; Megušar, F.; Paul, E.A.; Tiedje, J.M. Effects of pH and oxygen and ammonium concentrations on the community structure of nitrifying bacteria from wastewater. Appl. Environ. Microbiol. 1998, 64, 3584–3590. [Google Scholar] [CrossRef] [Green Version]
  41. Bhattacharya, R.; Mazumder, D. Kinetic study on nitrification of ammonium nitrogen-enriched synthetic wastewater using activated sludge. Water Sci. Technol. 2020, 81, 62–70. [Google Scholar] [CrossRef]
  42. Kapoor, A.; Viraraghavan, T. Nitrate removal from drinking water. J. Environ. Eng. 1997, 123, 371–380. [Google Scholar] [CrossRef]
  43. Park, H.I.; Kun Kim, D.; Choi, Y.-J.; Pak, D. Nitrate reduction using an electrode as direct electron donor in a biofilm-electrode reactor. Process Biochem. 2005, 40, 3383–3388. [Google Scholar] [CrossRef]
  44. Xia, S.; Wu, C.; Yang, X.; Zhou, Y.; Zhou, L.; Ran, Y.; Rittmann, B.E. Bioreduction of nitrate in high-sulfate water using a hydrogen-based membrane biofilm reactor equipped with a separate carbon dioxide module. Chem. Eng. J. 2020, 385, 123831. [Google Scholar] [CrossRef]
  45. Grommen, R.; Verhaege, M.; Verstraete, W. Removal of nitrate in aquaria by means of electrochemically generated hydrogen gas as electron donor for biological denitrification. Aquac. Eng. 2006, 34, 33–39. [Google Scholar] [CrossRef]
  46. Virdis, B.; Rabaey, K.; Rozendal, R.A.; Yuan, Z.; Keller, J. Simultaneous nitrification, denitrification and carbon removal in microbial fuel cells. Water Res. 2010, 44, 2970–2980. [Google Scholar] [CrossRef] [PubMed]
  47. Zhu, G.; Chen, G.; Yu, R.; Li, H.; Wang, C. Enhanced simultaneous nitrification/denitrification in the biocathode of a microbial fuel cell fed with cyanobacteria solution. Process Biochem. 2016, 51, 80–88. [Google Scholar] [CrossRef]
  48. Zhu, G.; Huang, S.; Lu, Y.; Gu, X. Simultaneous nitrification and denitrification in the bio-cathode of a multi-anode microbial fuel cell. Environ. Technol. 2021, 42, 1260–1270. [Google Scholar] [CrossRef]
  49. Zhang, F.; He, Z. Simultaneous nitrification and denitrification with electricity generation in dual-cathode microbial fuel cells. J. Chem. Technol. Biotechnol. 2012, 87, 153–159. [Google Scholar] [CrossRef]
  50. Park, Y.; Park, S.; Nguyen, V.K.; Yu, J.; Torres, C.I.; Rittmann, B.E.; Lee, T. Complete nitrogen removal by simultaneous nitrification and denitrification in flat-panel air-cathode microbial fuel cells treating domestic wastewater. Chem. Eng. J. 2017, 316, 673–679. [Google Scholar] [CrossRef]
  51. Feng, C.; Huang, L.; Yu, H.; Yi, X.; Wei, C. Simultaneous phenol removal, nitrification and denitrification using microbial fuel cell technology. Water Res. 2015, 76, 160–170. [Google Scholar] [CrossRef]
  52. Das, I.; Das, S.; Ghangrekar, M.M. Application of bimetallic low-cost CuZn as oxygen reduction cathode catalyst in lab-scale and field-scale microbial fuel cell. Chem. Phys. Lett. 2020, 751, 137536. [Google Scholar] [CrossRef]
  53. Das, I.; Das, S.; Das, S.; Ghangrekar, M.M. Proficient Sanitary Wastewater Treatment in Laboratory and Field-Scale Microbial Fuel Cell with Anti-Biofouling Cu0.5Mn0.5Fe2O4 as Cathode Catalyst. J. Electrochem. Soc. 2021, 168, 054519. [Google Scholar] [CrossRef]
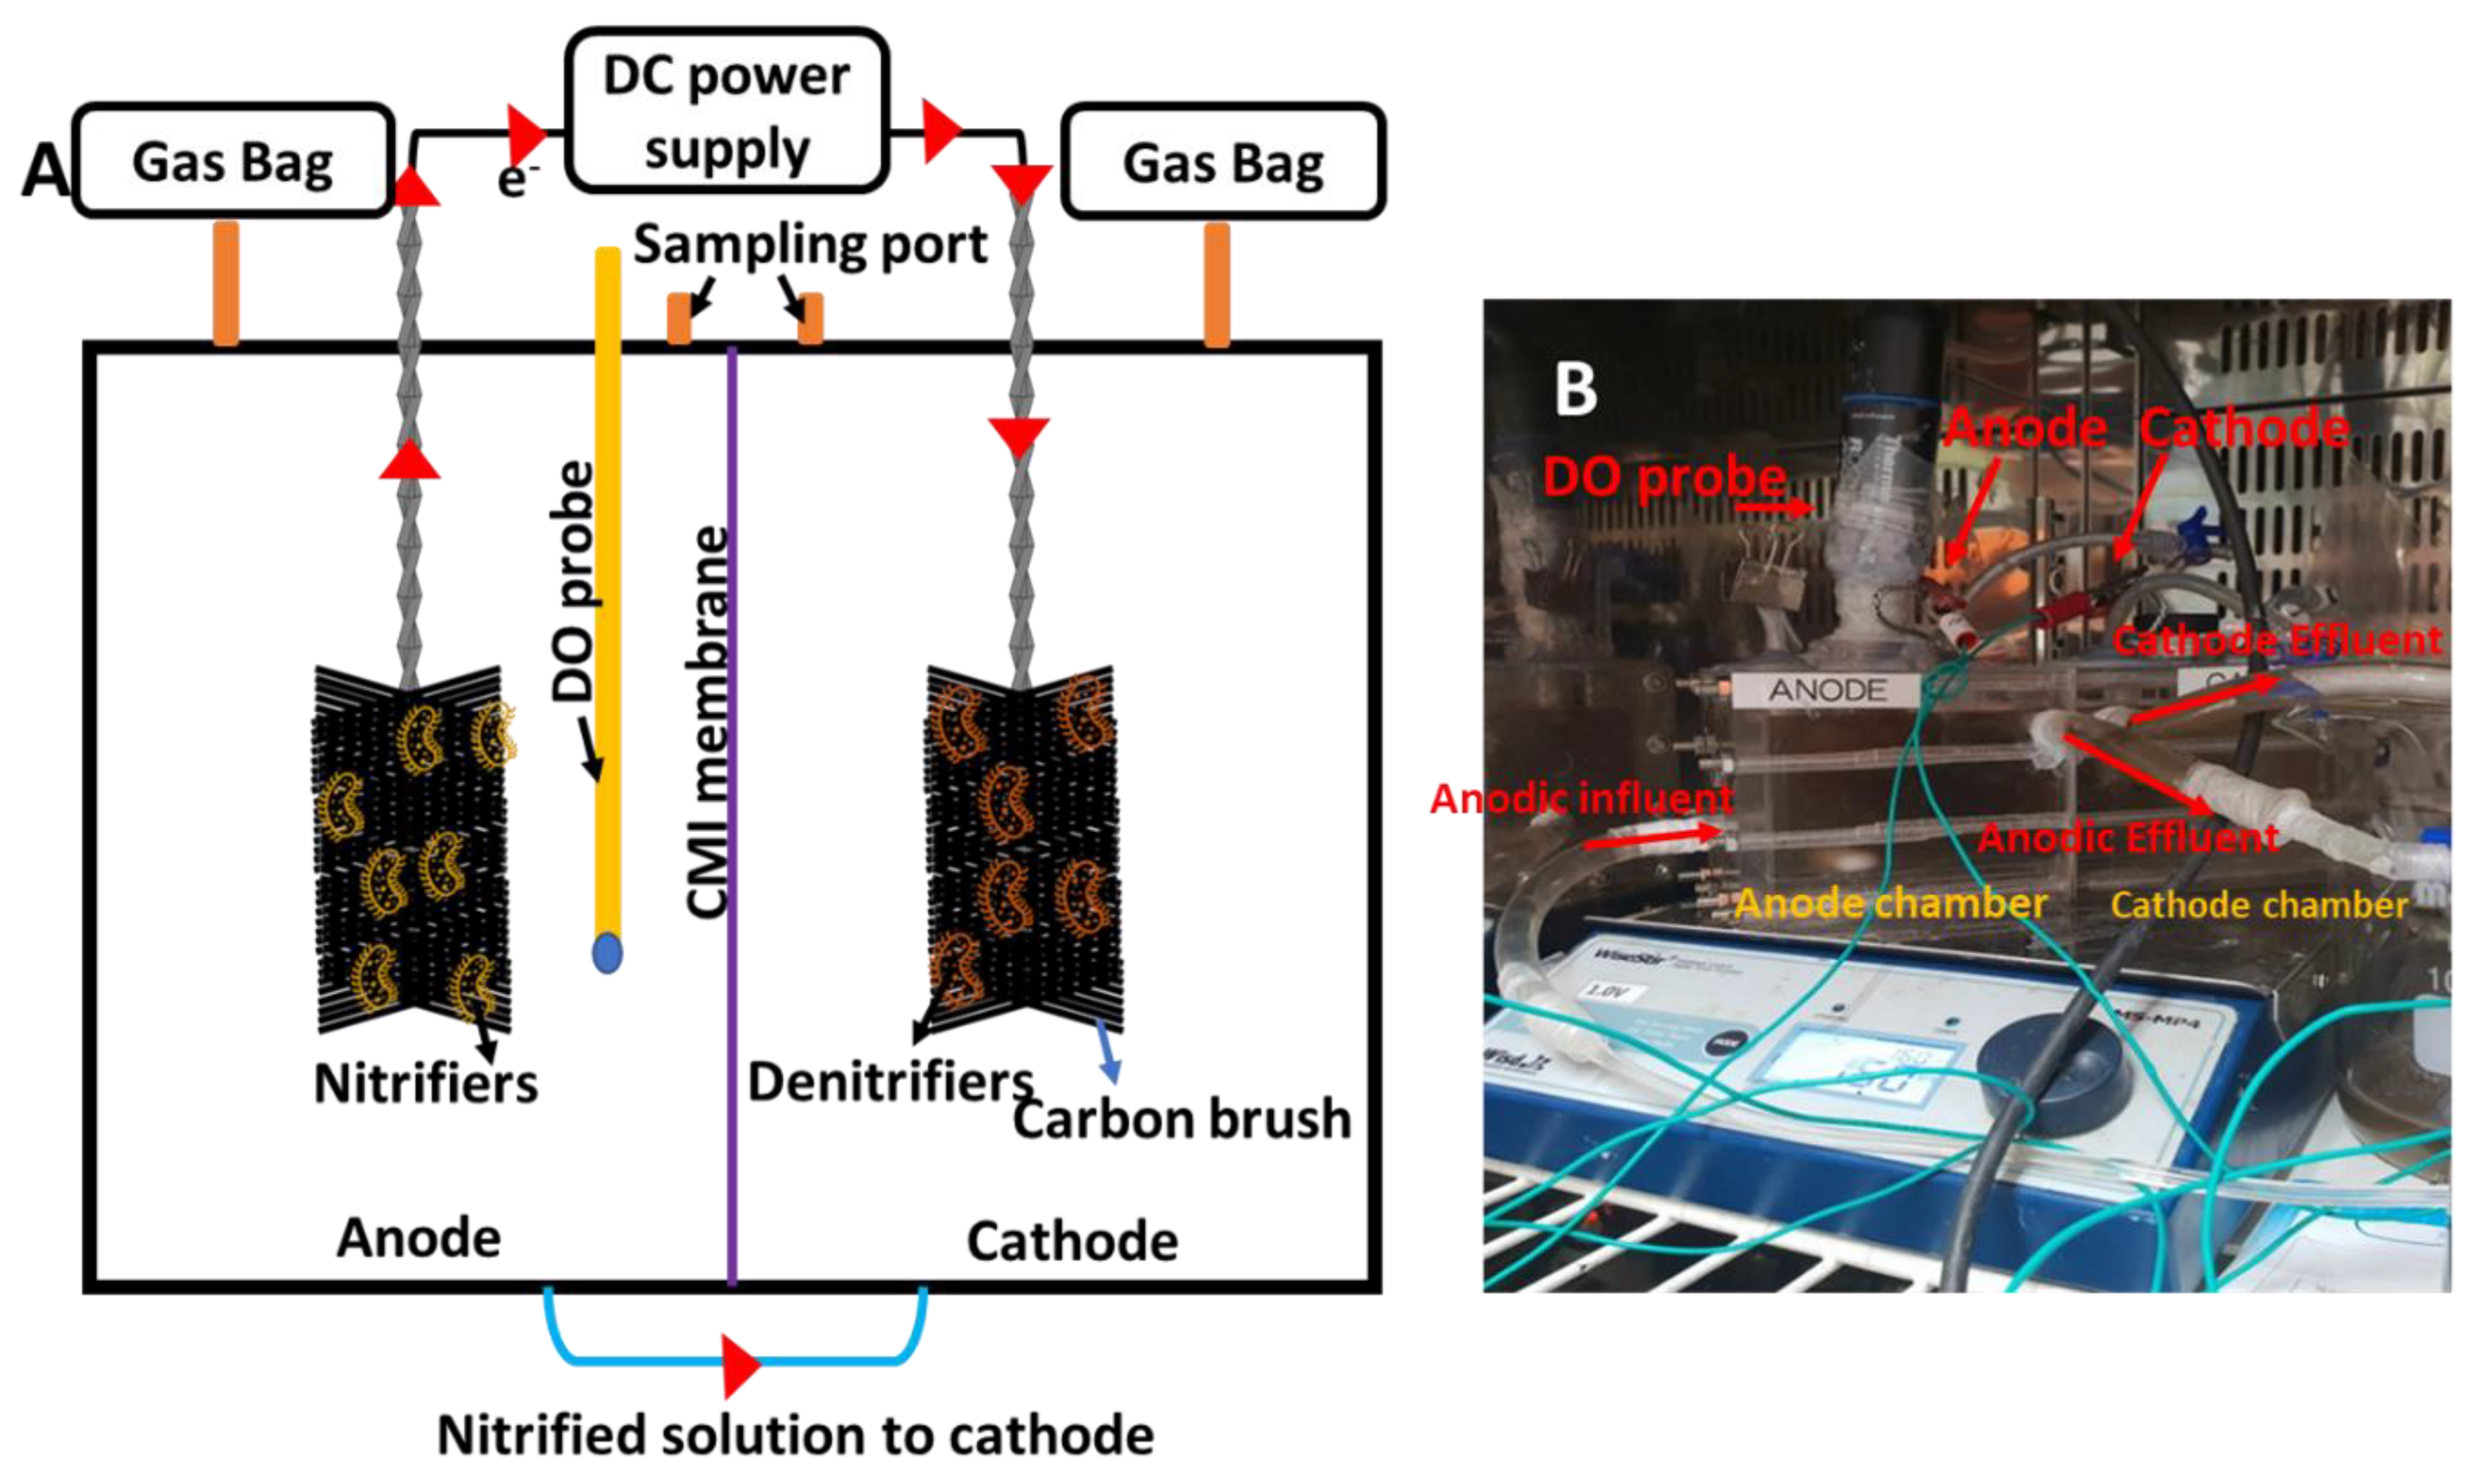
Figure 1. The schematic view (A) and photograph (B) of double chamber microbial electrolysis cell (MEC) used in this study for pursuing simultaneous nitrification and denitrification (SND) to remove nitrogen.
Energies 15 09171 g001
Figure 2. The variation in dissolved oxygen (DO) concentrations with respect to the time noted with change in applied voltage.
Energies 15 09171 g002
Figure 3. The variation in nitrogen (N) concentrations was noted at the anode (A) and cathode (B) of MEC by using 50 mg/L of ammonium nitrogen and 0.7 V. The total nitrogen (black squares), ammonium nitrogen (red circles), nitrate nitrogen (green up triangle), and nitrite nitrogen (blue down triangle). Changes in pH and DO (C) were noted at the anode of MEC during the nitrification process at an applied voltage of 0.7 V.
Energies 15 09171 g003
Figure 4. The variation in N concentrations with variation in applied voltage. 0.7 V (A), 1.0 V (B), and 1.5 V (C). The total nitrogen (black squares), ammonium nitrogen (red circles), nitrate nitrogen (green up triangle), and nitrite nitrogen (blue down triangle). The linear regressions (D) were noted at different applied voltages (NH4-N, initial ammonium nitrogen: 50 mg/L).
Energies 15 09171 g004
Table 1. The possible redox reactions involved in anode and cathode of MEC.
Anode
(water electrolysis)
10H2O + 10e → 5H2 + 10 OH
5H2O → 2.5O2 + 10H+ + 10e
Anode
(Nitrification)
NH4+ + 3/2O2 → NO2 + 2H+ + H2O
NO2 + 1/2O2 →NO3
Cathode
(Denitrification)
2NO3 + 2H2 → 2NO2 + 2H2O
2NO2 + 2H2 → N2O + H2O + 2OH
N2O + H2 → N2 + H2O
NO3 + 6H+ + 5e → 1/2N2 +3H2O
Publisher’s Note: MDPI stays neutral with regard to jurisdictional claims in published maps and institutional affiliations.