Article

Effect of Stagger Angle of Rotor Channels on the Wave Rotor

1
Aircraft and Propulsion Laboratory, Ningbo Institute of Technology, Beihang University, Beijing 100191, China
2
School of Aerospace Engineering, Xiamen University, Xiamen 361005, China
3
Research Institute of Aero-Engine, Beihang University, Beijing 100191, China
*
Author to whom correspondence should be addressed.
Energies 2022, 15(24), 9455; https://doi.org/10.3390/en15249455
Submission received: 29 October 2022 / Revised: 1 December 2022 / Accepted: 2 December 2022 / Published: 13 December 2022
(This article belongs to the Special Issue Recent Advances in Thermofluids, Combustion and Energy Systems)

Abstract

:
A wave rotor optimizes the use of energy resources by enhancing thermodynamic cycles, and further optimization of wave rotor geometry is emerging as an attractive research area. Among the geometric features, the stagger angle of channels lacks sufficient study in spite of its important effects. To address this question, this work developed and applied the velocity triangle models to modify the basic geometry of wave rotors for different stagger angles, and investigated the flow fields with two-dimensional numerical methods. Results showed that: (1) different stagger angles worked out similar unsteady pressure wave systems and kept nearly constant compression and expansion ratios of the wave rotor; (2) increased stagger angle made the inlet and outlet flows turn toward the axial direction, which was beneficial to compact and light-weighted integration of the wave rotor to a gas turbine; (3) increased stagger angle made the wave rotor consume more shaft power, but even the maximum shaft power was small. This work revealed a critical mechanism how the velocity variation across an unsteady pressure wave produced rim work in a staggered channel, and made a recommendation to comprehensive optimization of wave rotor geometry for better integration in a gas turbine and acceptable shaft power consumption.

1. Introduction

A wave rotor is a typical type of unsteady flow devices where one fluid stream compresses another fluid stream with unsteady pressure waves. Its application involves gas turbine topping cycles [1], internal combustion engine supercharging [2], and refrigeration units [3,4]. The special mechanism of energy transfer via unsteady pressure waves promises advantages such as lower rotational speed than equivalent turbomachines, self-cooling capacity, compactness, robustness, and fast response to transient operations [1]. With those advantages, the wave rotor enhances thermodynamic cycles with higher overall pressure ratios and higher peak temperatures, and thus, optimizes the use of energy resources. A wave-rotor-topped gas turbine increased the specific power by 25.1% and reduced the specific fuel consumption by 20.1% in thermodynamic analyses [5]. A successfully marketed wave rotor, Comprex® [6], was applied to diesel engines of the Mazda company in the 1980s, and a new version named Hyprex® [1,7] has been in the research and design process in Switzerland in recent years. The previous design and application support the feasibility of wave rotors, and draw attention to further optimizations.
Typical optimization is based on the geometry of the wave rotor. The basic geometry of a wave rotor consists of rotor and stator parts, as shown in Figure 1. The three-dimensional geometry and flow field is usually unwrapped in a two-dimensional view, as shown in Figure 2. The basic configuration of the rotor is a drum with a loop of uniform straight channels. The flows in the channels are driven by unsteady pressure waves, including shock waves and expansion waves. As a four-port wave rotor, there are a pair of high-pressure inlet and outlet ports and a pair of low-pressure inlet and outlet ports in the stator plates (Figure 1). Two fluid streams enter and exit the wave rotor through the four ports. One stream at high temperature expands, and provides the work to compress the other stream at low temperature. This configuration in Figure 1 and Figure 2 is known as the through-flow (TF) configuration.
The conventional geometry of wave rotor channels is straight and axial, but adapted channel geometries are drawing attention recently. Adapt the straight channels, and we have cambered channels, as shown in Figure 3a. Adapt the axial channels, and we have staggered channels, as shown in Figure 3b. In this work, a staggered channel refers to the staggered and straight channel in Figure 3b. The three-dimensional geometry of staggered channels would be skewed, but it is straight in an unwrapped two-dimensional view. A practical geometry would probably combine the cambered and staggered channels as shown in Figure 3c, but dedicated research on either adaption is important.
Cambered channels have gained a lot of attention for research. Pearson [8] and General Electric (GE) company [9] designed and experimentally studied a wave rotor turbine in the 1980s, which indicates the potential of wave rotors to extract shaft power like a turbine. Jagannath et al. [10], Tüchler et al. [11,12,13,14], and Liu et al. [15] recently developed wave rotors with the cambered, or curved, channels. Tüchler et al. experimentally validated that their wave rotors succeeded in power extraction of the rotor [13]. Akbari et al. designed a radial wave rotor with curved channels, which indicated similar ideas of power extraction [16].
On the contrary, research on staggered channels is rare. Only a few publications mentioned wave rotor channels in a staggered shape. Eidelman’s technical note mentioned staggered channels in a study on the gradual-opening phenomenon of wave rotor channels [17]. Welch and Paxson [18] numerically simulated staggered channels as well as cambered channels as they developed quasi-one-dimensional CFD methods for different geometries of wave rotors, although the discussion and results focused on the CFD method validation rather than the flow field properties in the stagger channels. In recent years, the work of Jagannath et al. [10] mentioned geometry models of staggered channels, but did not mention flow-field results of the staggered channels. The works of Tüchler et al. [14] and Liu et al. [15] on channel geometry optimization were on general geometries of cambered and staggered channels, but did not distinguish the effects of a cambered geometry from the effects of a staggered geometry. Therefore, the contribution of the staggered geometry to wave rotor optimization remains unclear.
However, the staggered geometry of channels would have independent effects on the wave rotor according to theories on aerodynamics and turbomachinery. Firstly, a proper stagger angle may arrange the inlet and outlet flow directions toward the axial direction as an adjacent compressor, combustor or turbine component requires. Axial inlet and outlet flow simplifies twisted transition ducts between the wave rotor and adjacent components, and thus reduces the overall length and weight of the engine. In addition, the energy loss of the flow would also be reduced in the simplified transition ducts. Secondly, staggered geometry of rotor channels could possibly affect the shaft power if there were a shock wave in the rotor channels. The mechanism is independent from the cambered geometry, and it takes aerodynamic data to summarize regulations. The potential effects of the staggered channels and the mechanisms are interesting. The mechanism of the staggered channels would be applicable to more complex channel geometry for further optimization of wave rotors with cambered and staggered channels.
There has been no dedicated research on staggered channels of wave rotors in the public domain to the authors’ knowledge. This work makes such an approach. Staggered channels with different stagger angles are compared in a numerical investigation. Result analysis starts with a fundamental analysis on the pressure ratios of wave rotors, and then discusses the inlet and outlet flow directions. The last issue of analysis is the shaft power. Conclusions summarize the regulations in the results and make suggestions to appropriate use of stagger angles in wave rotor optimization.

2. Methodology

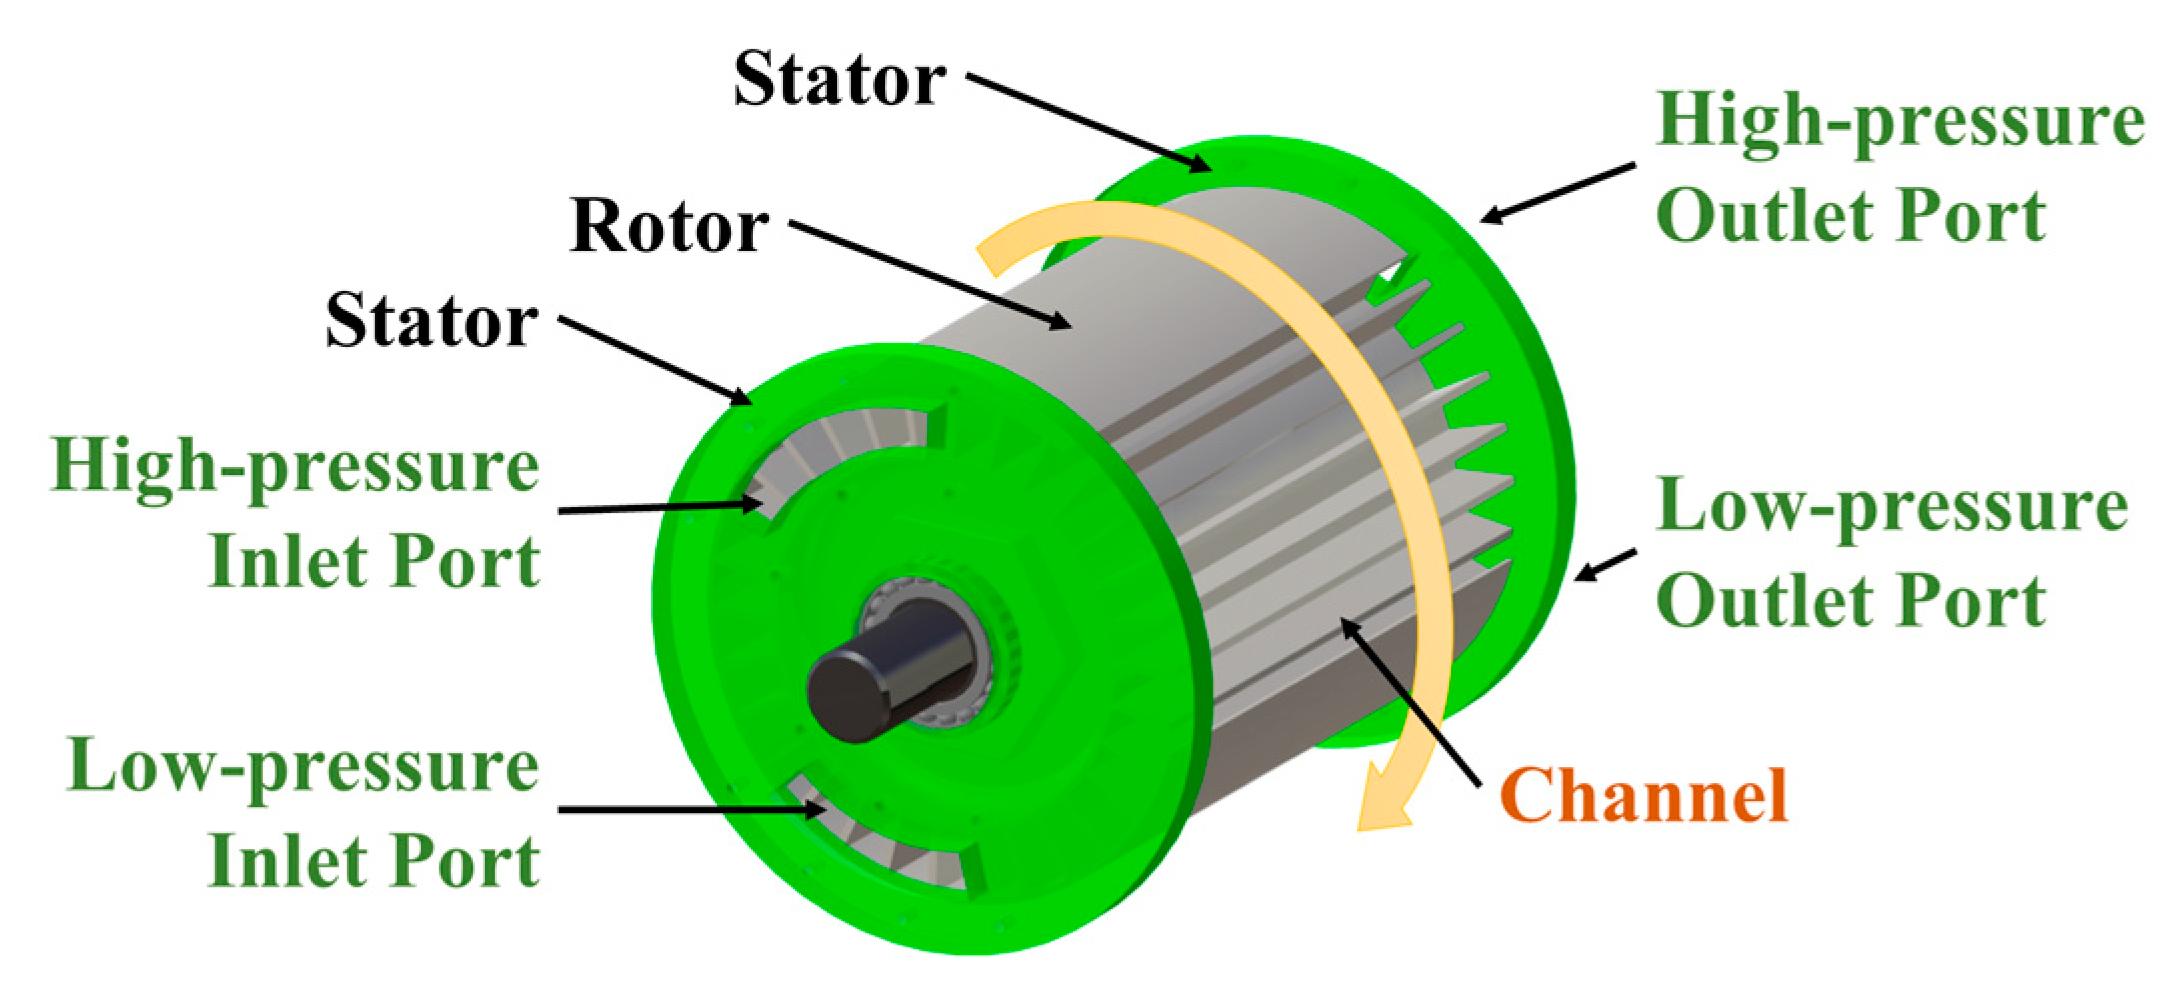
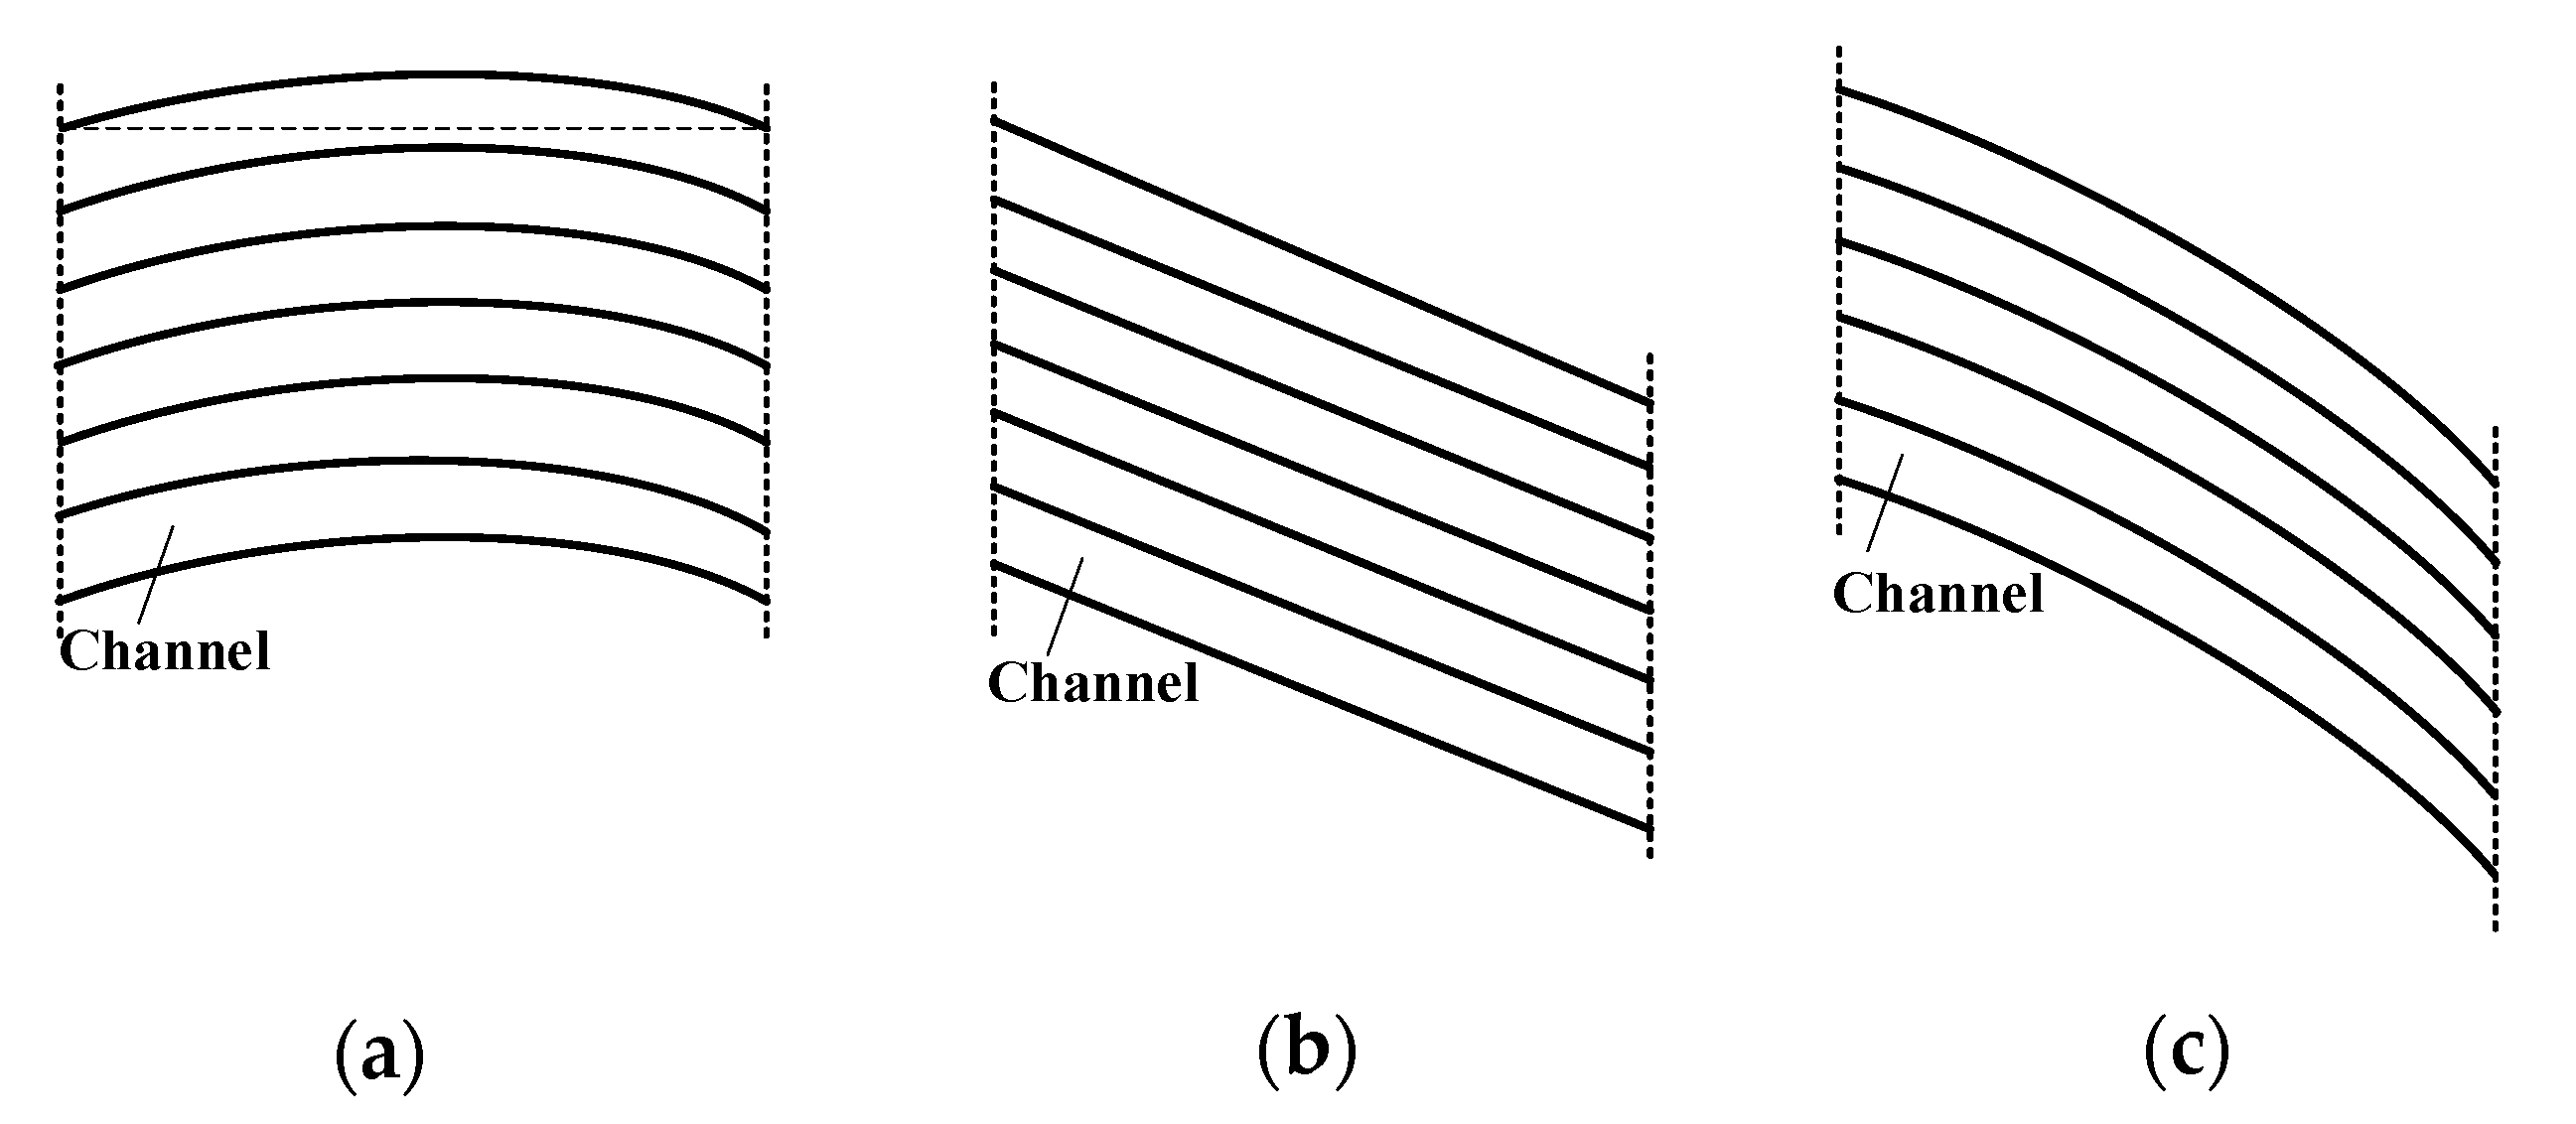
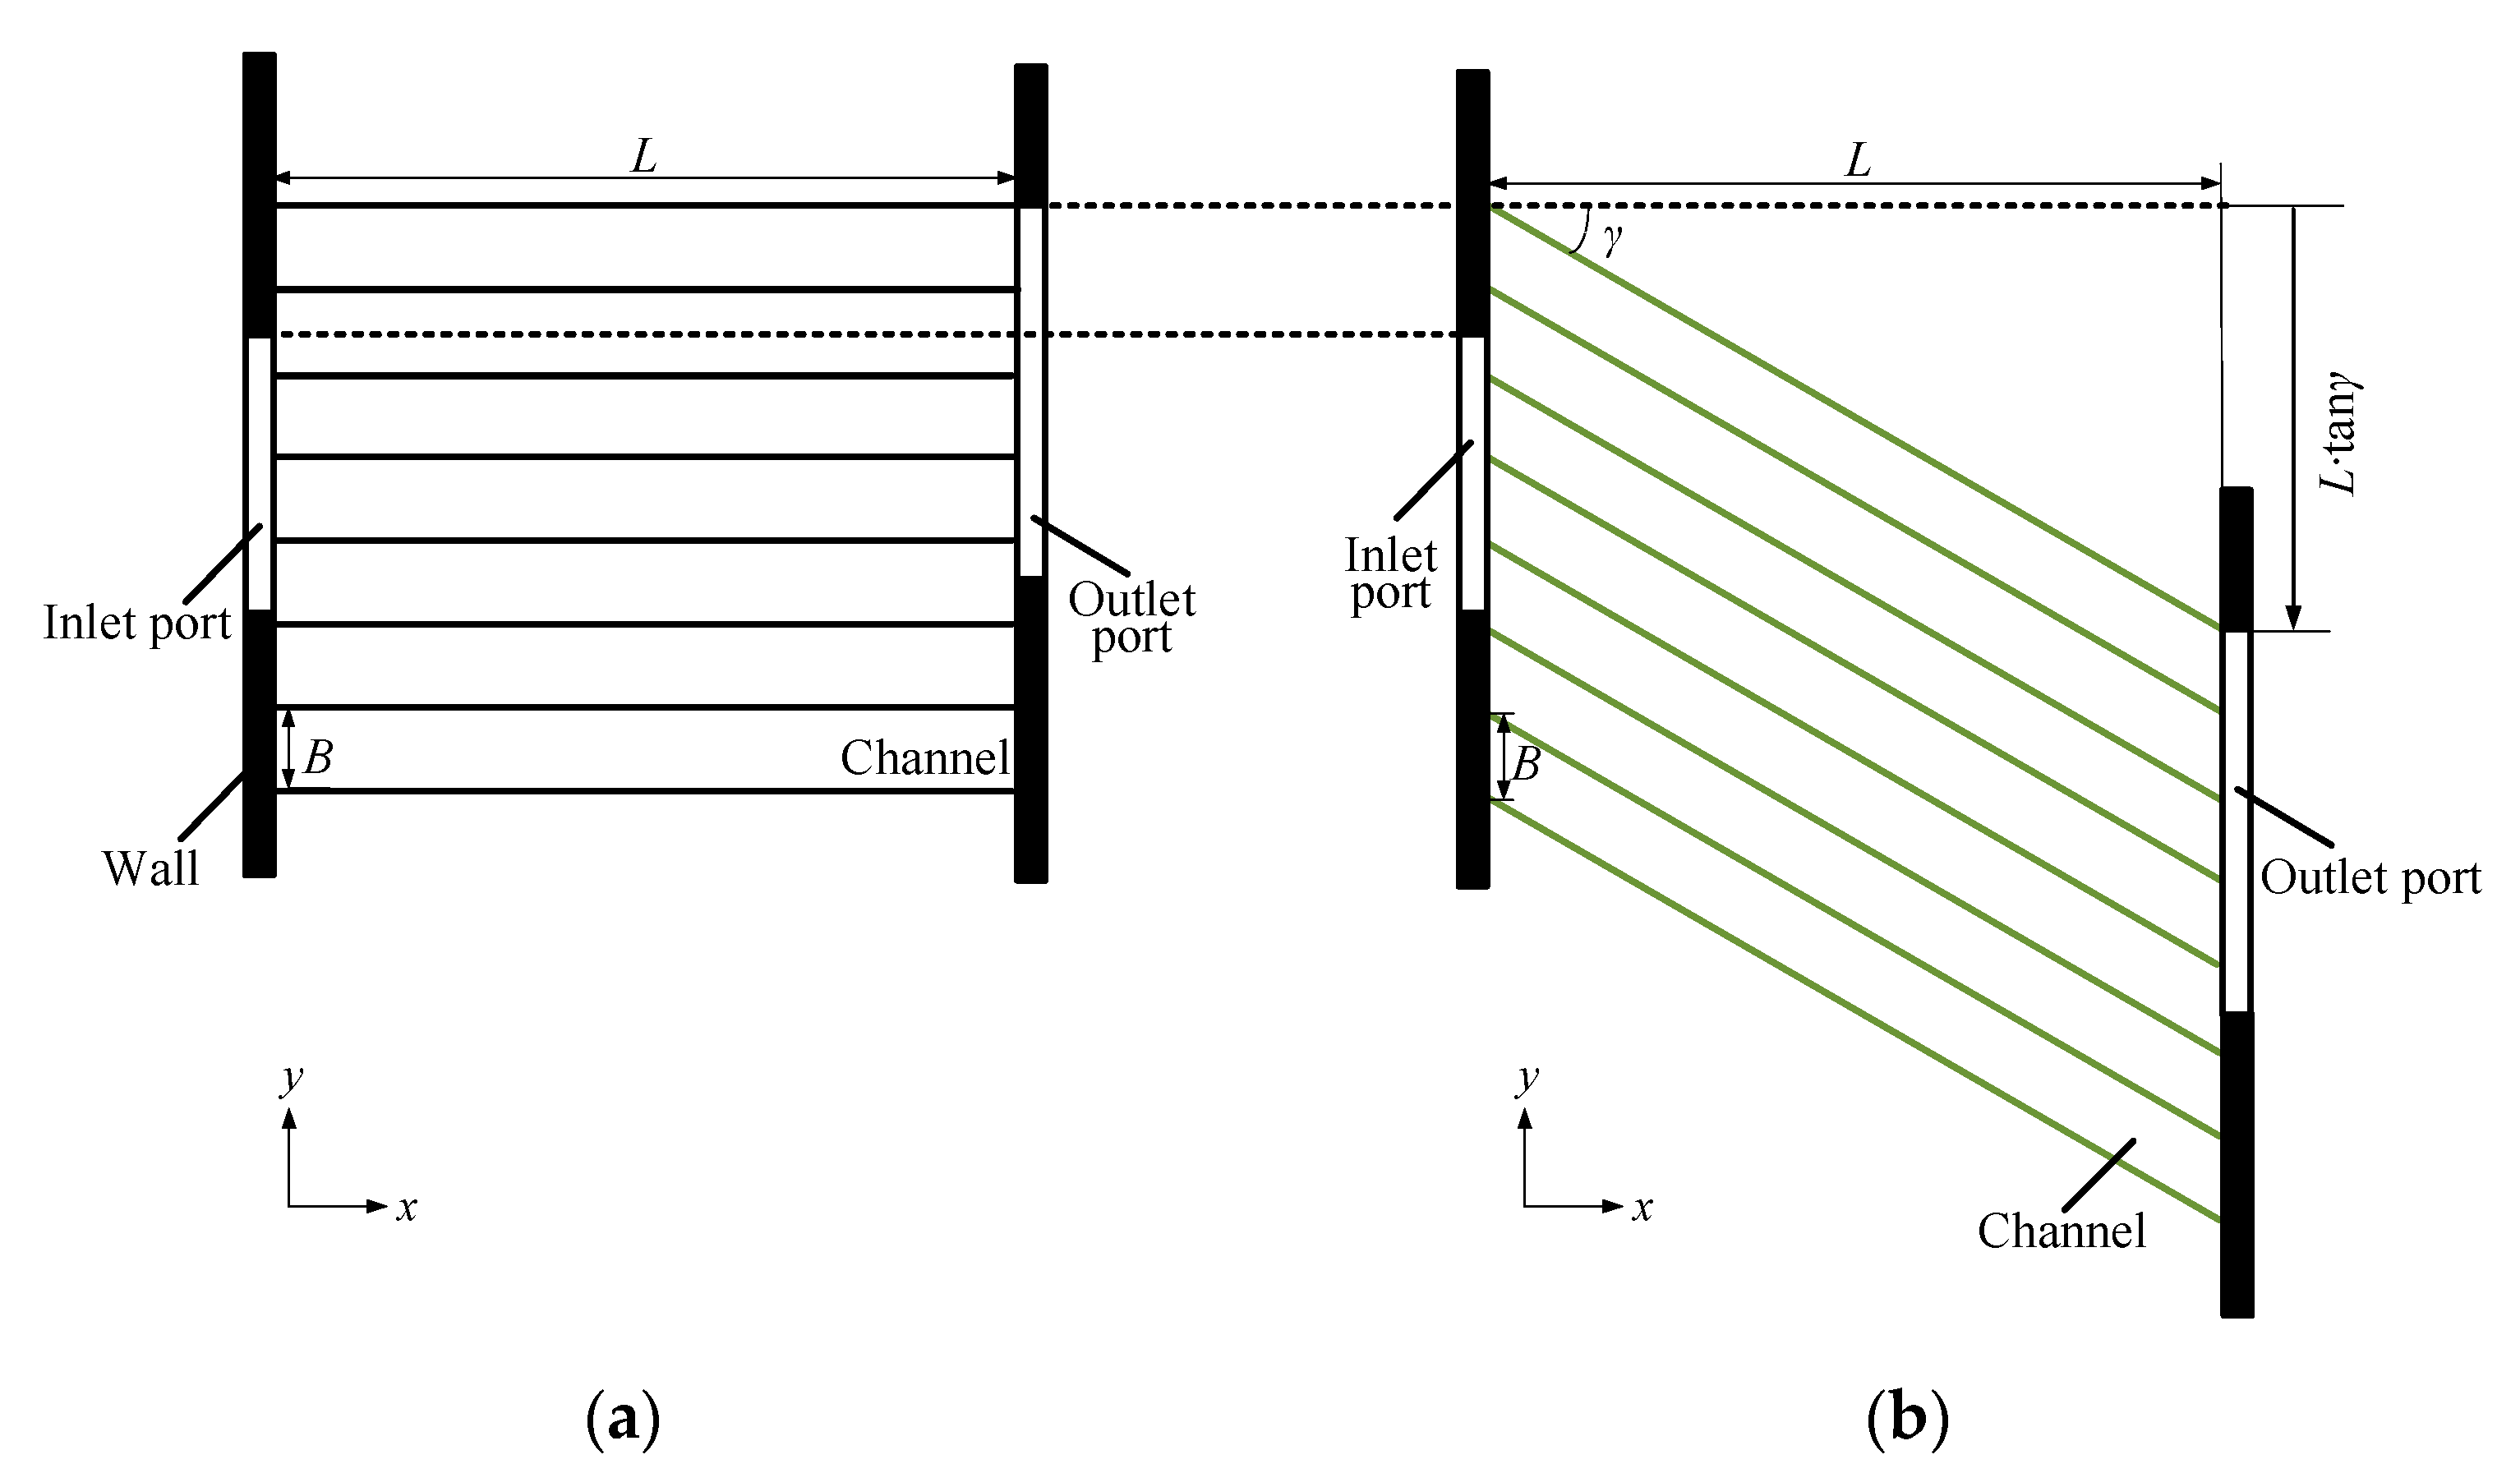
2.1. Geometric Modification

As mentioned above, there is no related research on the influence of the staggered channels on the properties of the wave rotor. Therefore, we mainly focus on the effect of the staggered channels on the wave rotor. The two-dimensional staggered geometry model of the wave rotor in this work is as shown in Figure 2 and Figure 4. The following description on the geometry model are the same for either the pair of high-pressure or the pair of low-pressure ports of the wave rotor. As shown in Figure 4a, the axial length L, the width B of a channel, and the y-coordinates of each port are premised. Among the premised geometry conditions, the y-coordinates of ports are solved with analytic models of unsteady pressure waves and one-dimensional CFD method of the flow field in the channels, as our previous publications elucidated [19,20]. The target of this work is to investigate the effects of the stagger angle γ in Figure 4b. The investigated stagger angles γ increasing clockwise from 0° to 30° (including 0°, 10°, 15°, 20°, and 30°).
A staggered case keeps the same axial length L and width B of the channel with the baseline case (γ = 0°), but it takes three steps of geometric modification. The first modification step is on the offset of outlet ports in y-coordinates. As shown in Figure 4, the inlet ports of a staggered case are in the same y-coordinates with the baseline case, while the outlet ports are shifted down. All the y-coordinates of outlet ports share the same offset value:
y = L ∙ tanγ
It obeys the fundamental geometry modification of the staggered channels, and thus intends to keep the pressure wave patterns in the channels.
The second modification step is on the rim velocity U of the rotor. Since the L is kept the same, the side-wall length of a channel increases with the increasing γ. The side-wall length of a channel is the propagation distance of unsteady pressure waves, and it increases as the stagger angle γ increases. In order to keep the pressure wave patterns in the channels, U would be inversely proportional to the propagation distance. Therefore, U should follow the rule:
U     cos γ
The third modification step is on the inclination angles of the inlet and outlet port sidewalls in parallel with the corresponding velocity vectors. The velocity triangles at inlet (subscript in) and an outlet (subscript out) ports are shown in Figure 5. Here, the absolute velocity C is the inlet/outlet velocity at stator ports, the relative velocity W is the velocity in the reference frame with the rotating channels, and the implicated velocity U of the reference frame is the rim velocity. For each port, α and β represent the absolute and relative velocity vector angles, respectively. For each of the four ports, Wx and Wy are the x-component and the y-component of the relative velocity W, respectively.
The values of Wx at different ports are different, and they are premised for all the four ports in one-dimensional CFD simulation with methods that our previous publications elucidated [19,20]. In other words, a positive stagger angle (γ > 0°) keeps the Wx values the same with the baseline case (γ = 0°). Based on the velocity triangles and premised Wx at different γ, θ is determined as shown in Equation (3) for each of the four ports.
θ = tan 1 U W x · tan γ W x
The selected values of Δy, U and θ at each port are shown in Table 1. Here, the minus sign indicates the opposite direction of motion of the rotor. With the increasing γ, θ gradually decreases at each port.
In all, the geometric modification is calculated based on the following assumptions: (1) the value of rim velocity U for different stagger angles γ is proportional to the cosine of γ; (2) the value of Wx for different stagger angles is the same; (3) the flow direction in a port is parallel to a port sidewall.

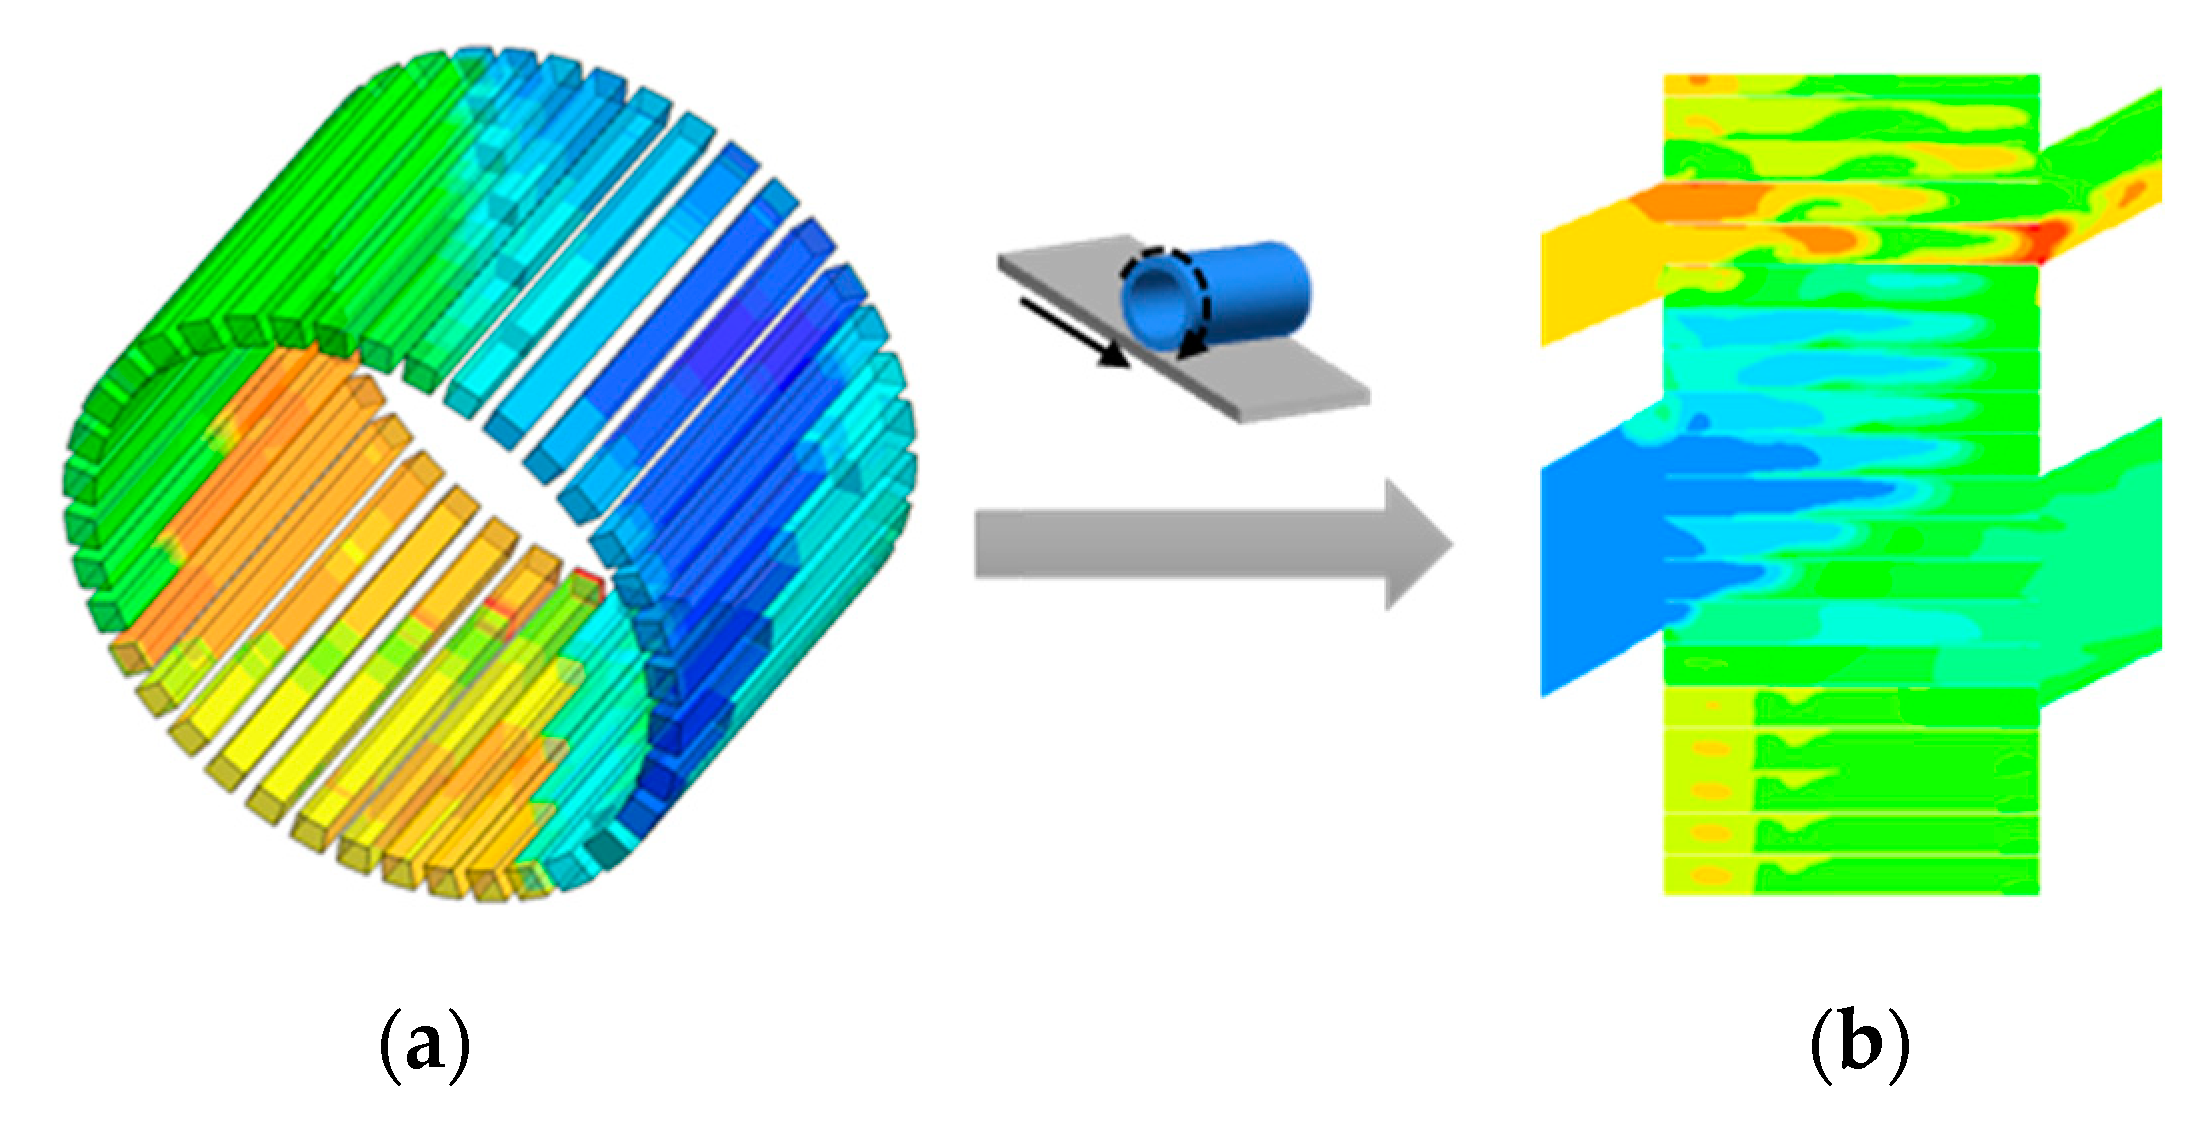
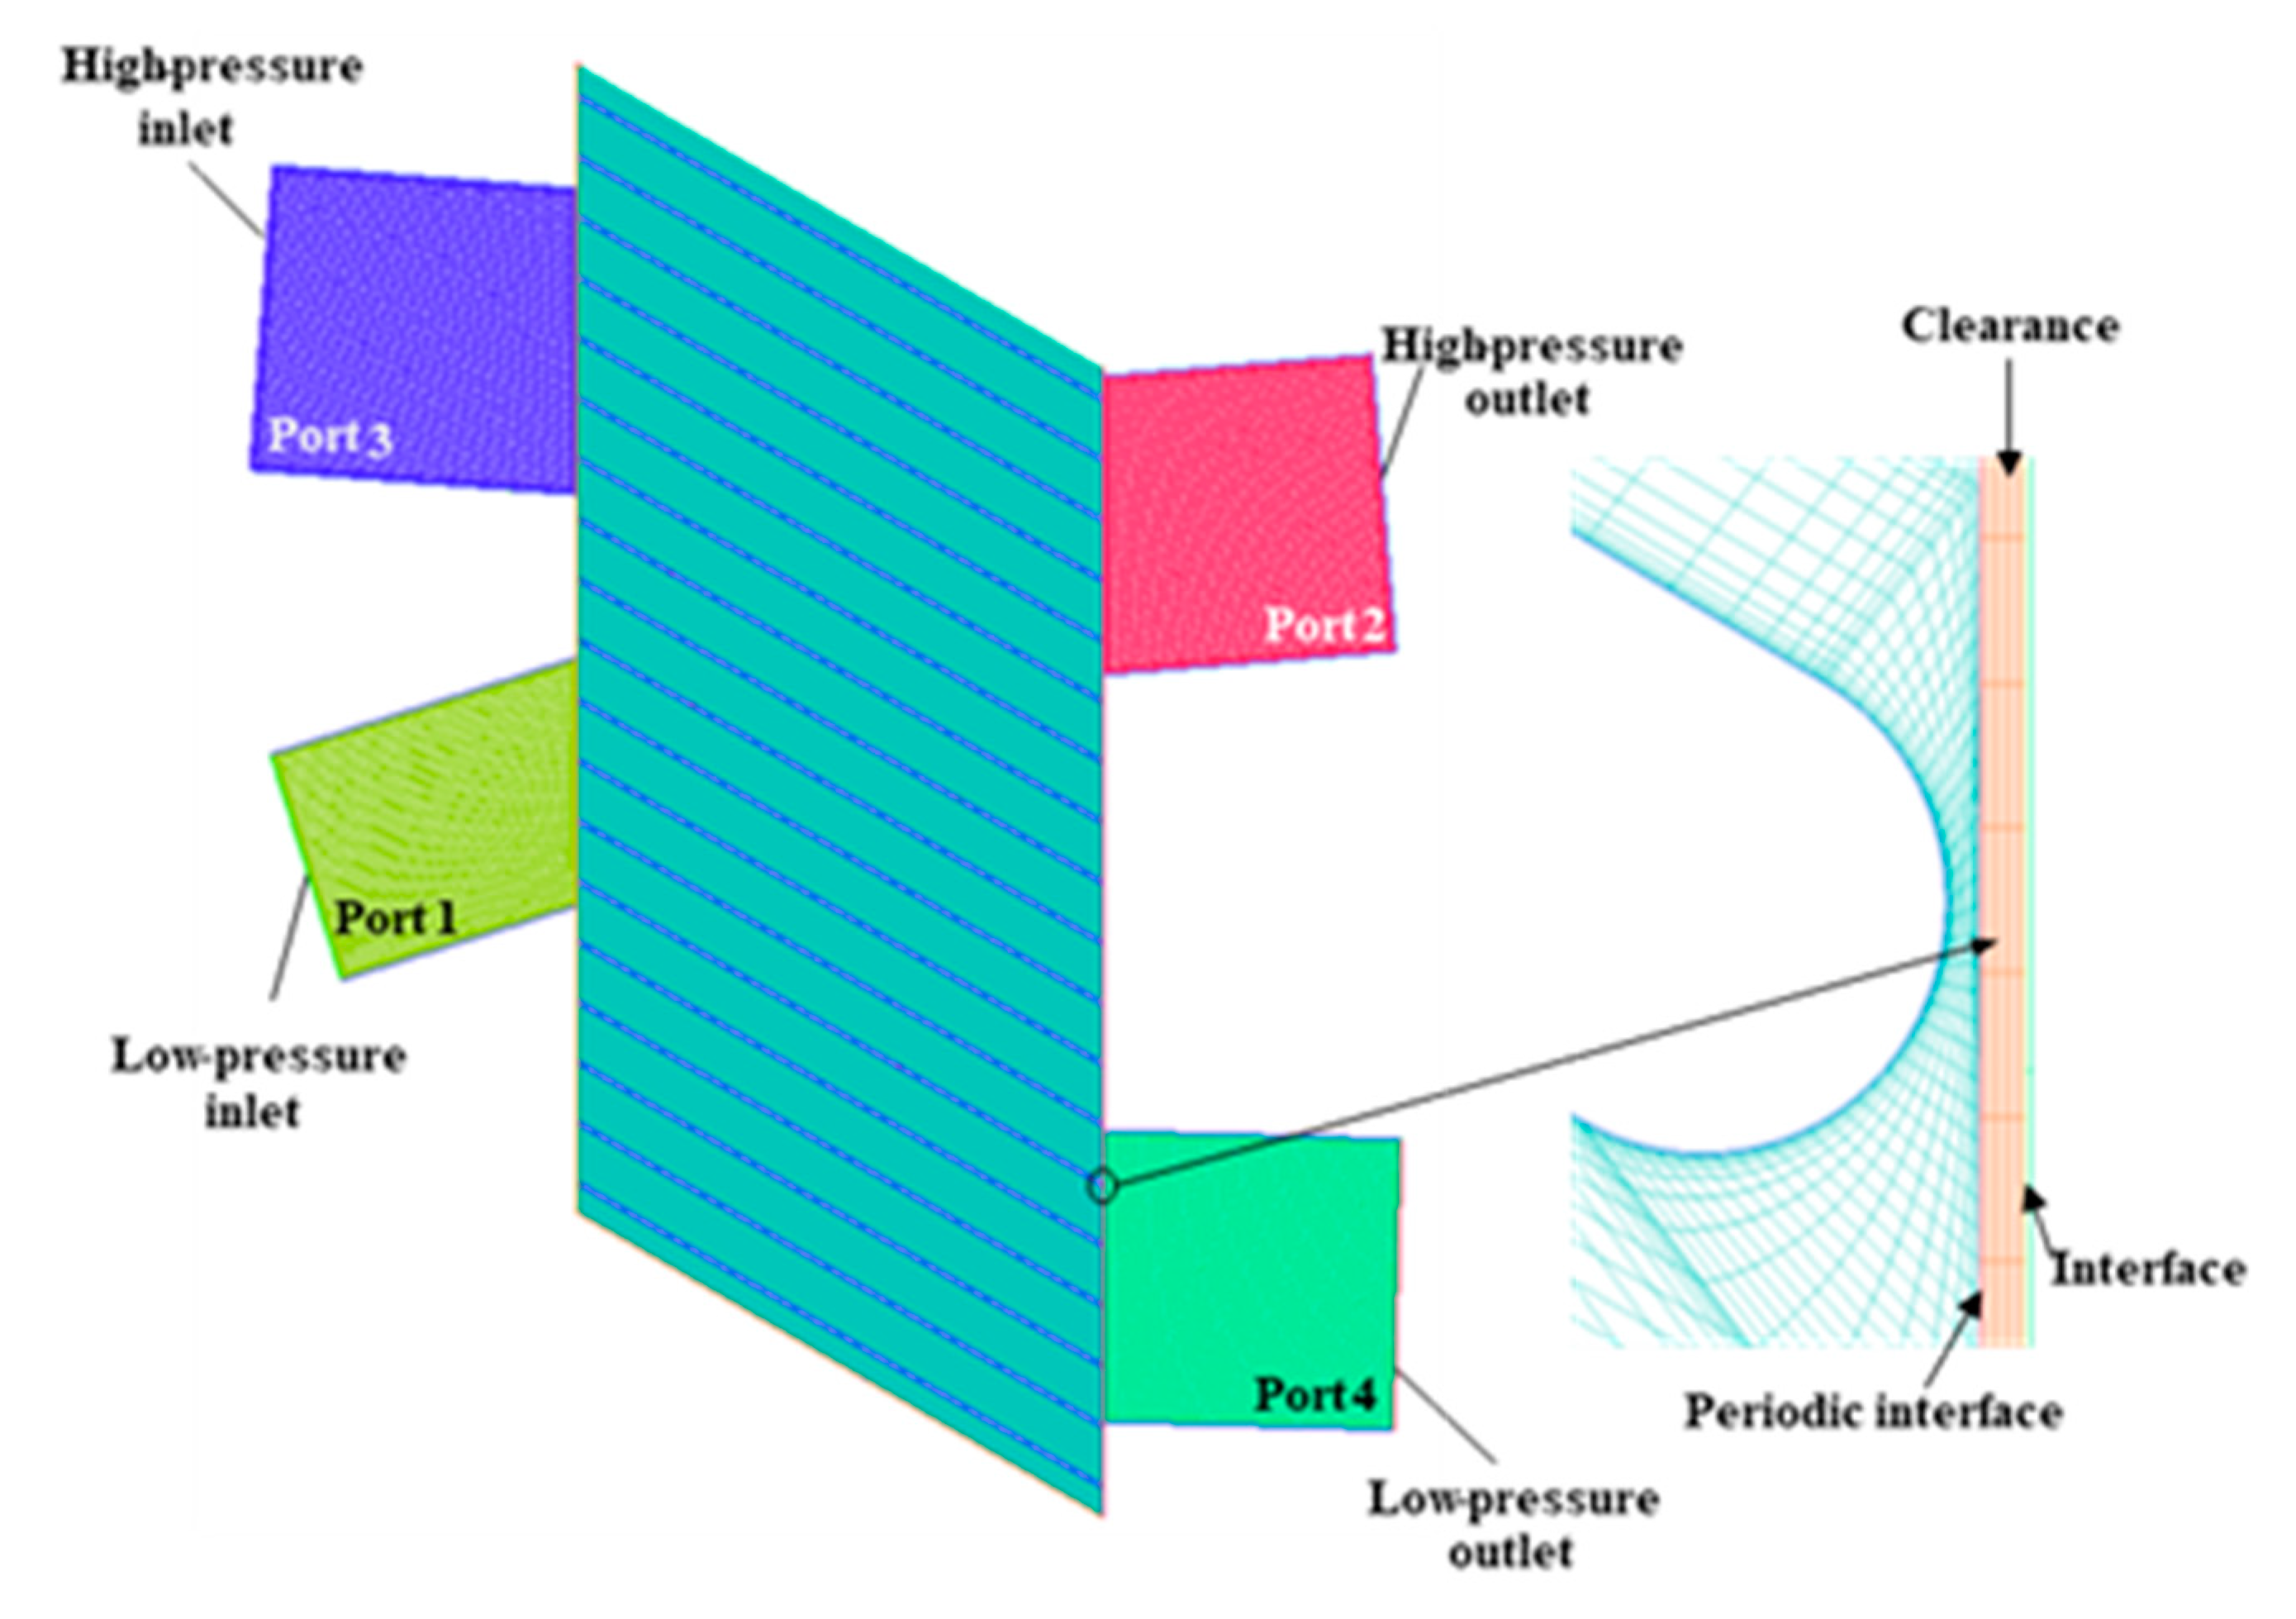
2.2. Numerical Model

2.2.1. Numerical Method

In this paper, ANSYS FLUENT 19.2 is used to conduct two-dimensional CFD simulations of wave rotors with different geometries. In Figure 6, models include a rotor and two pair of inlet/outlet stators. Boundary conditions at inlet and outlet ports are defined as pressure inlet and pressure outlet, respectively. In addition, the fluid in the model is defined as an ideal gas. To simulate the periodic movement in the wave rotor, a sliding mesh with constant velocity is used on the rotor, and the rotor/stator interfaces (in Figure 6) are set as periodic boundaries. In order to obtain the accurate numerical results of the flow field and the rotor/stator interface in the wave rotor, double precision and pressure-based solver with k-epsilon turbulence model are used. The turbulence model verification in the wave rotor has been discussed in detail in the previous study [21]. In addition, grids in the clearance are refined considering the effect of clearance leakage. The grid elements of each part in the wave rotor are listed in Table 2.
The numerical model is based on the following assumptions: (1) the fluid is a perfect gas with a constant specific heat; (2) the walls are adiabatic; (3) the flow is two dimensional, which means the radial velocity or the gas centrifugal force is ignored.

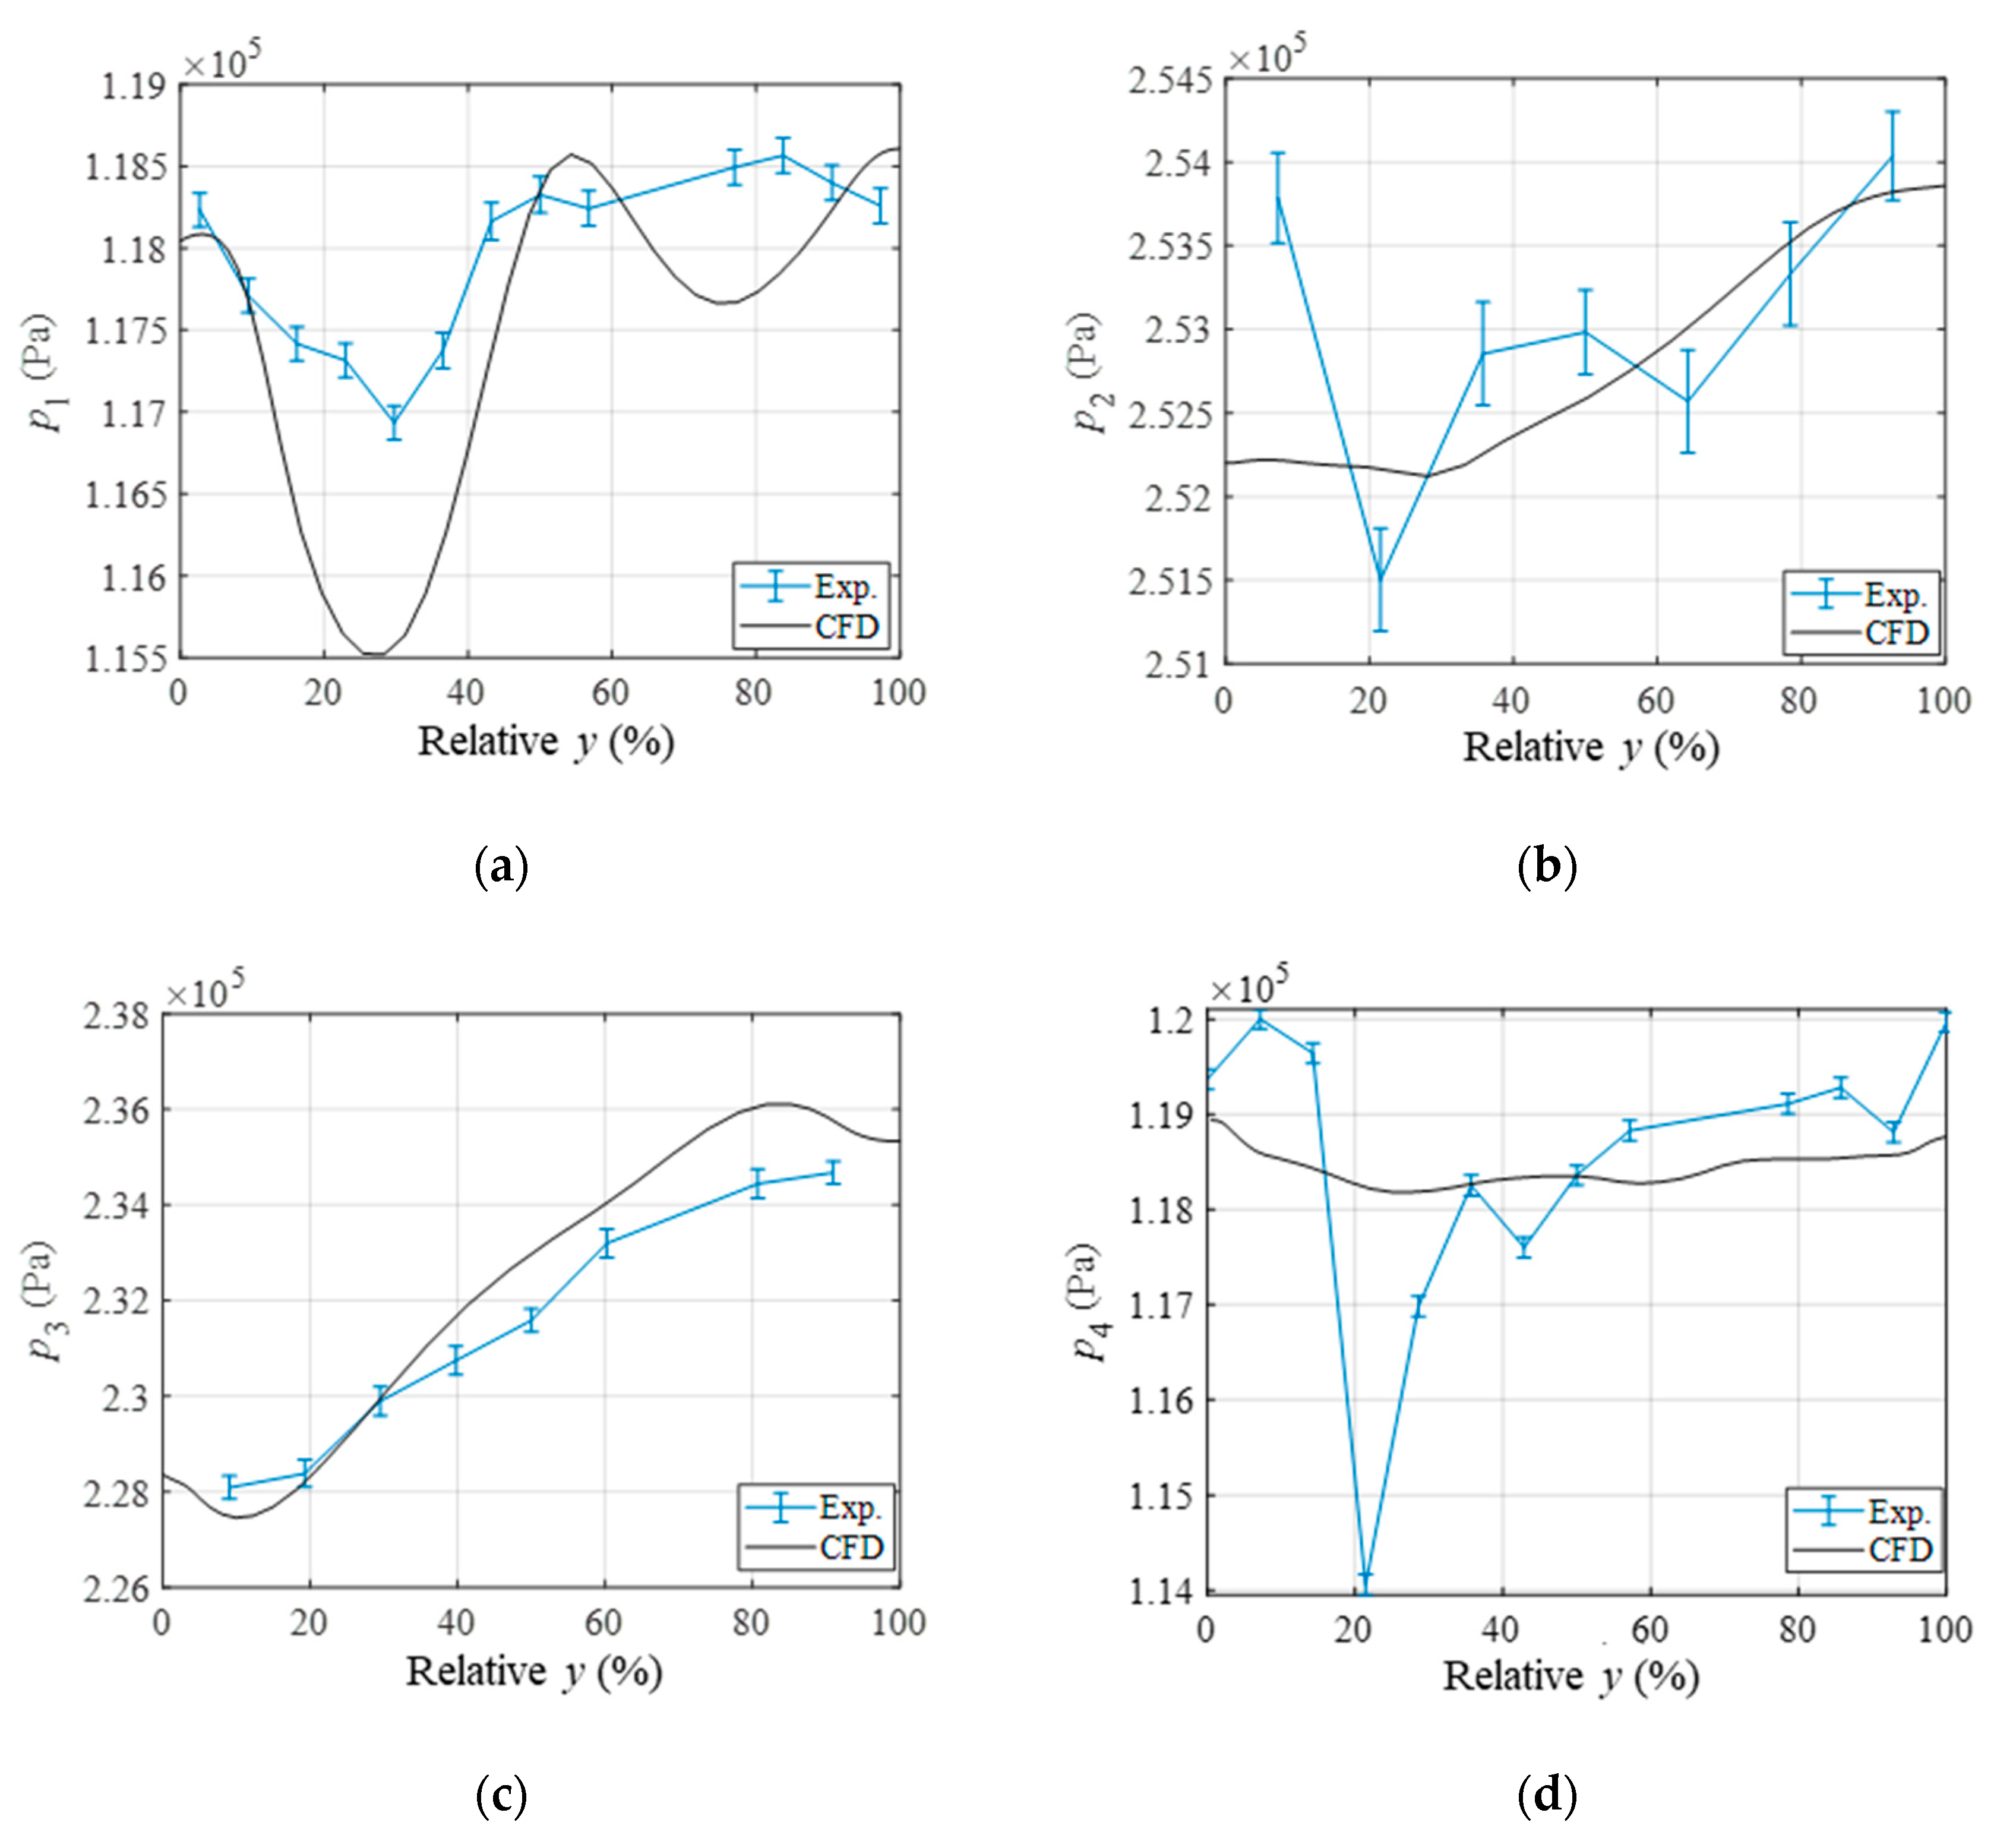
2.2.2. Model Validation

To verify the accuracy of the two-dimensional model for the flow field in the rotor, the numerical method is applied to the geometry and boundary conditions in our previous work [20], and the numerical results are compared with the experimental results. The numerical method and grid refinement are the same as mentioned in Section 2.2.1. The details of the experimental setup are described in the previous study [20,22]. For the numerical method and experiments, the circumferential pressure distribution at the rotor/stator interface of each port is shown in Figure 7. Here, p is the static pressure, the Arabic numerals in the subscript correspond to the four ports in Figure 6. Relative y represents the relative position in a port, here, 0 and 100% correspond to the open and closed positions of each port, respectively. It shows that the pressure distribution in the simulation at each port is approximately in good agreement with that in the experiment. Therefore, it proves that this two-dimensional model can simulate the variation of the flow field for formation and propagation process of pressure waves in the wave rotor.

3. Results Analysis

3.1. The Effects of Stagger Angle on Pressure Ratios

The pressure fields in the wave rotors are analyzed first, since they are the basis of the most fundamental performance of a wave rotor: the pressure ratios of compression and expansion. Figure 8 shows the instantaneous non-dimensional pressure (non-p) fields with different stagger angles. Here, the definition of the non-dimensional pressure is the ratio of the static pressure at each port to the total pressure at Port 1. Due to the pressure difference between the rotor and the ports, a series of pressure waves are generated in the rotor to expand or compress the flow. The specific pressure wave distribution is shown in the various lines in Figure 8. Take the baseline case (γ = 0°) in Figure 8a as an example. As a channel opens to Port 4, a left-moving main expansion wave ME is generated in the channel. Then it is reflected off the wall as the right-moving reflected expansion wave RE. After that, a compression wave is generated as the channel closes, and it tends to converge to a shock wave as it propagates in the channel. Port 1 is closed at the arrival of the hammer shock wave HS, and the flow in the channel is stagnated then. When the channel opens to the high-pressure Port 3, a main shock wave MS is triggered into the channel, and then it is reflected as the reflected shock wave RS when the channel opens to Port 2. As Port 3 closes to the channel, a right-moving ending expansion wave EE is generated in the channel, and Port 2 is closed at the arrival of the expansion wave EE. The flow field in the channel is halted, and goes to the next loop then. Comparison among the pressure fields Figure 8a–e shows a common feature for different stagger angles. That is, the front of any moving pressure wave stays perpendicular to the side-walls of the channel, while the propagation velocity of any pressure wave stays parallel to the side-walls of the channel. Moreover, the moving patterns of the unsteady pressure waves match the opening and closing edges of ports at the modified rim velocity for any stagger angle, which further indicates that the unsteady pressure wave systems are similar within the investigated stagger angle range (0° ≤ γ ≤ 30°). It validates the modifications in the geometry model in sub-Section 2.1, especially those modifications on outlet port offset and rim velocity.
As a result, the pressure ratios of compression Π and expansion ε are listed in Table 3, which are approximately equal to 3.0 and 1.19, respectively. It shows that when γ increases from 0° to 30°, the wave rotor basically keeps the compression and expansion pressure ratios, which is an effect of proper modifications of geometry models for different stagger angles.

3.2. The Effects of Stagger Angle on the Direction of Flow at Each Port

The directions of inlet and outlet flows are functions of the stagger angle according to the velocity triangle theory in Equation (3), and they determine the inclination angle θ of the port sidewalls as Table 1 illustrates. Instantaneous streamlines at each port of different γ are shown in Figure 8 above. As Figure 8 shows, the streamline directions in each port tend to follow the sidewalls far away from the rotor. However, the streamlines are bended near the rotor, and this feature is relatively obvious in the cases with larger stagger angles like Figure 8e. In addition, a separation vortex appears when a channel opens at an outlet port, and the separation vortex size increases with the increase in stagger angle. Bended streamlines and separation vortexes indicate that the flow direction does not exactly follow the port sidewalls at the rotor/stator interface. After all, the selected values of θ in Table 1 represent optimization targets of absolute velocity directions. The two-dimensional flow details would lead to deviation of the absolute velocity angle α from the selected inclination angle θ, and here we are investigating if such deviation is acceptable.

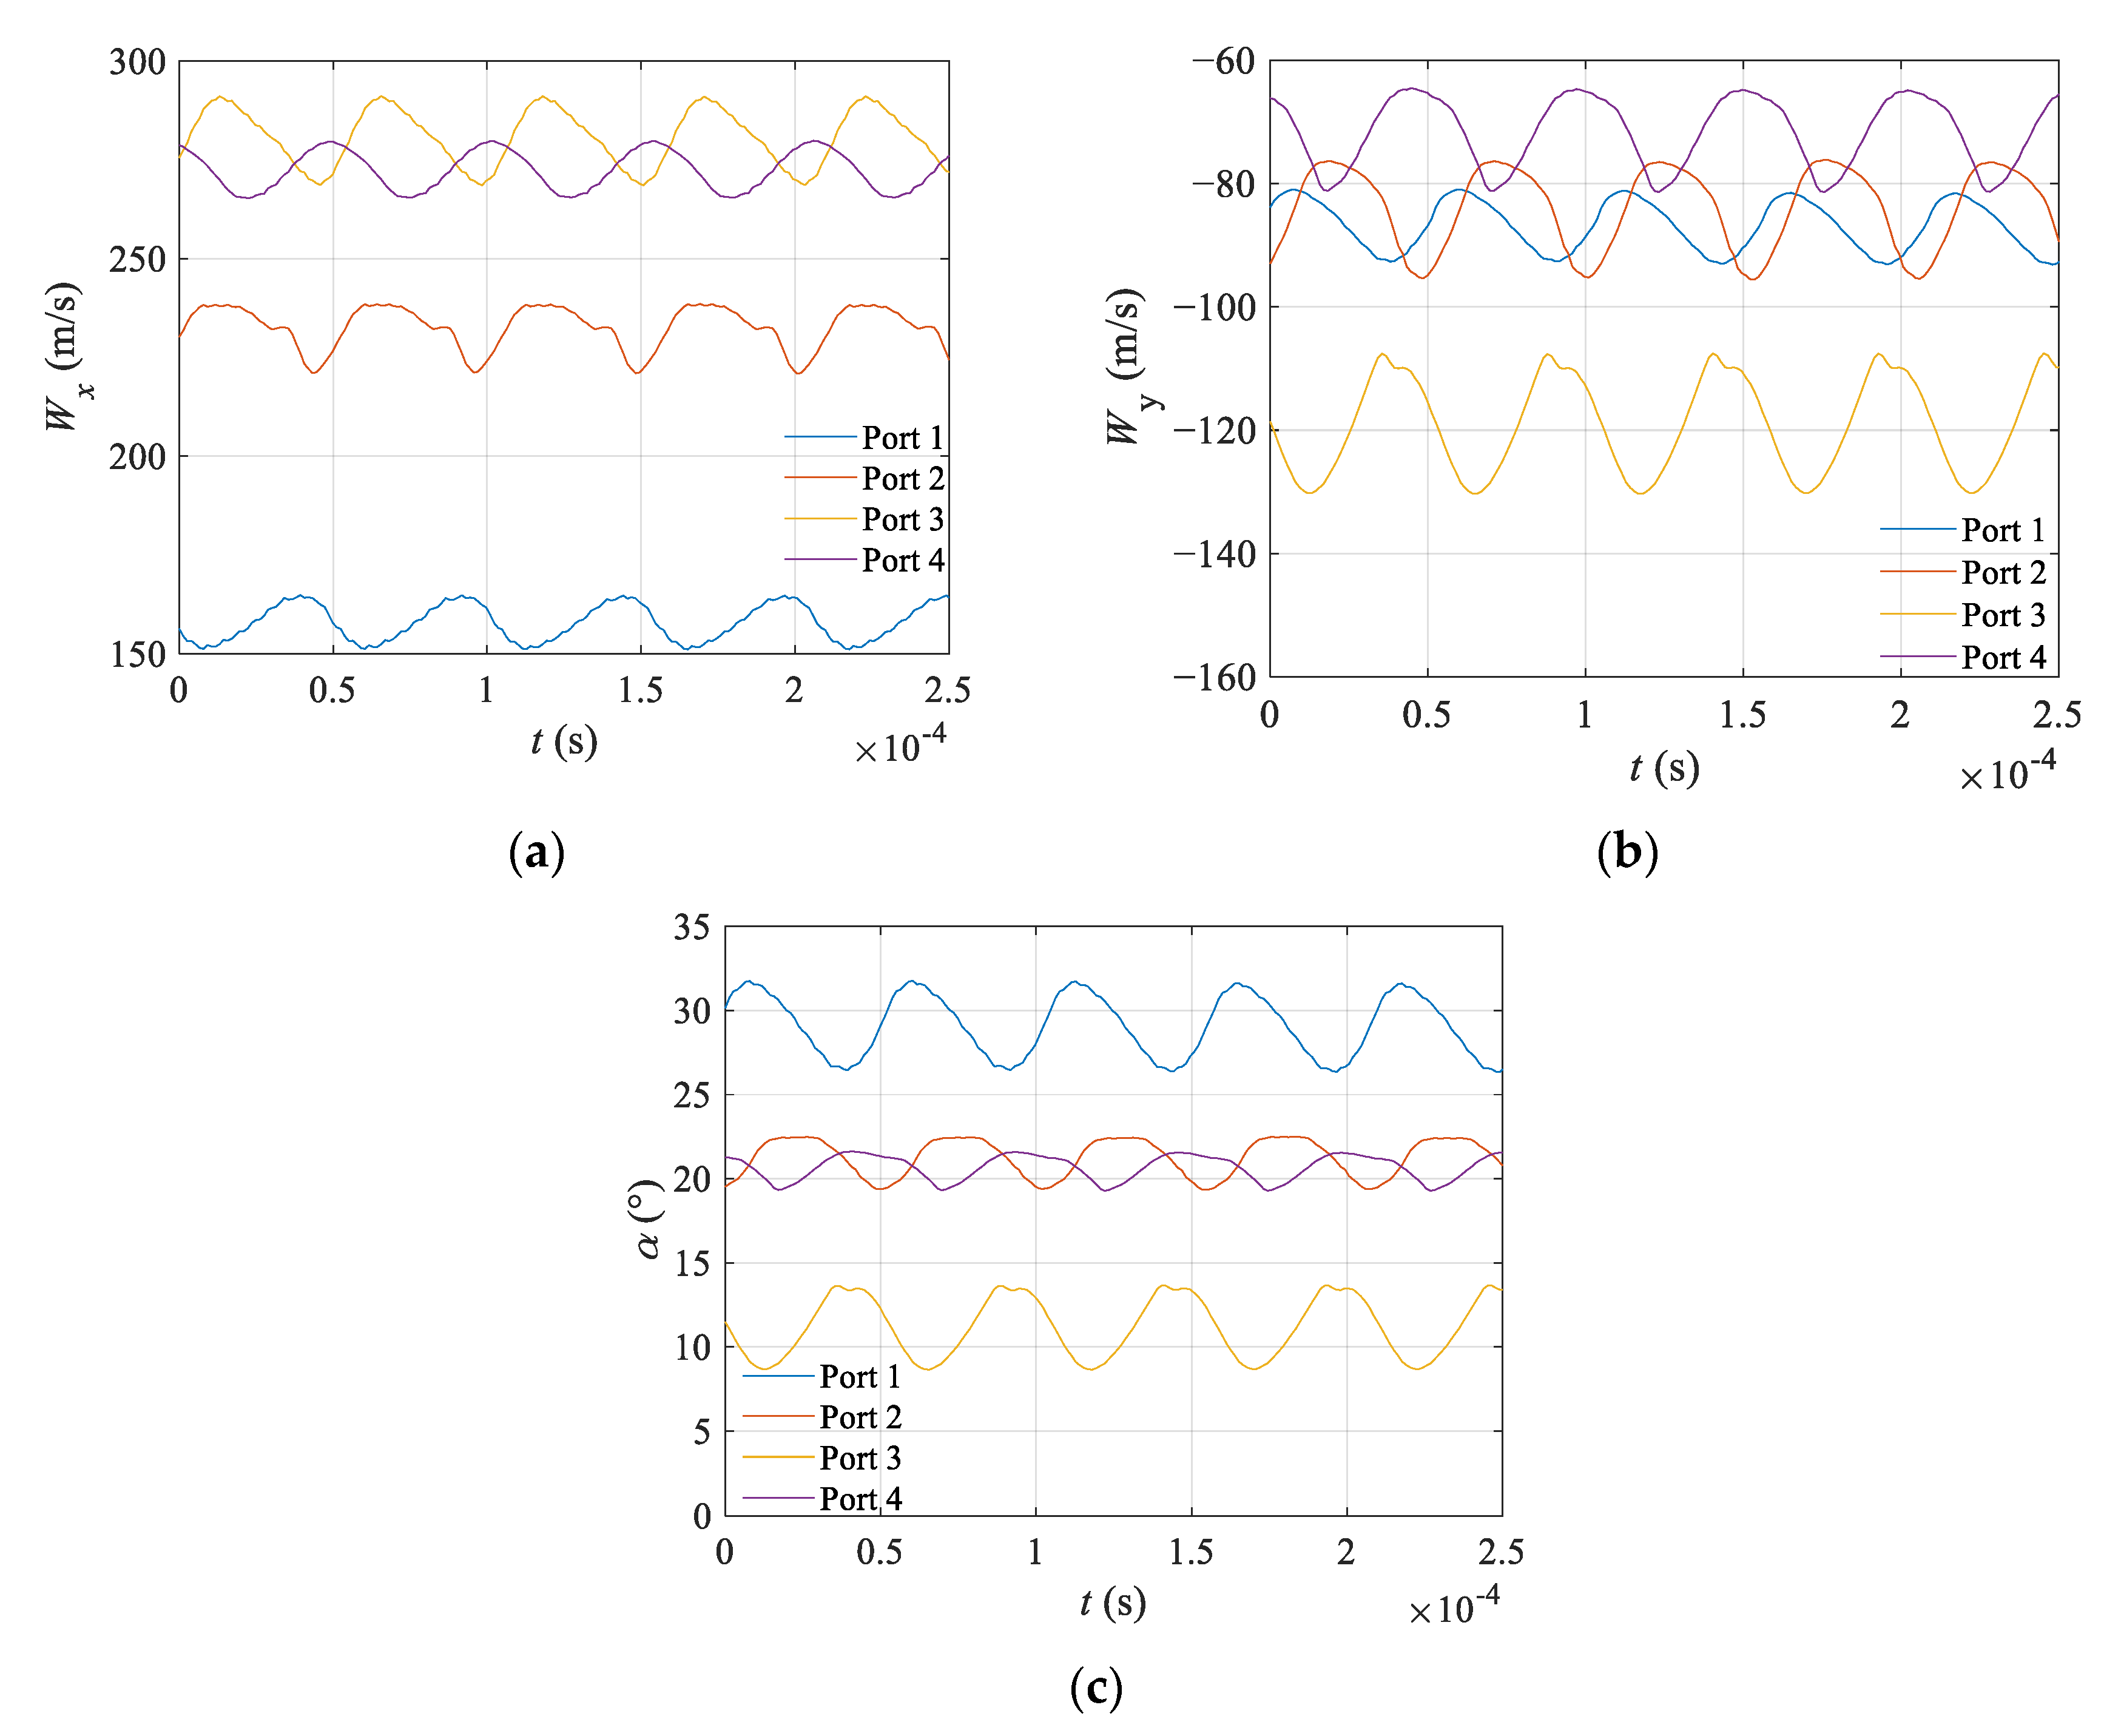
3.2.1. Unsteadiness of the Velocity

The flow field in a wave rotor channel is intrinsically unsteady, as is the flow at the rotor/stator interface. In this case, we analyze the unsteadiness in the flow directions at the rotor/stator interface at first. As the unsteadiness is due to similar unsteady pressure waves for different stagger angles, the situation of parameters at γ = 20° is taken as a sample as shown in Figure 9. Each velocity data is the spatial-averaged velocity of the entire rotor/stator interface of a port. Where, x in the subscript represents the axial component of the parameter, y in the subscript represents the tangential component of the parameter, as shown in Figure 5. In Figure 9a,b, axial and tangential velocities oscillate periodically and show different values at different ports. In the time period of 2.5 × 10⁻⁴ s in Figure 9a,b, the velocity goes through about five periods at each port and γ. It indicates that the oscillation period of the velocity at each port is the same, and is about 0.5 × 10⁻⁴ s. Note that the channel passing period τ = B/U, and its value of this wave rotor is approximately 0.5 × 10⁻⁴ s. The oscillation period of the velocity is approximately equal to the channel passing period. It indicates that the rotational movement of the rotor channels leads to the dominant unsteadiness of the velocity. The flow direction is represented by the absolute velocity angle α, and its instantaneous value can be calculated with the instantaneous CFD results of Wx and Wy by the following equation:
α = tan 1 U W y W x
Wx and Wy oscillate as shown in Figure 9a,b, so α experiences similar periodical oscillation in the channel-passing period, as illustrated in Figure 9c.

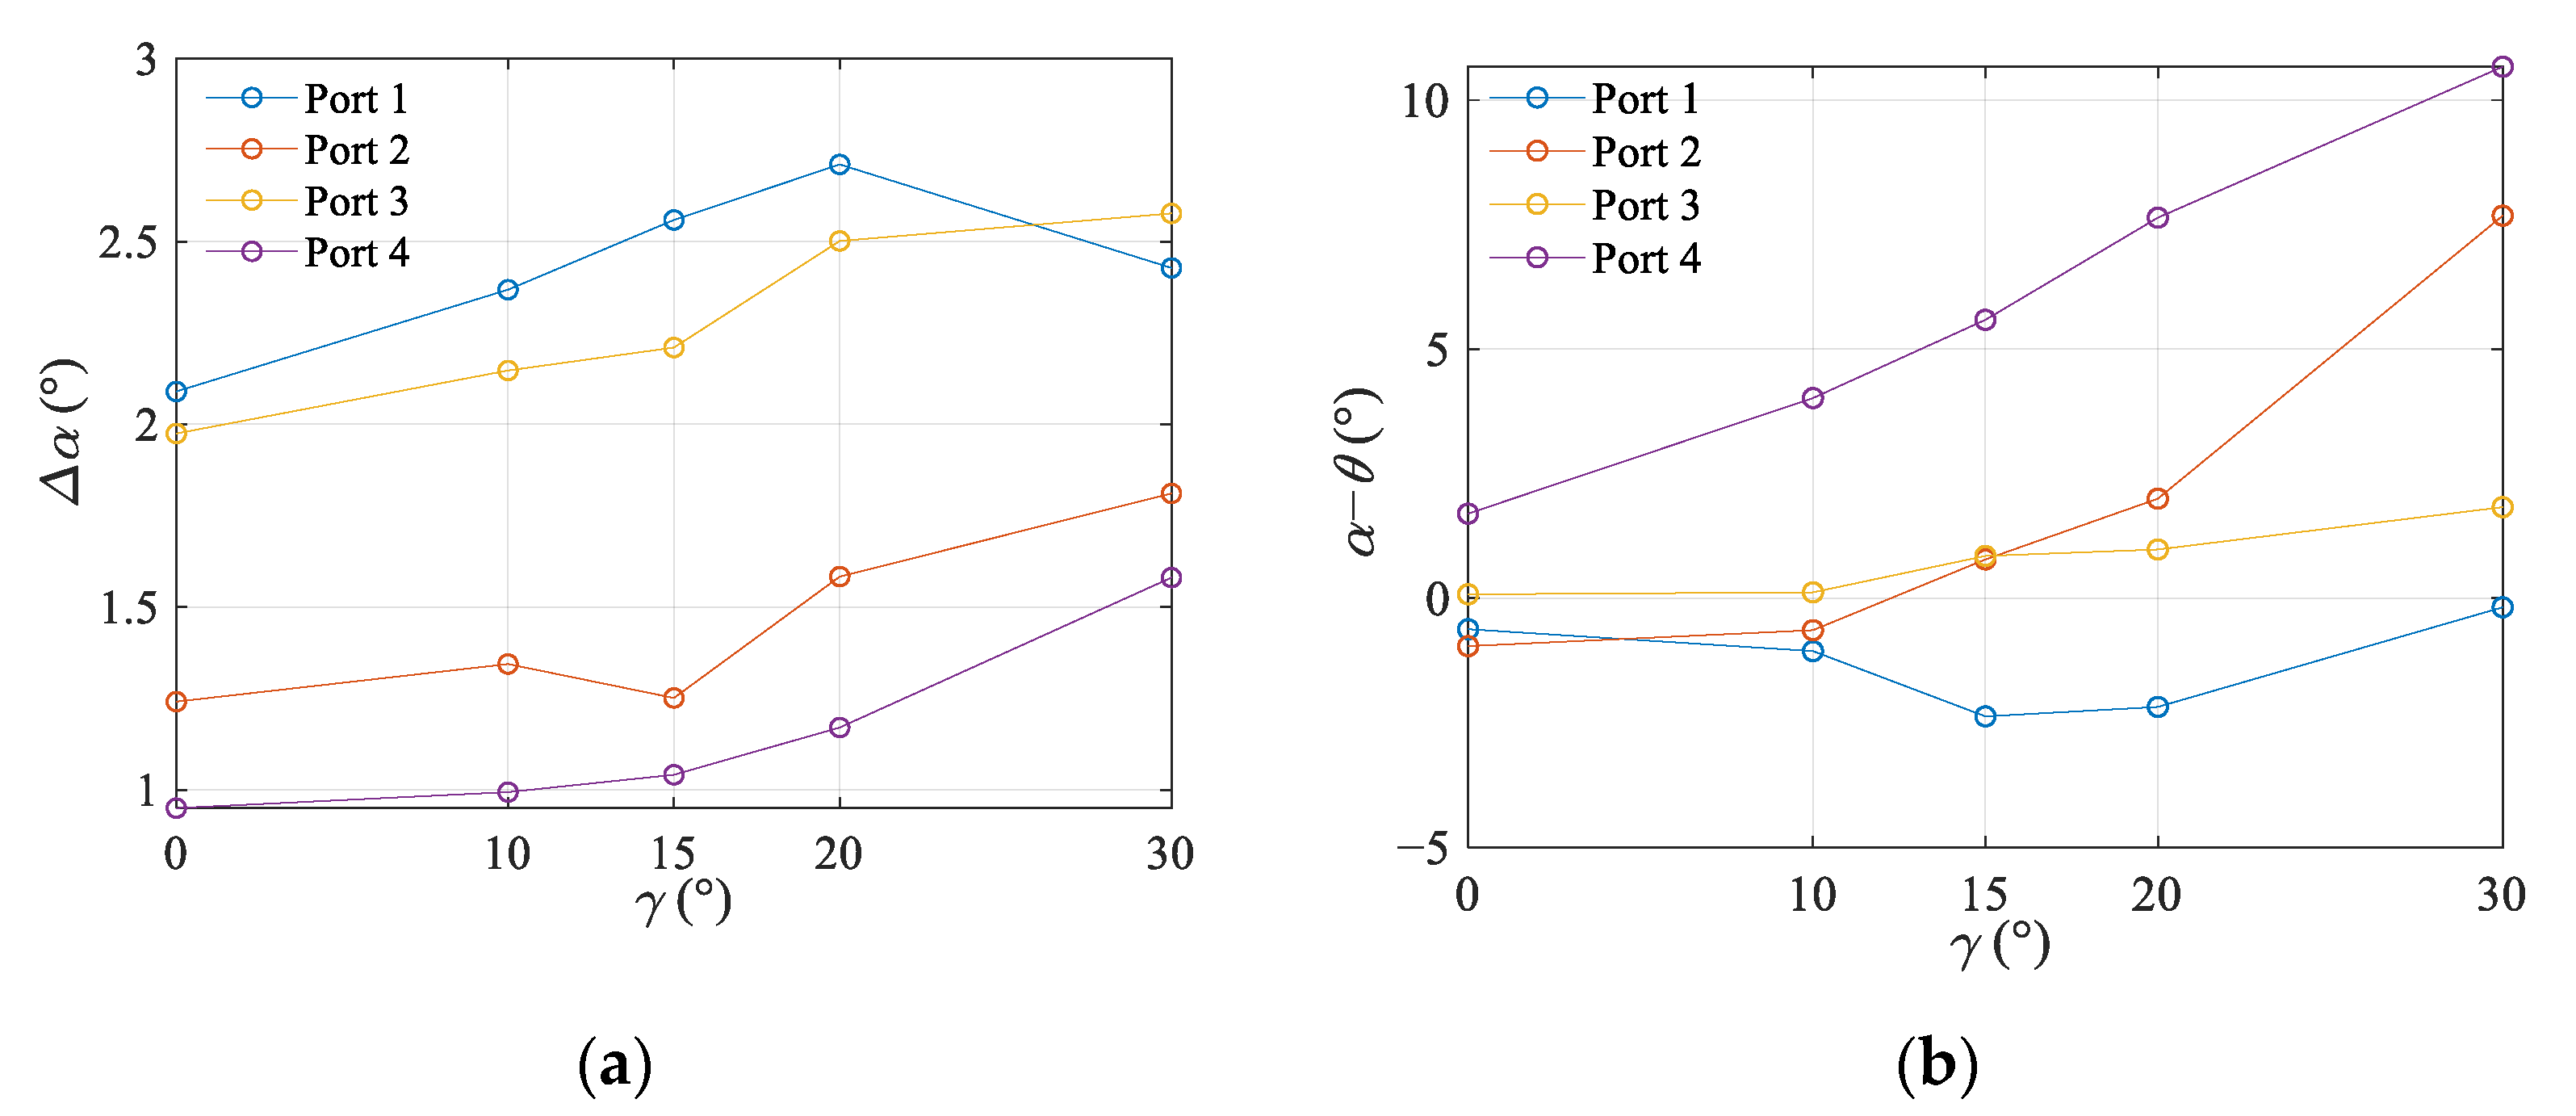
3.2.2. The Effect of Stagger Angle on Absolute Velocity Angle at Each Port

As the period of oscillation in the flow at the rotor/stator interface is known, the time-average and the oscillation amplitude of the absolute velocity angle α is calculated, and thus, the deviation of flow direction can be analyzed. The period of oscillation is divided into 40 physical time steps for sufficient time resolutions of the results in this work, that is, 40 phases are taken as a channel passing period. The time-averaged parameters are obtained by the arithmetic average of parameters within a channel passing period. The time-averaged velocity components of W and α at the rotor/stator interface are listed in Table 4.
The oscillation amplitudes of absolute velocity angle Δα at each port for different γ are calculated and illustrated in Figure 10a. The maximum value of Δα is about 2.7° in all the four ports for all the investigated stagger angles, which is acceptable. Such oscillation amplitude is referenced as uncertainty of flow direction. Figure 10b illustrates the deviation between α and θ at each port. Most data points Figure 10b show positive (αθ) values, except the data of Port 1 and the data of Port 2 where γ ≤ 10°. As the modification of stagger angle γ tends to decrease the port inclination angle θ (Equation (3)), a positive value of (αθ) means an insufficient effect of stagger angle modification. The trends are interesting, too. All the data except a fraction of data points of Port 1 where γ ≤ 15° show increasing trends in Figure 10b. It means that the larger stagger angle sustains more serious deviation, which is an ordinary trend of geometric modification.
Moreover, the absolute values of (αθ) for inlet ports (Port 1 and Port 3) are relatively smaller than those for outlet ports (Port 2 and Port 4), according to the data in Figure 10b. With the reference of Δα, the absolute values of deviation (αθ) in the inlet ports are even smaller than the corresponding oscillation amplitude Δα, so the deviation is treated as small and negligible. The deviation is larger in the outlet ports, and a possible reason is the separation vortex. As illustrated in Figure 11 and Figure 12, the separation vortex always exists at the outlet port in a period. Here, the time when a channel opens to the port is defined as the start time of a channel passing period τ (t = 0). The separation vortex tends to lift up the adjacent streamlines by reducing the x-velocity. Therefore, α at the outlet port is increased, which fits the increased (αθ) values of Port 2 or Port 4 in Figure 10b. After all, the streamlines tend to follow the port sidewalls away from the rotor/stator interface according to Figure 8, Figure 11 and Figure 12. The influential region of such deviation is limited close to the rotor/stator interface, and the deviation (α − θ) would not affect the upstream or downstream components of the wave rotor. It further validates the modifications in the geometry model in sub-Section 2.1, especially the modifications on port inclination angles.

3.3. The Effect of Stagger Angle on Shaft Power

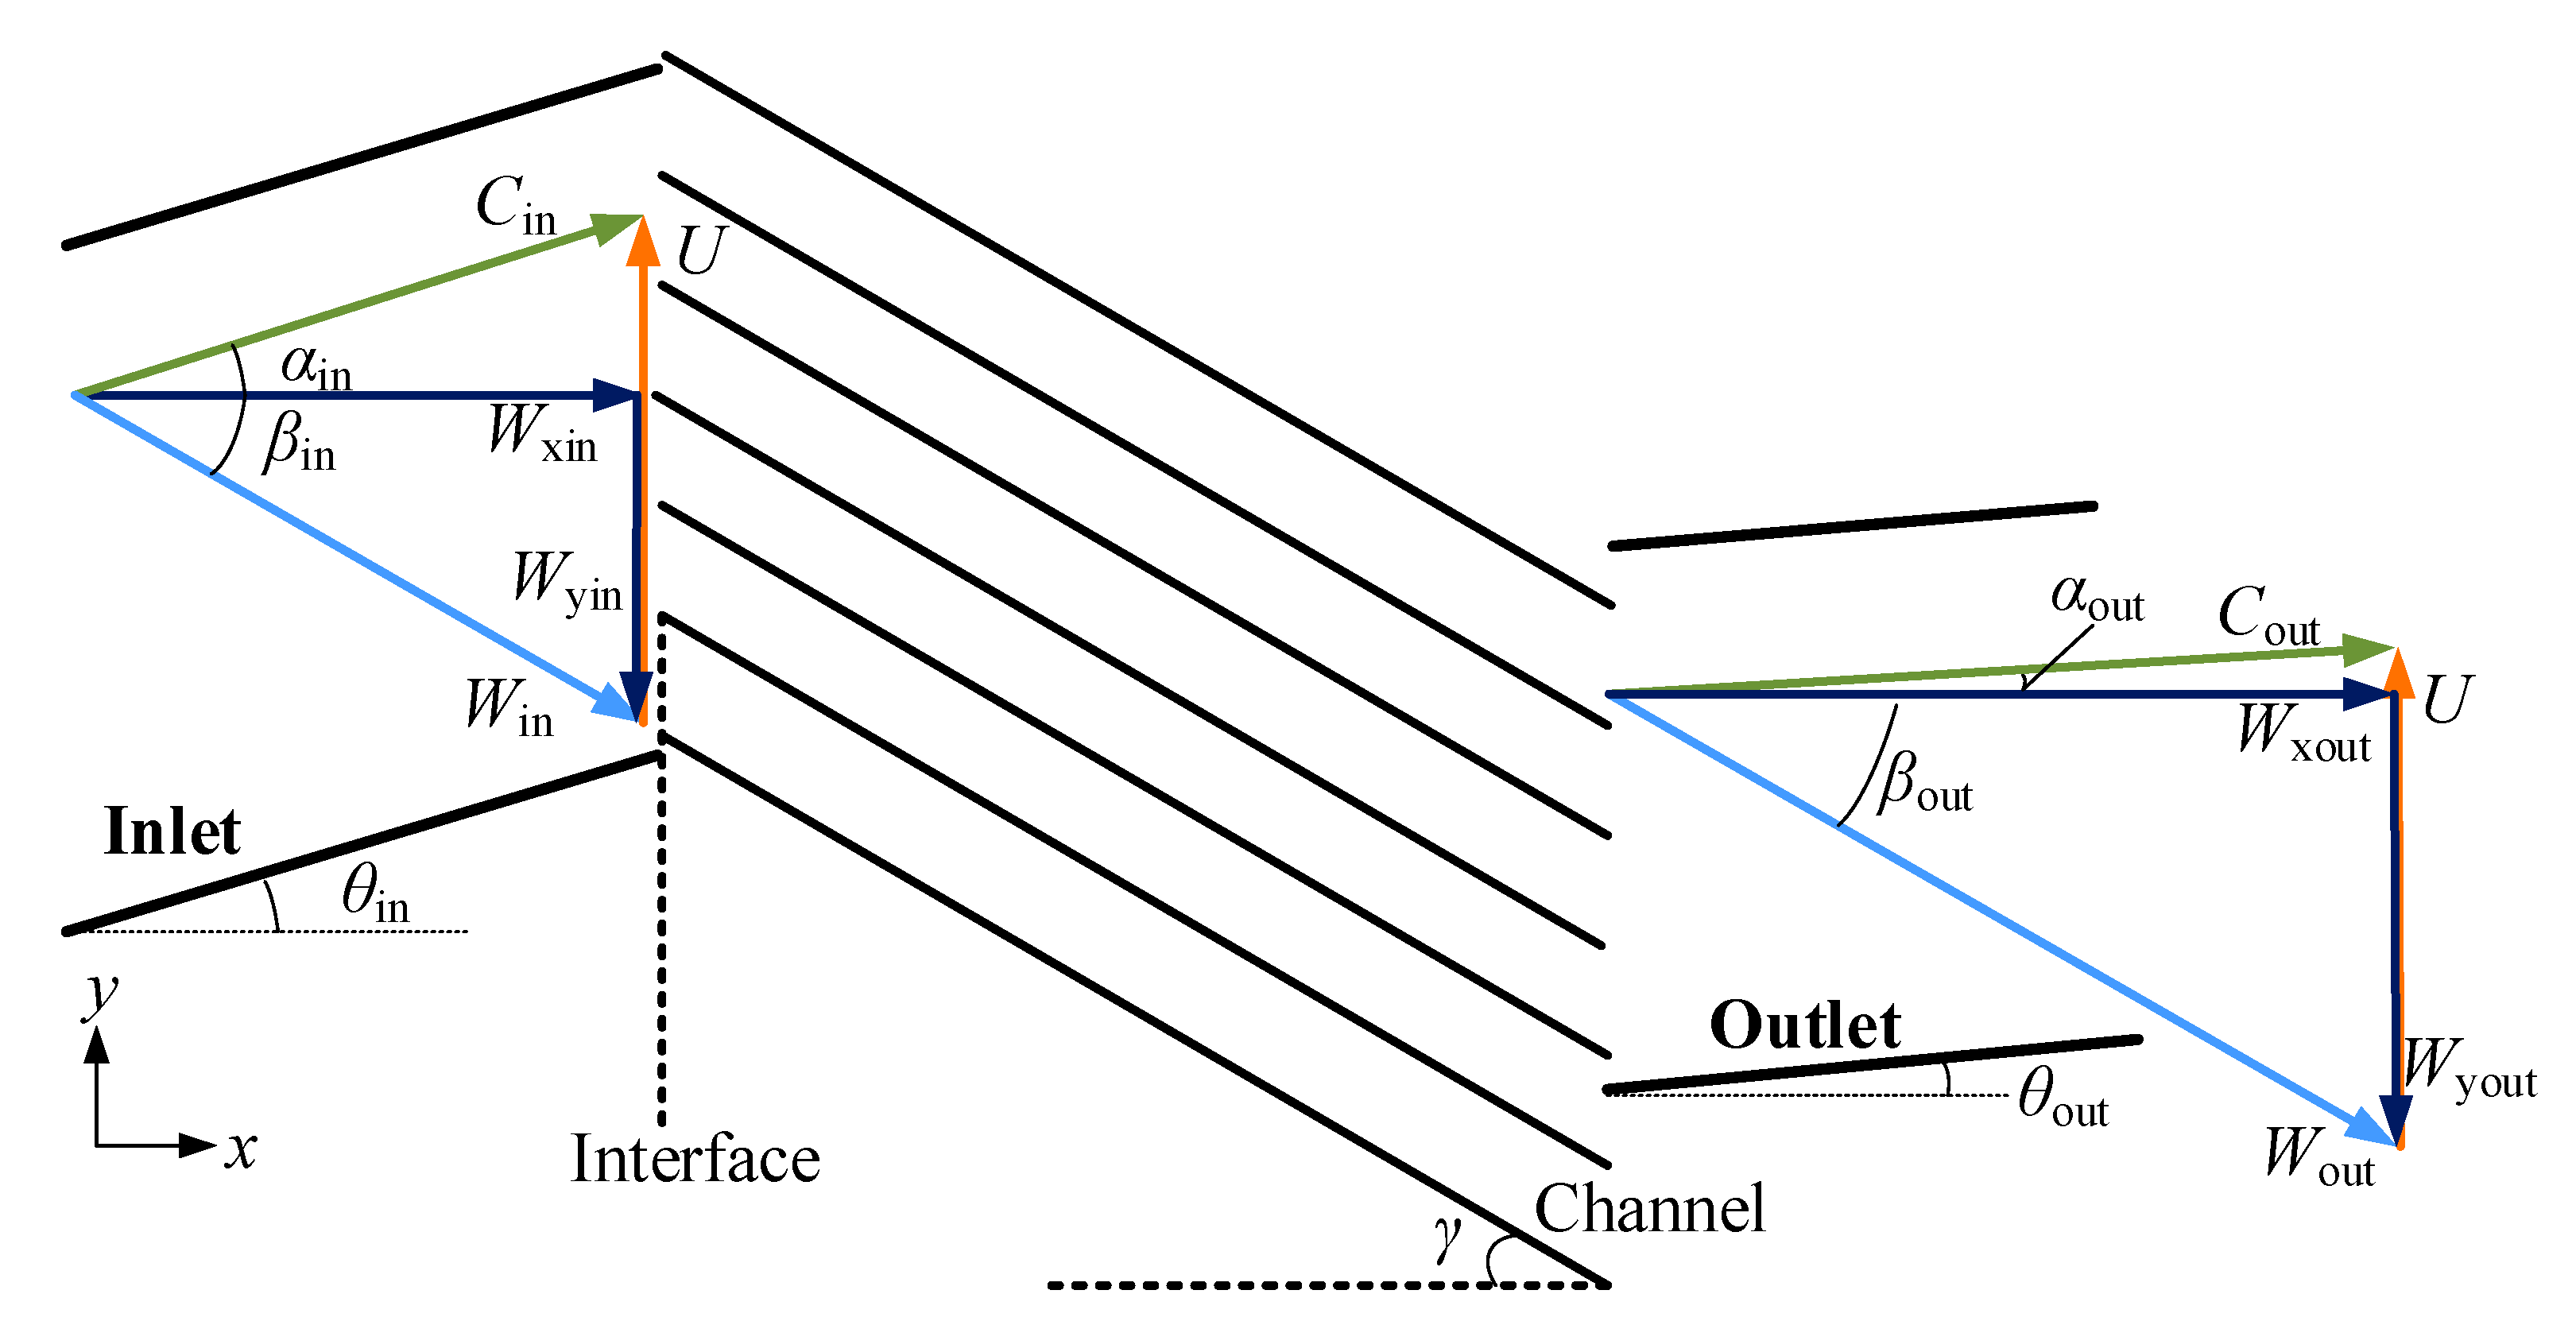
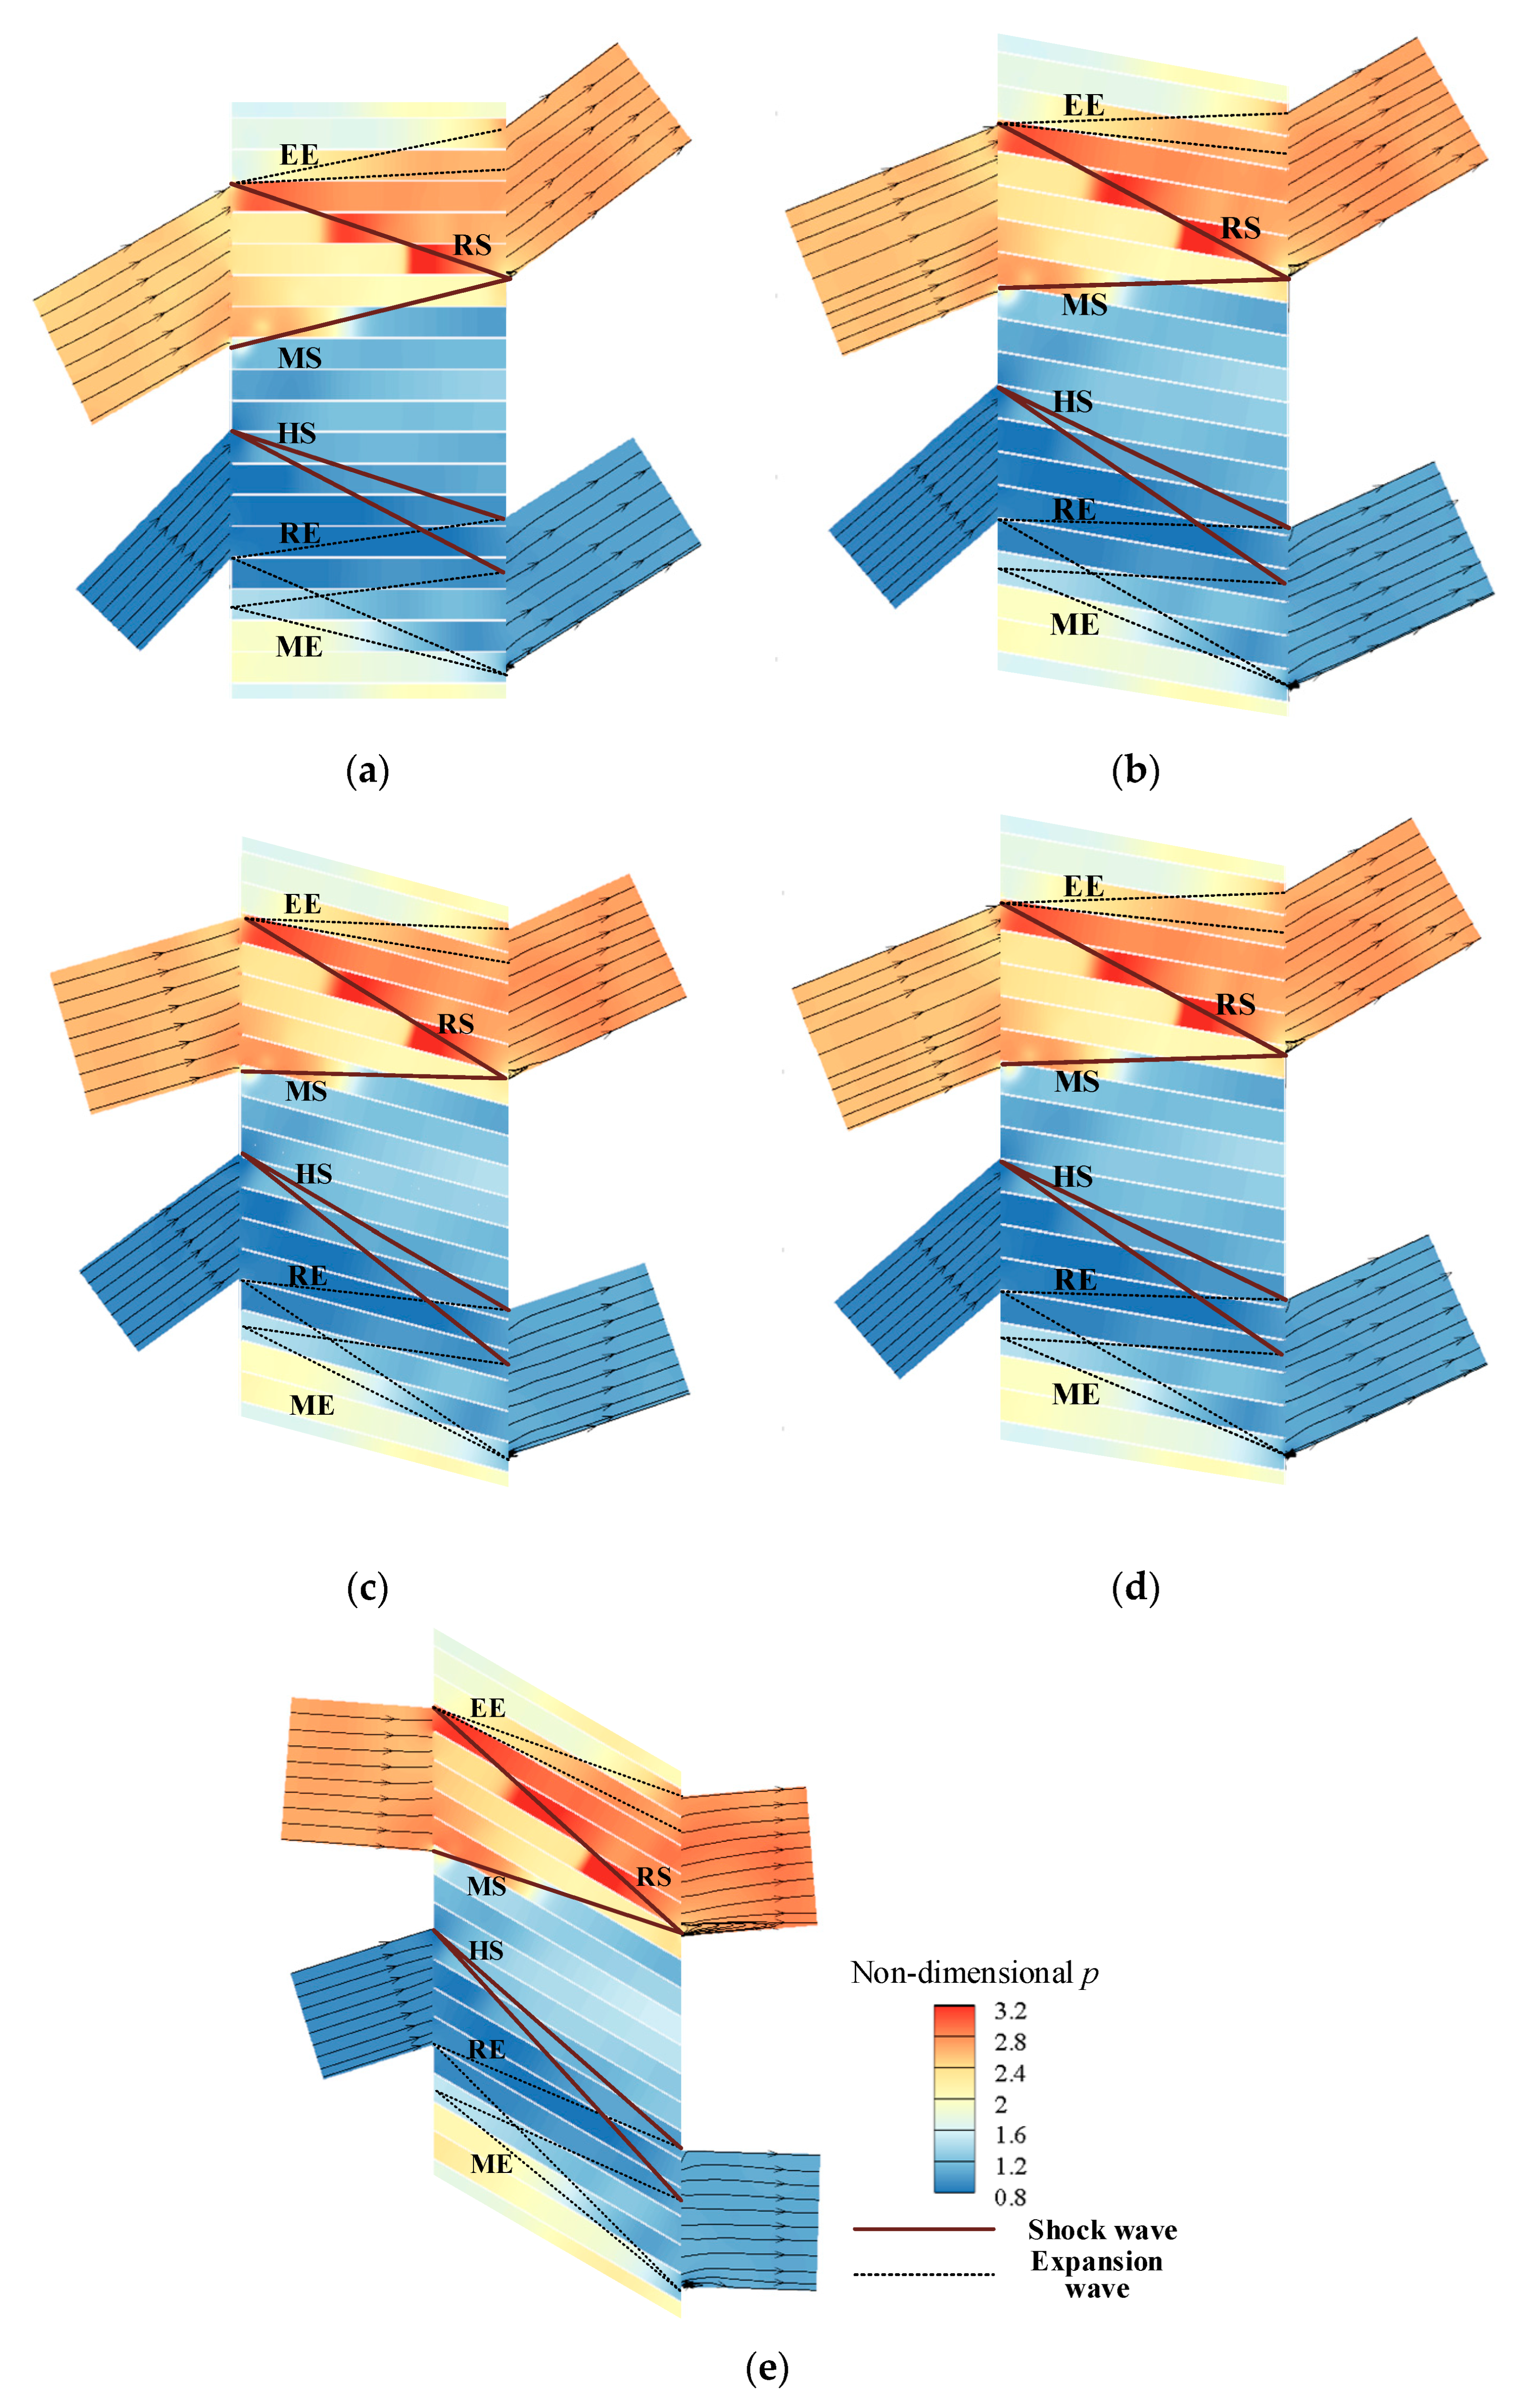
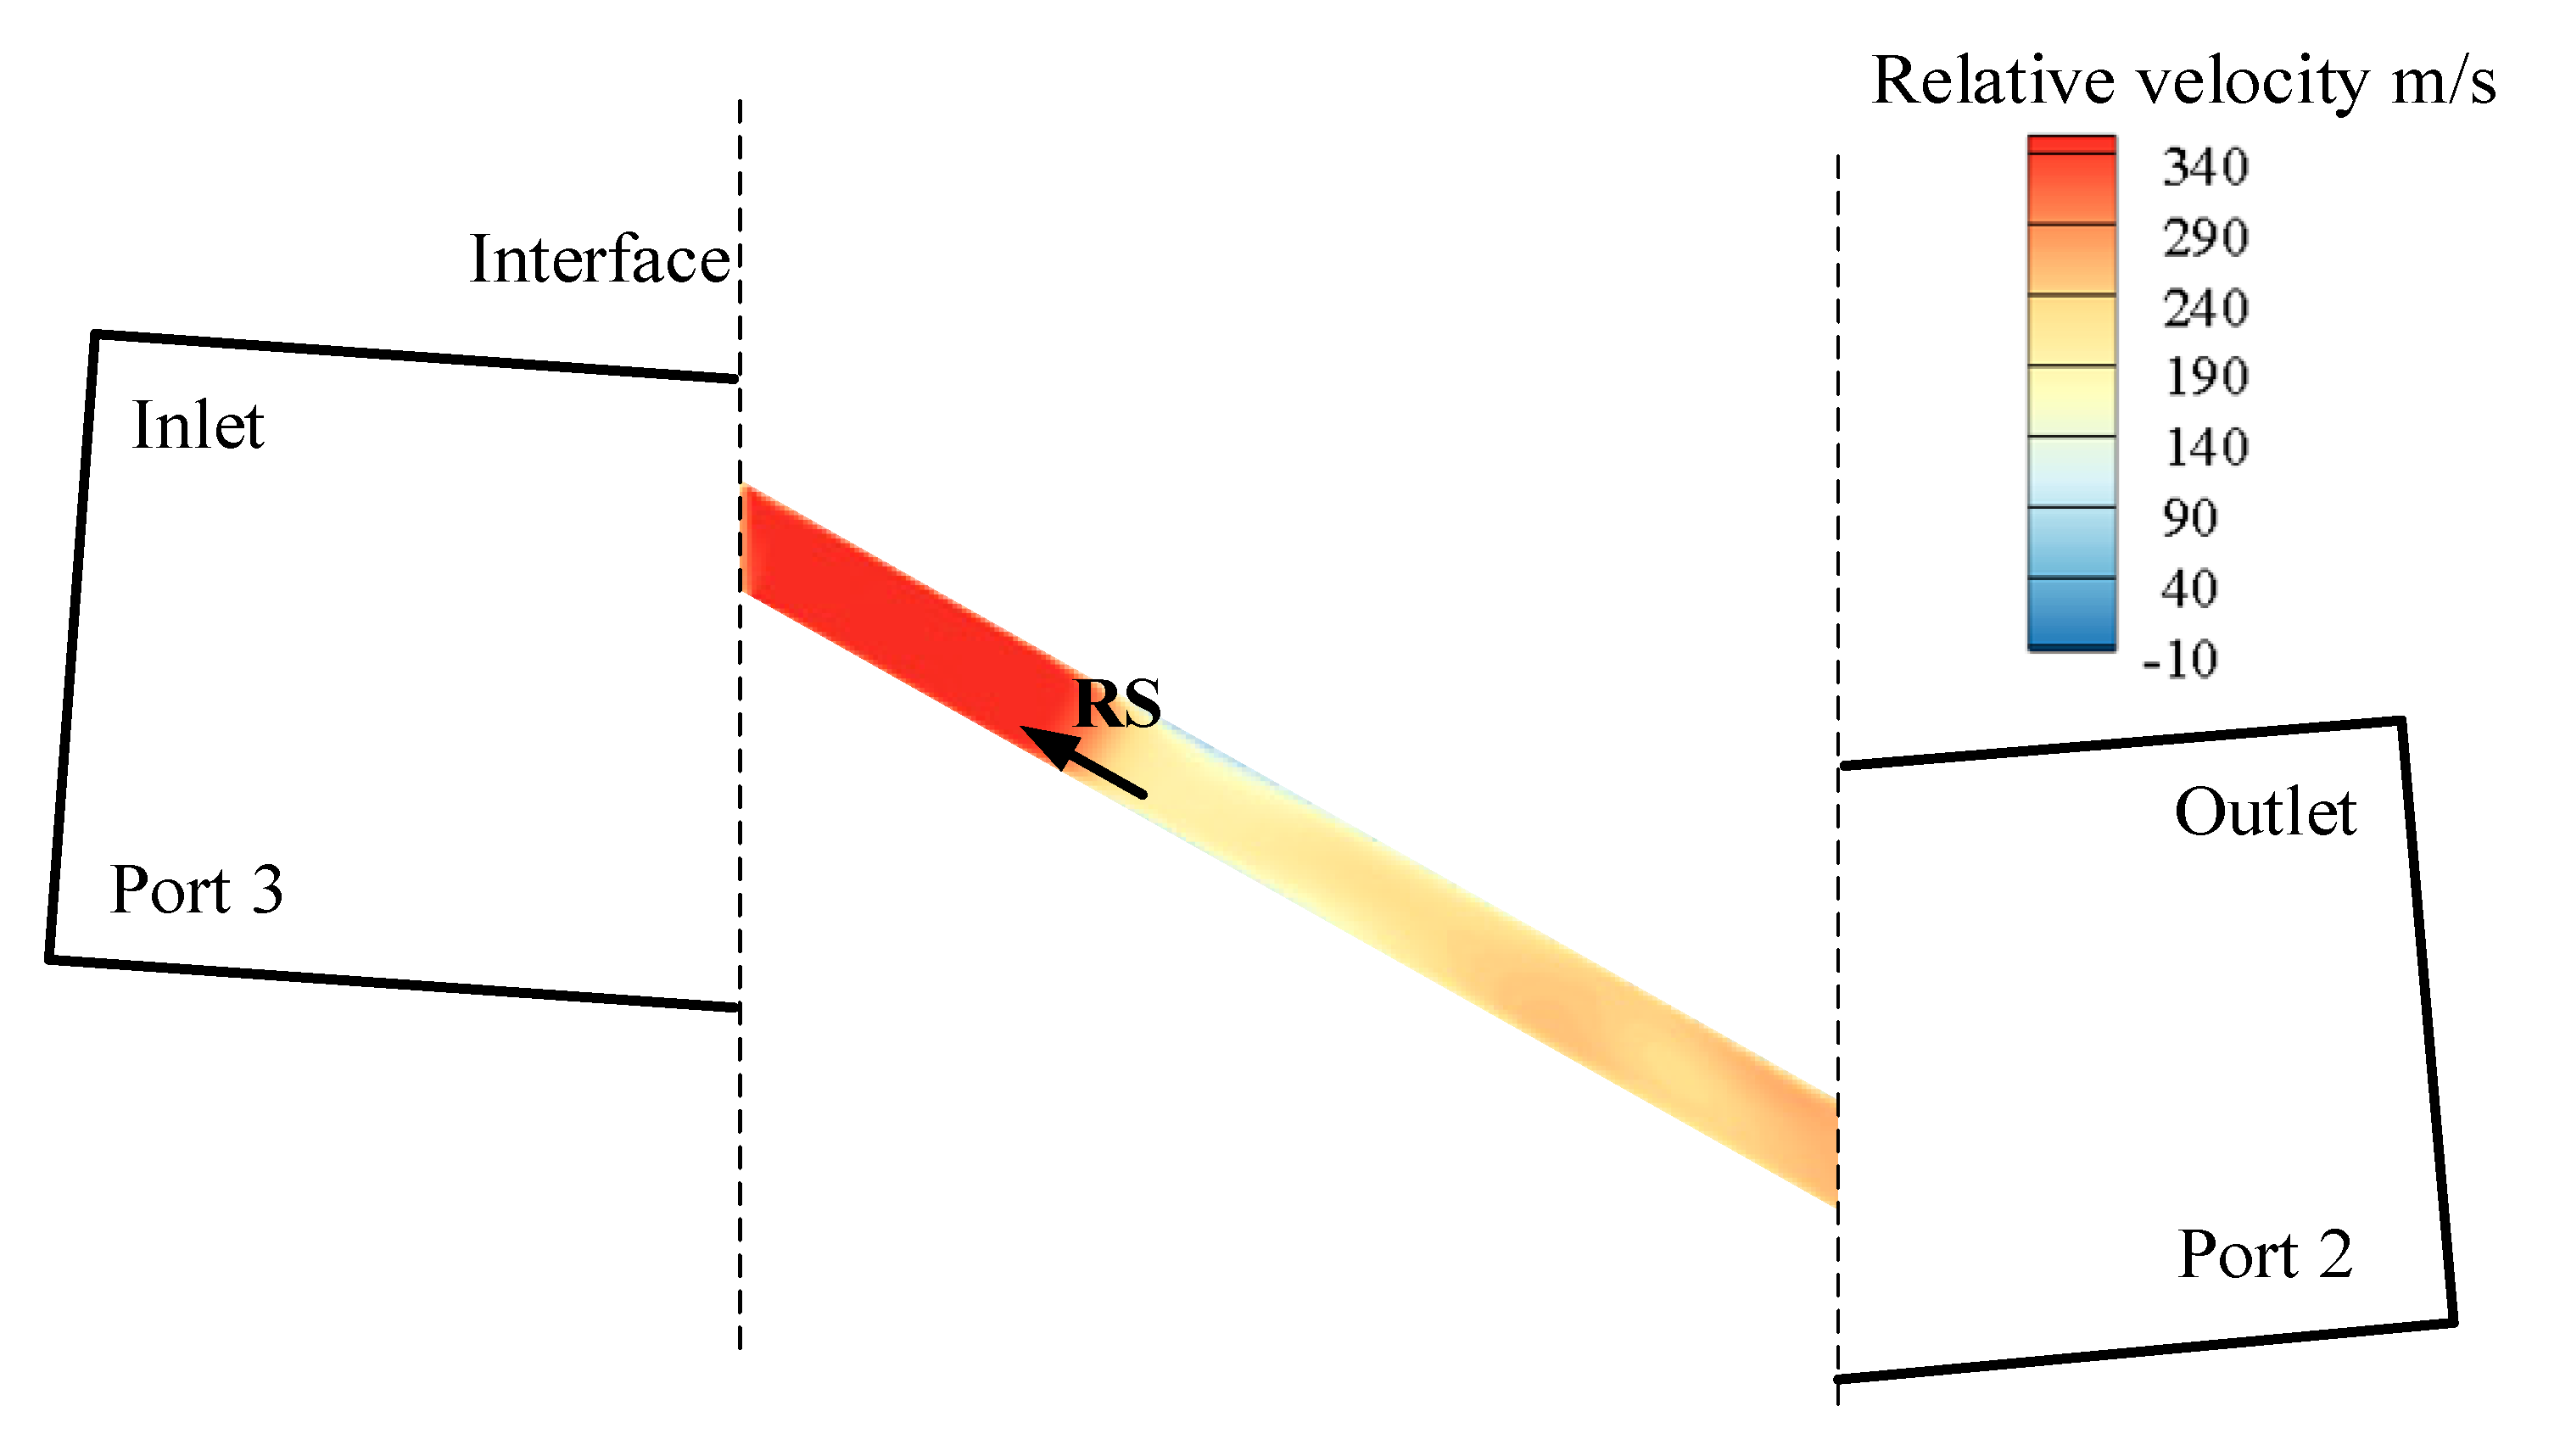
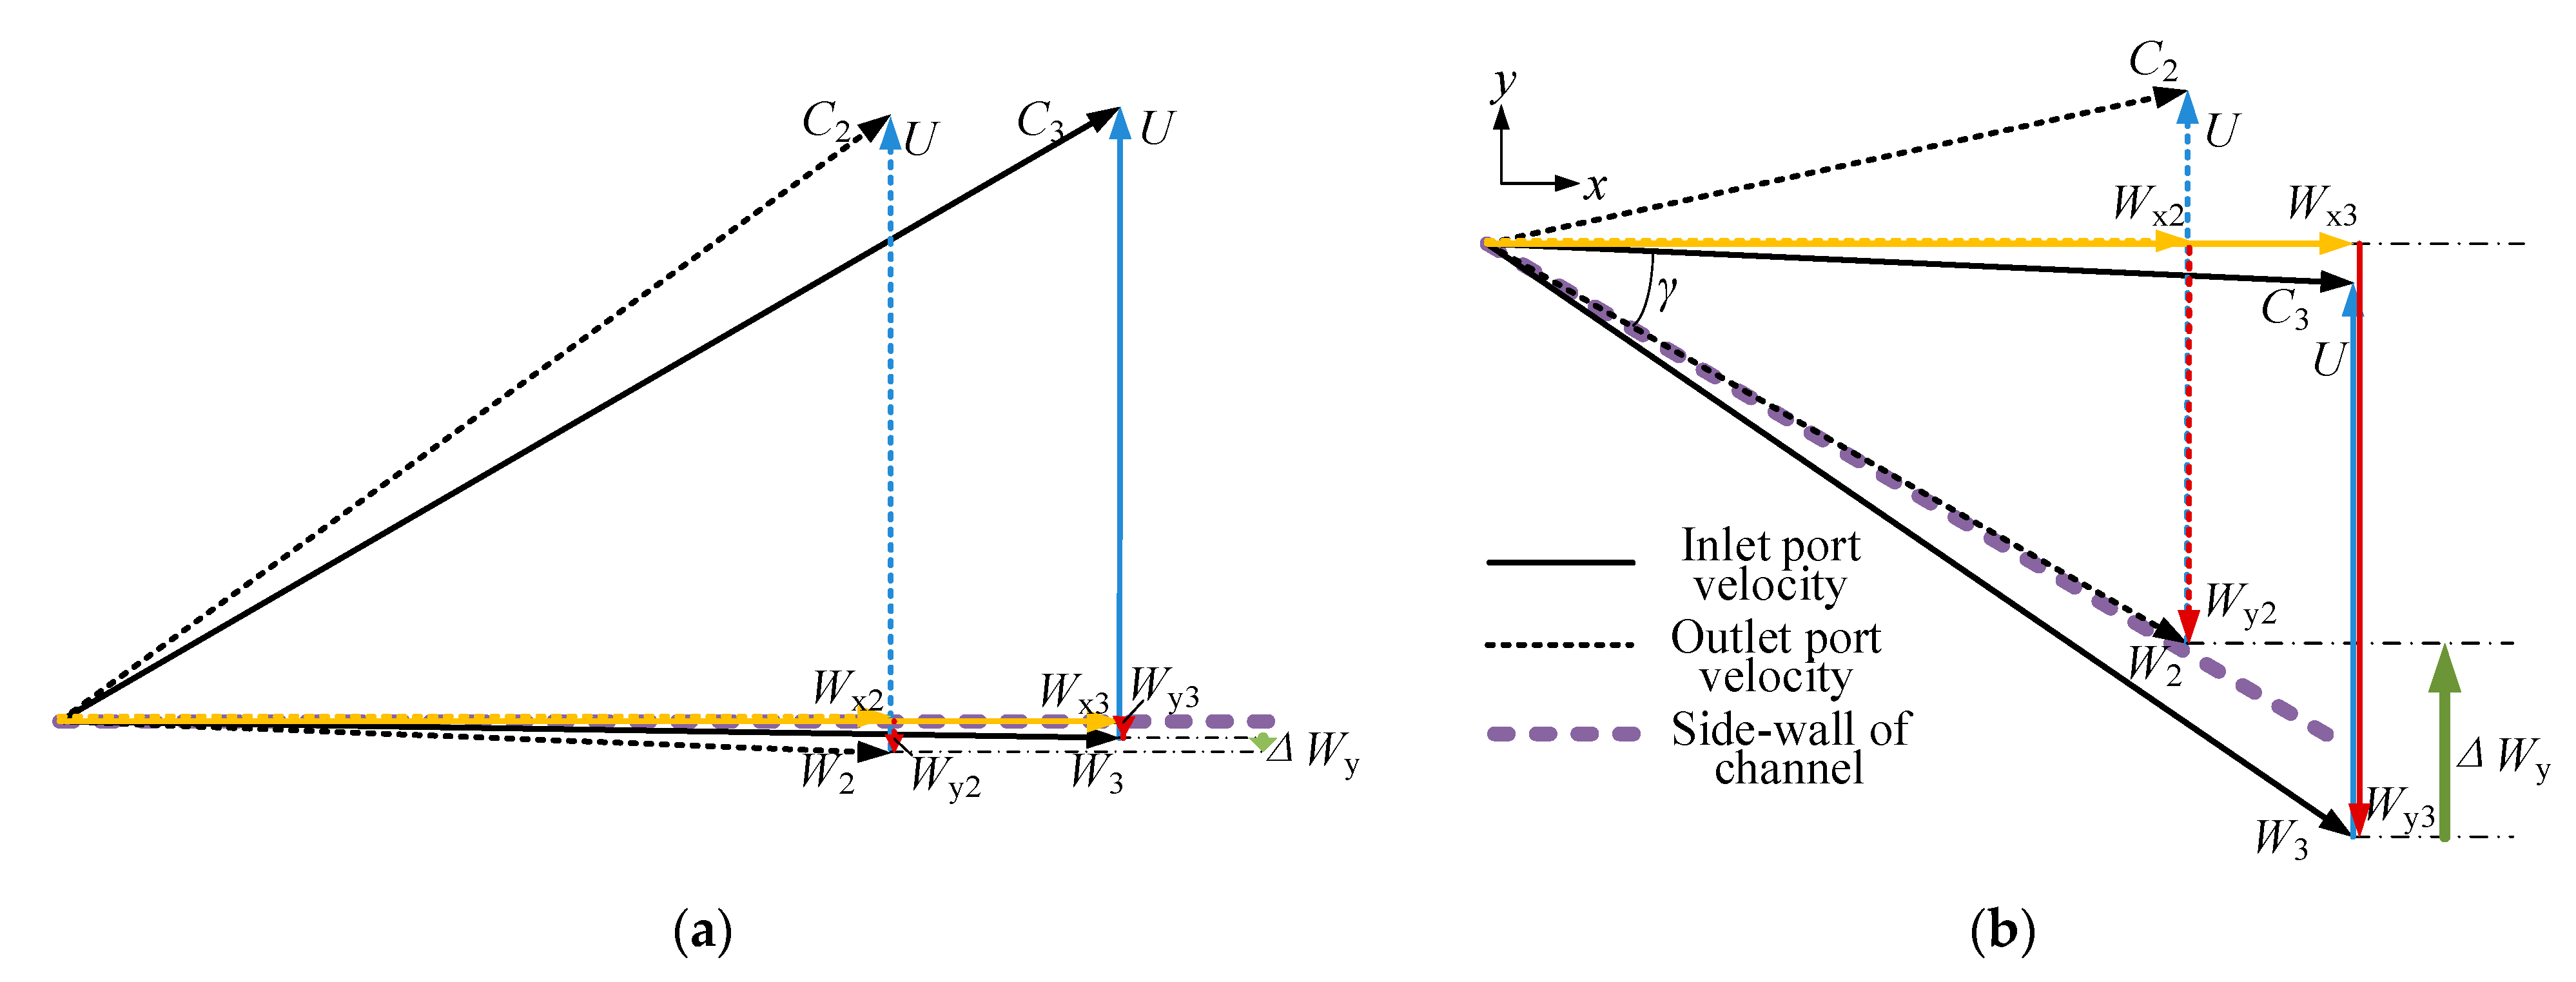
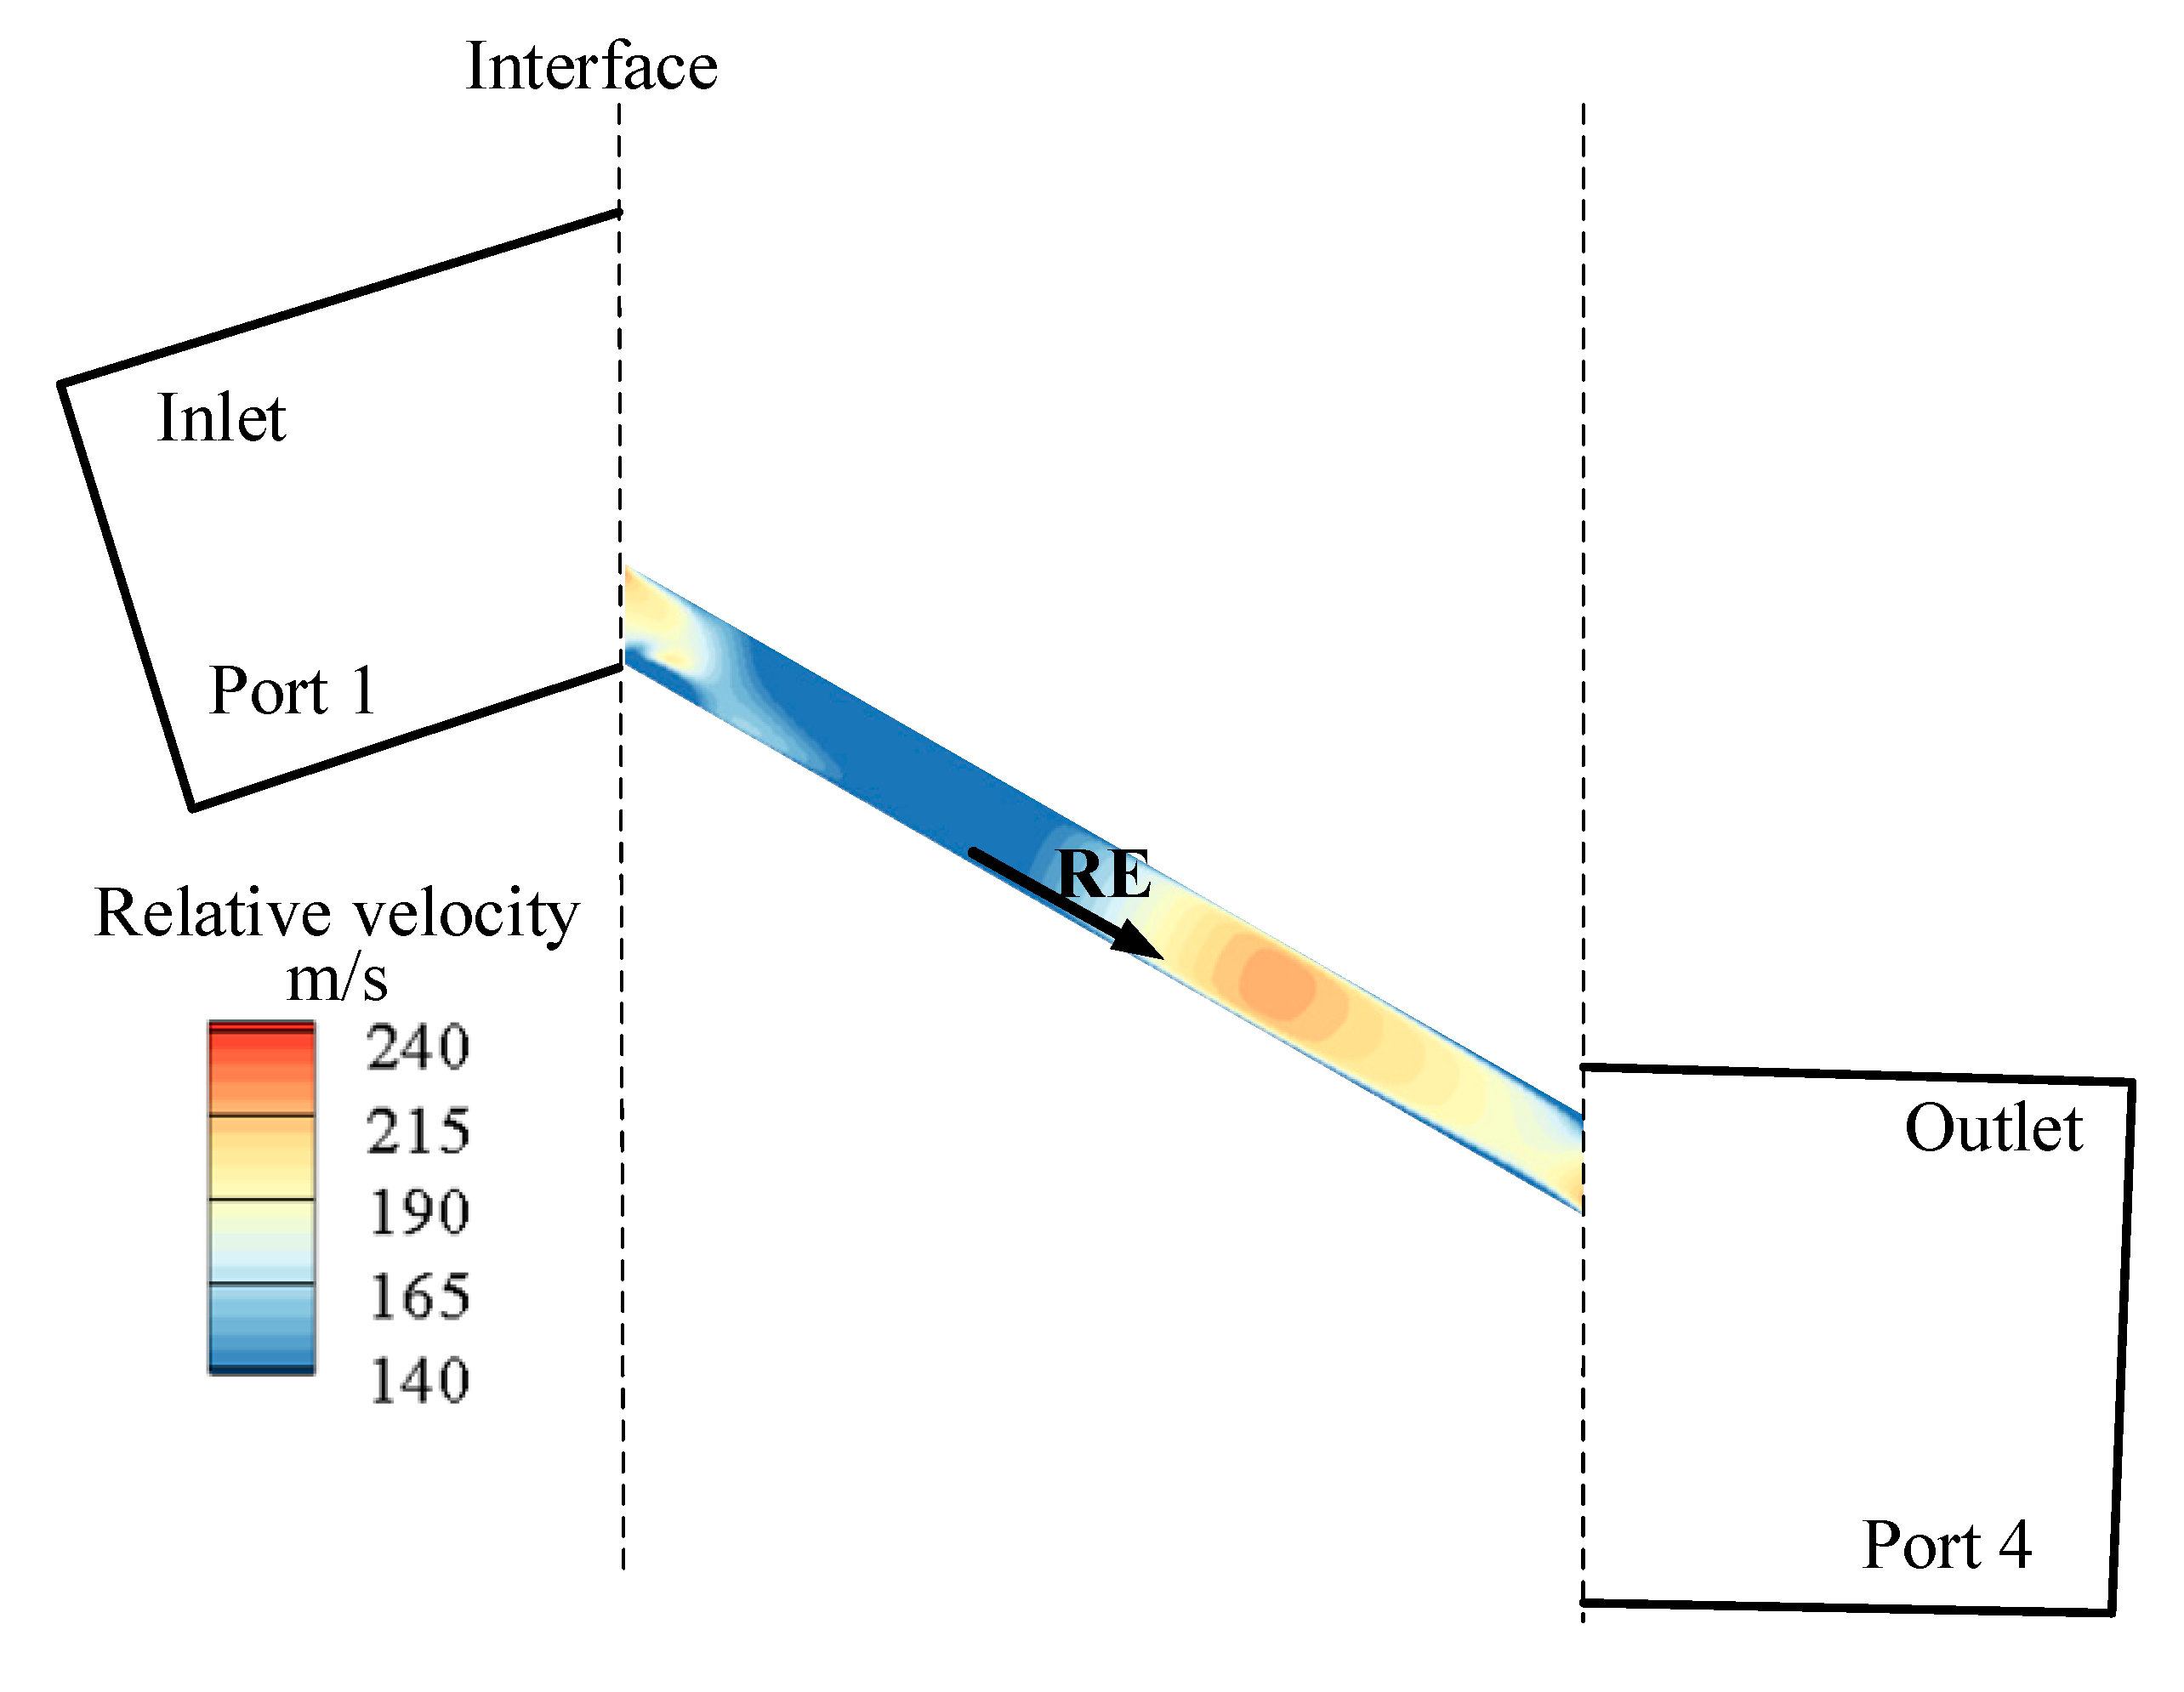
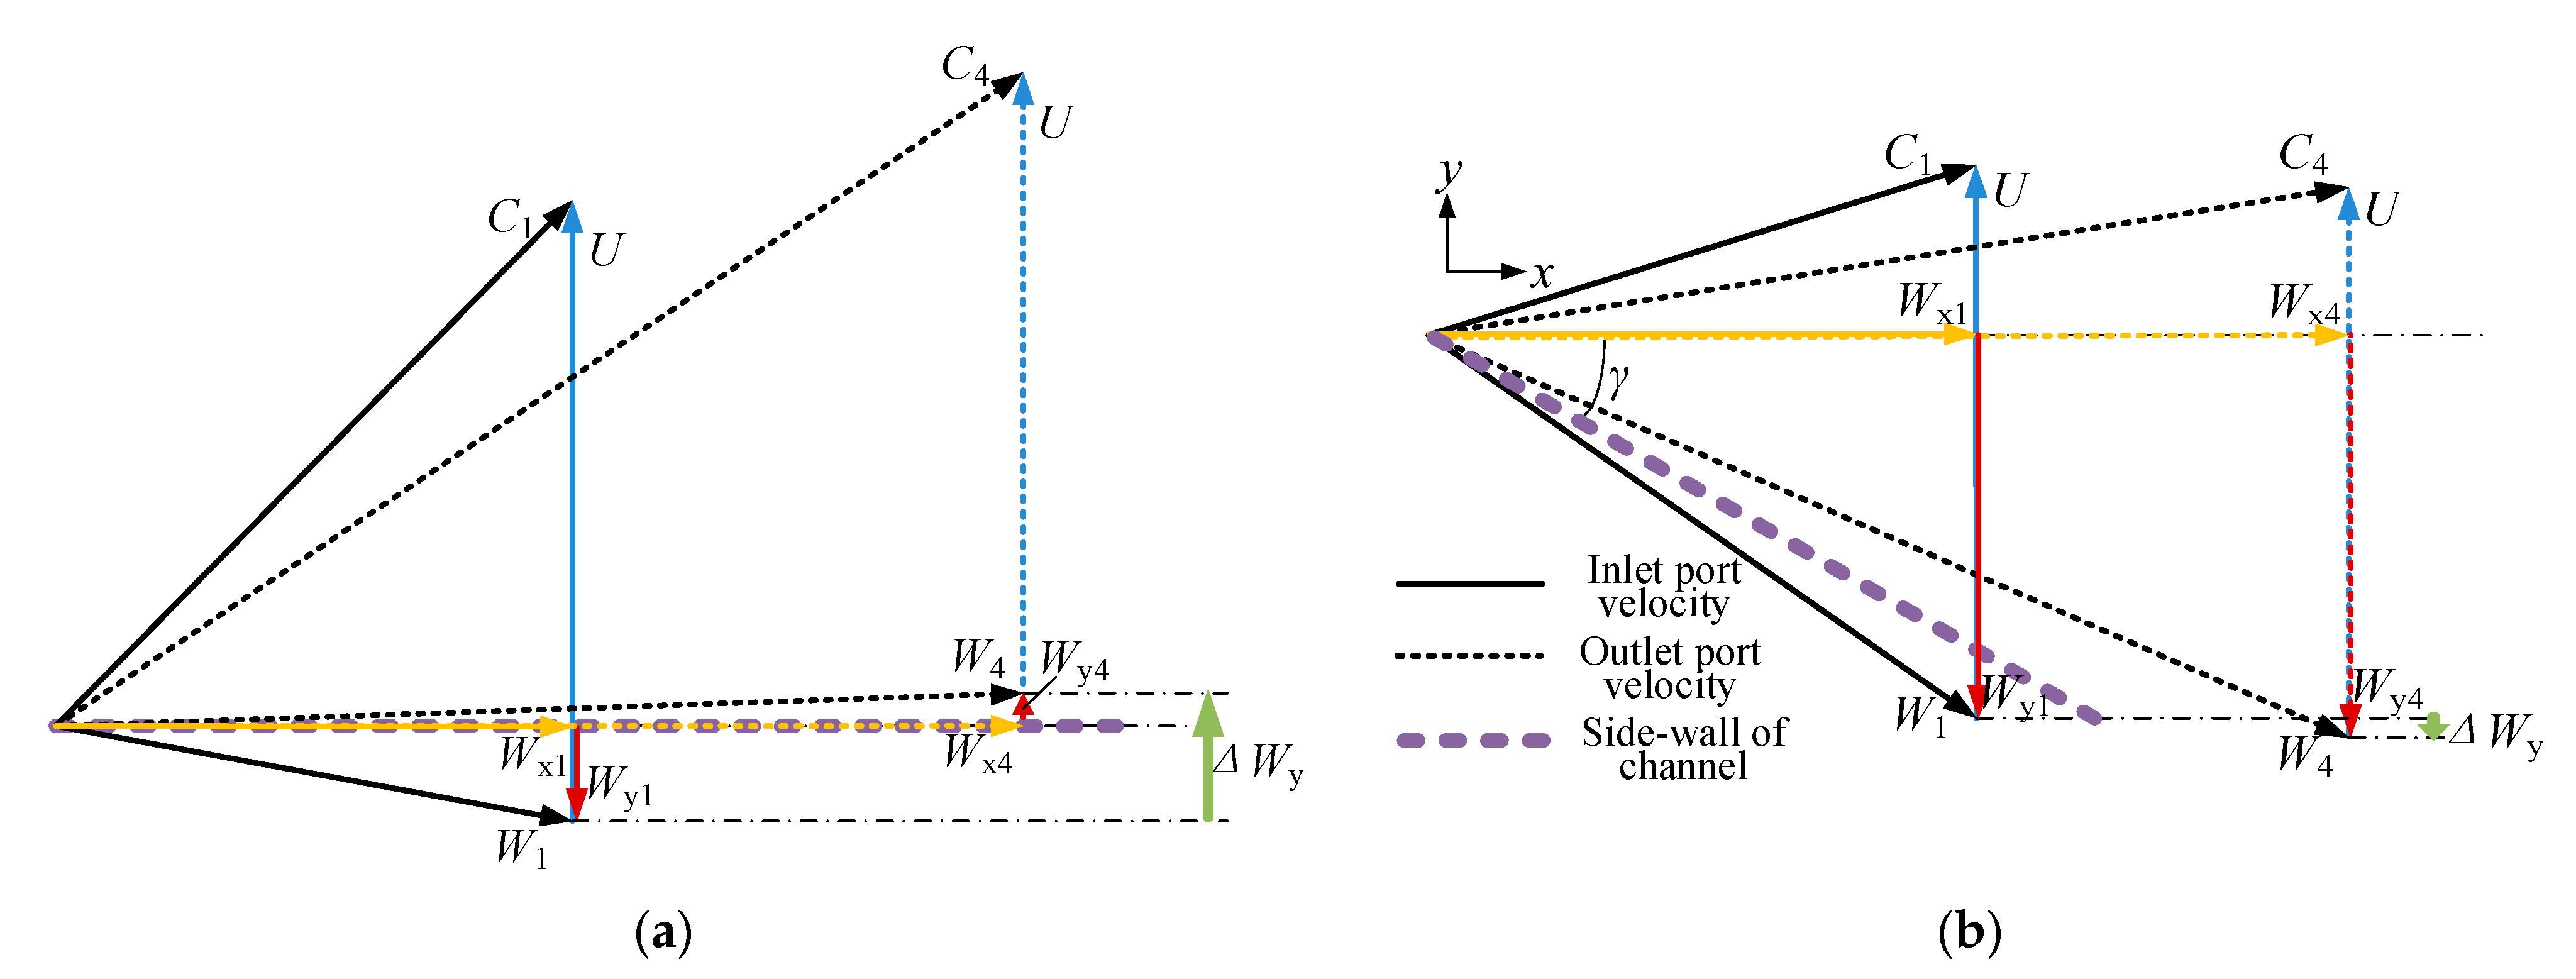
3.3.1. Mechanism of Velocity Triangles with Unsteady Pressure Waves

The results above have demonstrated that the velocity vectors are different between an inlet port and the opposite outlet port. Such difference not only turns the flow directions as discussed above, but also induces shaft power of the rotor. A model of velocity triangles is used to analyze the rim work, which reflects the mechanisms of unsteady pressure waves in the wave rotor.
(1)
Velocity triangles of the high-pressure inlet and outlet ports
The velocity results of a pair of inlet and outlet ports determine a quantified velocity triangle model. For the high-pressure Port 3 and outlet Port 2, we are identifying the phenomena that causes the difference in velocity vectors between the high-pressure ports at first. As the pressure wave system in Figure 8 illustrates, only the left-moving shock wave RS propagates between the inlet Port 3 and the outlet Port 2. In other words, the velocity at the inlet Port 3 is in front of the RS, and the velocity at the outlet Port 2 is behind the RS. Figure 13 shows the distribution of the instantaneous local relative velocity in a channel with the shock wave RS. According to the aerodynamic theory, an unsteady shock wave pushes the flow in its propagation direction. In this flow field, the left-moving RS reduces the local relative velocity behind it, as Figure 13 shows.
According to the data of W and α of each port in Table 4, quantitative velocity triangles of the inlet Port 3 and outlet Port 2 are shown in Figure 14. Figure 14a,b both show that the vector of W2 is shorter than the vector of W3 for different stagger angles. It is because the shock wave RS reduces the velocity as mentioned above. In spite of the significant difference in velocity magnitude at inlet and outlet ports, the difference in velocity directions is relatively small. It is because the wave rotor channel is straight and the flow follows the direction of the channel sidewalls. ΔWy in Figure 14 represents the magnitude of vector difference between the tangential relative velocities at outlet (Wy2) and inlet (Wy3). At γ = 30°, ΔWy is large, because the large difference in velocity magnitudes W2 and W3 has such a large tangential component. The direction of ΔWy is the same with the rim velocity U at γ = 30°, which is treated as positive in this work. In the other case of γ = 0°, because the flows are approximately horizontal in the channel, ΔWy magnitude is close to zero, and its direction makes no sense, as Figure 14a shows. In summary, increased stagger angle (γ = 30°) produces a positive ΔWy through the high-pressure inlet and outlet ports, because the shock wave RS reduces the outlet velocity. This mechanism is like the typical mechanism of velocity triangles in a supersonic compressor stage, except that the shock wave in a wave rotor is unsteady.
(2)
Velocity triangles of the low-pressure inlet and outlet ports
The discussion is similar in the low-pressure ports, except that the unsteady pressure wave between these ports is an expansion wave. As shown in Figure 15, only the right-moving expansion wave RE propagates between the low-pressure inlet Port 1 and outlet Port 4. An unsteady expansion wave pulls the flow back from its propagation direction in the aerodynamic theory. In this flow field, the right-moving expansion wave RE reduces the local relatively velocity behind it, as Figure 15 shows.
Note that the outlet Port 4 is in front of RE, and that the inlet Port 1 is behind it, as Figure 15 shows. In this case, the outlet velocity W4 (in front of RE) is higher than the inlet velocity W1 (behind RE), as the velocity triangles show in Figure 16. Moreover, the directions of W at inlet and outlet ports as γ = 0° and 30° both deviate from the sidewall directions of the corresponding γ. In the case of γ = 0°, the velocity direction deviation induces a positive ΔWy. In the case of γ = 30°, the velocity direction deviation angle is approximately the same with the case of γ = 0°, but the inlet and outlet velocity directions are both turned by about 30°. As the vectors of W1 and W4 shows in Figure 16b, the deviation of velocity directions and the increase in velocity magnitude make a small negative ΔWy in the case of γ = 30°.
The velocity triangles work out the values of ΔWy of the high-pressure and the low-pressure ports for different stagger angles. In general, ΔWy for high-pressure ports increases and ΔWy for low-pressure ports decreases as stagger angles increase as shown in Figure 17. It is critical to the rim work.

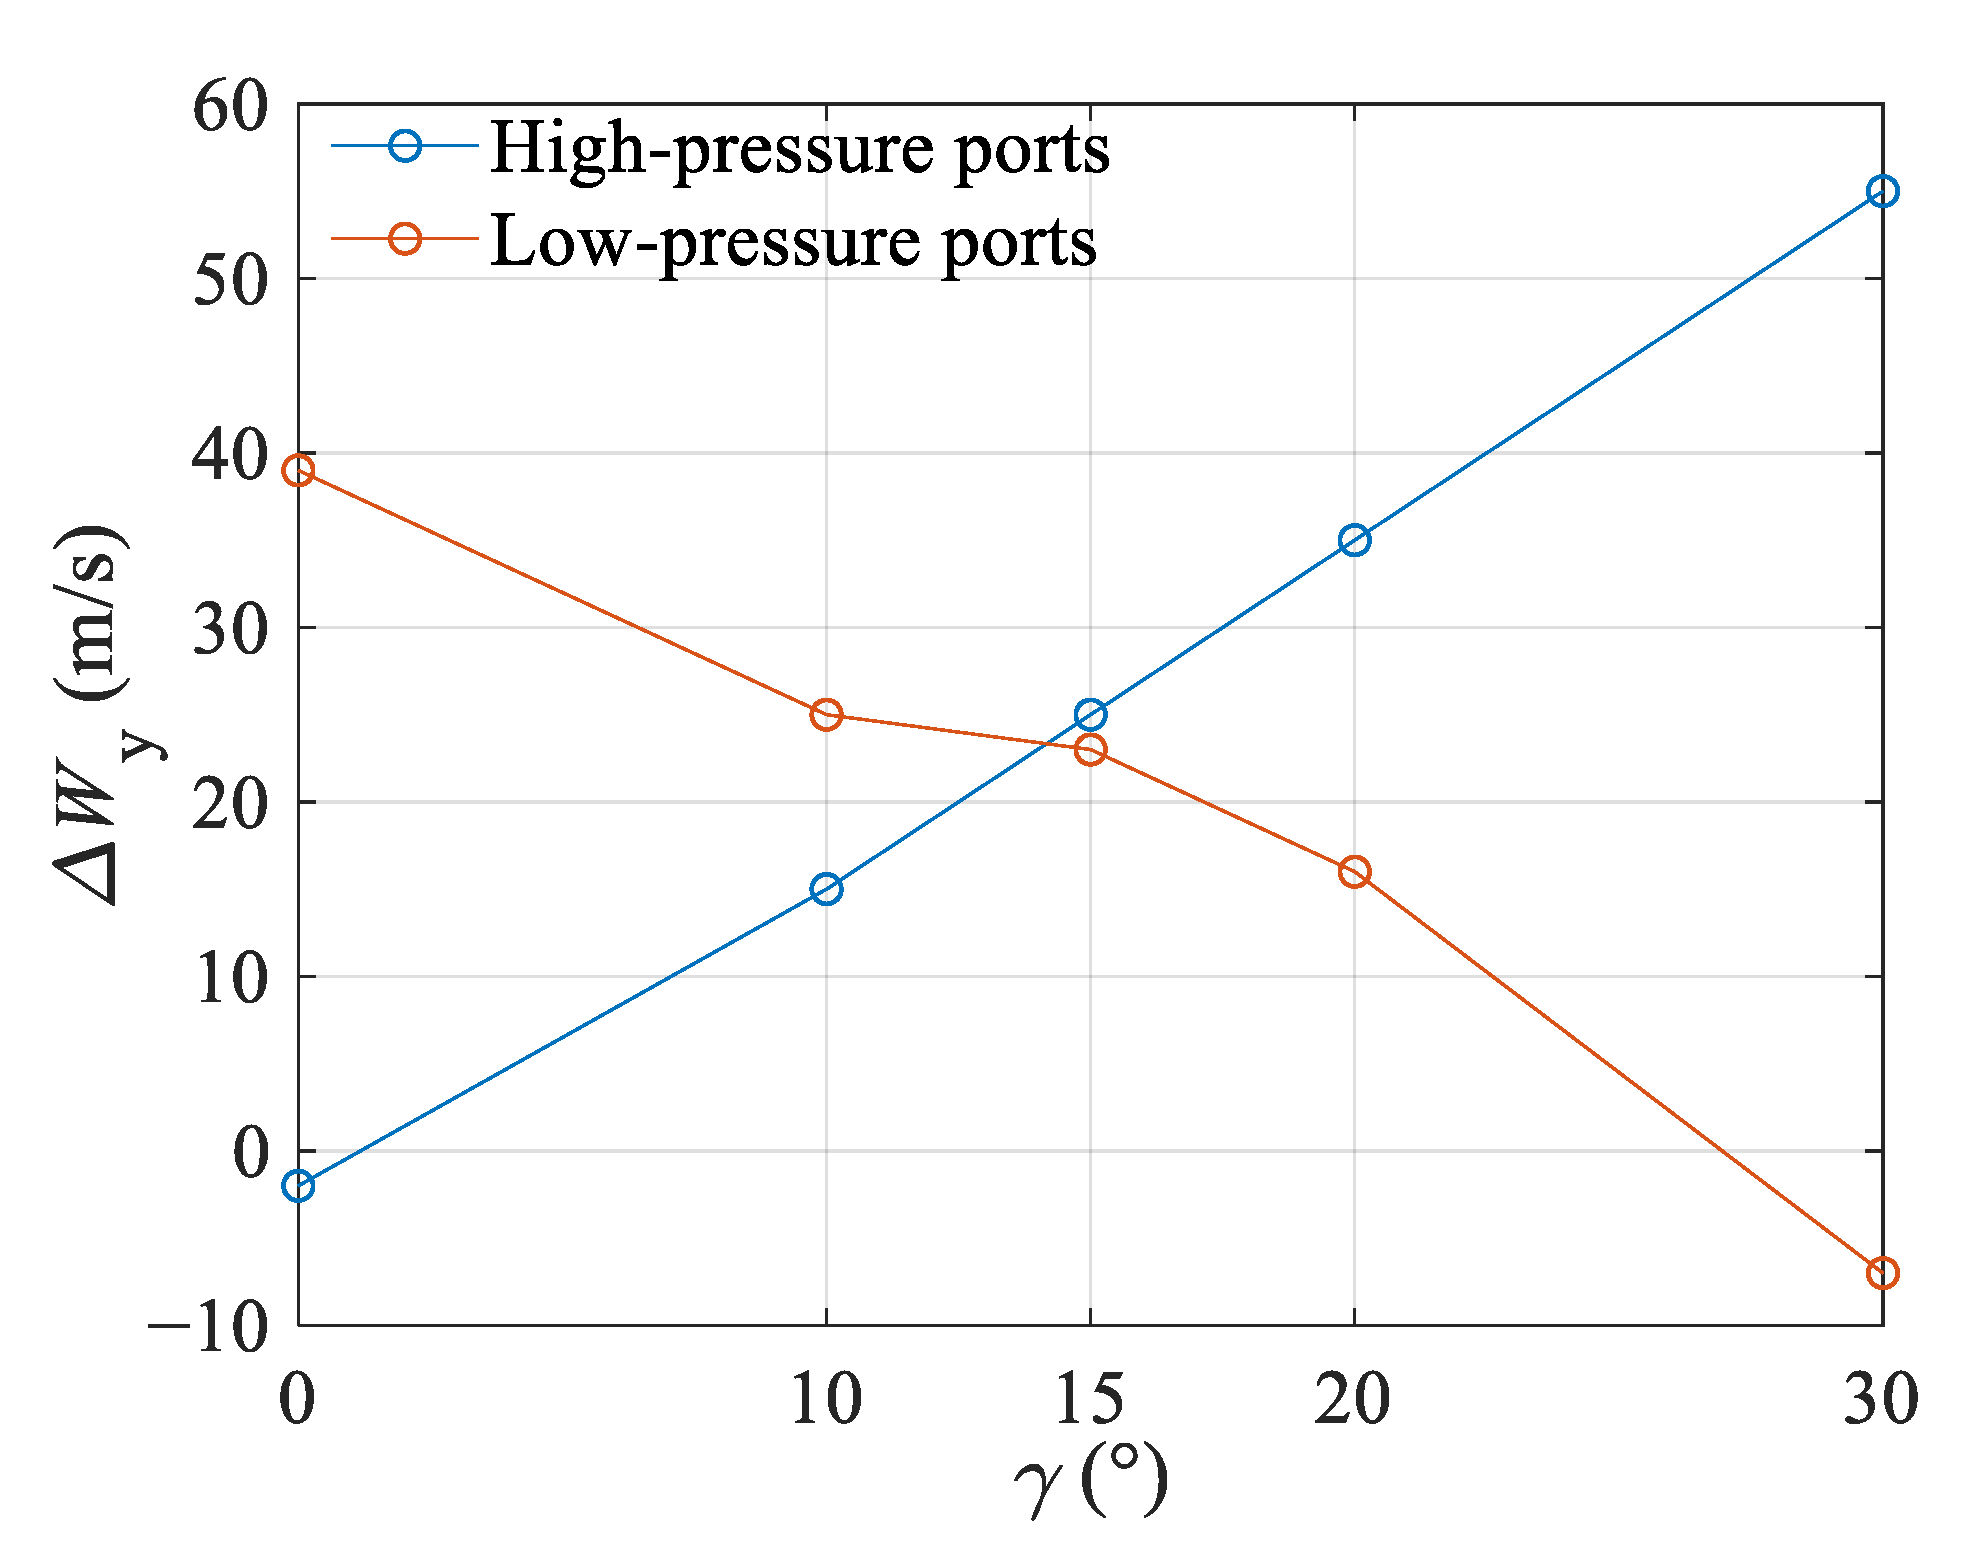
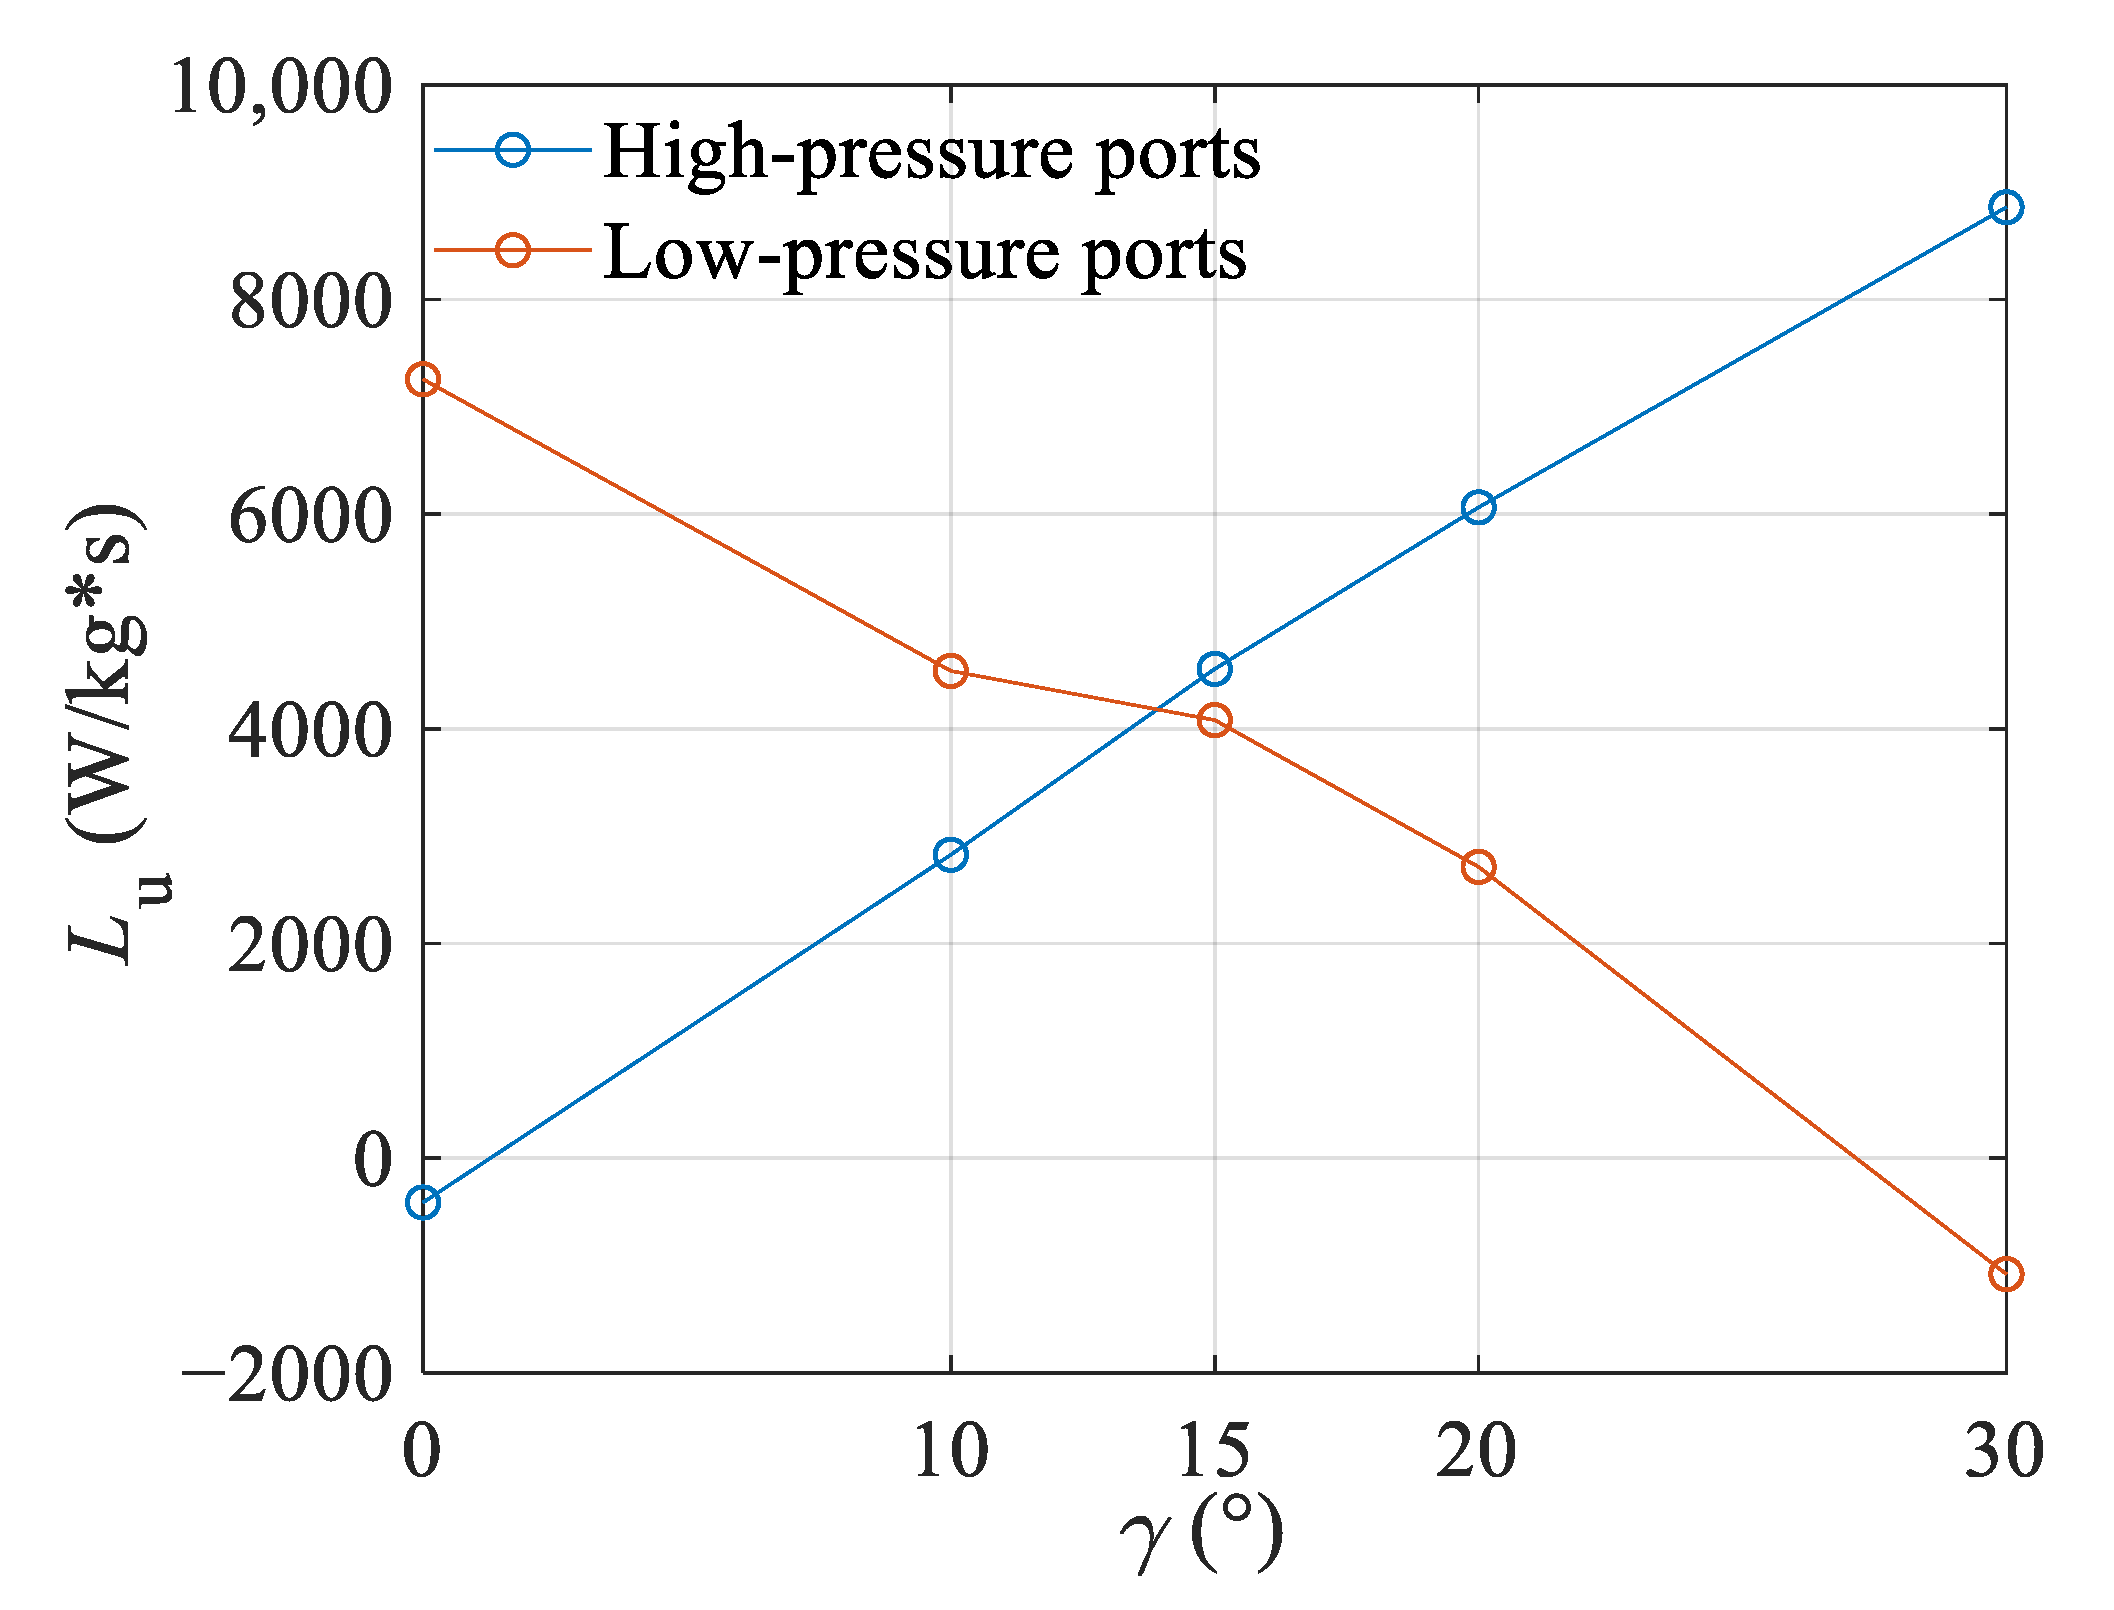
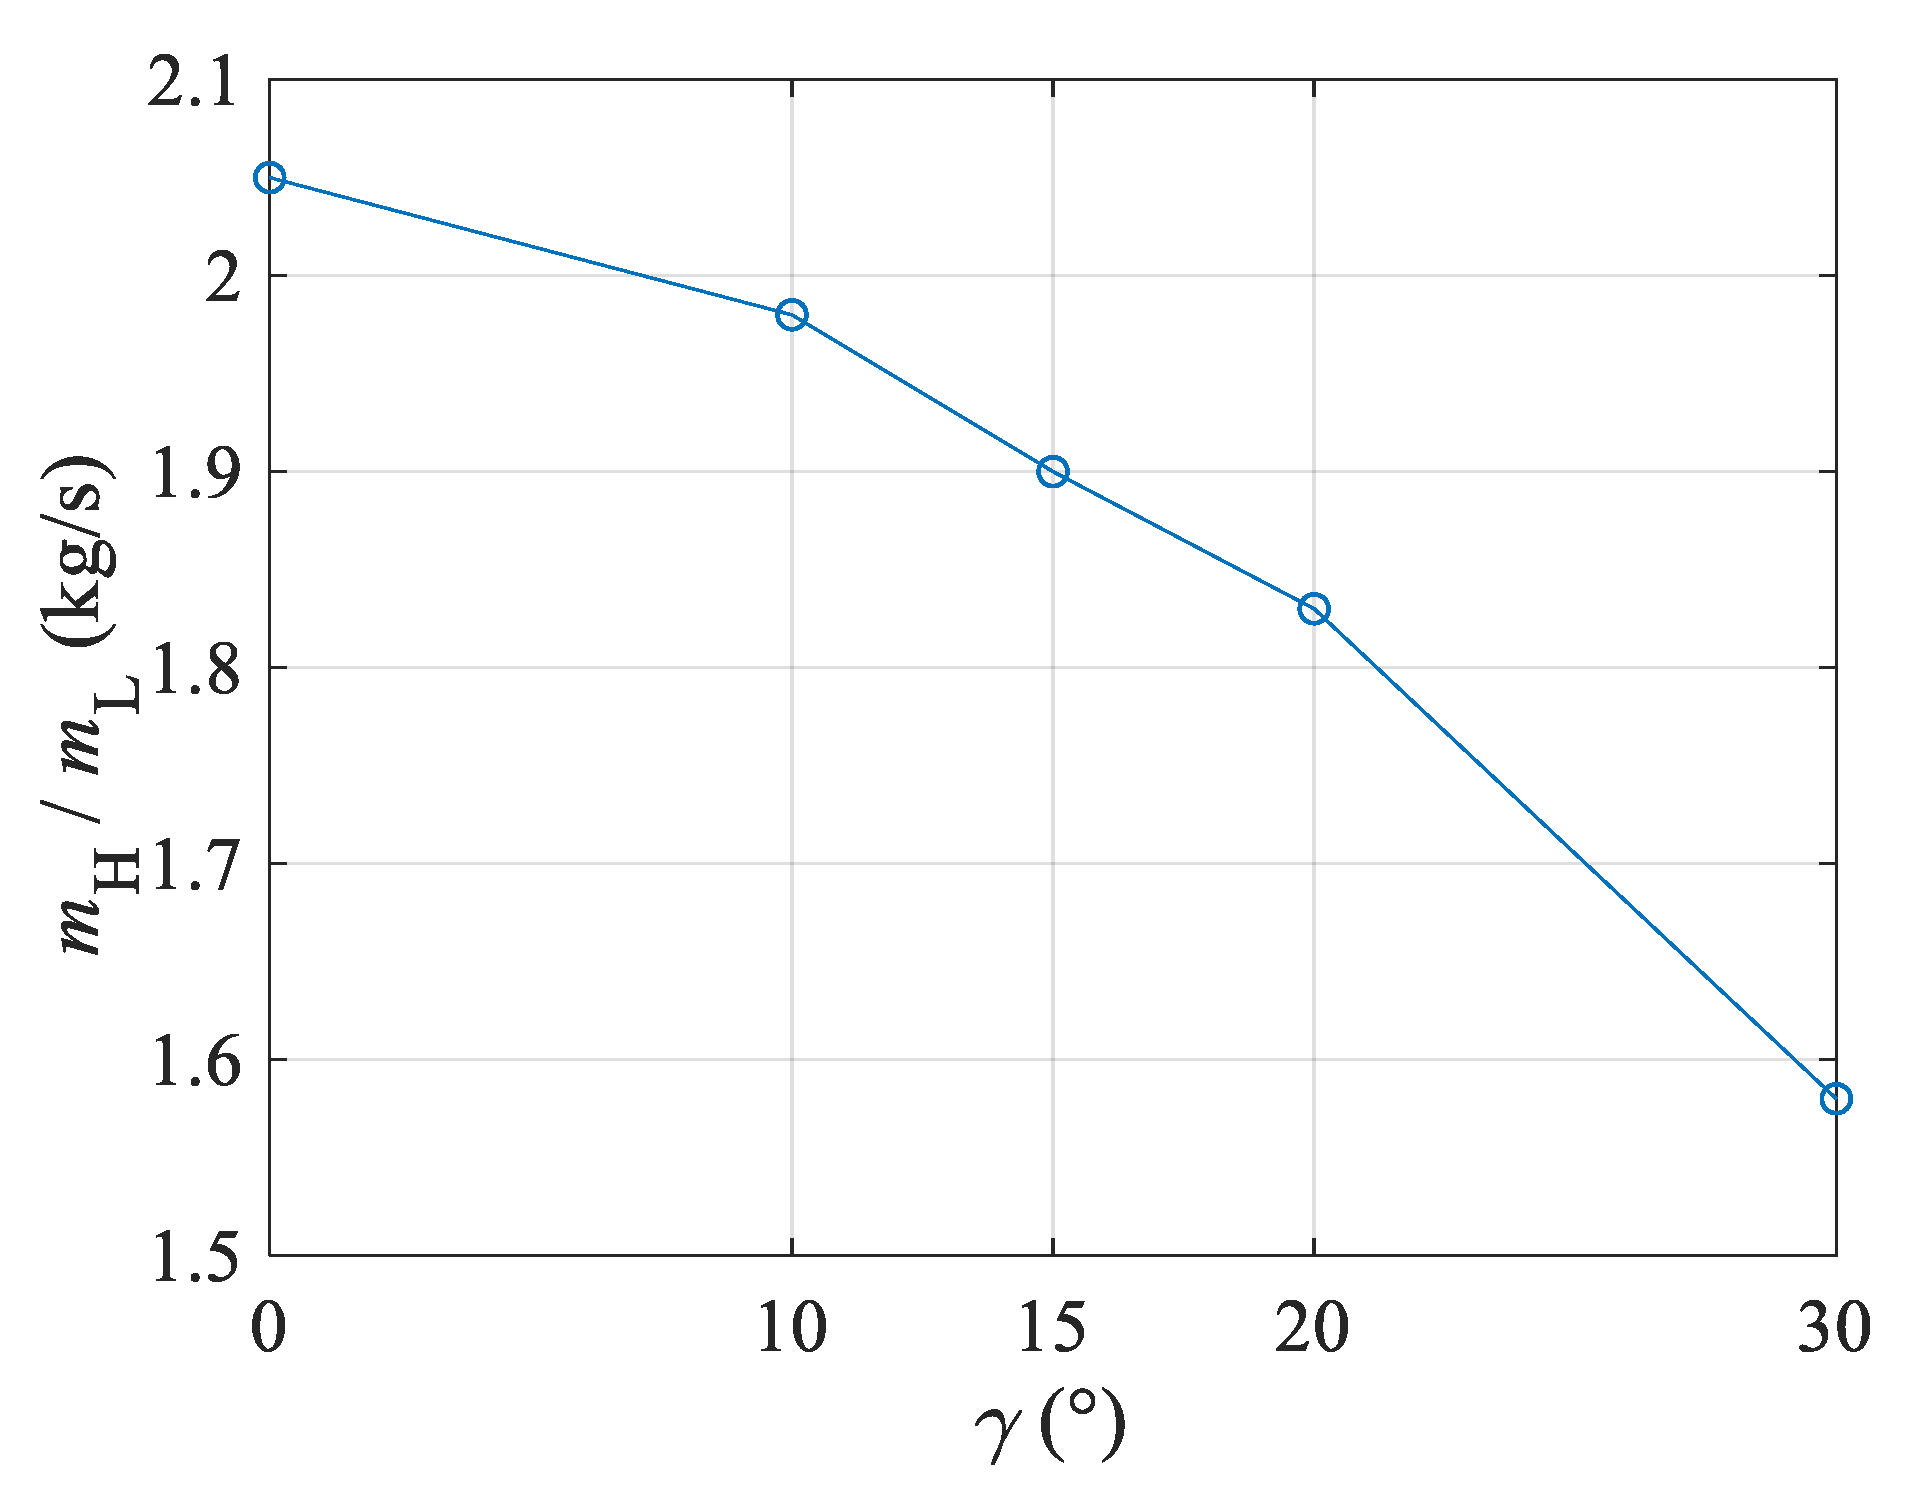
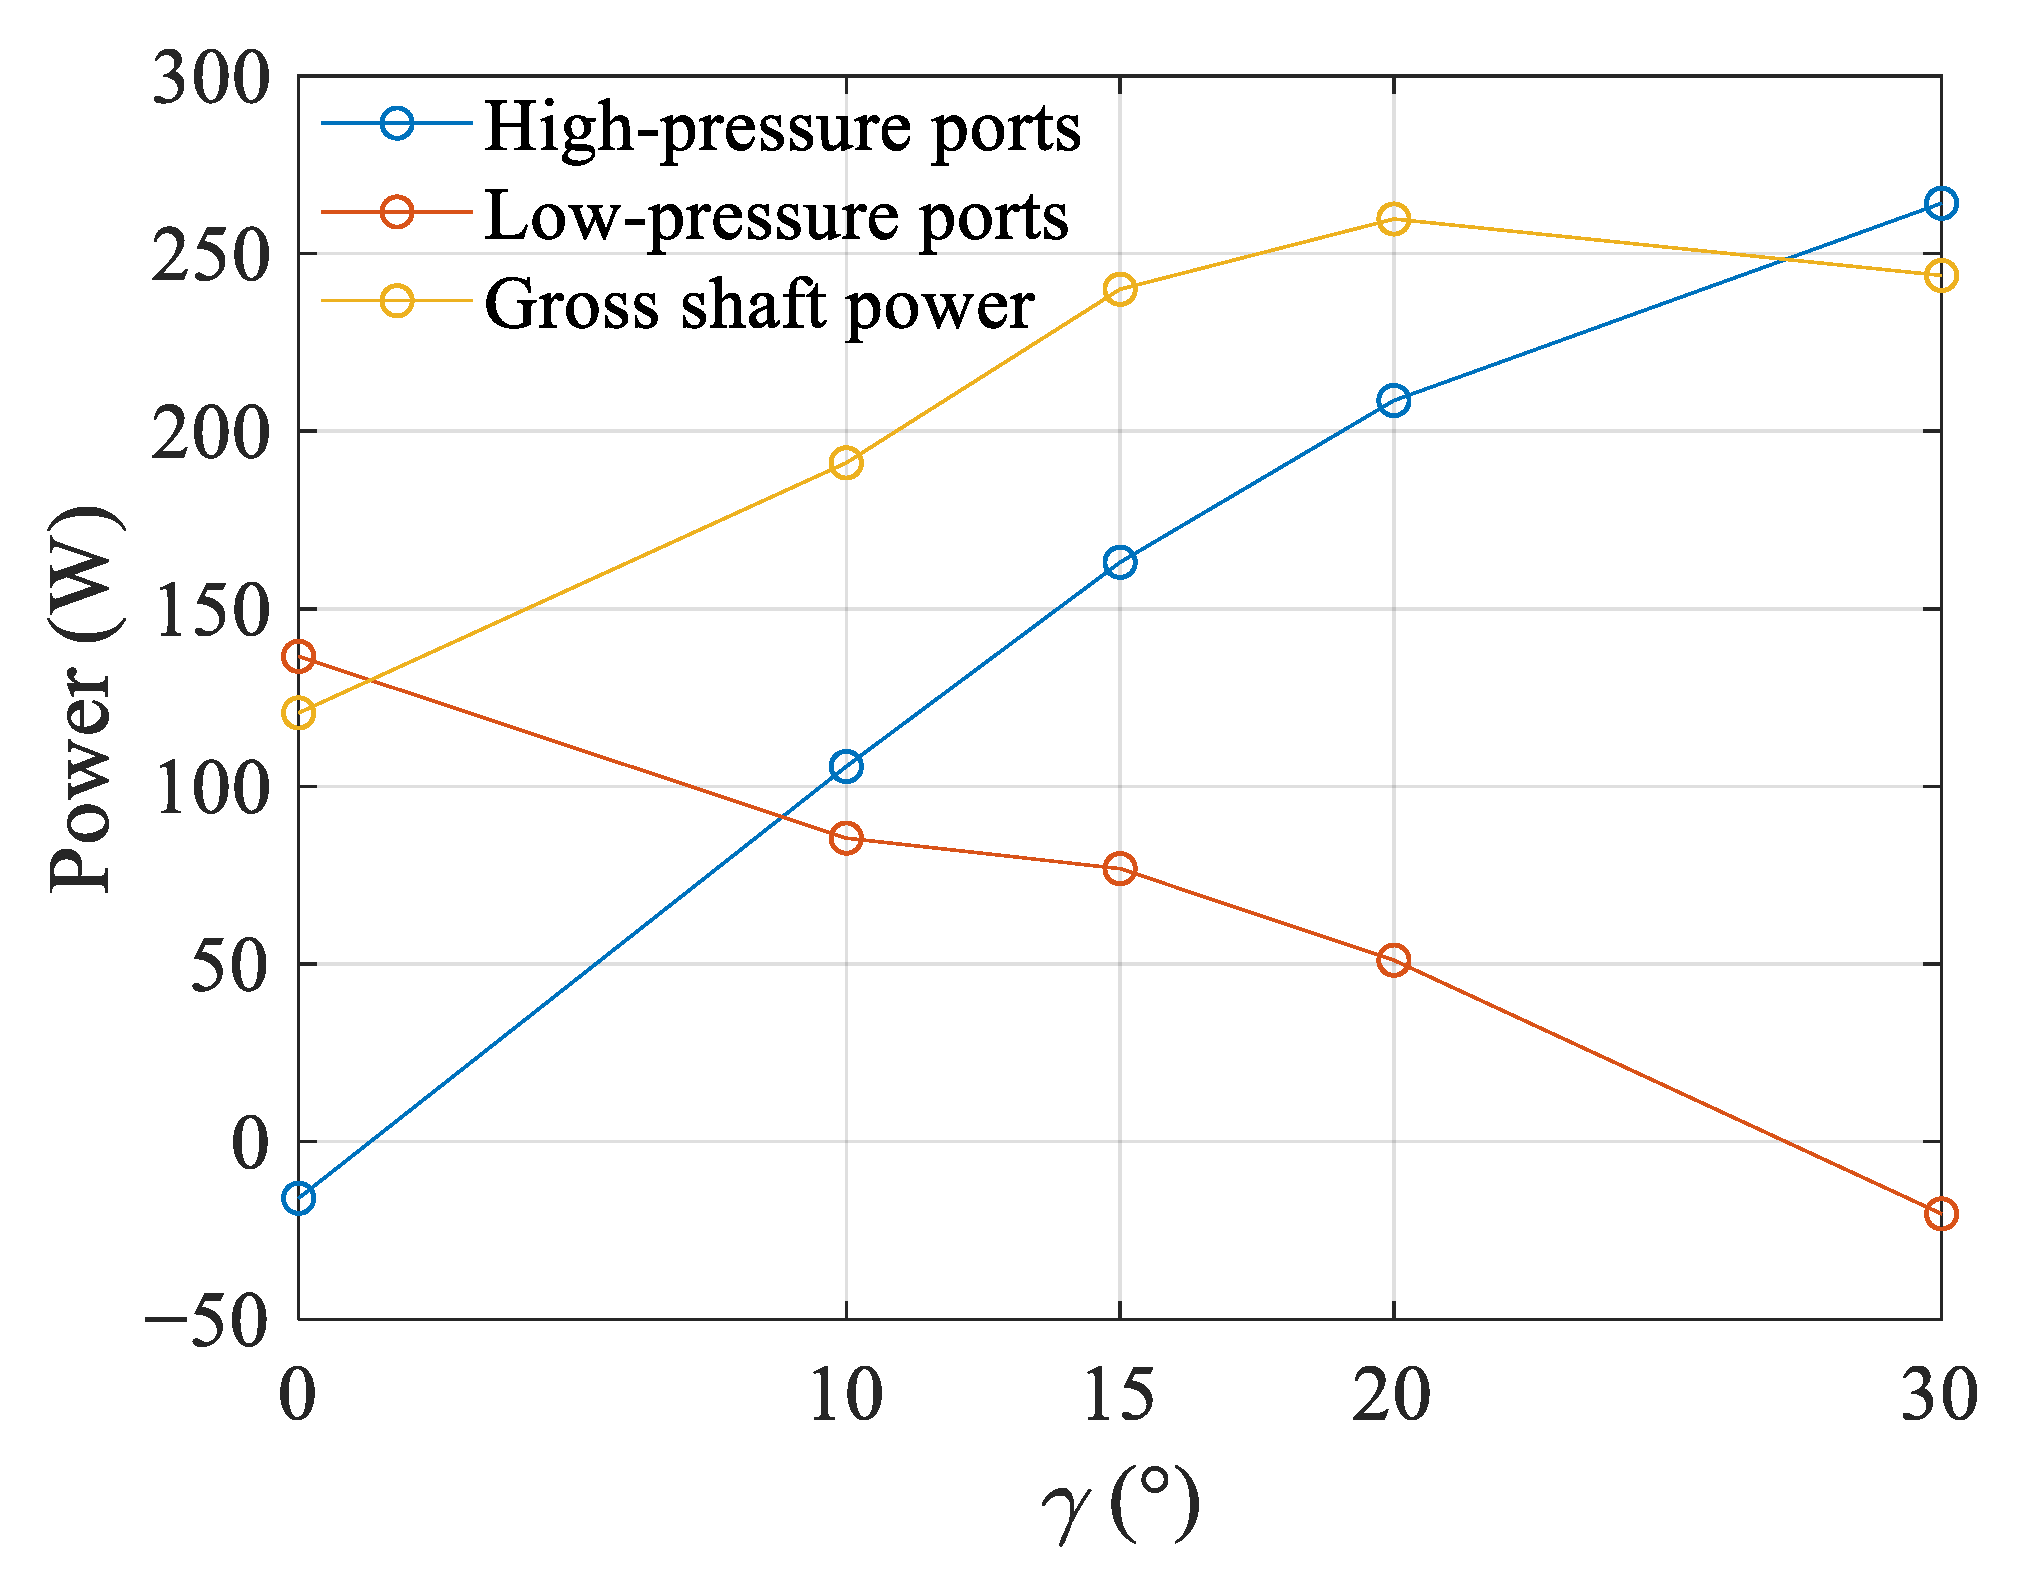
3.3.2. Effect of Stagger Angle on Shaft Power

(1)
Rim work estimation based on velocity triangles
According to the theories of turbomachinery, the equation of rim work Lu is shown below.
L u = U · Δ W y
The trends of Lu for high-pressure ports and low-pressure ports are shown in Figure 18. The variation ranges of the two curves in Figure 18 are close to each other, and the variation trends of them are similar to the trends of ΔWy in Figure 17. It shows that ΔWy dominates the trends of Lu, because the variation range of the other factor U is rather small, according to the data in Table 1. Because of a large ΔWy for low-pressure ports at γ = 0° in Figure 17, Lu for low-pressure ports has a high initial value at γ = 0°. As ΔWy significantly decrease with the increase of γ in Figure 17, Lu for low-pressure ports shows a decreasing trend in Figure 18. On the contrary, since ΔWy for high-pressure ports at γ = 0° is approximately zero, Lu for high-pressure ports is close to zero. With increasing γ, Lu for high-pressure ports increases as ΔWy increases.
(2)
Shaft power estimation
The gross shaft power P of the wave rotor is the summation of the products of the mass flow rate and the rim work of the high-pressure and the low-pressure ports, as the following equation shows:
P = mHLu,H + mLLu,L
In this work, the mass flow rate of the high-pressure ports is much higher than the mass flow rate of the low-pressure ports, as shown by the ratio of mass flow rates in Figure 19.
The mass flow rate data of the two-dimensional CFD results are scaled so that the low-pressure inlet mass flow rate mL is equal to the corresponding data of the wave rotor with cambered channels in the literature [13]. The shaft power as an effect of the stagger angle is shown in Figure 20. Positive shaft power means that the rotor wall does work on the airflow, that is, the wave rotor consumed the shaft power. The maximum gross shaft power is about 260 W in Figure 20. In regard to the wave rotor with cambered channels in the literature [13], it is able to output about 466 W of shaft power. The maximum gross shaft power consumption in this work is smaller and acceptable. As we introduced with Figure 3c, a practical cambered and staggered channel would compensate for the shaft power consumption due to the staggered channels.
The gross shaft power increases in the range where γ = 0–20° and then slightly decrease at γ = 30°. In addition, the results of shaft power of high-pressure and low-pressure ports are also illustrated in Figure 20, and the variation trends at different γ values are similar to the trends of Lu in Figure 18. Since the slope of the power for high-pressure ports is larger than that of the power for low-pressure ports, the increasing trend of power for high-pressure ports dominates the trend of gross shaft power in the range where γ = 0–20°. As γ increases to 30°, the slope of power for low-pressure ports relatively increases, while the slope of power for high-pressure ports and mass flow rate ratio relatively decreases. As a result, the gross shaft power slightly decreases at γ = 30°.
We can summarize the mechanisms by the effect of the stagger angle on the shaft power. For most stagger angle values, the unsteady pressure waves between the high-pressure and low-pressure ports induce positive ΔWy of the velocity triangles. It works out positive rim work, and thus positive shaft power, which means that the wave rotor consumes shaft power. An increase in stagger angle would increase the ΔWy of the high-pressure ports, but decrease the ΔWy of the low-pressure ports. Such trends make the gross shaft power increase when γ < 20° but decrease a little when γ increases to 30°. We can expect the gross shaft power consumption to decrease further if the stagger angle were even larger than 30°, but it would turn the inlet and outlet flow directions too much and deviate from the axial direction. In all, the stagger angle of 30° produces nearly axial inlet and outlet flows with an acceptable compromise of shaft power consumption, which is recommended for comprehensive optimization of staggered channels of wave rotors.
As mentioned above, the mechanism of the staggered channels is consistent with the typical mechanism of a supersonic compressor stage. Such a mechanism is brought about by the velocity variation across a shock wave or an expansion wave, which is also valid in cambered channels of wave rotor. Therefore, the knowledge of the mechanism of the simple staggered channels will help to design a wave rotor with a more complex shape of cambered and staggered channels.

4. Conclusions

In the present work, the effects of different stagger angles of rotor channels of a wave rotor were investigated for the first time, to the authors’ knowledge, in the public domain. The results have improved the understanding of stagger angles in wave rotor optimization. Conclusions are made:
(1)
Geometric modifications on outlet port coordinates, rim velocity, and port inclination angles were made for different stagger angles based on the velocity triangle model. With such modifications, the unsteady pressure wave system in the wave rotor was kept similar to the baseline case (γ = 0°), and the inlet and outlet flow direction fits the inclination of ports with acceptable deviation. It verified such geometric modifications.
(2)
As the stagger angle increased, the pressure ratios of compression and expansion of the wave rotor was basically kept constant for different stagger angles. It means that the wave rotor would keep stable functions of compression and expansion in the optimization on the stagger angle.
(3)
As the stagger angle increased, the inlet and outlet flow of the wave rotor turned towards the axial direction as the adjacent compressor, combustor, or turbine would require. It was beneficial to compact and light-weight integration of the wave rotor to a gas turbine.
(4)
As the stagger angle increased, the rotor consumed relatively more shaft power in this work. It was a compromise of staggered channels of wave rotors, but the shaft power amount was low and acceptable at any stagger angle.
(5)
A recommendation of stagger angle optimization is the stagger angle of 30°. It produces nearly axial inlet and outlet flows with an acceptable compromise of shaft power consumption. A geometry of cambered and staggered channels would compensate for the shaft power consumption in future work.
(6)
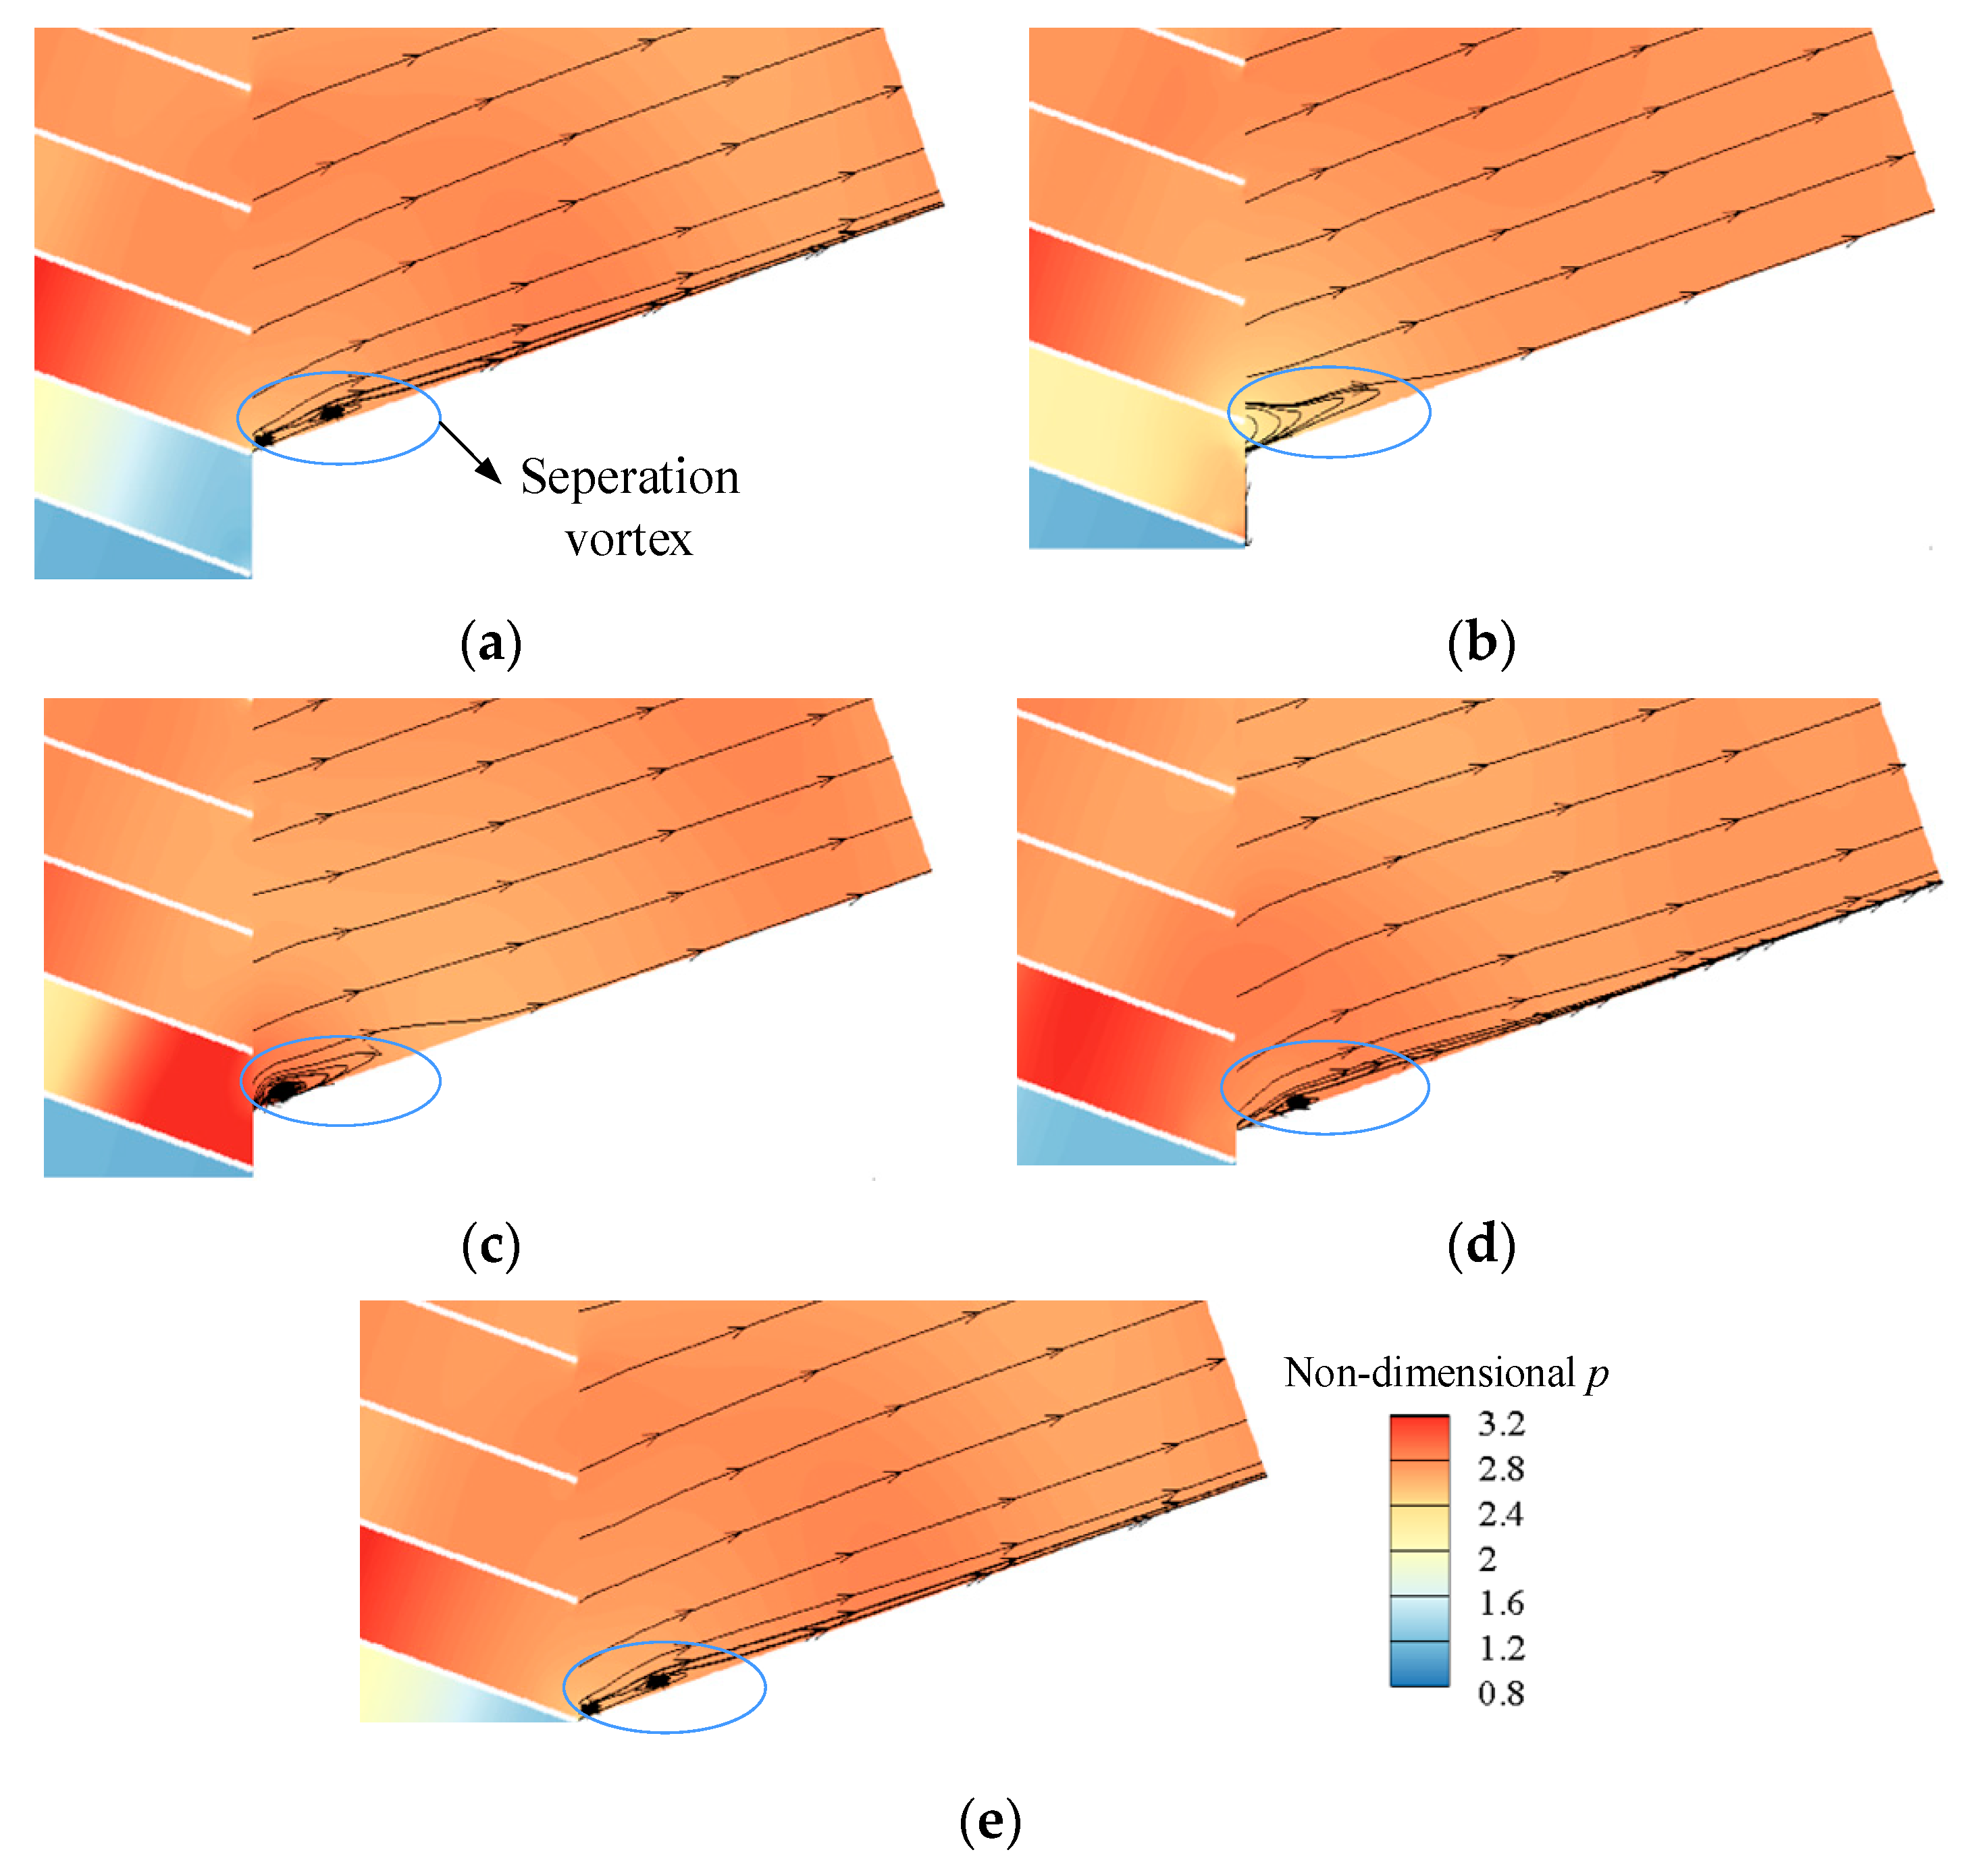
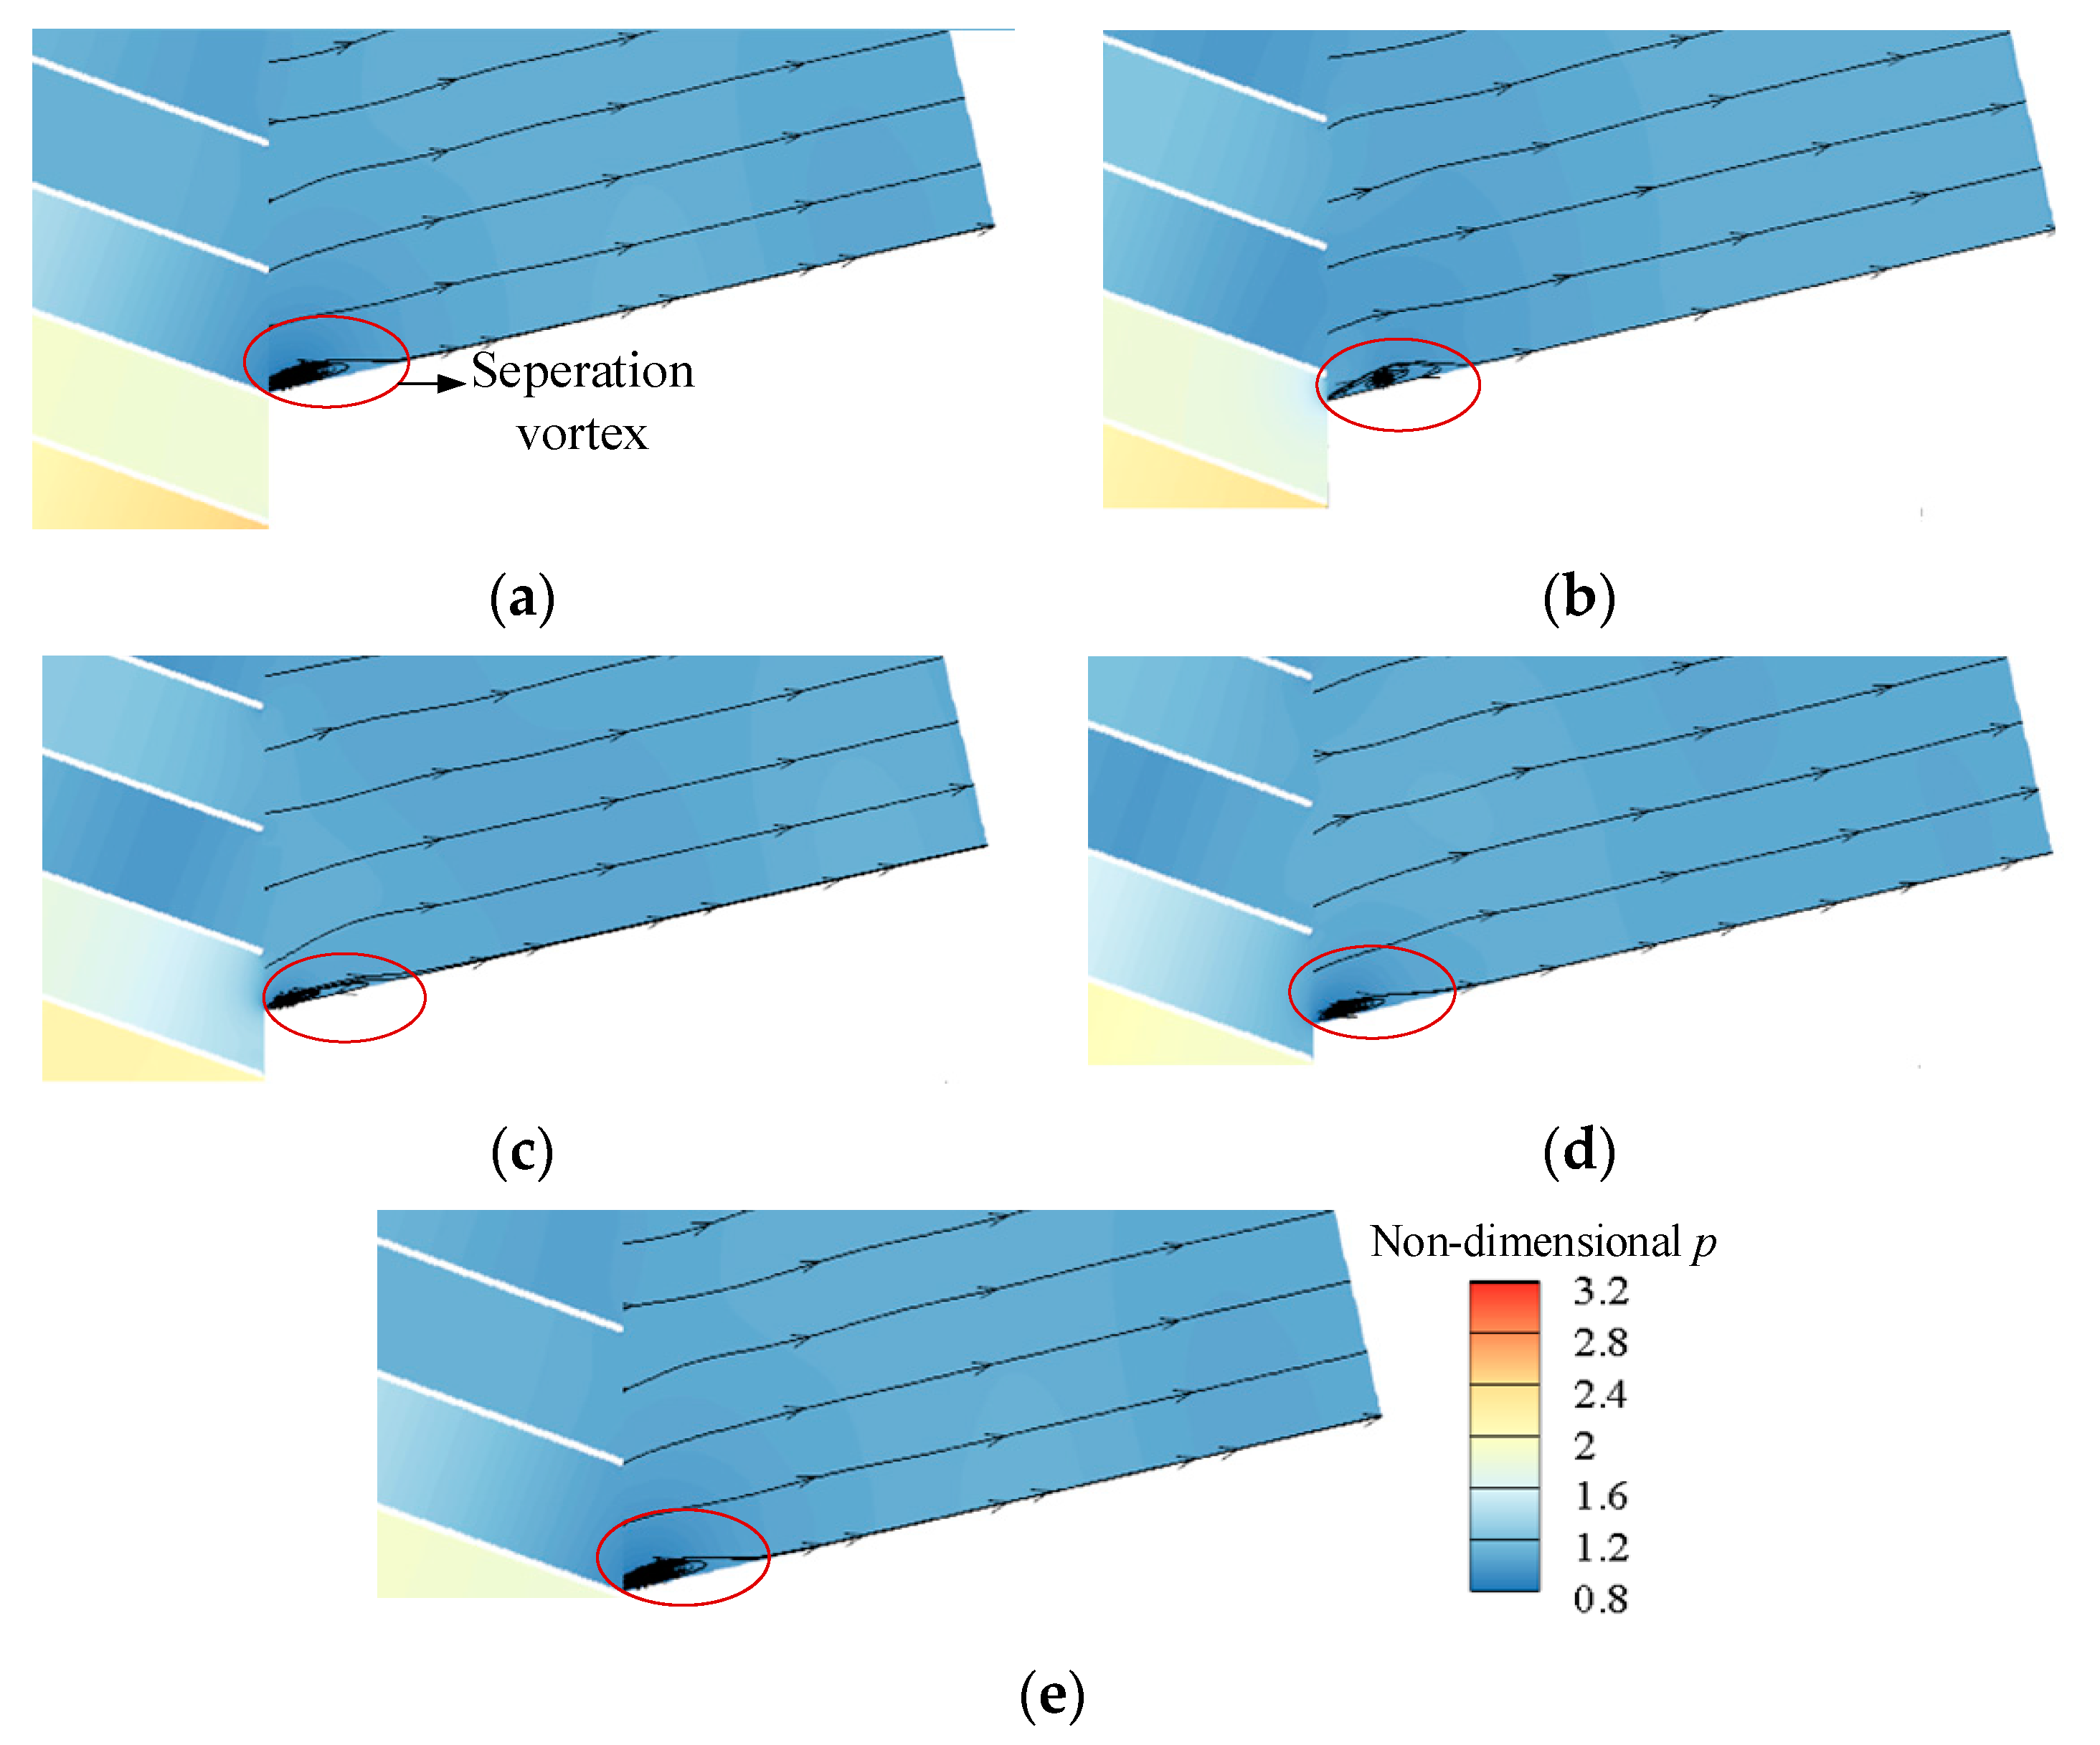
A critical mechanism in this work was the rim work mechanism of straight and staggered channels of the wave rotor. The unsteady pressure wave between an inlet port and the opposite outlet port induced variation in flow velocity. A staggered channel makes the tangential component of the velocity variation produce some rim work. Such a mechanism was like the typical mechanism of rim work in a supersonic compressor stage.

Author Contributions

Conceptualization, S.C.; methodology, H.L.; software, Y.C.; validation, S.C. and F.X.; formal analysis, Y.C.; investigation, Y.C.; resources, S.C.; data curation, S.C. and Y.C.; writing—original draft preparation, S.C. and Y.C.; writing—review and editing, S.C. and F.X.; visualization, Y.C.; supervision, H.L.; project administration, S.C. and F.X.; funding acquisition, S.C. and F.X. All authors have read and agreed to the published version of the manuscript.

Funding

This research was co-funded by the National Natural Science Foundation of China, grant numbers 51906007 and 12072303, and Ningbo Key Technology Research and Development Programme, grant number 2021Z035.

Institutional Review Board Statement

Not applicable.

Informed Consent Statement

Not applicable.

Data Availability Statement

Not applicable.

Acknowledgments

Authors wish to acknowledge the support of Aero Engine Academy of China.

Conflicts of Interest

The authors declare no conflict of interest.

Nomenclature and Abbreviations

NomenclatureGreek Letters
Cabsolute velocity (unit: m/s)αabsolute velocity angle (unit: degree)
CFDComputational fluid dynamicsβrelative velocity angle (unit: degree)
LuRim work (unit: W/kg·s)γstagger angle (unit: degree)
mmass flow rate (unit: kg/s)θinclination angel (unit: degree)
ppressure (unit: Pa)Δvariation
Pshaft power (unit: W)τchannel passing period
ttime (unit: s)Πcompression pressure ratio
Uimplicated velocity (unit: m/s)εexpansion pressure ratio
Wrelative velocity (unit: m/s)
xaxial coordinate (unit: m)
ytangential coordinate (unit: m)
Subscripts
1Port 1
2Port 2
3Port 3
4Port 4
ininlet
outoutlet
HHigh-pressure ports
LLow-pressure ports

References

  1. Akbari, P.; Nalim, R.; Mueller, N. A Review of Wave Rotor Technology and Its Applications. J. Eng. Gas Turbines Power 2006, 128, 717–735. [Google Scholar] [CrossRef] [Green Version]
  2. Pring, P.; Onder, C.H.; Guzzella, L. EGR Control of Pressure-wave Supercharged IC Engines. Control Eng. Pract. 2007, 15, 1520–1532. [Google Scholar] [CrossRef]
  3. Kharazi, A.A.; Akbari, P.; Mueller, N. Preliminary Study of a Novel R718 Compression Refrigeration Cycle Using a Three-port Condensing Wave Rotor. J. Eng. Gas Turbines Power 2005, 127, 539–544. [Google Scholar] [CrossRef]
  4. Hu, D.; Yu, Y.; Liu, P. Enhancement of Refrigeration Performance by Energy Transfer of Shock Wave. Appl. Therm. Eng. 2018, 130, 309–318. [Google Scholar] [CrossRef]
  5. Akbari, P.; Nalim, R.; Mueller, N. Performance Enhancement of Microturbine Engines Topped with Wave Rotors. J. Eng. Gas Turbines Power 2006, 128, 190–202. [Google Scholar] [CrossRef] [Green Version]
  6. Berchtold, M.; Mayer, A. Supercharging with Comprex: Application and Experience. In Proceedings of the ONR/NAVAIR Wave Rotor Research and Technology Workshop, Naval Postgraduate School, Monterey, CA, USA, 1 January–31 March 1985. [Google Scholar]
  7. Zsiga, N.; Skopil, M.A.; Wang, M.; Klein, D.; Soltic, P. Comparison of Turbocharging and Pressure Wave Supercharging of a Natural Gas Engine for Light Commercial Trucks and Vans. Energies 2021, 14, 5306. [Google Scholar] [CrossRef]
  8. Pearson, R.D. A Gas Wave-Turbine Engine Which Developed 35 HP and Performed Over a 6: 1 Speed Range. In Proceedings of the ONR/NAVAIR Wave Rotor Research and Technology Workshop, Naval Postgraduate School, Monterey, CA, USA, 1 January–31 March 1985; pp. 125–170. [Google Scholar]
  9. Mathur, A. Design and Experimental Verification of Wave Rotor Cycles. In Proceedings of the ONR/NAVAIR Wave Rotor Research and Technology Workshop, Naval Postgraduate School, Monterey, CA, USA, 1 January–31 March 1985; pp. 215–228. [Google Scholar]
  10. Jagannath, R.R.; Bane, S.P.; Razi Nalim, M. Numerical Modeling of a Wave Turbine and Estimation of Shaft Work. J. Fluid Eng. 2018, 140, 101106. [Google Scholar] [CrossRef] [Green Version]
  11. Tüchler, S.; Copeland, C.D. Experimental Results from the Bath μ-wave Rotor Turbine Performance Tests. Energ. Convers. Manage. 2018, 189, 33–48. [Google Scholar] [CrossRef]
  12. Tüchler, S.; Copeland, C.D. Validation of a Numerical Quasi-One-Dimensional Model for Wave Rotor Turbines with Curved Channels. J. Eng. Gas Turbines Power 2020, 142, 021017-1–021017-15. [Google Scholar] [CrossRef]
  13. Tüchler, S.; Copeland, C.D. Experimental and Numerical Assessment of an Optimised, Non-axial Wave Rotor Turbine. Appl. Energy 2020, 268, 115013. [Google Scholar] [CrossRef]
  14. Tüchler, S.; Copeland, C.D. Numerical Optimisation of a Micro-wave Rotor Turbine Using a Quasi-two-dimensional CFD Model and a Hybrid Algorithm. Shock Waves 2021, 31, 271–300. [Google Scholar] [CrossRef]
  15. Liu, P.; Feng, M.; Liu, X.; Wang, H.; Hu, D. Performance Analysis of Wave Rotor Based on Response Surface Optimization Method. J. Energy Resour. Technol. 2022, 144, 061302. [Google Scholar] [CrossRef]
  16. Akbari, P.; Tait, C.J.; Brady, G.M.; Polanka, M.D.; Sell, B. Enhancement of the Radial Wave Engine. In Proceedings of the AIAA Propulsion and Energy 2019 Forum, Indianapolis, IN, USA, 19–22 August 2019. [Google Scholar] [CrossRef]
  17. Eidelman, S. Gradual Opening of Skewed Passages in Wave Rotors. J. Propul. Power 1986, 2, 379–381. [Google Scholar] [CrossRef]
  18. Welch, G.; Paxson, D. Wave turbine analysis tool development. In Proceedings of the 34th AIAA/ASME/SAE/ASEE Joint Propulsion Conference and Exhibit, Cleveland, OH, USA, 12–15 July 1998. [Google Scholar] [CrossRef]
  19. Chan, S.; Liu, H. Mass-based Design and Optimization of Wave Rotors for Gas Turbine Engine Enhancement. Shock Waves 2017, 27, 313–324. [Google Scholar] [CrossRef]
  20. Chan, S.; Liu, H.; Xing, F.; Song, H. Wave Rotor Design Method with Three Steps Including Experimental Validation. J. Eng. Gas Turbines Power 2018, 140, 111201–111213. [Google Scholar] [CrossRef]
  21. Hu, D.; Li, Y.; Liu, P.; Yu, Y.; Liu, F. Numerical Study on the Effect of Nozzle Incident Angle on the Overall Performance of Gas Wave Refrigerator. Int. J. Refrig. 2022, 138, 61–70. [Google Scholar] [CrossRef]
  22. Chan, S.; Liu, H.; Song, H.; Li, F.; Jiang, C.; Gao, Z. Investigation of Pressure Wave Behaviors in the Rotational Speed Effects on a Pressure-exchange Wave Rotor. Chin. J. Aeronaut. 2022, 35, 247–259. [Google Scholar] [CrossRef]
Figure 1. Schematic geometry of a wave rotor.
Energies 15 09455 g001
Figure 2. Schematic of the flow field of a wave rotor. (a) Original three-dimensional; (b) Unwrapped two-dimensional.
Energies 15 09455 g002
Figure 3. Schematics of adaptions of wave rotor channel geometry. (a) Cambered; (b) Staggered; (c) Cambered and staggered.
Energies 15 09455 g003
Figure 4. Geometry models of a pair of inlet and outlet ports with y-coordinate offset. (a) Baseline (γ = 0°); (b) Staggered (γ > 0°).
Energies 15 09455 g004
Figure 5. Velocity triangles of a pair of inlet and outlet ports.
Energies 15 09455 g005
Figure 6. Schematic diagram of grid construction (computational solution and grid refinement in the clearance) at γ = 30°.
Energies 15 09455 g006
Figure 7. The results of CFD and experiment of ports. (a) Port 1; (b) Port 2; (c) Port 3; (d) Port 4.
Energies 15 09455 g007
Figure 8. Distribution of pressure fields, pressure wave system and streamlines at each port with γ. Pressure wave system including the main expansion wave ME, reflected expansion wave RE, hammer shock wave HS, main shock wave MS, reflected shock wave RS, and ending expansion wave EE. (a) γ = 0°; (b) γ = 10°; (c) γ = 15°; (d) γ = 20°; (e) γ = 30°.
Energies 15 09455 g008
Figure 9. Variation of spatial-averaged relative velocity and absolute velocity angle of each port at γ = 20°. (a) Relative velocity in axial direction Wx; (b) Relative velocity in tangential direction Wy; (c) Absolute velocity angle α.
Energies 15 09455 g009
Figure 10. Oscillation amplitude Δα and deviation between α and θ as functions of γ. (a) Oscillation amplitude Δα; (b) Deviation between α and θ.
Energies 15 09455 g010
Figure 11. Variation of the separation vortex at Port 2 in a period at γ = 20°. (a) t = 0; (b) t = 1/4τ; (c) t = 1/2τ; (d) t = 3/4τ; (e) t =τ.
Energies 15 09455 g011
Figure 12. Variation of the separation vortex at Port 4 in a period at γ = 20°. (a) t = 0; (b) t = 1/4τ; (c) t = 1/2τ; (d) t = 3/4τ; (e) t =τ.
Energies 15 09455 g012
Figure 13. Instantaneous relative velocity distribution in a channel between the high-pressure inlet and outlet ports.
Energies 15 09455 g013
Figure 14. Velocity triangles of high-pressure inlet Port 3 and outlet Port 2 for different stagger angles. (a) γ = 0°; (b) γ = 30°.
Energies 15 09455 g014
Figure 15. Instantaneous relative velocity distribution in a channel between the low-pressure inlet and outlet ports.
Energies 15 09455 g015
Figure 16. Velocity triangles of low-pressure inlet Port 1 and outlet Port 4 for different stagger angles. (a) γ = 0°; (b) γ = 30°.
Energies 15 09455 g016
Figure 17. Variation of ΔWy at different γ.
Energies 15 09455 g017
Figure 18. Variation of rim work Lu with γ.
Energies 15 09455 g018
Figure 19. Variation of mass flow rate m ratio of high-pressure ports to low-pressure ports with γ.
Energies 15 09455 g019
Figure 20. Variation of the shaft power with γ.
Energies 15 09455 g020
Table 1. Parameters with different γ at each port.
γ = 0°γ = 10°γ = 15°γ = 20°γ = 30°
Δy (m)00.0140.0210.0290.046
U (m/s)185.8183.0179.5174.6169.9
θ145.940.336.131.217.6
θ237.230.024.919.34.6
θ330.122.016.310.2−4.3
θ432.424.219.013.1−1.6
Table 2. Resolution of each part in the wave rotor.
RotorPortClearanceTotal Number
Grid resolution731,00022,00024,600777,640
Table 3. Compression pressure ratio Π and expansion pressure ratio ε with different γ.
γ = 0°γ = 10°γ = 15°γ = 20°γ = 30°
Π3.0183.0233.0173.0153.017
ε1.1921.1911.1921.1901.191
Table 4. Time-averaged velocity components Wx, Wy and absolute velocity angle α of four ports at different γ.
γ = 0°γ = 10°γ = 15°γ = 20°γ = 30°
Wx1155.9156.8159.7158.0158.3
Wx2243.8243.0239.4232.4203.5
Wx3310.5302.1292.0280.4250.0
Wx4290.3282.1282.0272.7268.0
Wy1−28.2−53.8−72.9−87.0−111.4
Wy2−7.4−45.0−64.1−84.2−116.7
Wy3−5.2−60.4−89.5−119.0−171.8
Wy410.9−29.0−50.2−71.4−118.1
α145.339.533.729.017.4
α236.229.625.721.312.3
α330.222.117.111.2−2.5
α434.128.624.620.79.1
Publisher’s Note: MDPI stays neutral with regard to jurisdictional claims in published maps and institutional affiliations.

