Article

Enhanced Artificial Immune Systems and Fuzzy Logic for Active Distribution Systems Reconfiguration

by
Guillermo Alonso
1,2,
Ricardo F. Alonso
1,2,
Antonio Carlos Zambroni Zambroni De Souza
2,* and
Walmir Freitas
3
1
Facultad de Ingeniería, Universidad Nacional de Itapúa, Encarnación 070102, Paraguay
2
Institute of Electrical Systems and Energy, Universidade Federal de Itajubá, Itajubá 37500-903, Brazil
3
Department of Systems and Energy, UNICAMP—University of Campinas, Campinas 13100-484, Brazil
*
Author to whom correspondence should be addressed.
Energies 2022, 15(24), 9419; https://doi.org/10.3390/en15249419
Submission received: 5 November 2022 / Revised: 2 December 2022 / Accepted: 7 December 2022 / Published: 13 December 2022
(This article belongs to the Special Issue Cyber Security in Modern Power Systems)

Abstract

:
Nowadays, the high penetration of automation on smart grids challenges electricity companies in providing an efficient distribution networks operation. In this sense, distribution system reconfiguration (DSR) plays an important role since it may help solve real-time problems. This paper proposes a methodology to solve the DSR problem using artificial immune systems (AIS) based on a new, efficient, and robust approach. This new methodology, called Enhanced Artificial Immune Systems (EAIS), uses the values of the currents in wires for intelligent mutations. The problem is accomplished by a multi-objective optimization with fuzzy variables, minimizing power losses, voltage deviation, and feeders load balancing. A comparison with other DSR solution methods is presented. The method is compared with two other previously proposed methods with the help of the 33-bus, 84-bus, and 136-bus distribution systems. Different scenarios are analyzed, including the optimal location of the Distributed Generation (DG). The results show the applicability of the proposed algorithm for the simultaneous solution of DSR and location or dispatch of DGs.

1. Introduction

Distribution networks usually have a weakly meshed system. This arrangement allows for a more straightforward and simple operation and protection system design. The connection with other feeders enables the reconfiguration of changing the state of a set of switches normally closed (NC) or normally opened (NO).
Distribution systems support many possible configurations depending on the number of switches and available circuits. These configurations could modify the values of the current, voltage, and system electrical losses. Therefore, reconfiguration is a way to reduce electrical losses and improve the voltage drop of the final consumer.
With distribution grid automation, real-time reconfiguration studies are essential for planning, with the purpose of maintaining high-quality service at the lowest possible cost. Several papers on distribution system reconfiguration (DSR) with a multi-objective approach are available with the primary objective of reducing electrical power losses. Evolutionary algorithms are the most used. In [1,2], the reconfiguration problem was resolved using a genetic algorithm (GA). In [3,4,5], algorithms based on Artificial Immune Systems (AIS) were used, whereas algorithms based on Particle Swarm Optimization (PSO) were developed in [6,7,8,9].
In a GA, two main operators, crossover and mutation, are used. In AIS, the main operator, called hypermutation, is used, whose probability of mutation is inversely proportional to the affinity; this characteristic allows for studying the proposal of this work. In [10], a GA was used for the reconfiguration of photovoltaic sets to optimize the power of the panels. An improved algorithm based on the Immune Genetic Algorithm (IGA), which is a fusion algorithm combining genetic GA with AIS, was proposed in [11] to solve the problem of low thermoelectric conversion efficiency in thermoelectric power generation.
Other evolutionary algorithms have used heuristic and meta-heuristic harmony search [12] and the runner-root algorithm [13]. Other heuristics used include mixed-integer quadratic programming (MIQP) [14,15,16]. In previous works, branch current information was used to support the search for the optimal solution. This information could be employed to improve the search quality as it will be treated in this work.
Reducing losses was the primary DSR optimization objective in [13,14,15,17], whereas [12] focused on voltage security. In [15,17], loss reduction was approached as a mono-objective problem. In [18], three heuristic methods based on branch exchange were proposed for distribution system reconfiguration, which provided the effective harmonic reduction in the grid.
Several papers have proposed a multi-objective approach for DSR solutions. Techniques based on non-dominant Pareto solutions were used in [3,6], and methods based on fuzzy logic were used in [13,19]. The fuzzy logic-based approach returns a unique solution in a multi-objective optimization problem unlike non-dominant Pareto solutions, which offer a set of viable solutions. A solution set could not be appropriated situation for real-time applications where the decision rests on the professionals in charge of the operation distribution center, because they must choose one of these solutions to apply on system. This task usually is not easy.
In [20], an efficient and optimally coordinated operation of volt-var control (VVC) devices, a DSR, and a smart photovoltaic inverter (PVSI) for energy savings were proposed.
In [21], the measurements obtained from the phasor measurement units (PMUs) were used to solve the DSR hourly. In [22], an improved algorithm based on marine predators was proposed for the simultaneous optimization of DSR with the integration of DGs.
This paper proposes a novel method based on Enhanced Artificial Immune Systems (EAIS) for solving the DSR problem. The EAIS algorithm is an improvement of the algorithm used in [3]; however, substantial improvements are proposed in the AIS approach and multi-objective analysis using fuzzy logic. Improvements are also included in terms of modeling, which allow the simultaneous application of the location or dispatch of DGs. It could also allow electrical current values from the PMUs to be added to the algorithm information. In the EAIS, the mutation probability is estimated proportionally to the branch current, improving the efficiency and AIS advantages regarding local and global search capacity. Higher convergence speed and lower computational costs are additional improvements.
The motivation of this paper is to contribute to the state of the art by proposing an algorithm that is suitable for use in real-time operation, using the information of the electrical currents in the branches in distribution systems and considering DGs.
In Section 6, two AIS-based methods were developed in MATLAB (using the same computer). Identical tools were employed to calculate the power flow and other auxiliary programs, avoiding software, hardware, and programming level dependence to compare all methods objectively. In addition, the search results were more efficient, avoiding overloading configurations that could lead to power flow lack convergence.
The contributions of this work are as follows:
1. The hypermutation proposed in the EAIS algorithm uses the current information of the buses, reducing the search space and improving its efficiency; it could also be used in other evolutionary algorithms such as GA. This advantage enables the methodology to be used for bulk distribution systems in real time, including the analysis of load curves for essential periods.
2. The proposed modeling is robust, enabling users to consider the reconfiguration and the dispatch or location of the DGs simultaneously.
3. The multi-objective approach with fuzzy logic is easy to apply and provides robust results in real-time operation.
4. The proposed EAIS algorithm reduces the computation time compared to the AIS algorithm, improving the applicability in Smart Grids.
This work is organized as follows: Section 2 describes the artificial immune system heuristic to find the solution to the reconfiguration system distribution problem, Section 3 explains how fuzzy logic is used to develop a strategy to handle the multiple objectives problem; Section 4 shows the power flow algorithm and graph theory used to solve the objective functions, Section 5 describes the proposed algorithm, and Section 6 shows the case studies. Finally, Section 7 presents the conclusion about the work.

2. Artificial Immune Systems

The Artificial Immune System (AIS) is a paradigm of artificial intelligence inspired by metaphors of the immunological system of vertebrates. This algorithm was chosen due to its robustness and efficiency in combating foreign attacks. Furthermore, this system works in a decentralized, parallel, and adaptive way, which is desirable in finding solutions to complex problems and artificial intelligence [3]. The AIS uses the principles and patterns observed in immunological systems. These characteristics are applied to solve mathematical problems. One of the characteristics is the robustness, which is expressed in its tolerance to disturbances in individual components that can perform complex tasks when acting together [23].
The AIS is an evolutionary algorithm based on the Clonal Principle [23]. The principal operator used in this principle is called hypermutation. This operator has two steps: cloning antibodies proportional to their affinity, and mutation inversely proportional to their affinity. Due to this, cloning directs the local search, and mutation directs the global search. Through this strategy, the AIS obtains an optimal balance between both search aspects. In [24], the AIS was used to solve the problem in distribution systems of charging electric vehicles. In [3], the AIS was proposed to solve the problem of distribution system reconfiguration using graph theory and Prim algorithm. In [25,26], algorithms based on AIS were developed for the DSR solution, and [27] presented two approaches based on AIS, the Copt-aiNet (Artificial Immune Network for Combinatorial Optimization) and Opt-aiNet (Artificial Immune Network for Optimization) algorithms, for solving the DSR problem.
This paper proposes using an algorithm based on AIS with adaptations to the mutation process to search for a multi-objective DSR problem. Section 5 details the flowchart of the proposed algorithm based on artificial immune systems and details the new hypermutation mechanism to improve this search in DSR problems.

3. Fuzzy Logic

In contrast to the called crisp values sets based on the classical Boolean Logic, fuzzy sets may take truth values between 0 and 1. Furthermore, when linguistic variables are used, these degrees may be managed by specific membership functions.
Thus, a fuzzy set is defined in the universe of discussion as a set of ordered pairs: A = {x,(μ_A (x))⁄x ϵ X}.
The membership degree of a particular variable is established by the membership functions μA(x) (Membership Function—M.F.).
This paper proposes a multi-objective analysis by the fuzzification of a real objective functions set. After fuzzification, the problem is converted to a single function, as in [12,13,28,29]. In Section 4, the process of fuzzification of the objective functions used in this work is detailed, and in Section 6, weights are attributed to each one. Finally, the global function or fitness is obtained as a weighted sum of the objective functions.
The choice of the membership function is critical to exploiting the potential of fuzzy logic. The membership function choice depends on the characteristics of the physical variable analyzed. The limits—maximum, minimum, and central values—are essential to assign the importance degree of the variable.

4. Distribution System Reconfiguration

This section shows the methodology used to resolve the distribution system reconfiguration.

4.1. Distribution Systems Power Flow

Newton-based power flow methods are used in distribution systems but require modifications for convergence due to the high value of R/X ratio, radial topology, and phase unbalance. However, other methods are available, such as a backward-forward sweep and Z-bus matrix. In this paper, the backward-forward sweep method [30] was used. For an M bus radial distribution network, there are only M − 1 lines (elements), and branch currents can be expressed regarding bus currents through Equations (1) and (2).
  I b u s = K · I b r a n c h
I b r a n c h = K 1 · I b u s
where I b u s is a vector of currents of each bus j of order M − 1, I   b r a n c h   is the vector of currents of each branch (j, m (j)), and m (j) is the bus connected to j. The matrix K is an incidence matrix. It is a nonsingular (M − 1) order square matrix. The incidence matrix is constructed in such a way that:
K(j, m (j)) = 1: The diagonal elements of matrix K are ones.
K(j, m (j)) = −1: If branch (j, m (j)) is connected.
K(j, k) = 0: All the remaining elements are zeros.
The power flow calculation used in [23] allows load imbalance per phase.

4.2. Graph Theory

Similarly to [6], the network is represented by graphs for managing topology. The nodes represent a set of loads, and the edges represent switches and branches. The distribution circuits are represented by a forest, where each feeder is a tree. Thus, all loads are connected, and the radial nature of the circuits is assured. The incidence matrix is used in the same way as the power flow with Equations (1) and (2). The control variable is the vector x ¯ = [ x 1 ,   x 2   , x 3 , x i , , x n ] , where   x i = 0 if the switch i is open and x i = 1 if it is closed. N = [ 1 , 2 ,   3 ,   , i , ,   n ] is the vector of the switch numbers in correlative order to facilitate the representation.
N 1 = { n m } , n m is the number of switches with a closed position, and N 2 = { n l } , where n l , is the number of switches with an open position and n,   N = { N 1   ,   N 2 }   is the total switch set.
The same representation is used for the power flow. Thus, the branch that does not change its state behaves like a fixed switch that maintains its status equal to 1, so these branches do not belong to the set of variables   x i . This representation is simplified using the same incidence matrix for the power flow and the graph that manages the configurations.
There are two feasibility conditions for a particular configuration: radiality (there are no closes meshed) and no islanding loads. According to graph theory, each feeder is a tree, and all systems are a forest (a set of trees connected to a common node).
In [6], Prim’s algorithm obtained the initial population and ensures forest construction (in the network). In this work, the condition of the forest was obtained using the Matroid theory used in [1,2,7,28,31,32,33,34]. Starting from a feasible configuration N 2 , , possible closed loops were obtained (fundamental loops), completing the n open switches.
The number of fundamental loops is given by Equation (3). This number is equivalent to N 2 .
L f = M N + 1
where   L f is the number of fundamental loops, M is the number of buses, and N is the number of branches.
The tree’s condition is maintained if one of its switches is open in these fundamental loops.
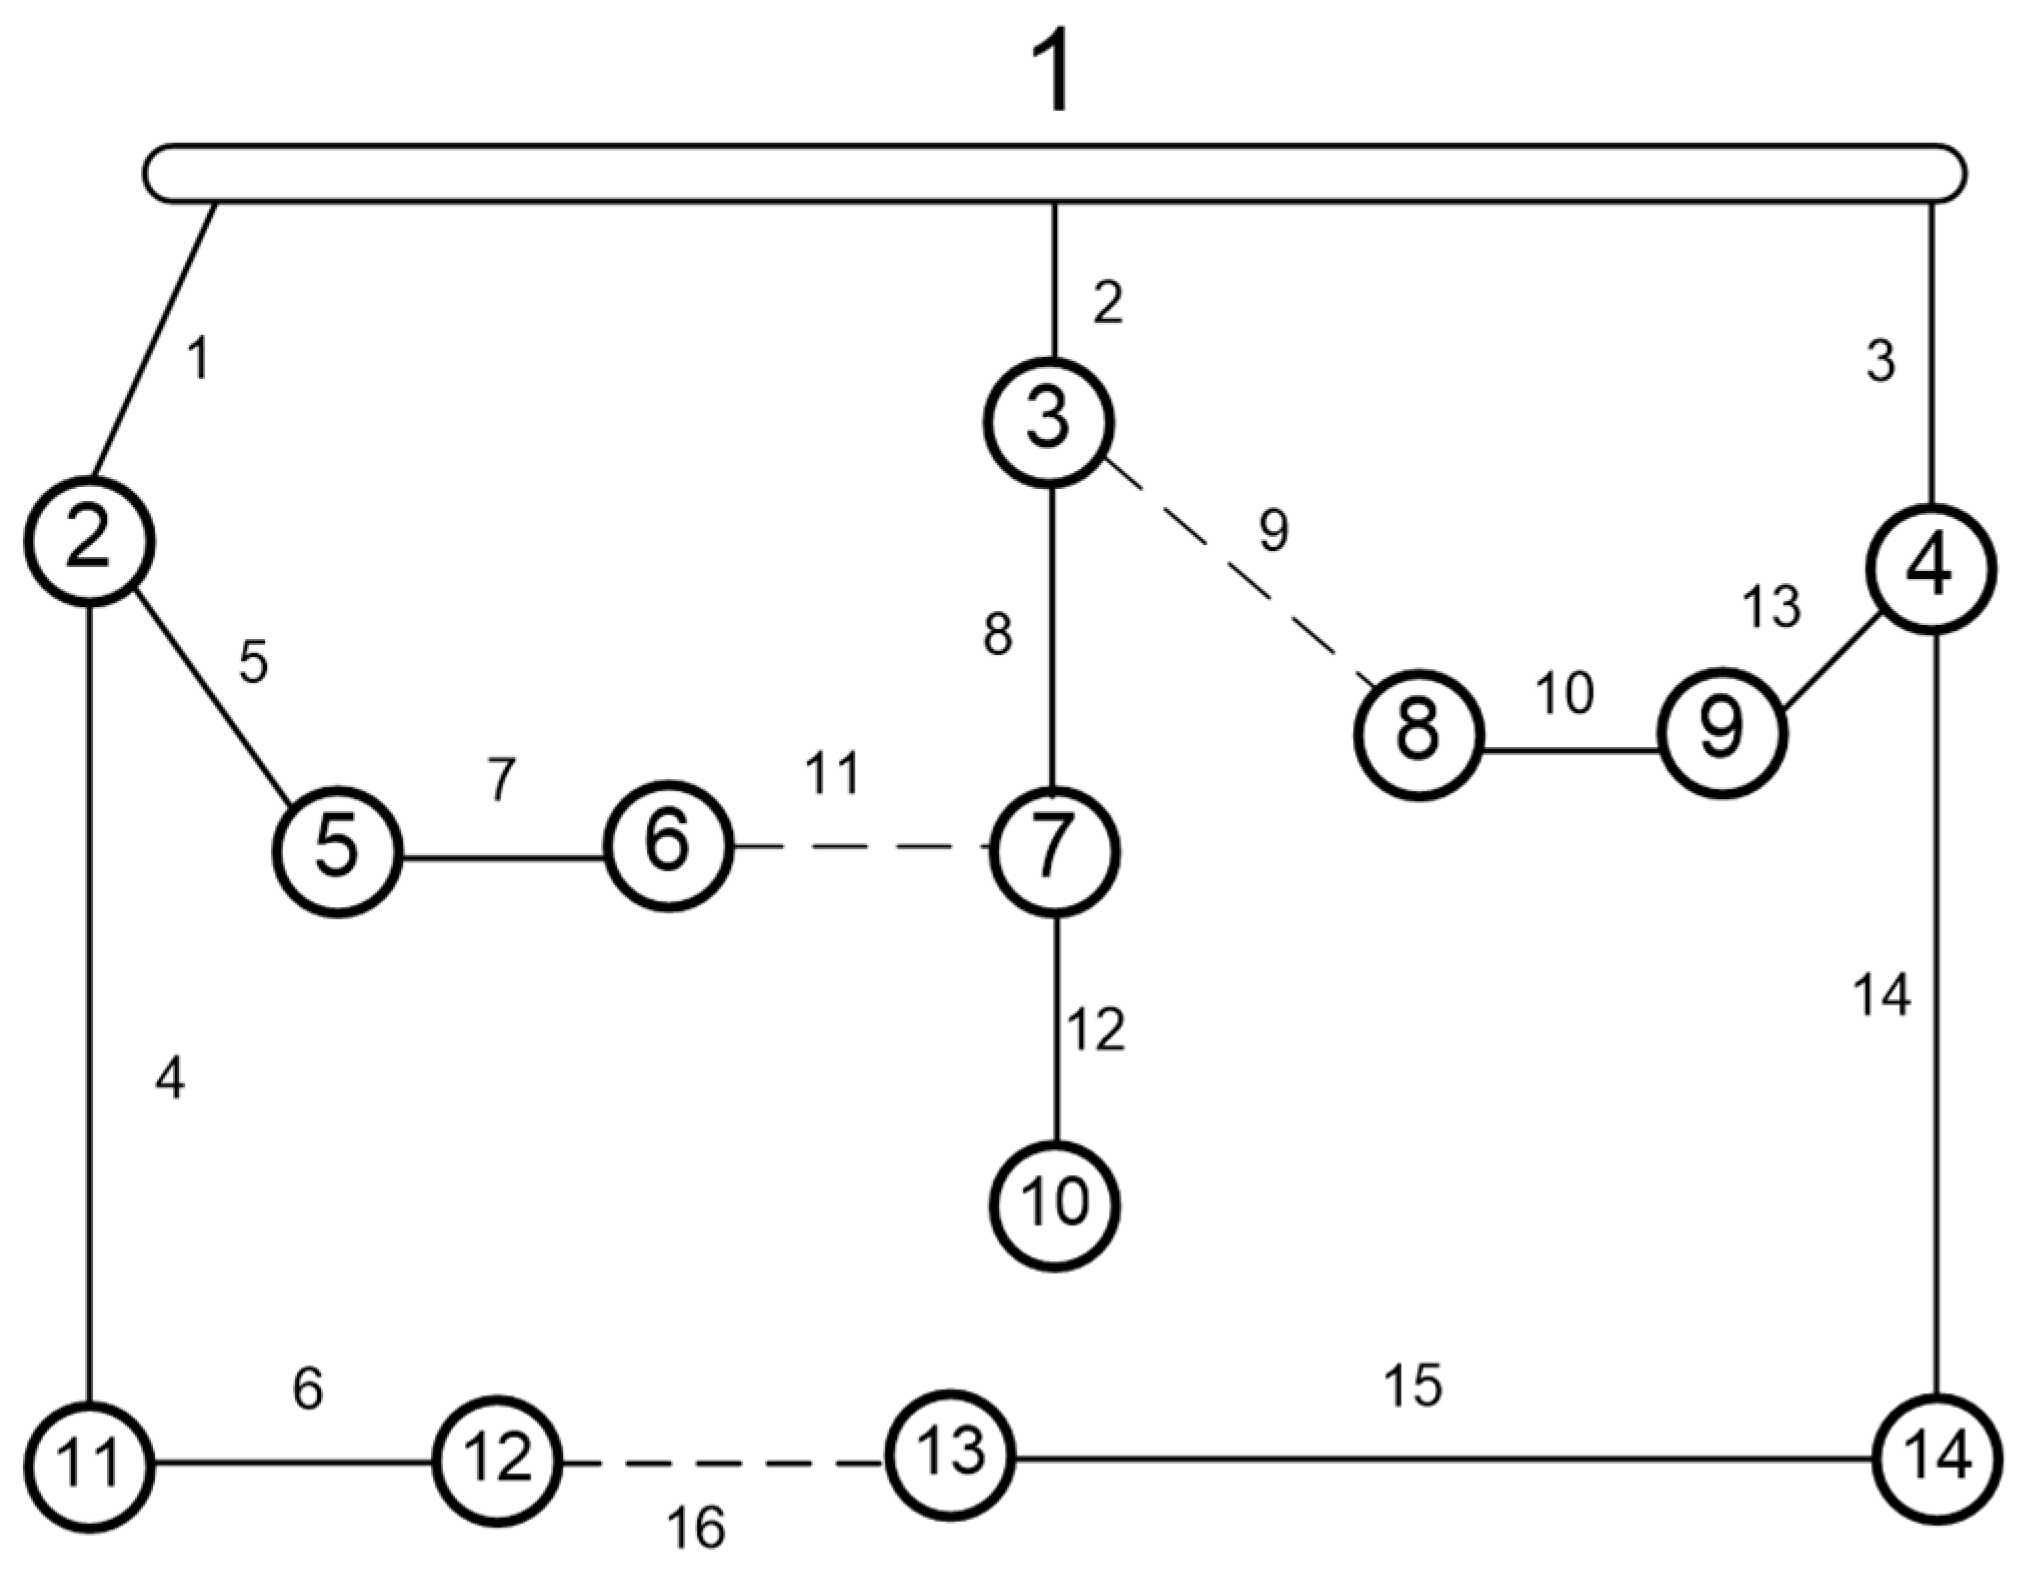
Figure 1 shows an example of a 14-bus test system, used in [7,12,14,34]. It has 14 buses, 3 feeders, and 16 branches. Overall, 13 of them are normally closed switches (NC) and 3 are normally open (NO). The initial configuration is equal to x ¯ 0 = [ 1 ,   1 ,   1 ,   1 ,   1 ,   1 ,   1 ,   1 ,   0 ,   1 ,   0 ,   1 ,   1 ,   1 ,   10 ] ,   and equivalent to N 1 0 = [ 1 ,   2 ,   3 ,   4 ,   5 ,   6 ,   7 ,   8 ,   10 ,   12 ,   13 ,   14 ,   15 ] and N 2 0 = [ 9 ,   11 ,   16 ] .
There are three fundamental loops given by:
L 1 = [ 1   ,   2 ,   5   , 7   , 8 ,   11   ] , L 2 = [ 2 ,   3 ,   9 ,   10 ,   13 ] , L 3 = [ 1   , 3 ,   4   , 6 ,   14 ,   15 ,   16 ] .

4.3. Objective Functions

Three objectives were considered: loss reduction, feeder currents balances, and drop voltage. Each one of these objectives is detailed below. Finally, fuzzification was developed to handle this multi-objective optimization. As mentioned in Section 4, the backward-forward sweep method calculates power flow and, consequently, the objective functions.

4.3.1. Power Loss Reduction

The power loss of the system is:
P l o s s = l = 1 N b r | I l | 2 R l
where
I l represents the currents of branch l .
Nbr represents the number of branches of the system including closed switches.
R l represents the resistance of branch l .
Ploss represents the total loss of the branches.
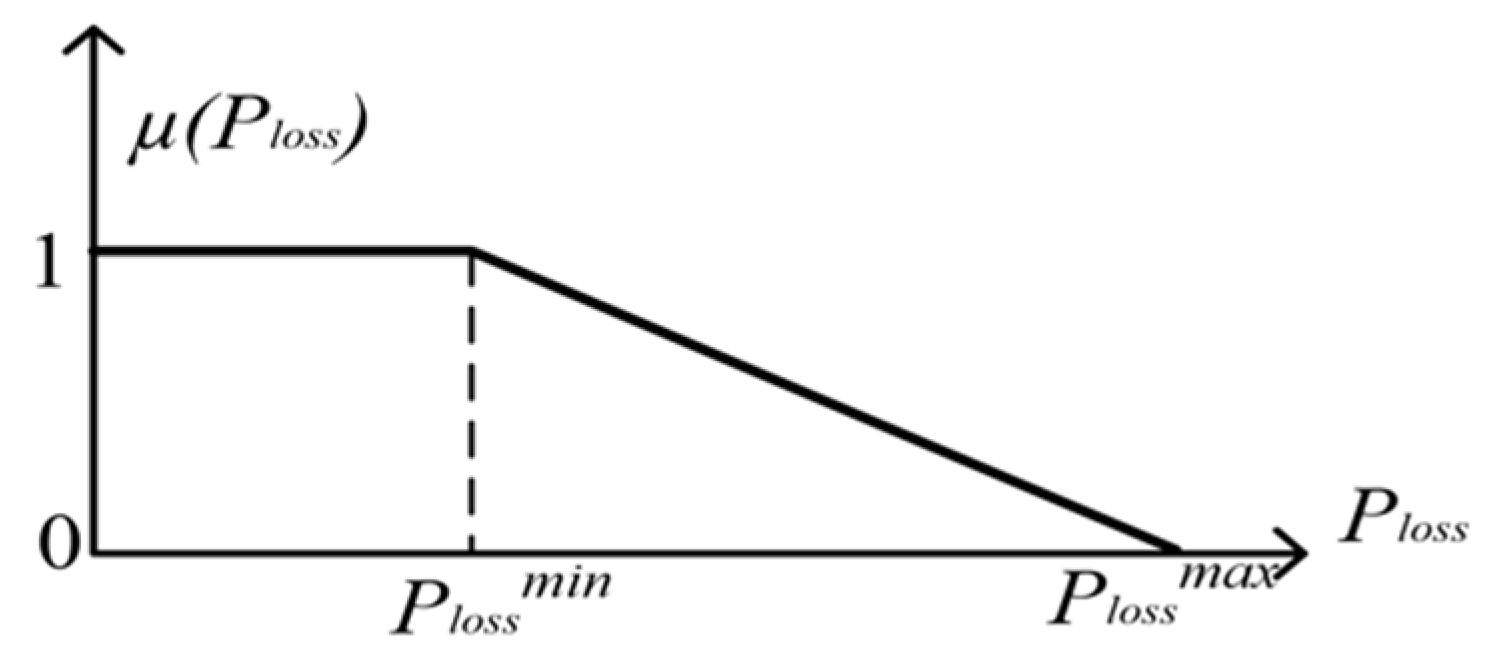
The membership function used in this case is the shoulder function (Figure 2), and the fuzzification is performed by (5):
P ˜ l o s s = μ ( P l o s s ) = { 1 ,   P l o s s < P l o s s m i n P l o s s m a x P l o s s P l o s s m a x P l o s s m i n ,   P l o s s T m i n P l o s s P l o s s m a x 0 ,   P l o s s > P l o s s m a x

4.3.2. Load Balancing Function

Load balance is an important issue in obtaining a uniform distribution demand in the feeder of the same substation or bay of feeders or substations. This strategy allows the optimization of infrastructure investments and extends the useful life of the equipment through the optimal distribution of the phase’s currents in the feeders set.
The load balancing function can be represented by an index that measures the imbalance between demands of feeders considering restrictions such as the voltage drop, maximum capacity of the lines, and radial topology. The load balancing index among feeders is represented by (6):
β = k = 1 n | I k I ¯ | I ¯
I ¯ = k = 1 n I k n
where
I   ¯ represents the average current of substation feeders.
I k represents the current of feeder ‘k’ obtained by a power flow methodology.
The membership function used is the shoulder function. This function must find a minimum; therefore, fuzzification is carried out by Equation (8):
β ˜ = μ ( β ) = { 1 ,   β < β m i n β m a x β β m a x β m i n ,   β m i n β β m a x 0 ,   β > β m a x
where   β m i n is the minimum imbalance value (in this case, 2% ), and β m a x is the maximum allowed value (in this paper, 40%).
The minimization problem is translated to a maximization problem of the fuzzy function β ˜ .

4.3.3. Voltage Drop Function

The voltage drop (about the nominal value) is given by Equation (9):
Δ V m = m a x ( | V j V r e f | )   j = 1 , 2 , .. , n b
where
V j represents the j-bus voltage obtained by power flow.
V r e f represents the nominal voltage value.
n b   is the number of system buses.
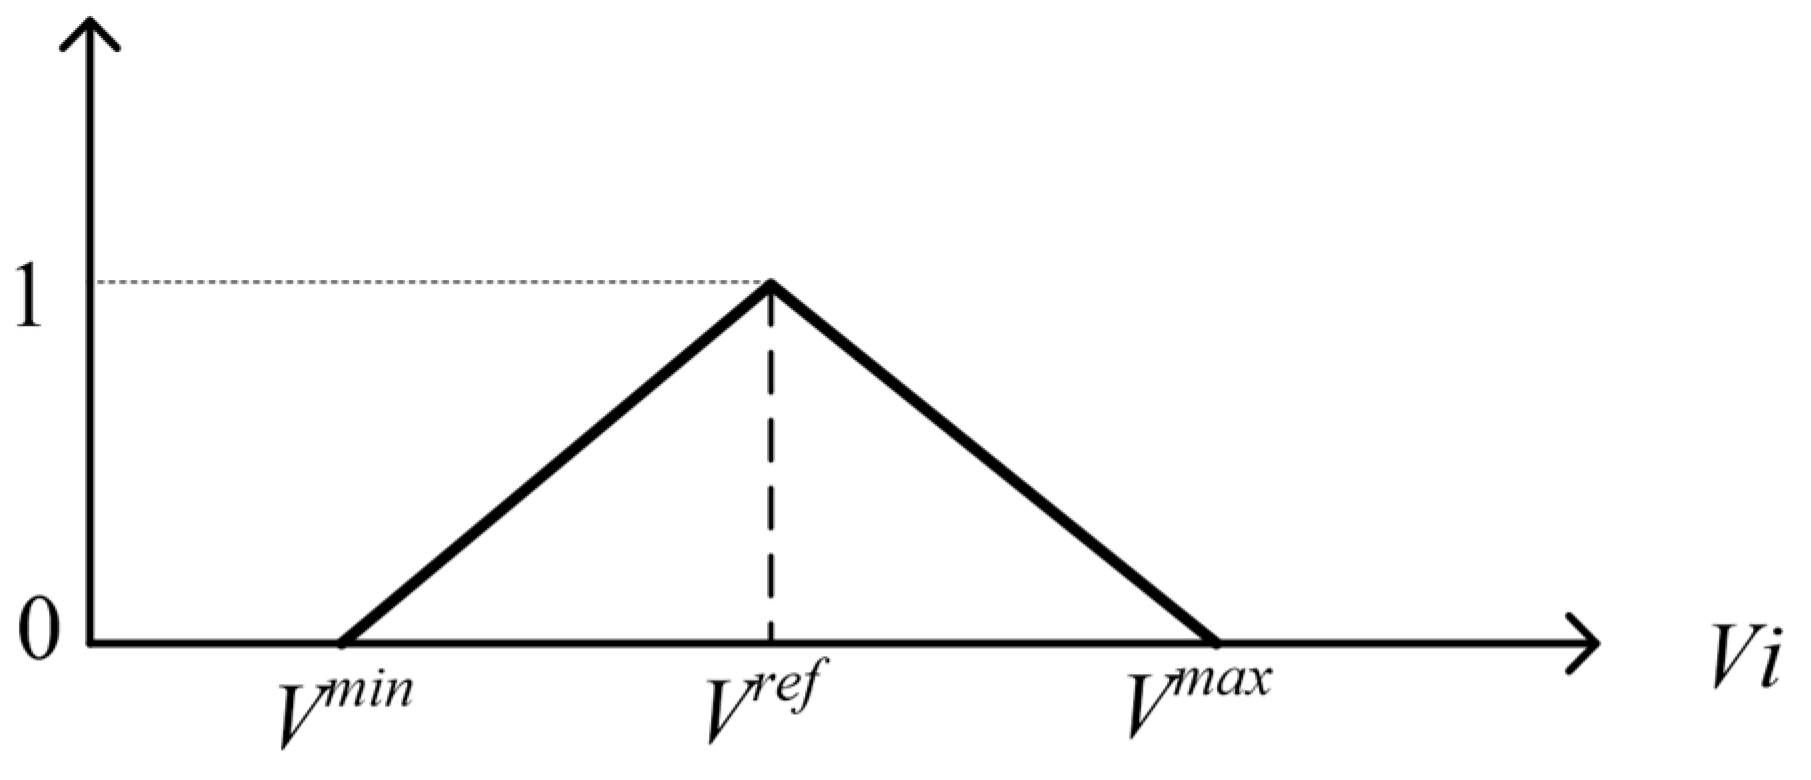
The fuzzified function is calculated by the equations given in (10). In this case, the triangular membership function is used because the voltage has an optimal central value.
Δ V ˜ m = μ ( Δ V m ) = { 0 ,   V i < V m i n V i V m i n V r e f V m i n ,   V m i n V i V r e f V i V m a x V r e f V m a x ,   V r e f V i V m a x 0 ,   V i > V m a x ,
where
V i is the bus related to Δ V m (absolute value).
V m a x is the maximum voltage allowed.
V m i n is the minimum voltage allowed.
In this case, the minimization problem is transformed to maximize the fuzzy function   Δ V ˜ m , as shown in Figure 3.

4.4. Problem Formulation

The multi-objective problem is formulated as follows:
m i n { P l o s s ( x ¯ ) β ( x ¯ ) Δ V m ( x ¯ ) }
s . t .
I l < I l m a x
V m i n V i V m a x
F ( x ¯ ) is a forest
where
x ¯   is a binary vector indicating the state (open-closed) of system switches,   x i = 0 if open and x i = 1   if closed.
I m a x is the maximum current of branch l .
The multi-objective problem can be represented as the maximization of fuzzy functions, where a global objective function is calculated through weighted sums according to Equation (12).
Z 1 ˜ = w 1 · P ˜ l o s s + w 2 · β ˜ + w 3 · Δ V ˜ m

5. Proposed Algorithm

The main contribution of this work is the Enhanced Artificial Immune Systems (EAIS) algorithm. With this strategy, the most efficient and effective technique for resolving a DRS problem is obtained. Next, the algorithm is described. In addition, this technique is demonstrated to be helpful for real-time purposes.

5.1. Algorithm Flowchart

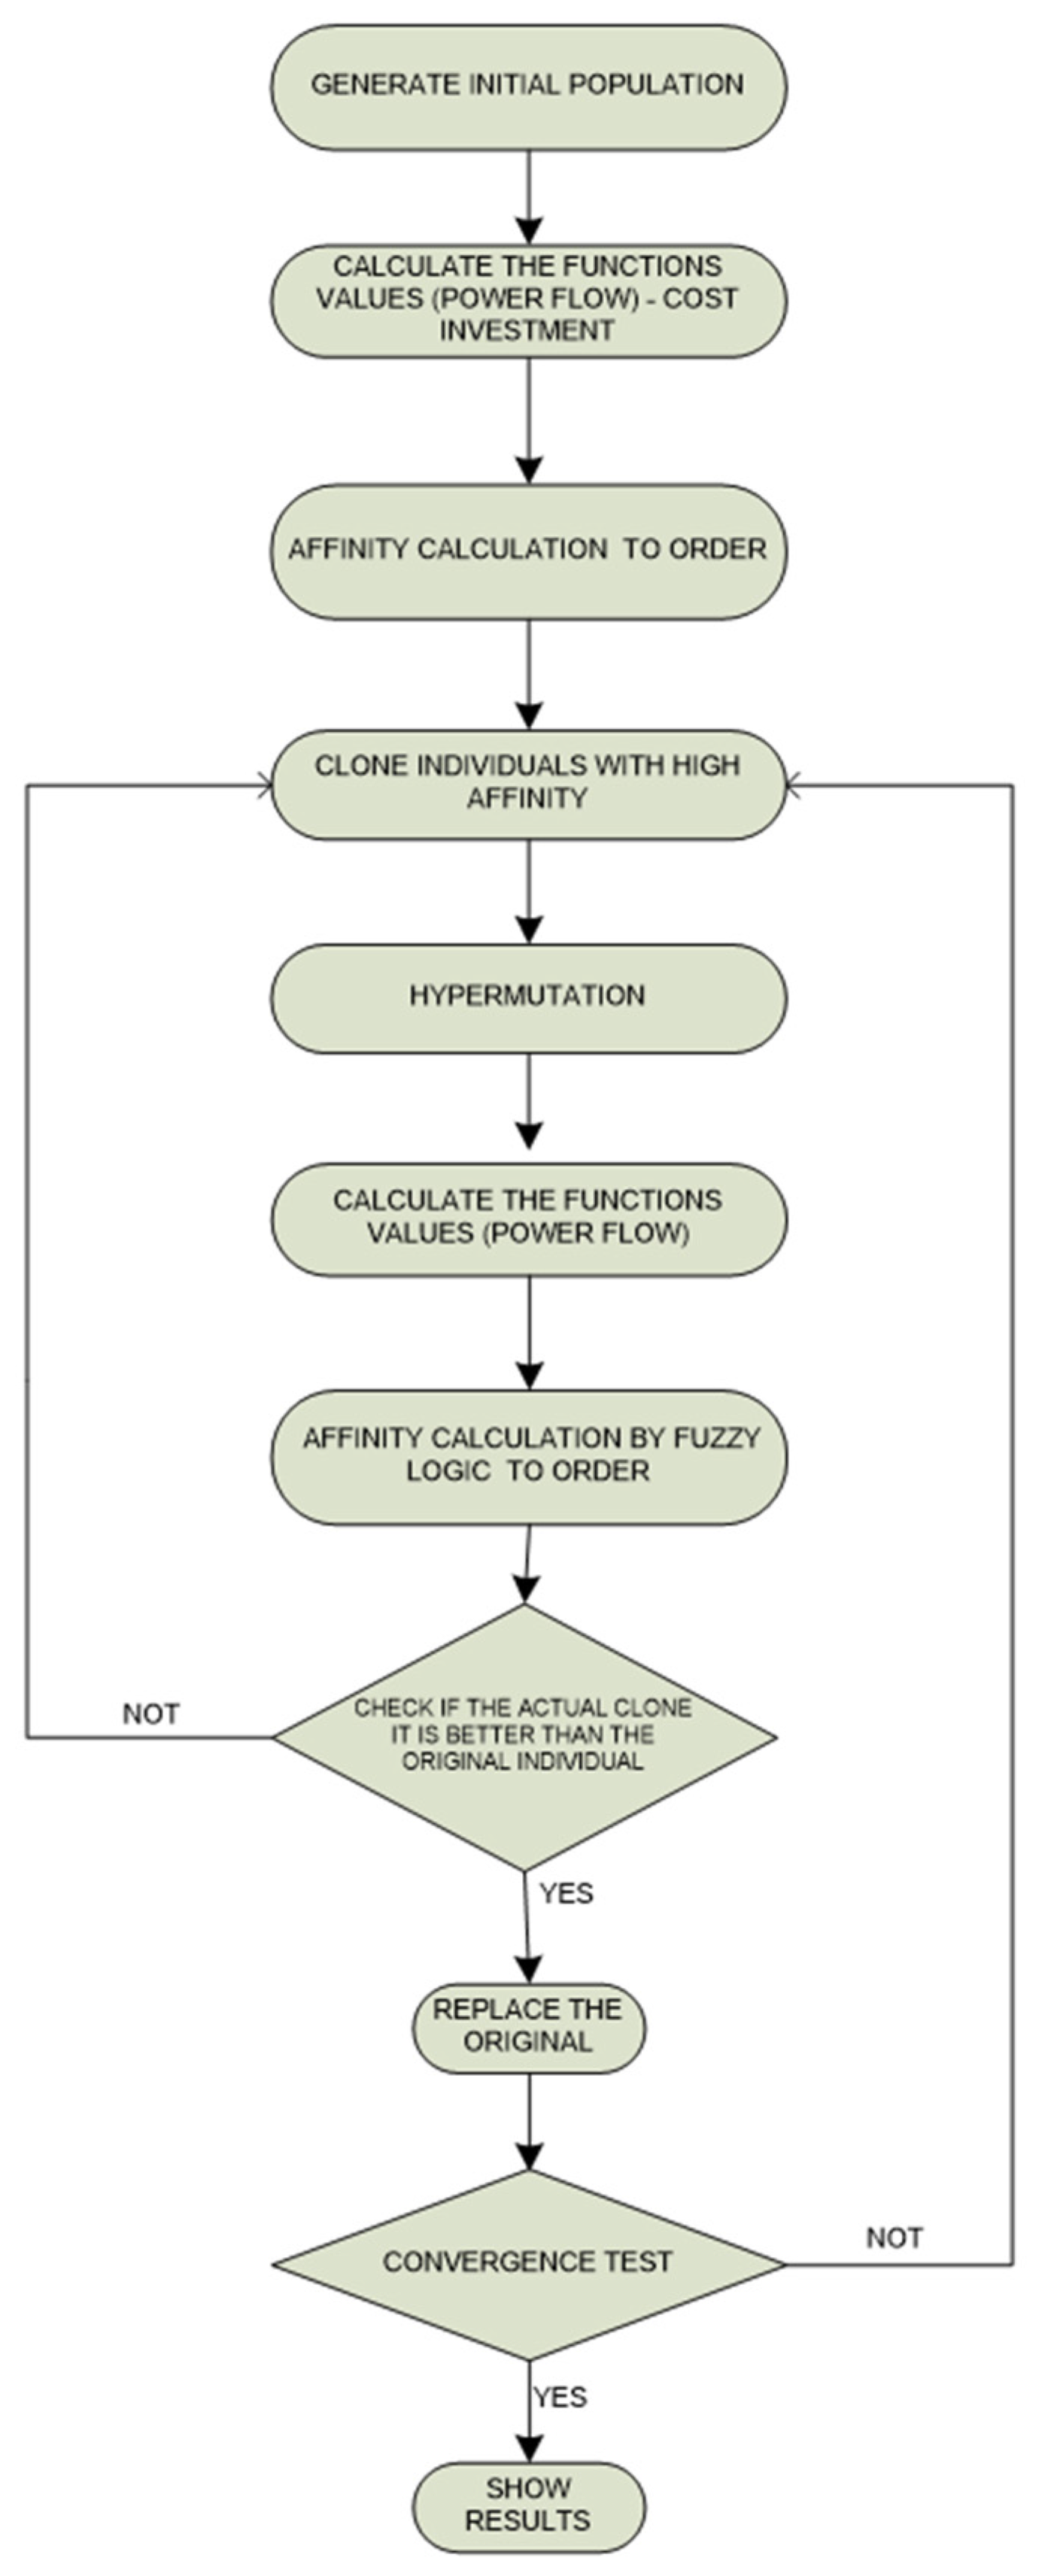
The AIS is applied similarly to [6], improving the mutation and fuzzy multi-objective analysis. The flowchart of this algorithm is presented in Figure 4. The first population is performed by successively applying random mutations identical to [27] from the initial configuration, unlike [3], which is performed using Prim’s algorithm. First, the original configuration of the circuit is included. Then, the functions are computed (and fuzzified) by calculating the power flow.
After that, these functions are defuzzified, converting the multi-objective problem into a mono-objective problem. Finally, the global objective function is calculated by Equation (12), which corresponds to the affinity value. The weights in (12) are estimated similarly to [28] and can be adjusted according to the importance level of the variables.
The more affined antibodies are cloned and subjected to the hypermutation process. In [3], the hypermutation process is realized in any bit of the antibody represented by a binary vector. This process varies from the state of one component (switch).
In this paper, the cloning-hypermutation process was carried out according to the approach developed in Section 5.2 using Equations (13)–(15). This approach consisted of an adaptation of the CLONALG algorithm described in [24], similar to that developed in [3] and [25,26]. Still, with the difference in the hypermutation process, such mutation probability depended on the current of each switch.

5.2. Cloning-Hypermutation Proposal

The cloning-hypermutation process is performed in three steps as detailed below.
Step1: The cloning of the population is performed according to Equation (13). Since the number of clones is directly proportional to the affinity, the affinity evaluation is performed for position i . Position i = 1 corresponds to the antibody with higher affinity, and i = N is the worst-affinity antibody.
Step2: An element of n 2 * N 2 of each antibody is chosen randomly and changes from the open state to the closed state. A loop composed of the switch   L = [ L m ] is created in this way using a depth search algorithm of Graph Theory. It is possible to extract these elements through the incidence matrix A . Finally, the opening of one of L m   switch es is performed, ensuring that the graph obtained is a forest, which implies all nodes’ radial configuration and connection. This process is carried out following the mutation control criteria described below:
  • It extracts the values of the currents I = [ I m ] of the formed loop L = [ L m ] from the previous equilibrium point in the last configuration (the antibody without applying the mutation).
  • The opening of one of the switches of L = [ L m ] is performed according to the probability given in Equation (14).
  • The successive application of mutations is carried out according to (15). For this case, from the second consecutive mutation, the opening probability is the same for all the switches   p m * = 1 .
Step3: The vector N 1 is updated, adding the closed switch and removing the open switch, yielding a vector   N 2   . Then, the incidence matrix A   is updated, enabling one to assess the objective function.
c l = r o u n d ( β × N i )
p m = e x p ( ( 1 i / ( δ × N ) ) I m * )
q i = r o u n d ( e x p ( α · i N ) · r a n d ( 0 , 1 ) )
The most affine antibody is in the i = 1 position, and the worst antibody is at the end of N vector (where N is the antibody population size).
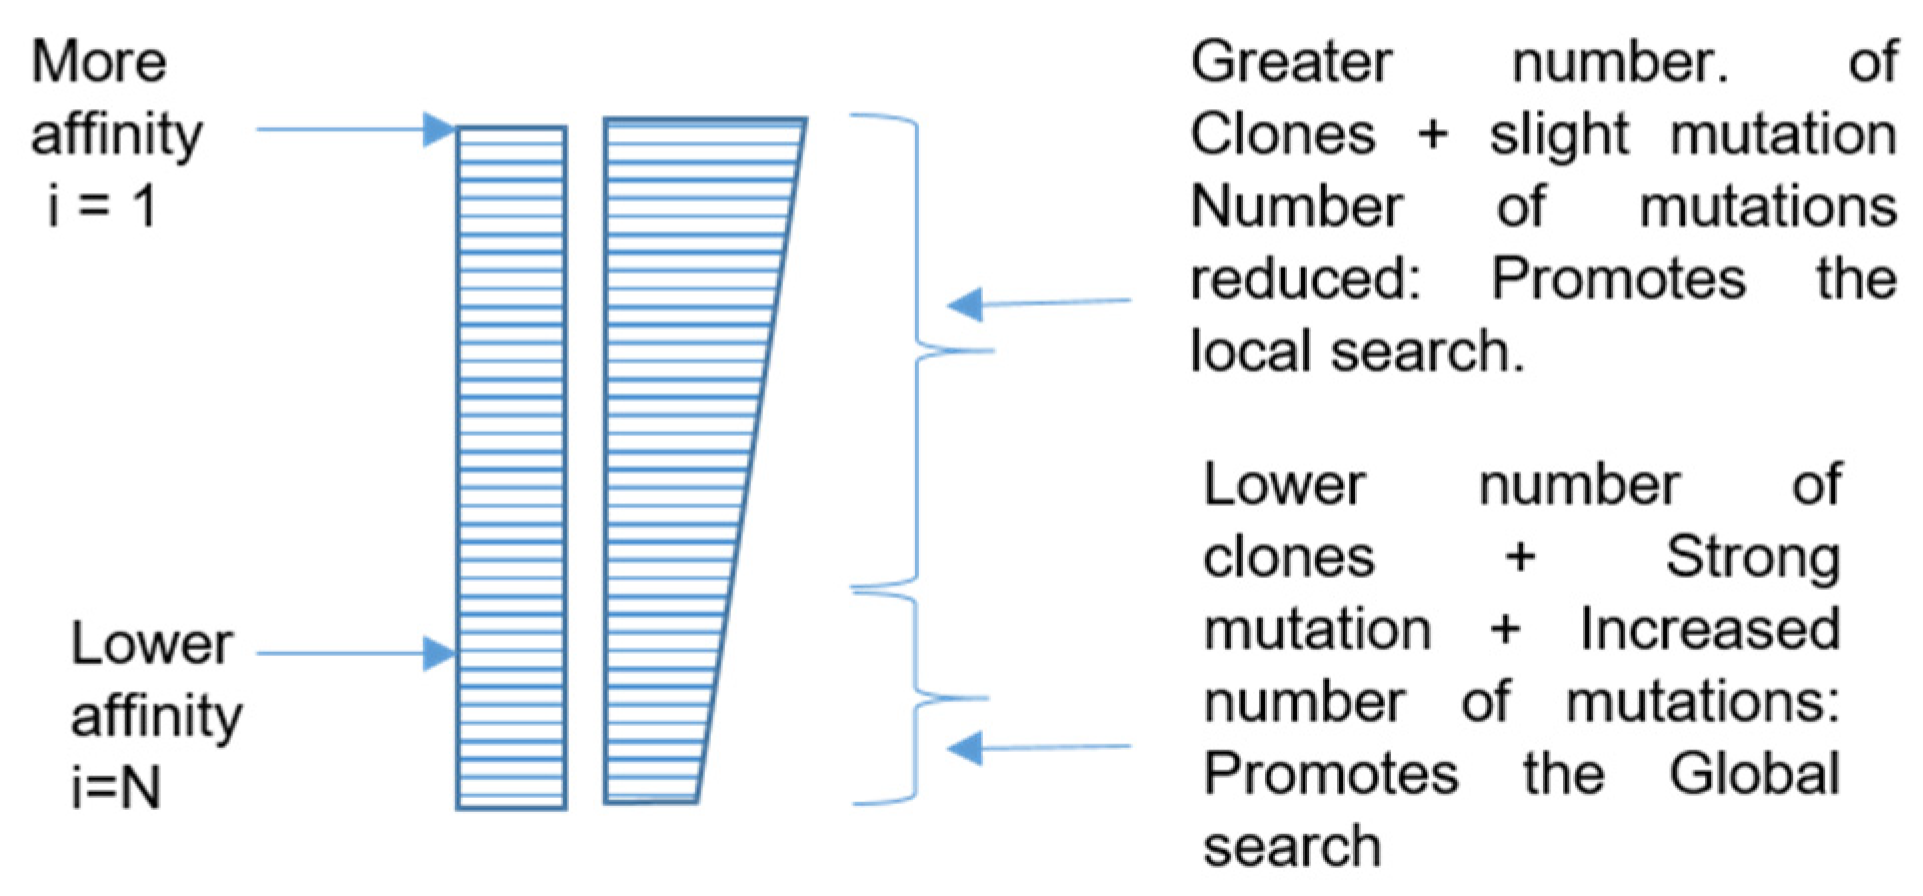
Equation (13) implies that the number of clones is directly proportional to the affinity degree, establishing a higher local search for upper-affinity antibodies. According toEquation (14), the probability of switch opening is inversely proportional to the current for ( 1 i / ( δ × N ) ) > 1 and directly proportional to the current for   ( 1 i / ( δ × N ) ) < 1 . The affinity involves slight changes in the configuration for upper-affinity antibodies (favoring the local search) and significant changes in the configuration for lower-affinity antibodies (favoring the global search). This is because the switch opening associated with a higher current value provokes considerable changes in the configuration. Equation (15) establishes the number of successive mutations inversely proportional to the degree of affinity, favoring the local search for upper-affinity antibodies and the global search for lower-affinity antibodies. Rand (1,0) is a random real number between 0 and 1. Figure 5 establishes the relationship between affinity and global and local search control.

5.3. Example of Cloning-Hypermutation Proposal

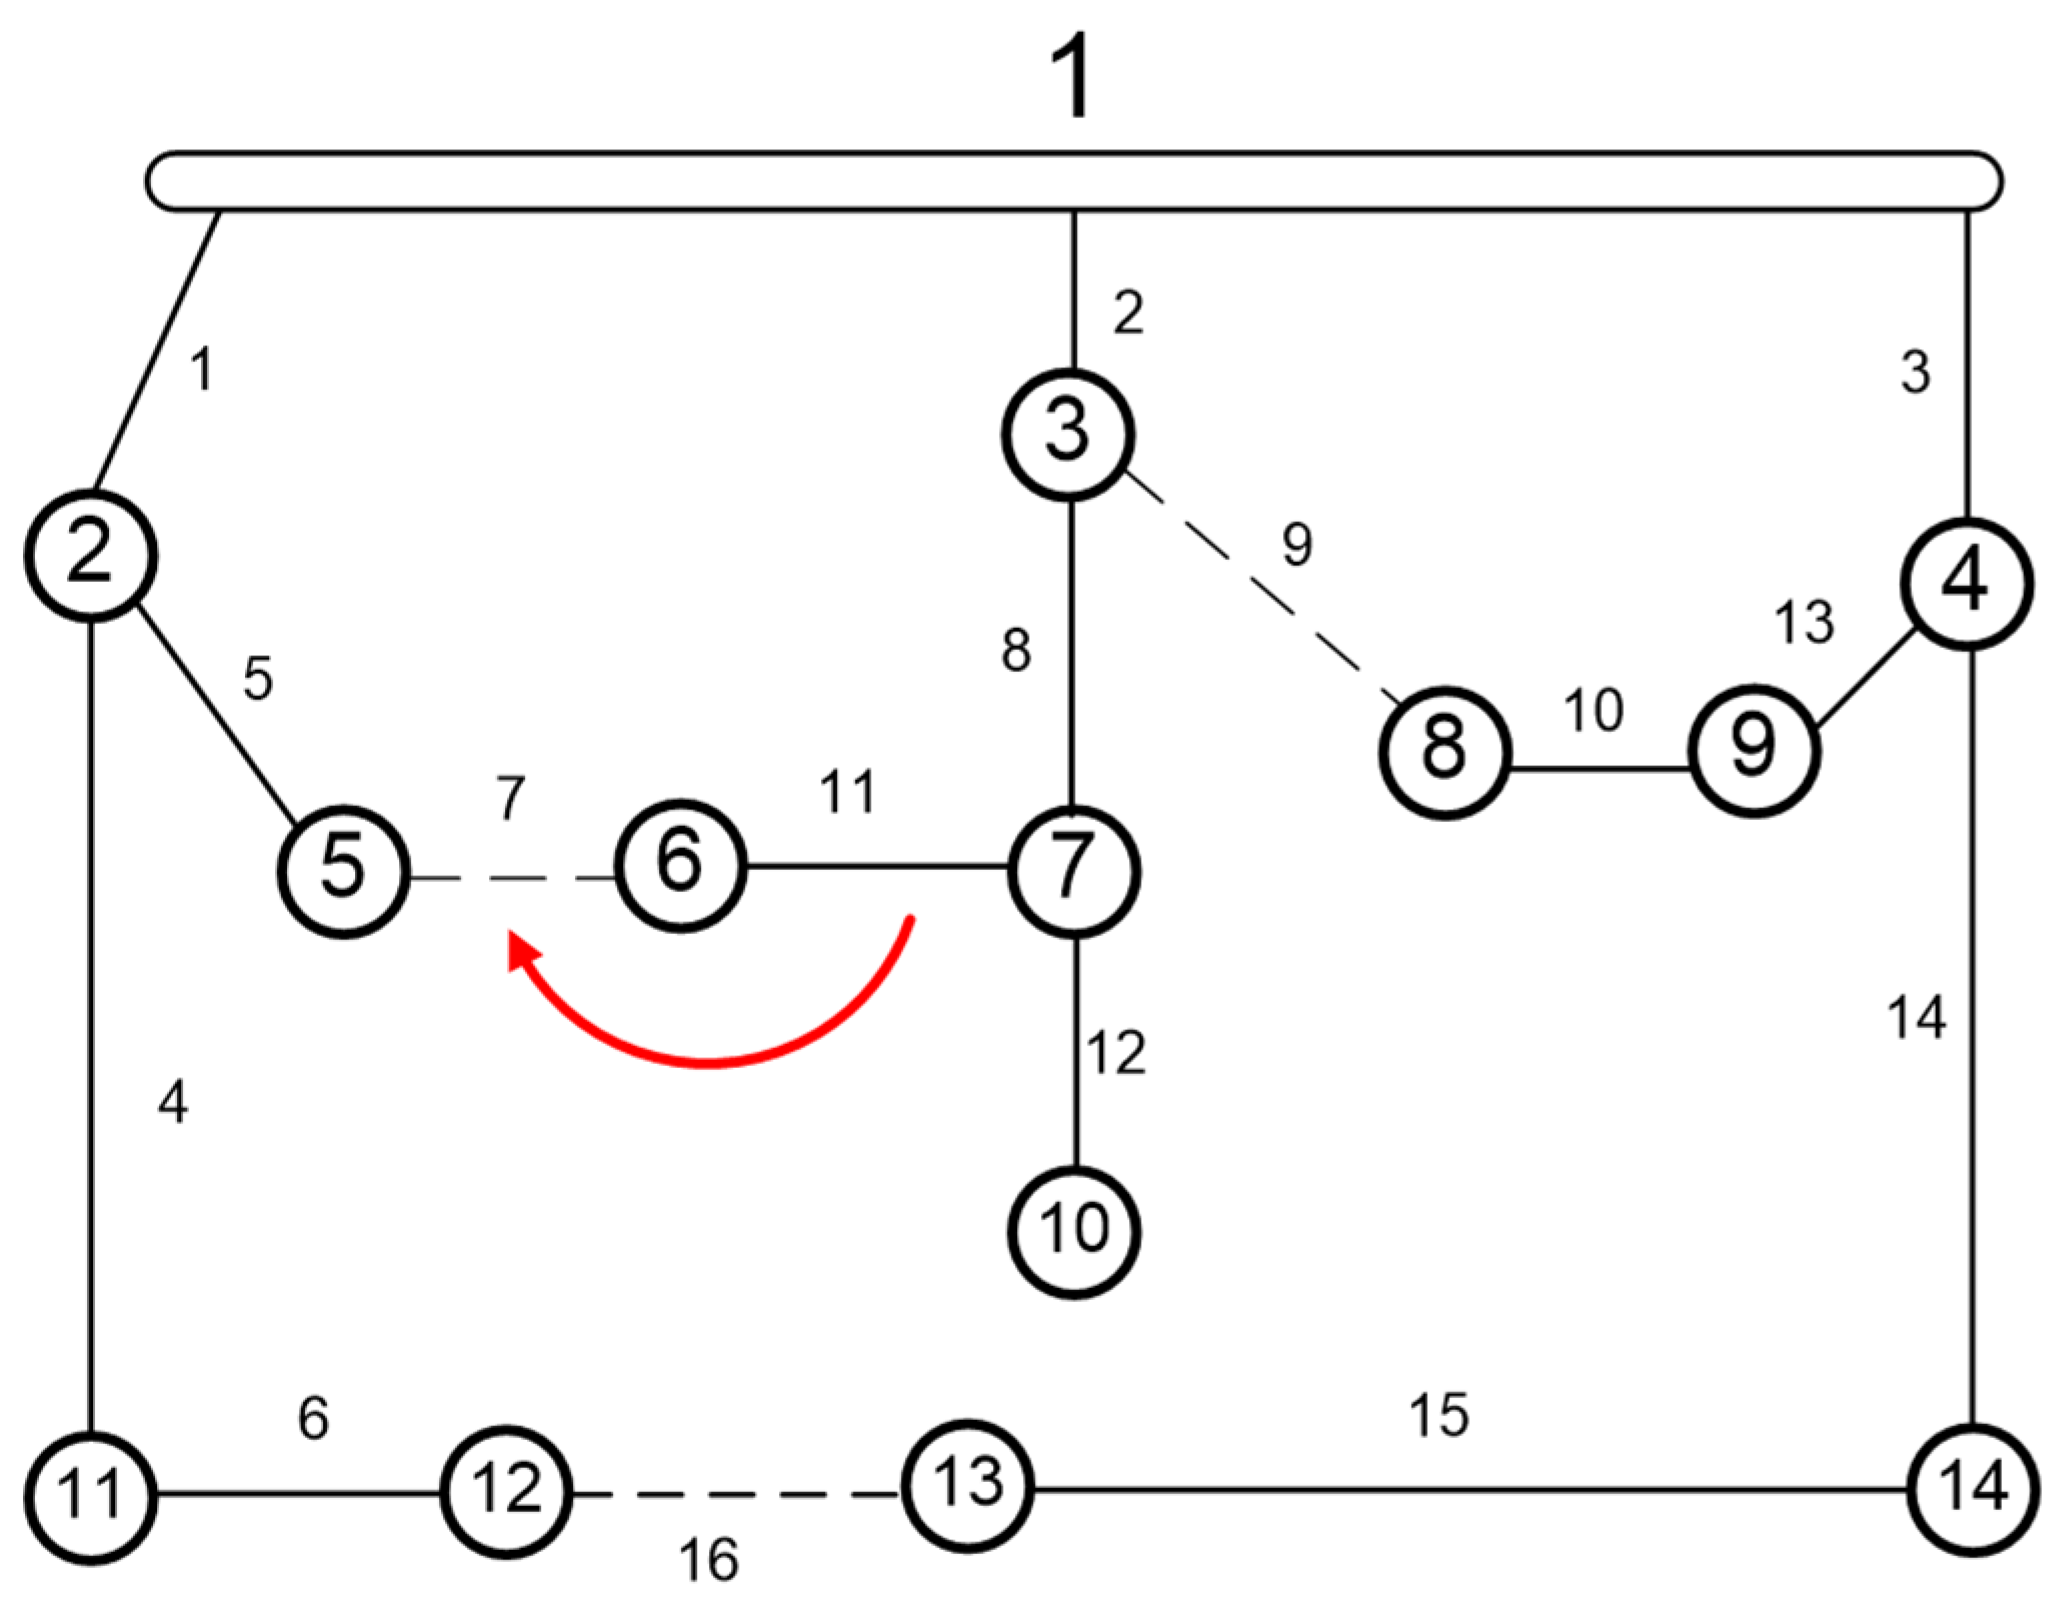
Figure 6 shows the IEEE 14-bus system. The cloning of the population is performed according to Equation (13). The mutation of this antibody depends on its affinity. There are two extreme cases: a high-affinity (i = 1) antibody, determined by N 2 1 = [ 9 ,   11 ,   16 ] , and a low-affinity (i = 10) antibody, defined by N 2 10 = [ 6 ,   14 ,   10 ] . Then, the relationship was proportional in a continuous way to these cases. This antibody will be the initial condition to explain each case’s mutation.

5.3.1. High-Affinity Individual Given by N 2 1

The antibody given by   N 2 1 = [ 9 ,   11 ,   16 ] has a high affinity according to the previous power flow value. The currents are given by I = [ I 1 , , I m , , I 16 ] for each m branch. An element of the   N 2 1 is then selected randomly (for example, switch 11) and closed, creating the set loop L = [ 1 , 2 , 5 , 7 , 8 , 11 ] . The currents of the loops are given by I = [ I 11 , I 7 , I 5 , I 8 , I 2 , I 1 ] , ordered from the lowest to highest ( I 11 = 0 ). Equation (14) is applied and the opening probability of each switch of the loop is obtained, yielding ρ 1 = [ ρ 7 , ρ 5 , ρ 8 , ρ 2 , ρ 1 , ρ 11 ] , ordered from the highest to lowest ( ρ 11 = 0 ) . After applying the probability, the opening of the switch is performed (for example, switch 7), and the configuration obtained is shown in Figure 7.

5.3.2. Low-Affinity Antibody Given by N 2 10

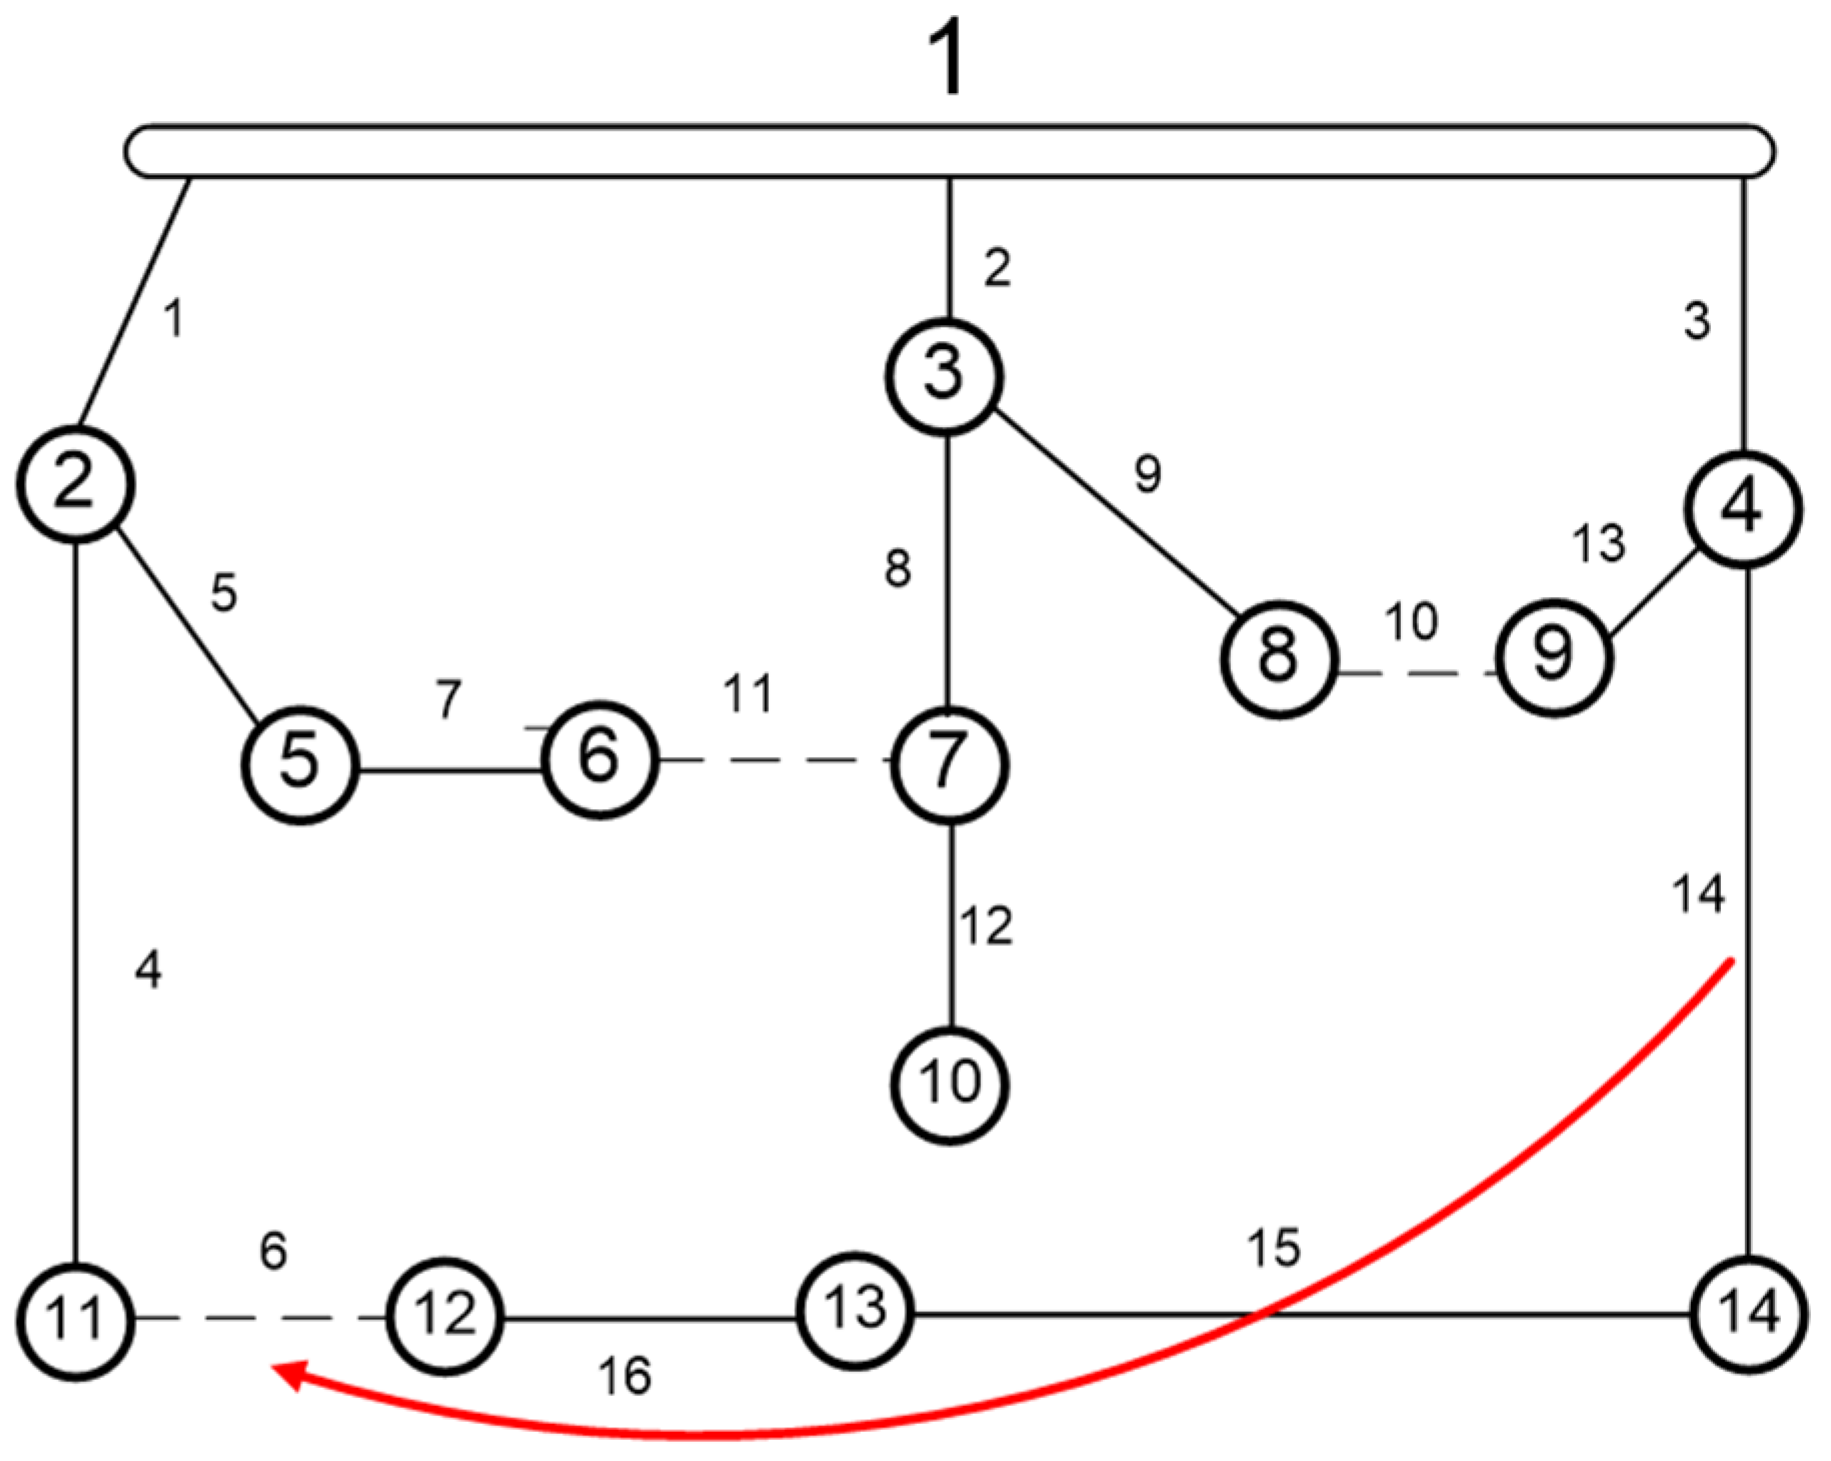
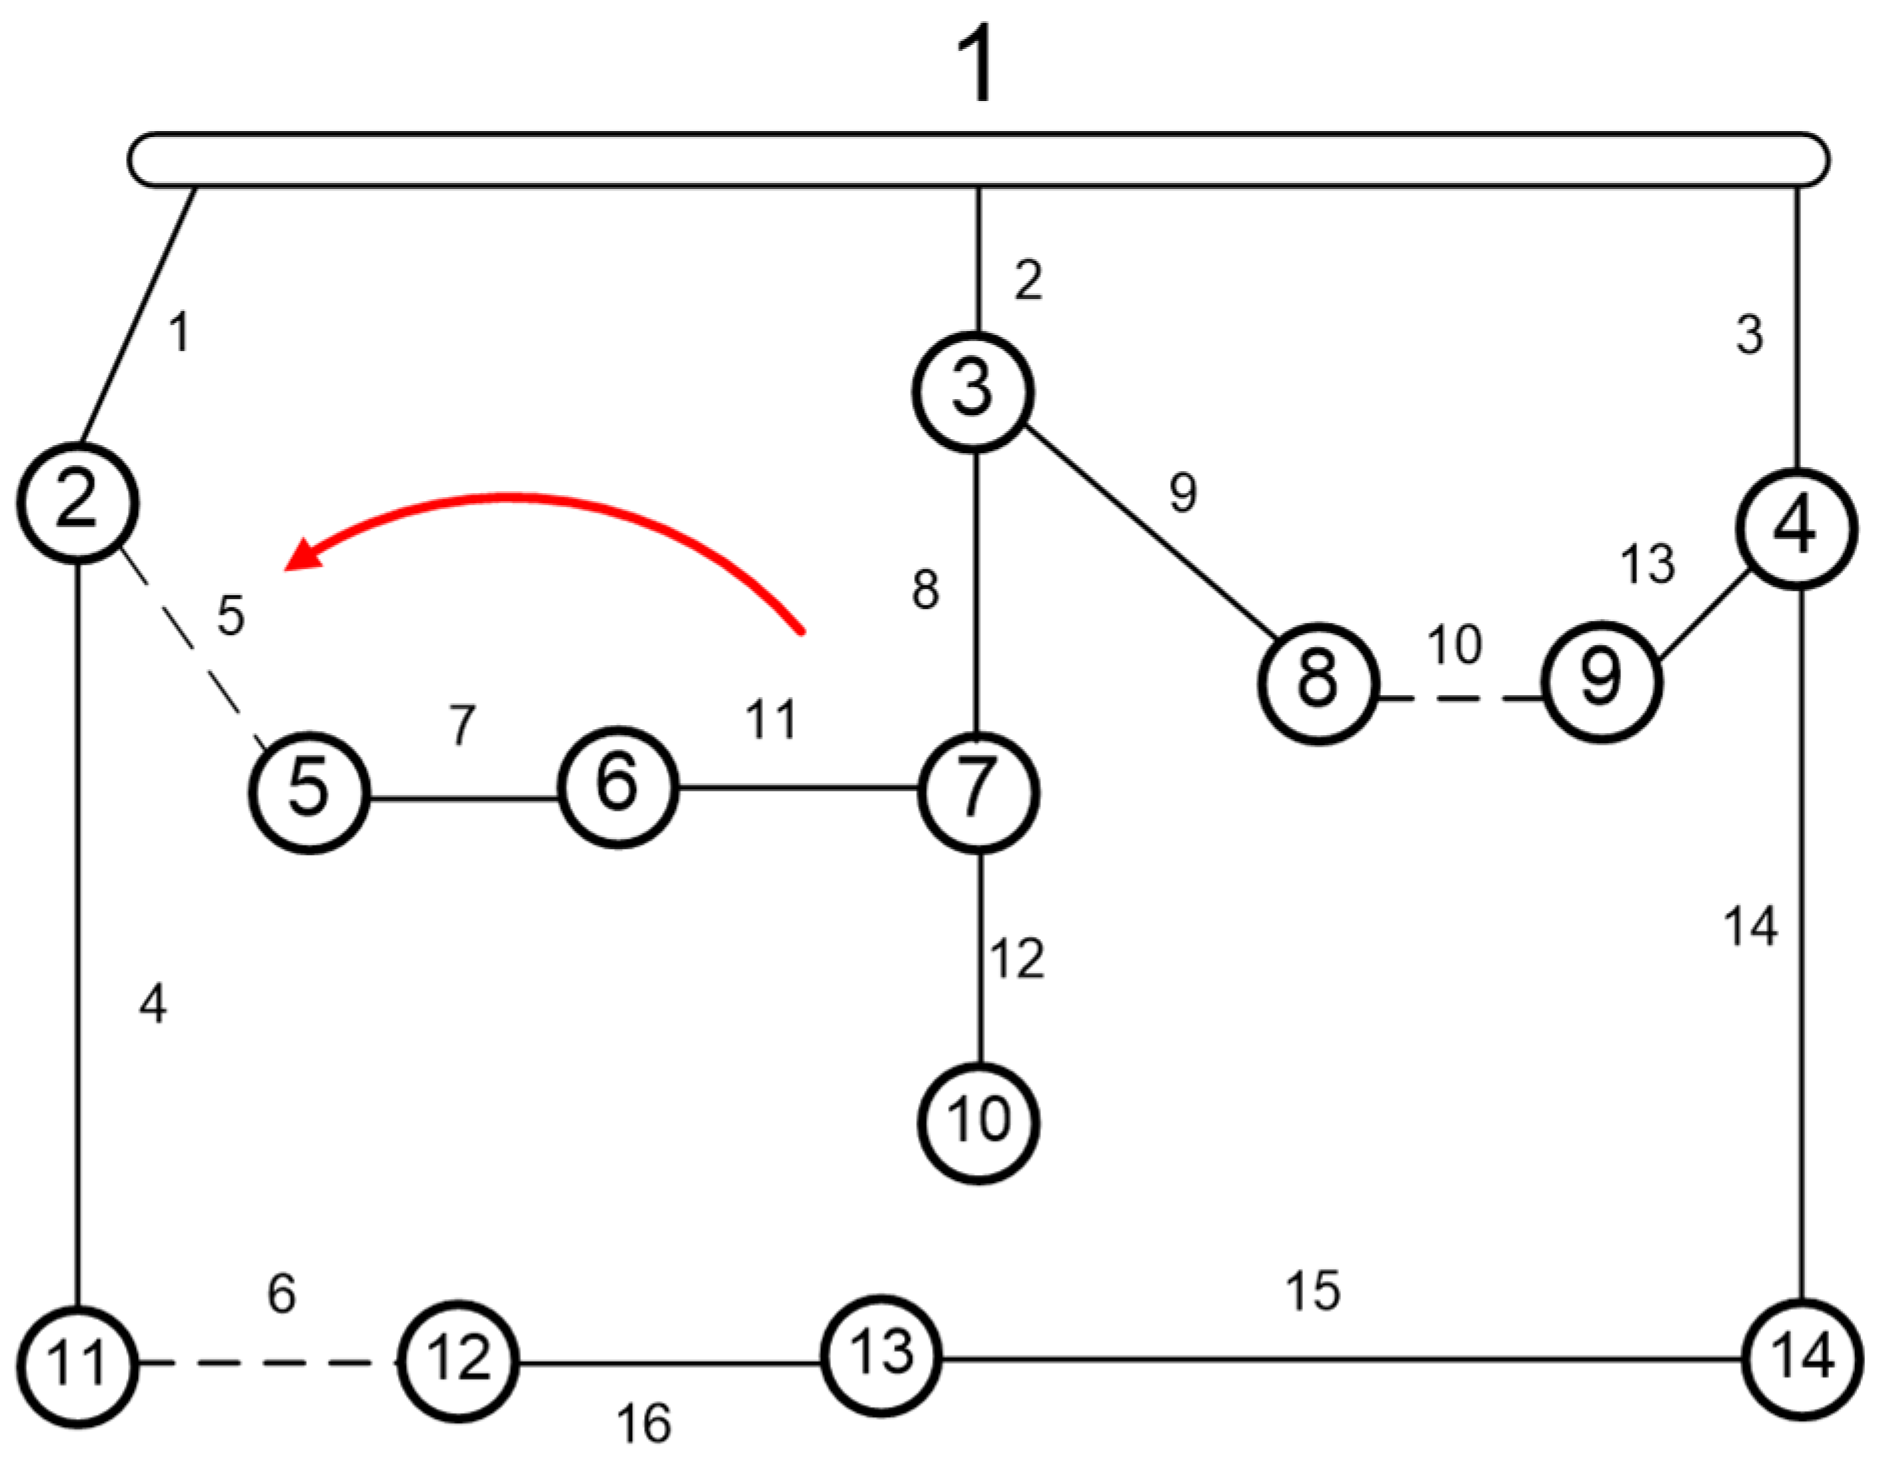
According to the power flow and the evaluation of the objective functions, the antibody given by   N 2 10 = [ 11 ,   14 ,   10 ] has a low affinity. Similar to the previous test, an element is selected randomly (for example, switch 14) and closed, creating the loop set L = [ 1 ,   4 ,   6 ,   16 ,   15 ,   14 ,   3 ] . The previous current values [ I 14   , I 15 , I 16 , I 3 , I 6 , I 4 , I 1 ] are obtained for the N 2 10 configuration and ordered from the lowest to highest ( I 14 = 0 ) . Next, Equation (14) is applied; then, an opening probability is obtained for each loop switch as follows: ρ 1 = [ ρ 1 , ρ 4 , ρ 6 , ρ 3 , ρ 16   , ρ 15 , ρ 14 ] , ( ρ 14 = 0 ) . Afterward, using ρ set, an opening switch is performed (for example, switch 6); then, a new configuration (Figure 8) is given by   N 2 10 * = [ 11 , 6 ,   10 ] (small affinity implies a big change in configuration). Applying Equation (15) successively (at random) yields one or more mutations on this antibody. In this example, a successive mutation is applied, closing one switch of   N 2 10 * set at random and opening another loop switch at random as well, yielding the new antibody given by   N 2 10 * * = [ 5 , 6 ,   10 ] , shown in Figure 9, which determines a configuration with the greatest and most viable modification compared to the previous   N 2 10 * configuration.
Thus, a strong mutation was carried out due to a significant change in the initial configuration. As a result, this global search strategy is the most effective resource compared with entirely random mutations.
For antibodies with higher affinity, opening a switch with low currents in the previous configuration will cause a small change in the configuration and, finally, antibody affinity. This action creates a minor computational effort by power flow calculation in the next iteration and favors the local search for the optimal solution. For less affine antibodies, opening the higher current switch is favorable to the global search, and applying successive mutations avoids the loss of solutions with overloaded configurations and high losses. Furthermore, this strategy does not require a high additional cost since the power flow calculation is performed every iteration (for objective function evaluation) and the equations are simple.
For comparison purposes, the algorithm proposed EAIS was compared with an algorithm AIS similar to [3,26], developed in this work.

6. Simulations

This section presents simulation results in three test systems, 33, 84, and 136 buses, to reduce losses. The results of the proposed EAIS algorithm were compared with other AIS strategies. In addition to comparing with other AIS proposals, the simulations were compared against other references regarding the resulting optimal value. Moreover, simulations in a 136-bus system to minimize power losses and improve feeder load balance and voltage deviation (multi-objective case) were carried out. Five scenarios were elaborated, two of them considering DG.
The simulations were developed in MATLAB R.17 using an Intel i7 quad-core processor computer with 8 GB of RAM.

6.1. Bus System

This system is initially employed in [12,13,14,19,27,28,34,35], where it included five tie switches (open switches) on the initial configuration (switches from 33 to 37) with power loss of 202.68 kW. The values of β = 0.5, N = 30, α = 1, δ = 0.66 were chosen. The maximum number of iterations was 20.
The results are shown in Table 1, and the convergence is represented in Figure 10a for the AIS algorithm and in Figure 10b for EAIS proposed method. Note the reduction of time and iterations convergence to 50% of the AIS approach.

6.2. 84-Bus System

An 11.40 kV 84-bus radial electrical distribution test system [7,14,27] was used, which included 13 tie switches (open switches) on the initial configuration (switches from 84 to 96) with a power loss of 531.90 kW. The results are shown in Table 2, and the convergence is represented in Figure 11a for the AIS algorithm and in Figure 11b for the EAIS proposed algorithm with 10 simulations. The values of β = 0.5, N = 40, α = 0.5, δ = 0.8 were chosen. The maximum number of iterations was 30. Thus, in the next tables, the same configuration as in AIS was used.
With EAIS, the time and iterations were reduced approximately to 40% of the initial value. These results were significantly better than the convergence time in the 84-bus system.

6.3. 136 Bus System

A 13.8 kV test system with 136 buses and 156 branches was also employed [7,13,23,35]. The initial power loss was 320.36 kW. For this case, the total load demand was 18,313.8 kW and 7932.5 kVAr. The results are shown in Table 3, the AIS algorithm convergence is represented in Figure 12a, and the proposed method convergence is shown in Figure 12b.
We used the values of β = 0.3, N = 50, α = 2, and δ = 0.8. The maximum number of iterations was 120.
Similar results were obtained with the help of the 136-bus system since approximately 42% of the initial time and iterations were observed. Figure 12a,b show the iteration process.

6.4. Multi-Objective Approach with Fuzzy Logic to the 136-Bus System

For the case of multi-objective optimization, Equation (15), five scenarios detailed in Table 4 were analyzed. The convergence is shown in Figure 13 We used β = 0.3, N = 50, α = 2, and δ = 0.8. The maximum number of iterations was 120.
In scenario 1, the original system without distributed generation was analyzed, and the weights w1 = 1, w2 = 0, and w3 = 0 were used, equivalent to the loss reduction of the previous section. Note that in Figure 13, the convergence was improved using fuzzy logic.
In scenarios 2 and 3, the multi-objective optimization with different weights in the original system without DG was studied.
In scenario 4, DG was introduced on five buses for multi-objective reconfiguration. In scenario 5, the optimal location of DG and multi-objective reconfiguration were added to the problem simultaneously; for each DG, four possible buses were candidates to host it. The original 136-bus system was modified in such a way that 5 buses and 20 additional branches were added to the system (now with 141 buses and 176 branches). This methodology can be applied to a larger number of DGs and connection buses to optimize the reconfiguration and location of DGs simultaneously.
The convergence of the fitness function is shown in Figure 13a for each scenario; the maximum convergence time was given for scenario 6 with 172 sec and 26 iterations. Figure 13b shows the loss results obtained in the optimization for each scenario. A notable improvement was noted with the introduction of DGs, and their optimal location was carried out simultaneously.
The results of the load balance between feeders are shown in Figure 14a, whereas the voltage drop optimization is shown in Figure 14b. The introduction of DGs clearly improved the results.
The results of scenario 6 are presented in Table 5, including the optimal location of the DGs.
There was a noticeable improvement in the voltage and the current balance with a significant loss reduction.
These advantages could improve the performance of variable loads and distributed generation simulations approaches similar to [38]. This is possible due to the robustness and computational improvements introduced.
Such improvements make it possible to study a system in a more realistic way, contributing to the precision of the results and state of the art. It is important to remember that the power flow must be calculated in each iteration, which is the main consumer of computational resources. The power flow in a realistic system includes complex mathematical models of the line, transformer, and other distribution power system equipment; this complexity contributes to the increasing computational efforts. However, this precision implies that the results obtained are more in line with reality. This method demonstrates that even using a more complex and complete model, the optimization results are satisfactory, and the time used is reasonable for real-time use.

7. Conclusions

This paper proposes an Enhanced Artificial Immune Systems (EAIS) algorithm with an intelligent mutation approach with a probability related to the current of each branch. This strategy reduces the search space and avoids the power flow calculation in overloaded configurations as much as possible, lowering the computational cost.
The proposed method was compared with an AIS algorithm. Unlike the AIS method, EAIS uses a mutation probability proportional to the branch current. The results obtained were satisfactory, with test systems of 33, 84, and 136 buses, reducing approximately 50% of the time and the convergence of the iteration and making the search for the optimal DSR much more efficient.
The proposed fuzzy logic multi-objective optimization offers excellent results. Moreover, the modeling also allows the incorporation of the optimal location or operation of DGs simultaneously with the reconfiguration.
Subsequently, the validated tool was applied to a real system with a mono-objective approach for loss reduction and a multi-objective to reduce losses, load balance between feeders, and voltage deviation, obtaining satisfactory results.
As mentioned, this methodology allows the use of a complete mathematical model of the electrical network (it could include variable load and distributed generation), which contributes to the precision of the results. In relation to the computational effort, it is possible to conclude that the simulation is reasonable for real-time operation.
The results demonstrate the effectiveness of the algorithm applied to real-time systems with DGs. The study can be extended to applications with electric vehicles and demand prediction in order to schedule daily operations in real systems to achieve energy optimization, thus optimizing the number of daily configuration changes. This would be the next step to continue the investigation.

Author Contributions

Conceptualization, G.A. and R.F.A.; methodology, G.A. and R.F.A.; software, G.A. and R.F.A.; validation, R.F.A., A.C.Z.Z.D.S. and W.F.; formal analysis, G.A., R.F.A., A.C.Z.Z.D.S. and W.F.; investigation, G.A., R.F.A., A.C.Z.Z.D.S. and W.F.; resources, G.A.; data curation, G.A., R.F.A., A.C.Z.Z.D.S. and W.F.; writing—original draft preparation, G.A., R.F.A., A.C.Z.Z.D.S. and W.F.; writing—review and editing, A.C.Z.Z.D.S. and W.F.; visualization, A.C.Z.Z.D.S. and W.F.; supervision, A.C.Z.Z.D.S. and W.F.; project administration A.C.Z.Z.D.S.; funding acquisition, A.C.Z.Z.D.S. All authors have read and agreed to the published version of the manuscript.

Funding

This research received no external funding.

Data Availability Statement

Not applicable.

Conflicts of Interest

The authors declare no conflict of interest.

References

  1. Duan, D.-L.; Ling, X.-D.; Wu, X.-Y.; Zhong, B. Reconfiguration of distribution network for loss reduction and reliability improvement based on an enhanced genetic algorithm. Int. J. Electr. Power Energy Syst. 2015, 64, 88–95. [Google Scholar] [CrossRef]
  2. Abdelaziz, M. Distribution network reconfiguration using a genetic algorithm with varying population size. Electr. Power Syst. Res. 2017, 142, 9–11. [Google Scholar] [CrossRef]
  3. Alonso, F.R.; Oliveira, D.Q.; de Souza, A.C.Z. Artificial Immune Systems Optimization Approach for Multiobjective Distribution System Reconfiguration. IEEE Trans. Power Syst. 2014, 30, 840–847. [Google Scholar] [CrossRef]
  4. SSouza, S.S.; Romero, R.; Pereira, J.; Saraiva, J.T. Artificial immune algorithm applied to distribution system reconfiguration with variable demand. Int. J. Electr. Power Energy Syst. 2016, 82, 561–568. [Google Scholar] [CrossRef] [Green Version]
  5. Ferrero, S.; Freschi, F.; Pons, E.; Repetto, M. Application of vector immune system to distribution network reconfiguration. Int. J. Numer. Model. Electron. Netw. Devices Fields 2017, 32, e2262. [Google Scholar] [CrossRef]
  6. Qi, Q.; Wu, J.; Long, C. Multi-objective operation optimization of an electrical distribution network with soft open point. Appl. Energy 2017, 208, 734–744. [Google Scholar] [CrossRef]
  7. Li, Z.; Jazebi, S.; de Leon, F. Determination of the Optimal Switching Frequency for Distribution System Reconfiguration. IEEE Trans. Power Deliv. 2016, 32, 2060–2069. [Google Scholar] [CrossRef]
  8. Gutiérrez-Alcaraz, G.; Tovar-Hernández, J.H. Two-stage heuristic methodology for optimal reconfiguration and Volt/VAr control in the operation of electrical distribution systems. IET Gener. Transm. Distrib. 2017, 11, 3946–3954. [Google Scholar] [CrossRef]
  9. Kothona, D.; Bouhouras, A.S. A Two-Stage EV Charging Planning and Network Reconfiguration Methodology towards Power Loss Minimization in Low and Medium Voltage Distribution Networks. Energies 2022, 15, 3808. [Google Scholar] [CrossRef]
  10. Durango-Flórez, M.; González-Montoya, D.; Trejos-Grisales, L.A.; Ramos-Paja, C.A. PV Array Reconfiguration Based on Genetic Algorithm for Maximum Power Extraction and Energy Impact Analysis. Sustainability 2022, 14, 3764. [Google Scholar] [CrossRef]
  11. Yang, B.; Zeng, C.; Li, D.; Guo, Z.; Chen, Y.; Shu, H.; Cao, P.; Li, Z. Improved immune genetic algorithm based TEG system reconfiguration under non-uniform temperature distribution. Appl. Energy 2022, 325, 119691. [Google Scholar] [CrossRef]
  12. Kumar, P.; Ali, I.; Thomas, M.S.; Singh, S. Imposing voltage security and network radiality for reconfiguration of distribution systems using efficient heuristic and meta-heuristic approach. IET Gener. Transm. Distrib. 2017, 11, 2457–2467. [Google Scholar] [CrossRef]
  13. Nguyen, T.T.; Nguyen, T.T.; Truong, A.V.; Nguyen, Q.T.; Phung, T.A. Multi-objective electric distribution network reconfiguration solution using runner-root algorithm. Appl. Soft Comput. 2017, 52, 93–108. [Google Scholar] [CrossRef]
  14. Ahmadi, H.; Marti, J.R. Distribution System Optimization Based on a Linear Power-Flow Formulation. IEEE Trans. Power Deliv. 2014, 30, 25–33. [Google Scholar] [CrossRef]
  15. López, J.C.; Lavorato, M.; Rider, M.J. Optimal reconfiguration of electrical distribution systems considering reliability indices improvement. Int. J. Electr. Power Energy Syst. 2016, 78, 837–845. [Google Scholar] [CrossRef]
  16. Pareja, L.A.G.; López-Lezama, J.M.; Carmona, O.G. A Mixed-Integer Linear Programming Model for the Simultaneous Optimal Distribution Network Reconfiguration and Optimal Placement of Distributed Generation. Energies 2022, 15, 3063. [Google Scholar] [CrossRef]
  17. Ferdavani, A.K.; Zin, A.A.M.; Khairuddin, A.; Naeini, M.M. Reconfiguration of distribution system through two minimum-current neighbour-chain updating methods. IET Gener. Transm. Distrib. 2013, 7, 1492–1497. [Google Scholar] [CrossRef]
  18. Kazemi-Robati, E.; Sepasian, M.S. Fast heuristic methods for harmonic minimization using distribution system reconfiguration. Electr. Power Syst. Res. 2020, 181, 106185. [Google Scholar] [CrossRef]
  19. Narimani, M.R.; Vahed, A.A.; Azizipanah-Abarghooee, R.; Javidsharifi, M. Enhanced gravitational search algorithm for multi-objective distribution feeder reconfiguration considering reliability, loss and operational cost. IET Gener. Transm. Distrib. 2014, 8, 55–69. [Google Scholar] [CrossRef]
  20. Pamshetti, V.B.; Singh, S.; Singh, S.P. Combined Impact of Network Reconfiguration and Volt-VAR Control Devices on Energy Savings in the Presence of Distributed Generation. IEEE Syst. J. 2020, 14, 995–1006. [Google Scholar] [CrossRef]
  21. Akrami, A.; Doostizadeh, M.; Aminifar, F. Optimal Reconfiguration of Distribution Network Using μ PMU Measurements: A Data-Driven Stochastic Robust Optimization. IEEE Trans. Smart Grid 2019, 11, 420–428. [Google Scholar] [CrossRef]
  22. Shaheen, A.M.; El-Sehiemy, R.A.; Kamel, S.; Elattar, E.E.; Elsayed, A.M. Improving Distribution Networks’ Consistency by Optimal Distribution System Reconfiguration and Distributed Generations. IEEE Access 2021, 9, 67186–67200. [Google Scholar] [CrossRef]
  23. de Castro, L.; Von Zuben, F. Learning and optimization using the clonal selection principle. IEEE Trans. Evol. Comput. 2002, 6, 239–251. [Google Scholar] [CrossRef]
  24. Oliveira, D.; de Souza, A.Z.; Delboni, L. Optimal plug-in hybrid electric vehicles recharge in distribution power systems. Electr. Power Syst. Res. 2013, 98, 77–85. [Google Scholar] [CrossRef]
  25. De Oliveira, L.W.; de Oliveira, E.J.; Gomes, F.V.; Silva, I.C.; Marcato, A.L.; Resende, P.V. Artificial Immune Systems applied to the reconfiguration of electrical power distribution networks for energy loss minimization. Int. J. Electr. Power Energy Syst. 2013, 56, 64–74. [Google Scholar] [CrossRef]
  26. Kavousi-Fard, A.; Niknam, T. Optimal Distribution Feeder Reconfiguration for Reliability Improvement Considering Uncertainty. IEEE Trans. Power Deliv. 2013, 29, 1344–1353. [Google Scholar] [CrossRef]
  27. Souza, S.S.; Romero, R.; Franco, J.F. Artificial immune networks Copt-aiNet and Opt-aiNet applied to the reconfiguration problem of radial electrical distribution systems. Electr. Power Syst. Res. 2014, 119, 304–312. [Google Scholar] [CrossRef]
  28. Saffar, A.; Hooshmand, R.; Khodabakhshian, A. A new fuzzy optimal reconfiguration of distribution systems for loss reduction and load balancing using ant colony search-based algorithm. Appl. Soft Comput. 2011, 11, 4021–4028. [Google Scholar] [CrossRef]
  29. Davydenko, L.; Davydenko, N.; Bosak, A.; Bosak, A.; Deja, A.; Dzhuguryan, T. Smart Sustainable Freight Transport for a City Multi-Floor Manufacturing Cluster: A Framework of the Energy Efficiency Monitoring of Electric Vehicle Fleet Charging. Energies 2022, 15, 3780. [Google Scholar] [CrossRef]
  30. Farag, H.E.; El-Saadany, E.; El Shatshat, R.; Zidan, A. A generalized power flow analysis for distribution systems with high penetration of distributed generation. Electr. Power Syst. Res. 2011, 81, 1499–1506. [Google Scholar] [CrossRef]
  31. Cebrian, J.C.; Kagan, N. Reconfiguration of distribution networks to minimize loss and disruption costs using genetic algorithms. Electr. Power Syst. Res. 2010, 80, 53–62. [Google Scholar] [CrossRef]
  32. Vitorino, R.M.; Jorge, H.M.; Neves, L.P. Multi-objective optimization using NSGA-II for power distribution system reconfiguration. Int. Trans. Electr. Energy Syst. 2015, 25, 38–53. [Google Scholar] [CrossRef]
  33. Guan, W.; Tan, Y.; Zhang, H.; Song, J. Distribution system feeder reconfiguration considering different model of DG sources. Int. J. Electr. Power Energy Syst. 2015, 68, 210–221. [Google Scholar] [CrossRef]
  34. Andervazh, M.; Olamaei, J.; Haghifam, M. Adaptive multi-objective distribution network reconfiguration using multi-objective discrete particles swarm optimisation algorithm and graph theory. IET Gener. Transm. Distrib. 2013, 7, 1367–1382. [Google Scholar] [CrossRef]
  35. Shukla, J.; Das, B.; Pant, V. Stability constrained optimal distribution system reconfiguration considering uncertainties in correlated loads and distributed generations. Int. J. Electr. Power Energy Syst. 2018, 99, 121–133. [Google Scholar] [CrossRef]
  36. Tomoiaga, B.; Chindriş, M.; Sumper, A.; Villafafila-Robles, R.; Sudria-Andreu, A. Distribution system reconfiguration using genetic algorithm based on connected graphs. Electr. Power Syst. Res. 2013, 104, 216–225. [Google Scholar] [CrossRef]
  37. Li, G.; Shi, D.; Duan, X. Multiobjective Distribution Network Reconfiguration Considering the Charging Load of PHEV. Elektronika ir Elektrotechnika 2013, 19, 21–26. [Google Scholar] [CrossRef]
  38. Zhai, H.; Yang, M.; Chen, B.; Kang, N. Dynamic reconfiguration of three-phase unbalanced distribution networks. Int. J. Electr. Power Energy Syst. 2018, 99, 1–10. [Google Scholar] [CrossRef]
Figure 1. 14-bus test system.
Energies 15 09419 g001
Figure 2. Electrical losses membership function.
Energies 15 09419 g002
Figure 3. Voltage Drop membership function.
Energies 15 09419 g003
Figure 4. Flowchart algorithm.
Energies 15 09419 g004
Figure 5. Cloning-hypermutation. Local and Global Search.
Energies 15 09419 g005
Figure 6. 14 Bus Test System. Initial Configuration N 2 1 = [ 9 , 11 , 16 ] .
Energies 15 09419 g006
Figure 7. Mild Mutation—Higher-Affinity Antibodies N 2 1 = [ 9 , 11 , 16 ] N 2 1 * = [ 9 , 7 , 16 ] .
Energies 15 09419 g007
Figure 8. Strong Mutation—Low-Affinity Individuals N 2 10 = [ 11 , 14 , 10 ] N 2 10 * = [ 11 , 6 , 10 ] .
Energies 15 09419 g008
Figure 9. Successive mutation linked to Strong Mutation N 2 10 * = [ 11 , 6 , 10 ] N 2 10 * = [ 5 , 6 , 10 ] .
Energies 15 09419 g009
Figure 10. Loss reduction Objective Function convergence—33-bus system: (a) AIS; (b) EAIS.
Energies 15 09419 g010
Figure 11. Loss reduction Objective Function convergence—84-bus system: (a) AIS; (b) EAIS.
Energies 15 09419 g011
Figure 12. Loss reduction Objective Function convergence—136-bus system: (a) AIS; (b) EAIS.
Energies 15 09419 g012
Figure 13. (a) Convergence of the fitness function for each scenario. (b) Loss Reduction Objective Function.
Energies 15 09419 g013
Figure 14. (a) Load Balancing Objective Function for each scenario. (b) Voltage Drop Objective Function.
Energies 15 09419 g014
Table 1. 33 Bus System Loss Reduction.
Ref.Open SwitchLoss (kW)Average Convergence Time (s)Average Convergence Iteration
33–34–35–36–37202.68datadata
AIS7–9–14–32-37139.550.848.1
7–9–14–32–37139.55datadata
[1,2,7,8,15,17,18,20,24,28,30,33,36,37]7–9–14–32–37139.550.414.4
Table 2. 84 Bus System Loss Reduction.
Ref.Open SwitchLoss (kW)Average Convergence Time (s)Average Convergence Iteration
Initial84–85-85–87-88–89-90–91-92–93-94–65-96531.90
AIS7–13-34–39-42-55–62-72–83-86–89-90–92469.882 20.5
EAISsame469.880.85.8
[7,13,23]Same469.88-----------------
Table 3. 136-Bus System Loss Reduction.
Ref.Open SwitchLoss (kW)Average Convergence Time (s)Average Convergence Iteration
Initial136–137–138–139–140–141–142–143–144–145–146–147–148–149–150–151–152–153–154–155–156320.3
AIS7–35–51–90–96–106–118–126–135–137–138–141–142–144–145–146–147–148–150–151–155280.193868
EAISSame280.191631
[14,19,25].Same280.19-------------------
Table 4. 136 Bus System Scenarios.
w1, w2, w3DG1
200 kW
100 kVAr
DG2
200 kW
100 kVAr
DG3
200 kW
100 kVAr
DG4
200 kW
100 kVAr
DG5
200 kW
100 kVAr
11, 0, 0xxxxx
20.4, 0.3, 0.3xxxxx
30.8, 0.1, 0.1xxxxx
40.8, 0.1, 0.1bus 20bus 30Bus 42Bus 50Bus 80
50.8, 0.1, 0.1possible bus
20,21,22,23
possible bus
30,31,32,33
possible bus
42,43,44,45
possible bus
50,51,52,53
possible bus
80,81,82,83
Table 5. Scenario 6 Results.
Open SwitchDG Location
Bus
Loss
kW
Feeder- (Branches) Current (pu) Maximum Load
Unbalance
Voltage
Minimum (pu)
7–9–38–51–106–118–126–128–138
141–142–144–145 146–147–148–149 150–151–152–156
23–33–44–53–82246,151-(1)
2-(17)
3-(39)
4-(63)
5-(75) 6-(85)
7-(99)
0.0243
0.0308
0.0196
0.0179
0.0305
0.0184
26%0.9678
Publisher’s Note: MDPI stays neutral with regard to jurisdictional claims in published maps and institutional affiliations.