Abstract
A special experimental setup with a three-electrode discharge gap was used to study the dynamic characteristics of the ultra-high- and super-high-frequency (UHF-SHF) electromagnetic radiation of a high-voltage discharge having the streamer form with reference to the dynamics of individual streamers at the nanosecond time resolution. We performed synchronous detection of the radiation waveforms using a wideband horn antenna, on the one hand, and high-speed photography of the discharge development in the discharge gap using an ICCD camera, on the other hand. It was found that the high-voltage discharge is a source of radiation in the frequency band up to 10 GHz, which is a series of individual ultrawideband (UWB) bursts having durations of less than 1 ns and leading fronts less than 100 ps long and appears when the streamers moving from the discharge anode (thin wire) meet the discharge cathode (plane). By the order of magnitude, the number of radiation bursts corresponds to the number of streamers that reach the electrode, according to the high-speed photography data. The qualitative data confirmed by simple theoretical estimations show that the sources of UWB radiation pulses are individual streamers at the moment of their contact with the electrode, and the radiation of the streamers can be regarded as transition radiation.
1. Introduction
High-frequency radiation of high-voltage discharges in their different forms and stages is of great interest as a source of diagnostic information about the dynamics of the current and the electric field during a breakdown [1,2,3], an indicator of the discharge on high-voltage power lines [4], and as a negative factor affecting electronic systems of different purposes [5,6,7]. The radiation at frequencies of up to tens of megahertz is often used currently in the studies of high-voltage discharges, including lightning discharges [8,9,10,11]. The higher-frequency gigahertz range corresponding to the ultra-high-frequency (UHF) and super-high-frequency (SHF) bands (0.3–3 GHz and 3–30 GHz, respectively) has been less well studied experimentally. A conventional notion is that in the case of a high-voltage air breakdown, the key role in the generation of the UHF-SHF components of electromagnetic radiation is played by streamers, i.e., plasma structures produced by individual electron avalanches and moving at high velocities (10–100 km/s), see [12,13,14,15,16] and references therein.
Recent publications have presented numerical calculations and analytical estimations of the waveforms of radiation of the streamers, which are essentially ultrawideband electromagnetic pulses (UWB EMP) with subnanosecond durations and can occur in a discharge, e.g., due to sharp short-time current steps produced by colliding streamers [17,18]. Detailed experimental studies in this field present severe difficulties, mainly due to the necessity of using special high-voltage setups, high-speed oscillography and photography equipment operating in the picosecond shutter speed range, and special field sensors that allow one to reproduce waveforms of gigahertz signals without significant distortions [19]. The experiments performed to measure the waveforms of the pulsed gigahertz radiation generated by high-voltage discharges at the streamer propagation stage are rather few and have been performed in recent years only [20,21].
A complex of physical setups has been established in the high-voltage test center “VNIC 900” (Istra, Moscow Oblast, Russia) in order to model high-voltage discharges and study the electromagnetic radiation in various frequency ranges, which accompanies the evolution of such discharges. A special setup, which makes it possible to initiate a high-voltage streamer discharge, which does not pass over to an arc discharge, in the pulse-periodic regime is used to study the properties of streamers [22]. This paper presents the results of the first experimental study of the dynamic properties of the UHF radiation of a streamer discharge with a nanosecond time resolution that allows one to resolve the fine radiation structure and the processes related to the propagation of individual streamers.
2. Materials and Methods
The diagram of the setup for studying the streamer discharge under the air pressure is shown in Figure 1. A discharge develops between two parallel metal wires with identical potentials (anode) and a metal plane (cathode). The diameter of the wires is 0.5 mm and their length is 28 cm. The wires are suspended at a height of 5 cm above a metal plane and the distance between the wires is 6 cm. This setup is used in various atmospheric pressure plasma experiments [22].
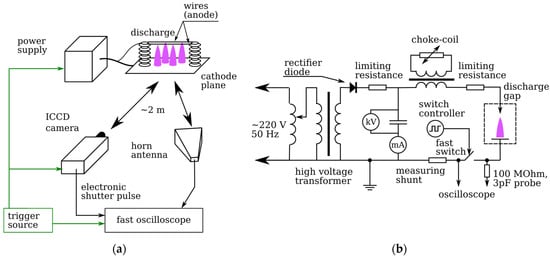
Figure 1.
Experimental setup. (a) Block diagram of the setup. (b) Block diagram of the power supply of the high-voltage discharge.
The discharge ignition method is described in detail in [22,23,24]. The voltage generated by a high-voltage source (25–45 kV) is applied between the wires (anode) and the ground (Figure 1b). The plane acting as the second electrode (cathode) is kept under the floating potential before the discharge. The discharge ignition is a result of the fast switching of the cathode plane to the ground using the TGI-500/16 pulsed thyratron. When the thyratron opens, the charge from the cathode plane goes to the ground in the form of a current pulse. The potential of the cathode plane drops, as shown in Figure 2, while the potential drop between the cathode and the anode, held at a constant high voltage, increases rapidly. The potential drop between the anode and the cathode reaches the value at which streamers start, just as the current peaks between the cathode and the ground. The potential of the insulated cathode plane is measured by means of a high-impedance probe, and the current is detected with a low-inductance shunt with a resistance of 1 Ohm. The discharge is ignited in the pulse-periodic regime at a frequency of 500 Hz–2 kHz.
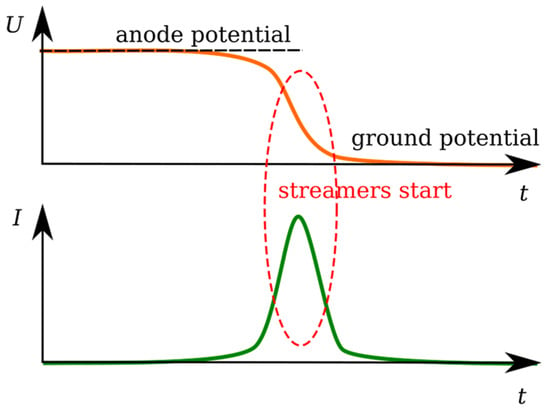
Figure 2.
Schematic representations of waveforms of cathode voltage () with respect to ground and current () in the cathode-to-ground circuit.
In the course of the experiments, the microwave radiation of the discharge was received by a P6-23M vertically polarized wideband (0.8–18 GHz) horn antenna and recorded by a LeCroy WaveMaster oscilloscope with a bandwidth of 16 GHz and a sampling rate of 40 GHz. A radioabsorbing material based on a Mylar film was used to prevent reflections of electromagnetic waves from the details and equipment of the experimental setup. The discharge was photographed with a 4Picos ICCD fast shutter camera, which had a delay time determined by an external trigger. The camera formed a strobe signal corresponding to the opening of the electronic shutter, which was also recorded by an oscilloscope in order to ensure the exact association of the photography results with the results of the electromagnetic measurements with nanosecond accuracy. The experimental equipment was looped in a synchronization/trigger circuit. The distances from the discharge gap to the objective lens of the ICCD camera and the antenna aperture were measured with an accuracy of up to 1 cm. The delays during the propagation of signals through the cables were also calibrated. This ensured accurate time referencing of the results of measuring the microwave radiation and the discharge current and the photography data.
3. Results
In the course of the experiments, a streamer discharge was ignited in the air under normal conditions. The voltage between the anode and the grounding loop varied from 35 to 38 kV, and the repetition rate of the discharge pulses was 1 kHz. The discharge starts to develop in several tens of nanoseconds after the opening of the thyratron switch. The potential difference between the electrodes (the wire and the plane) amounts to tens of kilovolts at the breakdown instant. The discharge starts from the anode, i.e., the positive (anode-type) version of the streamer discharge is observed in the experiment. Figure 3 shows the photos of the discharge gap made at different time moments. The photos were obtained in different discharges. Their comparison is possible due to the quite good repeatability of the process. The camera looks at the discharge gap strictly horizontally. The cathode is oriented orthogonally to the plane of the frame, and the anode wires are almost at the same level, so it is impossible to distinguish streamers starting from the first wire from streamers starting from the second wire. The 0 ns time instant corresponds to the current growth front in the cathode–ground circuit at a level of 1/3 of the maximum current value. The photo shutter speed was 10 ns. In 20–25 ns after the current growth start, glowing appears in the vicinity of the wire anode. The boundary of the glowing streamer region starts moving towards the cathode. Heads of individual streamers become visible at the 50–60 ns time interval. Several tens of streamers cross the anode–cathode gap during approximately 100 ns. The first streamers reach the cathode at the 130 ns time instant. The process of the streamer “landing” on the cathode ends at 170 ns. At the same instant, the next (second) wave of streamers start from the wire anode.
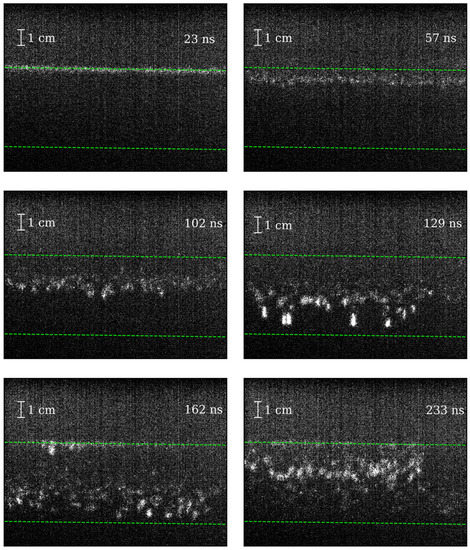
Figure 3.
Photos of the streamer discharge taken at various delays relative to the front edge of the current pulse (shown in the margins of the photos). The green dashed line marks the positions of the anode (top) and cathode (bottom). The anode-to-ground potential difference is 35 kV.
The series of shots taken in different discharge pulses with the delays increasing with an increment of about 10 ns have been generalized in the form of a diagram presented in Figure 4a. Shades of grey show the integral brightness found by summing the pixel brightness along each of the horizontal rows of the camera matrix which correspond to different values of the height above the plane. The time and the height above the plane are plotted along the x and y axes, respectively. The diagram shows that the discharge starts developing at the instant when the current running from the cathode to the ground is maximum (Figure 4c). The presented diagram allows us to estimate the velocity of the streamers. At the initial stage of the motion of the first wave of the streamers, their velocity is 1.5 × 107 cm/s. Then, the streamers accelerate and reach the cathode with a velocity of about 5 × 107 cm/s. The second streamer wave moves more uniformly at a characteristic velocity of 2.5 × 107 cm/s. Note that according to the photography data obtained, the heads of the second streamer wave do not reach the cathode, since these streamers seem to “disperse” in the near-electrode space (see Figure 4a).
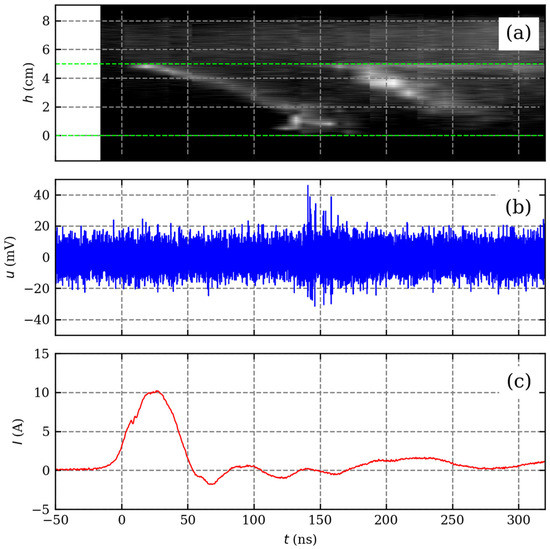
Figure 4.
(a) Diagram representing the time dependence of the integral intensity of the discharge glowing at specified heights over the cathode; (b) waveform of the signal registered with horn antenna; and (c) waveform of the current running from the cathode to the ground. The potential difference between the anode and the ground is 35 kV.
Figure 4b shows a typical waveform of the signal received by the horn antenna. The waveform demonstrates the appearance of the noise pulse packet, which is related to the discharge, in the time interval where the streamers interact with the cathode (130–160 ns). The increase of the anode voltage to 38 kV leads to an increase in the streamer’s velocity. In this case, the first streamers reach the cathode at a time moment of about 100 ns. The intensity of the electromagnetic pulse signals rises as the voltage in the gap increases, and no qualitative variation of the physical scenario of the phenomenon (the discharge beginning at the current maximum instant, accelerated motion of the streamer heads, electromagnetic noise generation during the contact of the streamers with the cathode, and formation of the second streamer wave) is observed.
Analysis of the waveforms shows that the considered pulse package is formed by short subnanosecond bursts with front edges with a duration as low as 25 ps, which is limited practically by the sampling frequency of the oscilloscope channels. The bursts are quite well separated in time and follow a sufficiently high duty cycle of about 10 (see Figure 5). The burst character of the radiation is confirmed by the results of treating the signal with a continuous wavelet transform using the Ricker wavelet (also referred to as the “Mexican hat wavelet”) [25]. The scalogram of the signal shown in Figure 5a consists of separate peaks in a wide range of wavelet scales, τ = 0.2–0.8 ns, with pauses in between. A typical example of the frequency spectrum of an individual subnanosecond pulse is shown in Figure 6a. The spectrum occupies a frequency band of up to 10 GHz at least, and the spectrum maximum falls at approximately 2.5 GHz. In general, the power spectral density (PSD) of the noise signal formed by a sequence of electromagnetic pulses (Figure 6b) repeat generally the properties of the spectrum of an individual burst. The radiation spectrum fits in the interval up to 10 GHz, and the main radiation power is concentrated in the 1–4 GHz range.
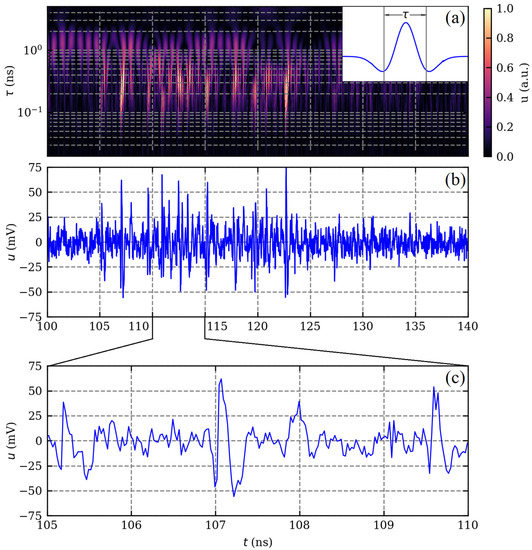
Figure 5.
(a) Scalogram of a package of radiation pulses received by the horn antenna. The inset shows the Ricker wavelet with the width τ. (b) Waveform of the signal, which was used to the scalogram. (c) Blow-up of the section of the waveform, which demonstrates individual radiation pulses. The anode voltage is 38 kV.
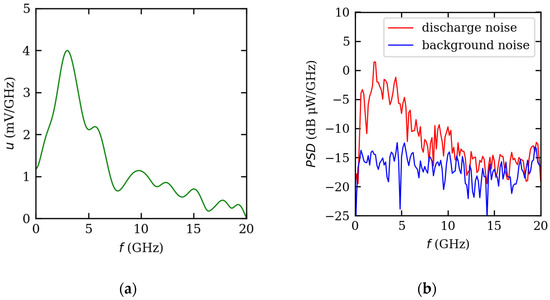
Figure 6.
(a) Typical voltage spectrum of an individual radiation pulse. (b) Power spectral density of a package of UHF-SHF pulses. Background noise presented as a reference was obtained from the sections of the antenna waveforms taken before the beginning of the streamer discharge process. The anode voltage is 38 kV.
We shall present now some statistical characteristics of the pulsed radiation, which were obtained in 40 realizations at two values of the discharge voltage, 35 kV and 38 kV. The results of the statistical analysis are shown in Figure 7. The average number of pulses in the package is 15 for 35 kV and 17 for 38 kV.
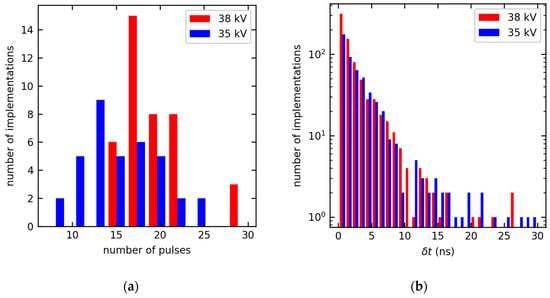
Figure 7.
(a) Distribution of the number of the subnanosecond pulses detected in each discharge realization. The red and blue colors correspond to the results of the experiments, in which the anode voltage was 38 kV and 35 kV, respectively. (b) Distribution of the repetition intervals of the radiation pulses at the same values of the voltage.
A smaller number of the radiation pulses detected at a voltage of 35 kV may be due to a decrease in their amplitude when some of the pulses are not resolved against the background of the inherent noise of the oscilloscope. The pulse repetition intervals δt are distributed in accordance with the exponential law with the characteristic value of the interval between two consequent pulses being equal to approximately 3 ns.
4. Discussion
The obtained results indicate clearly that the generation of subnanosecond radiation pulses is determined by the interaction of the streamers with the cathode of the high-voltage discharge. First, the pulses are detected within the time period, when the streamers “land” on the cathode. Second, the number of pulses observable in the package coincides with the number of streamers that can be seen in the photos of the discharge with an accuracy of up to the second order of magnitude. It should be taken into account here that not all pulses can be resolved in waveforms due to the noise of the receiving line. In particular, fewer pulses in the experiments with an anode voltage of 35 kV can be attributed to the lower radiation amplitude (see Figure 4 and Figure 5), as compared with the experiments performed at a voltage of 38 kV.
The results of the high-frequency measurements allow us to estimate the quantitative parameters of the sources of subnanosecond pulses. We assume that the pulsed antenna current exciting the radiation pulses is localized inside the discharge gap. For the central radiation frequency, being about 2.5 GHz (vacuum wavelength λ ~ 12 cm), the length of the entire discharge gap (5 cm) turns out to be shorter than half of the radiation wavelength (λ/2 = 6 cm), and the characteristic scale (1 cm) of the region, in which the streamers interact with the cathode, is an order of magnitude shorter than the radiation wavelength. Correspondingly, it will be reasonable to regard the radiation source as an elementary dipole when making order-of-magnitude estimations. It is known [26] that the energy flow at the wavelength λ, which is radiated by a dipole with the uniform current distribution, at the angle θ to the dipole axis is equal to
where Z0 = 120 π Ohm is the vacuum impedance, I is the current intensity, δl is the dipole length, and r is the distance to the measurement point. A power of 36 μW corresponds to a pulse with an amplitude of 60 mW in the 50 Ohm line of the receiving horn antenna. Taking into account that the direction of the antenna turns out to be nearly perpendicular to the direction of the streamer motion (θ π/2, see Figure 8b), the distance from the discharge gap to the antenna is 2.6 m, and the effective area of the horn antenna is 0.055 m2, one can estimate the moment of the radiating current as Iδl ~ 1 A·mm. This value looks feasible allowing for the fact that in terms of the order magnitude, the current in the streamer is close to 1 A and the size of the streamer head is close to 1 mm [12].
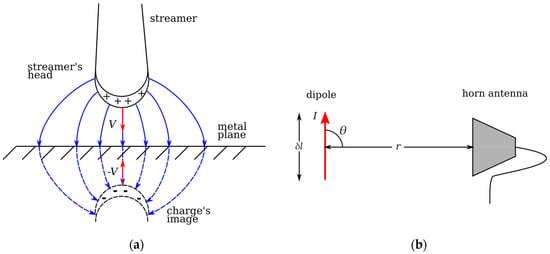
Figure 8.
(a) Scheme of formation of transition radiation when the streamer head approaches the conducting plane with the velocity V. (b) Schematic layout of the horn antenna position with respect to the radiating electric dipole with the current I and the length δl.
The most probable mechanism of excitation of UHF-SHF pulses is the transition radiation. It is known [12] that an uncompensated positive charge is concentrated on the head of the anode streamer. As the streamer approaches the cathode, a negative charge should be induced in the latter, and the electric field of the streamer head should be equal to the field of the streamer head image (Figure 8a). As a result, a nonstationary electric dipole is formed, which is the radiation source. The spatial scales of the streamers can be estimated in a sufficiently wide range, from l ~ 1 cm (the size of the visible part of the streamer channel) to l ≤ 10−3 cm (the characteristic scale of the gradient of the electron density in the streamer head [27]). Correspondingly, for the approach velocity of the streamer head and its image in the cathode, which is about 108 cm/s, the characteristic time scales of the pulsed radiation can be estimated in the range of three orders of magnitude, from 1 ps to 1 ns. The parameters of the pulsed radiation detected during the interaction of the streamers with the high-voltage discharge electrode fit these limits.
Note that the pulsed jets of charged particles from the interaction of primary streamers with a cathode [28,29,30] can also contribute to the generation of UHF-SHF radiation, which is the subject of further research.
5. Conclusions
The effect of the generation of subnanosecond electromagnetic pulses by a streamer discharge, which is ignited under the atmospheric pressure between a wire anode and a plane metal cathode, has been observed experimentally. Electromagnetic pulses, in which energy is concentrated mainly in the frequency range from 1 to 4 GHz, arise when the streamers approach the cathode plane. Most probably, the excitation of electromagnetic pulses occurs due to the transition radiation mechanism, which is related to the approach of the streamer heads to the cathode of the air gap in which the breakdown occurs. This mechanism, which is due to the interaction of the streamers with the metal conductor, can play the determining part in the formation of electromagnetic radiation of high-voltage electrode discharges, including discharges in industrial facilities, power transmission lines, and other power assets.
Author Contributions
Conceptualization, M.G. and V.S.; methodology, V.S., M.G., I.Z. and A.B.; software, I.Z.; formal analysis, M.G.; investigation, D.S., I.V., S.K., Y.K., A.N., M.N., A.O. and I.Z.; resources, P.M. and A.B.; data curation, I.Z. and I.V.; writing—original draft preparation, I.Z. and M.G.; writing—review and editing, V.S. and A.S.; visualization, S.K. and I.V.; supervision, M.G., and V.S.; project administration, N.S. and E.B.; funding acquisition, V.S. All authors have read and agreed to the published version of the manuscript.
Funding
The study was supported by a grant from the Russian Science Foundation № 19-19-00501, https://rscf.ru/project/19-19-00501/, accessed on 9 December 2022.
Data Availability Statement
Not applicable.
Conflicts of Interest
The authors declare no conflict of interest.
References
- Le Boulch, M.; Hamelin, J.; Weidman, C. UHF-VHF radiation from lightning. Electromagnetics 1987, 7, 287–331. [Google Scholar] [CrossRef]
- Bandara, S.; Marshall, T.; Karunarathne, S.; Stolzenburg, M. Electric field change and VHF waveforms of Positive Narrow Bipolar Events in Mississippi thunderstorms. Atmos. Res. 2020, 243, 105000. [Google Scholar] [CrossRef]
- Huang, B.; Zhang, C.; Zhu, W.; Lu, X.; Shao, T. Ionization waves in nanosecond pulsed atmospheric pressure plasma jets in argon. High Voltage 2021, 6, 665–673. [Google Scholar] [CrossRef]
- Xiao, X.; Hu, W.; Ran, J.; Xu, Z.; Hei, G.; Han, X.; Zhao, L. Design and optimization of detection antenna for corona discharge in high-voltage transmission lines. J. Phys. Conf. Ser. 2020, 1486, 062024. [Google Scholar] [CrossRef]
- Baum, C.E.; Breen, E.L.; Pitts, F.L.; Sower, G.D.; Thomas, M.E. The measurement of lightning environmental parameters related to interaction with electronic systems. IEEE Trans. Electromagn. Compatability 1982, EMC-24, 123–137. [Google Scholar] [CrossRef]
- Varfolomeev, A.A.; Gushchin, M.E.; Korobkov, S.V.; Kostrov, A.V.; Palochkin, Y.P.; Priver, S.E.; Odzerikho, D.A.; Strikovskii, A.V. Engine-driven electrization of aircraft as a radio interference source. Tech. Phys. Lett. 2015, 41, 14–17. [Google Scholar] [CrossRef]
- Gushchin, M.E.; Zudin, I.Y.; Korobkov, S.V.; Kostrov, A.V.; Mikryukova, P.A.; Priver, S.E.; Strikovskiy, A.V.; Syssoev, V.S. Parameters of high-voltage discharges on helicopter rotor blades and related electromagnetic interference. Tech. Phys. Lett. 2020, 46, 66–68. [Google Scholar] [CrossRef]
- Le Vine, D.M. Review of measurements of the RF spectrum of radiation from lightning. Meteorol. Atmos. Phys. 1987, 37, 195–204. [Google Scholar] [CrossRef]
- Gurevich, A.V.; Garipov, G.K.; Almenova, A.M.; Antonova, V.P.; Chubenko, A.P.; Kalikulov, O.A.; Karashtin, A.N.; Kryakunova, O.N.; Lutsenko, V.Y.; Mitko, G.G.; et al. Simultaneous observation of lightning emission in different wave ranges of electromagnetic spectrum in Tien Shan mountains. Atmos. Res. 2018, 211, 73–84. [Google Scholar] [CrossRef]
- Lysov, N.; Temnikov, A.; Chernensky, L.; Orlov, A.; Belova, O.; Kivshar, T.; Kovalev, D.; Voevodin, V. Physical simulation of the spectrum of possible electromagnetic effects of upward streamer discharges on model elements of transmission line monitoring systems using artificial thunderstorm cell. Appl. Sci. 2021, 11, 8723. [Google Scholar] [CrossRef]
- Temnikov, A.; Belova, O.; Chernensky, L.; Orlov, A.; Lysov, N.; Kivshar, T.; Kovalev, D.; Kalugina, I. Peculiarities of spectrum of electromagnetic signals induced by discharges from artificial thunderstorm cell. J. Electrost. 2022, 115, 103660. [Google Scholar] [CrossRef]
- Bazelyan, E.M.; Raizer, Y.P. Lightning Physics and Lightning Protection; IOP Publishing Ltd.: Bristol, UK; Philadelphia, PA, USA, 2000. [Google Scholar]
- Ebert, U.; Nijdam, S.; Li, C.; Luque, A.; Briels, T. Review of recent results on streamer discharges and discussion of their relevance for sprites and lightning. J. Geophys. Res. 2010, 115, A00E43. [Google Scholar] [CrossRef]
- Starikovskiy, A.Y.; Aleksandrov, N.L. How pulse polarity and photoionization control streamer discharge development in long air gaps. Plasma Sources Sci. Technol. 2020, 29, 075004. [Google Scholar] [CrossRef]
- Bertault, P.; Dupuy, J.; Gibert, A. The role of the cathode zone in the transition corona effect arc. J. Phys. D Appl. Phys. 1977, 10, L219–L222. [Google Scholar] [CrossRef]
- Bessiéres, D.; Paillot, J.; Gibert, A.; Pécastaing, E. Positive corona ignition and development in air at atmospheric pressure under a Heaviside voltage pulse. Plasma Process. Polym. 2005, 2, 183–187. [Google Scholar] [CrossRef]
- Luque, A. Radio frequency electromagnetic radiation from streamer collisions. J. Geophys. Res. Atmos. 2017, 122, 10497–10509. [Google Scholar] [CrossRef]
- Shi, F.; Liu, N.; Dwyer, J.R.; Ihaddadene, K.M.A. VHF and UHF electromagnetic radiation produced by streamers in lightning. Geophys. Res. Lett. 2019, 46, 443–451. [Google Scholar] [CrossRef]
- Fedorov, V.M.; Efanov, M.V.; Ostashev, V.Y.; Tarakanov, V.P.; Ul’yanov, A.V. Antenna Array with TEM-Horn for Radiation of High-Power Ultra Short Electromagnetic Pulses. Electronics 2021, 10, 1011. [Google Scholar] [CrossRef]
- Gushchin, M.E.; Korobkov, S.V.; Zudin, I.Y.; Nikolenko, A.S.; Mikryukov, P.A.; Syssoev, V.S.; Sukharevsky, D.I.; Orlov, A.I.; Naumova, M.Y.; Kuznetsov, Y.A.; et al. Nanosecond electromagnetic pulses generated by electric discharges: Observation with clouds of charged water droplets and implications for lightning. Geophys. Res. Lett. 2021, 48, e92108. [Google Scholar] [CrossRef]
- Parkevich, E.V.; Shpakov, K.V.; Baidin, I.S.; Rodionov, A.A.; Khirianova, A.I.; Khirianov, T.F.; Bolotov, Y.K.; Medvedev, M.A.; Ryabov, V.A.; Kurilenkov, Y.K.; et al. Streamer formation processes trigger intense x-ray and high-frequency radio emissions in a high-voltage discharge. Phys. Rev. E 2022, 105, L053201. [Google Scholar] [CrossRef]
- Syssoev, V.S.; Naumova, M.Y.; Kuznetsov, Y.A.; Orlov, A.I.; Sukharevsky, D.I.; Makalsky, L.M.; Kukhno, A.V. Streamer Discharge Plasma Generator. Inorg. Mater. Appl. Res. 2022, 13, 1380–1384. [Google Scholar] [CrossRef]
- Ashmarin, G.V.; Lelevkin, V.M.; Tokarev, A.V. Development of a Linear Corona Torch Discharge. Plasma Physics Rep. 2002, 28, 866–870. [Google Scholar] [CrossRef]
- Lepekhin, N.M.; Priseko, Y.S.; Filippov, V.G.; Bulatov, M.U.; Sukharevskii, D.I.; Syssoev, V.S. Modulated corona nanosecond discharge in air under ambient pressure. Tech. Phys. Lett. 2015, 41, 352–354. [Google Scholar] [CrossRef]
- Ryan, H. Ricker, Ormsby, Klander, Butterword—A choice of wavelets. CSEG Recorder 1994, 19, 8–9. [Google Scholar]
- Kraus, J.D. Antennas, 2nd ed.; Tata McGraw-Hill Publishing Company Limited: New Delhi, India, 1988. [Google Scholar]
- Lehtinen, N.G.; Østgaard, N. X-ray emissions in a multiscale fluid model of a streamer discharge. J. Geophys. Res. Atmos. 2018, 123, 6935–6953. [Google Scholar] [CrossRef]
- Huang, B.; Zhang, C.; Ren, C.; Shao, T. Guiding effect of runaway electrons in atmospheric pressure nanosecond pulsed discharge: Mode transition from diffuse discharge to streamer. Plasma Sources Sci. Technol. 2022, 31, 114002. [Google Scholar] [CrossRef]
- Sigmond, R.S. The residual streamer channel: Return strokes and secondary streamers. J. f Appl. Phys. 1984, 56, 1355–1370. [Google Scholar] [CrossRef]
- Odrobina, I.; Černák, M. Numerical simulation of streamer-cathode interaction. J. Appl. Phys. 1995, 78, 3635–3642. [Google Scholar] [CrossRef]
Publisher’s Note: MDPI stays neutral with regard to jurisdictional claims in published maps and institutional affiliations. |
© 2022 by the authors. Licensee MDPI, Basel, Switzerland. This article is an open access article distributed under the terms and conditions of the Creative Commons Attribution (CC BY) license (https://creativecommons.org/licenses/by/4.0/).