
Passive Cooling Analysis of an Electronic Chipset Using Nanoparticles and Metal-Foam Composite PCM: An Experimental Study


Abstract
:1. Introduction
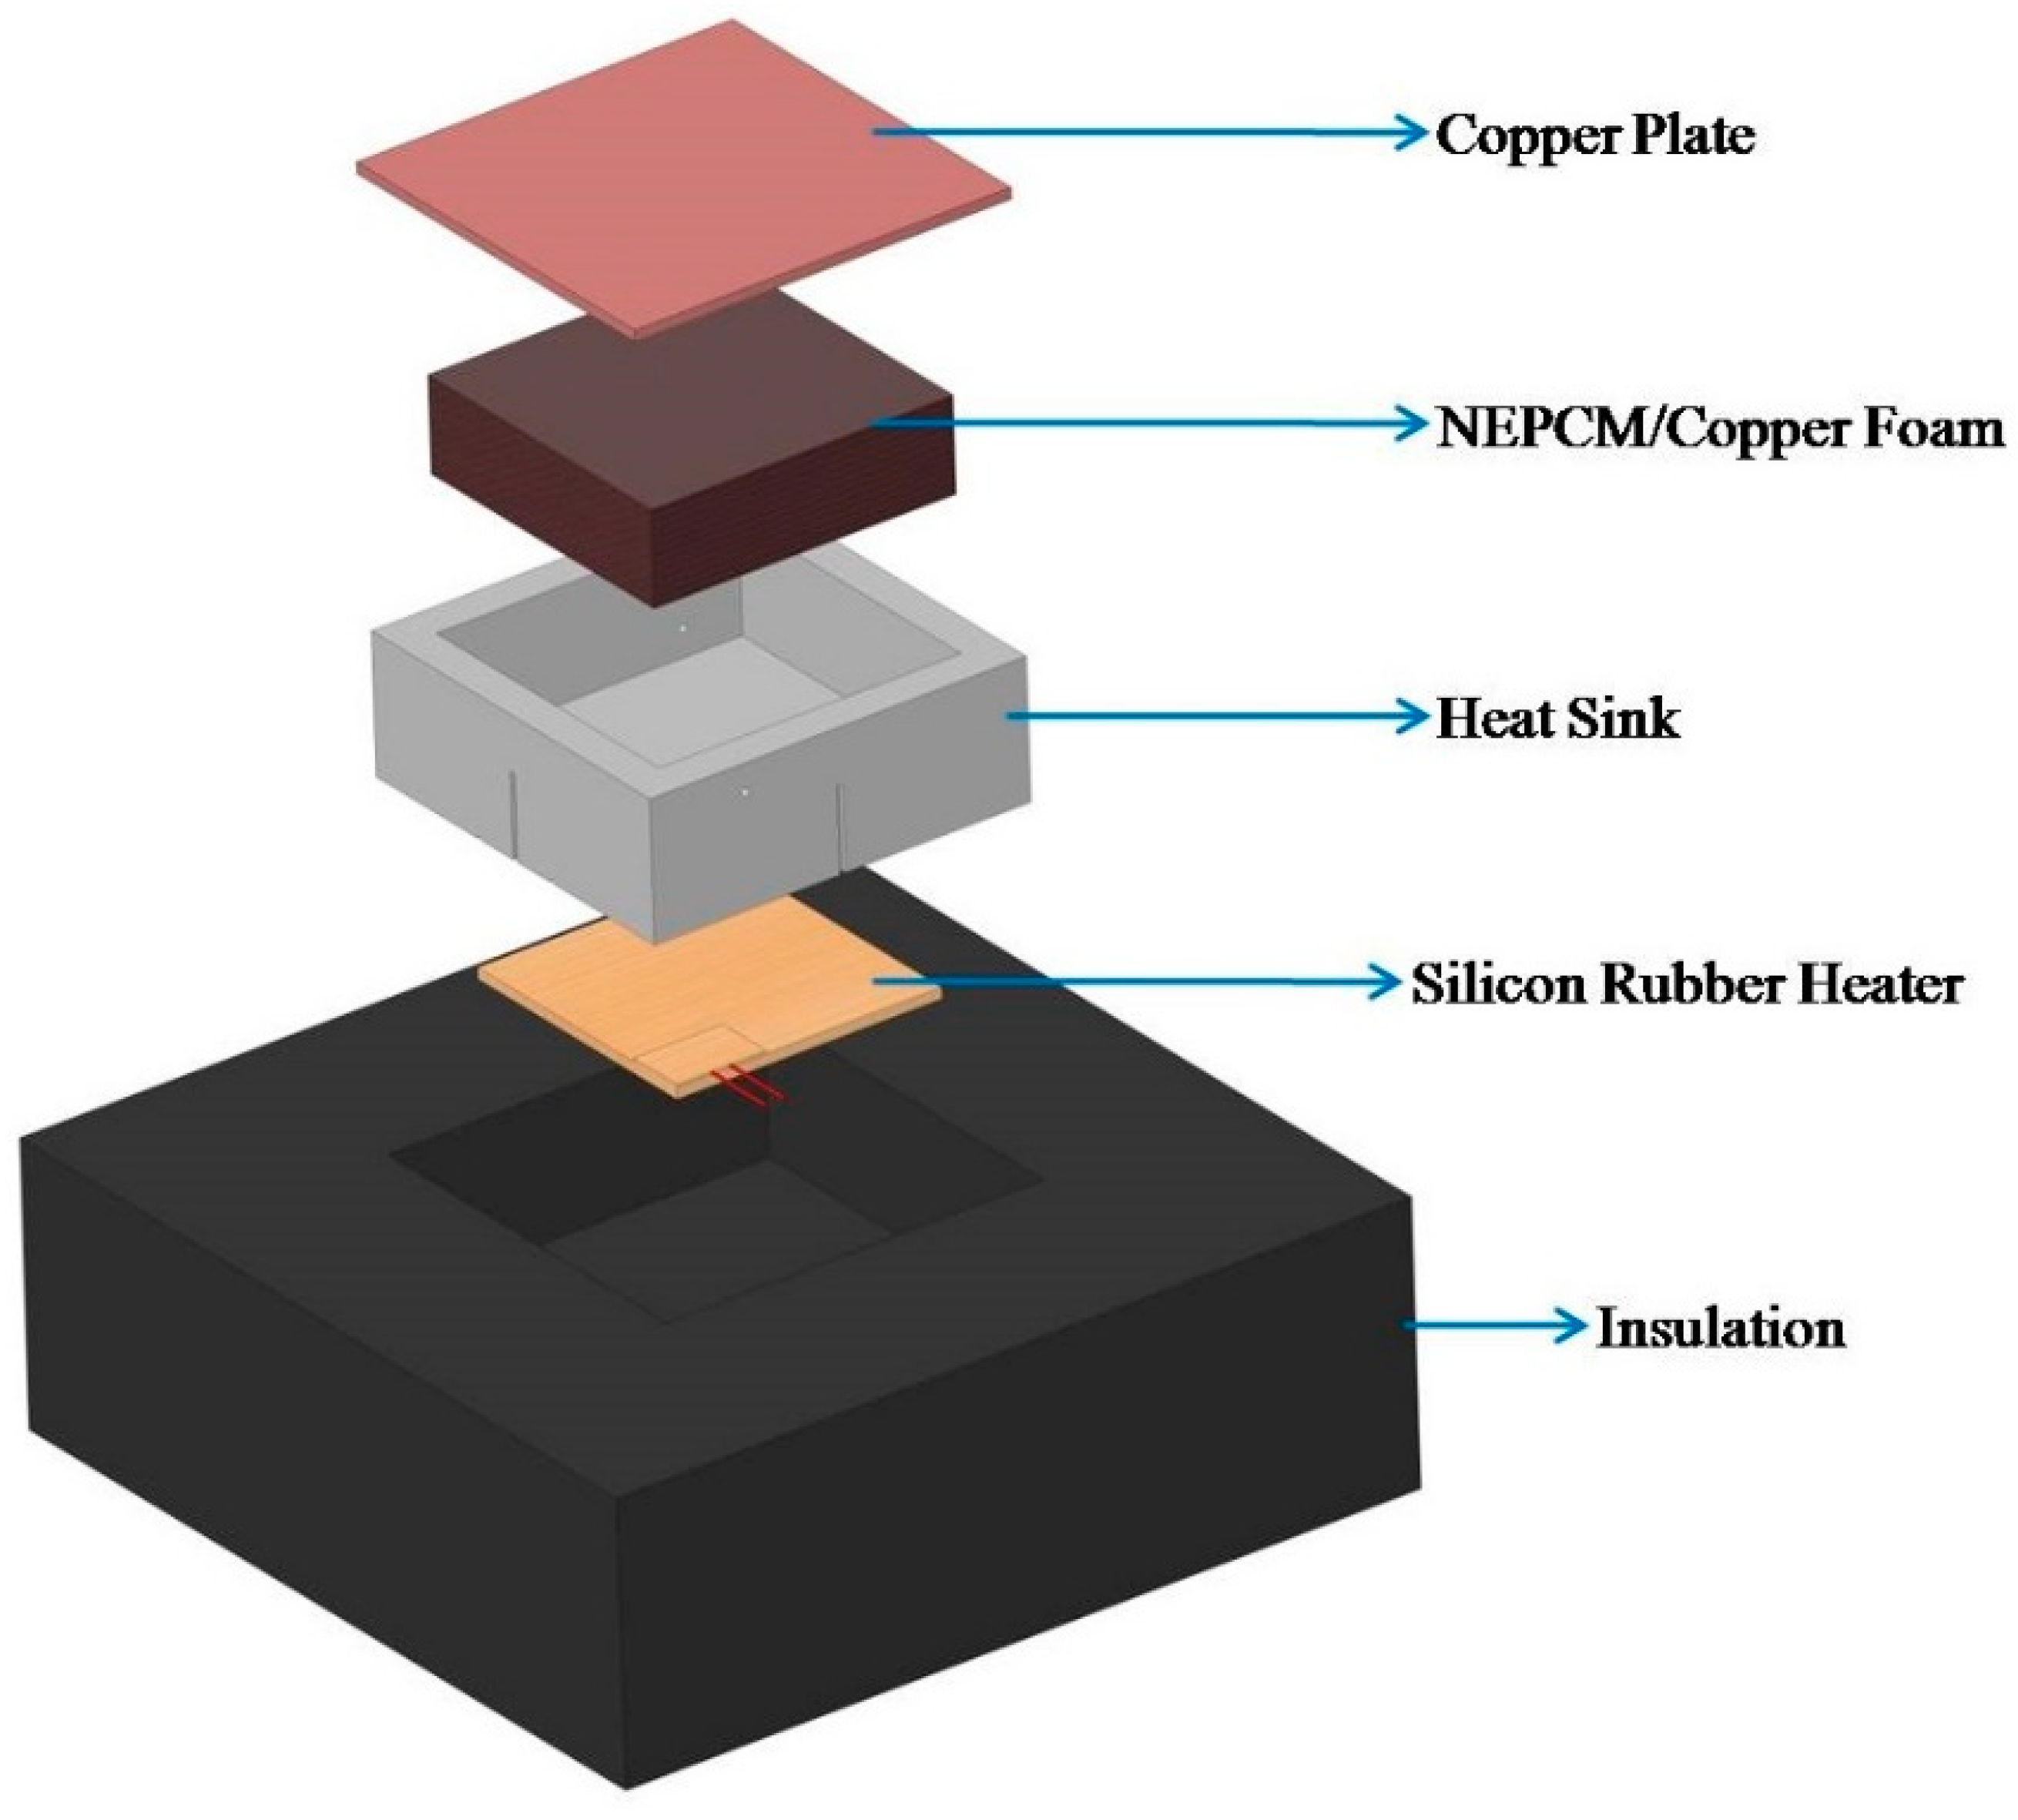
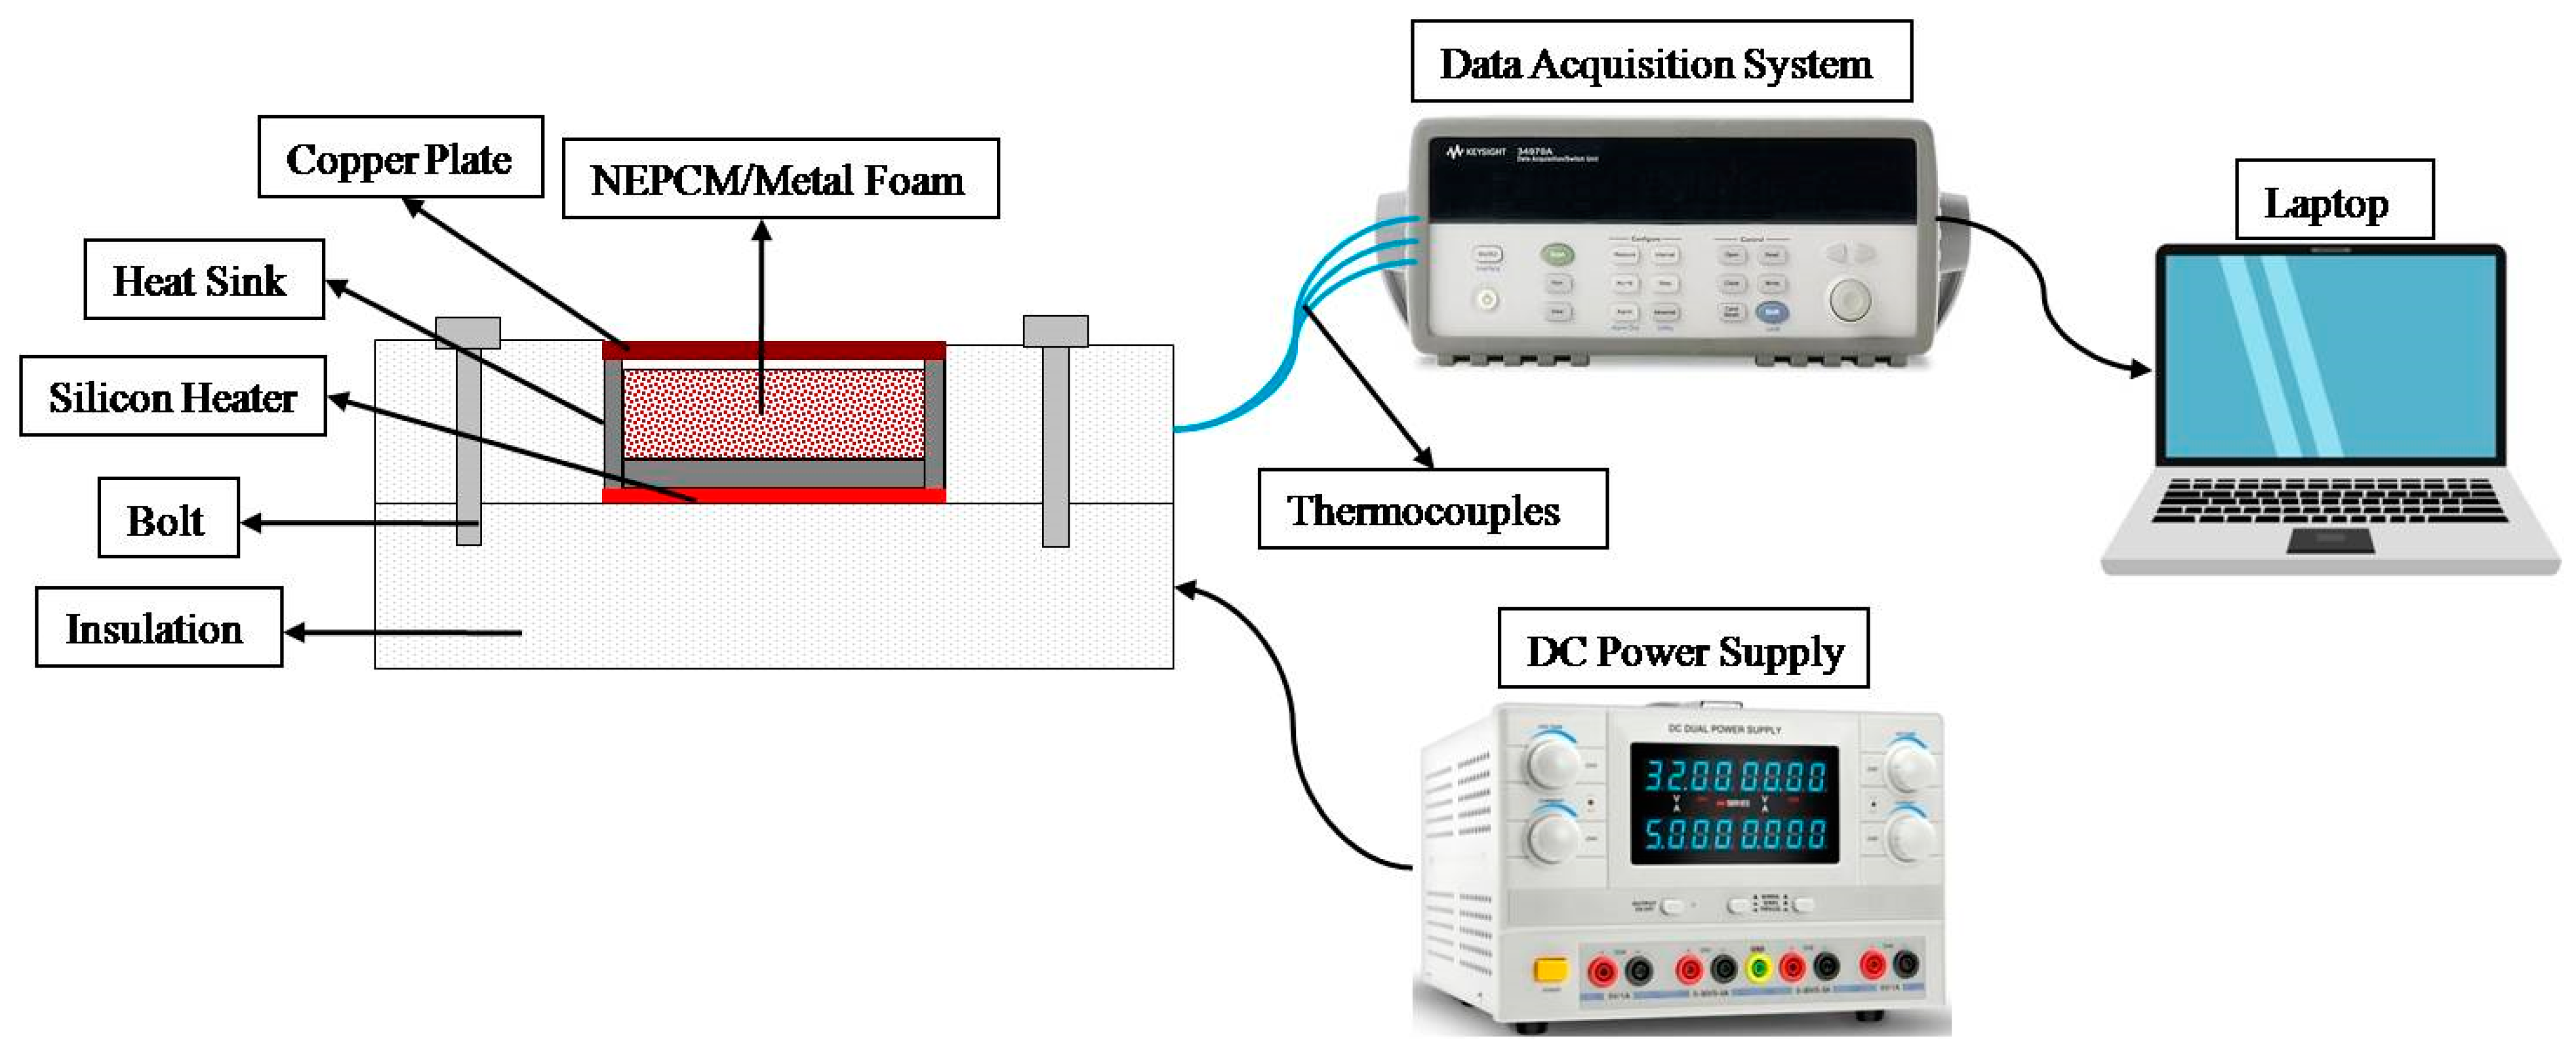
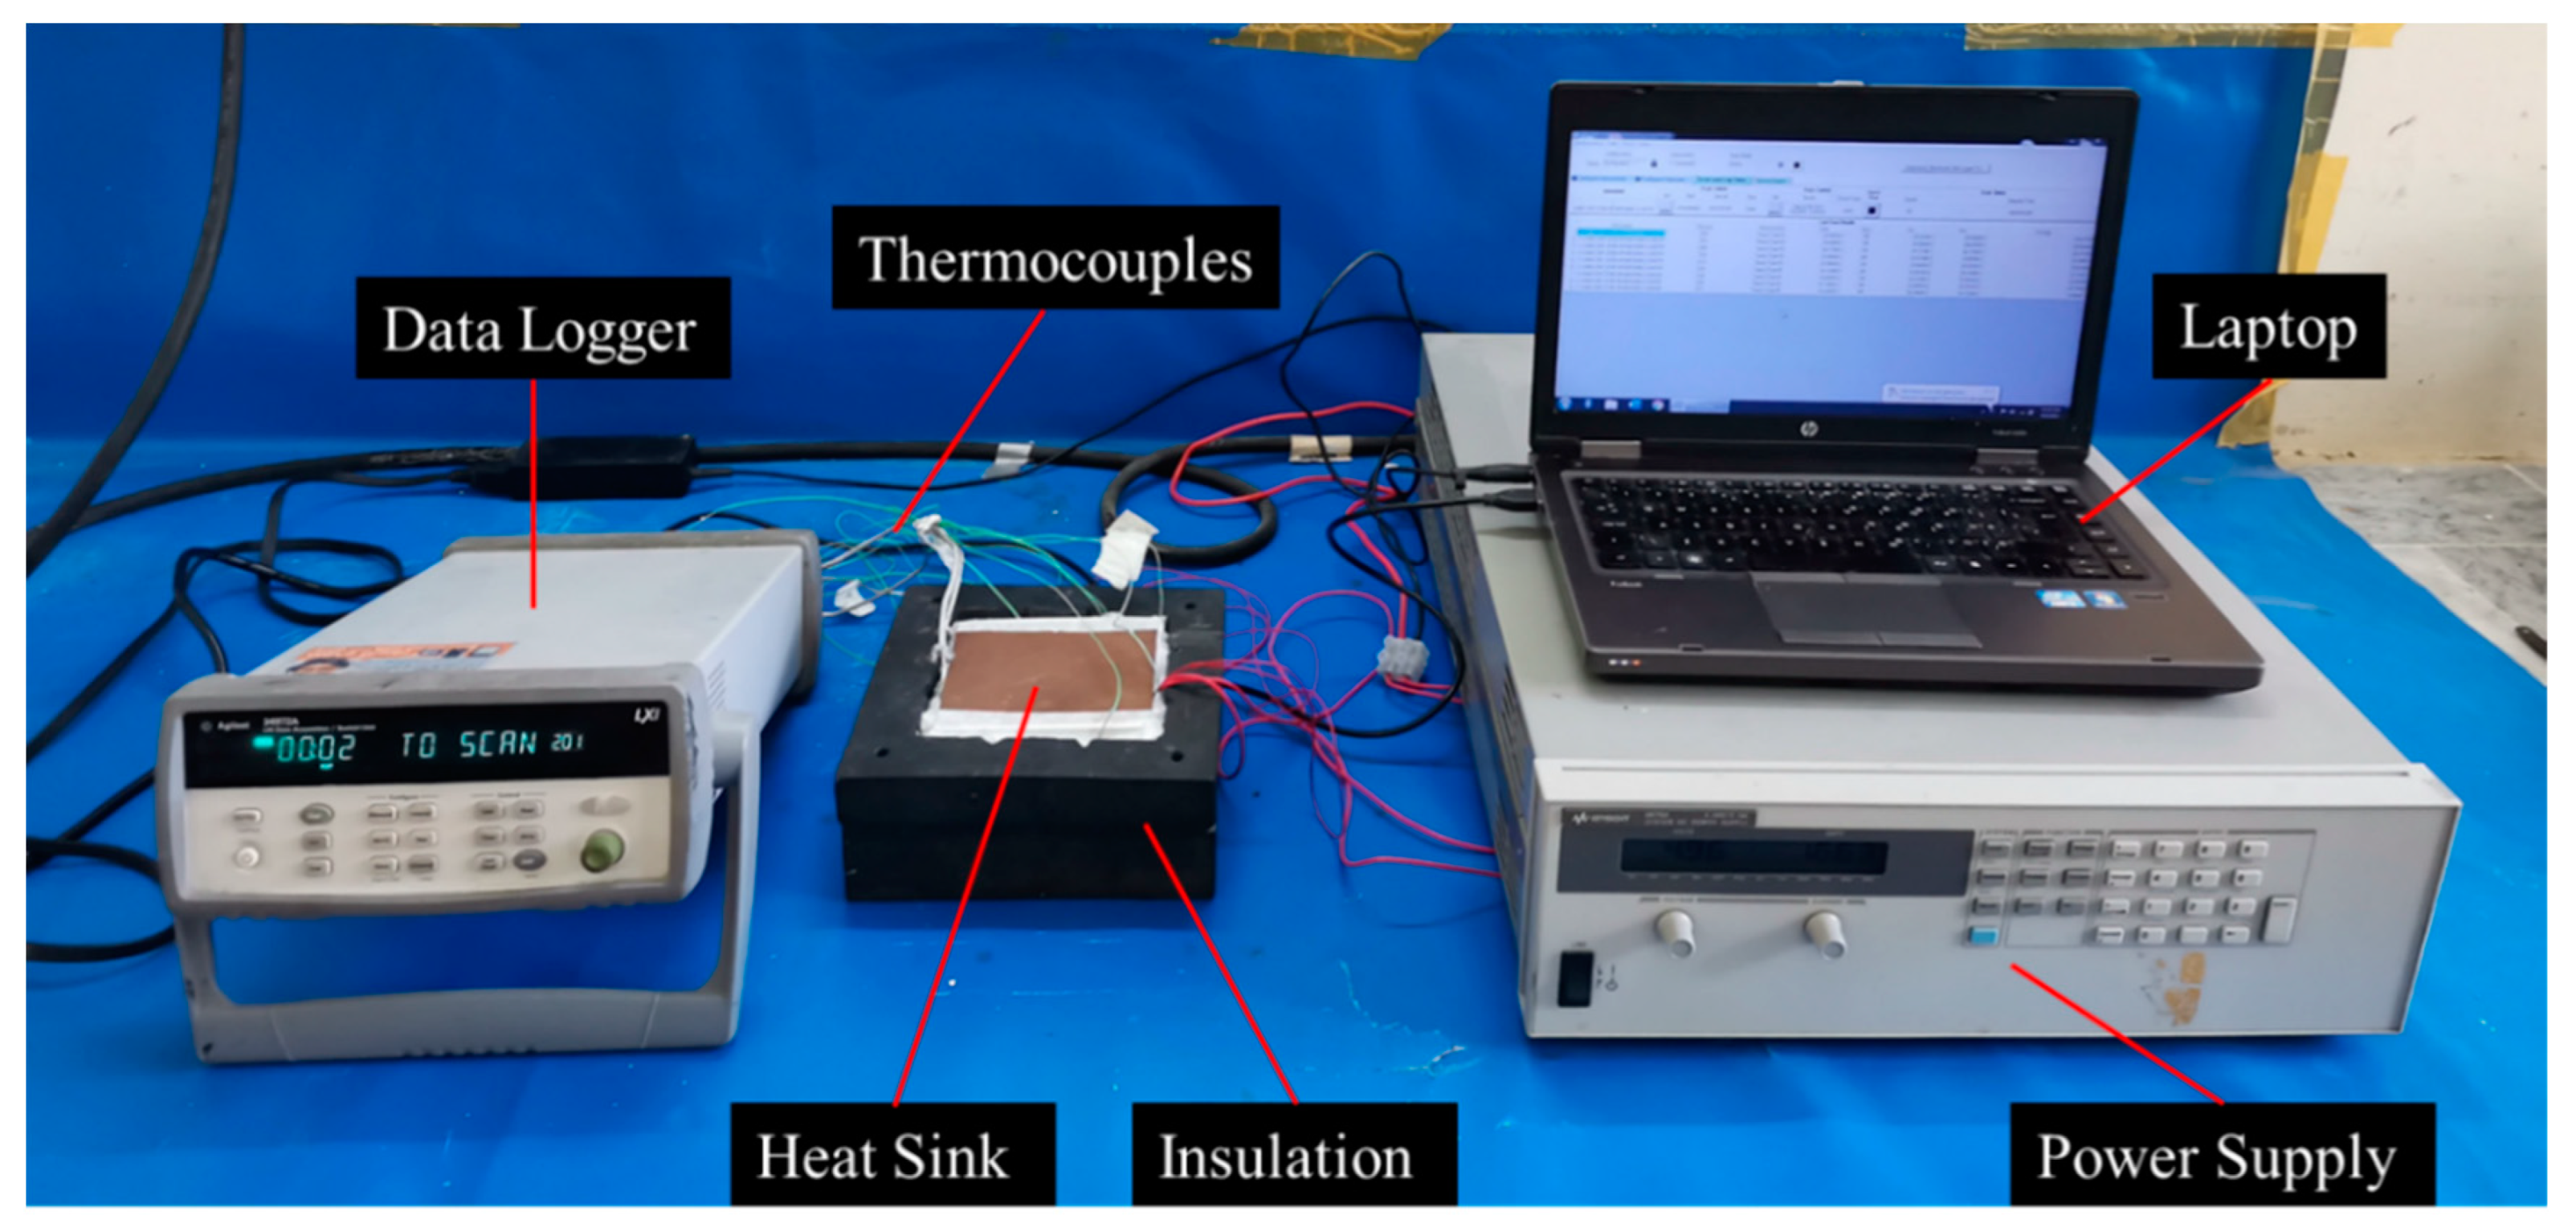
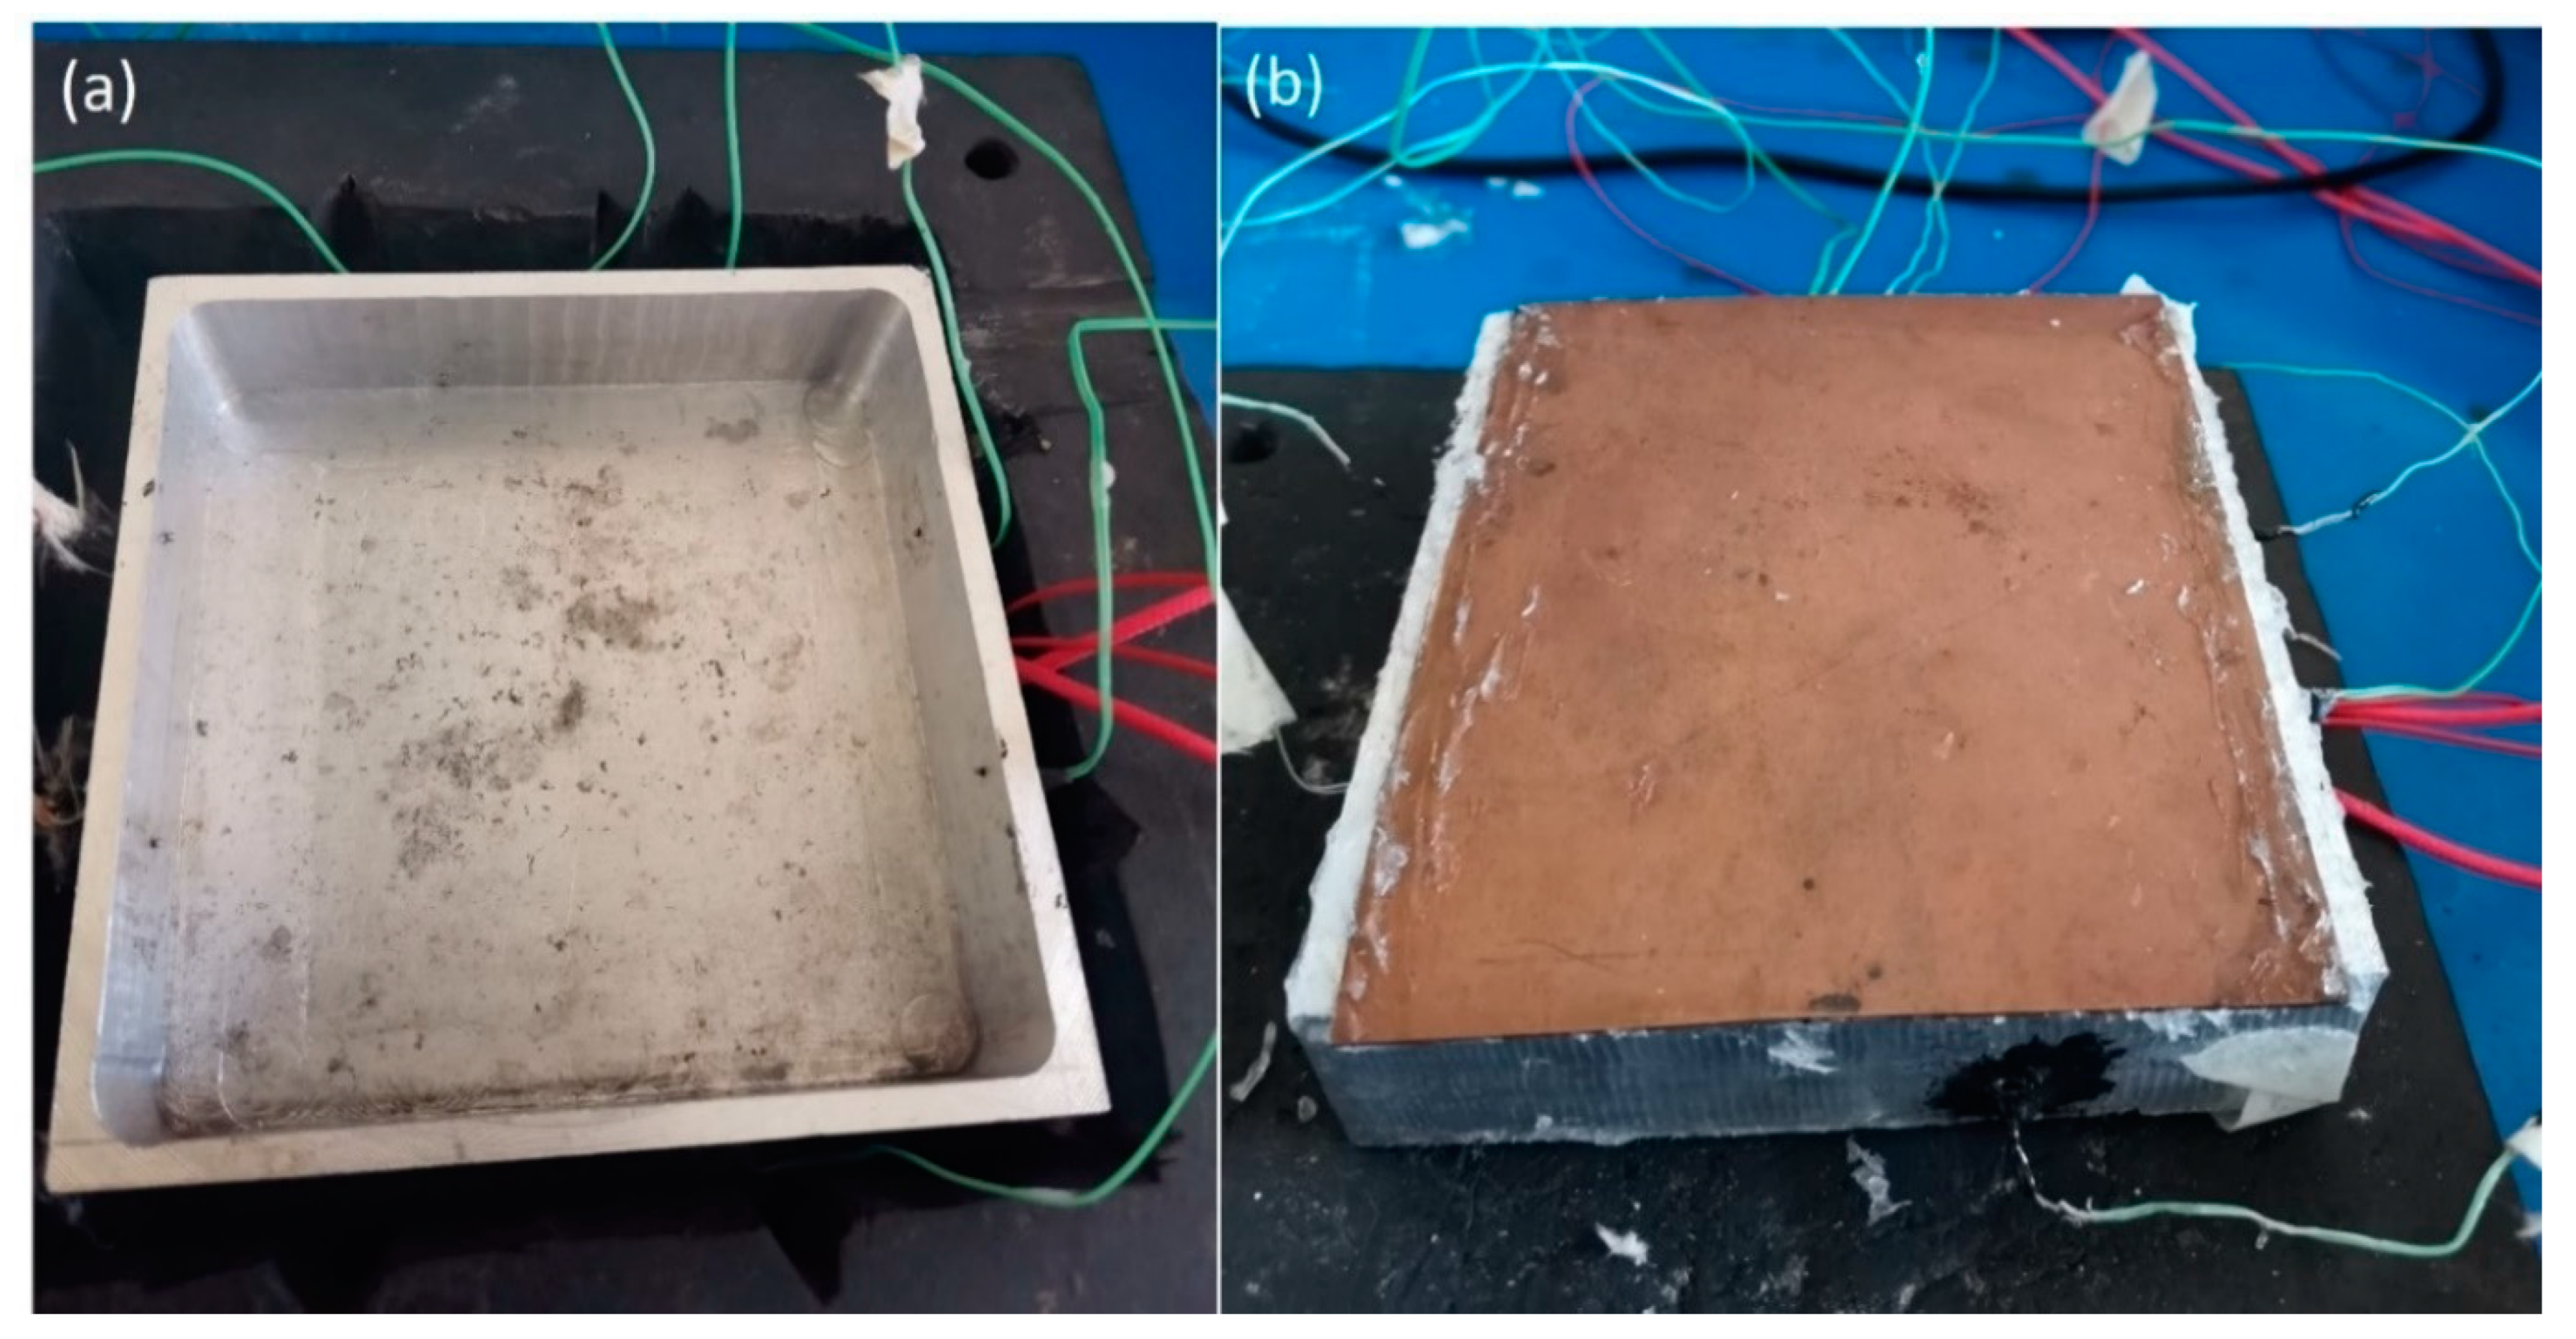
2. Experimental Setup
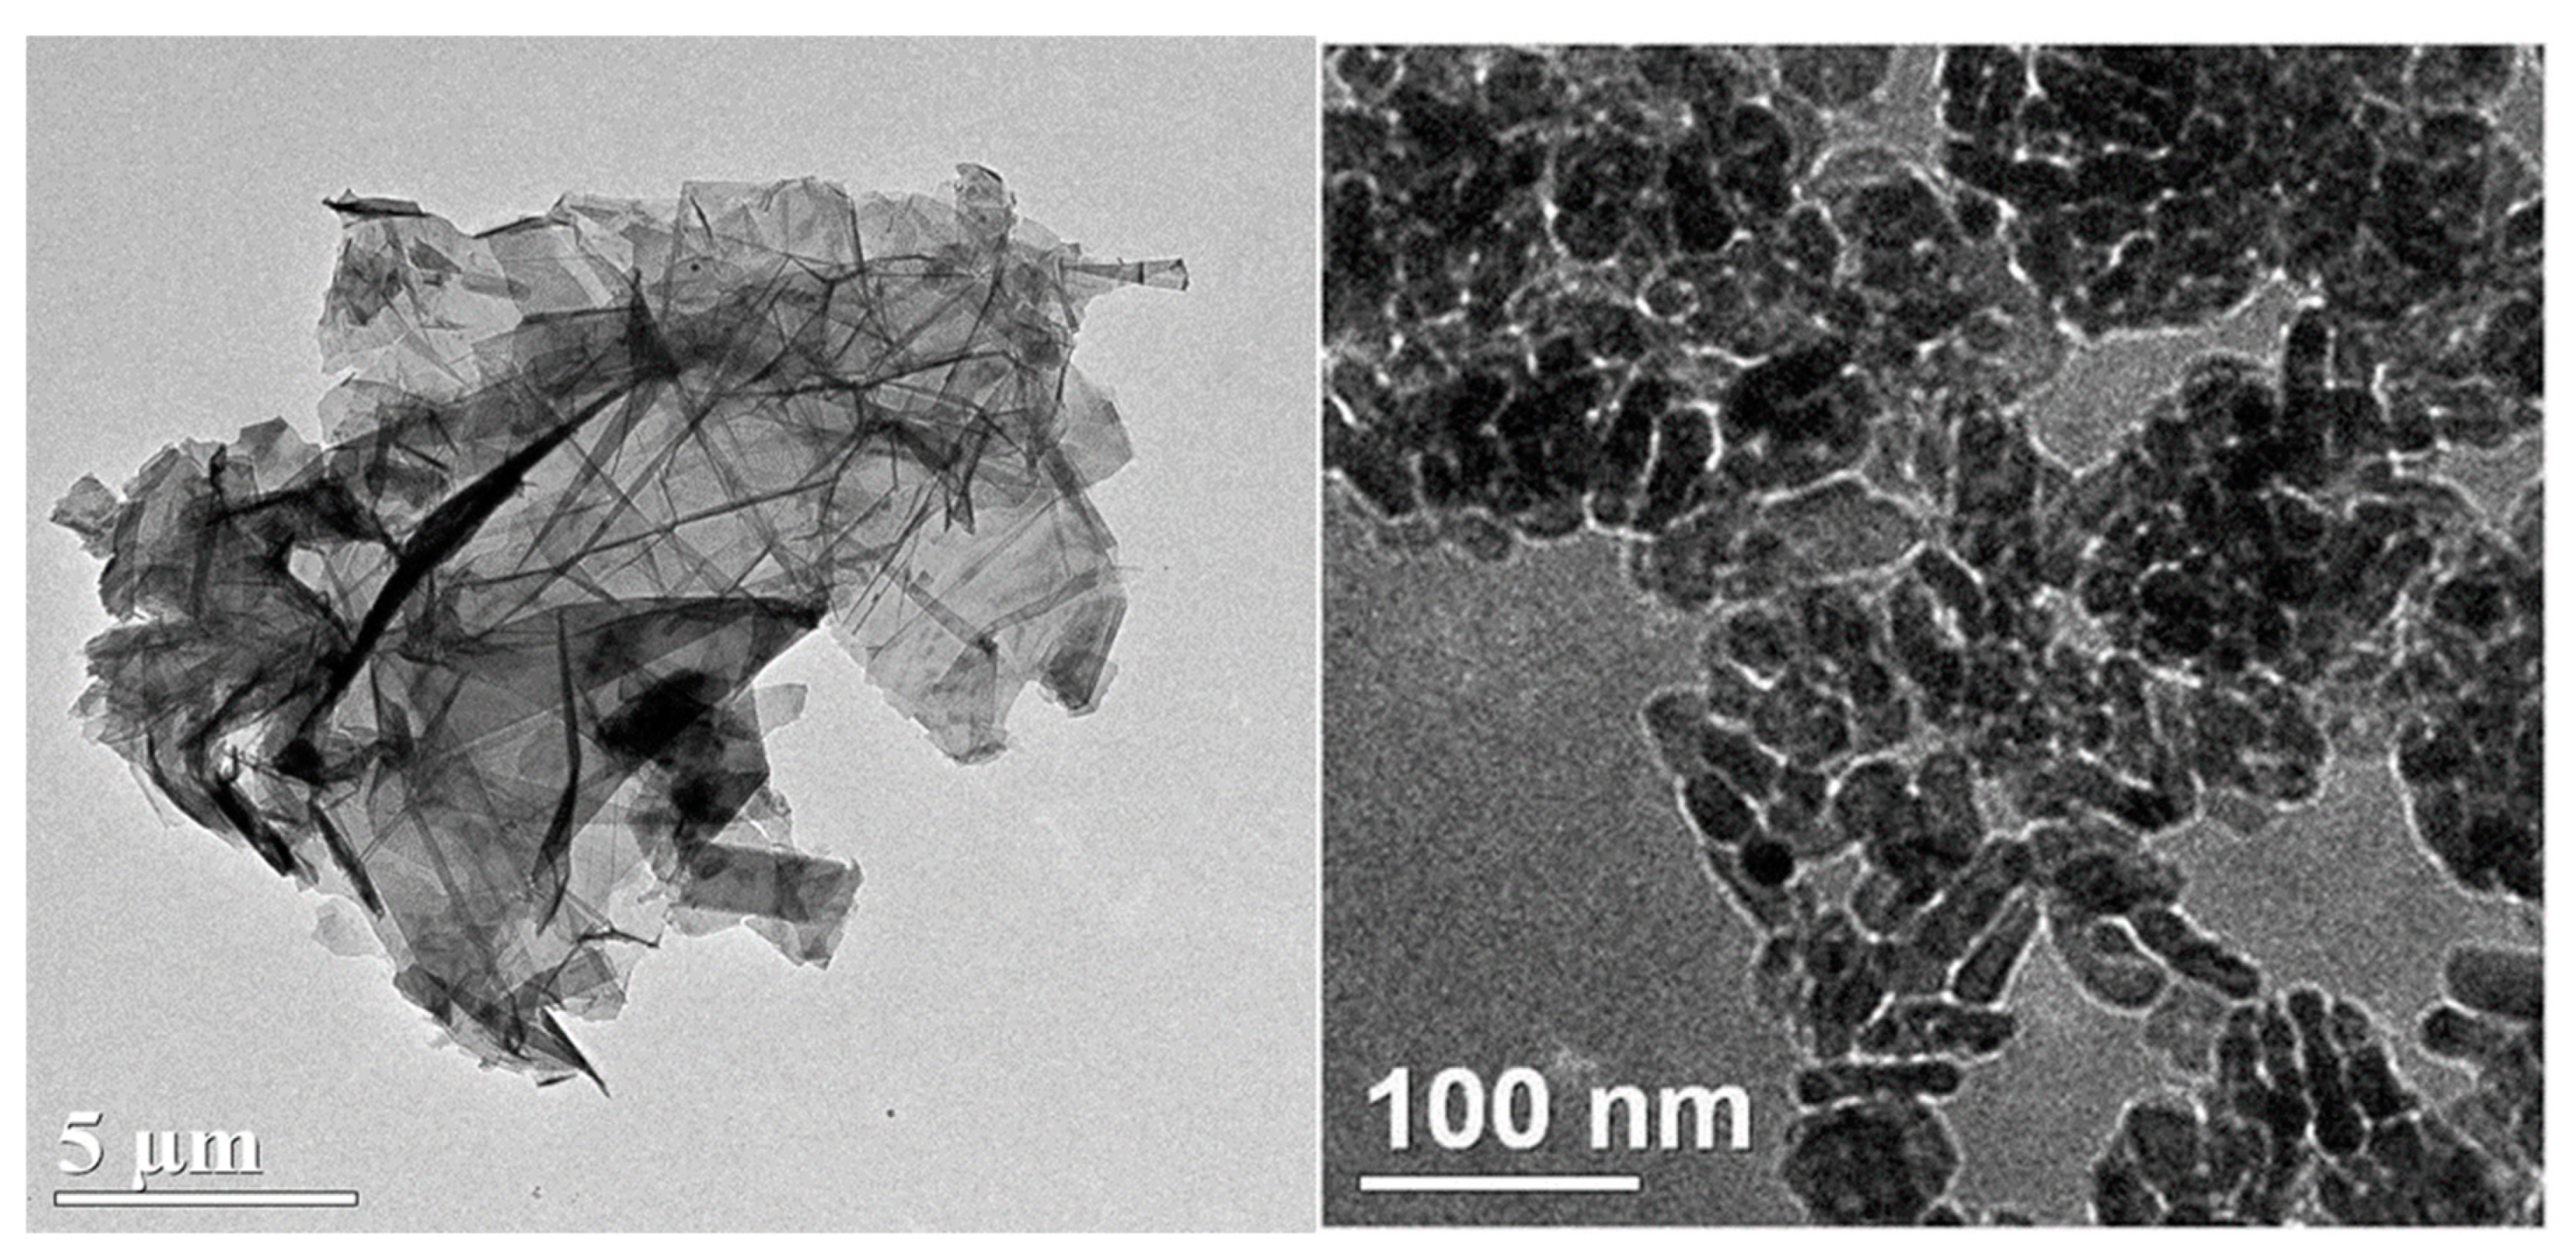
2.1. Materials
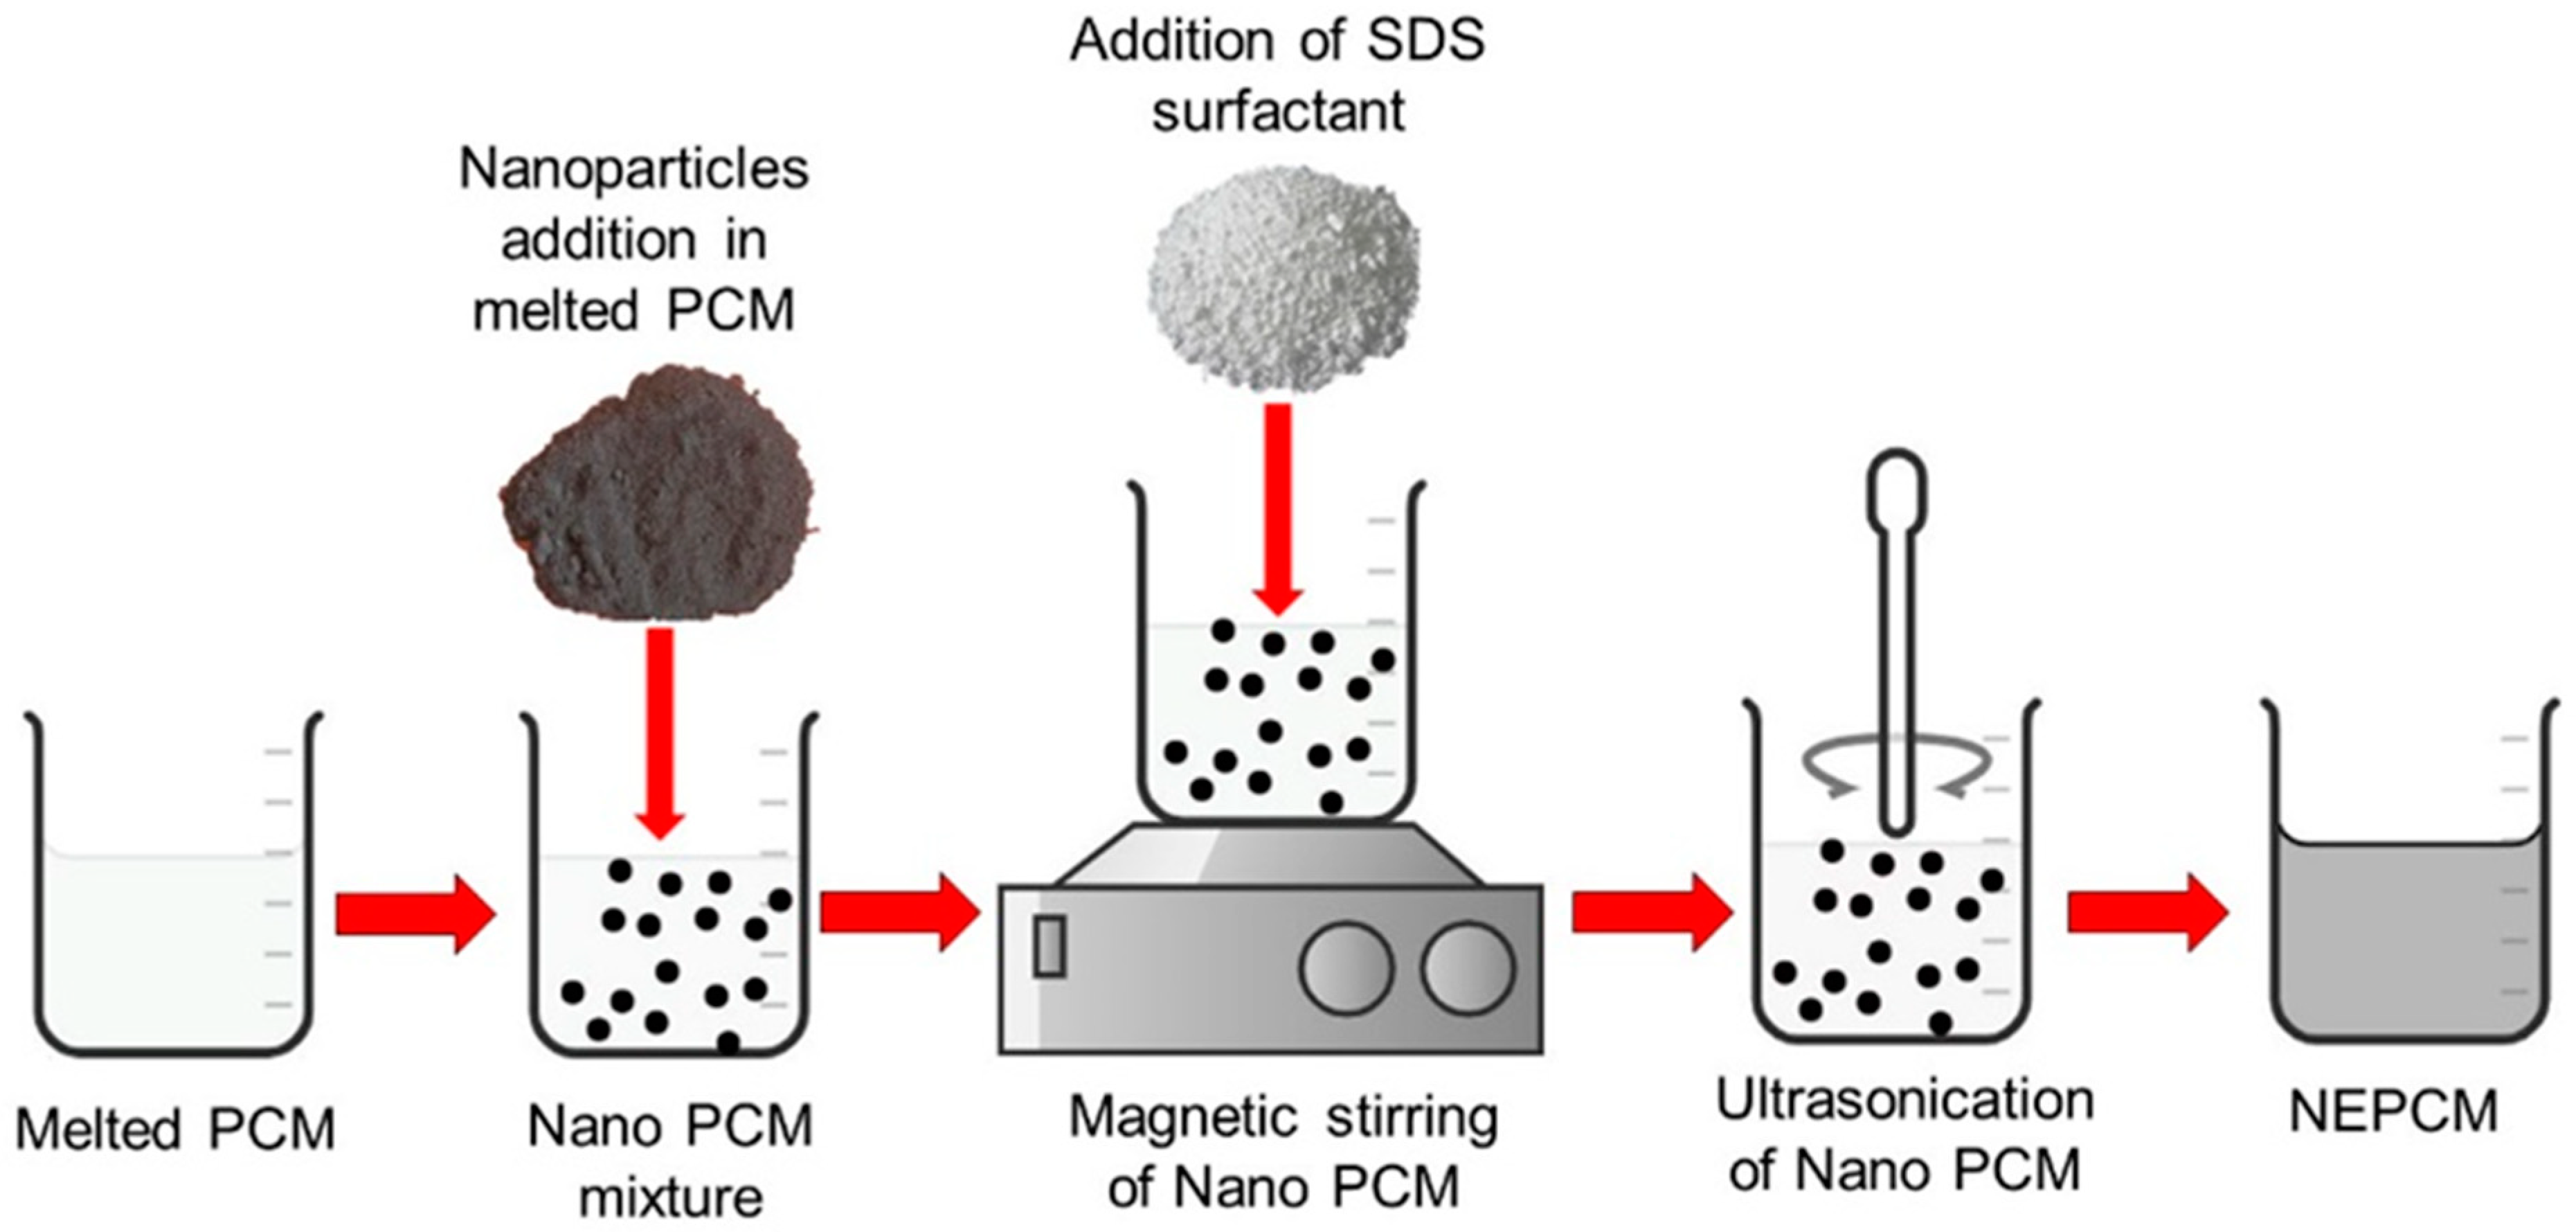
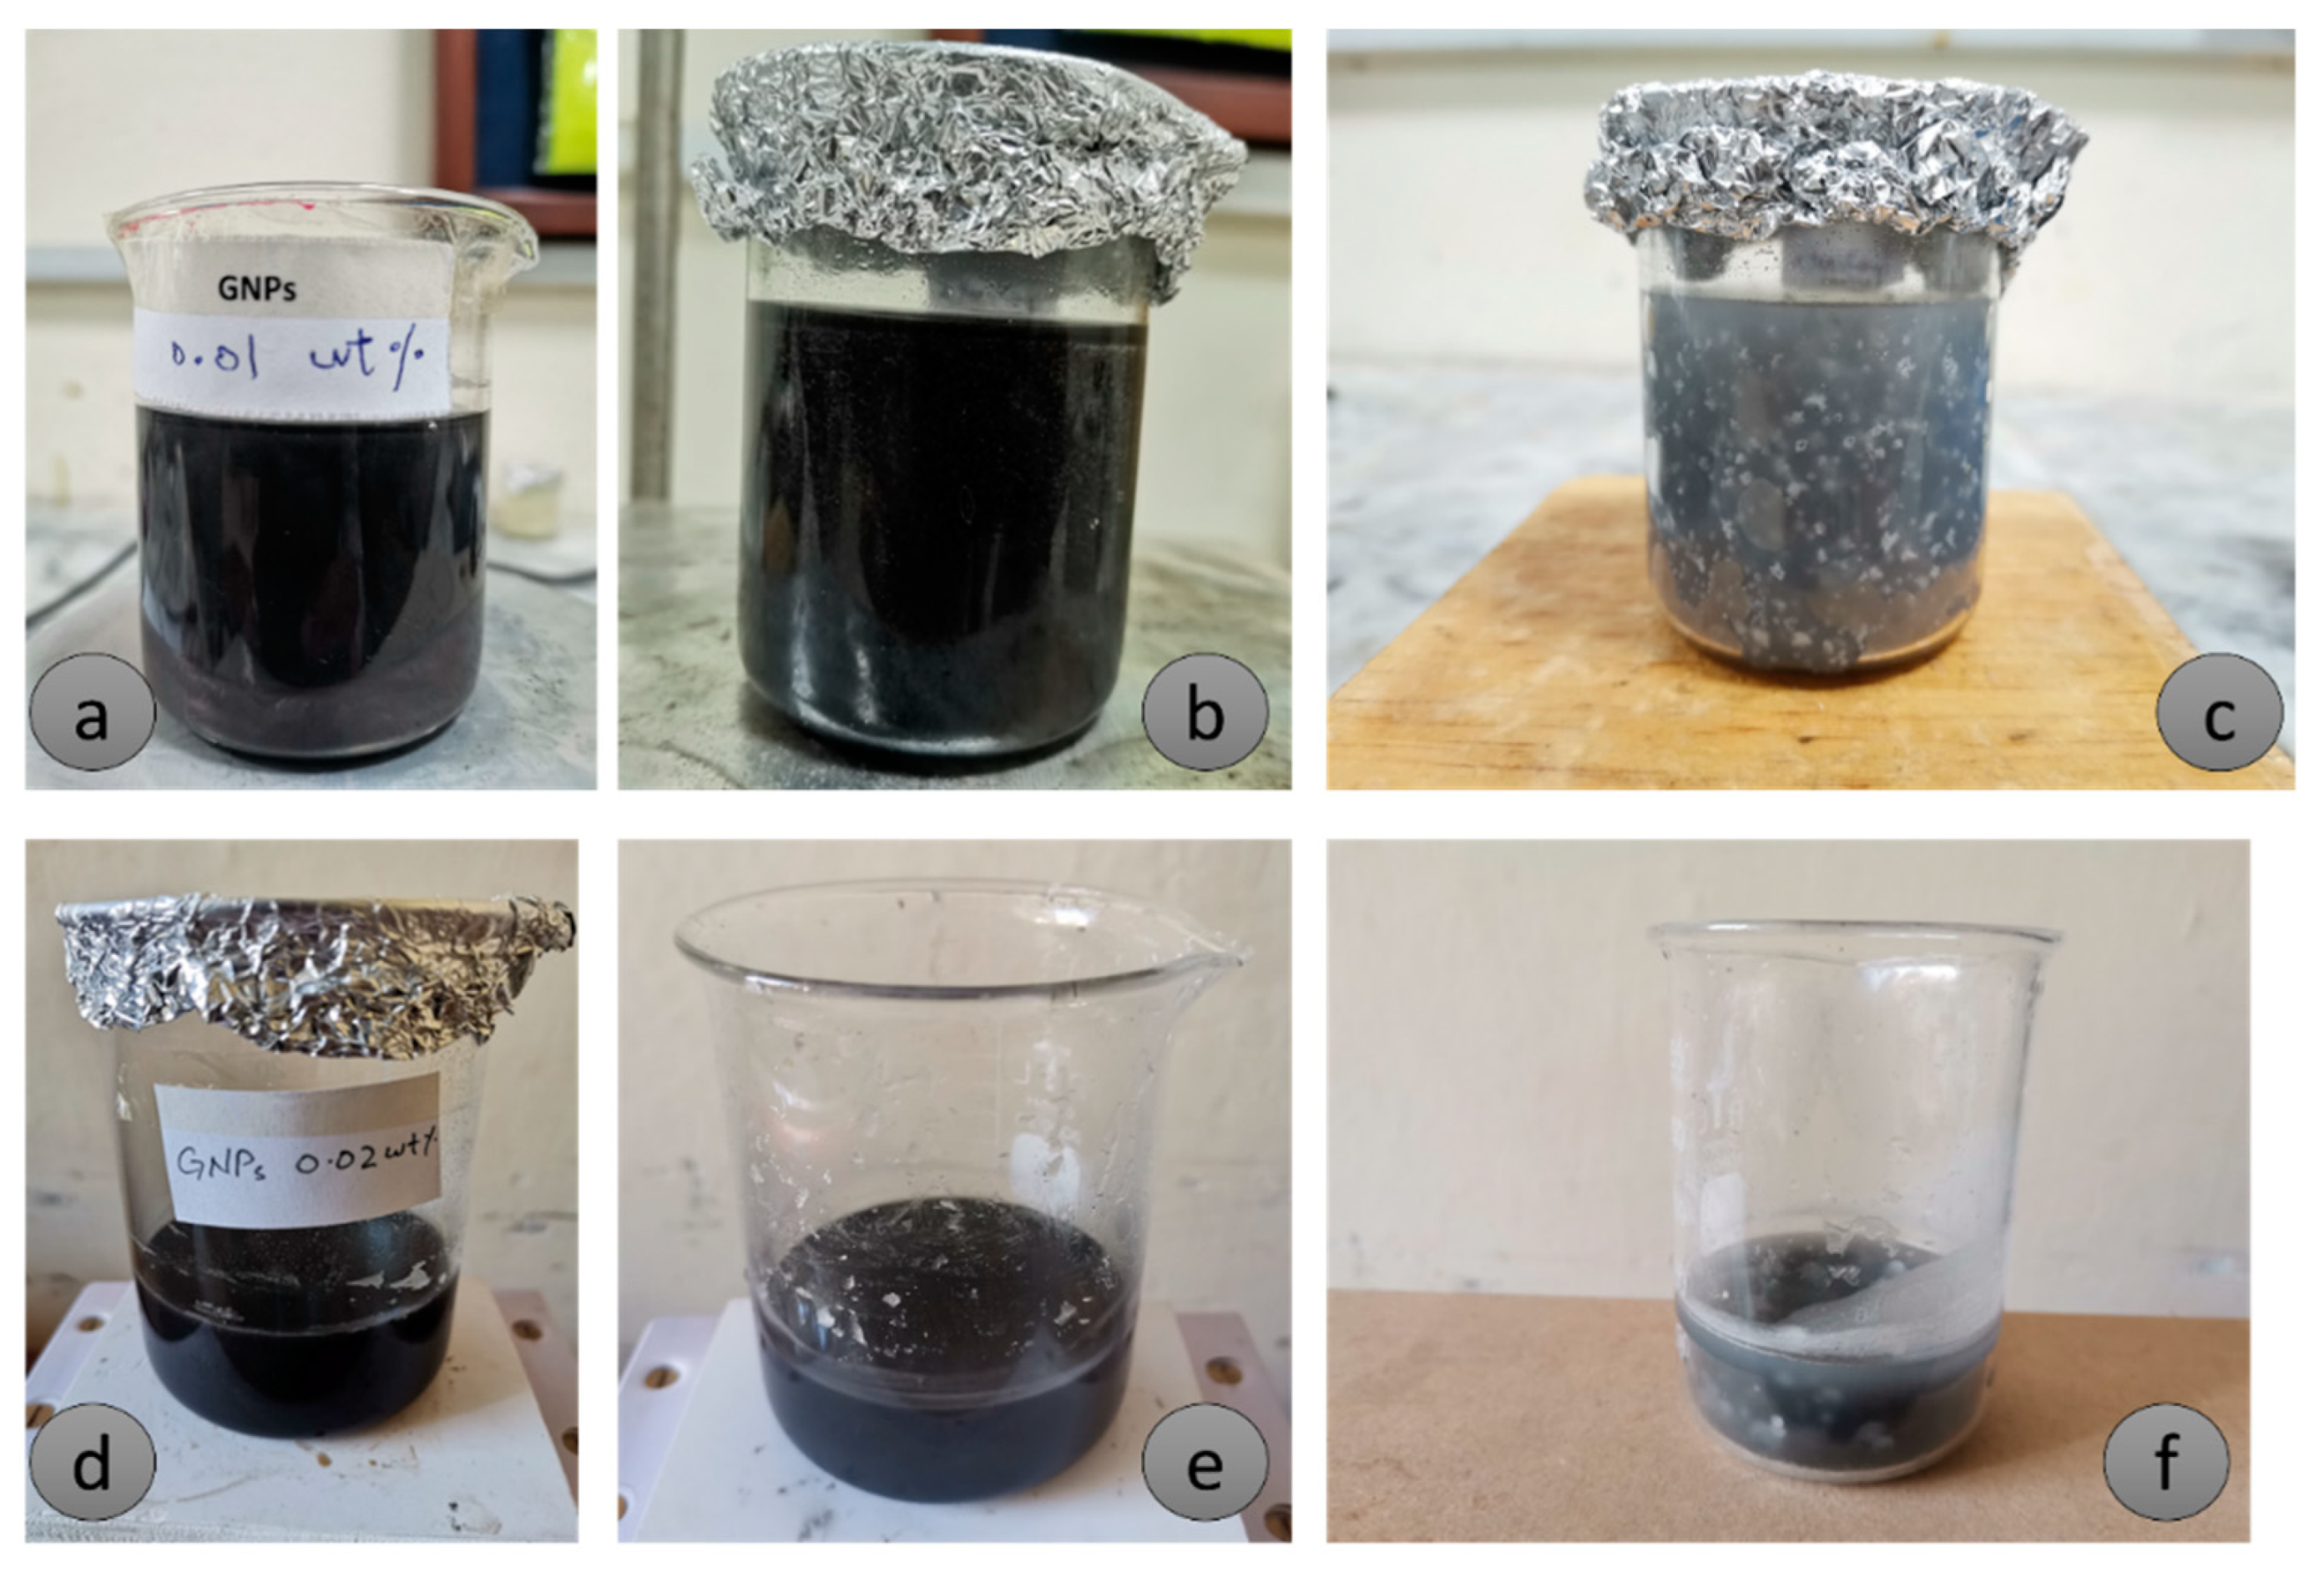
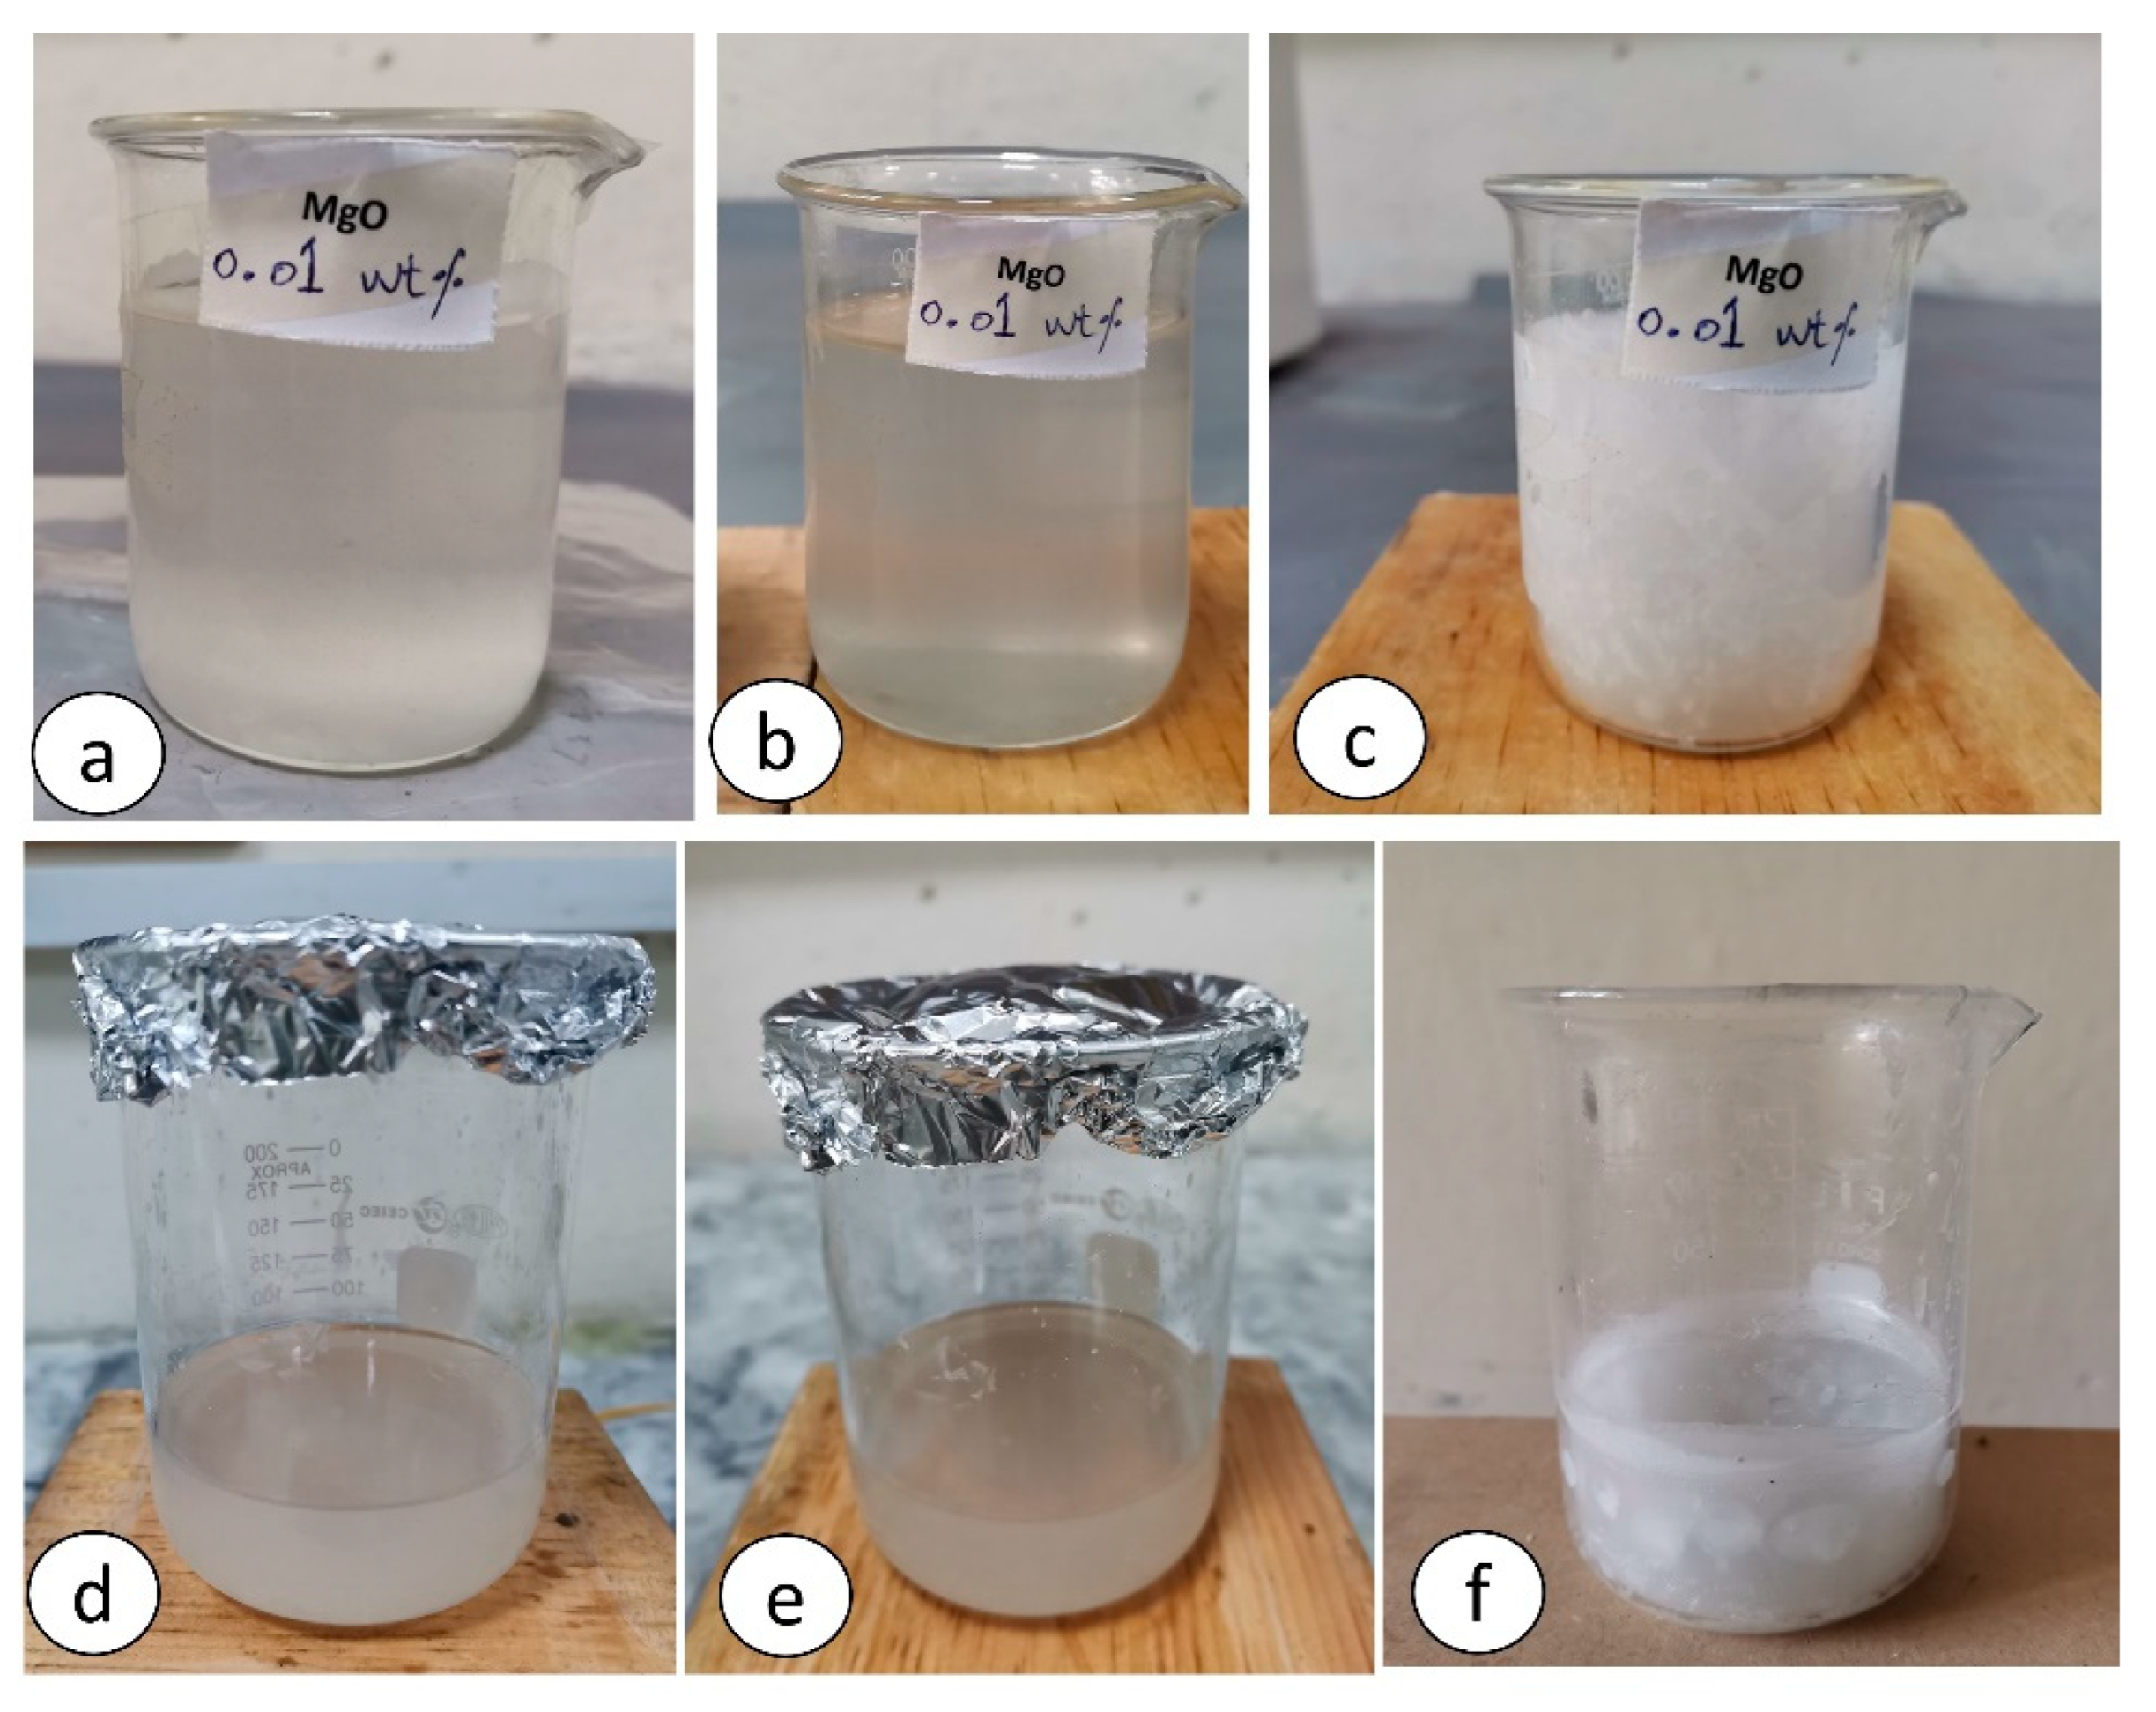
2.2. NEPCM Preparation and Saturation in Metal Foam
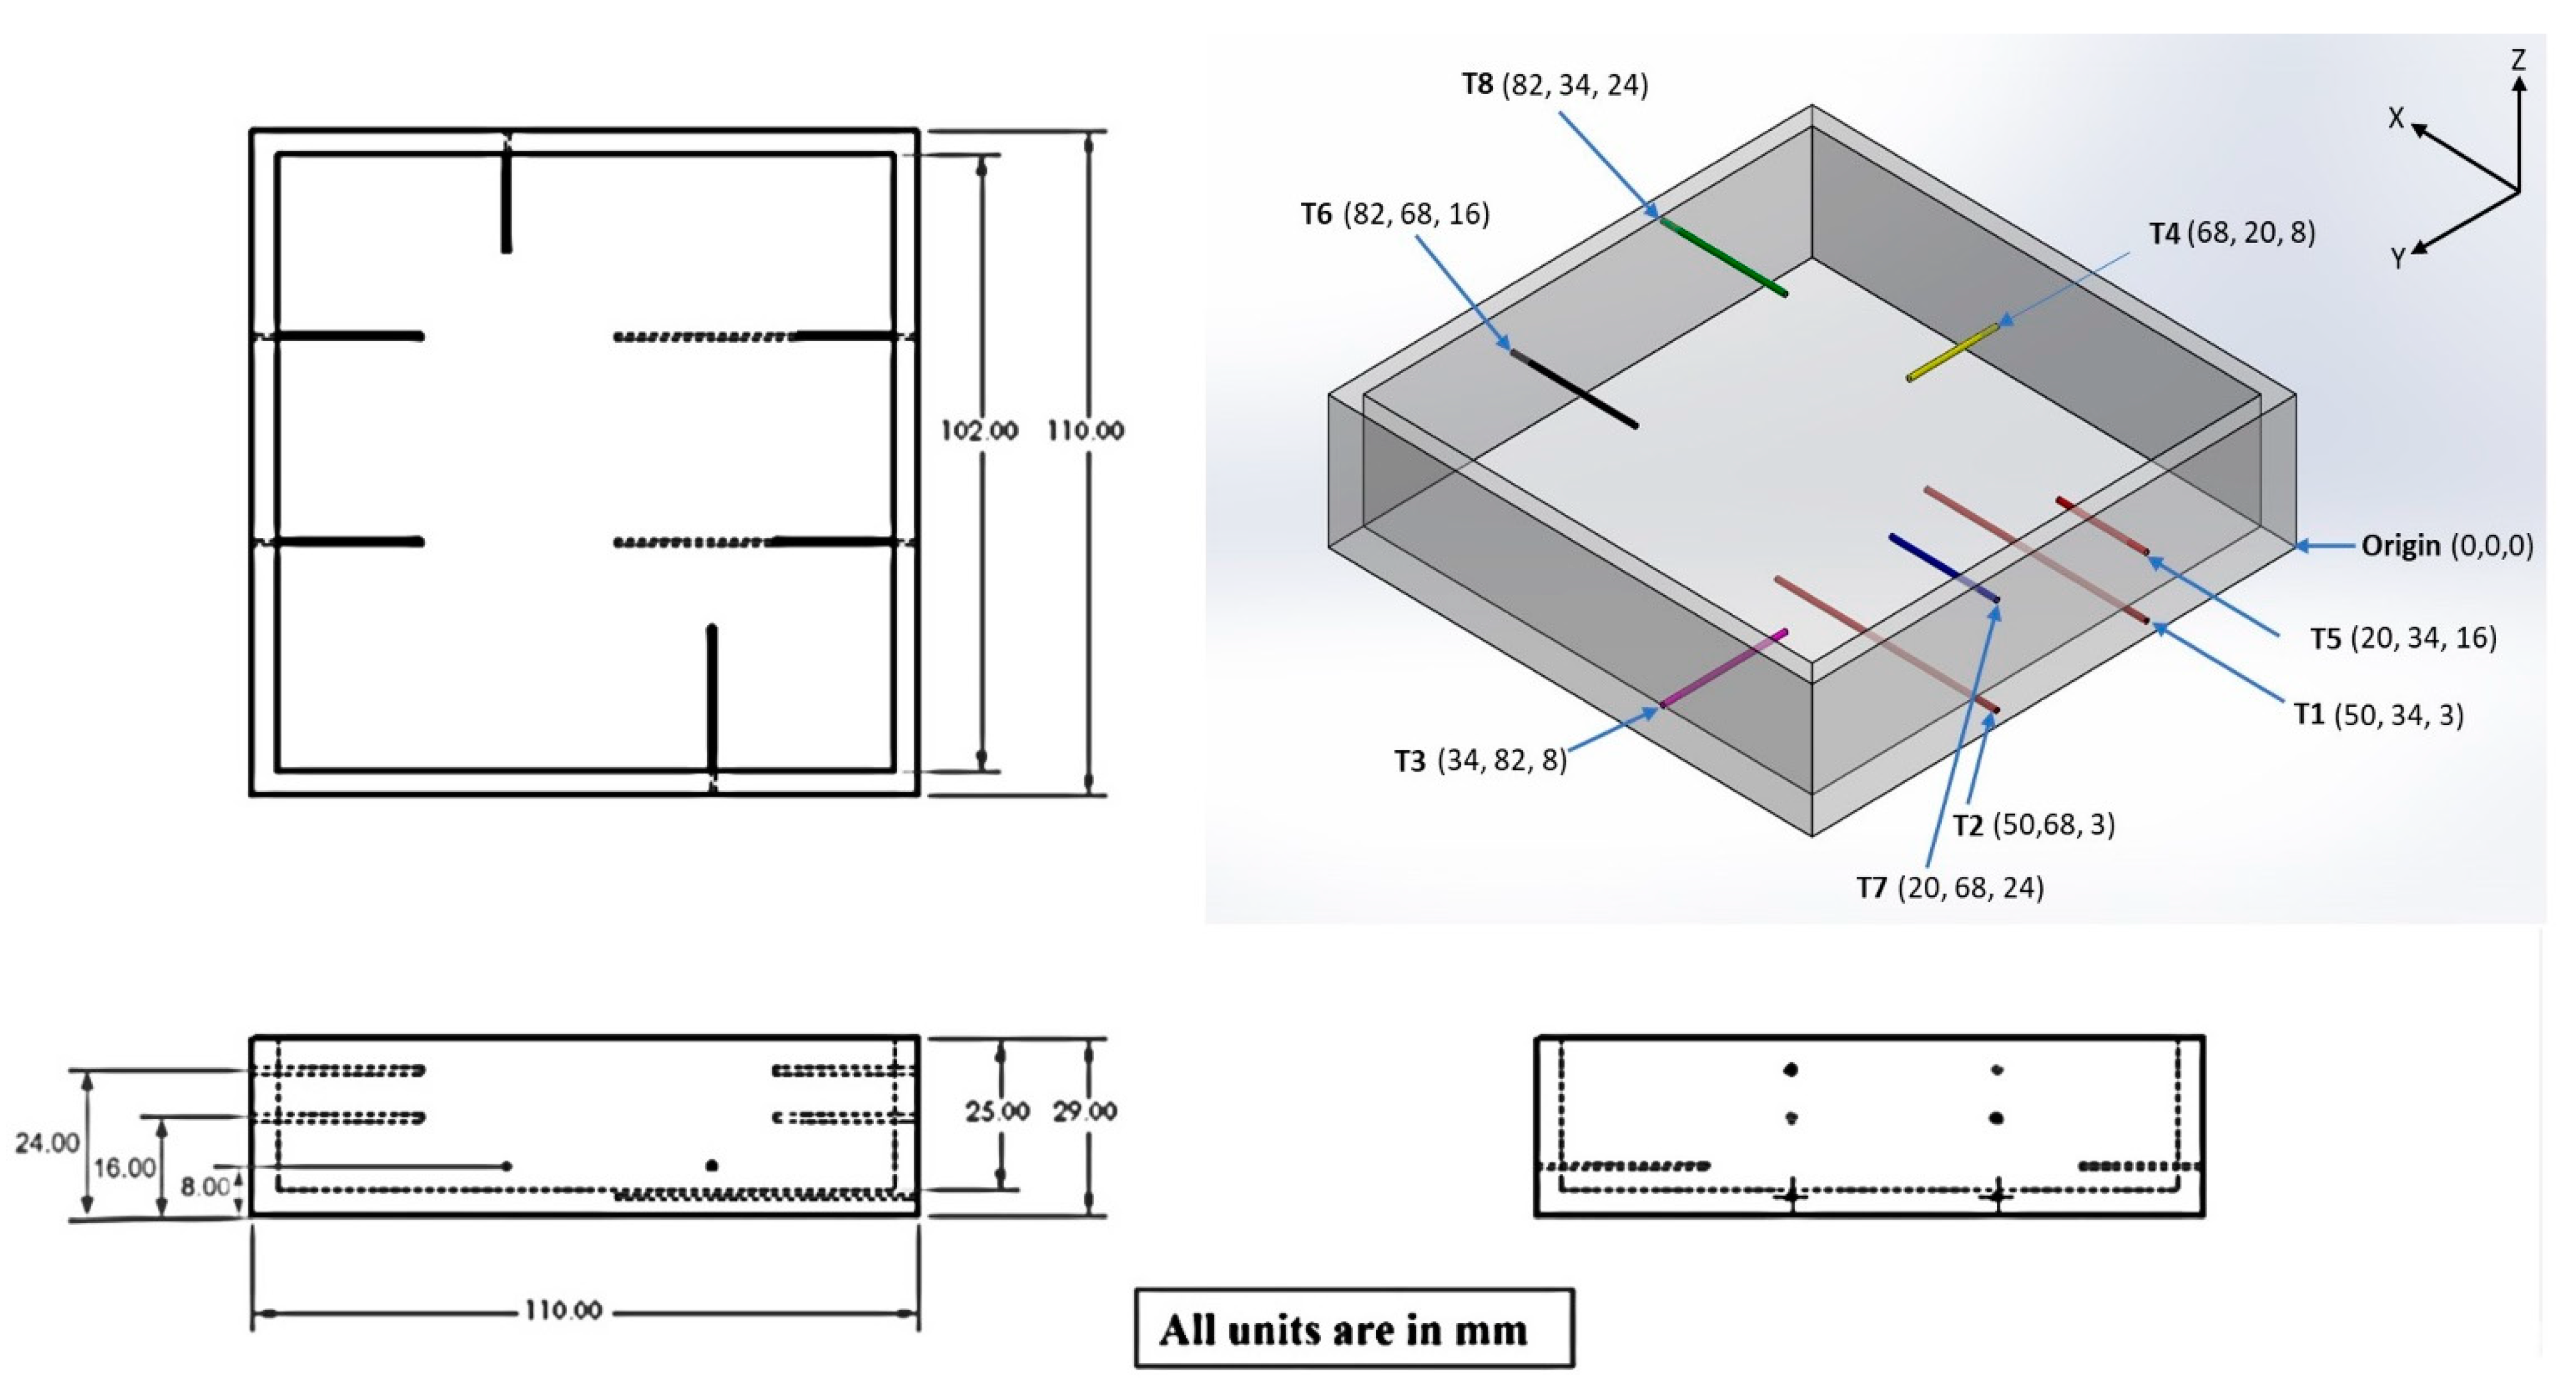
2.3. Thermocouples Positions
2.4. Thermal Management Analysis
- 0.01 wt.% GNPs enhanced PT-58 (G1-NEPCM) with and without copper foam;
- 0.02 wt.% GNPs enhanced PT-58 (G2-NEPCM) with and without copper foam;
- 0.01 wt.% MgO enhanced PT-58 (M1-NEPCM) with and without copper foam;
- 0.02 wt.% MgO enhanced PT-58 (M2-NEPCM) with and without copper foam.
Enhancement Ratio in Operational Time
2.5. Experimental Uncertainty Analysis
- final value of the variable;
- measured value of variable;
- uncertainty in the value of measured variable due to fluctuation in the readings and scale of instrument.
3. Results and Discussion
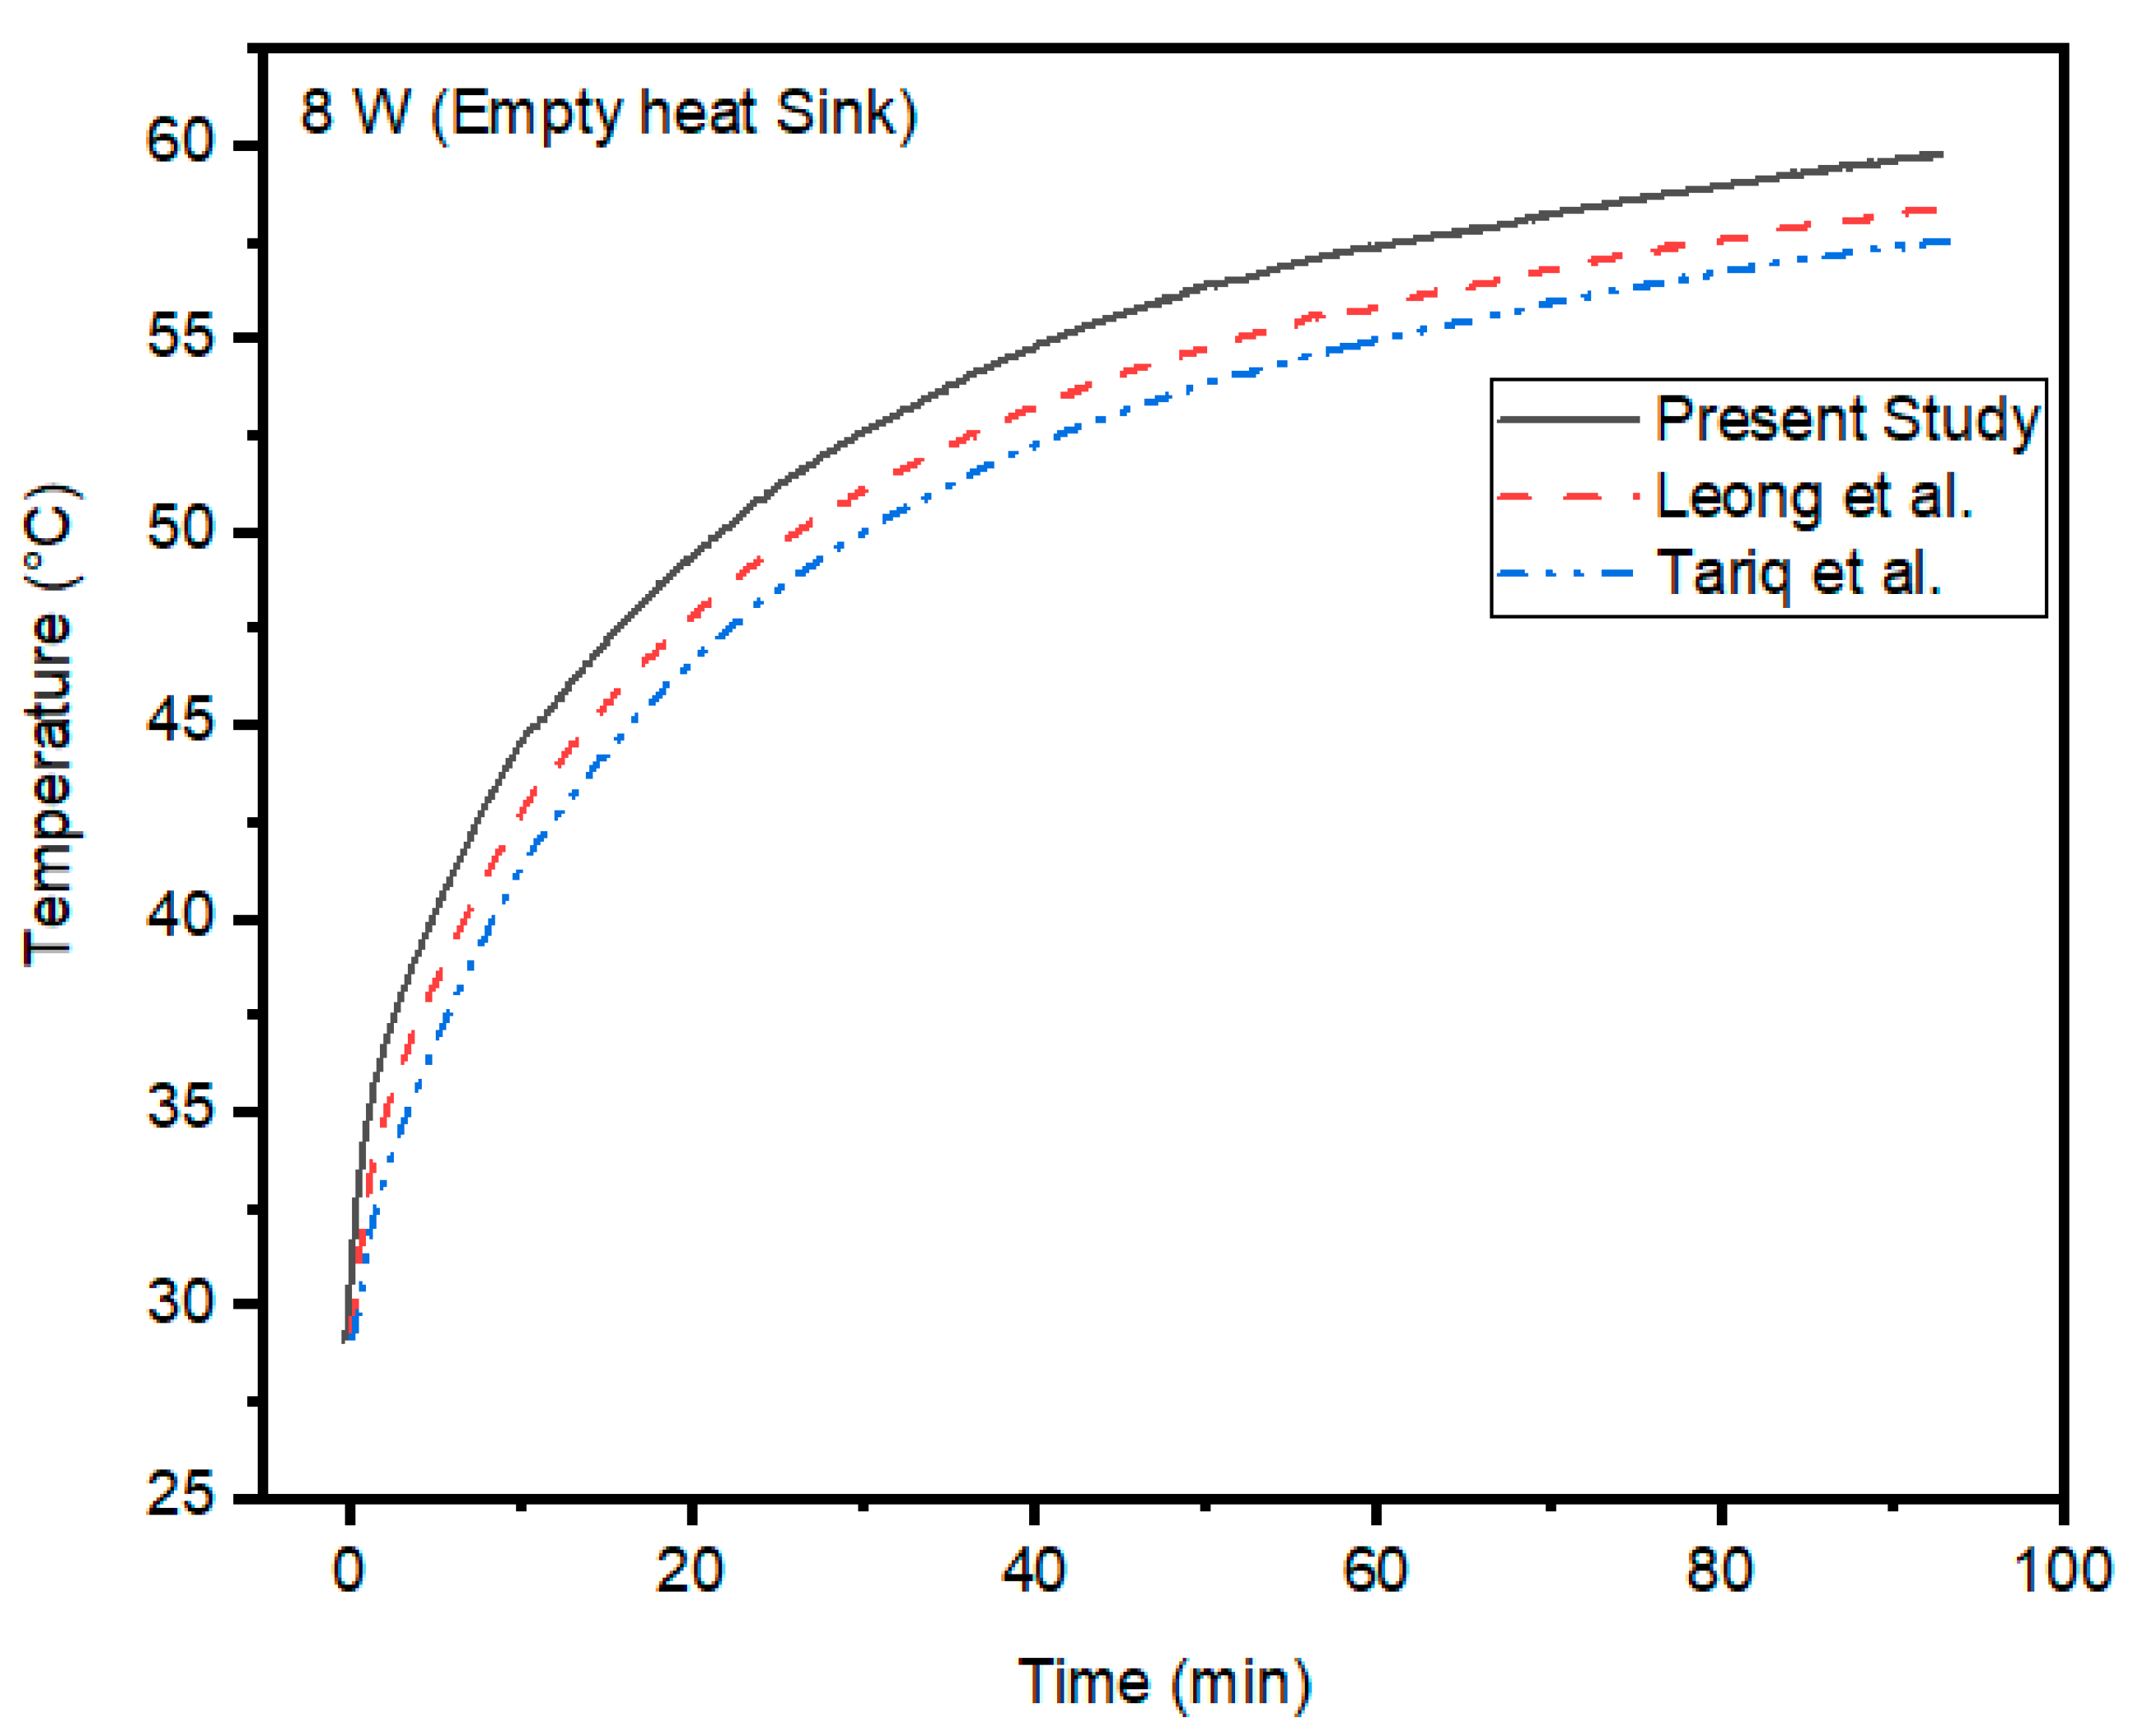
3.1. Validation of Experimentation Setup
3.2. Results and Discussion
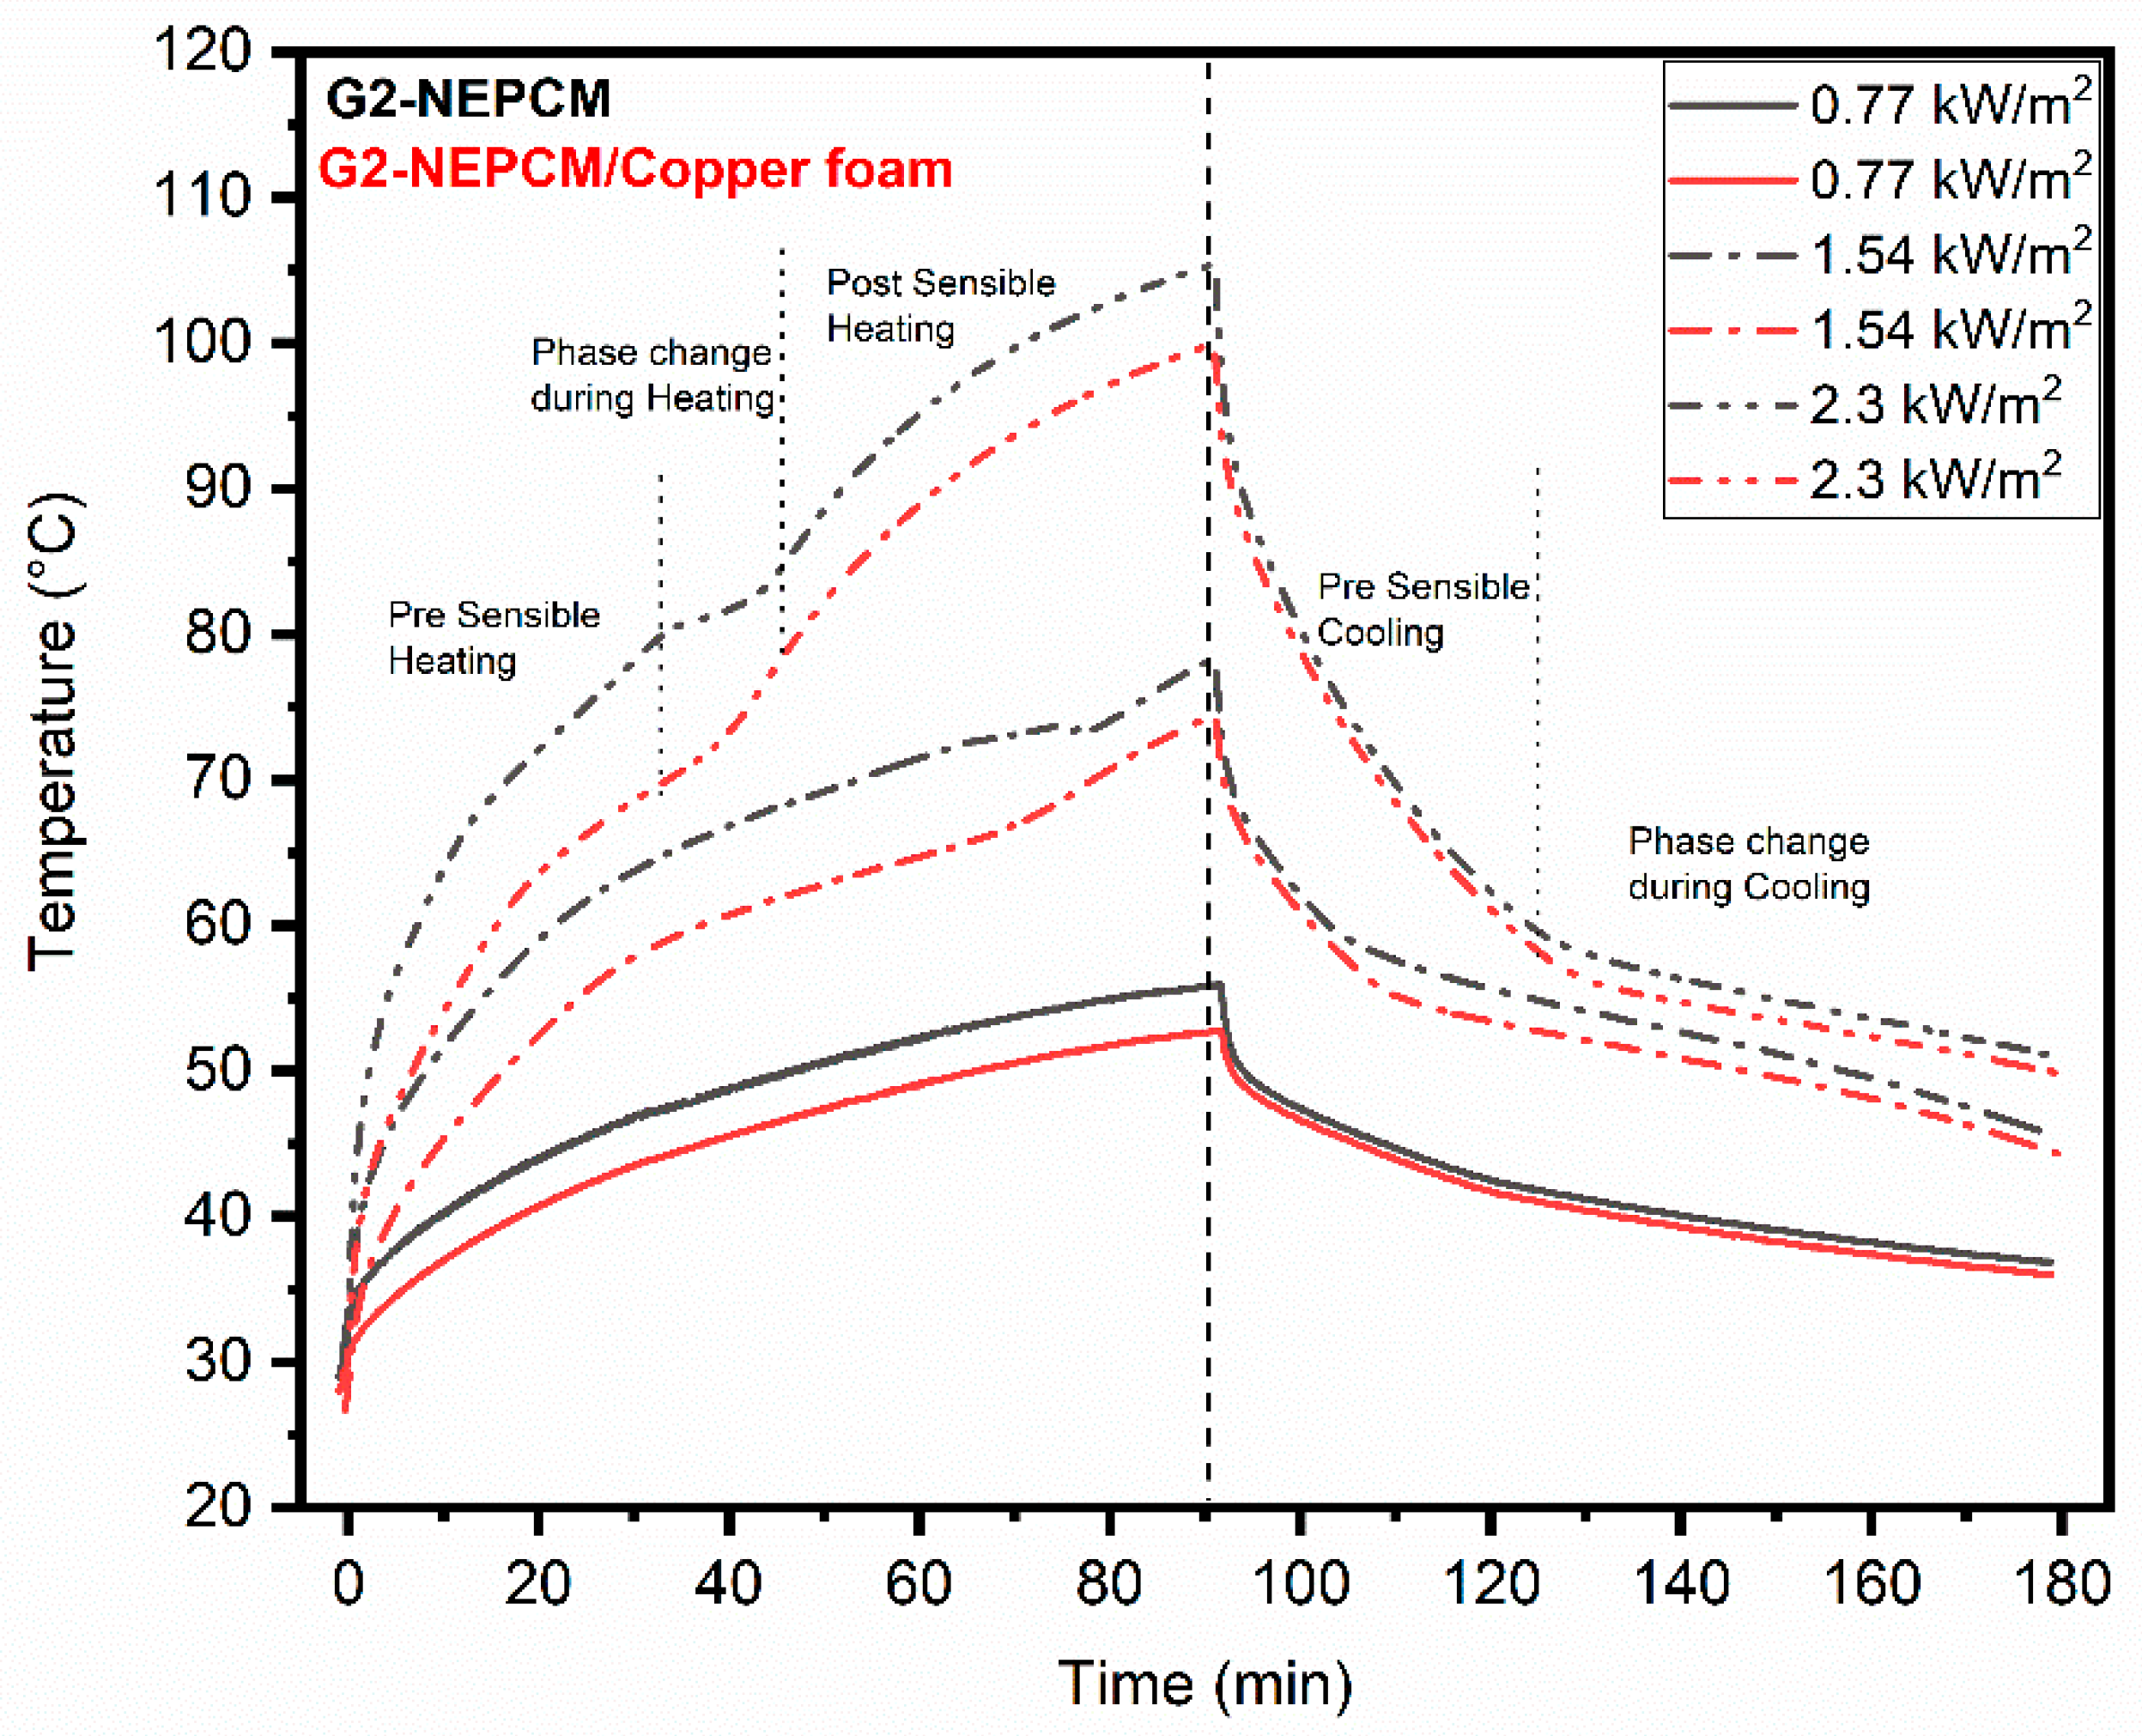
3.2.1. Base Temperature Comparison of Heat Sink with GNPs Composites
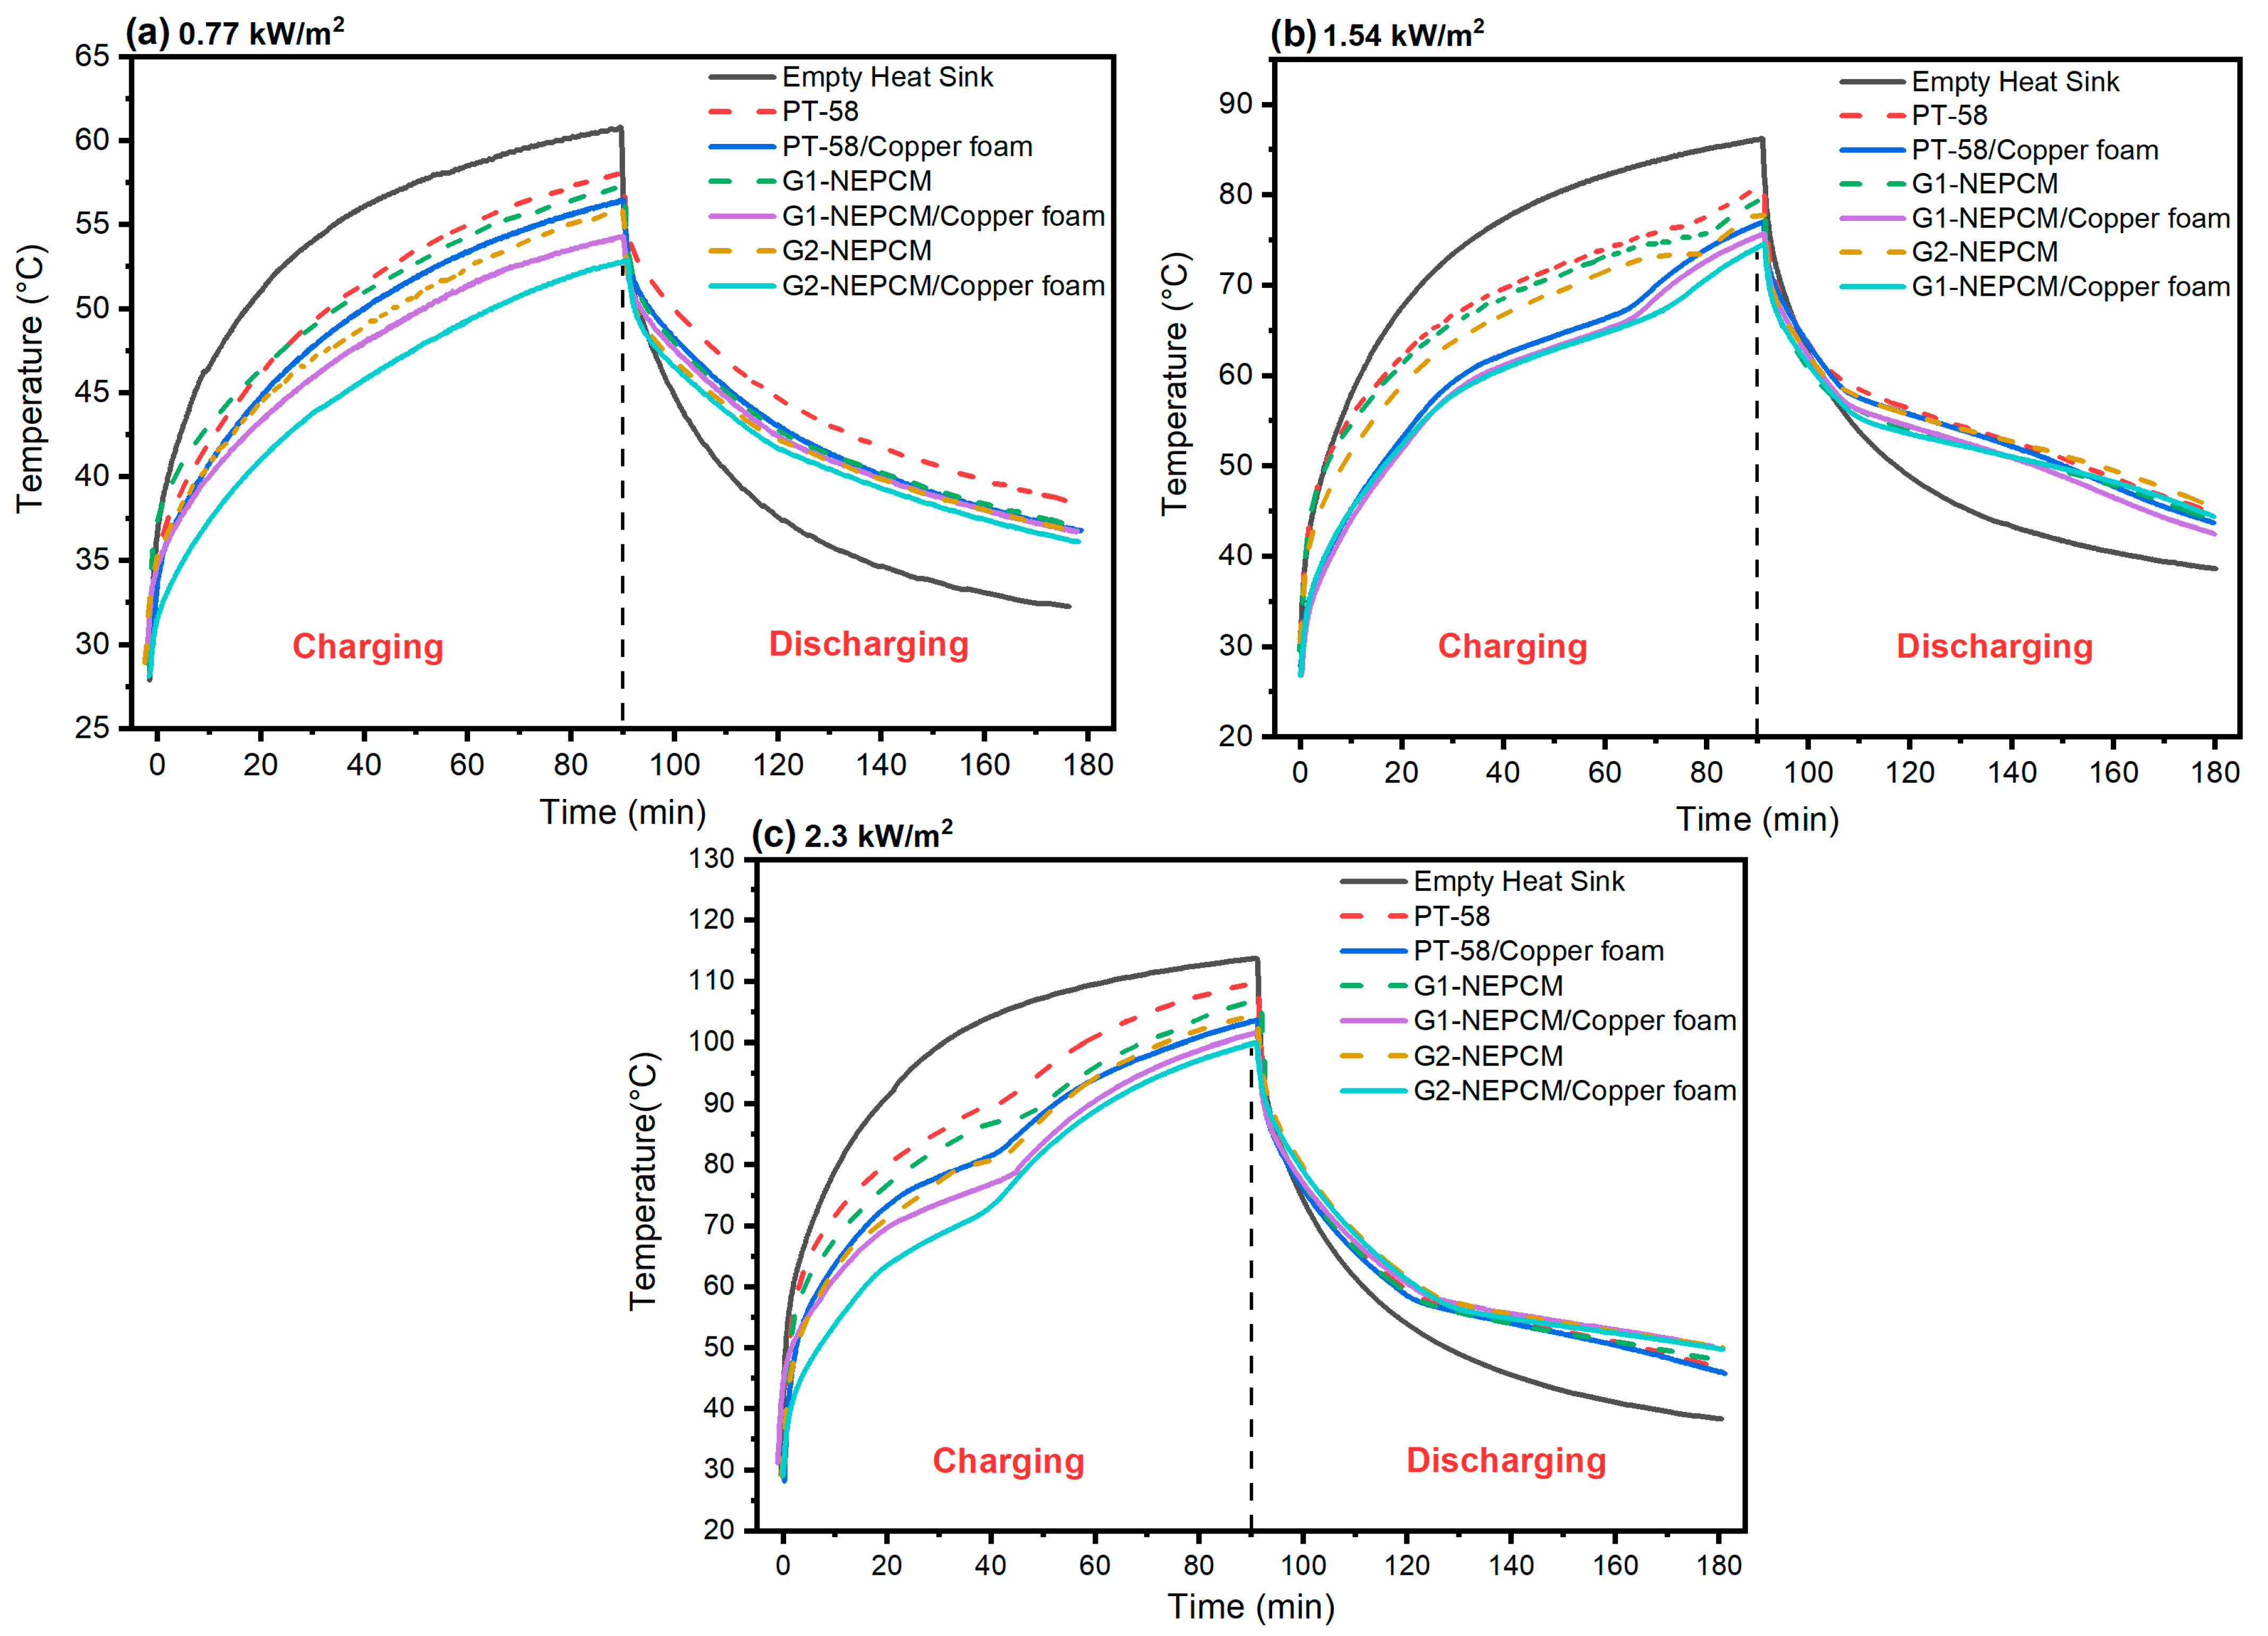
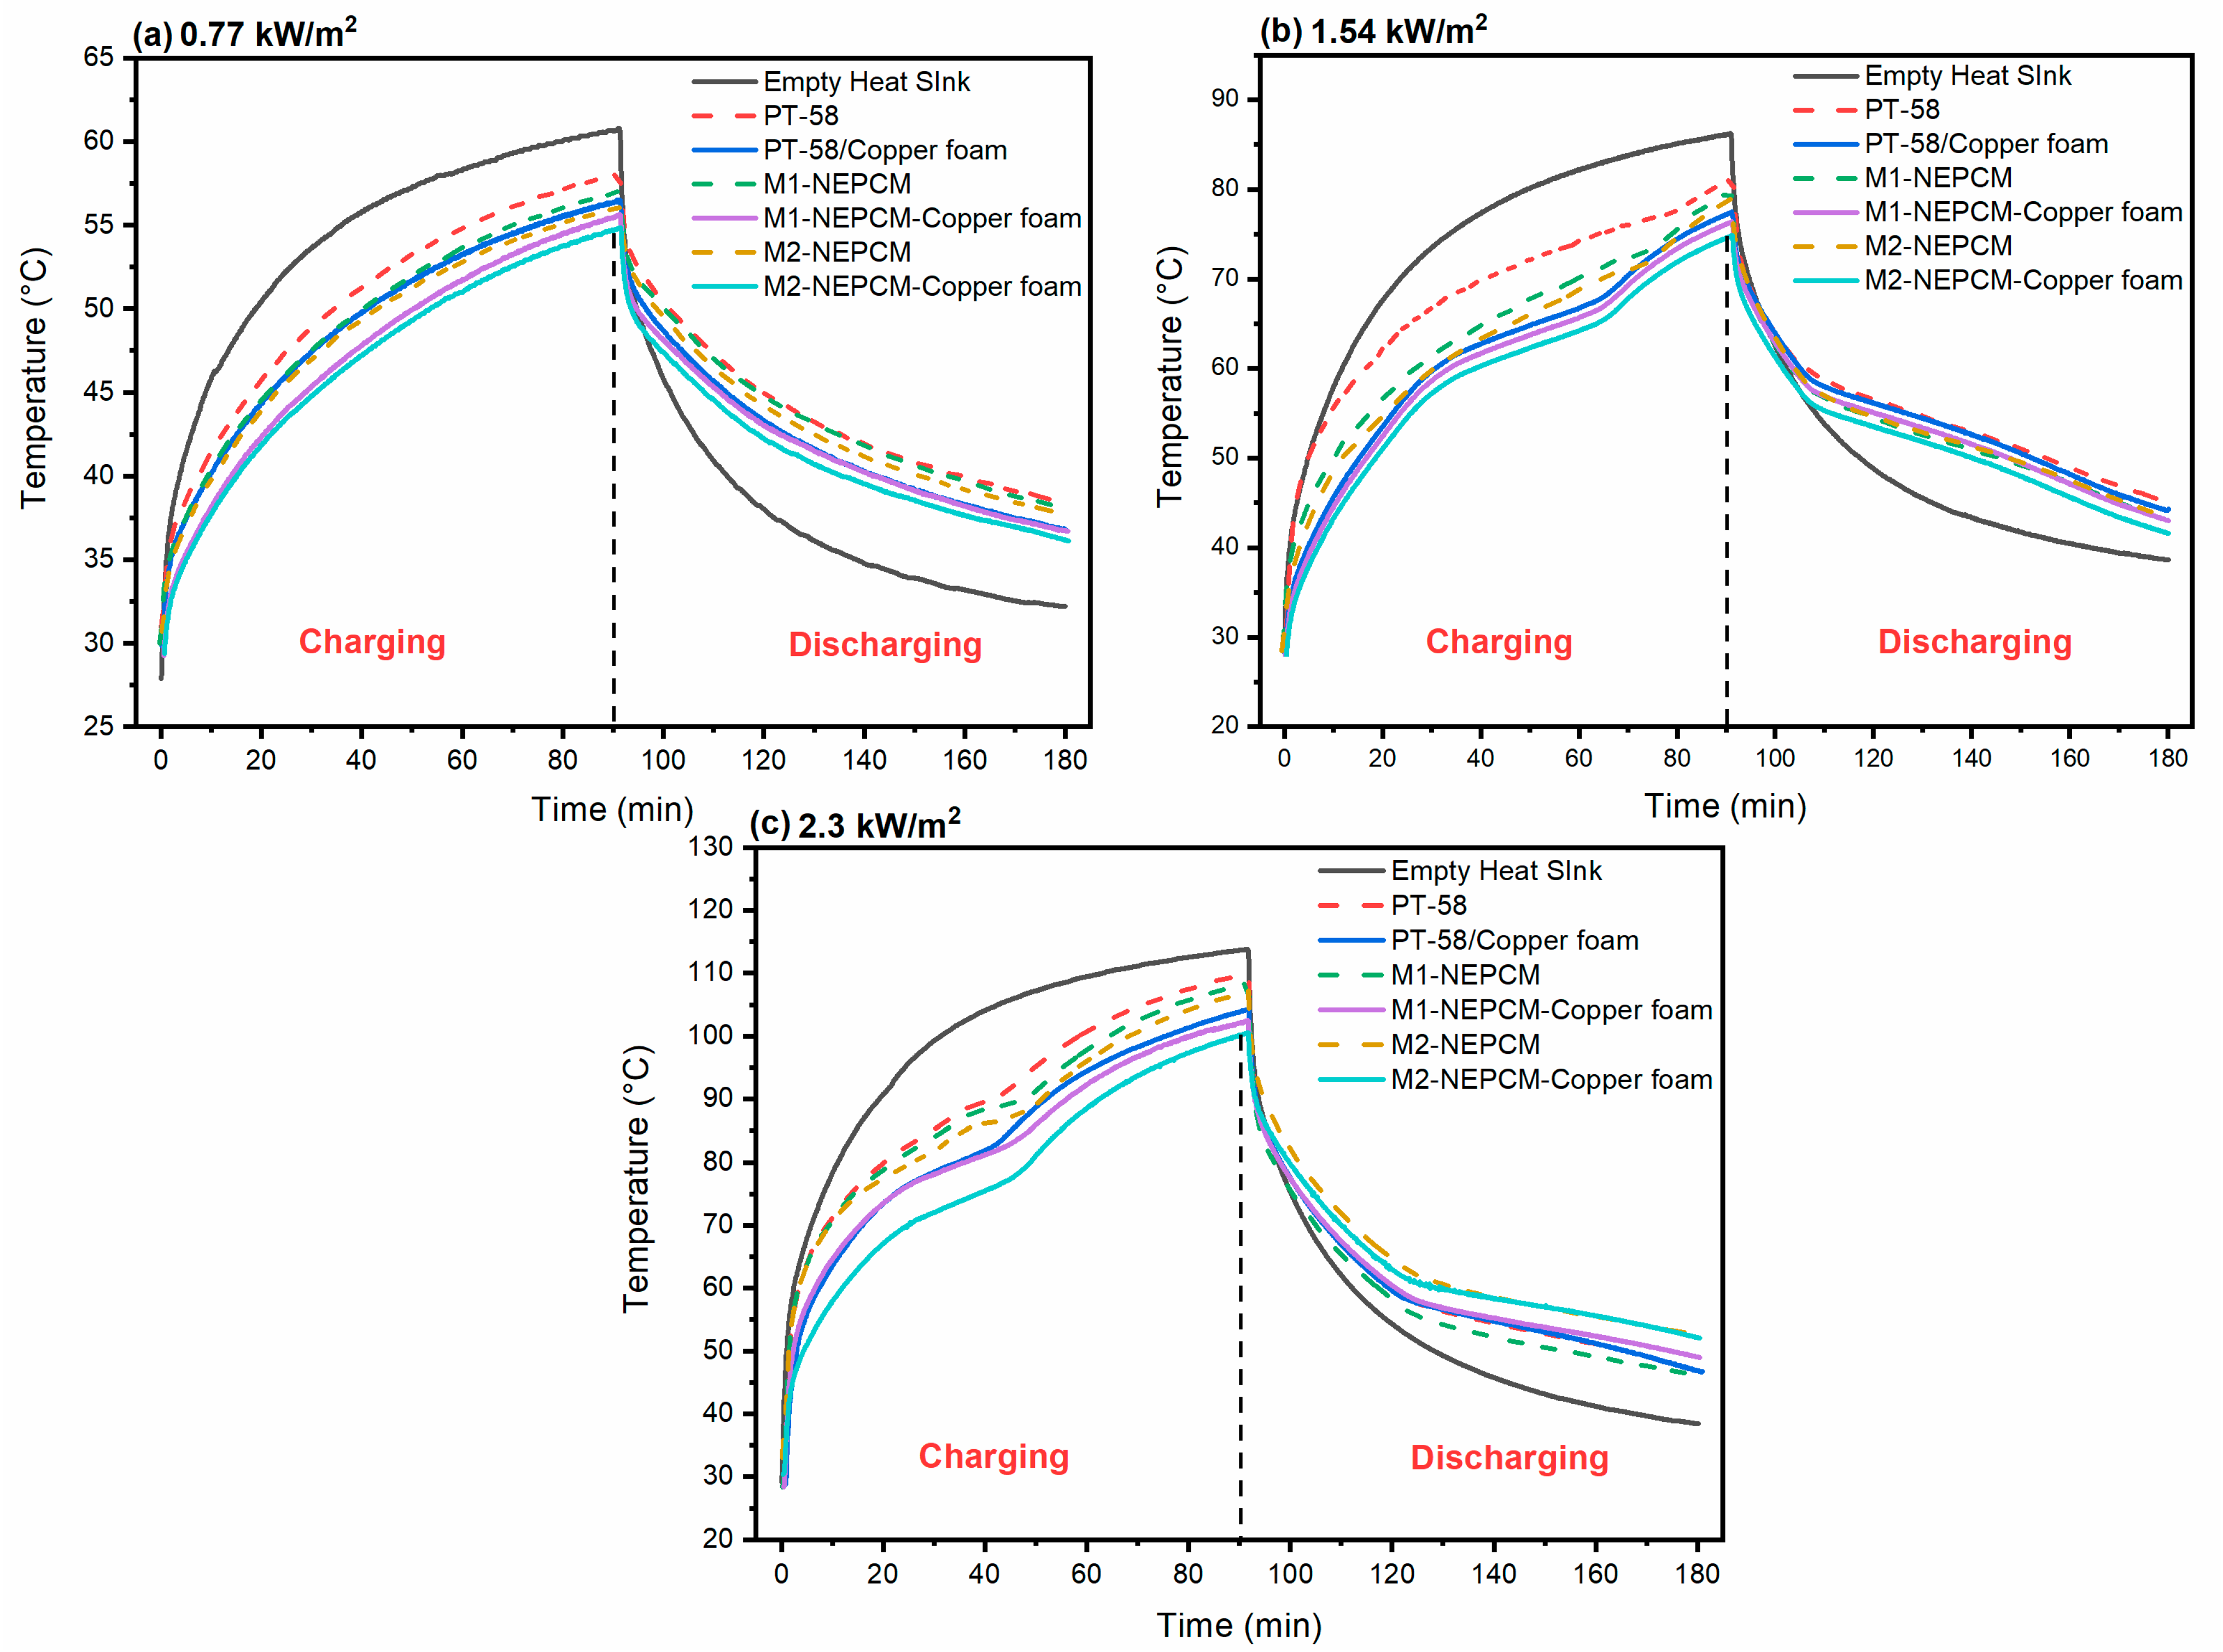
- At heating input of 0.77 kW/, the maximum temperature reduction of 13.03% was observed in the case of G2-NEPCM/copper foam as compared to empty heat sink. The discharing of NEPCM/copper foam case was better than that of simple PCM and NEPCM cases. The melting of PCM or NEPCM composites was not noticed in this case;
- For heating input of 1.54 kW/, maximum temperature reduction was 16% for G2-NEPCM/copper foam, while for G2-NEPCM case temperature decline of 9.1% was obsered as compared to empty heat sink case. For NEPCM and NEPCM/copper foam cases a sharp increase in temperature was noticed after the completion of the latent heating phase;
- At heating input of 2.3 kW/, maximum base temperature was reduced by 12.48% and 6.89% for G2-NEPCM, with and without copper foam insertion. The increase in volume fraction of NPs from 0.01 to 0.02 wt.% improved the heat transfer rate in both cases of with and without copper foam.
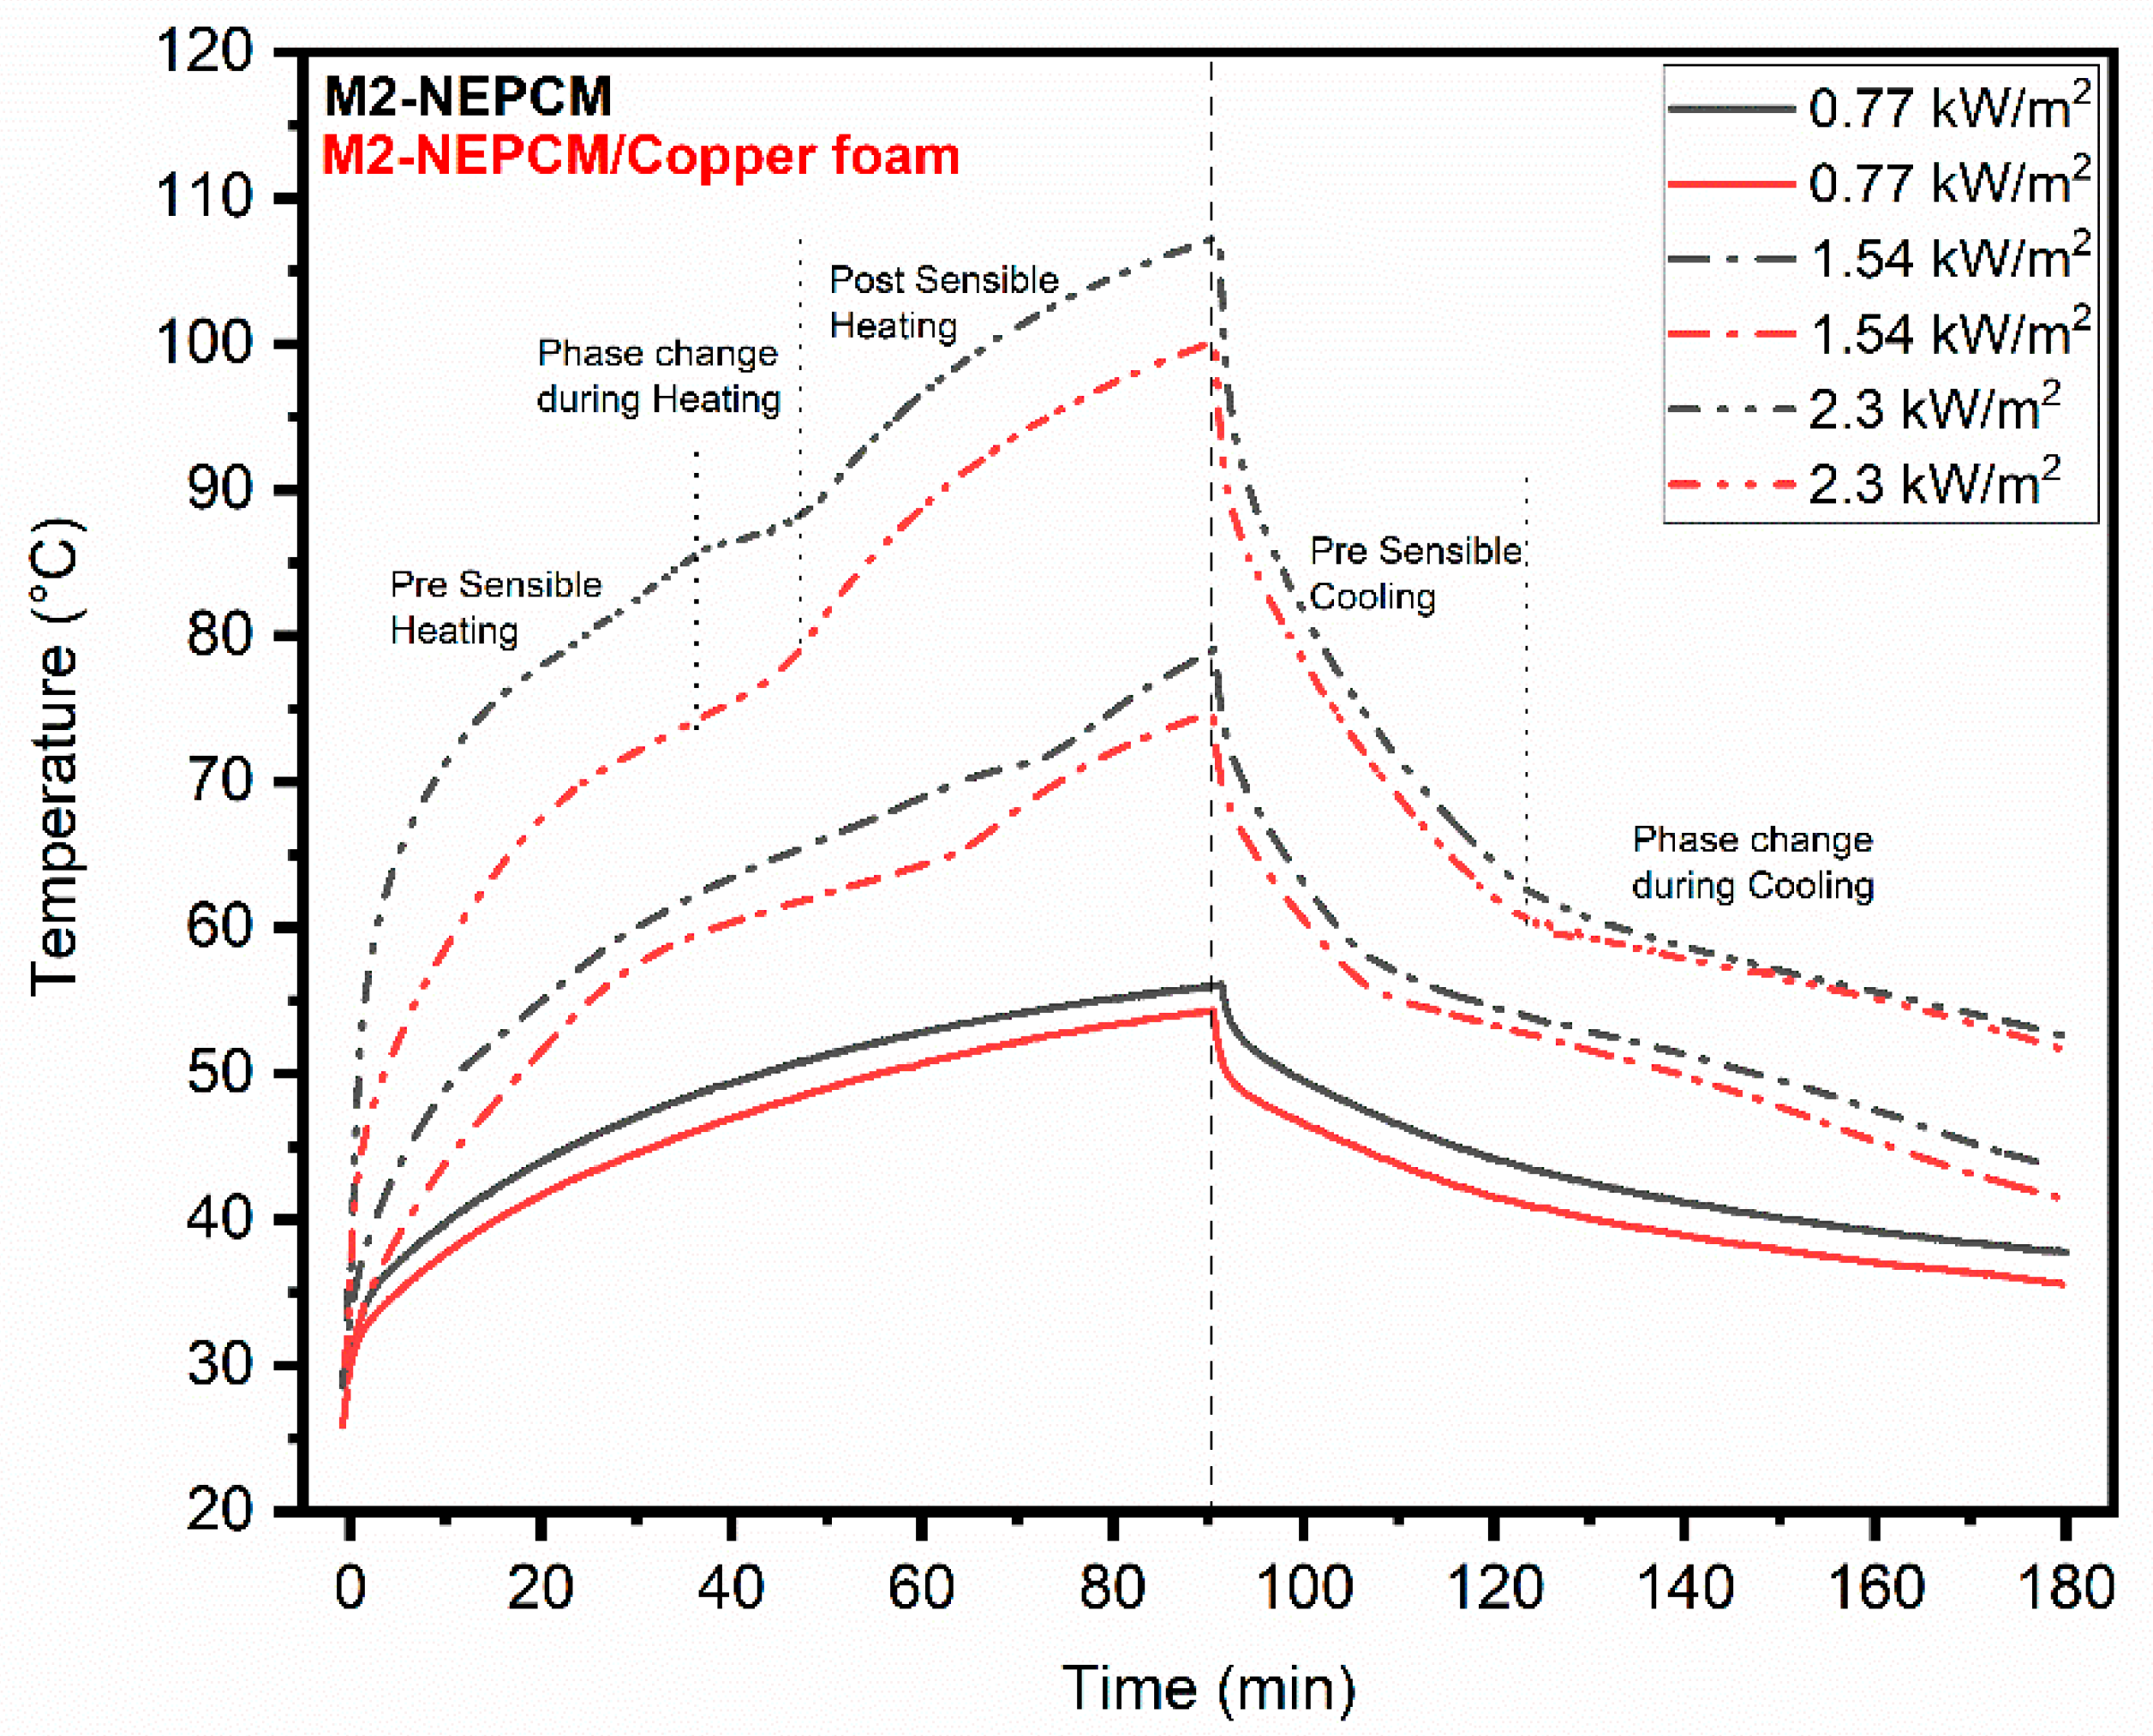
3.2.2. Base Temperature Comparison of Heat Sink with MgO Composites
- For a heating load of 0.77 kW/, the maximum temperature of base was reduced by 9.7% and 7.6% for M2-NEPCM, with and without copper foam, respectively. At the end of discharging for NEPCM/copper foam composite gave lower temperature than simple NEPCM cases due to better heat dissipation rate.
- At heating input of 1.54 kW/, maximum temperature of base was decreased by 11.38% and 13.38% for M2-NEPCM, with and without copper foam, respectively. The combined usage of MgO NPs and copper foam gave smooth PCM melting profile and offered lower base temperatures;
- Similarly, at heating input of 2.3 kW/ for M2-NEPCM, with and without copper foam, temperature reduction of 11.62% and 5.3% was noticed. At high heating load, PCM was completely melted for both NEPCM and NEPCM/copper foam cases, thus increasing the heat sink base temperature considerably. The discharging at this load was better in the case of M2-NEPCM, with and without copper foam cases.
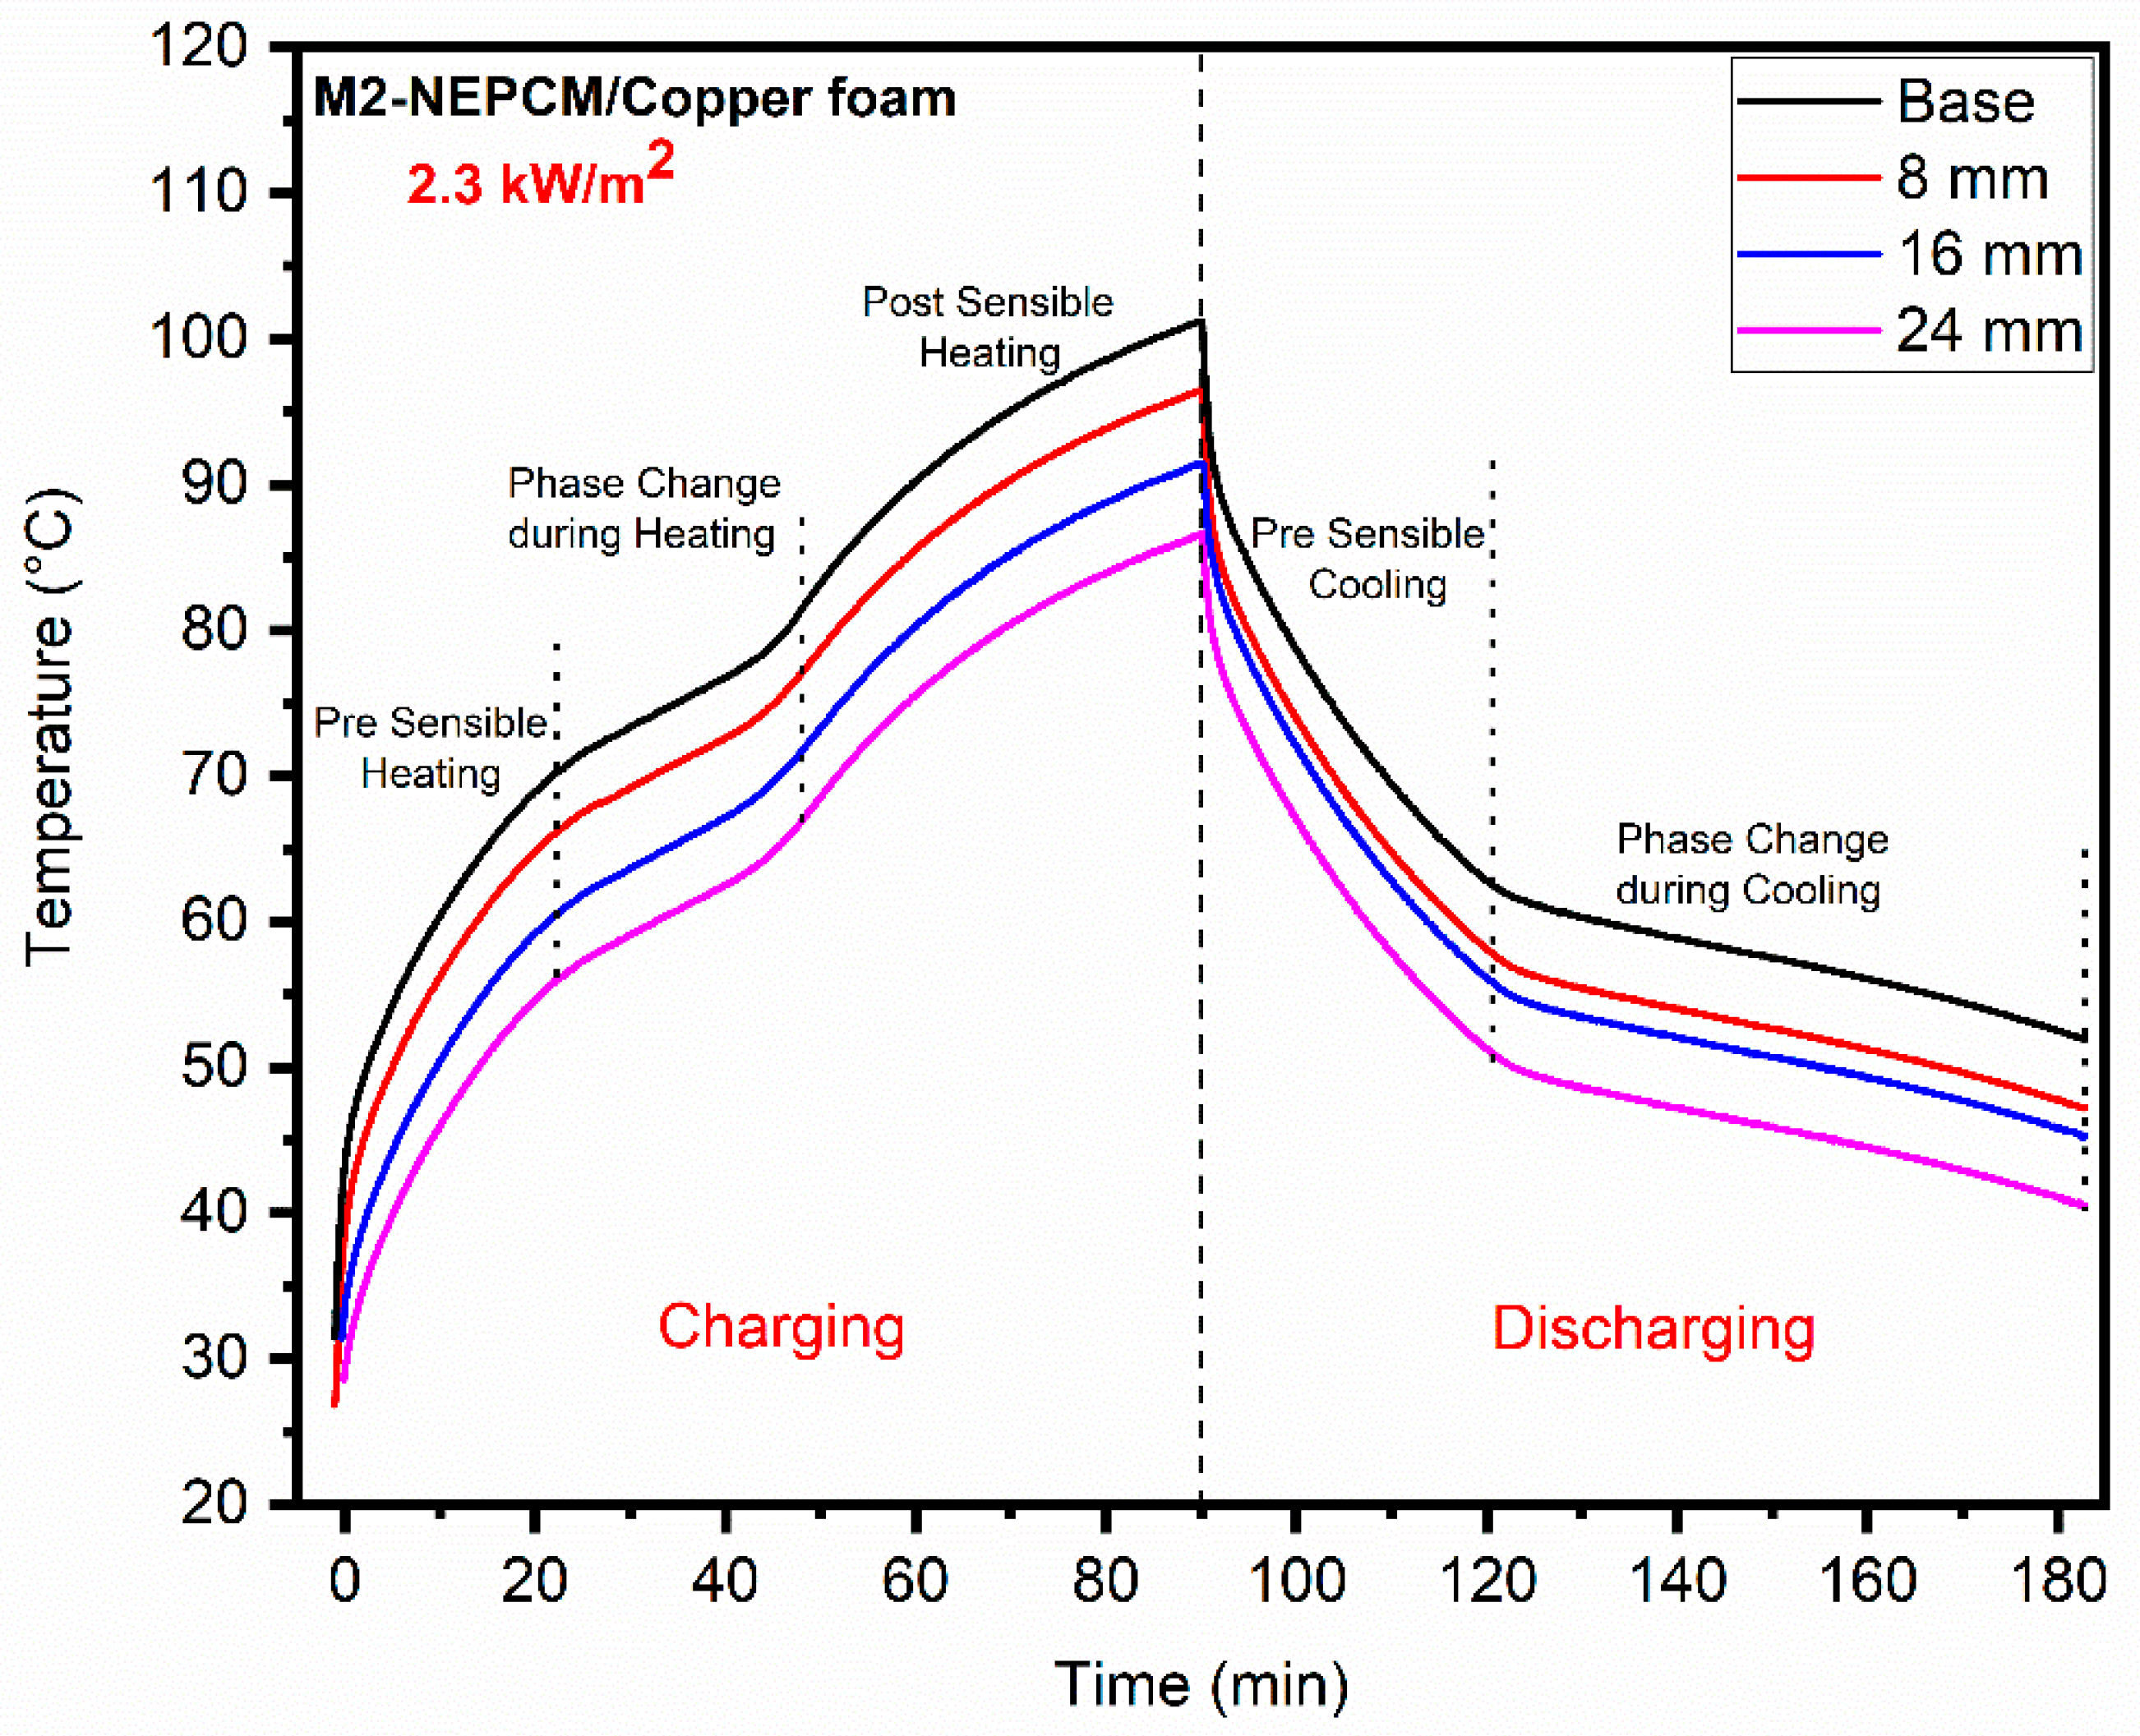
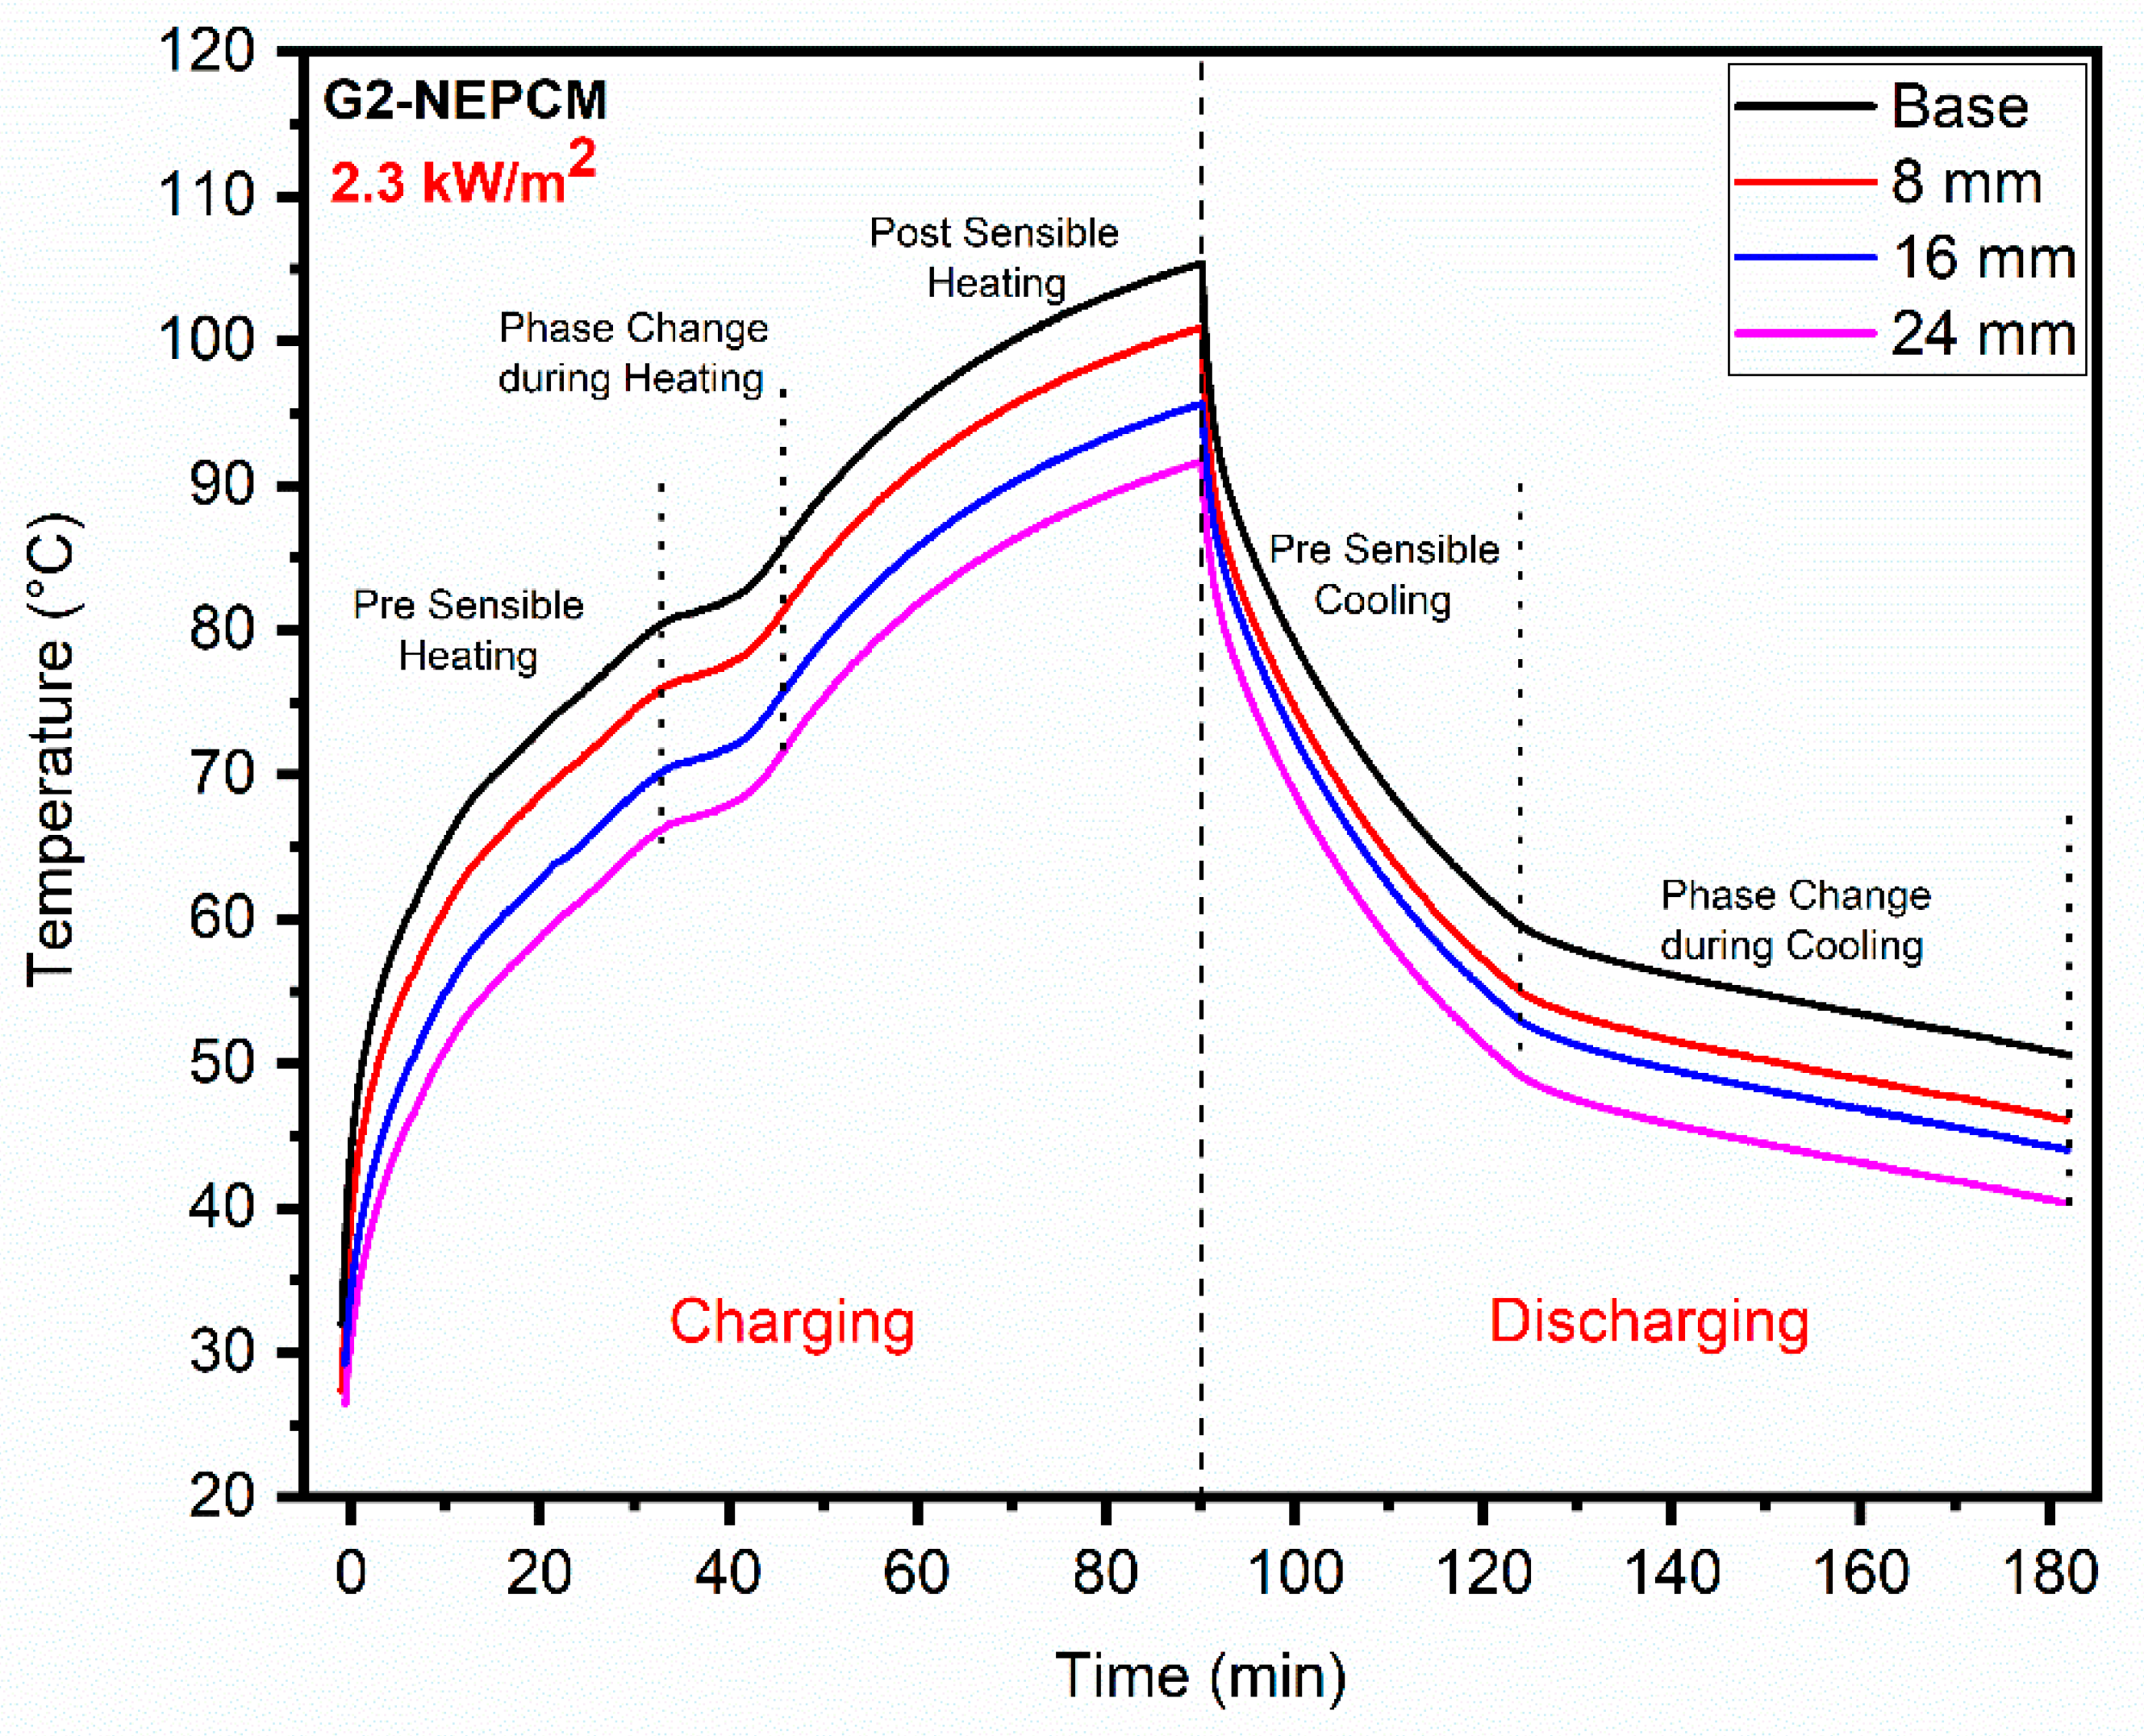
3.2.3. Spatial Variations in Temperature in Heat Sink
3.2.4. Effect of Different Heating Inputs on Heat Sink
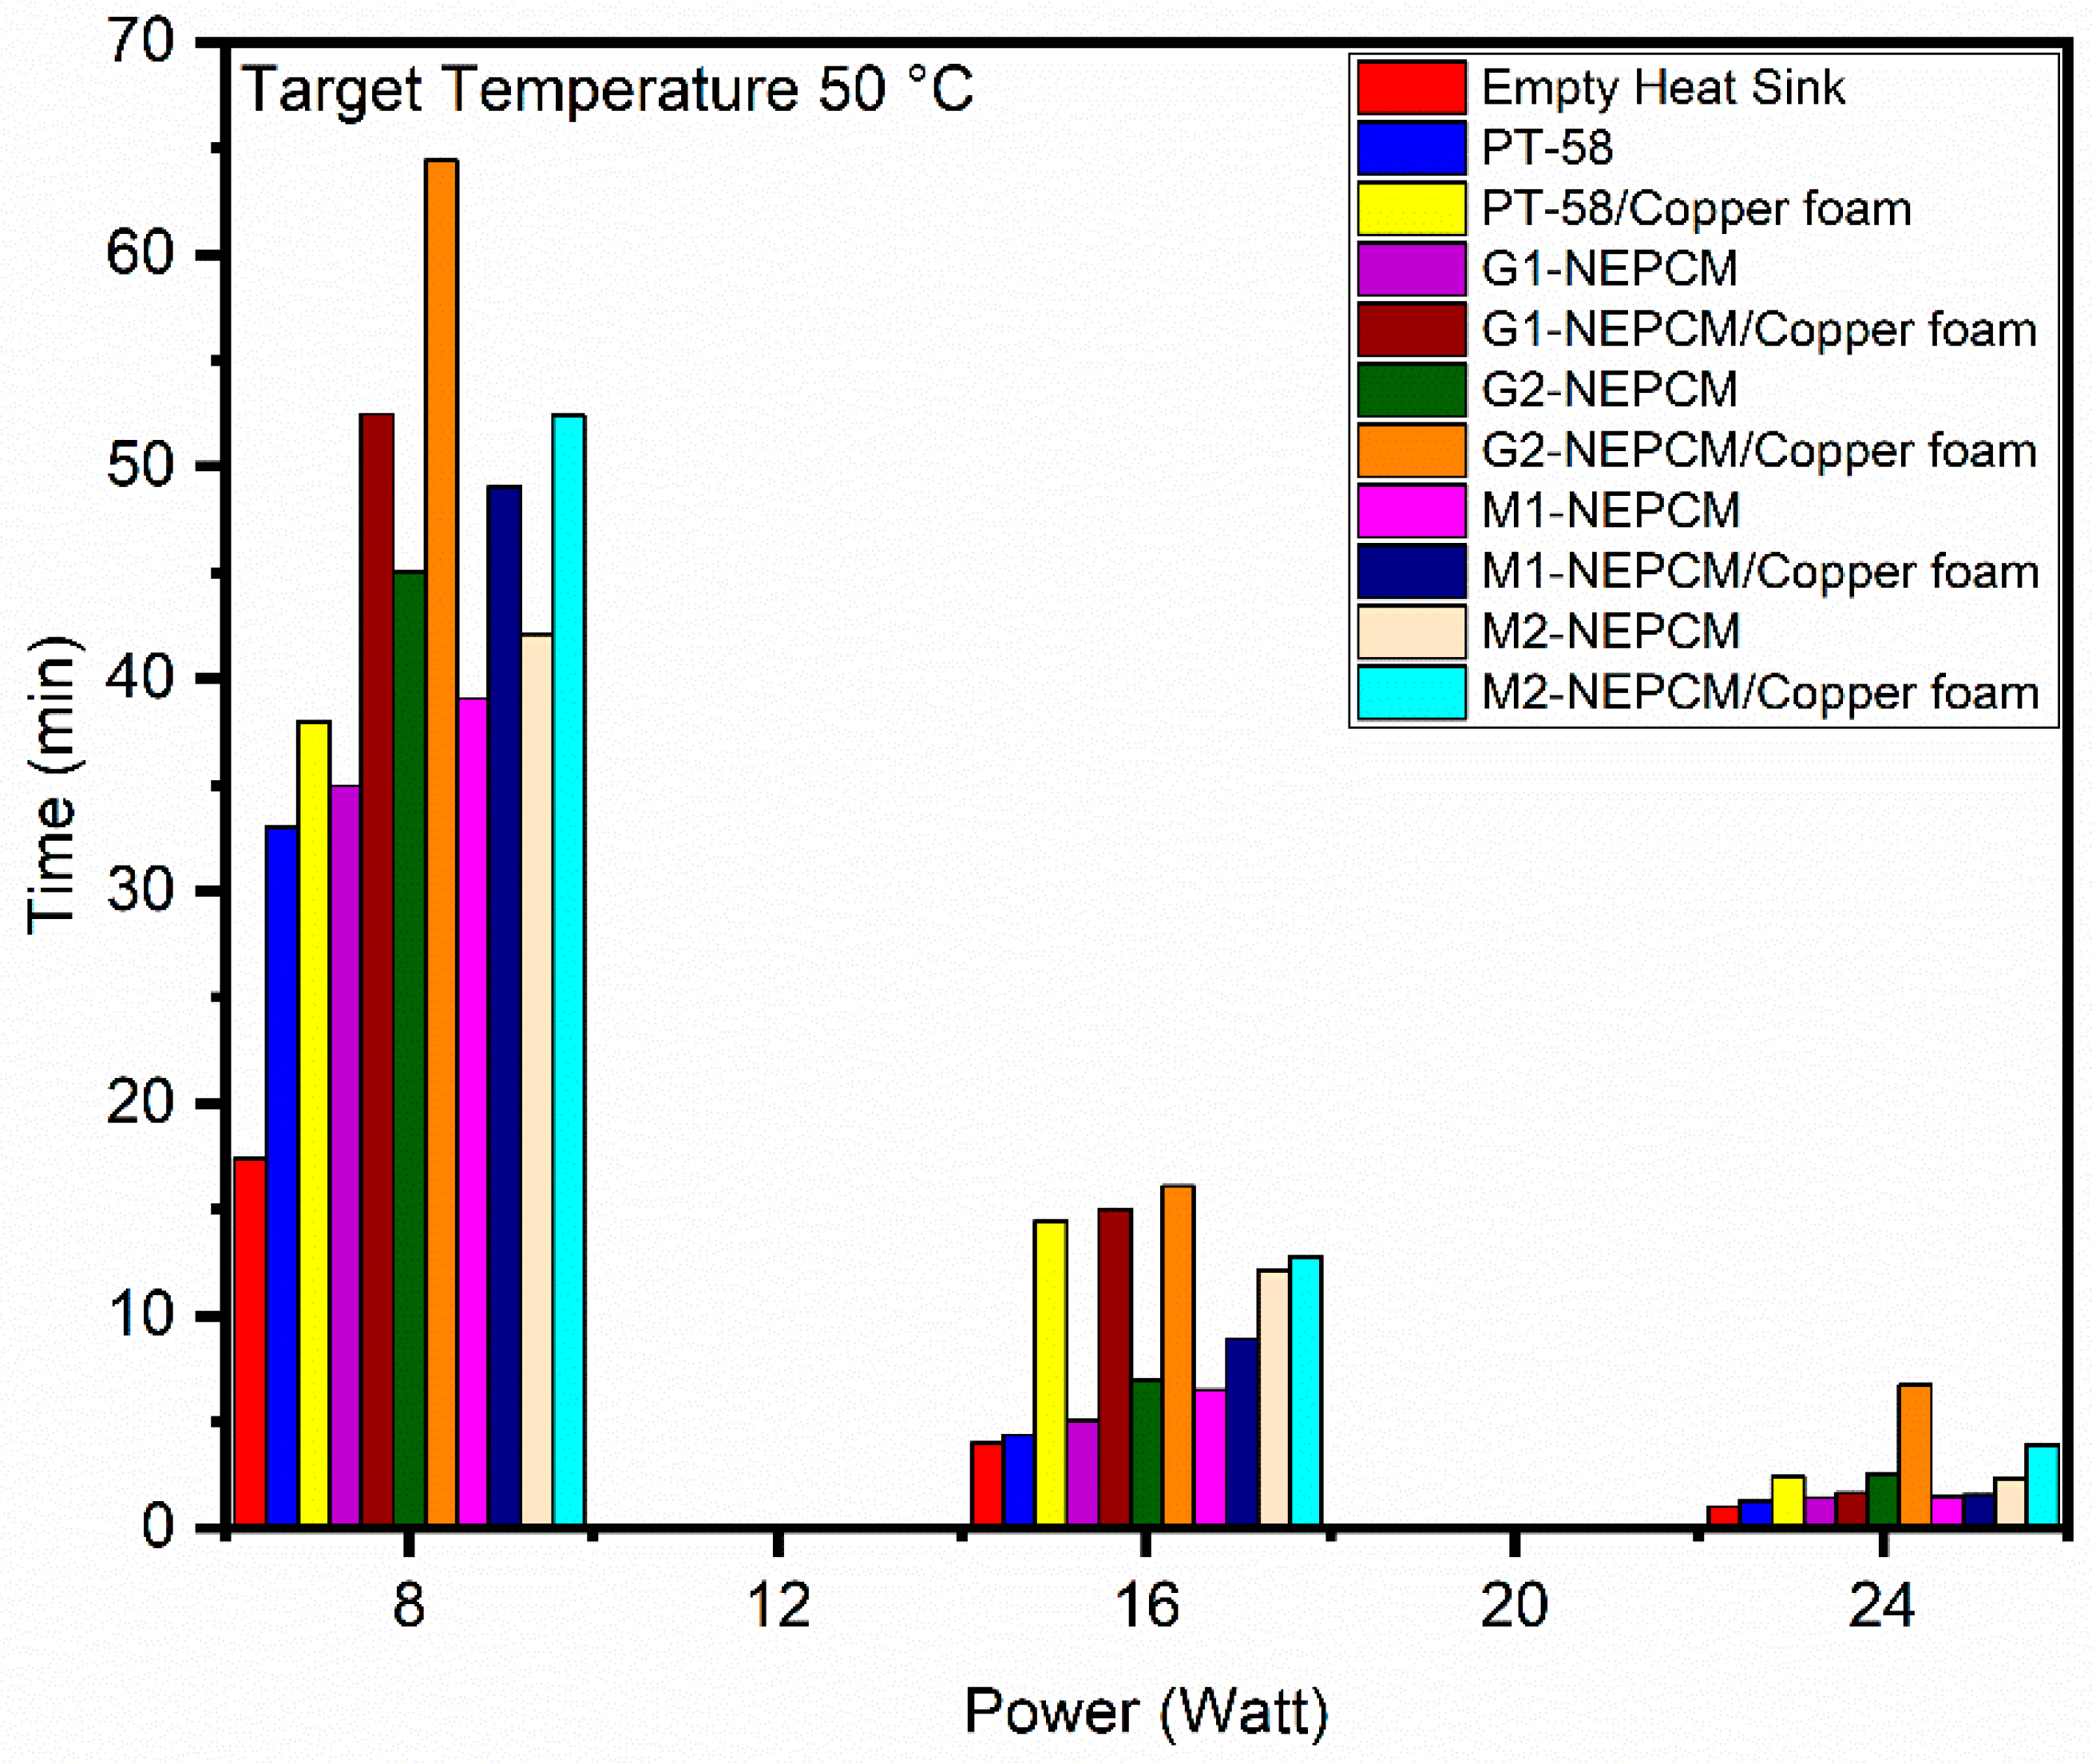
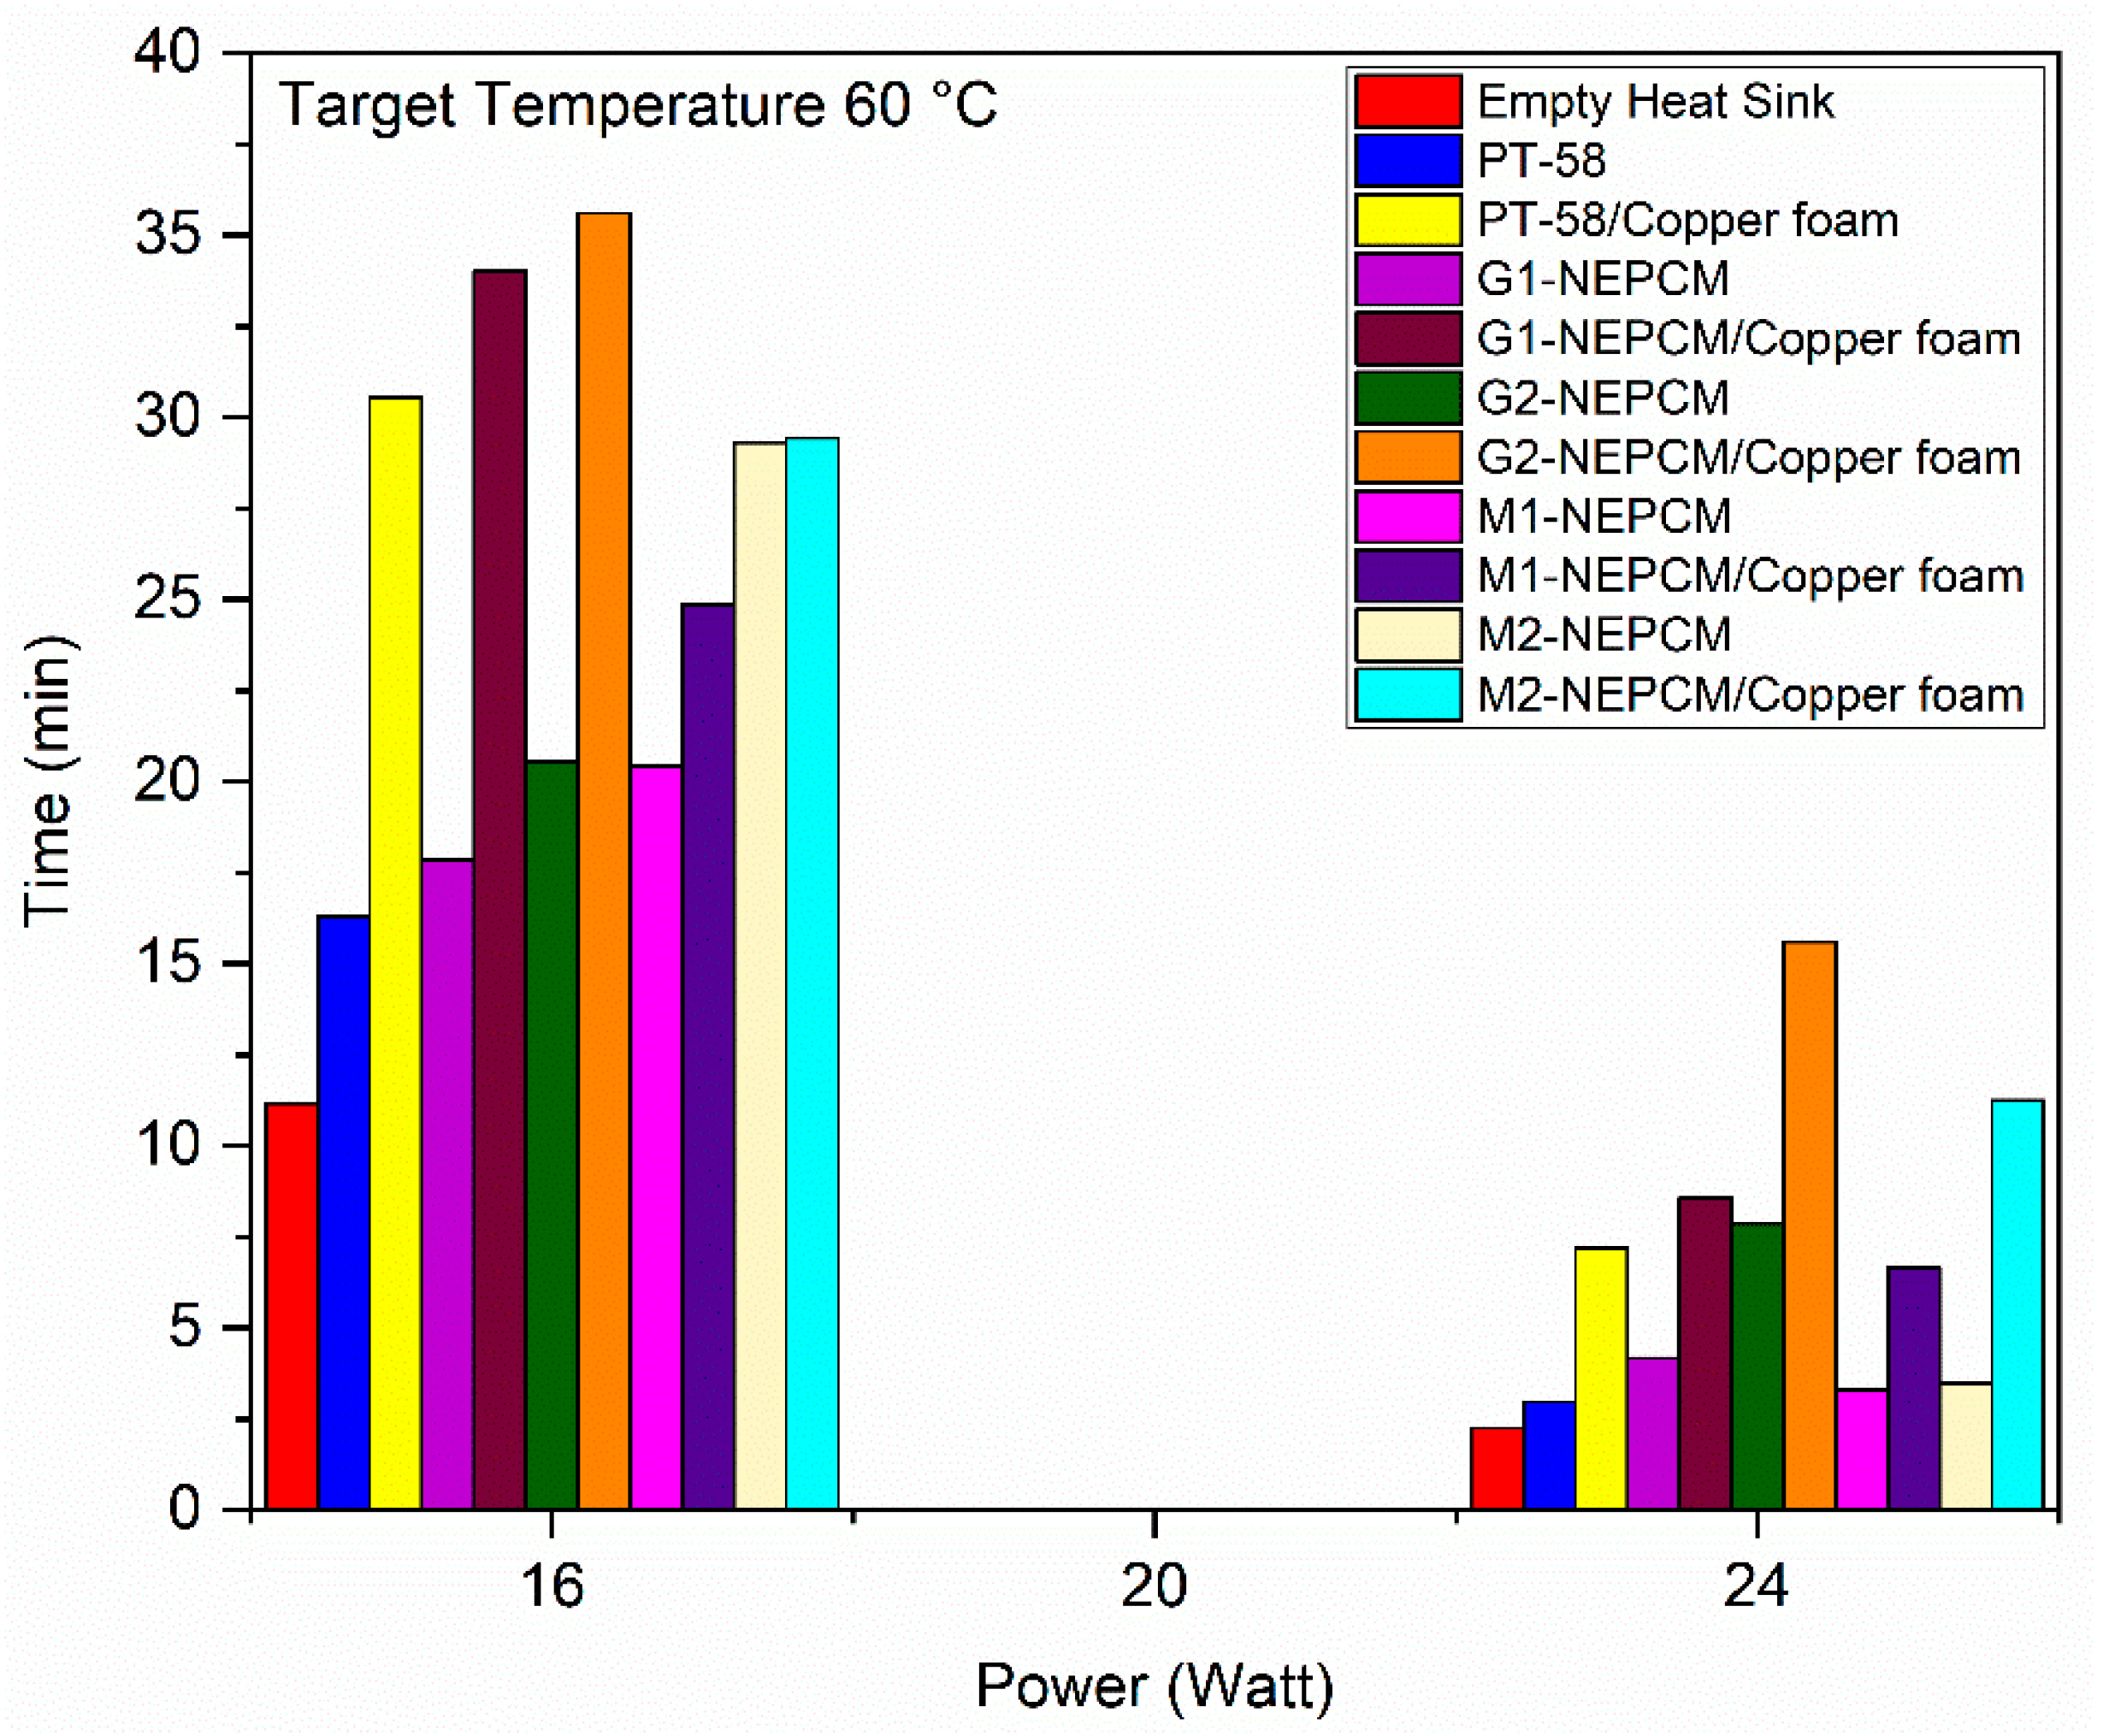
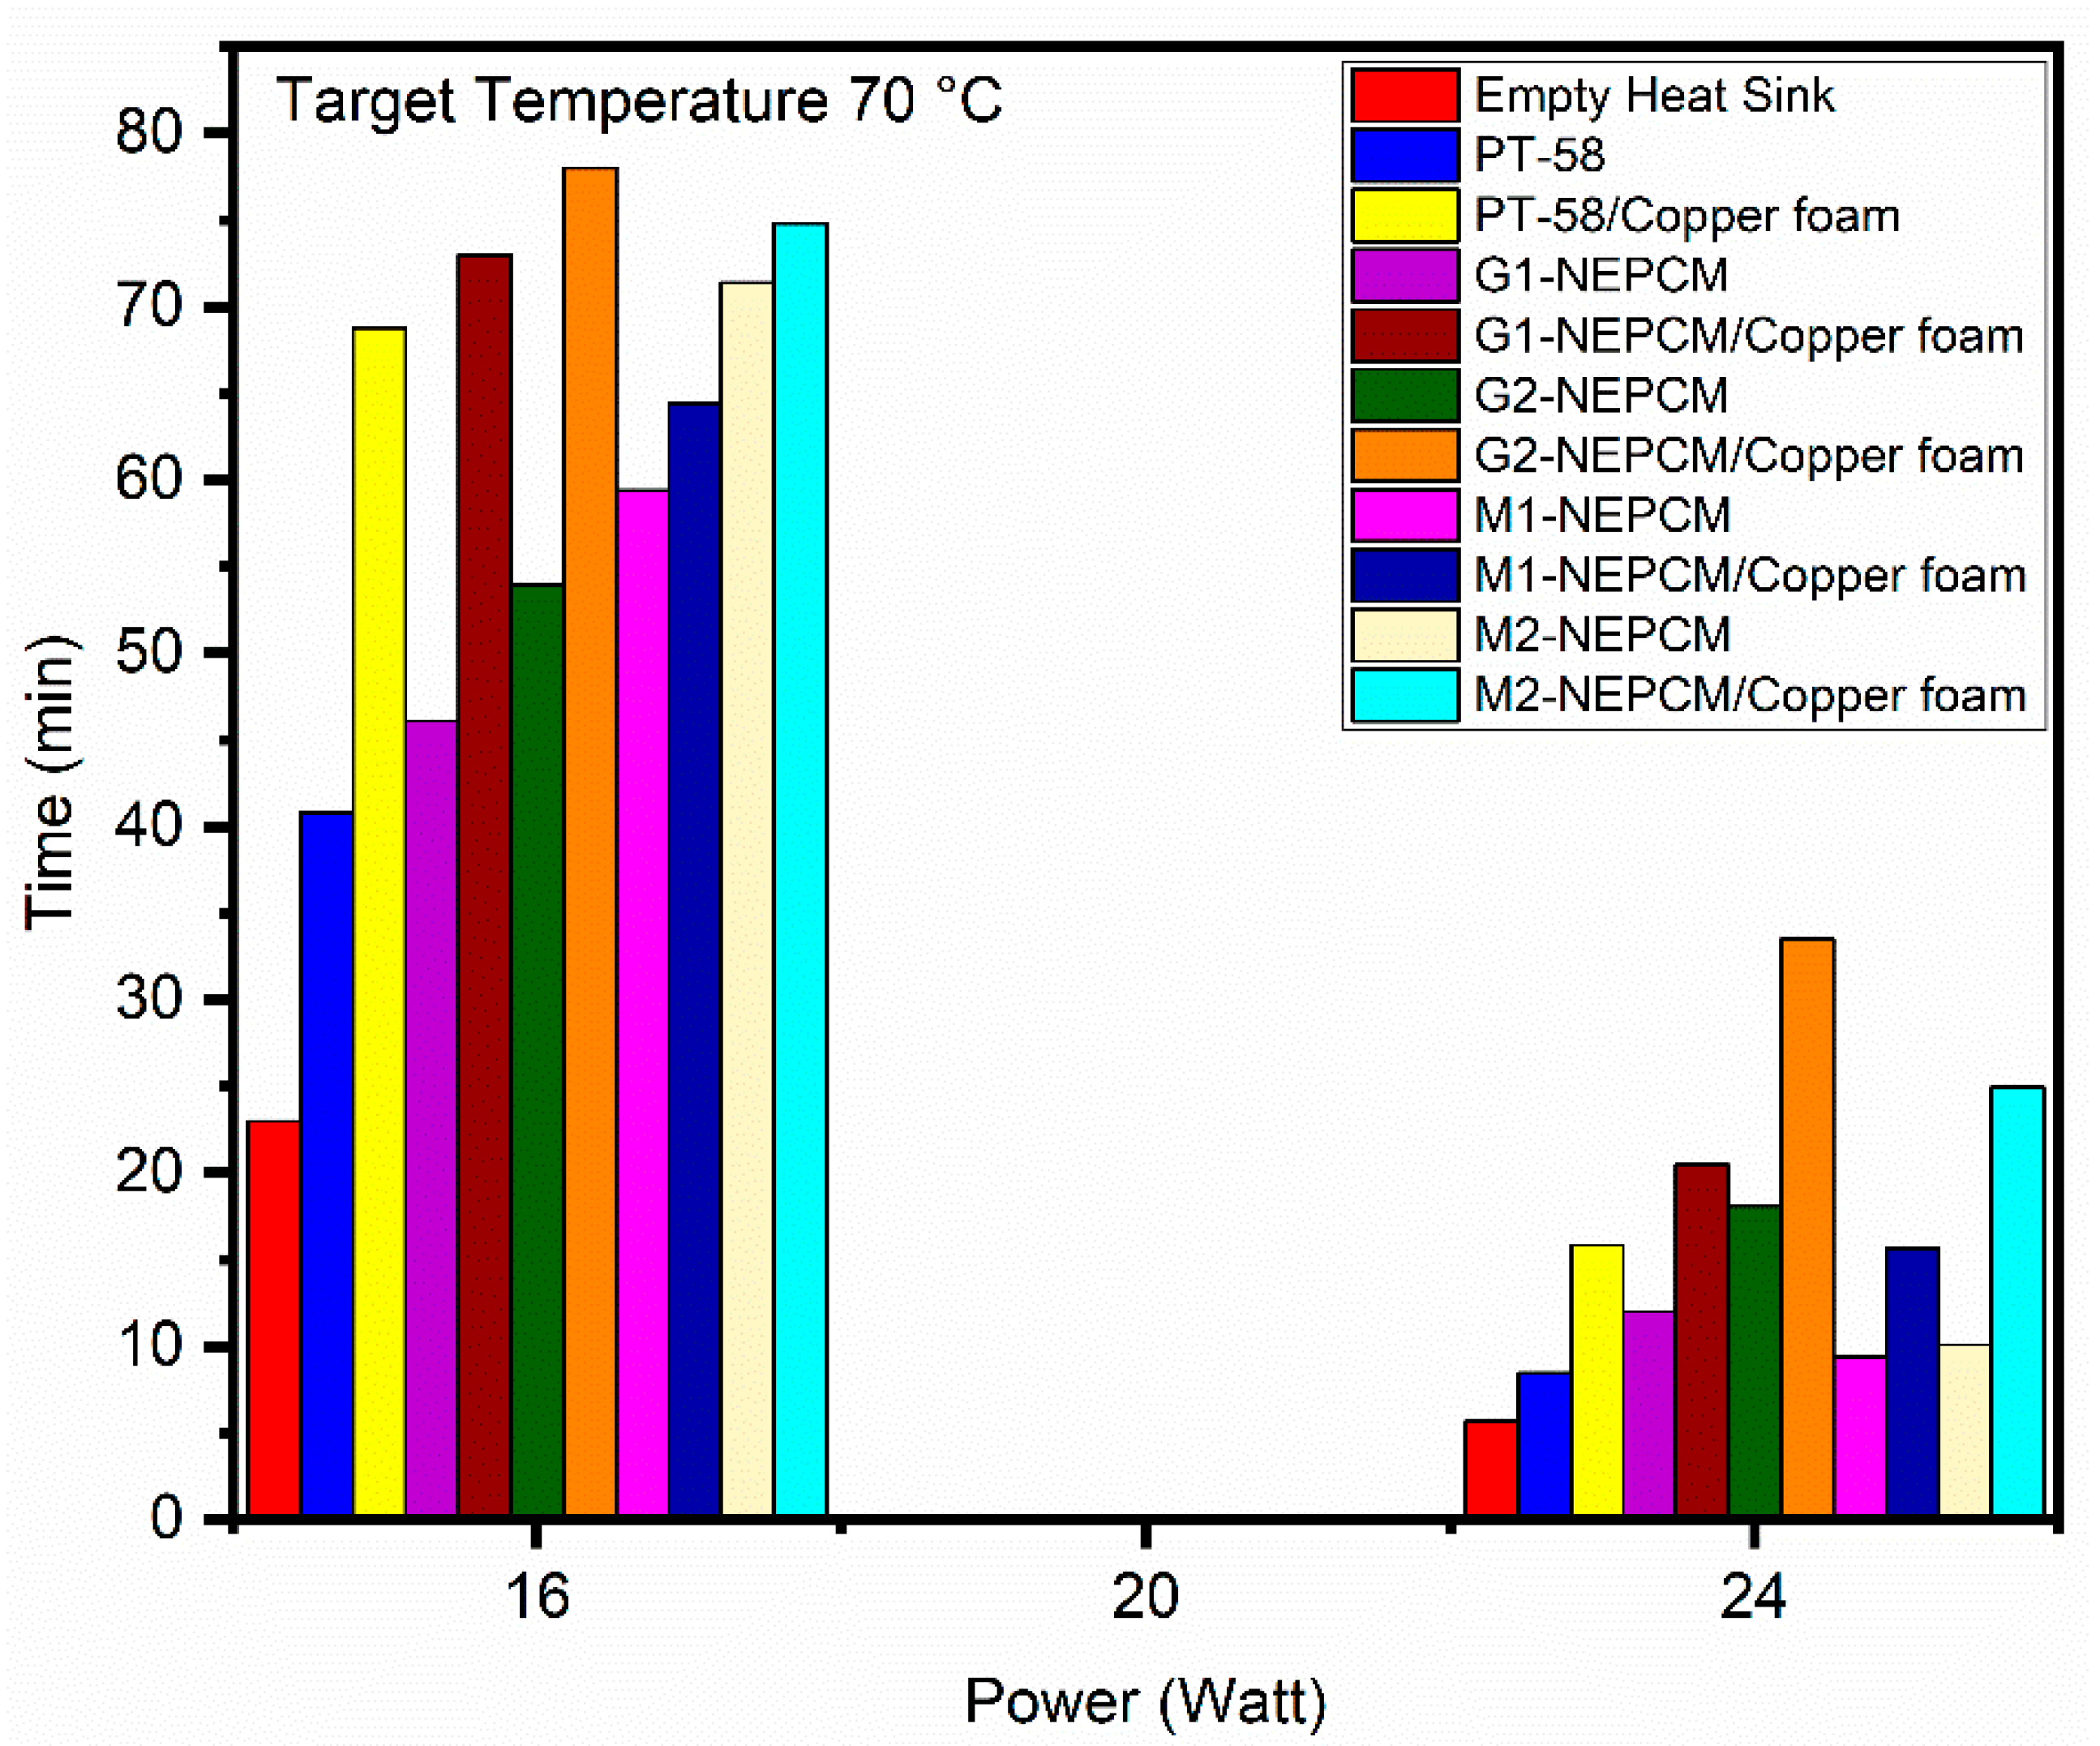
3.2.5. Analysis of Operational Time Variations for Various Target Temperatures
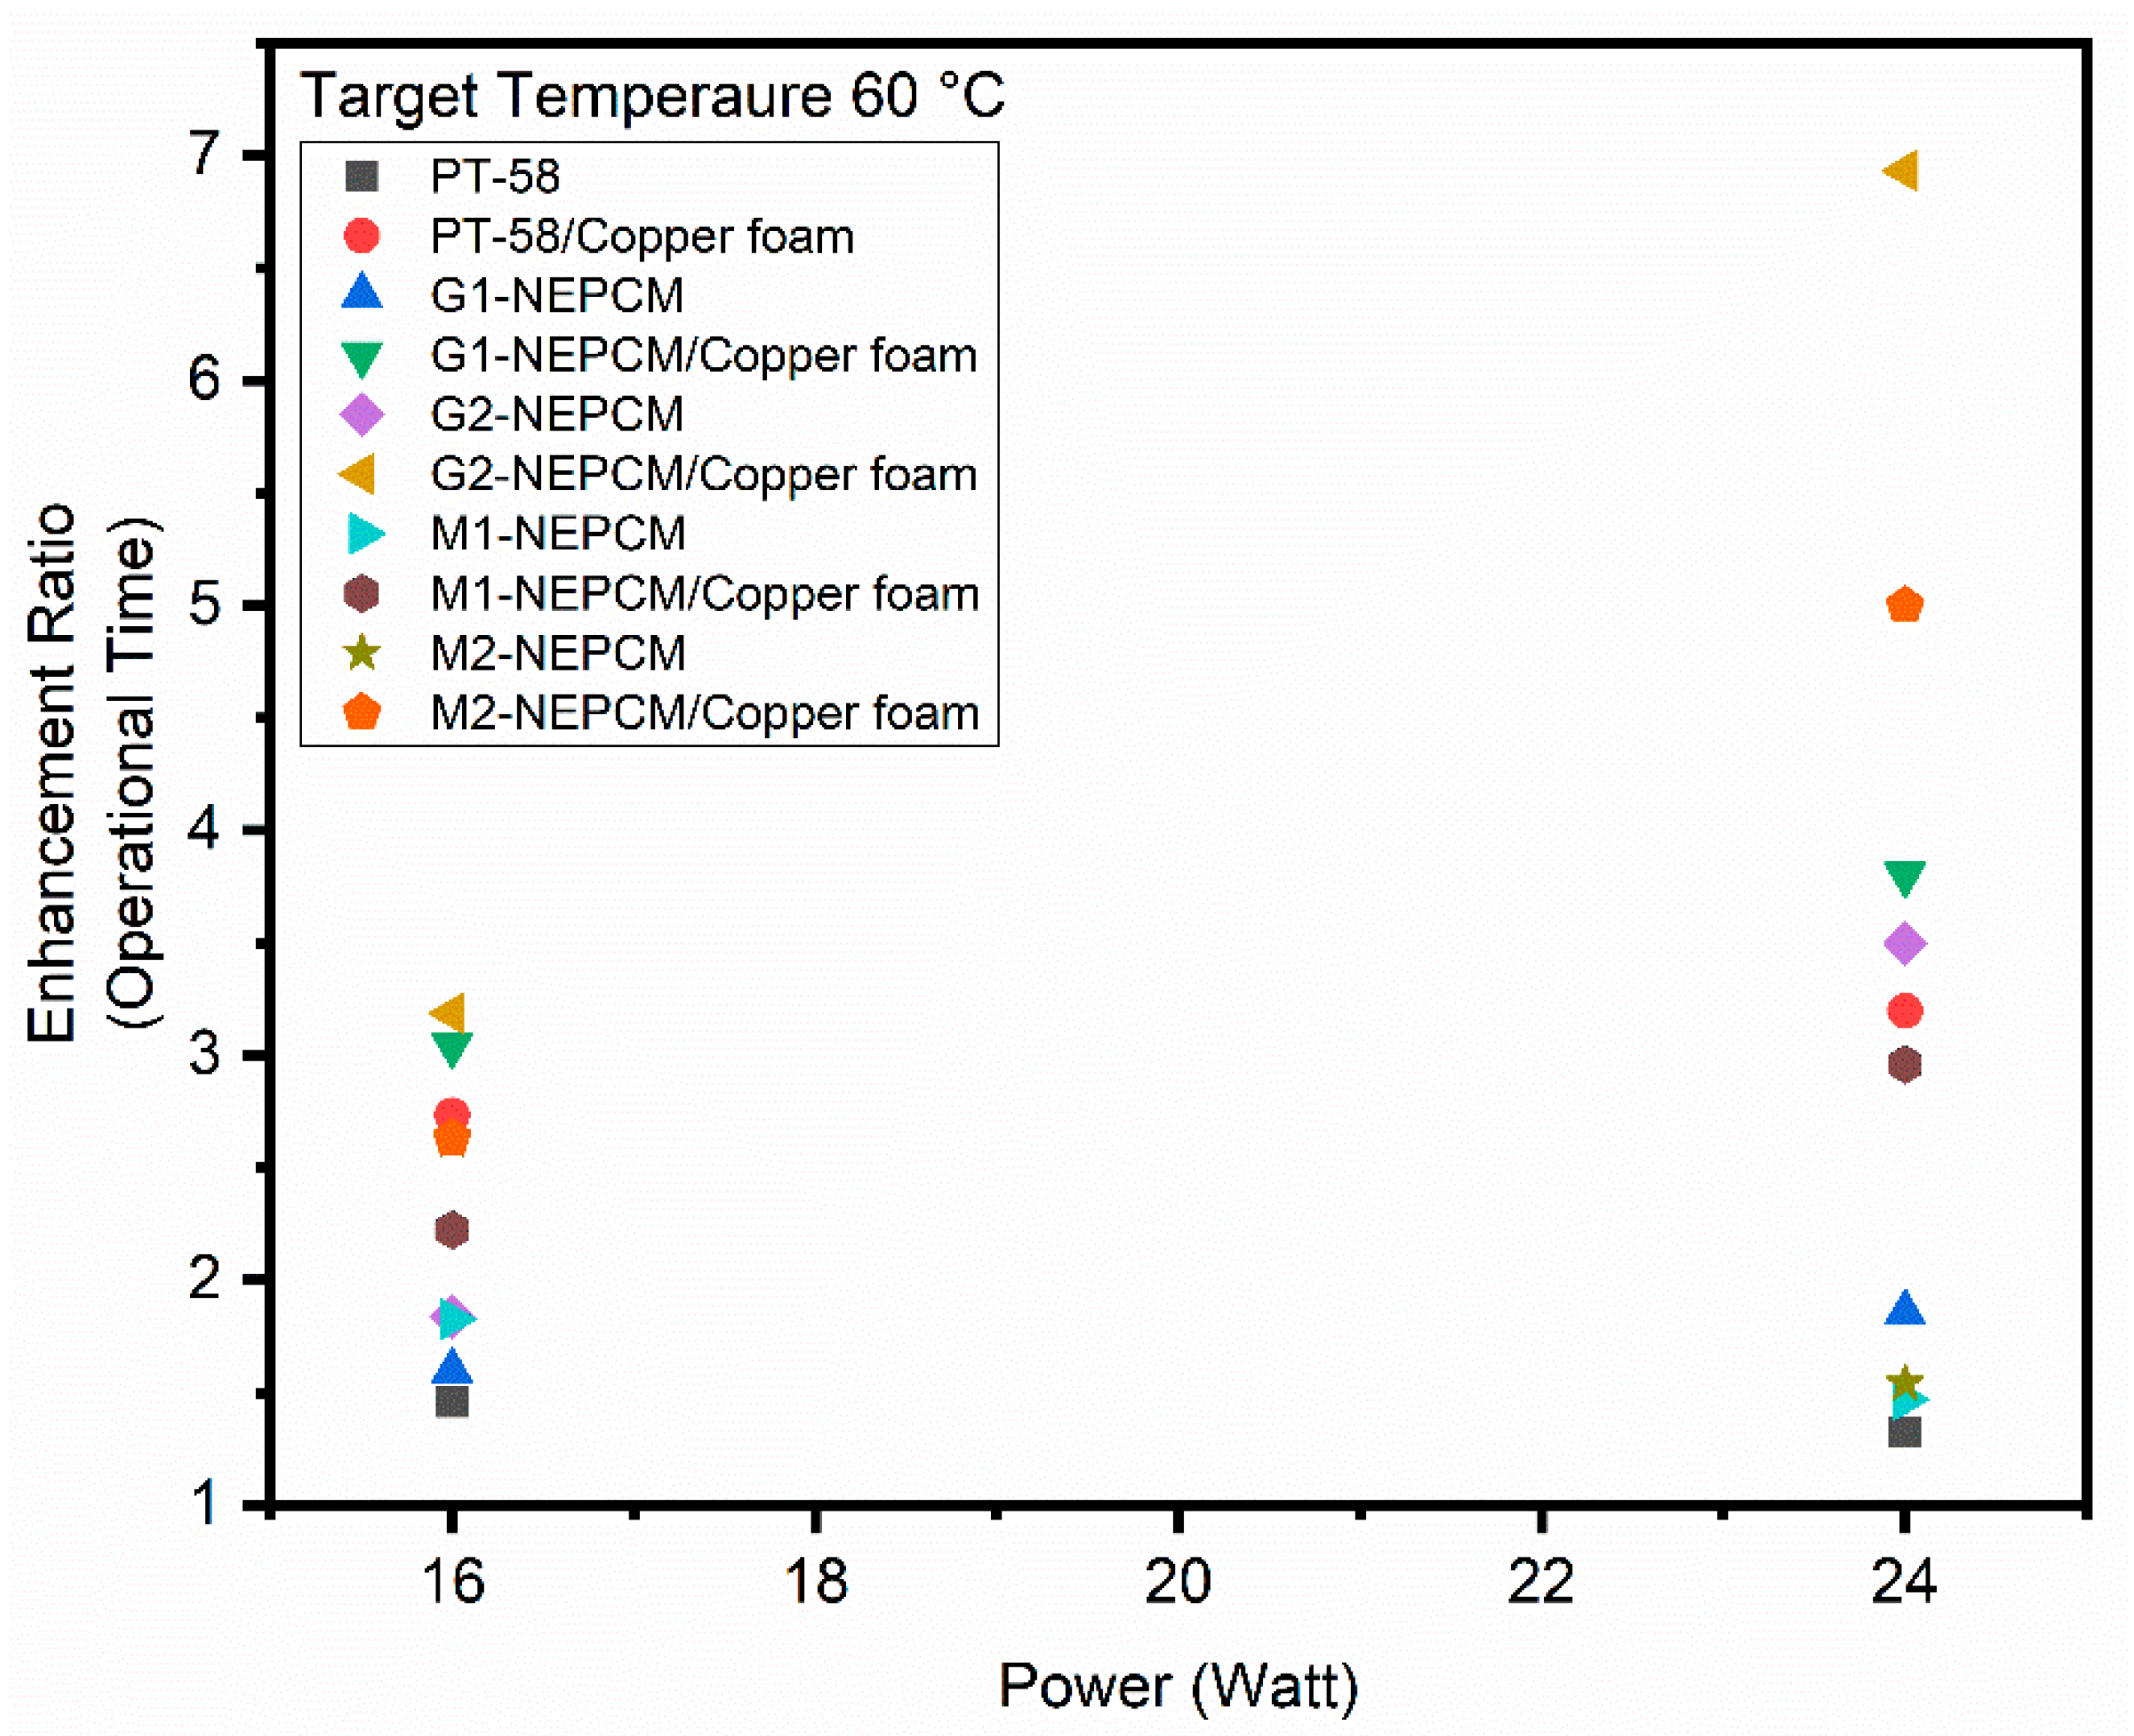
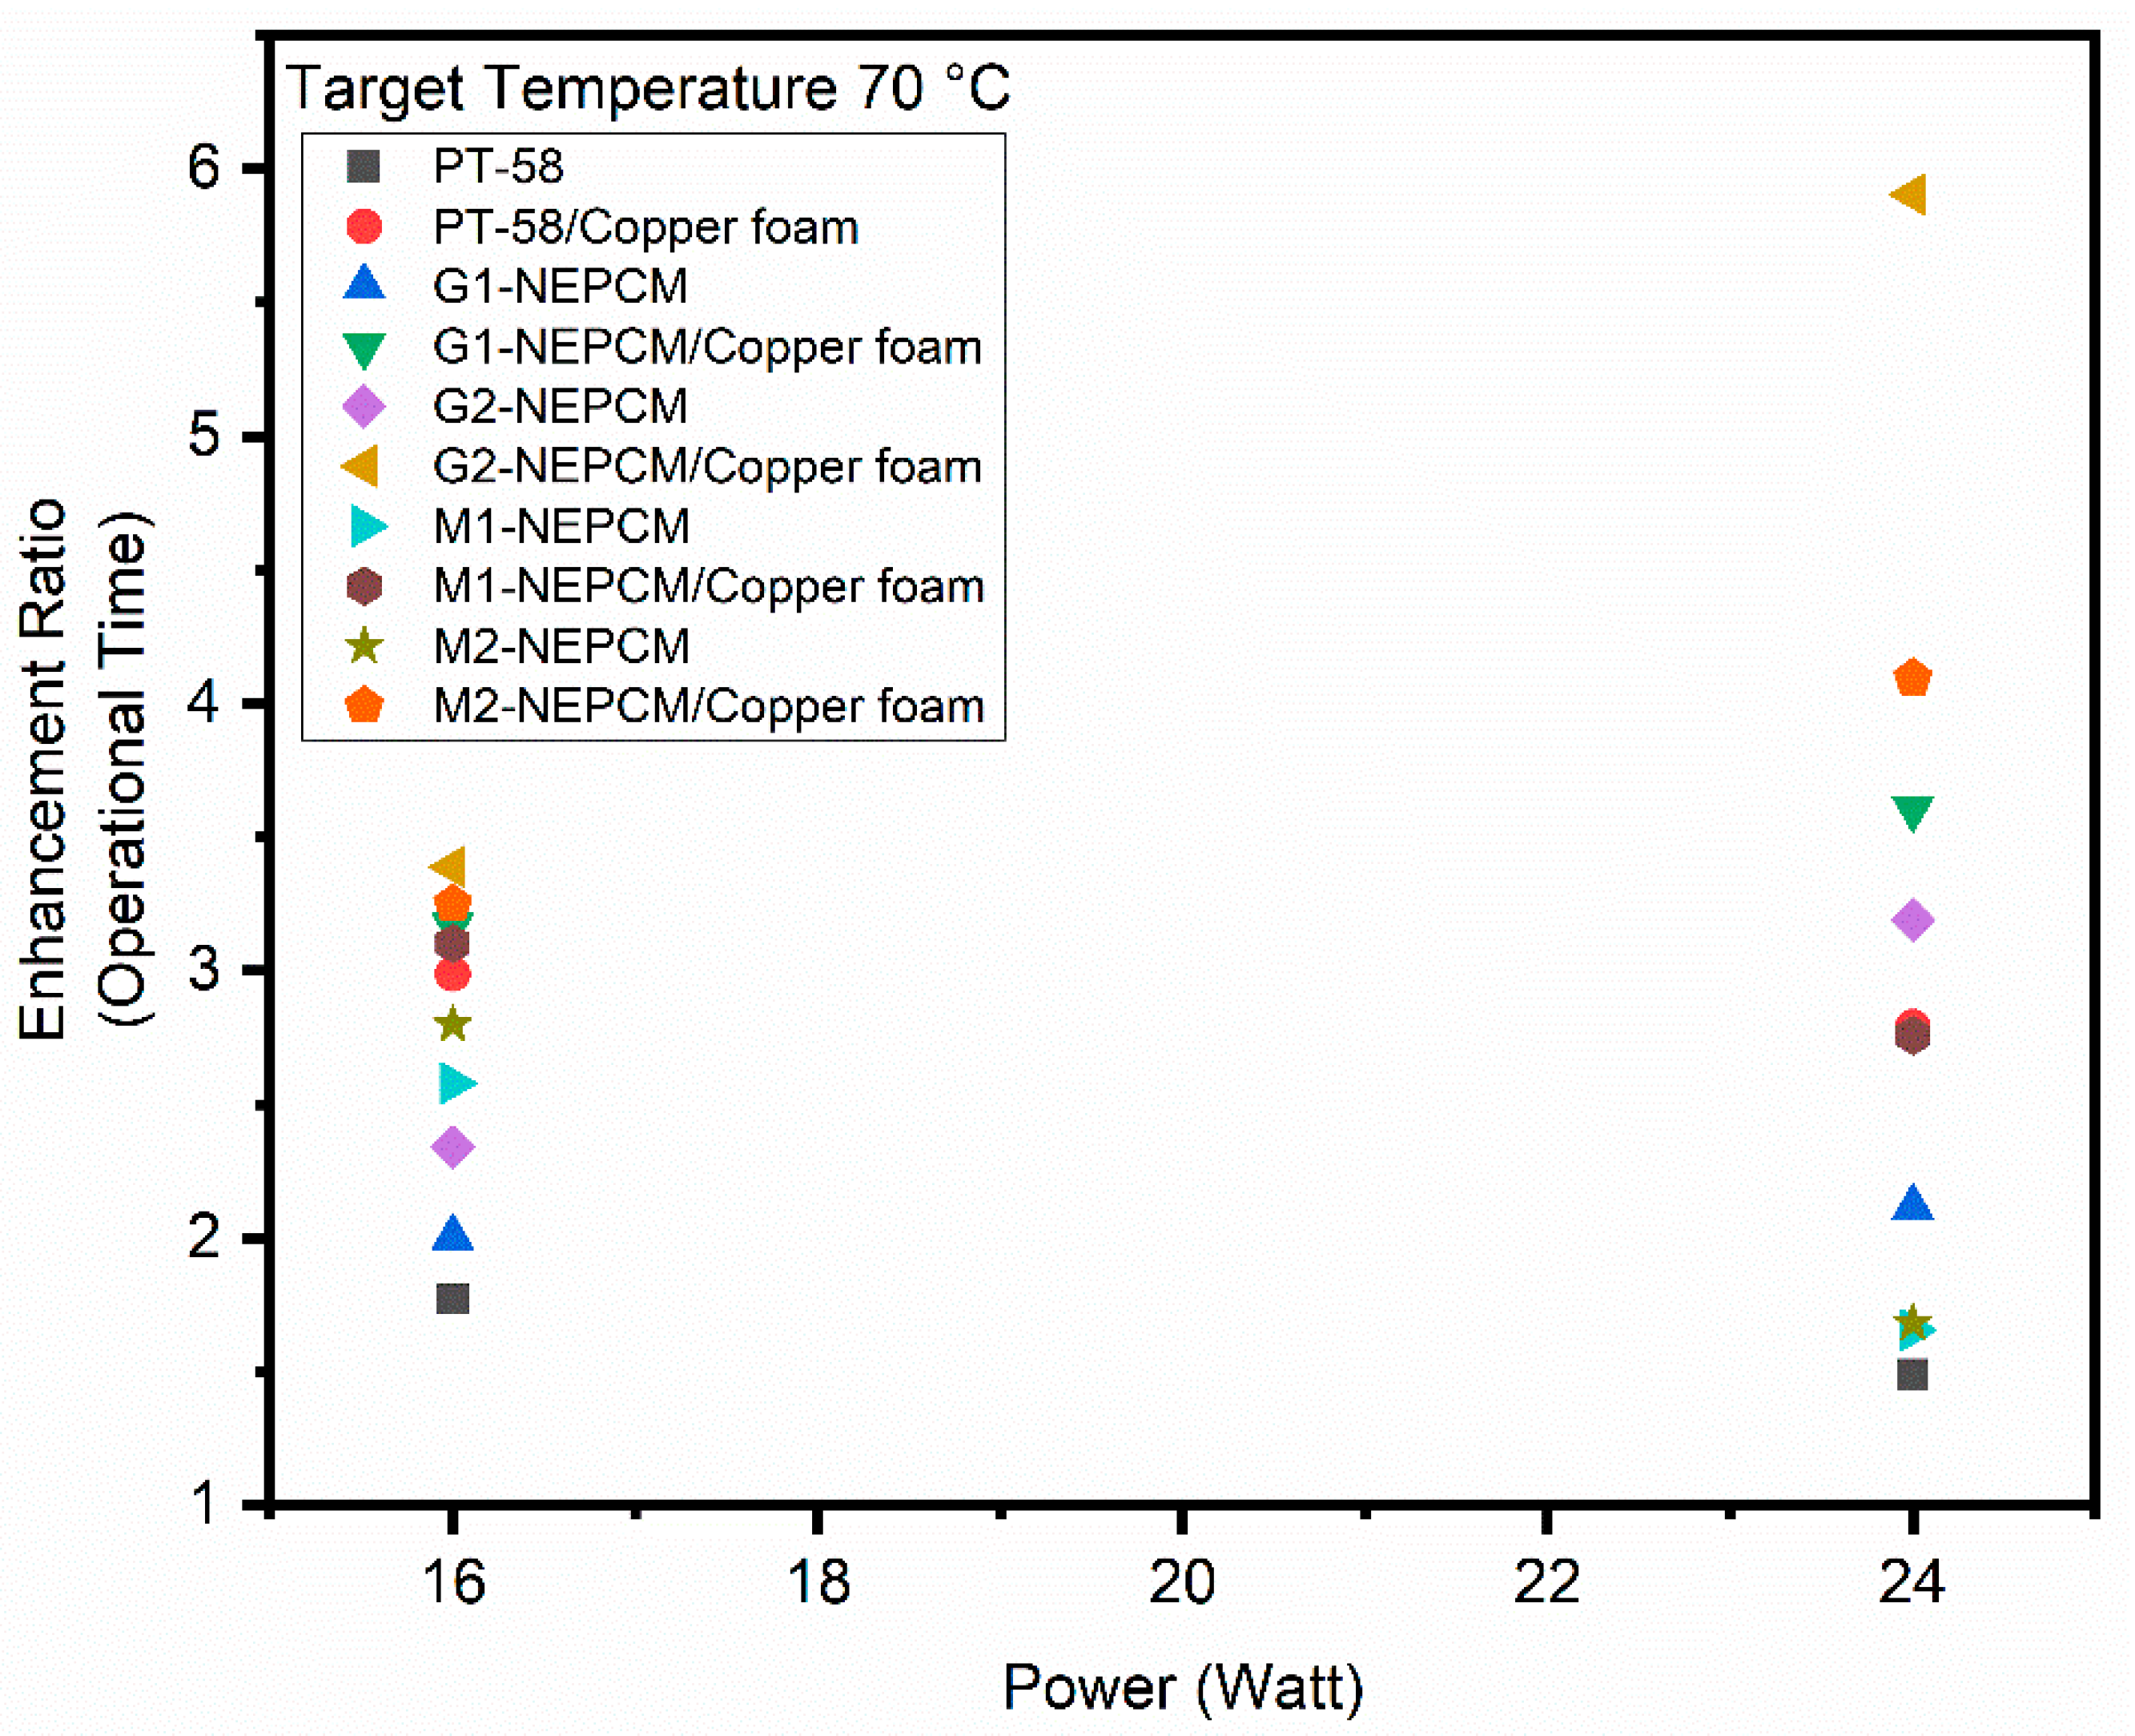
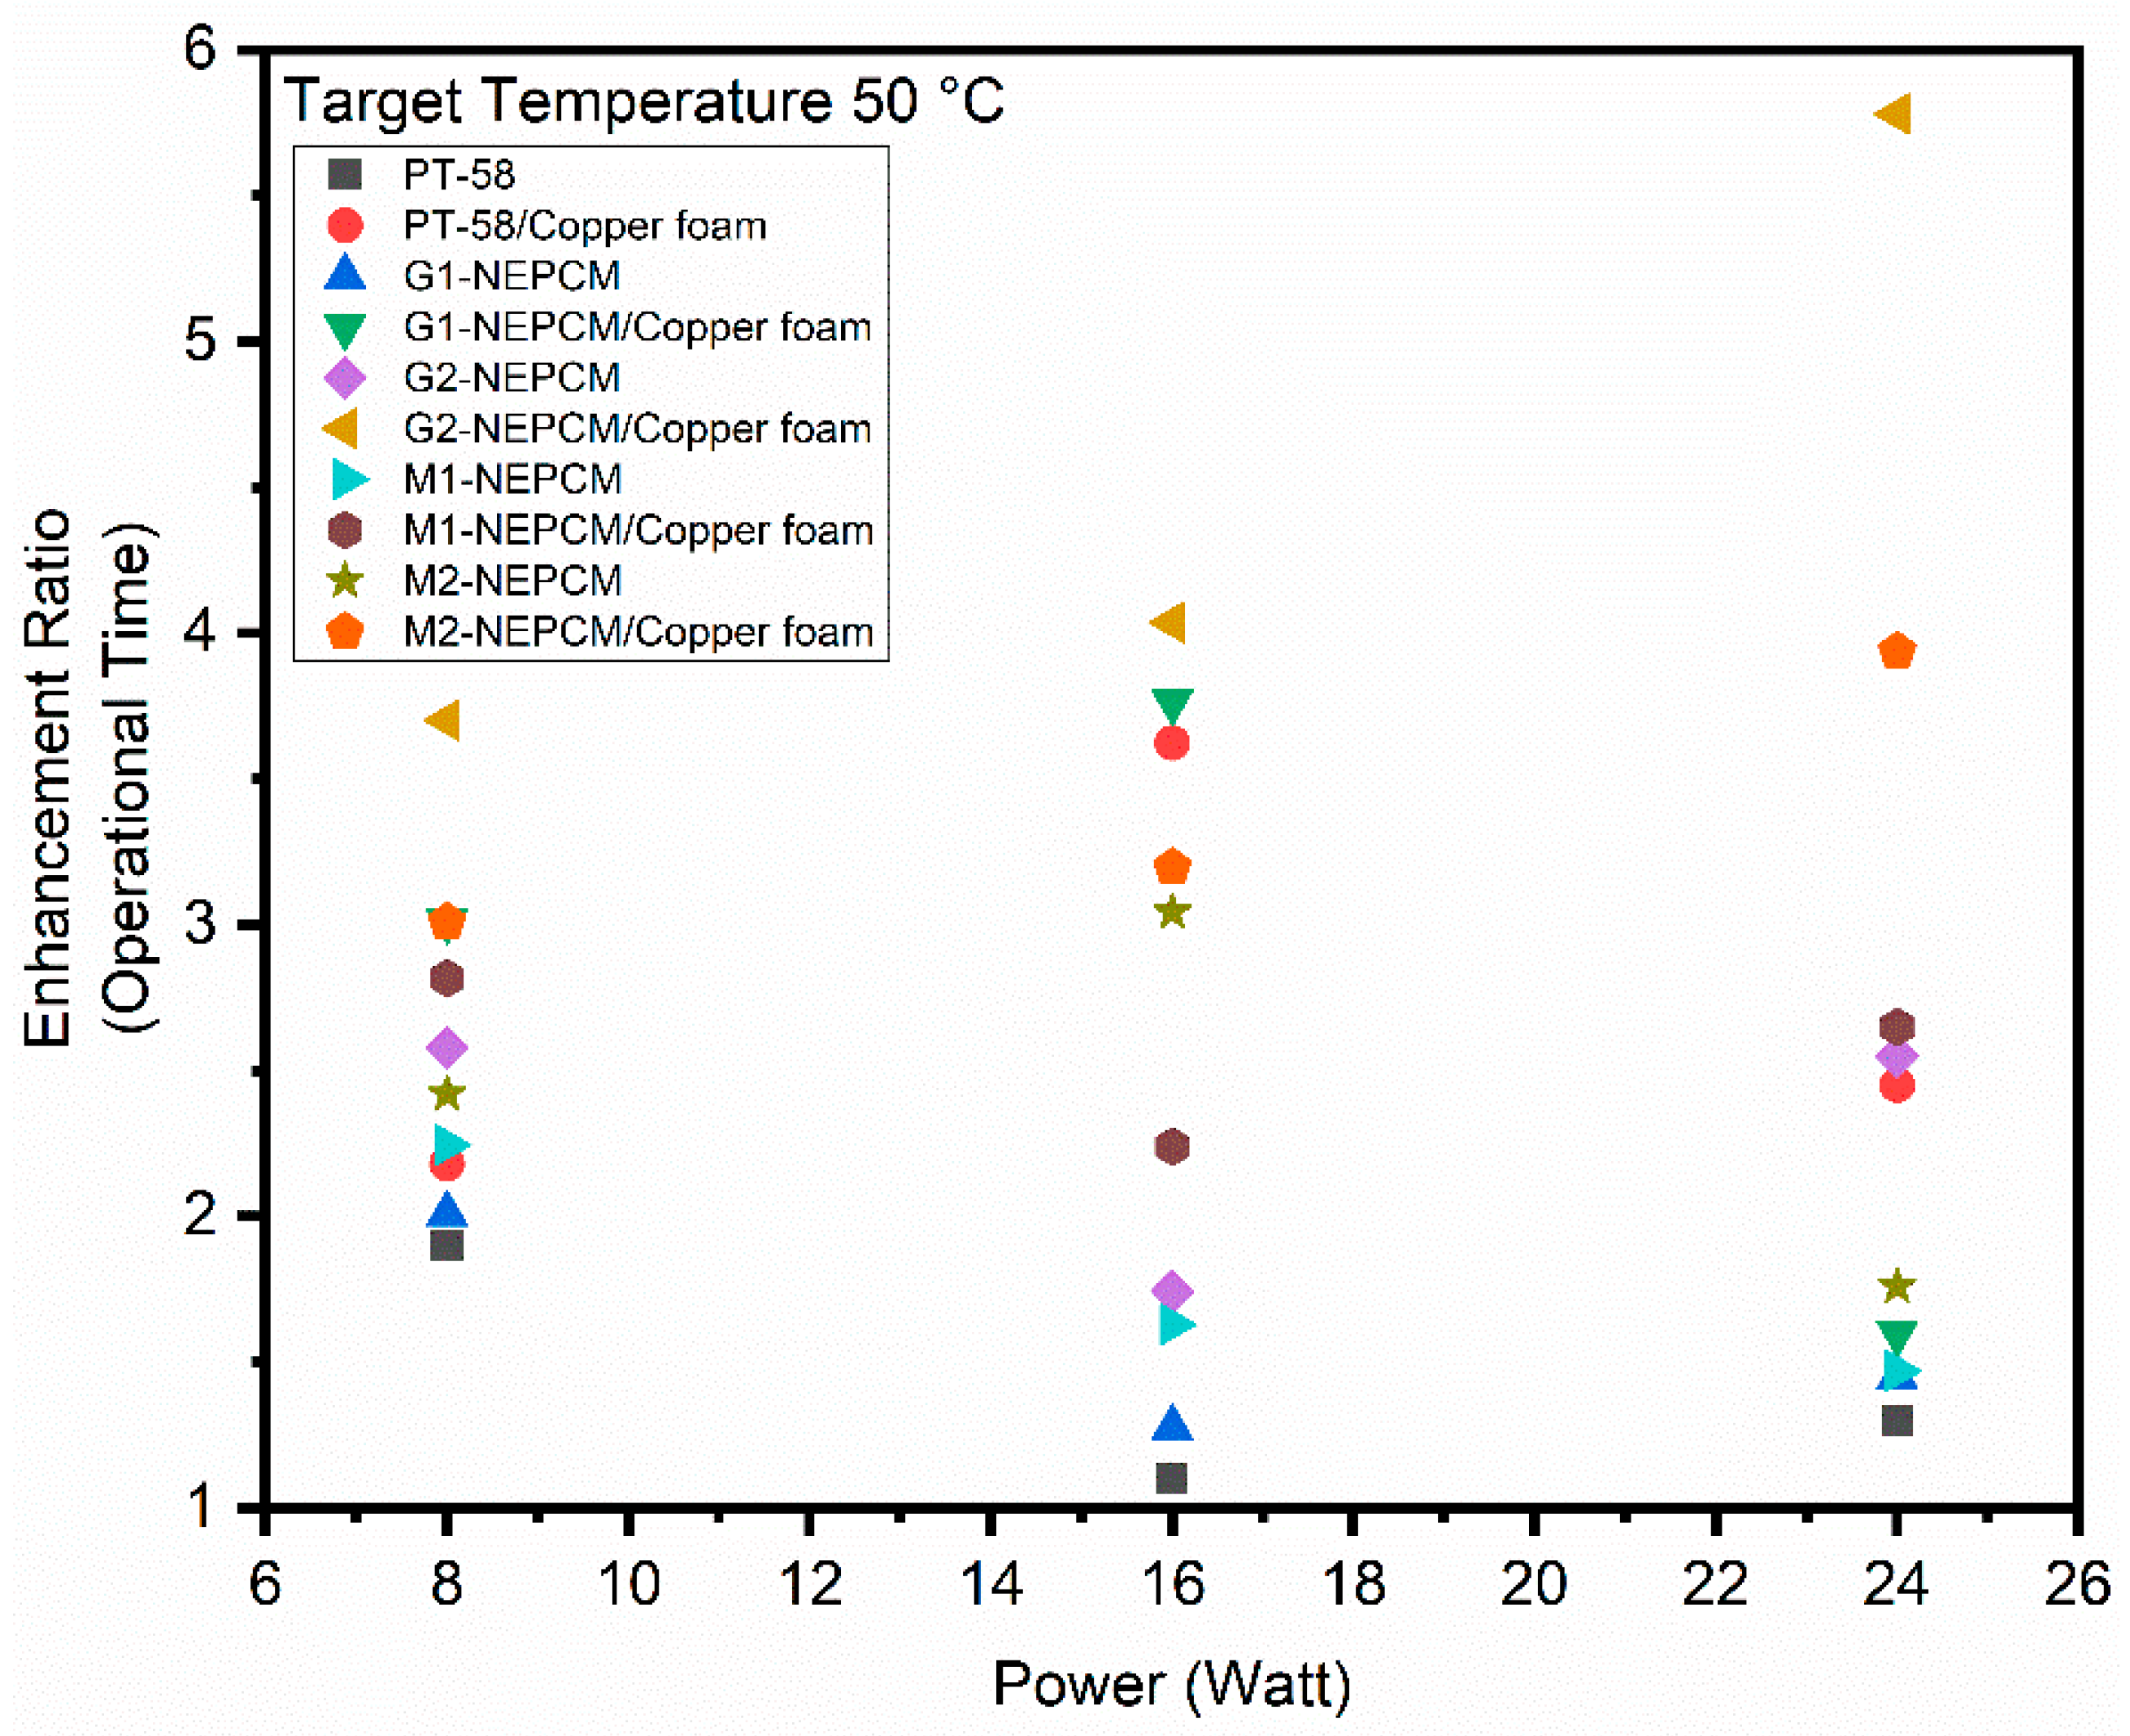
3.2.6. Enhancement Ratio in Operational Time for Various NEPCMs Composites
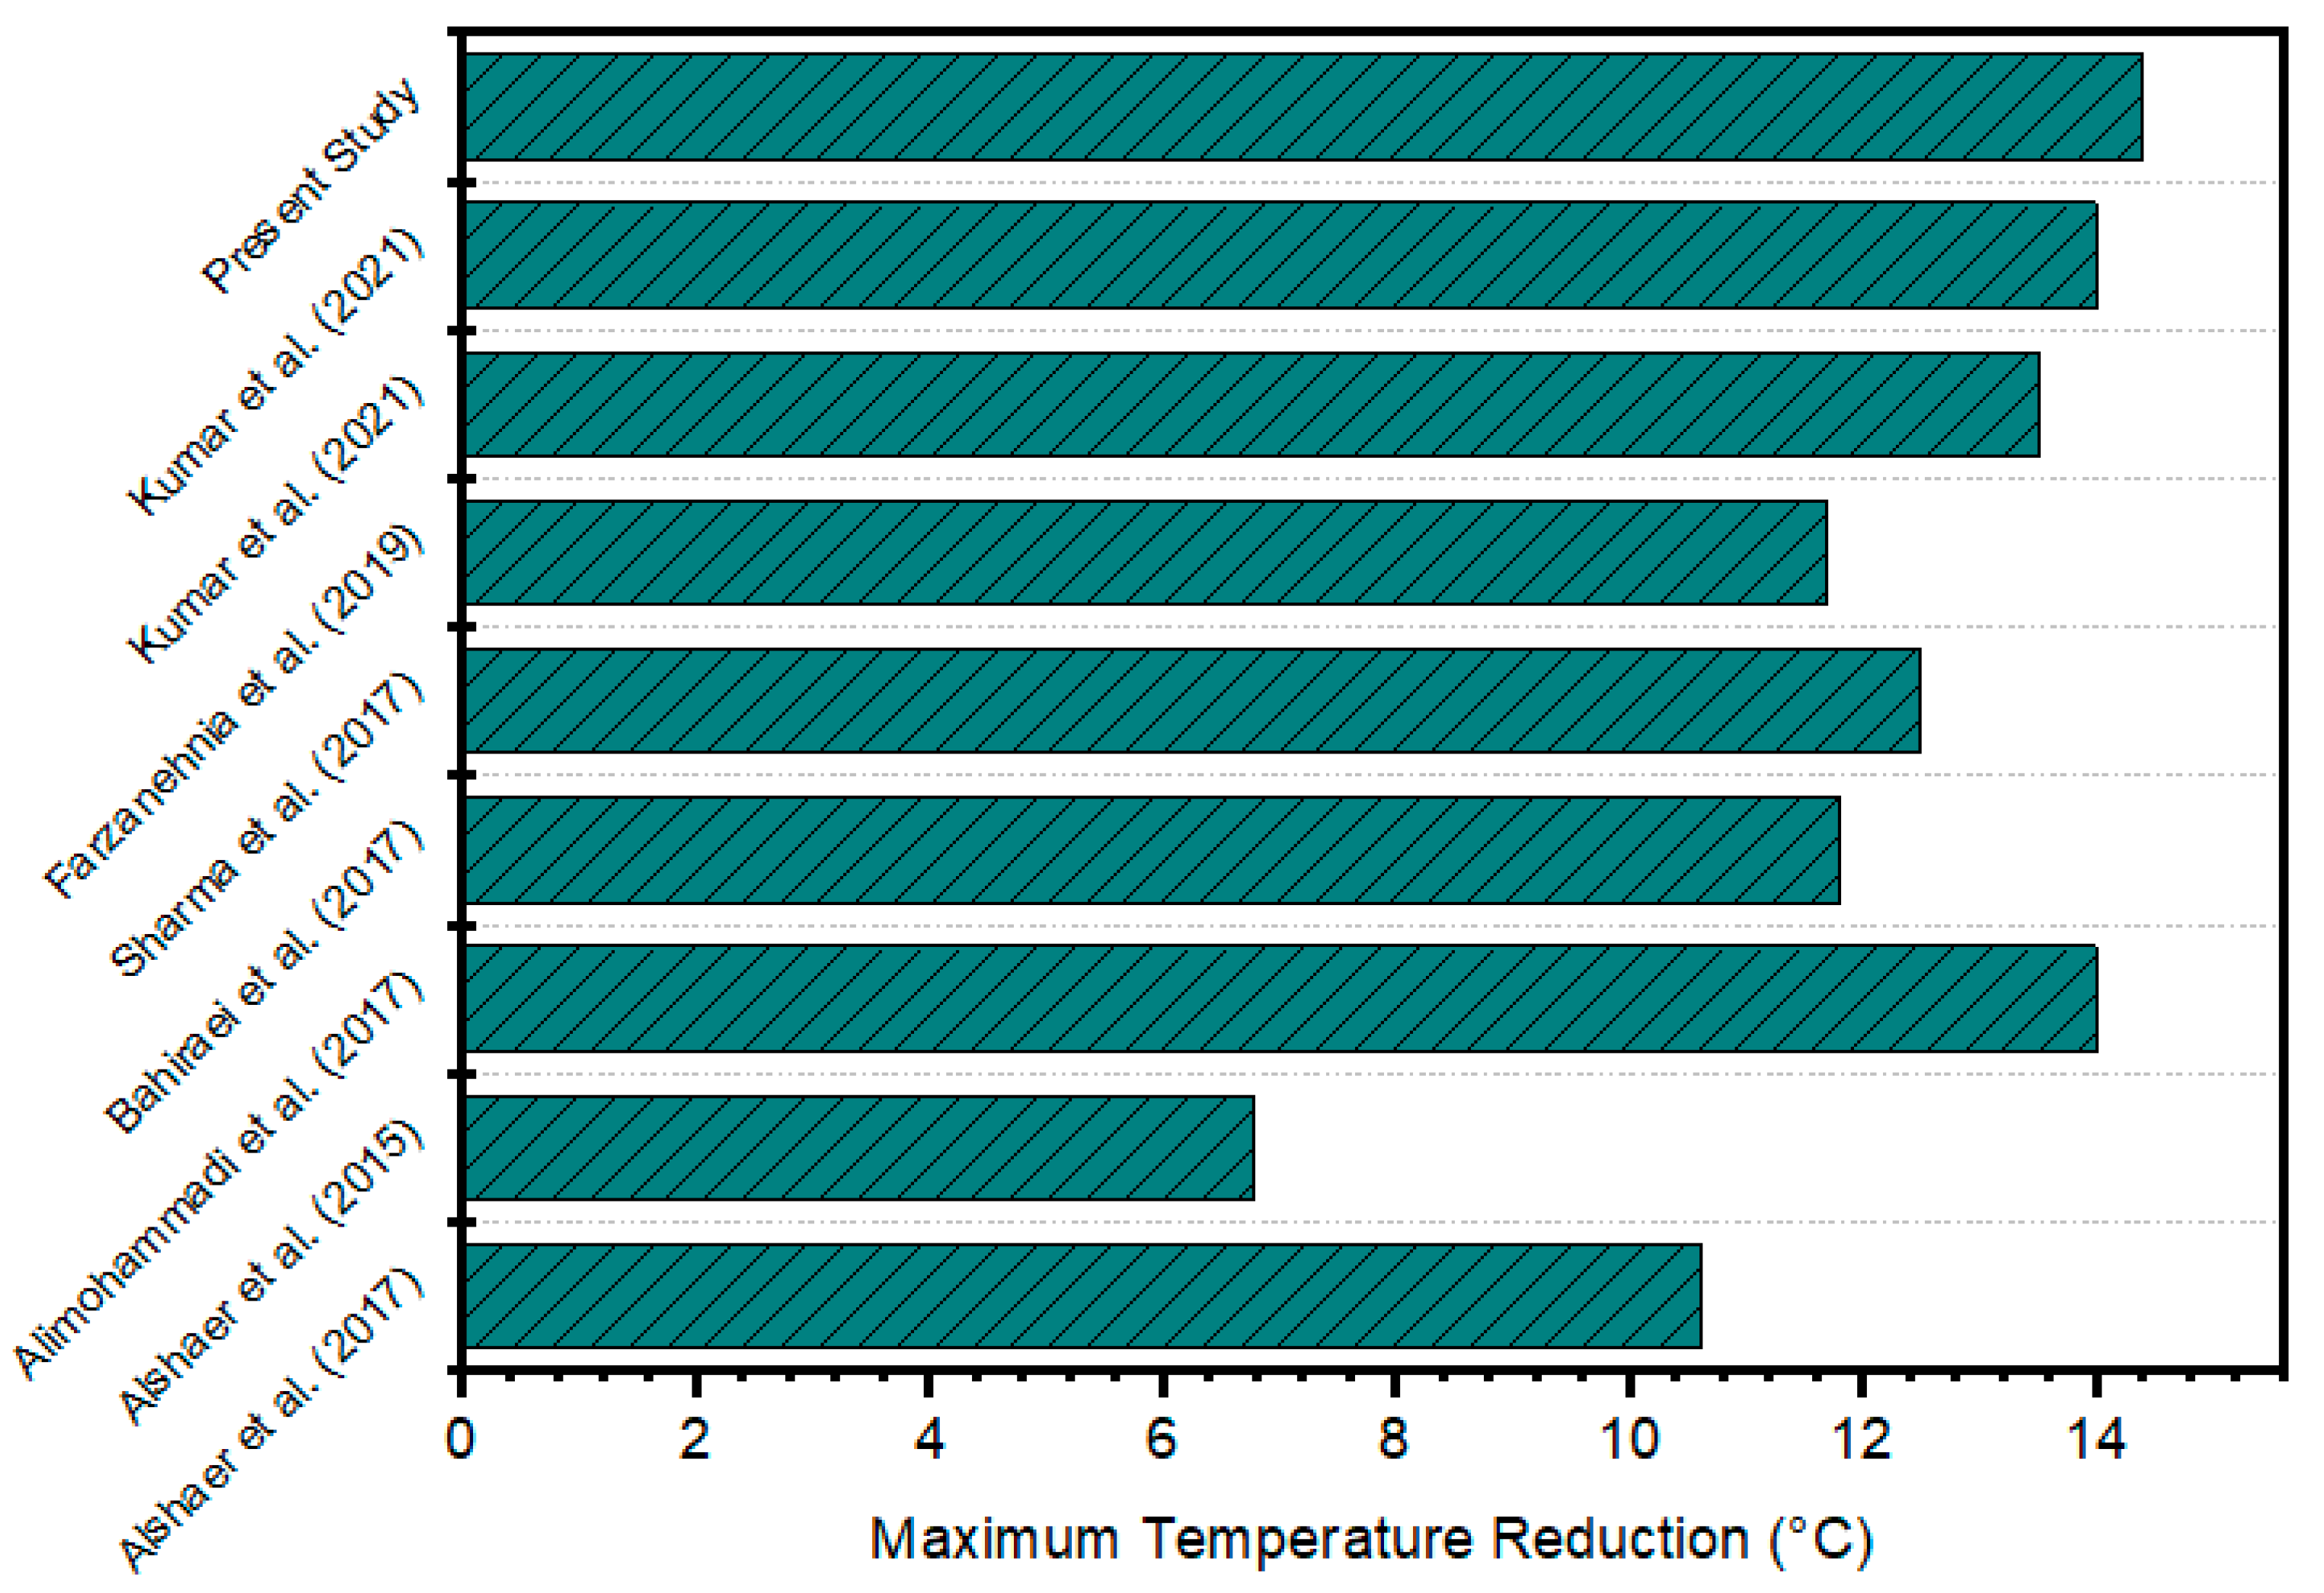
3.3. Comparison of Experimental Results with the Literature
4. Conclusions
- From the baseline comparison of heat sink it is noticed that the G2-NEPCM/copper foam performed best among all configurations at all heating inputs. The reason is high thermal conductivity of GNPs, NPs and copper foam.
- The increase in NPs concentration in PCM improved the cooling capacity of heat sink and lowered the base temperature. For G2-NEPCM and M2-NEPCM, base temperature reduced by 8.03% and 7.6% at 0.77 kW/, 9.1% and 8.3% at 1.54 kW/, and 6.9% and 5.3% at 2.3 kW/, respectively.
- The introduction of copper foam in NEPCM further lowered the base temperature and delayed the latent heating phase of PCM. In the case of G2-NEPCM/copper foam, maximum temperature reductions of 7.92 C, 13.85 C and 13.26 C were observed at heating inputs of 0.77 kW/, 1.54 kW/ and 2.3 kW/, respectively. While at 1.54 kW/ and 2.3 kW/ heating input, M2-NEPCM lowered the heat sink base temperature by 11.35 C and 13.66 C, which was better than all configurations. The reason was the NEPCM melting was not commenced in this case.
- Time required to achieve different target temperatures for various configurations of heat sink revealed that at 8 W power level, G2-NEPCM/copper foam took 64.4 min to reach 50 C target temperature. While at 16 W power level, the G2-NEPCM/copper foam showed best performance and took 78 min in achieving target temperature of 70 C. The M2-NEPCM/copper foam achieved target temperature of 70 C in 74.8 min. For 24 W power level, GNPs-NEPCM/copper foam took the highest time to achieve target temperatures of 50 C, 60 C, and 70 C;
- The enhancement ratio study of heat sink indicated that dominance of NEPCM/copper foam-based heat sinks in general, and GNPs-NEPCM/copper foam specifically. The highest enhancement ratio of 5.8, 6.9 and 5.9 was observed for G2-NEPCM/copper foam at target temperatures of 50 C, 60 C and 70 C, respectively, at 24 W power level.
- The overall cooling performance of heat sink was better in the case of NEPCM/copper foam composites as compared to PCM and NEPCM cases. The reason is that the copper foam helped to dissipate heat more uniformly and improved the heat transfer rate of PCM inside heat sink.
- The combined usage of NPs and metal foam is a good solution to mitigate the high heat load. The different types of NPs could have different influence on the thermal performance of PCM. The use of copper foam for thermal management exhibited better performance, even when simple PCM was used. The high thermal conductivity of copper foam improved the conduction and convection heat transfer in the PCM and NEPCM.
Author Contributions
Funding
Conflicts of Interest
Nomenclature
| Abbreviations | |
| Aluminium Oxide | |
| CuO | Copper Oxide |
| GNPs | Graphene Nanoplatelets |
| Iron Oxide | |
| Magnesium Nitrate | |
| MgO | Magnesium Oxide |
| min | Minute |
| MWCNTs | Multi Walled Carbon Nanotubes |
| NEPCM | Nano enriched PCM |
| NPs | Nanoparticles |
| PCM | Phase Change Materials |
| PPI | Pores Per Inch |
| TES | Thermal Energy Storage |
| Titanium Dioxide | |
| TEM | Transmission Electron Microscopy |
| wt.% | Weight Percent |
| Symbols | |
| k | Thermal conductivity (W/m.K) |
| P | Power (W) |
| q | Heating input (kW/) |
| Tmax | Maximum Temperature after Charging Phase (K) |
| VPCM | Volume of PCM (mm3) |
| I | Current (A) |
| L | Length of Heating Surface (mm) |
| W | Width of Heating Surface (mm) |
| mpcm | Mass of PCM (g) |
| Vs | Volume of Heat Sink (mm3) |
| T1–T8 | Thermocouple Locations |
| V | Voltage (V) |
| T | Temperature (°C) |
| G | Thermal Conductance (W/k) |
| Greek Symbols | |
| ε | Porosity |
| ψPCM | Volume Fraction of PCM |
| ρ | Density |
| δ | Uncertainty Value |
| ξ | Enhancement Ratio in operation time |
| φ | Weight fraction of Nanoparticles |
References
- Hua, W.; Zhang, L.; Zhang, X. Research on Passive Cooling of Electronic Chips Based on PCM: A Review. J. Mol. Liq. 2021, 340, 117183. [Google Scholar] [CrossRef]
- Sahoo, S.K.; Das, M.K.; Rath, P. Application of TCE-PCM Based Heat Sinks for Cooling of Electronic Components: A Review. Renew. Sustain. Energy Rev. 2016, 59, 550–582. [Google Scholar] [CrossRef]
- Ghosh, D.; Ghose, J.; Datta, P.; Kumari, P.; Paul, S. Strategies for Phase Change Material Application in Latent Heat Thermal Energy Storage Enhancement: Status and Prospect. J. Energy Storage 2022, 53, 105179. [Google Scholar] [CrossRef]
- Iradukunda, A.-C.; Vargas, A.; Huitink, D.; Lohan, D. Transient Thermal Performance Using Phase Change Material Integrated Topology Optimized Heat Sinks. Appl. Therm. Eng. 2020, 179, 115723. [Google Scholar] [CrossRef]
- Mozafari, M.; Lee, A.; Mohammadpour, J. Thermal Management of Single and Multiple PCMs Based Heat Sinks for Electronics Cooling. Therm. Sci. Eng. Prog. 2021, 23, 100919. [Google Scholar] [CrossRef]
- Kalbasi, R. Introducing a Novel Heat Sink Comprising PCM and Air—Adapted to Electronic Device Thermal Management. Int. J. Heat Mass Transf. 2021, 169, 120914. [Google Scholar] [CrossRef]
- Xie, J.; Choo, K.F.; Xiang, J.; Lee, H.M. Characterization of Natural Convection in a PCM-Based Heat Sink with Novel Conductive Structures. Int. Commun. Heat Mass Transf. 2019, 108, 104306. [Google Scholar] [CrossRef]
- Dammak, K.; El Hami, A. Thermal Reliability-Based Design Optimization Using Kriging Model of PCM Based Pin Fin Heat Sink. Int. J. Heat Mass Transf. 2021, 166, 120745. [Google Scholar] [CrossRef]
- Sunku Prasad, J.; Anandalakshmi, R.; Muthukumar, P. Numerical Investigation on Conventional and PCM Heat Sinks under Constant and Variable Heat Flux Conditions. Clean Technol. Environ. Policy 2020, 87, 454–462. [Google Scholar] [CrossRef]
- Cheng, P.; Chen, X.; Gao, H.; Zhang, X.; Tang, Z.; Li, A.; Wang, G. Different Dimensional Nanoadditives for Thermal Conductivity Enhancement of Phase Change Materials: Fundamentals and Applications. Nano Energy 2021, 85, 105948. [Google Scholar] [CrossRef]
- Farzanehnia, A.; Khatibi, M.; Sardarabadi, M.; Passandideh-Fard, M. Experimental Investigation of Multiwall Carbon Nanotube/Paraffin Based Heat Sink for Electronic Device Thermal Management. Energy Convers. Manag. 2019, 179, 314–325. [Google Scholar] [CrossRef]
- Fan, L.-W.; Zhu, Z.-Q.; Zeng, Y.; Xiao, Y.-Q.; Liu, X.-L.; Wu, Y.-Y.; Ding, Q.; Yu, Z.-T.; Cen, K.-F. Transient Performance of a PCM-Based Heat Sink with High Aspect-Ratio Carbon Nanofillers. Appl. Therm. Eng. 2015, 75, 532–540. [Google Scholar] [CrossRef]
- Kothari, R.; Sahu, S.K.; Kundalwal, S.I. Investigation on Thermal Characteristics of Nano Enhanced Phase Change Material Based Finned and Unfinned Heat Sinks for Thermal Management System. Chem. Eng. Process.-Process Intensif. 2021, 162, 108328. [Google Scholar] [CrossRef]
- Joseph, M.; Sajith, V. Graphene Enhanced Paraffin Nanocomposite Based Hybrid Cooling System for Thermal Management of Electronics. Appl. Therm. Eng. 2019, 163, 114342. [Google Scholar] [CrossRef]
- Jalil, J.M.; Mahdi, H.S.; Allawy, A.S. Cooling Performance Investigation of PCM Integrated into Heat Sink with Nano Particles Addition. J. Energy Storage 2022, 55, 105466. [Google Scholar] [CrossRef]
- Aramesh, M.; Shabani, B. Metal Foams Application to Enhance the Thermal Performance of Phase Change Materials: A Review of Experimental Studies to Understand the Mechanisms. J. Energy Storage 2022, 50, 104650. [Google Scholar] [CrossRef]
- Marri, G.K.; Balaji, C. Experimental and Numerical Investigations on the Effect of Porosity and PPI Gradients of Metal Foams on the Thermal Performance of a Composite Phase Change Material Heat Sink. Int. J. Heat Mass Transf. 2021, 164, 120454. [Google Scholar] [CrossRef]
- Venkateshwar, K.; Tasnim, S.H.; Simha, H.; Mahmud, S. Influence of Metal Foam Morphology on Phase Change Process under Temporal Thermal Load. Appl. Therm. Eng. 2020, 180, 115874. [Google Scholar] [CrossRef]
- Li, W.; Zhang, D.; Jing, T.; Gao, M.; Liu, P.; He, G.; Qin, F. Nano-Encapsulated Phase Change Material Slurry (Nano-PCMS) Saturated in Metal Foam: A New Stable and Efficient Strategy for Passive Thermal Management. Energy 2018, 165, 743–751. [Google Scholar] [CrossRef]
- Zhao, L.; Xing, Y.; Wang, Z.; Liu, X. The Passive Thermal Management System for Electronic Device Using Low-Melting-Point Alloy as Phase Change Material. Appl. Therm. Eng. 2017, 125, 317–327. [Google Scholar] [CrossRef]
- Arshad, A.; Jabbal, M.; Faraji, H.; Talebizadehsardari, P.; Bashir, M.A.; Yan, Y. Thermal Performance of a Phase Change Material-Based Heat Sink in Presence of Nanoparticles and Metal-Foam to Enhance Cooling Performance of Electronics. J. Energy Storage 2022, 48, 103882. [Google Scholar] [CrossRef]
- Lin, Y.; Jia, Y.; Alva, G.; Fang, G. Review on Thermal Conductivity Enhancement, Thermal Properties and Applications of Phase Change Materials in Thermal Energy Storage. Renew. Sustain. Energy Rev. 2018, 82, 2730–2742. [Google Scholar] [CrossRef]
- Graphene Nanoplatelets (2–10 nm) Supplier—ACS Material. Available online: https://www.acsmaterial.com/graphene-nanoplatelets-2-10nm.html (accessed on 29 October 2021).
- NanoAmor, Amorphous Products|Nanoscale Products|Nanopowder|Nanoparticles—Magnesium Oxide Nanopowder (MgO, 99+%, 20 Nm). Available online: https://www.nanoamor.com/inc/sdetail/2543 (accessed on 29 October 2021).
- Ali, H.M.; Saieed, A.; Pao, W.; Ali, M. Copper Foam/PCMs Based Heat Sinks: An Experimental Study for Electronic Cooling Systems. Int. J. Heat Mass Transf. 2018, 127, 381–393. [Google Scholar]
- Jamil, F.; Ali, H.M.; Nasir, M.A.; Karahan, M.; Janjua, M.M.; Naseer, A.; Ejaz, A.; Pasha, R.A. Evaluation of Photovoltaic Panels Using Different Nano Phase Change Material and a Concise Comparison: An Experimental Study. Renew. Energy 2021, 169, 1265–1279. [Google Scholar] [CrossRef]
- Venugopal, J.; Prathap, L.; Rao, C.M.M.P.; Alagesan, J.; Manjunatha, L.H.; Gangodkar, D.; Mohanavel, V.; Sathyamurthy, R. Synthesis and Characterization of Paraffin Wax with Carbon Nanotubes and Magnesium Oxide. Energy Rep. 2022, 8, 313–320. [Google Scholar] [CrossRef]
- Eanest Jebasingh, B.; Valan Arasu, A. A Comprehensive Review on Latent Heat and Thermal Conductivity of Nanoparticle Dispersed Phase Change Material for Low-Temperature Applications. Energy Storage Mater. 2020, 24, 52–74. [Google Scholar] [CrossRef]
- Jurčević, M.; Nižetić, S.; Arıcı, M.; Ocłoń, P. Comprehensive Analysis of Preparation Strategies for Phase Change Nanocomposites and Nanofluids with Brief Overview of Safety Equipment. J. Clean. Prod. 2020, 274, 122963. [Google Scholar] [CrossRef]
- Rehman, T.-; Ali, H.M. Thermal Performance Analysis of Metallic Foam-Based Heat Sinks Embedded with RT-54HC Paraffin: An Experimental Investigation for Electronic Cooling. J. Therm. Anal. Calorim. 2020, 140, 979–990. [Google Scholar] [CrossRef]
- Kline, S.J. Describing Uncertainty in Single Sample Experiments. Mech. Eng. 1953, 75, 3–8. [Google Scholar]
- Leong, K.Y.; Chew, S.P.; Gurunathan, B.A.; Ahmad, K.Z.K.; Ong, H.C. An Experimental Approach to Investigate Thermal Performance of Paraffin Wax and 1-Hexadecanol Based Heat Sinks for Cooling of Electronic System. Int. Commun. Heat Mass Transf. 2019, 109, 104365. [Google Scholar] [CrossRef]
- Tariq, S.L.; Ali, H.M.; Akram, M.A.; Janjua, M.M. Experimental Investigation on Graphene Based Nanoparticles Enhanced Phase Change Materials (GbNePCMs) for Thermal Management of Electronic Equipment. J. Energy Storage 2020, 30, 101497. [Google Scholar] [CrossRef]
- Alshaer, W.G.; Rady, M.A.; Nada, S.A.; Palomo Del Barrio, E.; Sommier, A. An Experimental Investigation of Using Carbon Foam–PCM–MWCNTs Composite Materials for Thermal Management of Electronic Devices under Pulsed Power Modes. Heat Mass Transf. 2017, 53, 569–579. [Google Scholar] [CrossRef]
- Alshaer, W.G.; Nada, S.A.; Rady, M.A.; Del Barrio, E.P.; Sommier, A. Thermal Management of Electronic Devices Using Carbon Foam and PCM/Nano-Composite. Int. J. Therm. Sci. 2015, 89, 79–86. [Google Scholar] [CrossRef]
- Alimohammadi, M.; Aghli, Y.; Alavi, E.S.; Sardarabadi, M.; Passandideh-Fard, M. Experimental Investigation of the Effects of Using Nano/Phase Change Materials (NPCM) as Coolant of Electronic Chipsets, under Free and Forced Convection. Appl. Therm. Eng. 2017, 111, 271–279. [Google Scholar] [CrossRef]
- Bahiraei, F.; Fartaj, A.; Nazri, G.-A. Experimental and Numerical Investigation on the Performance of Carbon-Based Nanoenhanced Phase Change Materials for Thermal Management Applications. Energy Convers. Manag. 2017, 153, 115–128. [Google Scholar] [CrossRef]
- Sharma, S.; Micheli, L.; Chang, W.; Tahir, A.A.; Reddy, K.S.; Mallick, T.K. Nano-Enhanced Phase Change Material for Thermal Management of BICPV. Appl. Energy 2017, 208, 719–733. [Google Scholar] [CrossRef]
- Kumar, A.; Kothari, R.; Sahu, S.K.; Kundalwal, S.I. A Comparative Study and Optimization of Phase Change Material Based Heat Sinks for Thermal Management of Electronic Components. J. Energy Storage 2021, 43, 103224. [Google Scholar] [CrossRef]
- Kumar, A.; Kothari, R.; Sahu, S.K.; Kundalwal, S.I. Thermal Performance of Heat Sink Using Nano-Enhanced Phase Change Material (NePCM) for Cooling of Electronic Components. Microelectron. Reliab. 2021, 121, 114144. [Google Scholar] [CrossRef]


| Property | Copper Foam | PT58 Pure PCM | Aluminum | Rubber Block |
|---|---|---|---|---|
| Melting point (°C) | 1057 | 58–60 | 660.4 | – |
| Thermal conductivity (W/m-K) | 388 | 0.25 (Solid) 0.15 (Liquid) | 237 | 0.043 |
| Apparent density (Kg/m3) | 276 | 890 (Solid) 810 (Liquid) | 2689 | 2500 |
| Specific Heat (J/g°C) | 0.383 | 2.47 (Solid) 2.71 (Liquid) | 0.903 | 1.23 |
| Heat storage capacity (kJ/kg) | – | 225 | – | – |
| Porosity () | 97 | – | – | – |
| Pore density (PPI) | 35 | – | – | – |
| Pore size (mm) | 2.8 | – | – | – |
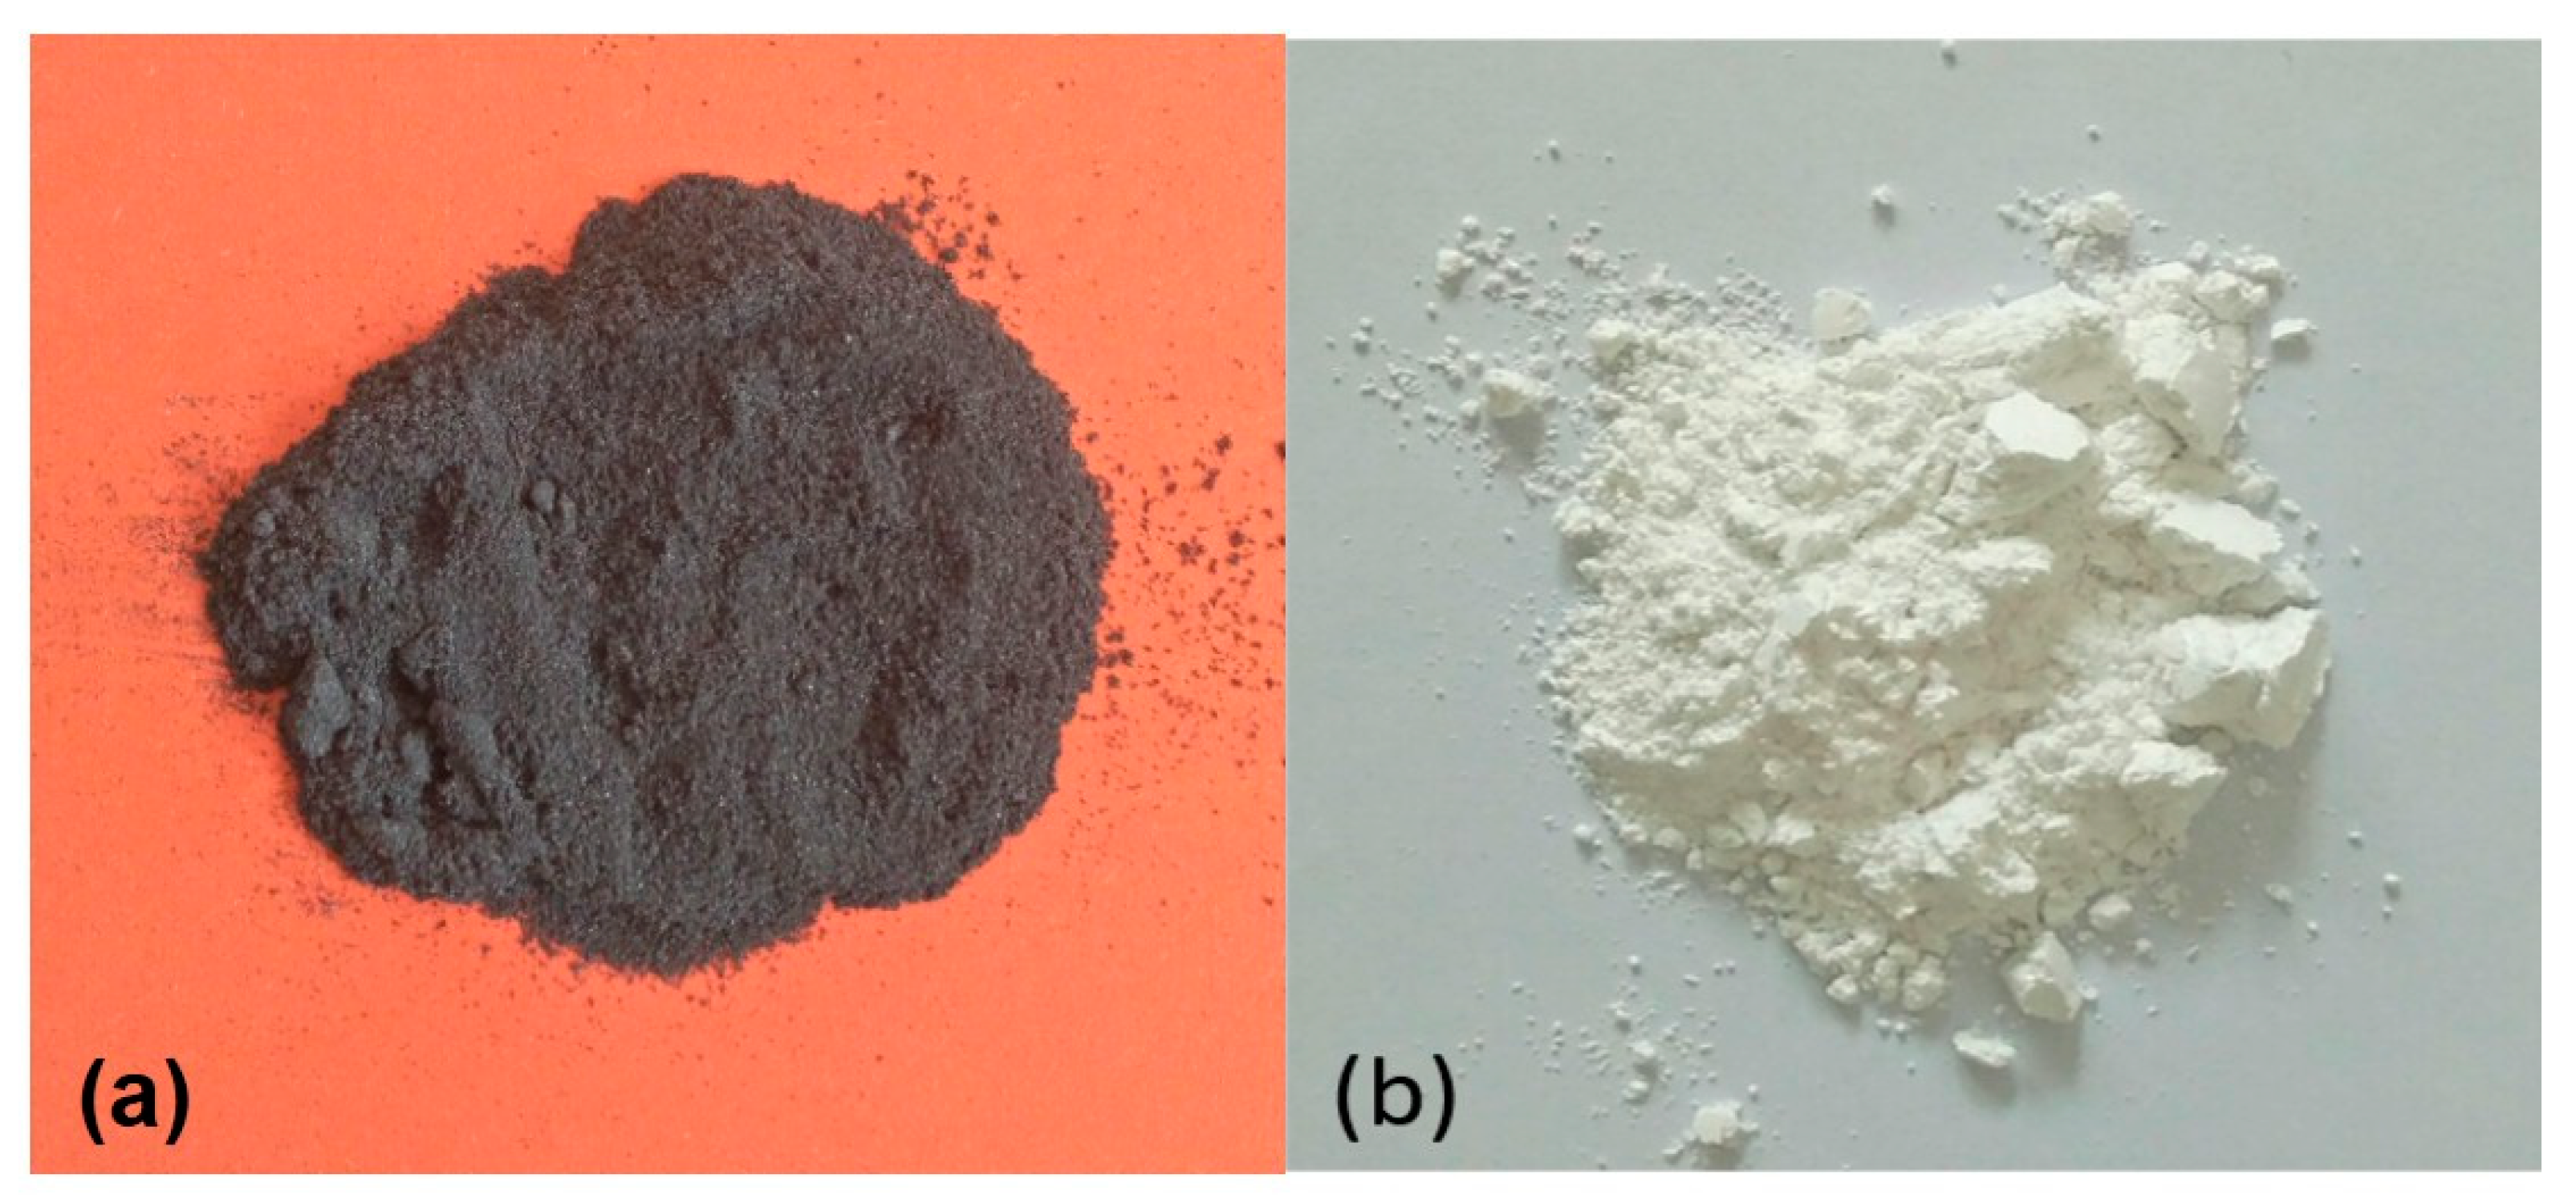
| NP Type | GNPs | MgO |
|---|---|---|
| Color | Grey powder | White |
| Thermal conductivity | 3000 (W/m K) | 49.5 (W/m K) |
| Particle size | 2–7 µm | 20 nm |
| Thickness | 2–10 nm | - |
| Specific surface area | 20–40 | 50 |
| Bulk density | 0.10 g/cm3 | 0.1–0.3 |
| Purity | >99% | 99% |
| Morphology | Platelets morphology | Spherical |
| Name | ||||
|---|---|---|---|---|
| Location of thermocouples | Heat sink base | 8 | 16 | 24 |
Publisher’s Note: MDPI stays neutral with regard to jurisdictional claims in published maps and institutional affiliations. |
© 2022 by the authors. Licensee MDPI, Basel, Switzerland. This article is an open access article distributed under the terms and conditions of the Creative Commons Attribution (CC BY) license (https://creativecommons.org/licenses/by/4.0/).
Share and Cite
Hassan, F.; Hussain, A.; Jamil, F.; Arshad, A.; Ali, H.M. Passive Cooling Analysis of an Electronic Chipset Using Nanoparticles and Metal-Foam Composite PCM: An Experimental Study. Energies 2022, 15, 8746. https://doi.org/10.3390/en15228746
Hassan F, Hussain A, Jamil F, Arshad A, Ali HM. Passive Cooling Analysis of an Electronic Chipset Using Nanoparticles and Metal-Foam Composite PCM: An Experimental Study. Energies. 2022; 15(22):8746. https://doi.org/10.3390/en15228746
Chicago/Turabian StyleHassan, Faisal, Abid Hussain, Furqan Jamil, Adeel Arshad, and Hafiz Muhammad Ali. 2022. "Passive Cooling Analysis of an Electronic Chipset Using Nanoparticles and Metal-Foam Composite PCM: An Experimental Study" Energies 15, no. 22: 8746. https://doi.org/10.3390/en15228746
APA StyleHassan, F., Hussain, A., Jamil, F., Arshad, A., & Ali, H. M. (2022). Passive Cooling Analysis of an Electronic Chipset Using Nanoparticles and Metal-Foam Composite PCM: An Experimental Study. Energies, 15(22), 8746. https://doi.org/10.3390/en15228746