1. Introduction
World trends in the electric power industry determine several promising areas of scientific research in the field of relay protection and automation (RPA) [
1,
2,
3,
4,
5,
6,
7,
8,
9,
10,
11,
12,
13,
14,
15]. Among them are noted:
Development of principles for building adaptive protections, i.e., protections that automatically adjust to the modes of operation of electric power systems (EPS) [
3,
4,
5,
6,
7,
8,
9];
Issues of organizing remote access and cybersecurity, automated data acquisition and analysis, timely response to changes in the EPS mode [
10,
11];
Analysis of the need to increase the requirements for relay protection and automation, controllability and observability of the modes of distribution networks, including those with sources of distributed generation [
12,
13,
14,
15];
Application of technologies for simulation of EPS facilities for the purposes of relay protection and automation. New principles for building relay protection and automation systems based on modern communication technologies and the IEC 61850 standard [
4,
11,
16].
The existing tendency to increase the share of digital relay protection devices, as well the growth of their computing power, is likely to continue in the future. The development of communication technologies in relay protection will provide access for any IED to almost all mode parameters measured within the substation. On the other hand, the requirements for the efficiency of the RPA devices are becoming stricter. Protections should become more sensitive and faster and are capable of adapting independently to the operating mode of an electrical network of complex configuration. The introduction of distributed generation sources and renewable energy sources into distribution networks contributes to the expansion of the variety of potentially possible network operation modes [
12,
13,
14,
15], thereby complicating the task of adaptation.
One of the directions of technical improvement of relay protection and automation systems is the development of new algorithms for recognition of emergency modes, which uses the information available through communication systems to the fullest and most effectively [
1,
4,
16]. The approach involves replacement of traditional types of relay protection (current protection, distance protection, and other automatic) with decision-making systems adapted to a specific protected object.
The construction of these systems requires solving the following problems:
Obtaining statistical data that fully and reliably describes the values of the parameters, both in normal and emergency modes.
Identification of regularities in the obtained data, allowing to formulate a recognition rule that reliably separates normal and emergency modes.
The solution of the first task can be carried out with the help of EPS simulation. Modern processors make it possible to perform multiple run simulations of a network section in a reasonable time and obtain the required distributions of signs of normal and emergency modes with sufficient accuracy. To conduct simulation, it is advisable to use the Monte Carlo method [
17], since it will allow to determine not only the ranges of possible values of the signs of the regime, but also their frequency distributions, as well as to establish the correlation between the signs.
Formation of optimal conditions for operation of relay protection is a much more complicated process, because it requires analysis of a large amount of model data, characterizing the modes of operation of the electric power system.
Performing the analysis “manually” is extremely difficult, due to its high complexity and individuality for each specific circuit-mode situation. However, the algorithms of machine learning, one of the branches of artificial intelligence that is actively developing today, are proving their effectiveness in solving problems of this kind.
In contrast to rigidly defined decision-making algorithms, which include traditional types of relay protection, machine learning allows you to identify empirical patterns in the data and build an emergency operation rule in accordance with them.
The purpose of the article is to apply classical machine learning algorithms and data analysis methods to recognize complex normal and emergency modes in new advanced electrical networks (power grids) to improve relay protection and automation devices.
2. Machine Learning in the Task of Developing New Algorithms for Identifying Emergency Modes of EPS
The term “artificial intelligence” (AI) summarizes a fairly large range of different algorithms to analyze information and make decisions, often while simulating human cognitive activity [
18,
19,
20,
21,
22].
The term “artificial intelligence” (AI) generalizes a fairly large range of different algorithms that allow one to analyze information and make decisions, often imitating human cognitive activity [
18,
19,
20,
21,
22].
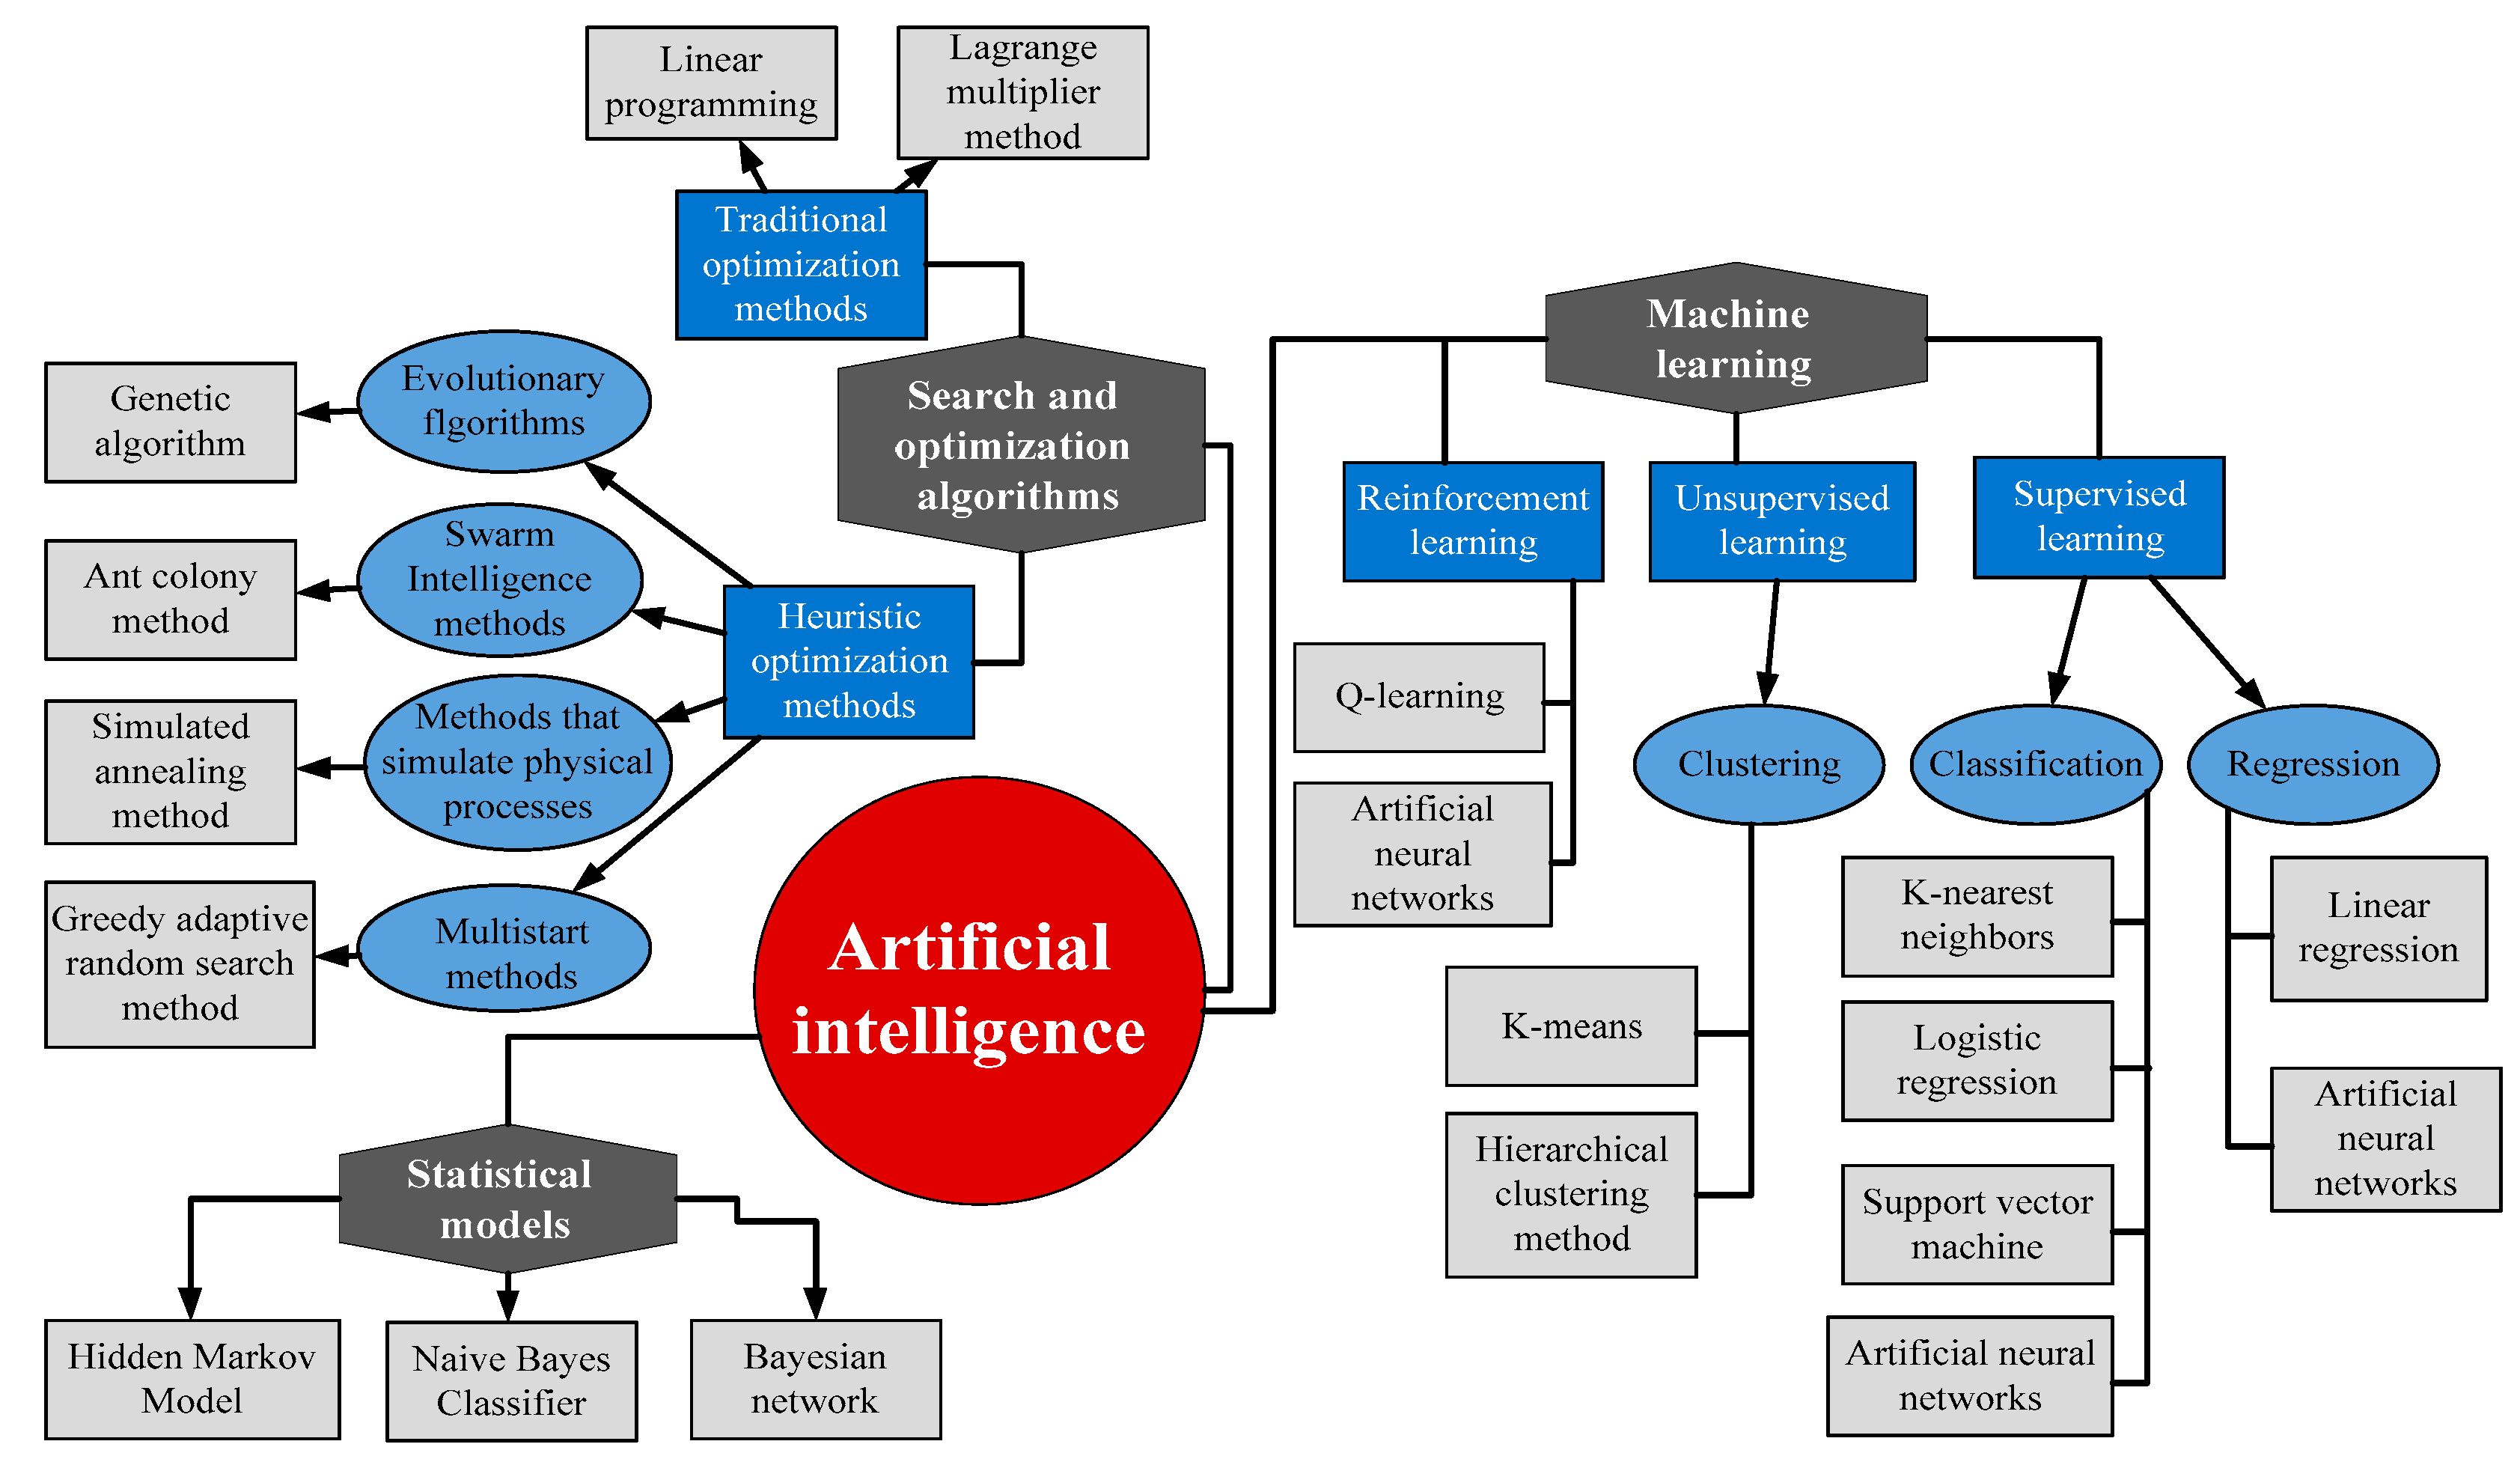
Machine learning (
Figure 1) is a section of artificial intelligence designed to build algorithms that can learn from empirical data [
22,
23,
24,
25]. Unlike statistical methods, machine learning methods directly analyze instances (realizations) of the training sample and not its statistical characteristics. Depending on the problem being solved, as well as the data used for training, algorithms are divided into supervised learning and unsupervised learning.
Unsupervised learning algorithms are designed to discover hidden patterns in input information. They use “unlabeled” data and require minimal human intervention. A typical unsupervised learning problem is a clustering problem, i.e., the task of combining objects into relatively homogeneous groups (clusters).
Supervised learning involves the formation of algorithms capable of predicting the value of an unknown quantity based on some feature vector. The desired value depends on them. The training sample consists of a set of data vectors for which the value of the objective function is known. In the case when the target variable is continuous, then such a task is called a regression task. If the observed feature vector needs to be associated with a discrete value from a given list, then such a task is called a classification problem.
Like other areas of artificial intelligence, machine learning is being actively explored for possible applications in the electric power industry, in particular in relay protection. However, existing studies are more likely to demonstrate the capabilities of a particular algorithm than to develop a systematic approach to the introduction of machine learning in the power industry. In this regard, a comprehensive study of the possibility of using classification algorithms in relay protection is relevant.
An important stage in the development process is the selection and training of algorithms that directly decide on the operation of protection in emergency modes. The task of constructing trainable RPA modules based on “labeled” (classified) model data is a typical supervised learning task, namely, a classification task. Next, we analyze the application of classical machine learning algorithms in the problem of classifying EPS modes, which are also the most common in solving pattern recognition problems.
3. Application of Simulation in the Problem of Classifying EPS Modes
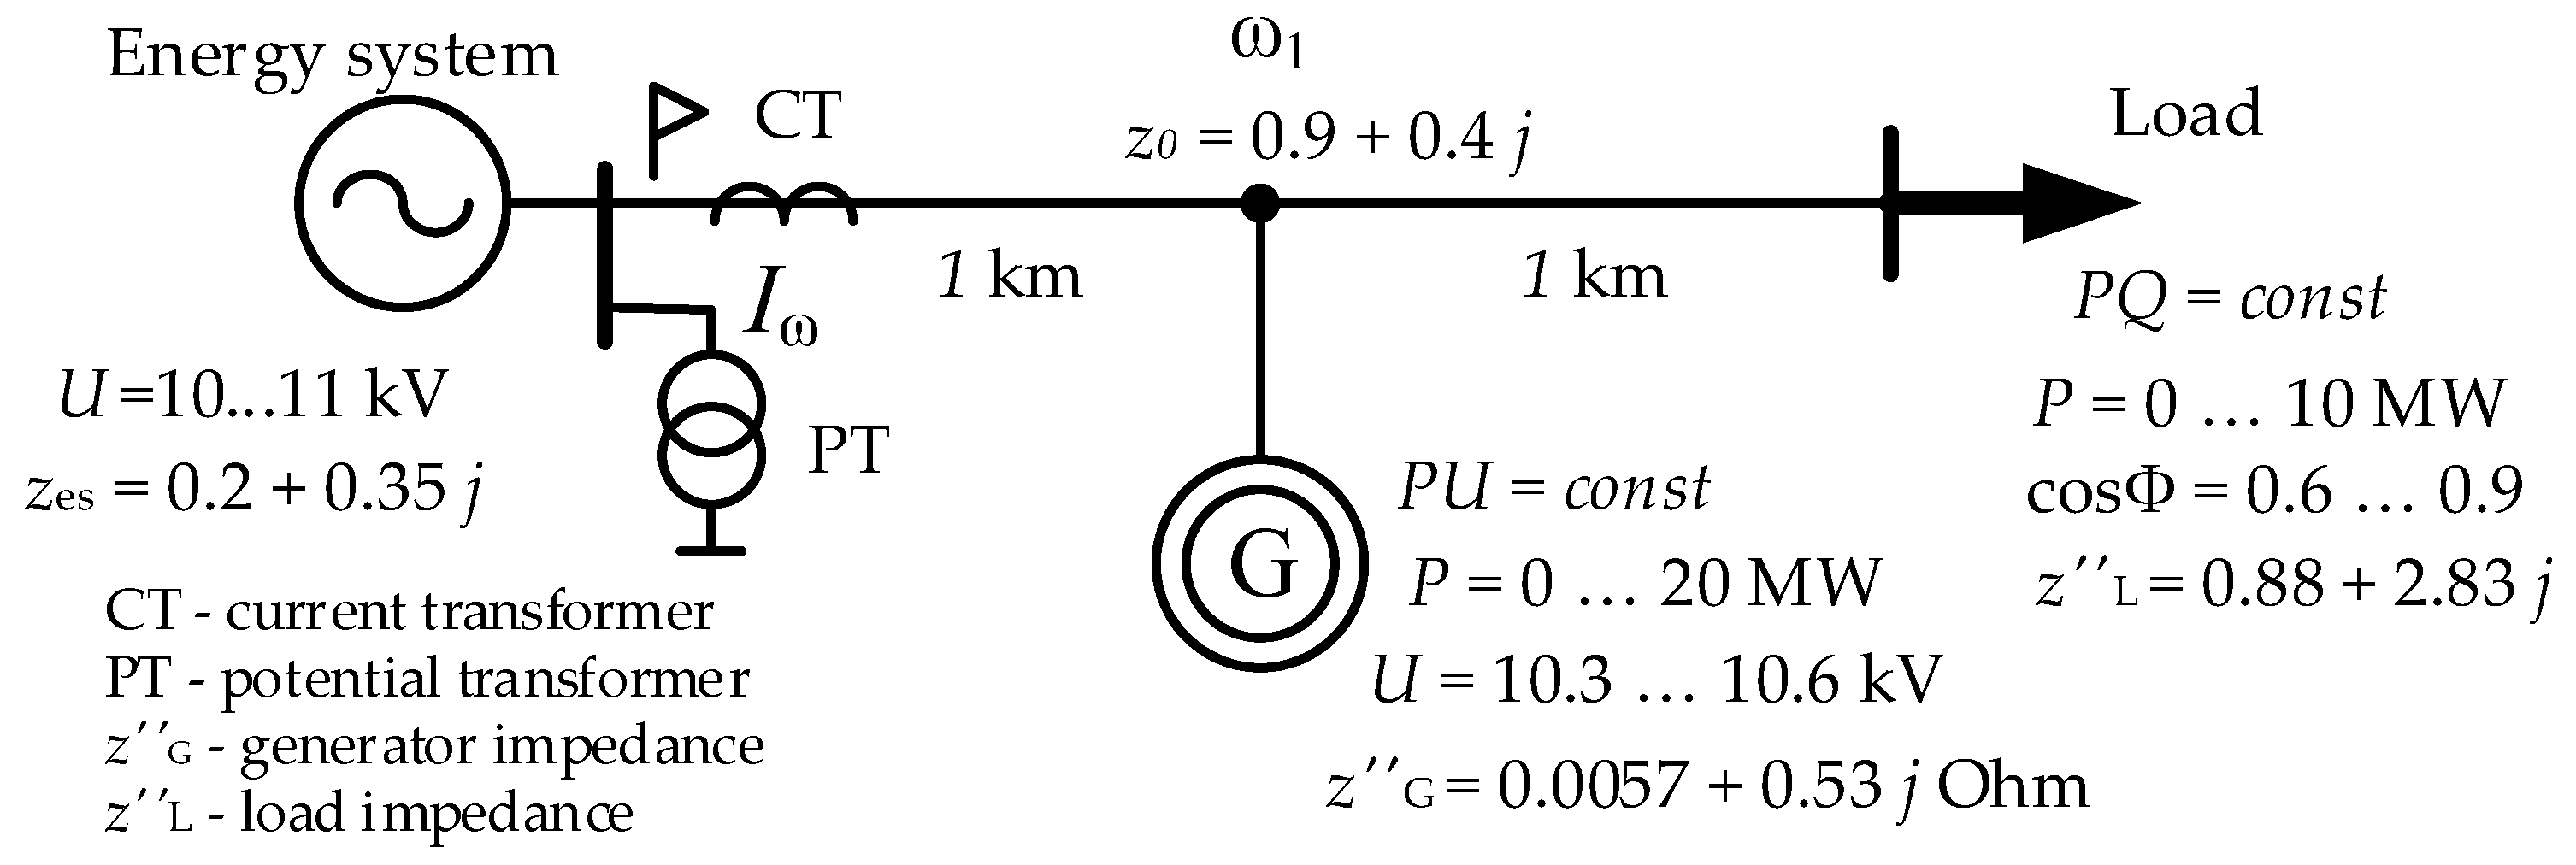
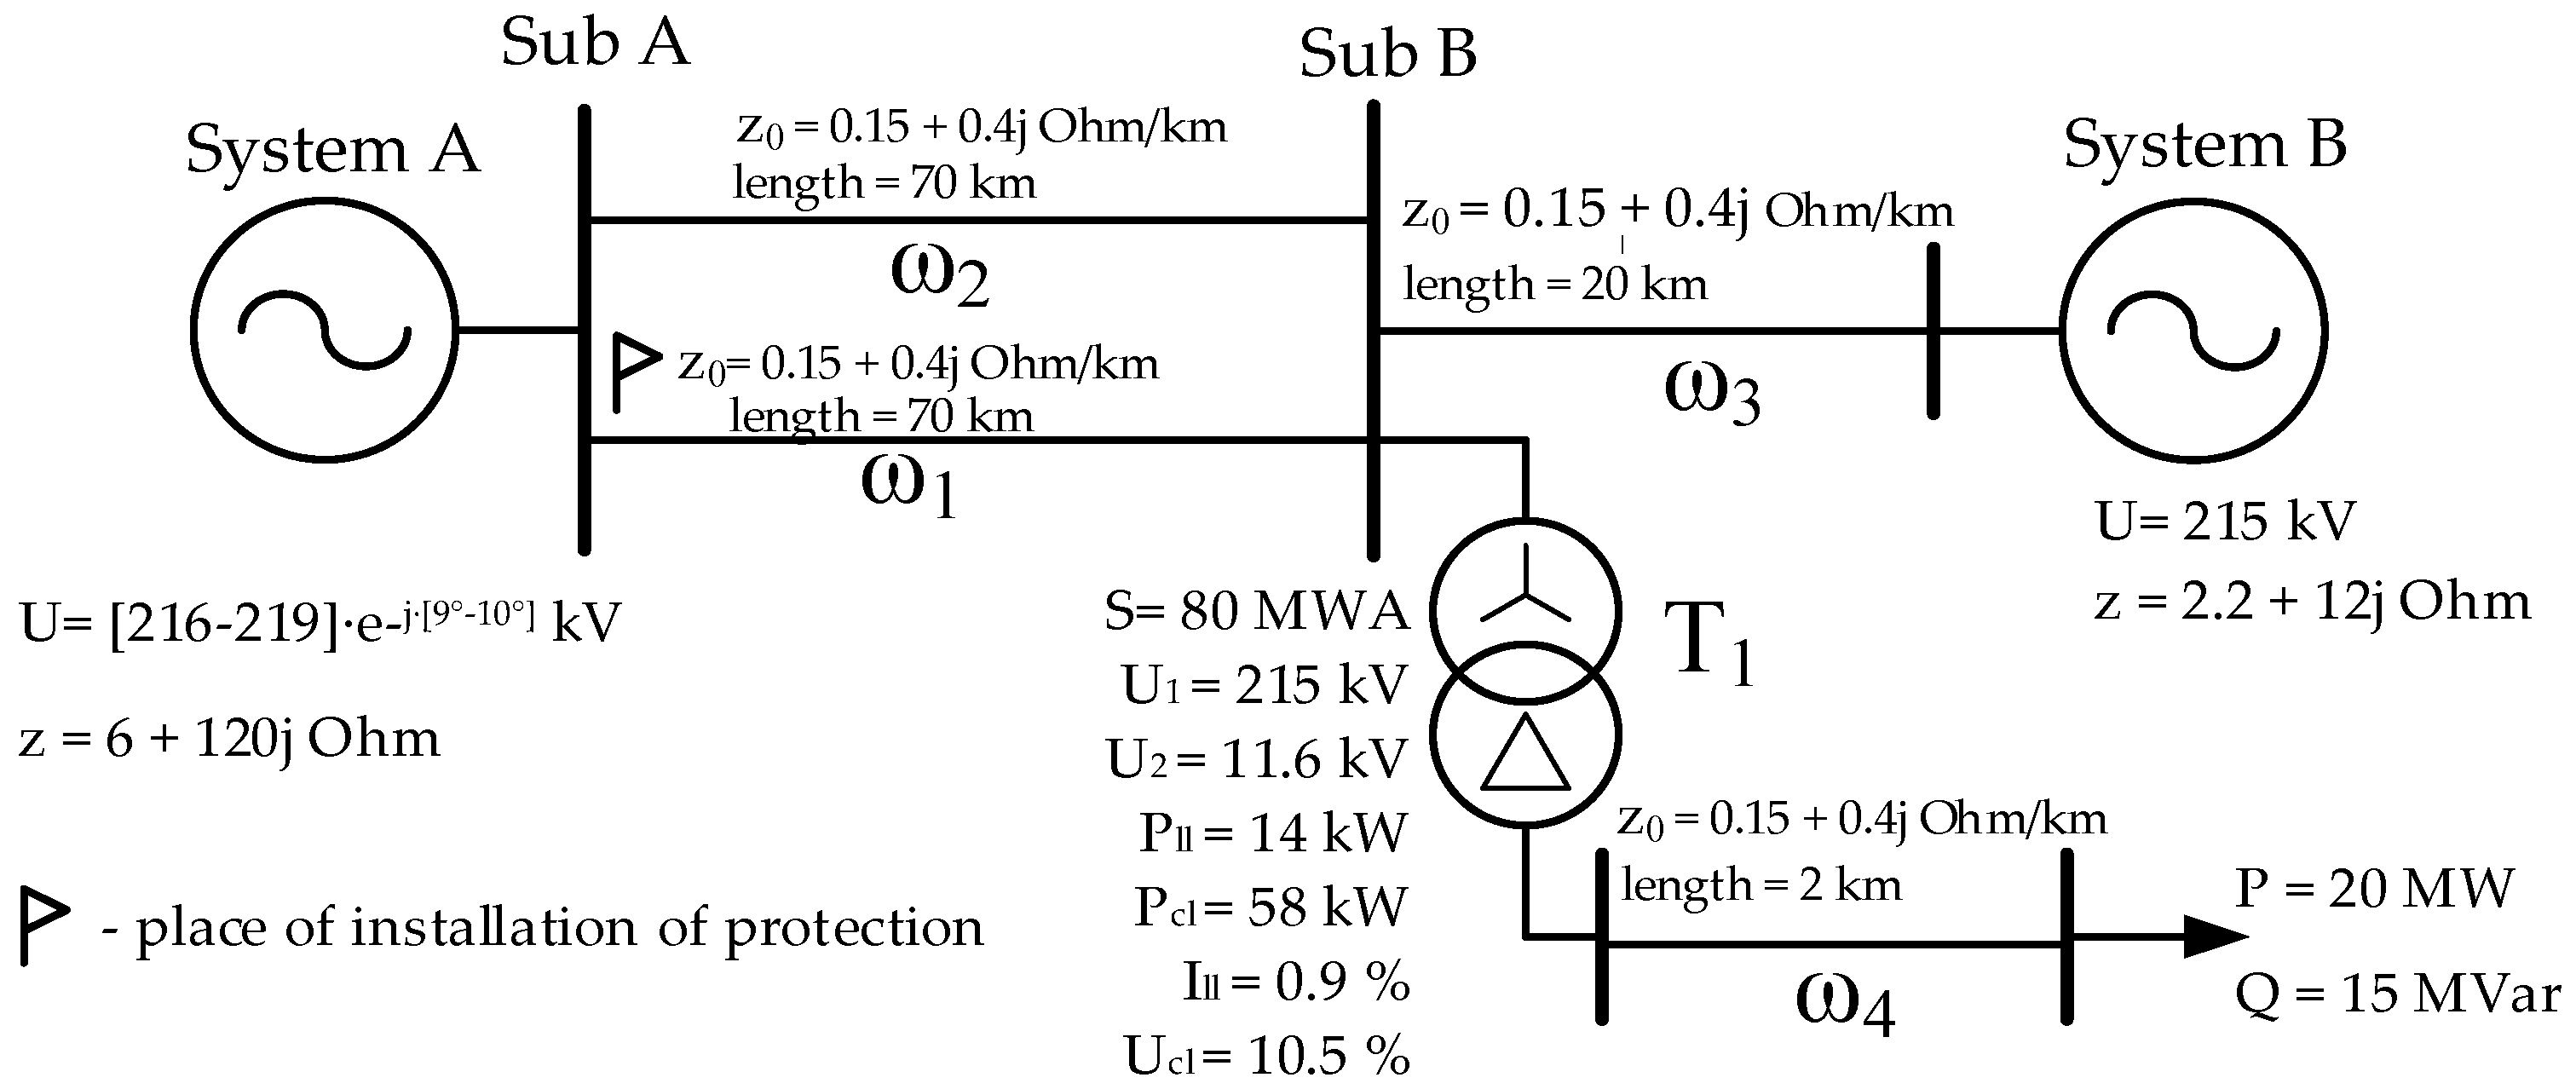
As a data source for training and analyzing the studied machine learning algorithms, let us consider a network section with a source of distributed generation (
Figure 2). The figure shows both constant and changing parameters of the simulation model. Let us formulate the recognition task as follows: it is necessary to develop a triggering element for the RPA device installed at the beginning of the line ω1, which provides protection of the line from three-phase and phase-to-phase short circuits. In this case, detuning from operating modes and load self-start modes should be implemented.
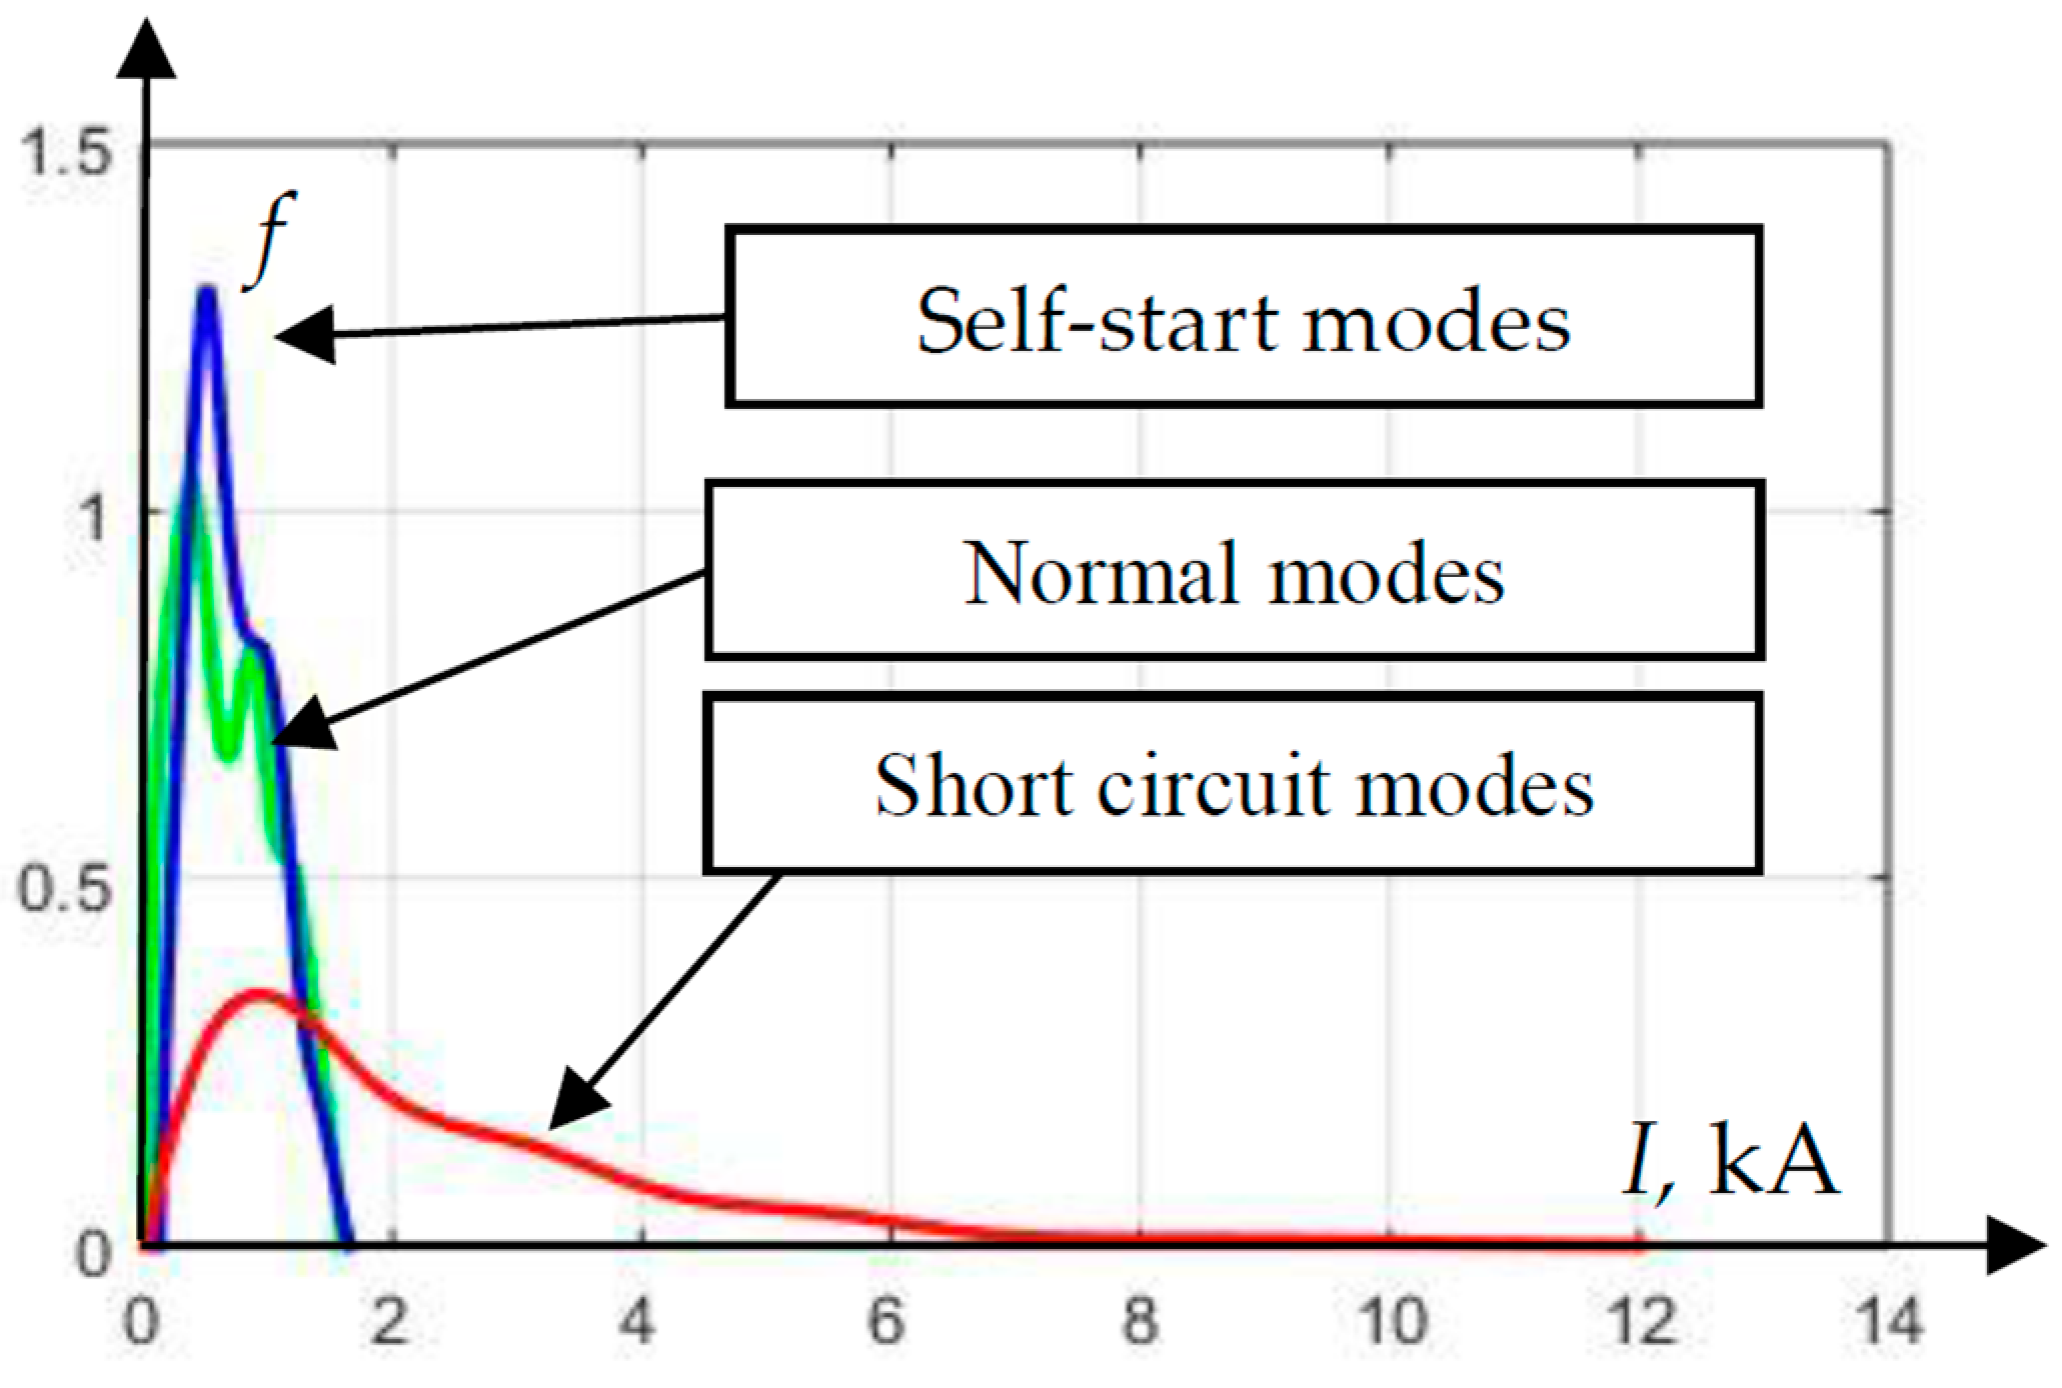
As a result of modeling in Matlab, all possible modes of operation of the considered electric power system (
Figure 2) statistical distributions of the effective RMS current value in the operating modes, modes of self-start, and during short circuits on the line ω1 (
Figure 3) were constructed.
Figure 3 shows that a significant part of the emergency short-circuit currents turned out to be commensurate in magnitude with the normal currents and load self-starting currents. This is due to the fact that the generator included in the branch line can reduce the proportion of short-circuit current flowing through the installation site of the protection, thereby reducing its sensitivity [
26]. Obviously, the use of current protection in the analyzed section of the electrical network is not effective due to low sensitivity. That is, the classic current protection will not perceive a short circuit in the network as an emergency mode.
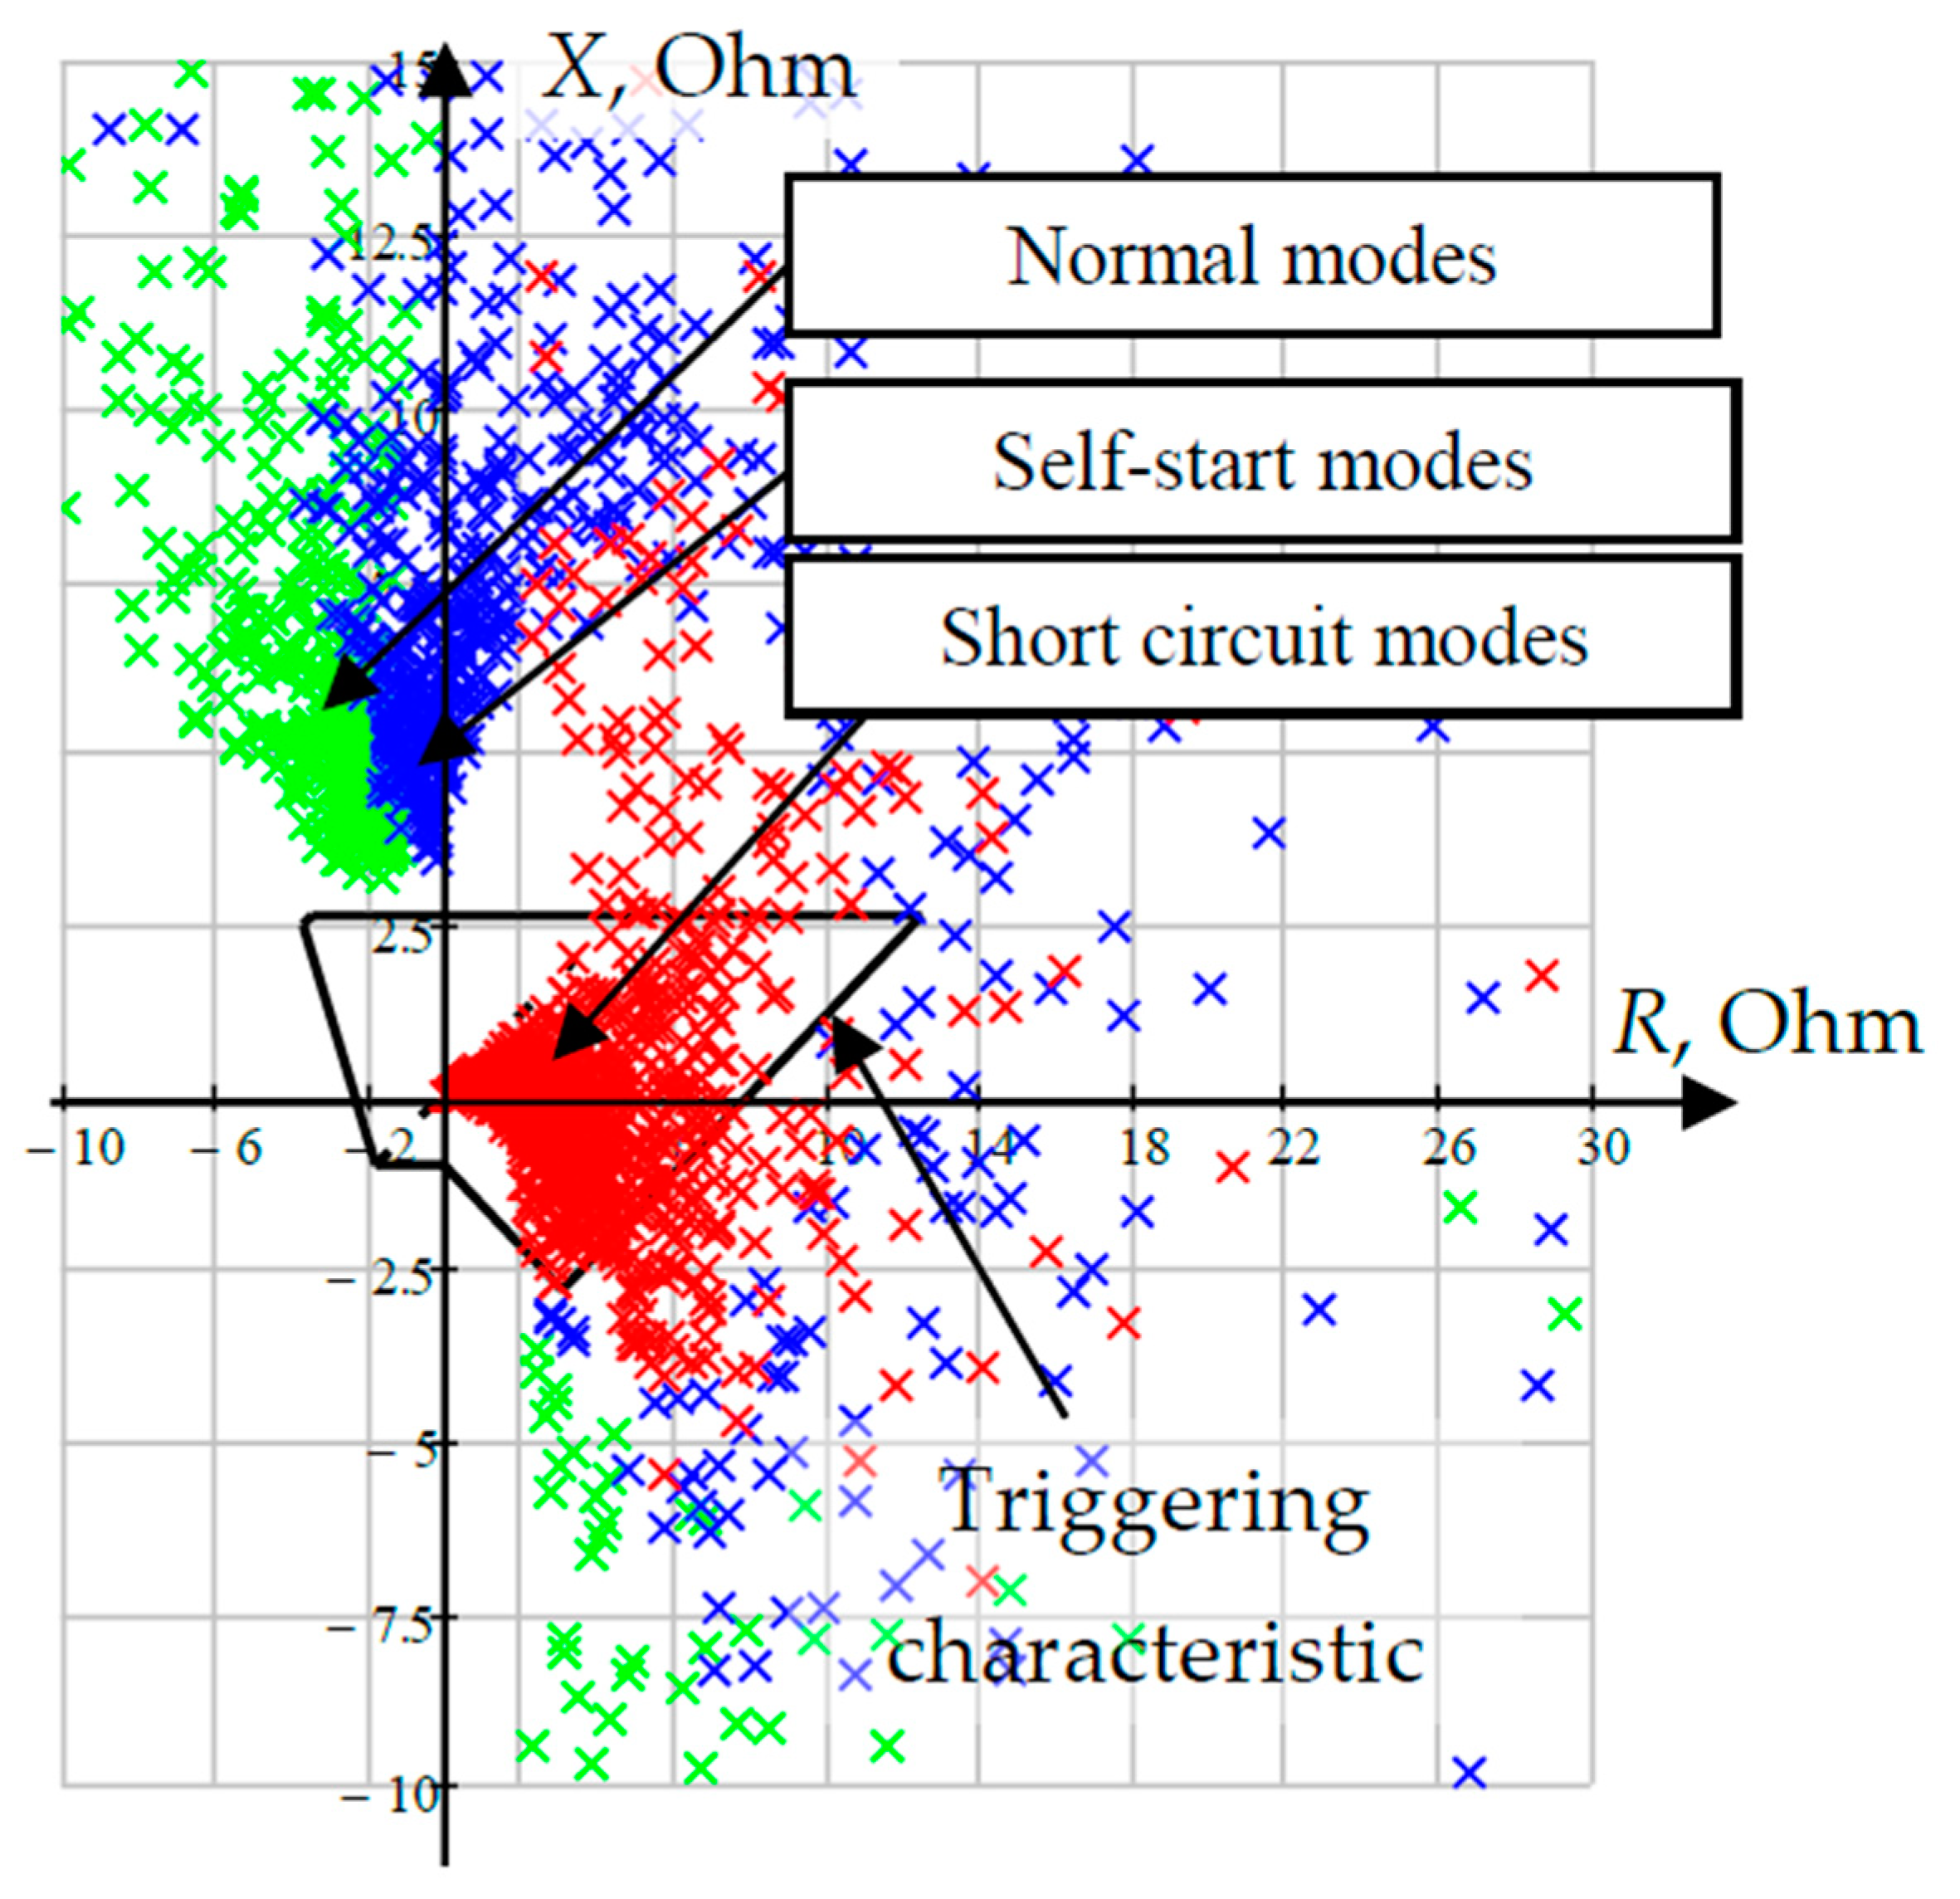
Figure 4 characterizes the efficiency of the use of distance protection (DP) for the scheme under consideration (
Figure 2). Using the results of simulation, the values of complex resistances were calculated, estimated at the place where the protection was installed for each of the experiments, and placed on the complex plane.
Distance protection with a characteristic (
Figure 4), obtained by the condition of detuning from normal modes and modes of self-starting of the load, is able to disconnect the short circuit that occurs on the line with a probability of 74%. Despite the fact that the result inherent in distance protection significantly exceeds the result characteristic of current protection, its efficiency is still insufficient for reliable detection of emergency modes of a section of an electrical network.
4. Considered Machine Learning Methods
A further increase in the recognizing ability of the protection can be achieved as a result of the use of recognizing elements based on machine learning algorithms.
4.1. K-Nearest Neighbor Method
The k-nearest neighbor method [
25,
26] belongs to the group of metric classification algorithms. At the same time, the elements of the training sample that are closest to the object being classified are analyzed in order to make a decision about its belonging to a particular class.
The k-nearest neighbor method has the most intuitive operating principle among machine learning algorithms [
25,
26]. The classification of the mode (object) is carried out according to the most frequently occurring class among its “neighbors”. This happens for the objects of the training sample located at the minimum distance from the object being classified. The number of “neighbors” is chosen when determining the parameters of the mathematical model, based on the requirements of a specific classification problem. The method can use various distance functions [
27]. The following are most commonly used:
where x = [x
1, x
2…x
m], y = [y
1, y
2…y
m]—Vectors in m-dimensional space, the distance between which is to be determined; D(x,y)—Value of distance between vectors.
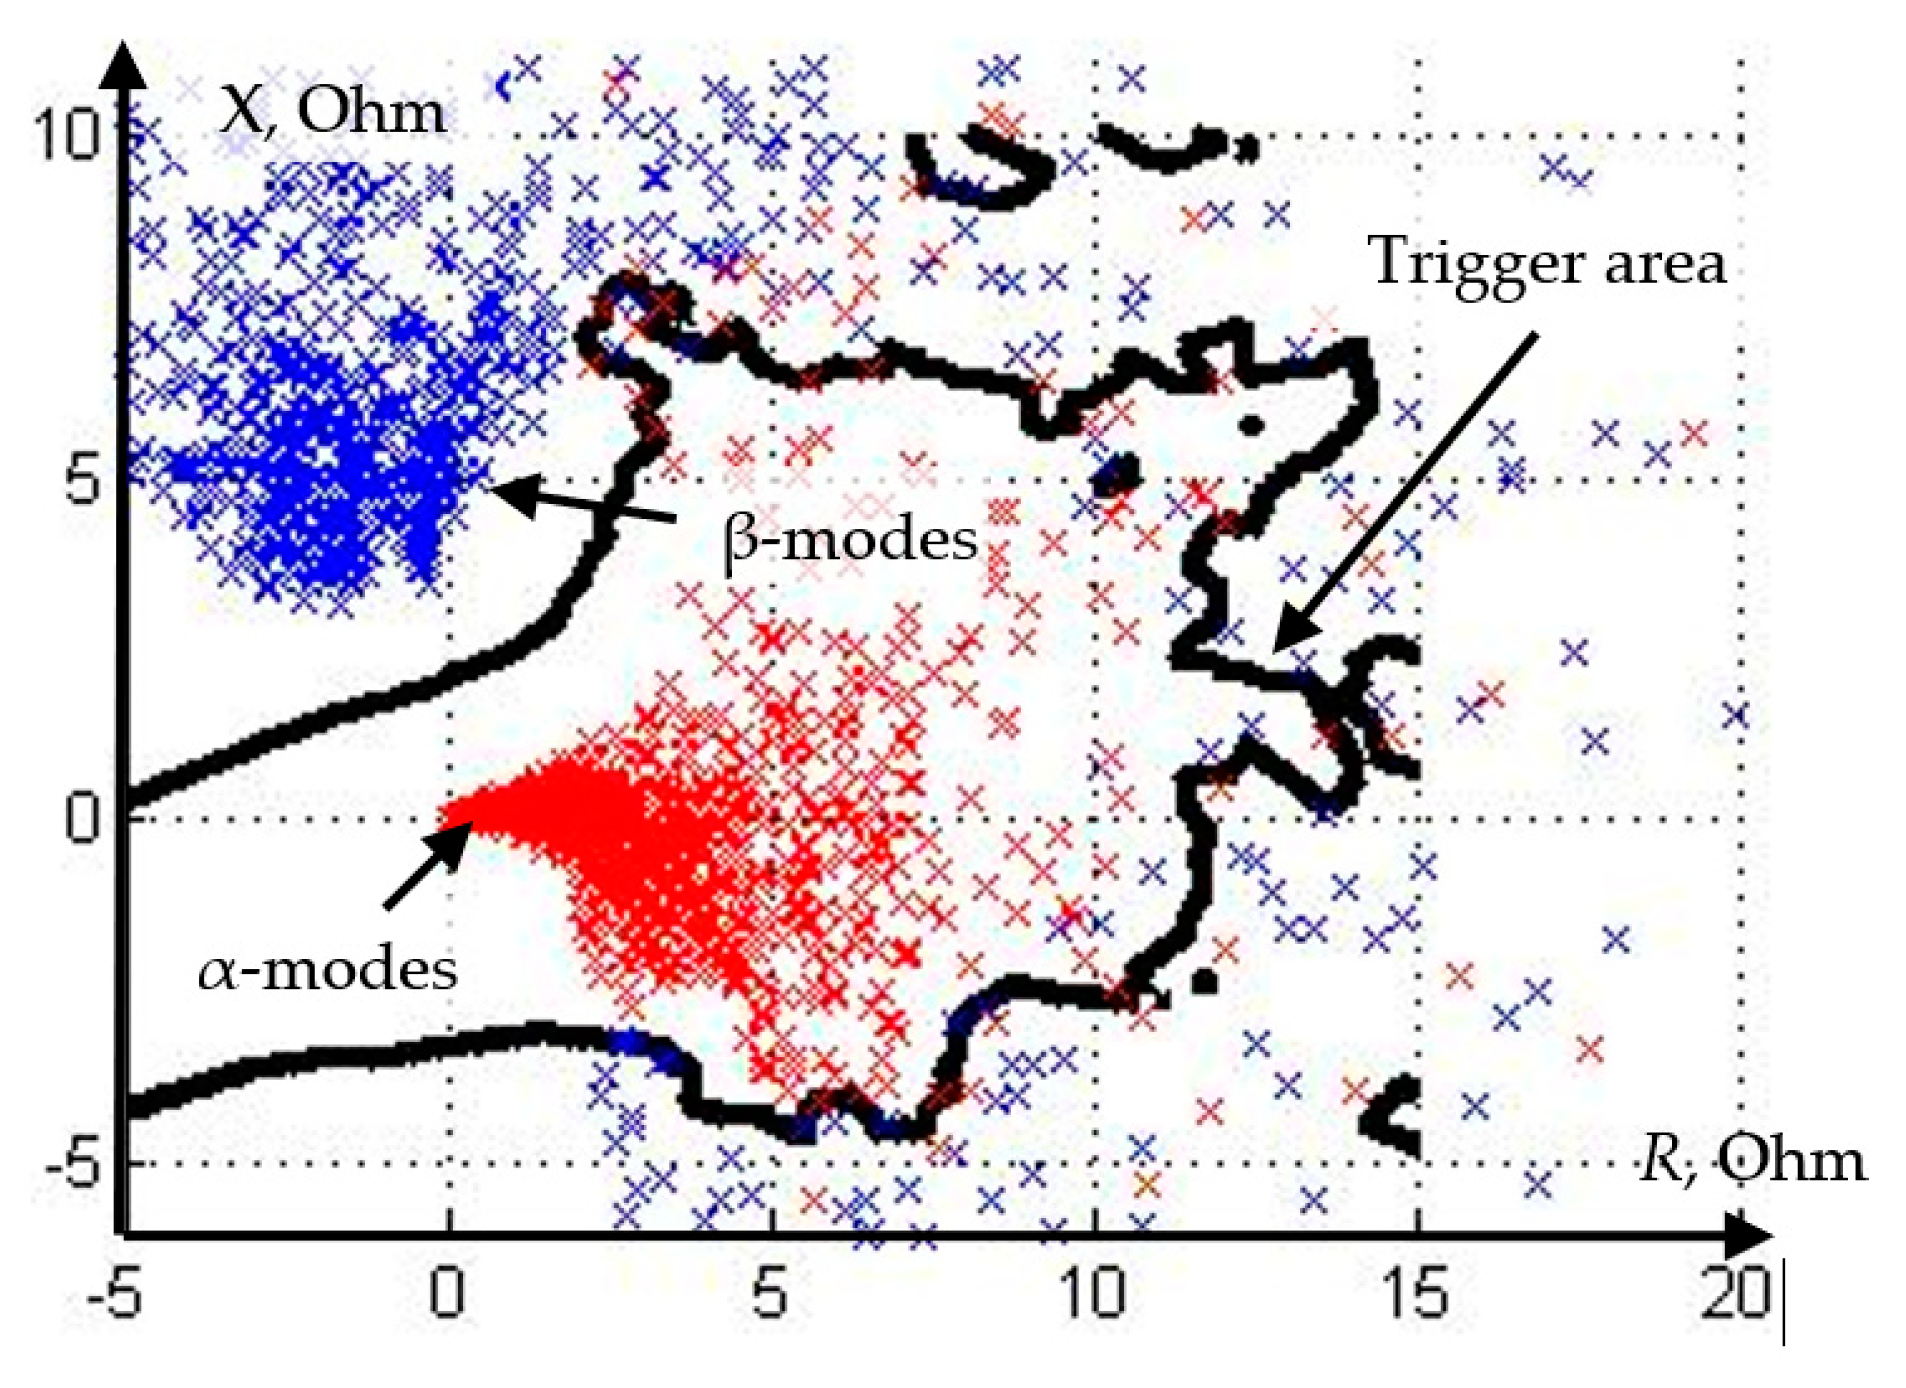
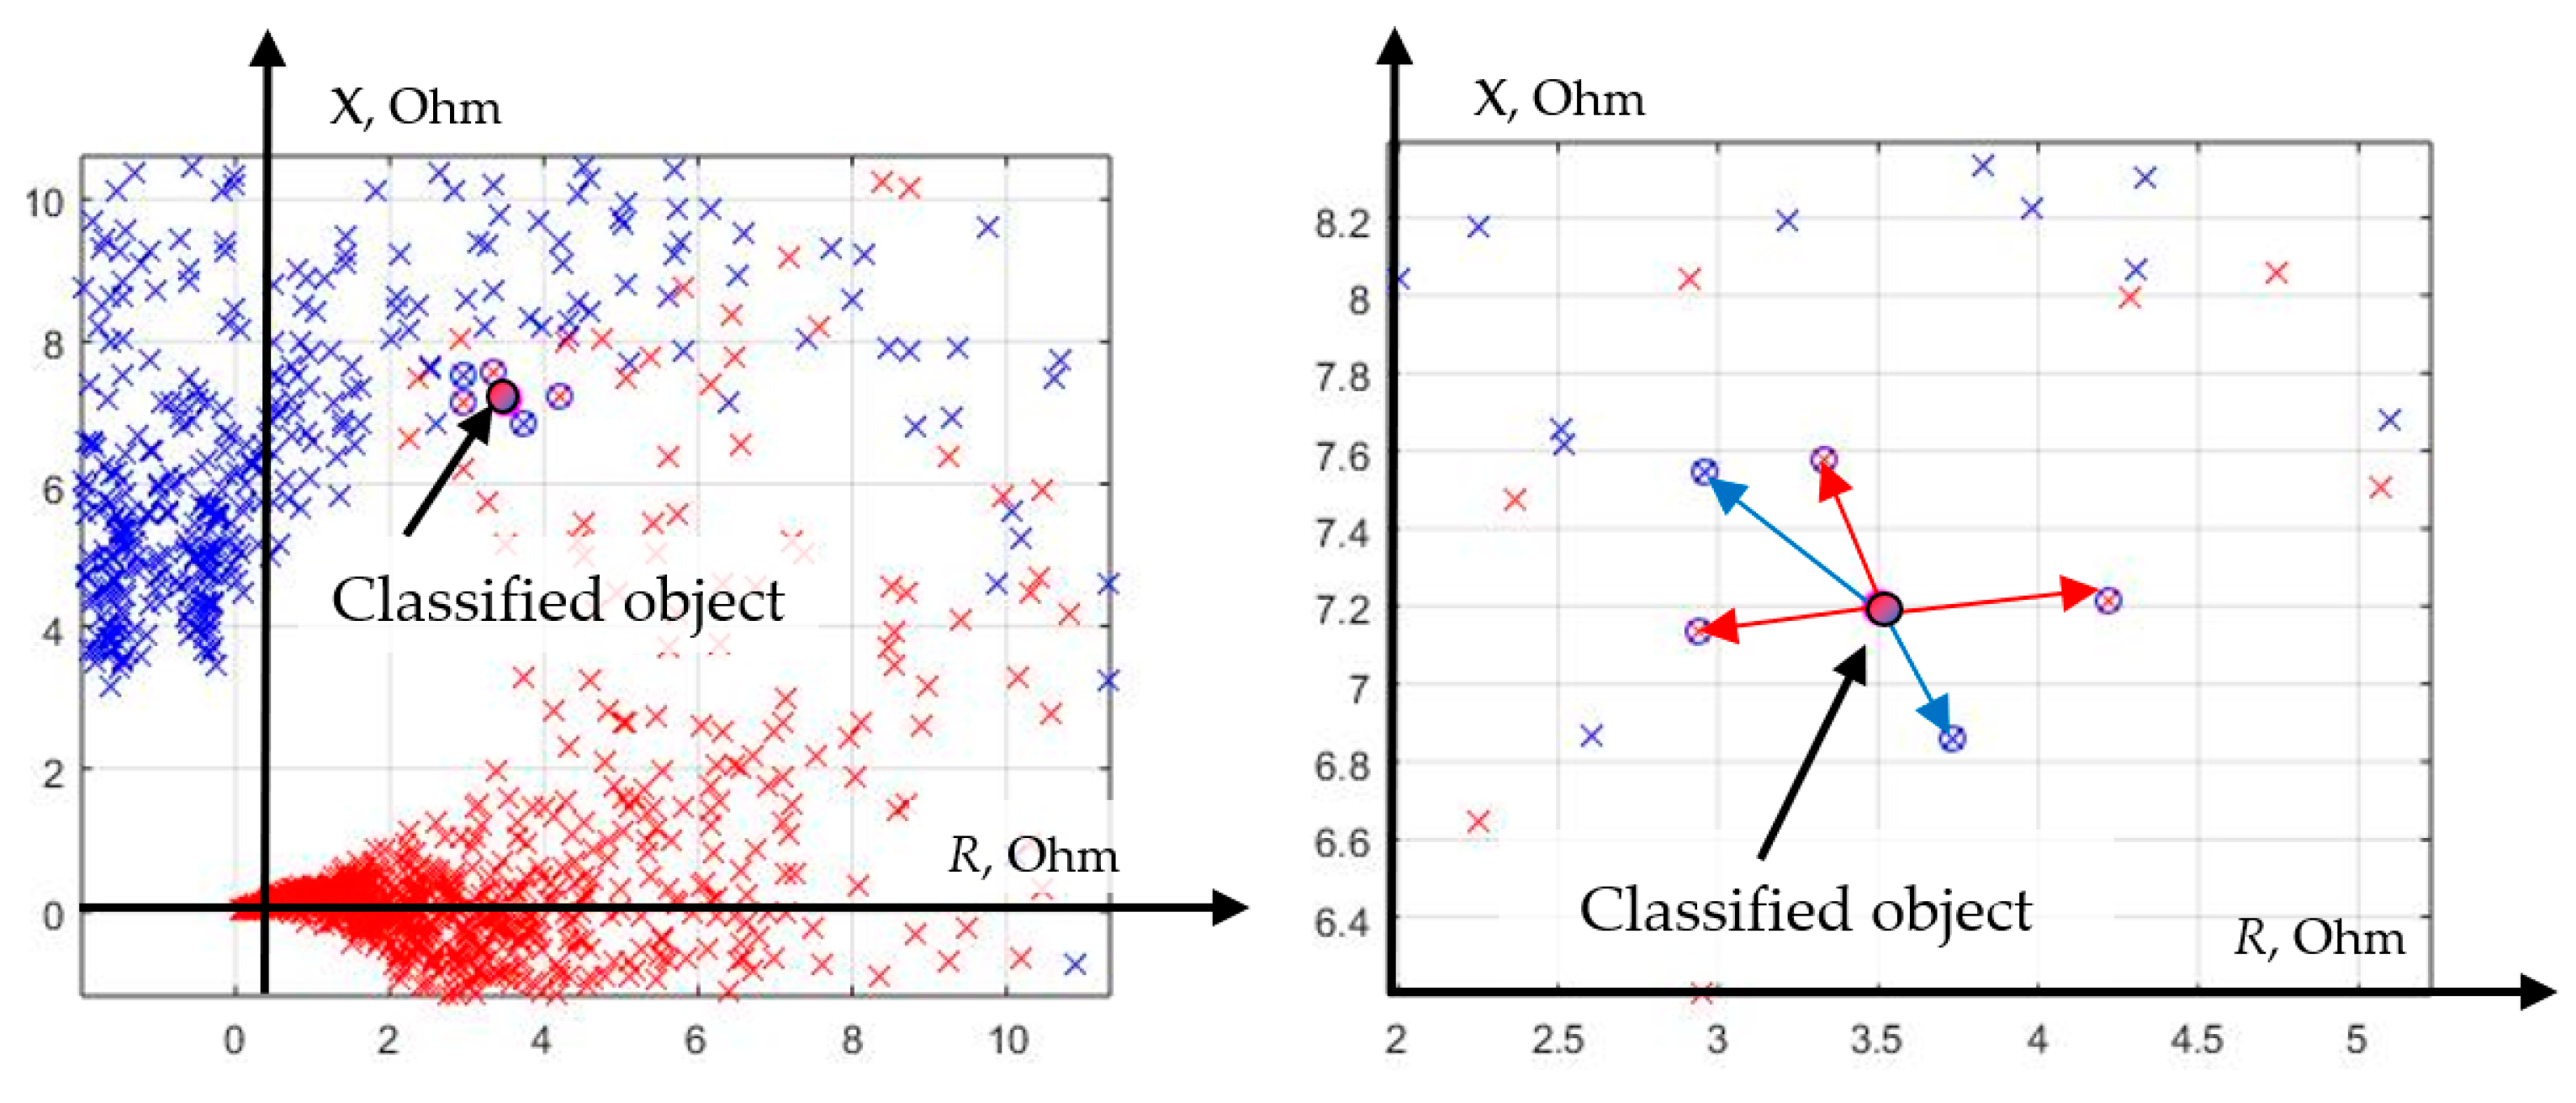
To be able to objectively assess the advantages of the k-nearest neighbors method, let us choose the feature space formed by the active and reactive components of the complex resistance (
Figure 5). When setting up the classifier, we take the value of k equal to 5, and we choose the Euclidean metric as a distance function.
The modes whose simulation is implemented for protection training are divided into two categories: α-modes and β-modes. α-modes are understood as short circuits and other emergency modes that must be disabled by relay protection, while β-modes are understood as alternative modes, i.e., those during which protection must not act.
As an example, in the training sample, we select five (k = 5) values and define their classes. The distance to them is minimal from the classified value of the complex resistance (1). Among the nearest neighboring values of the complex resistance there were three objects belonging to the class α and two objects characteristic of the class β (
Figure 5). Therefore, in accordance with the majority principle, the current analyzed mode belongs to the class α.
Let us select on the setting plane (in the feature space) the areas of protection operation, within which the mode will belong to class α when implementing the algorithm under study (
Figure 6).
Let us estimate the efficiency of the recognition algorithm by the RPA device using the error matrix [
24], which contains the probabilities of correct classification of each of the classes, as well as the probabilities of errors of the first and second kind. Let us randomly divide the total set of model simulation experiments into two groups, one of which will be used for training the protection algorithm, and the second for its subsequent testing. The error matrix, as applied to the conditions of the study of the k-nearest neighbors method, is illustrated in
Table 1.
Analysis of the
Table 1 shows that the use of the k-nearest neighbors method ensures the detection of 95.2% of the short circuit on the protected line, and with a probability of 2.9%, a false triggering of the protection is possible.
Depending on the specific case and the requirements for RPA, modifications of the k-nearest neighbors method are possible [
26]. For example, instead of the majority principle, the following classification rule (criterion) can be adopted: an object belongs to class α only if each of its k-nearest neighbors also belongs to class α. Otherwise, the object belongs to the class β. This criterion will make it possible to eliminate the possibility of false assignment of the object’s operation mode to the set of α-modes, thereby provoking a non-selective operation of the relay protection device. In this case, by modifying the decision rule at the cost of some loss of sensitivity, it is possible to reduce the probability of false triggering of the protection algorithm. It is also possible to reduce the number of false protection triggering in operating modes and load self-start modes by increasing the parameter k. This leads to a roughening of the protection, a decrease in sensitivity, but the probability of a false protection operation is reduced to zero. Increasing the recognition of emergency modes is also possible by expanding the set of information features (increasing the dimension of the feature space). The maximum percentage of recognized short circuits achieved using the k-nearest neighbors method was 98.8%. At the same time, a further increase in the dimension of the feature space did not lead to an increase in the recognition ability of the RPA.
4.2. Logistic Regression Method
Unlike the k-nearest neighbors method discussed above, the logistic regression method [
28] is a method of linear data classification, which consists in finding the optimal hyperplane in the feature space that separates α and β modes from each other. The determination of the equation of the optimal separating plane is carried out by finding the minimum of the objective function, specified in such a way that its value increases in proportion to the classification error of the training sample objects. The optimization problem is formulated as follows:
where B
i—the
i-th element of the training sample; Z—the desired vector of hyperplane coefficients; and Y
i—the label of the
i-th element (0 or 1).
The sigm function, called the sigmoid, is given by expression (5):
The vector Z, along which the optimization is carried out, specifies the coefficients of the separating hyperplane. Since the number of elements of the training sample (N) can reach several thousand values, the most effective ways to solve the given optimization problem are iterative methods (steepest descent, gradient method).
Having found the vector of coefficients
, at which the minimum of the objective function is provided, it becomes possible to determine the probability that an arbitrary object x belongs to the class α according to expression (6):
The classification of the object x consists in comparing the probability with some selected setting pset in the range (0, 1). Changing the setpoint allows you to increase the sensitivity or coarsen the classifying algorithm.
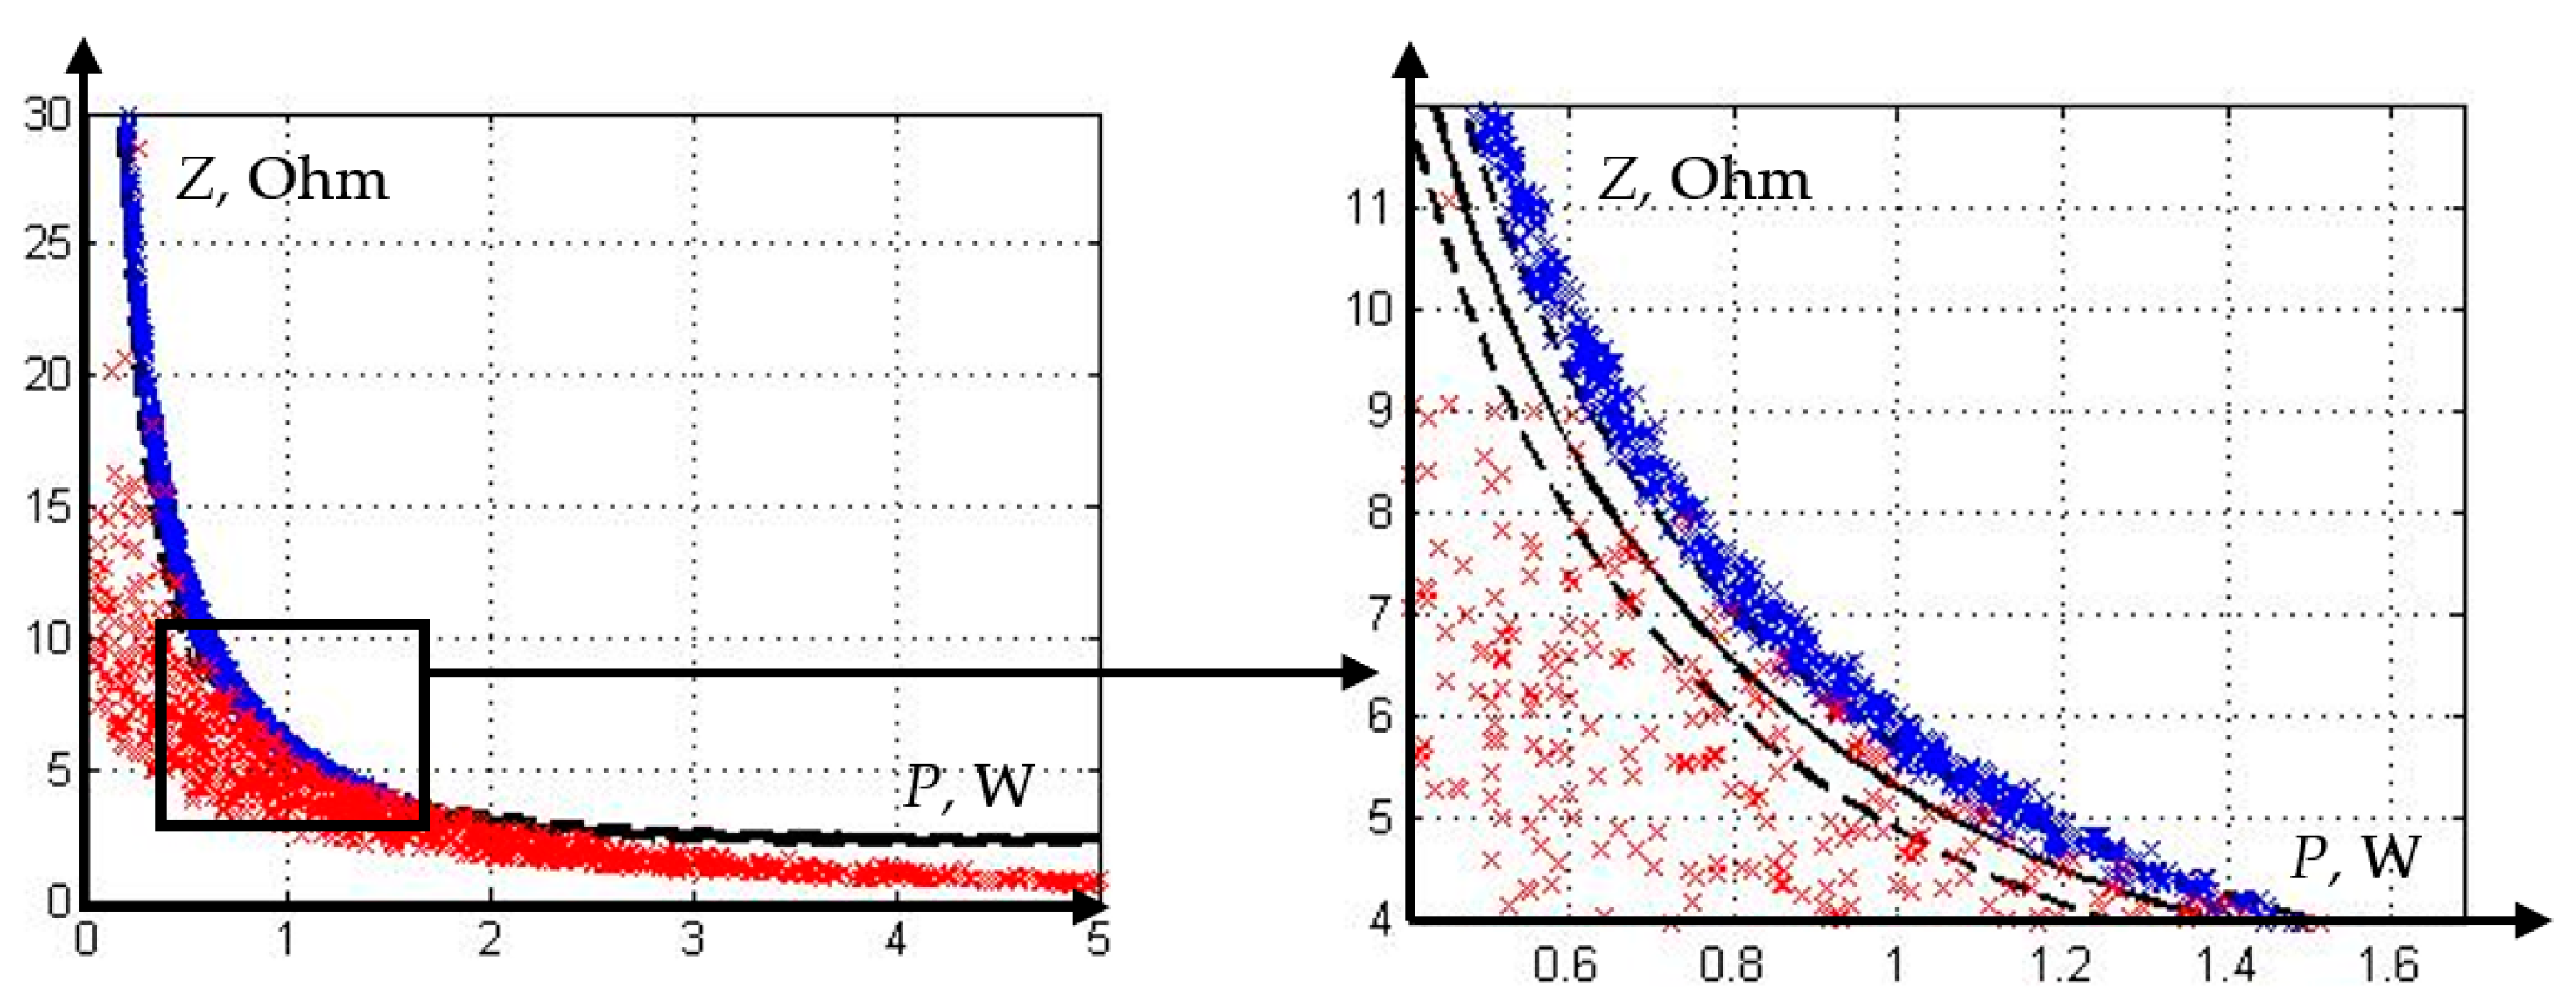
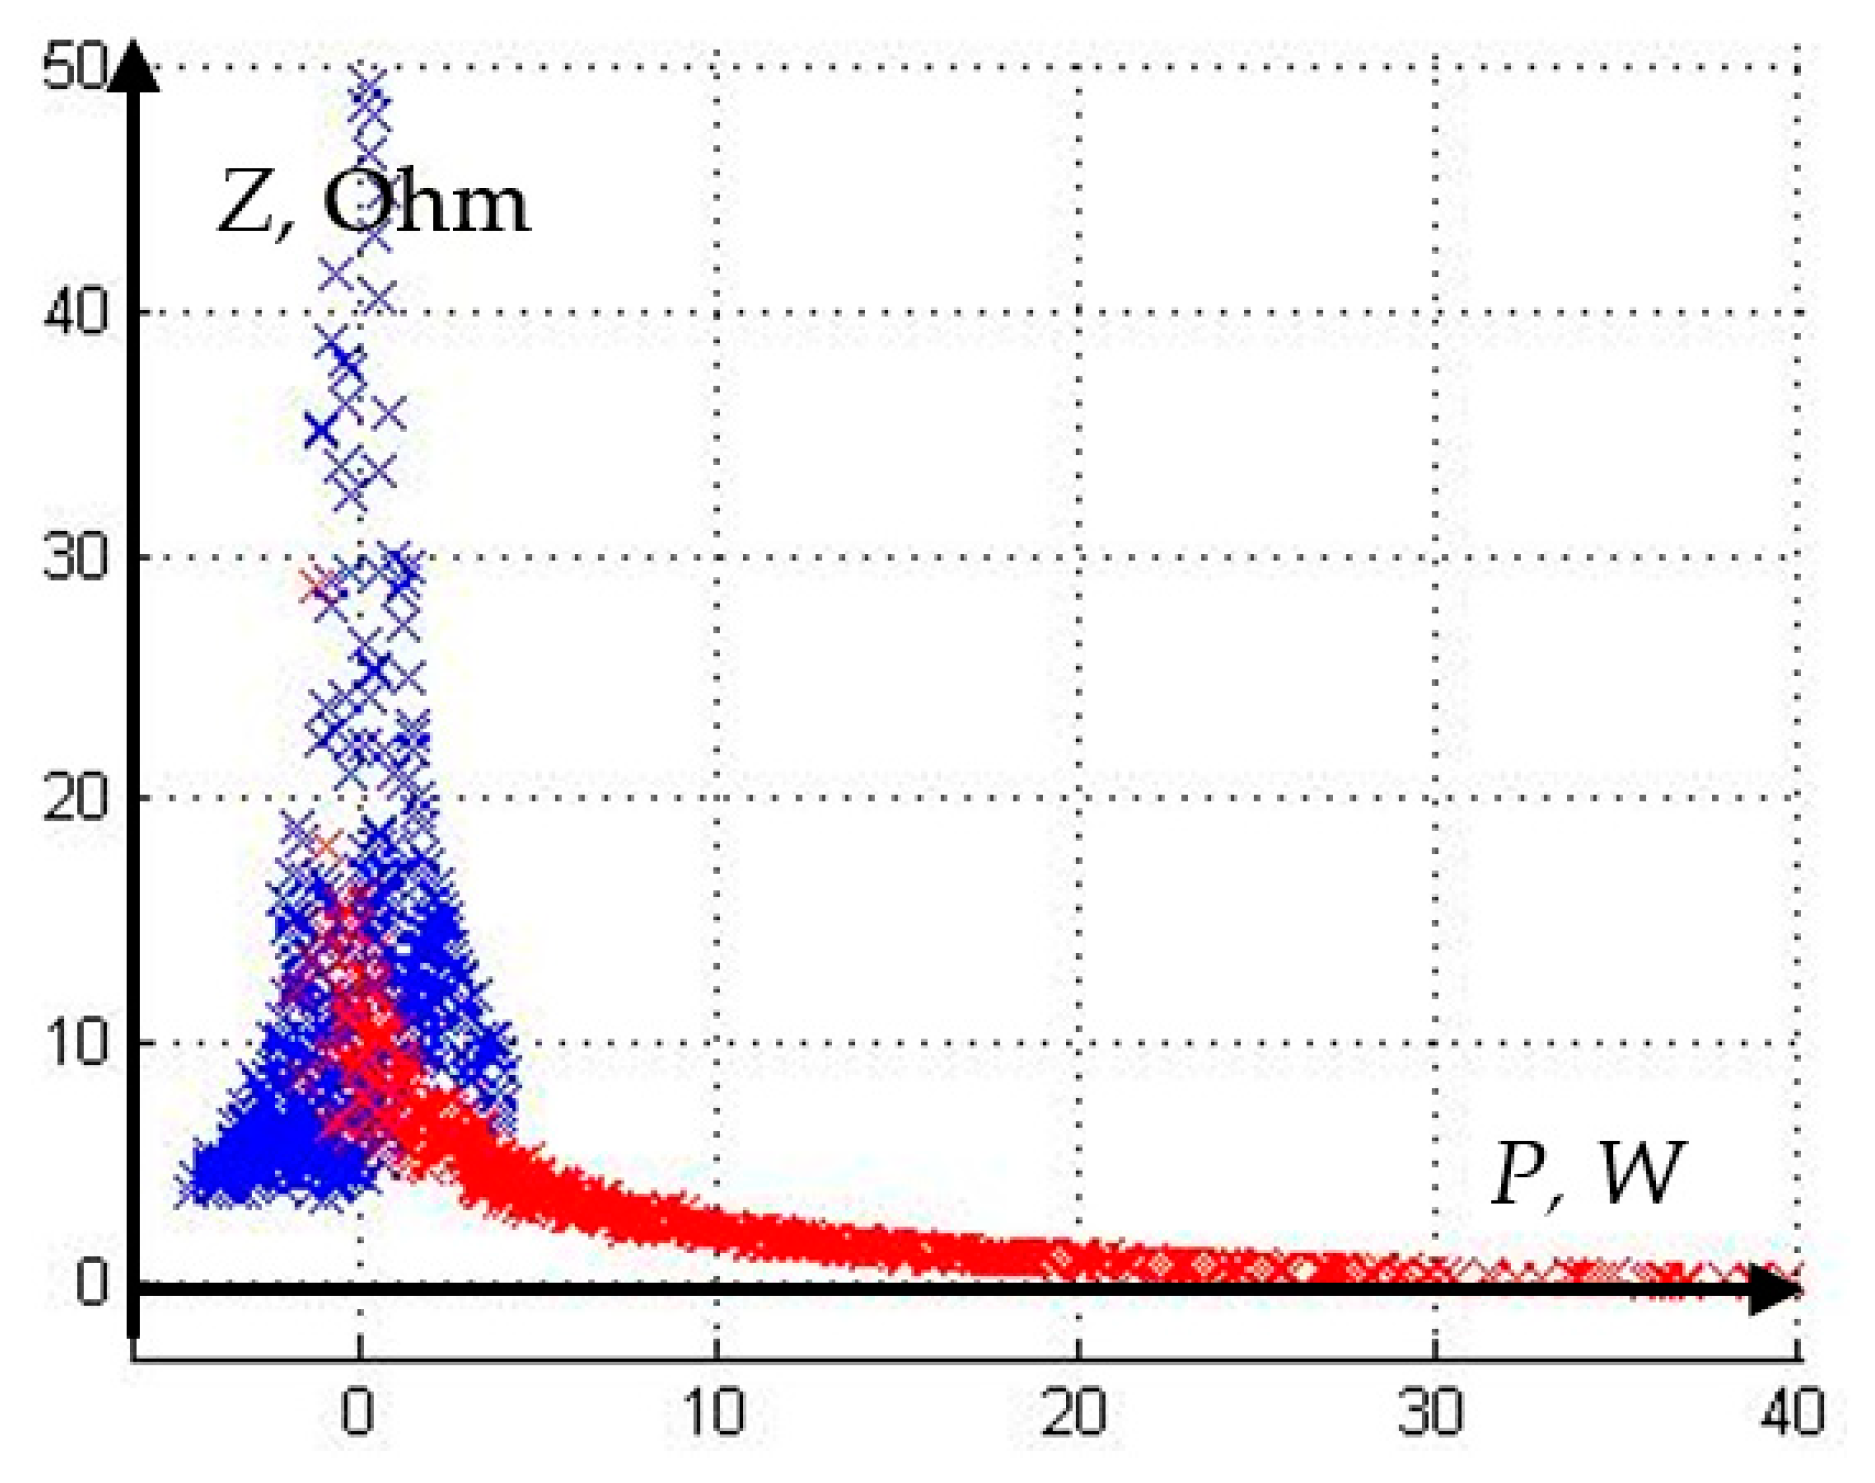
As an example, consider a training sample (
Figure 7), formed on the basis of the results of modes simulation of the network section shown in
Figure 2. As a feature space, we choose such quantities as active power (P), as well as the modulus of complex resistance (Z).
As a result of solving the optimization problem (4) for this sample, the vector
received the following value:
Therefore, the trigger condition is given by the following equation:
where
pset—the selected threshold.
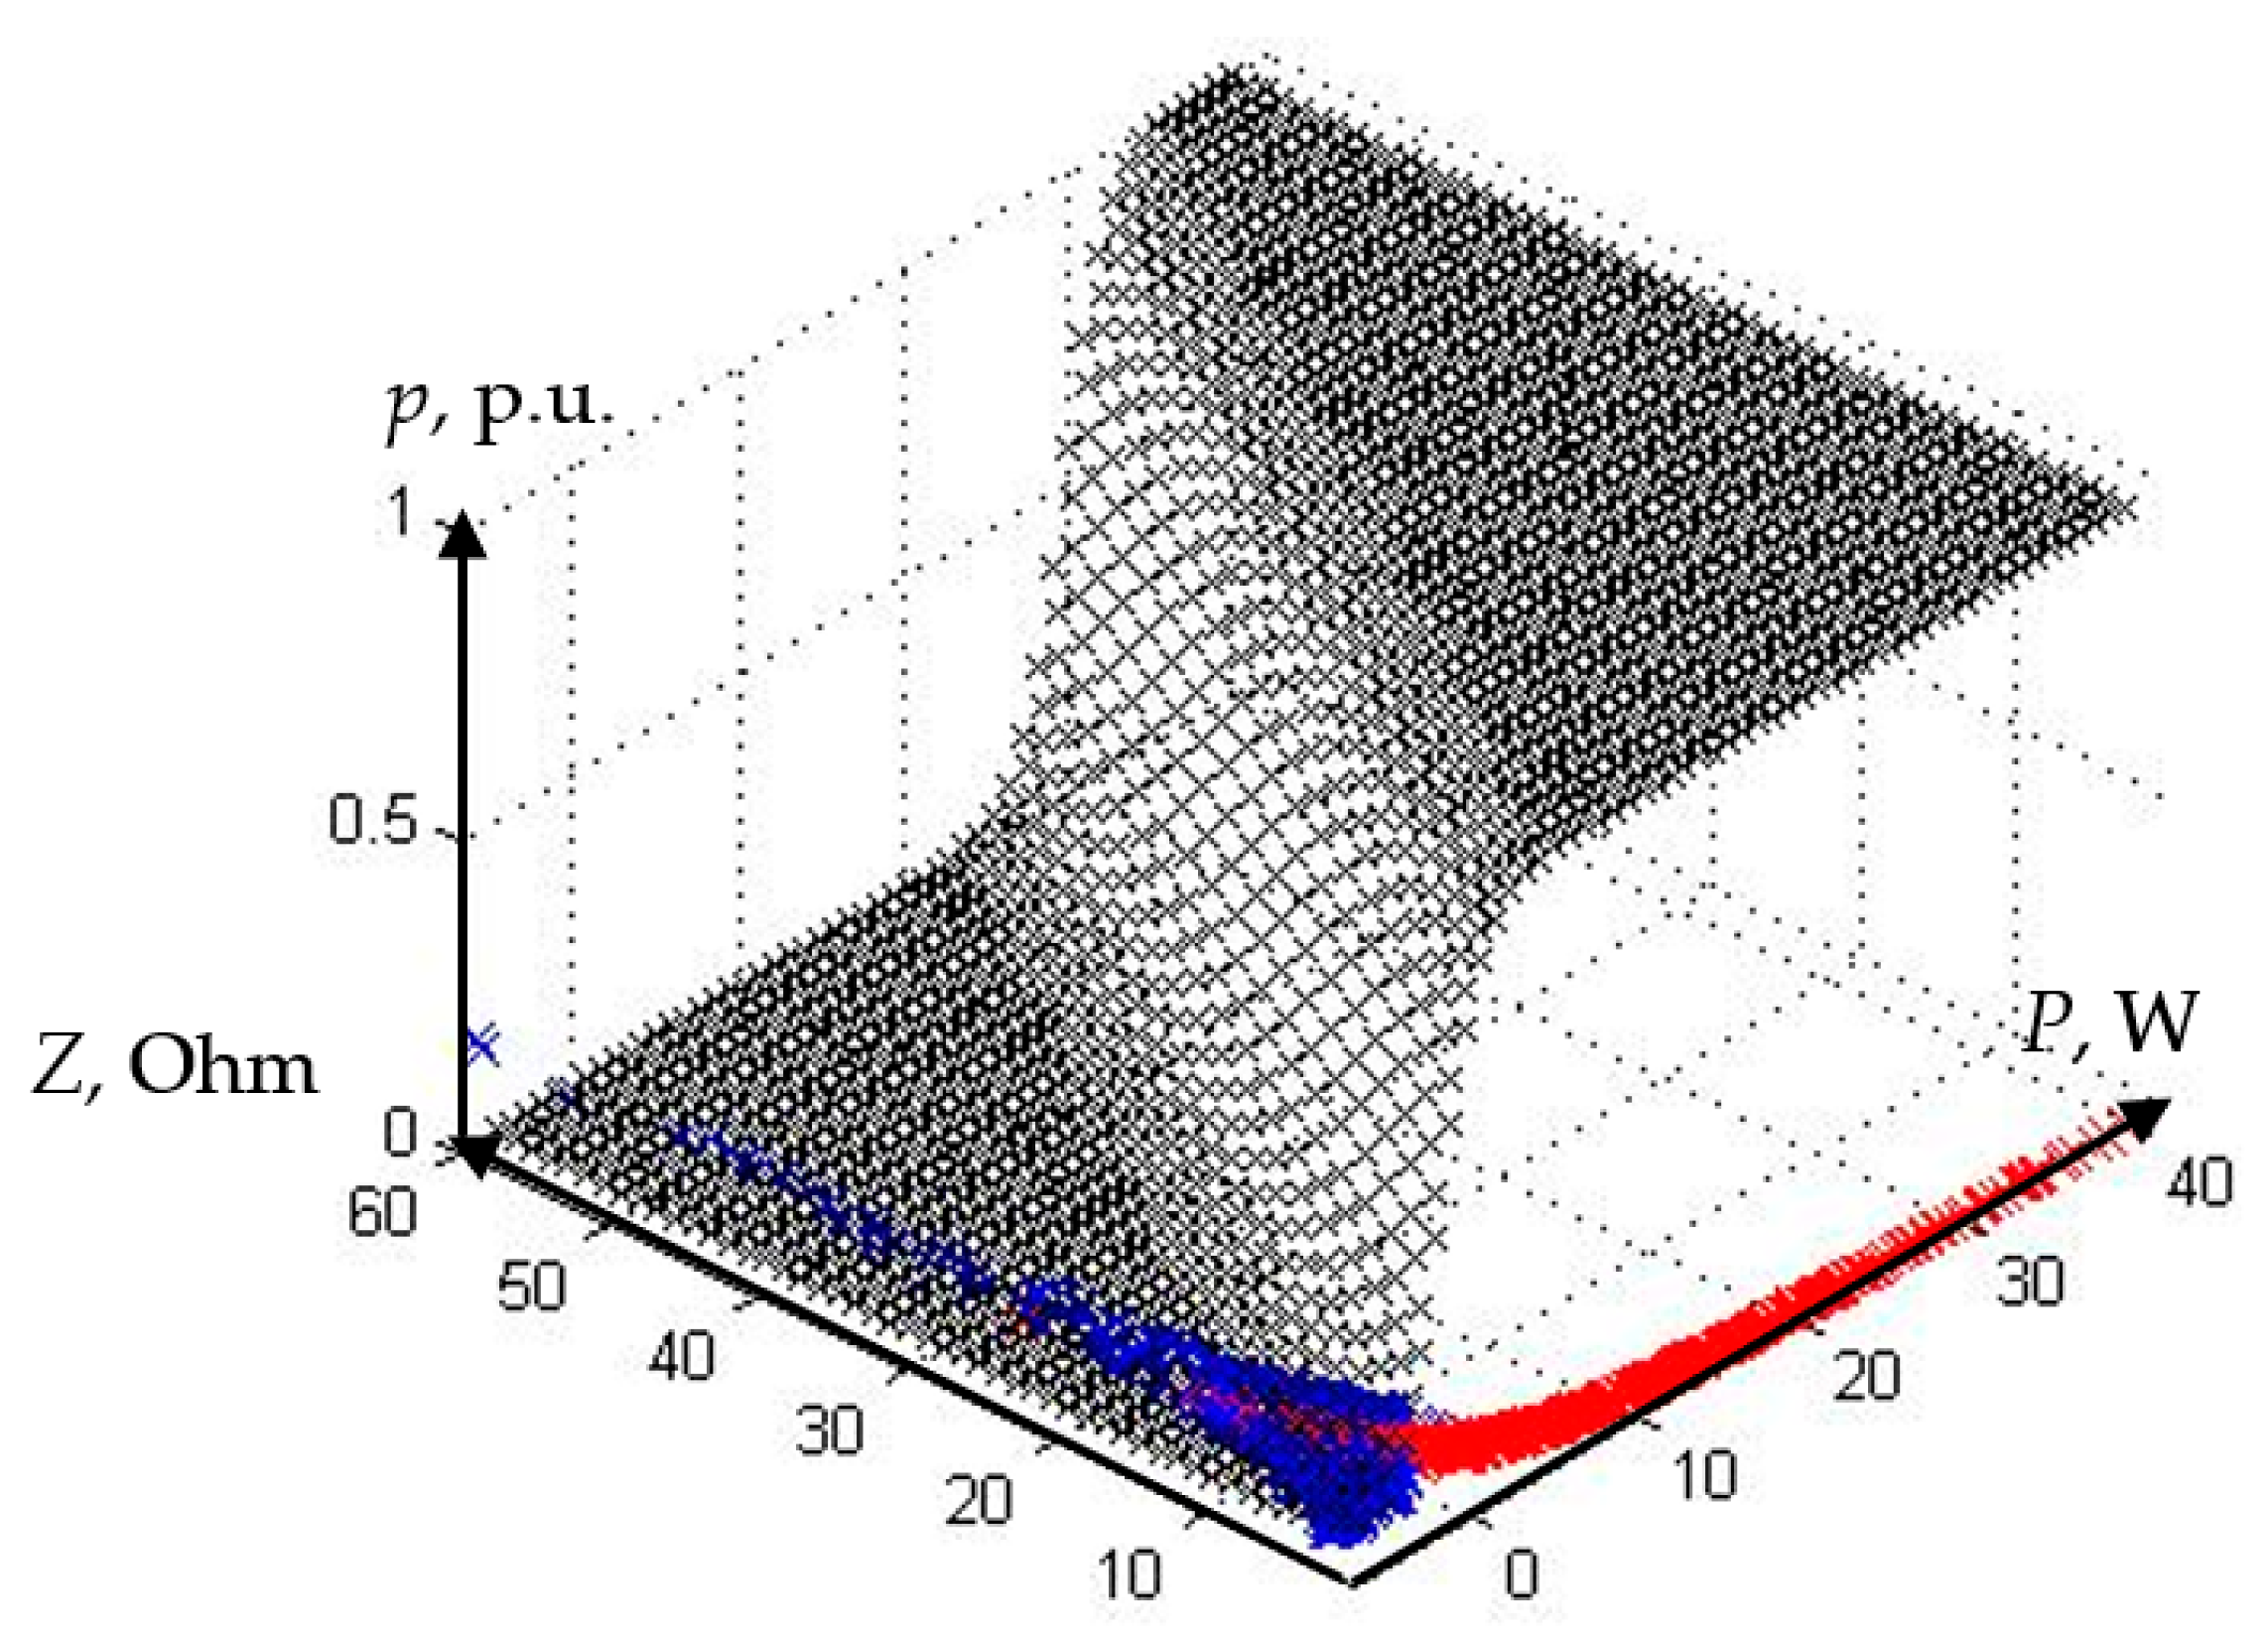
To illustrate the principle of operation of the logistic regression method, let us determine the value p in accordance with expression (6) for each point of the feature space.
The surface thus obtained is shown in
Figure 8.
Having chosen the setpoint by the value
p, we divide the feature space into the areas of triggering and non-triggering. For the presented two-dimensional example, the trigger boundary becomes a straight line.
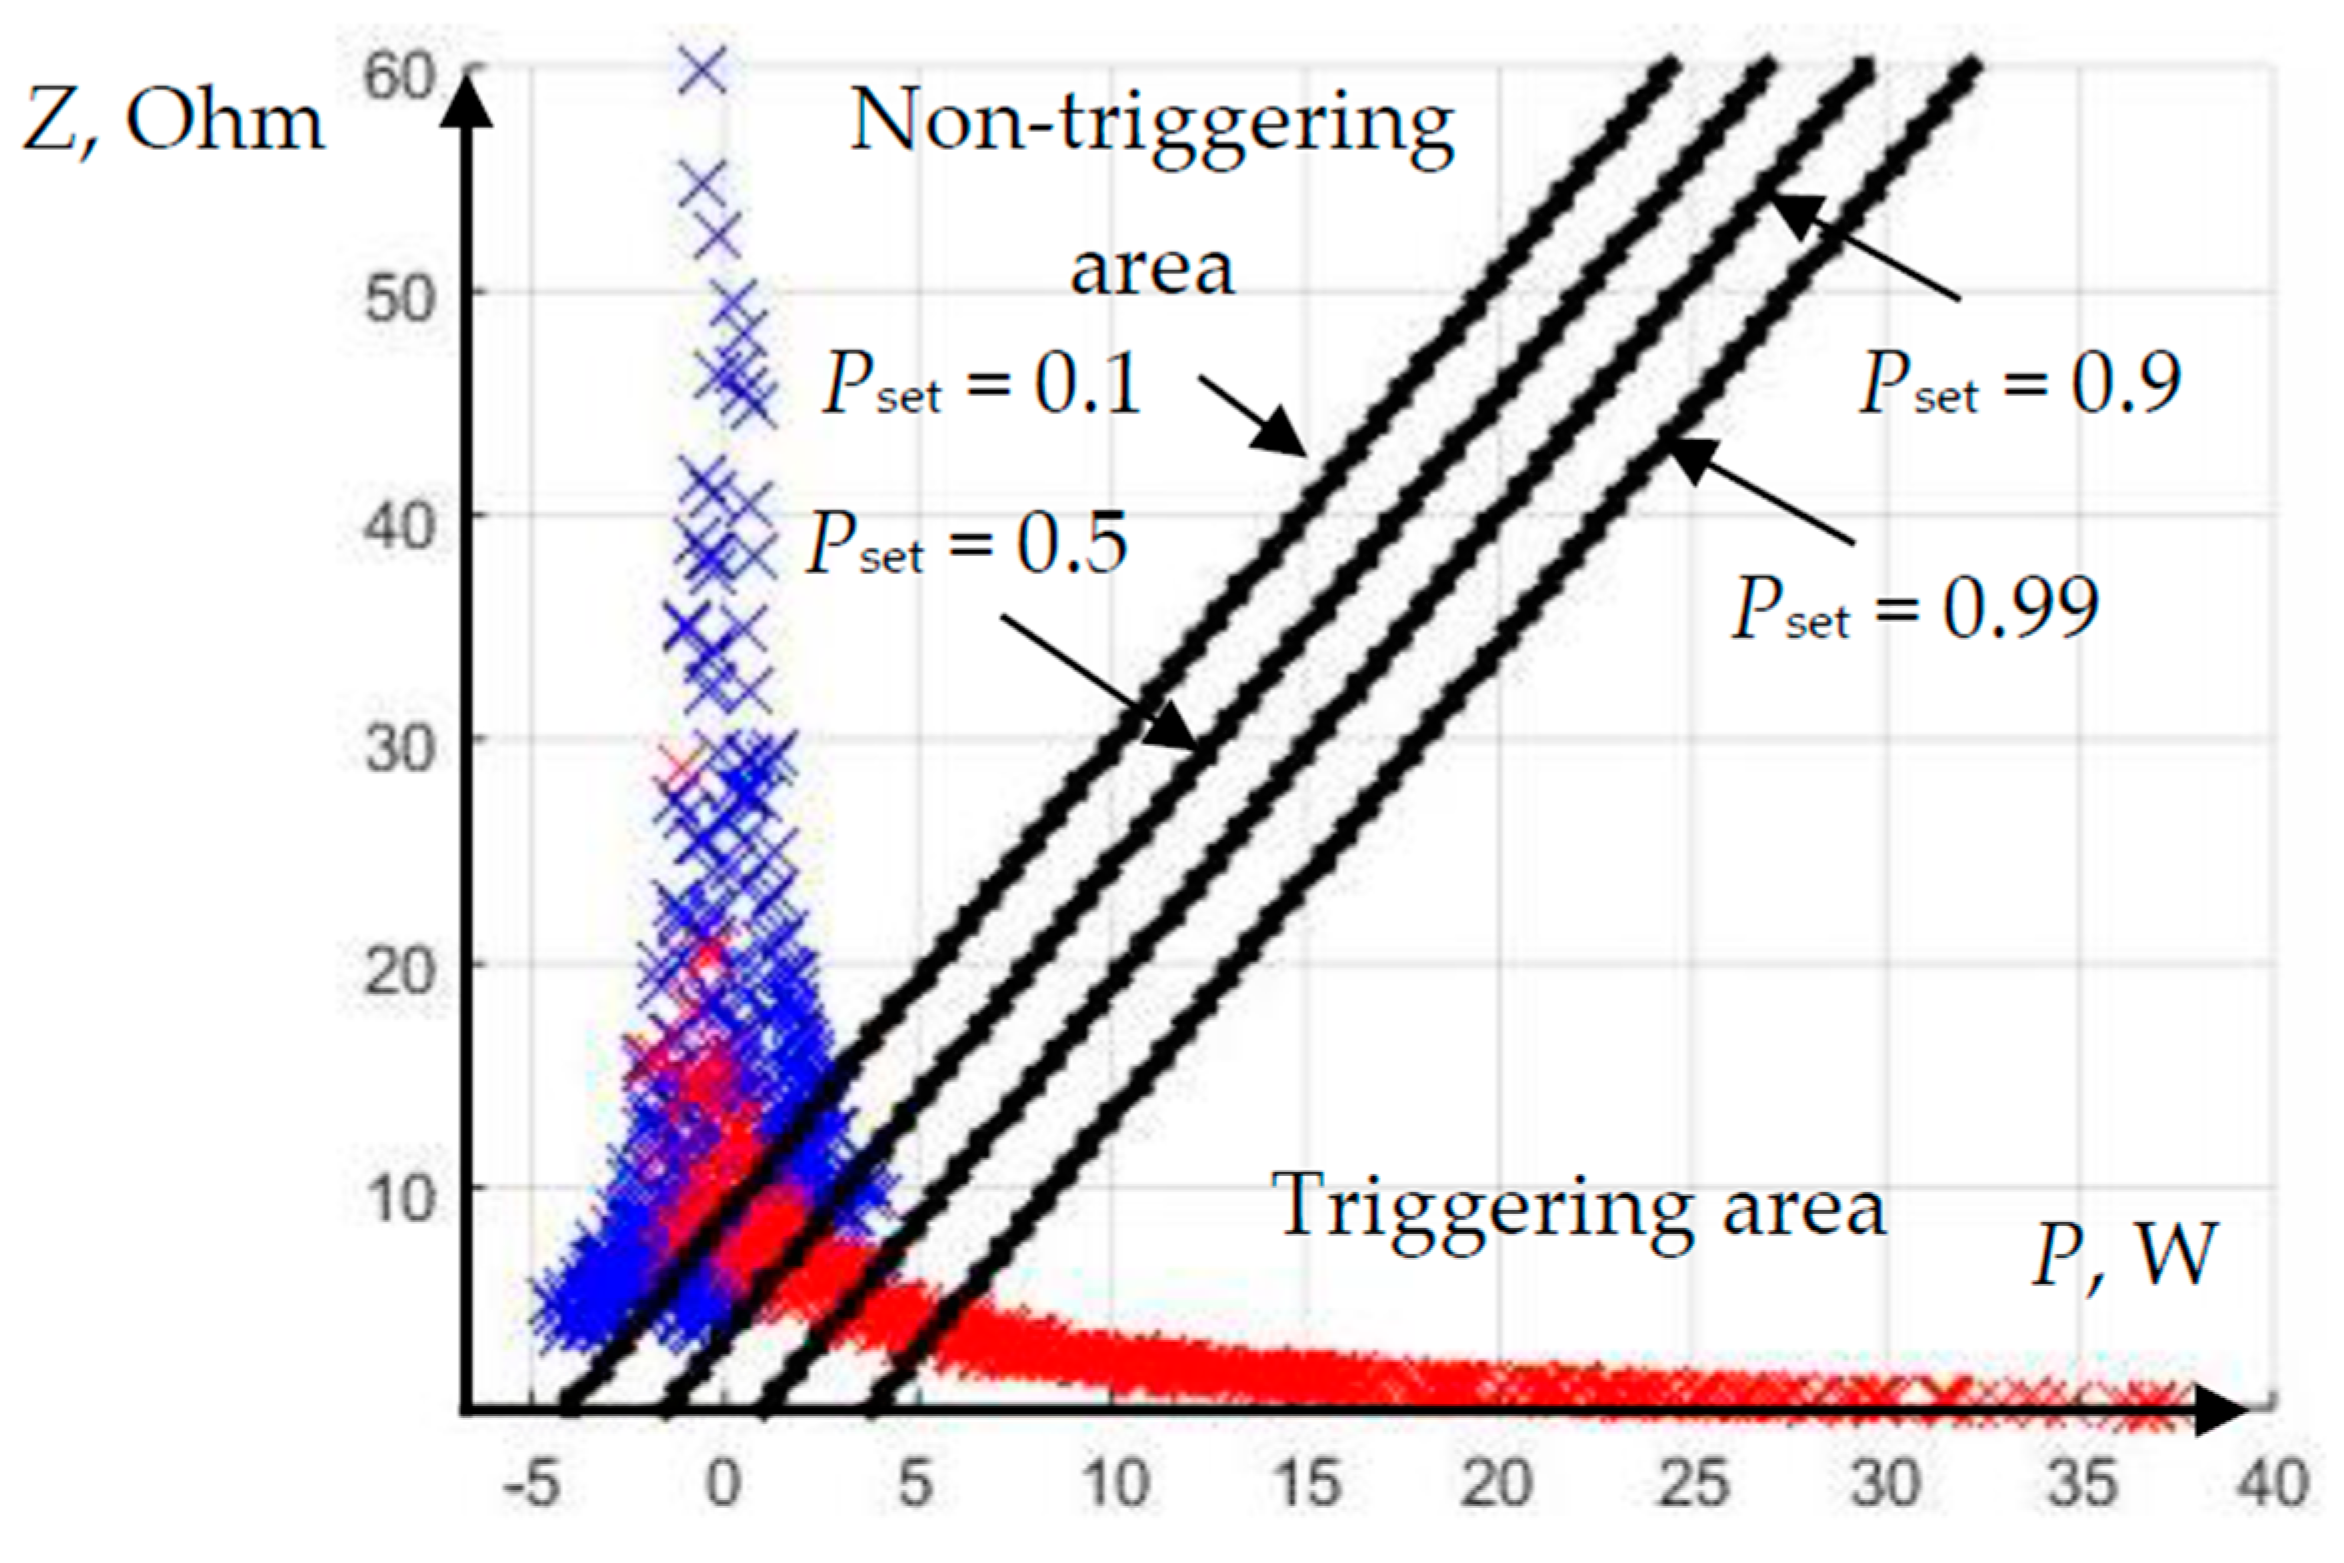
Figure 9 illustrates the trigger limits characteristic of several values of the response threshold
pset.
As can be seen from the
Figure 9, an increase in the triggering threshold leads to a decrease in the probability of false triggering of the protection, at the same time reducing the percentage of short circuits that fall into the triggering area. Let us display the nature of the observed phenomenon in the form of a receiver operating characteristic (ROC-curve) [
29], which evaluates the quality of the classifier (
Figure 10).
The curve (
Figure 10) shows that the algorithm makes it possible to achieve an unambiguous recognition of the emergency mode in approximately 60% with the complete absence of unnecessary operations. Shifting the threshold in the direction of increasing the protection sensitivity will increase the recognition up to 90%, but at the same time, the probability of false triggering will reach 10%. Further feeling is not justified, because a relatively small increase in the TPR parameter (True Positive Rate) corresponds to a significant increase in FPR parameter (False Positive Rate), which corresponds to a decrease in the slope of the ROC curve with respect to the horizontal axis.
There are various options for using the logical regression method, for example, the use of a non-linear modification of logical regression, which allows you to more effectively adapt to the training sample. The use of a rectifying space can significantly increase the classification accuracy.
Similar to other classification methods used in machine learning problems, when implementing the logistic regression method, the number of mode parameters combined into a feature space can vary in order to achieve the highest classification accuracy. The analysis of the conducted model experiments showed that the expansion of the feature space in combination with the introduction of the rectifying space technique made it possible to achieve a sufficiently high quality of recognition, commensurate with the results of the k-nearest neighbors method. The set of features corresponding to the maximum percentage of recognized short circuits, while guaranteeing the absence of false triggering, contains such quantities as phase current, reactive power, and complex resistance modulus. In the indicated space, it was possible to correctly classify 98% of the samples of the test sample, which is lower by 0.8% compared to the k-nearest neighbors method.
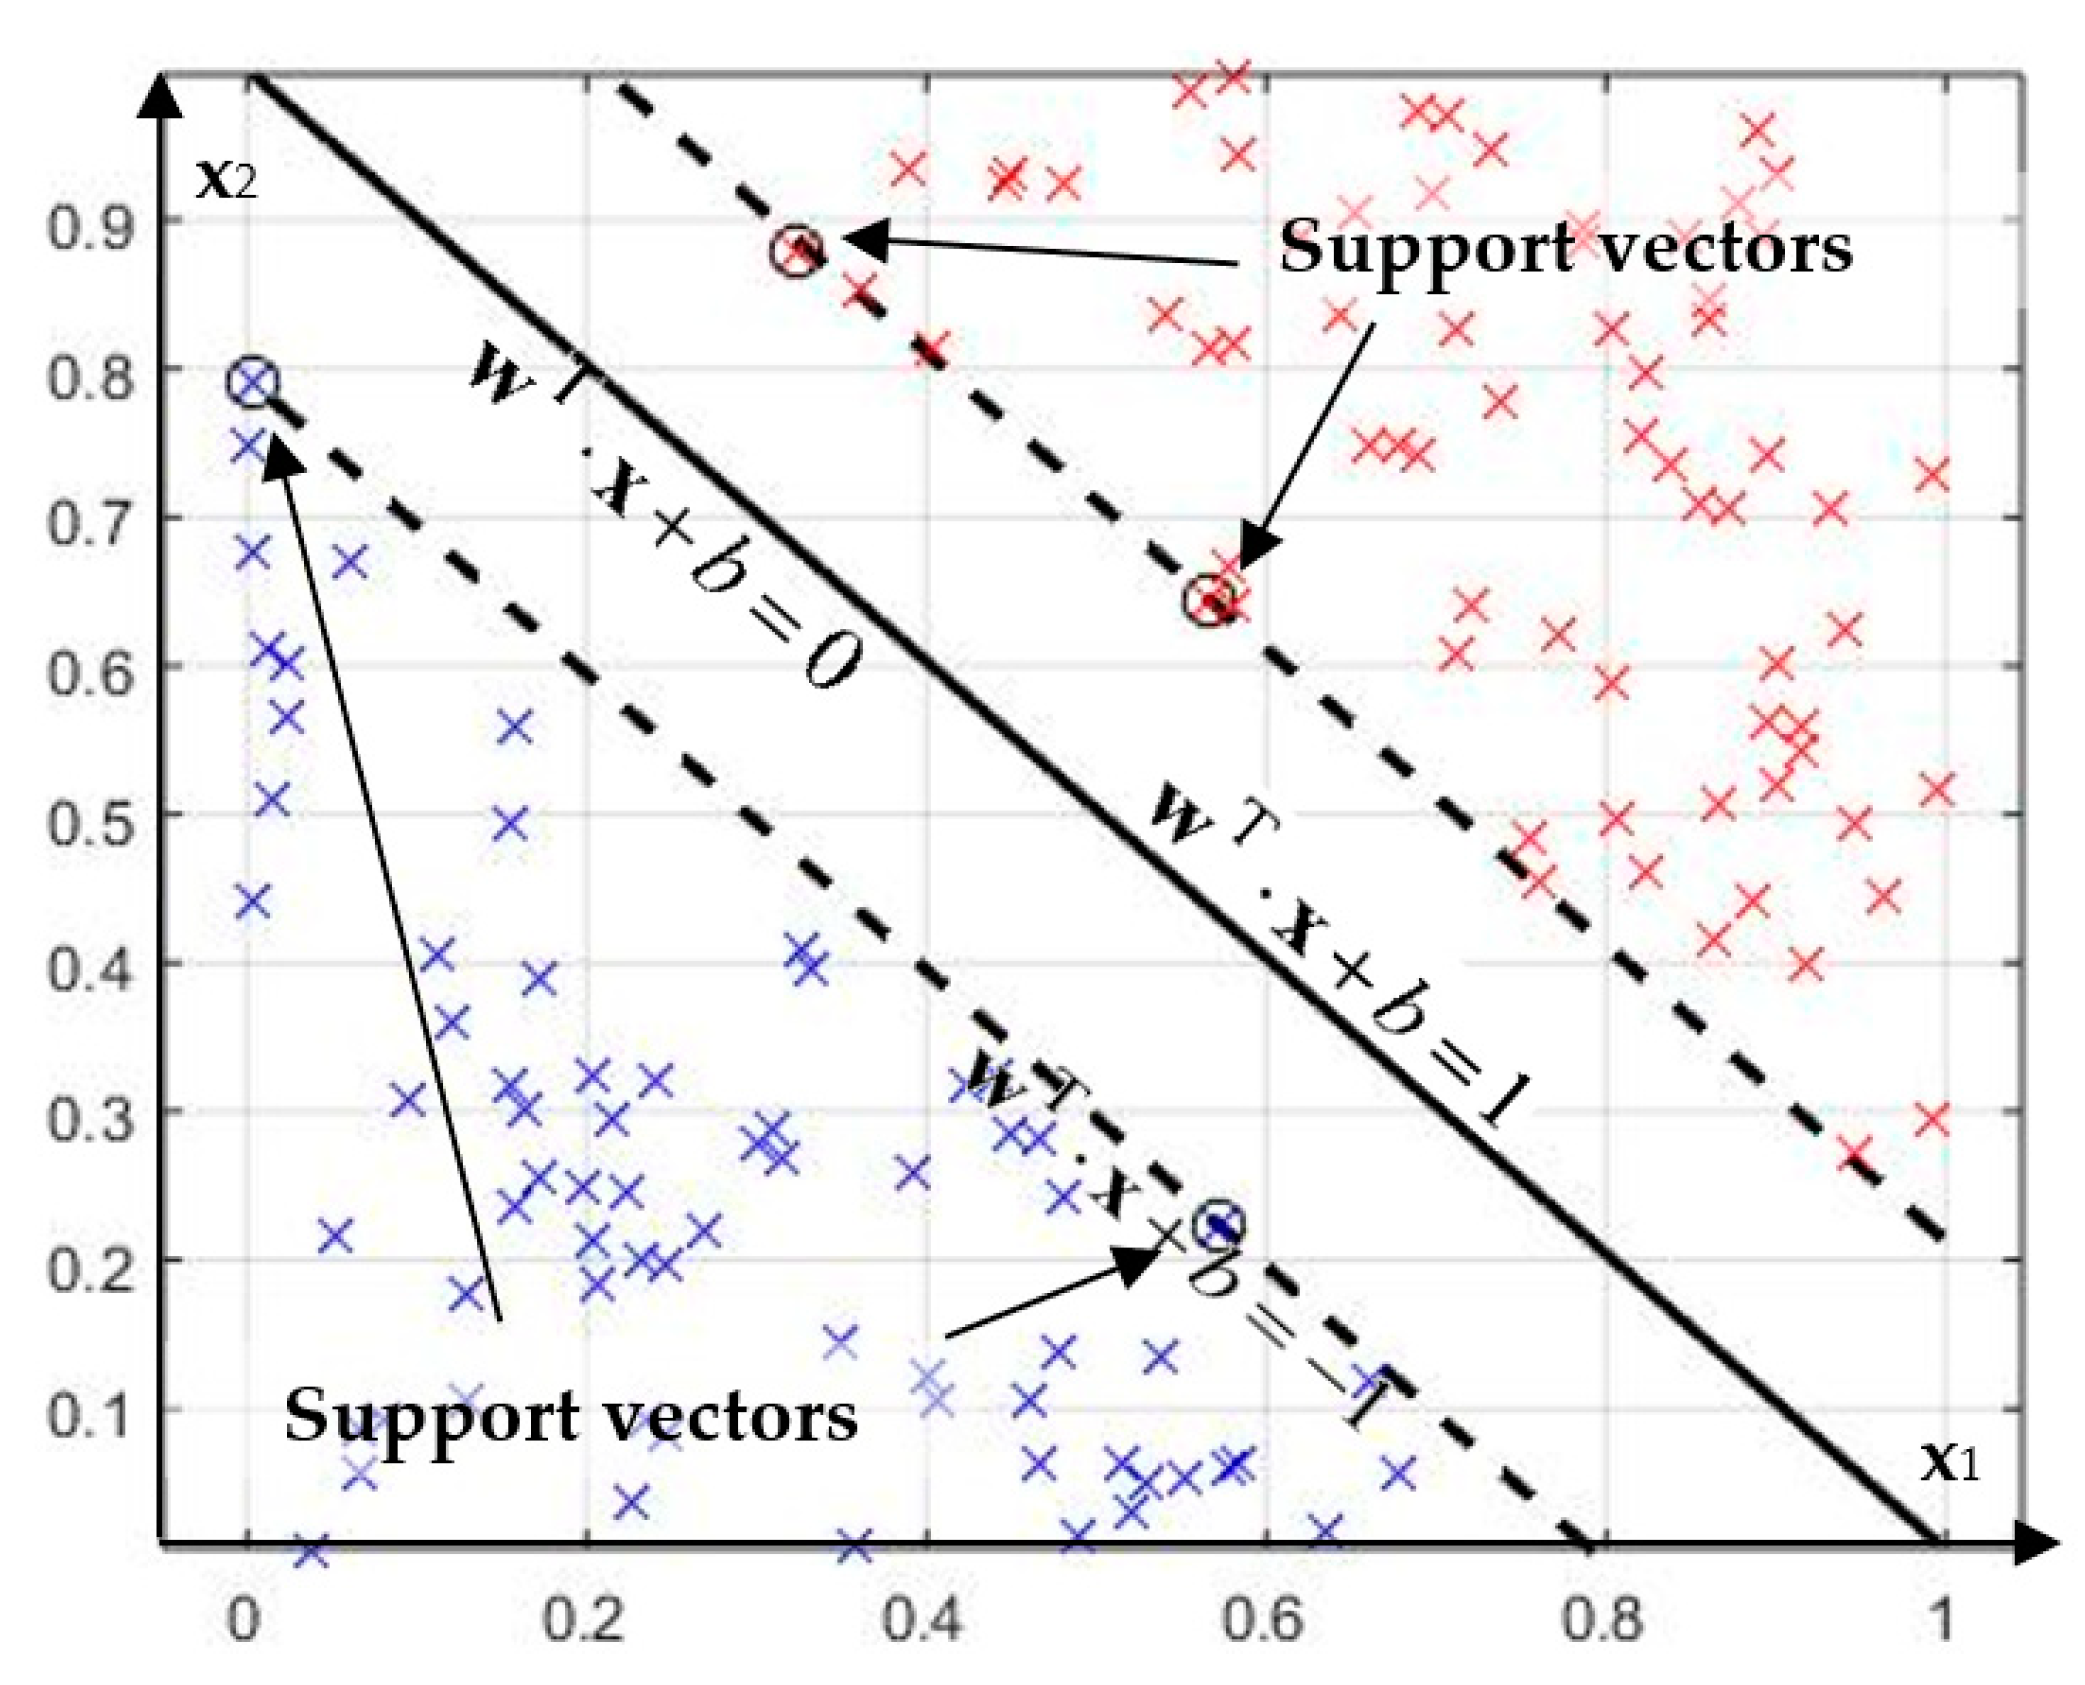
4.3. Support Vector Machine
One of the promising methods for linear data classification is the support vector machine (SVM). In its simplest form, the method is used to recognize two classes. Similar to the logistic regression method, the learning procedure for the implementation of relay protection involves drawing a hyperplane in the feature space, which will separate the elements of the training sample belonging to different classes, dividing the feature space into areas of triggering and non-triggering of the relay protection and protection devices. Thus, the procedure for classifying the current mode consists in determining which side of the separating hyperplane is the mapping of the given mode onto the selected feature space [
30].
Let there be a training sample
x1…x
N, consisting of
N vectors, in view of the
M-dimensional feature space. For each element of the training sample, there is a class label
y1…
yN such that
yi = 1 if the
i-th element belongs to the class α and
yi = −1 if the
i-th element belongs to the class β. Then, the hyperplane of the view
separates the classes if the following condition is met:
An example of a separating hyperplane is shown in
Figure 11. The distance between the border and the closest representatives of both classes forms a dividing strip, the width of which is called the “gap”. It is quite obvious that the most optimal separating hyperplane is the one that provides the maximum gap, provided condition (9) is met. It was proven [
30] that the equation of such a hyperplane can be obtained as a result of finding the conditional minimum of the system of expressions:
However, in most practical cases, the training sample is not linearly separable, that is, there is not a single hyperplane that satisfies the system of inequalities (11). In order for the SVM algorithm to be applied in this case, it must be modified and allow some misclassification of the training sample objects. A penalty is introduced for the total classification error, and the optimization problem takes the form:
where
—variable characterizing the classification error of the
i-th object of the training sample;
C—coefficient that sets the amount of the penalty for misclassification.
Coefficient C allows you to adjust what will be more important for the algorithm—maximizing the width of the separating strip or minimizing the total classification error.
In practice, instead of the direct SVM task described by expression (11), the so-called dual task is solved, which is similar to the original one in terms of the final result, however, it can be solved using faster iterative methods. When solving the dual SVM task, the optimization takes place in terms of the variables λ
1…λ
n (expression (12)), that is, in terms of Lagrange multipliers. The dual SVM task for a linearly inseparable sample is derived from the direct task [
25] and written as follows:
The quadratic programming task (12) can be solved using one of the well-known methods (for example, [
31]).
Having obtained the optimal Lagrange multipliers λ
1…λ
n as a result of solving (12), we can restore the equation of the separating hyperplane:
where
s—the index of the vector for which 0 < λ
s <
C.
The classification of an arbitrary object using the support vector machine method consists in assessing the measure of its belonging to a class according to expression (14) and comparing the obtained value with the selected setting:
Note that to obtain the result of expression (14), it is sufficient to sum only over those i for which λi ≠0, that is, only over support vectors, the number of which is much less than the total size of the training sample.
Using the example of protecting a section of an electrical network (
Figure 2), we analyze the efficiency of emergency mode recognition using the support vector machine [
32,
33]. Consider the efficiency of the method for solving the task of constructing the relay protection algorithm (
Figure 2). We implement the training of the support vector machine with a quadratic kernel function in a two-dimensional feature space formed by active power (
P) and impedance (
Z). The resulting response limit is shown in
Figure 12.
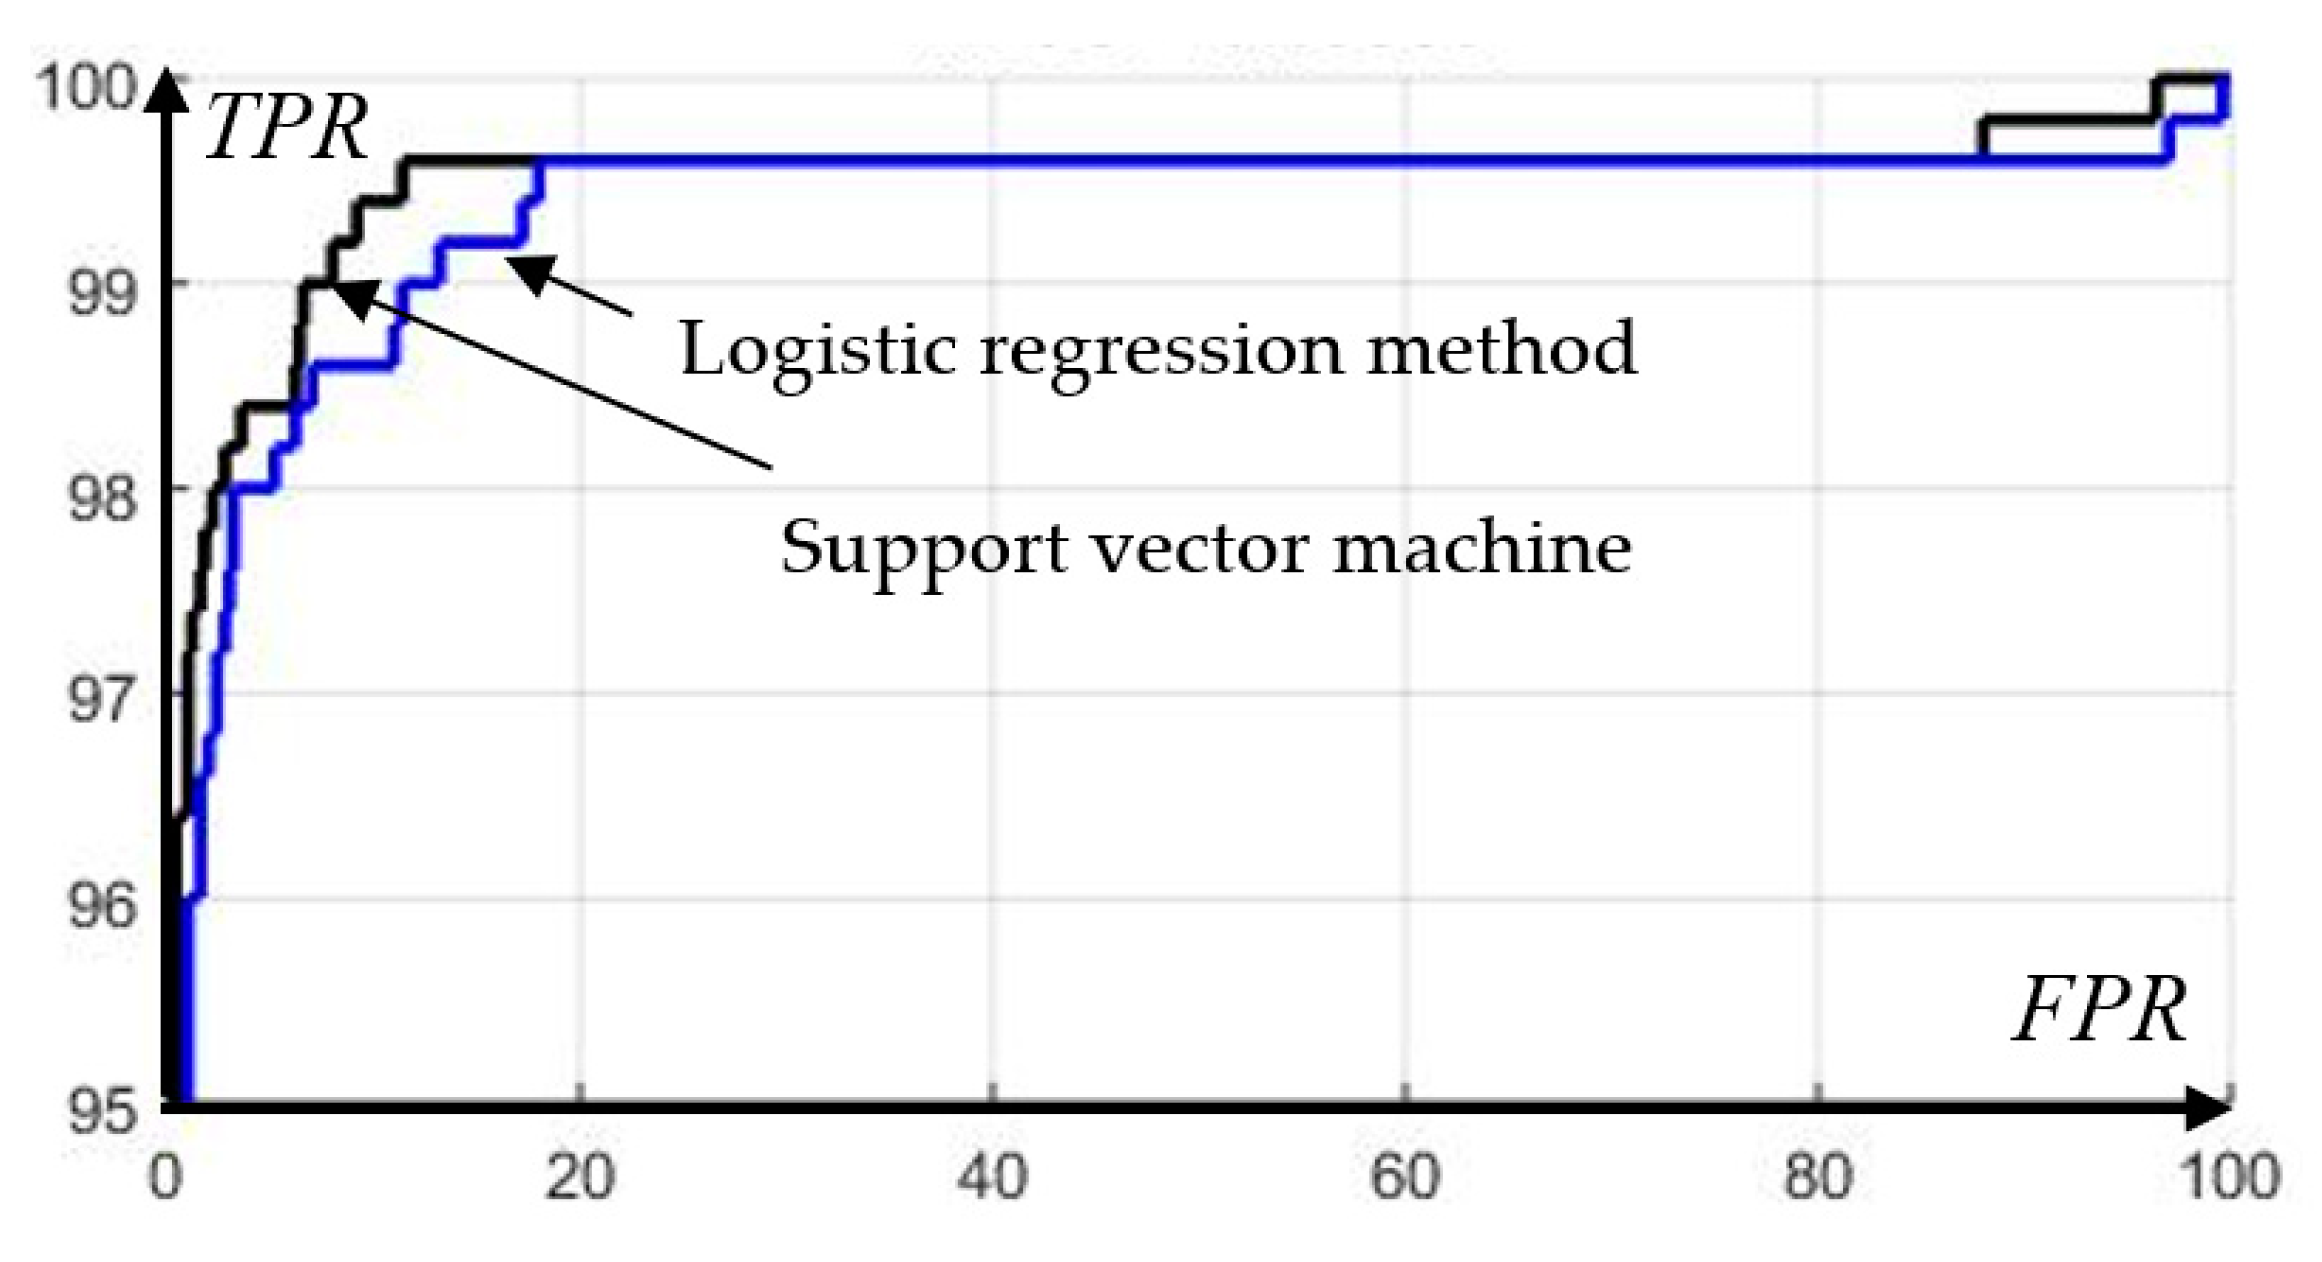
Let us evaluate the performance characteristics of the resulting algorithm for various values of the response threshold
pset. Let us display the results in the form of the operating characteristic of the receiver (
Figure 13), as well as a similar characteristic obtained as a result of applying the logistic regression method on the accepted feature space.
Analysis of
Figure 13 shows that in a two-dimensional feature space (
P-Z), the support vector machine provides a greater recognition ability in relation to failure modes in comparison with the logistic regression method. Moreover, a similar comparative analysis with the k-nearest neighbors method for various combinations of features showed that the support vector machine allows achieving zero recognition error with a feature space dimension of 4 or more. Thus, we can conclude that the support vector machine is superior to other considered methods in relation to the problem of classifying the modes of a section of an electrical network.
5. Improving the Technical Excellence of Relay Protection and Automation Devices through the Introduction of Training Modules
An alternative option for using machine learning methods in relay protection and automation is to create auxiliary triggering elements that work in conjunction with traditional types of relay protection and increase their sensitivity. Let us consider an example of using machine learning to improve the efficiency of a distance protection device (DPD) using the example of an electrical network shown in
Figure 14.
Let distance protection be used to protect the line ω1. In accordance with the requirements for relay protection, the second stage of distance protection should operate in case of short circuits along the entire length of the line ω1, as well as partially reserve the parallel line ω2, the adjacent line ω3, as well as the transformer T1.
At the same time, Ref. [
31] imposes the following restrictions on the second stage resistance setting (
Table 2).
Let us demonstrate on the complex plane of the DP of the line ω
1 a set of short-circuit modes on adjacent elements, and select their part, in which the operation of the second stage ω
1 is unacceptable according to the detuning conditions (
Figure 15).
Due to the fact that the line ω3 has a relatively short length, after coordination with the first stage of its distance protection, the possibility of reserving a significant part of the parallel line ω2 and the transformer T1 by the second stage ω1 is lost. Starting the second stage with an interphase short circuit on the primary winding of the transformer is possible only with a probability of 42.7%, and with a short circuit to ω2 with a probability of 5.8%. Thus, in the event of failure of the main protections, most of the short circuits on the parallel line and in the transformer can be disabled only by the third stage of distance protection ω1. Since the third stage has a longer time delay, the protected elements are more likely to be seriously damaged by the long-term fault current flow.
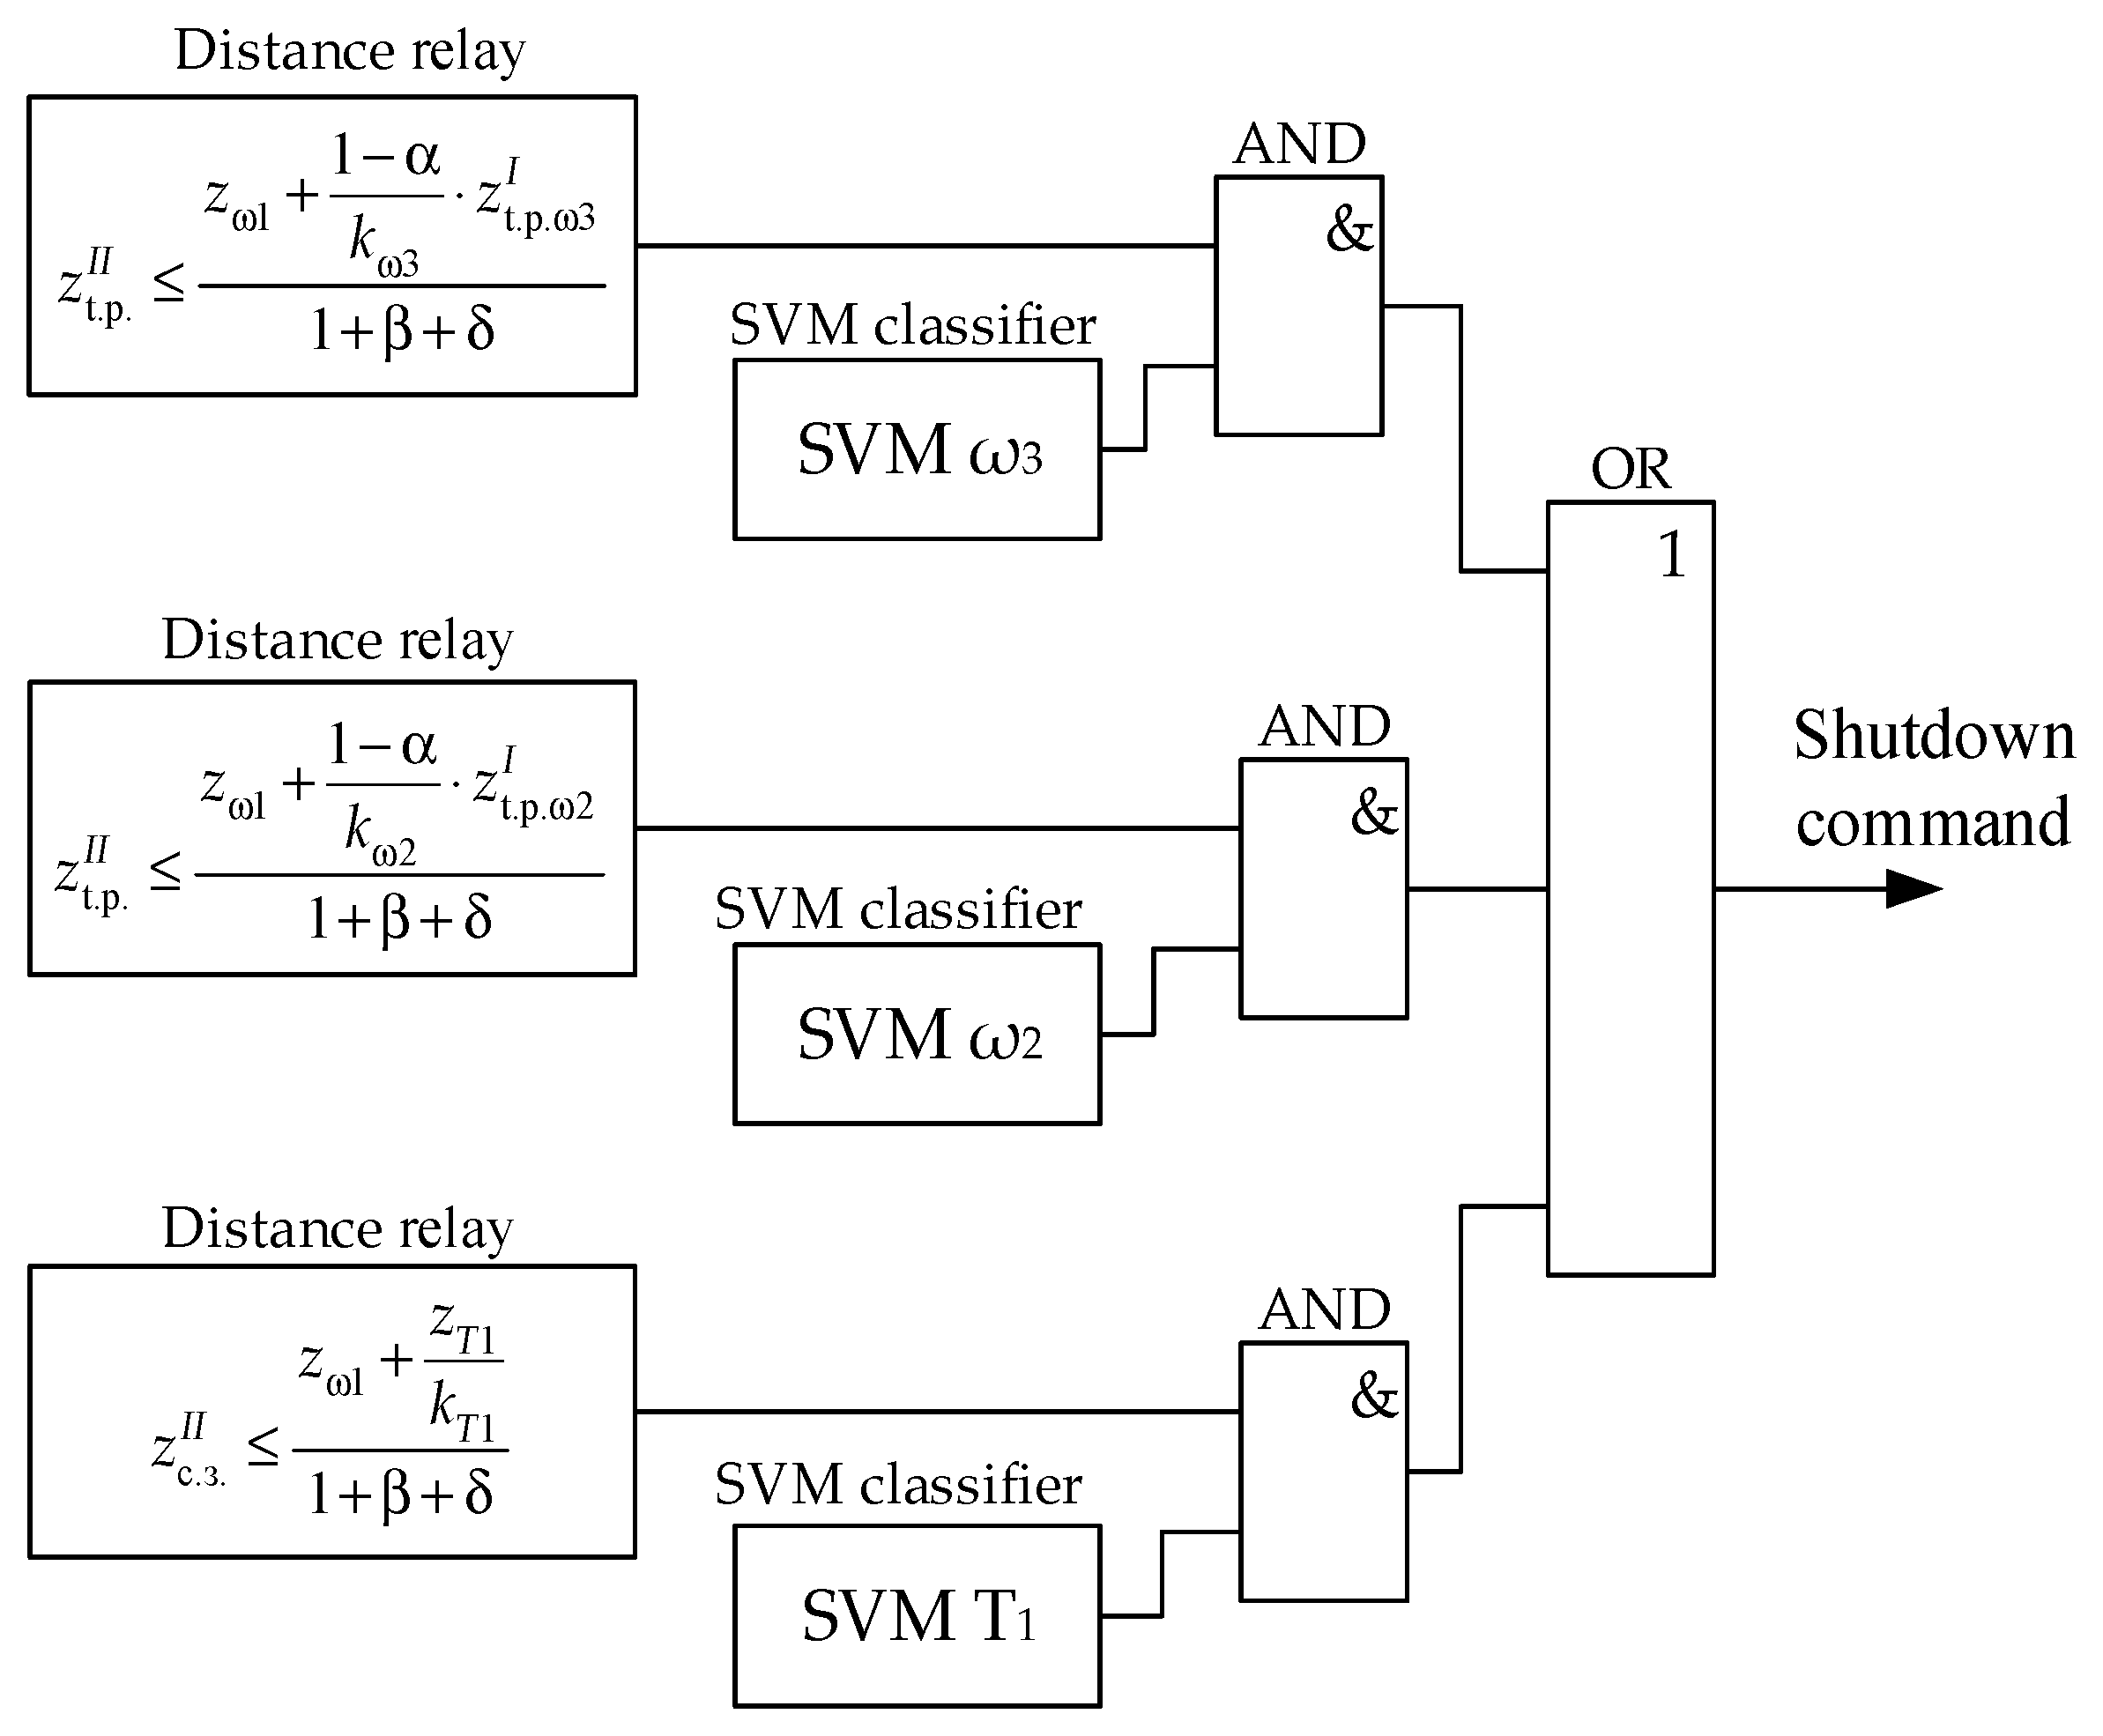
It is possible to expand the coverage area of the protection in question through the use of special triggering elements that can indicate a damaged section of the network. In the presence of such selector algorithms, the second stage ω1, parameterized in accordance to conditions (15)–(17), can be replaced by three stages independent of each other, having the same time delay, and the setting of each of them will be set only according to one of the conditions (15)–(17).
By combining the DP stages with faulty section selectors, as shown in
Figure 16, it is possible to achieve a greater probability of starting the protection during a short circuit in the reserve zone, with the complete elimination of the possibility of non-selective triggering.
Thus, for a more efficient redundancy of DP algorithms with the required speed, it is advisable to use specialized algorithms of triggering elements for classifying emergency modes. We use the support vector machine for this.
To implement the learning process of the multi-parameter relay protection algorithm [
20,
21], we single out the list of modes that the device must track (α-modes), as well as the list of alternative modes in which its operation should be excluded (β-modes). The α-modes are various types of short circuits in the protection zone, while the β-modes are normal modes, as well as short circuits outside the protection zone, the operation of which can lead to non-selective triggering.
Let us form training samples for the auxiliary triggering elements being developed. Obviously, for the “SVM T
1” classifier, designed to detect faults inside a power transformer (
Figure 14), the data obtained as a result of modeling short circuits on T
1 should be used as α-modes. The set of β-modes should be formed by the following modes:
− short circuit behind the transformer T1;
− short circuit on a part of the line ω2, outside the coverage area of the I-st stage of its DP;
− short circuit on a part of the line ω3, outside the coverage area of the I-st stage of its DP;
− normal modes.
Note that the behavior of the “SVM T1“classifier in modes not included in the training sample is not defined. For example, it is not excluded that this element will operate during a short circuit at the beginning of the line ω3; however, such operation will not lead to non-selective triggering of the circuit breaker, and therefore it is permissible.
Arguing similarly, we define α and β modes for the triggering elements “SVM ω
2“ and “SVM ω
3“ and summarize them in
Table 3.
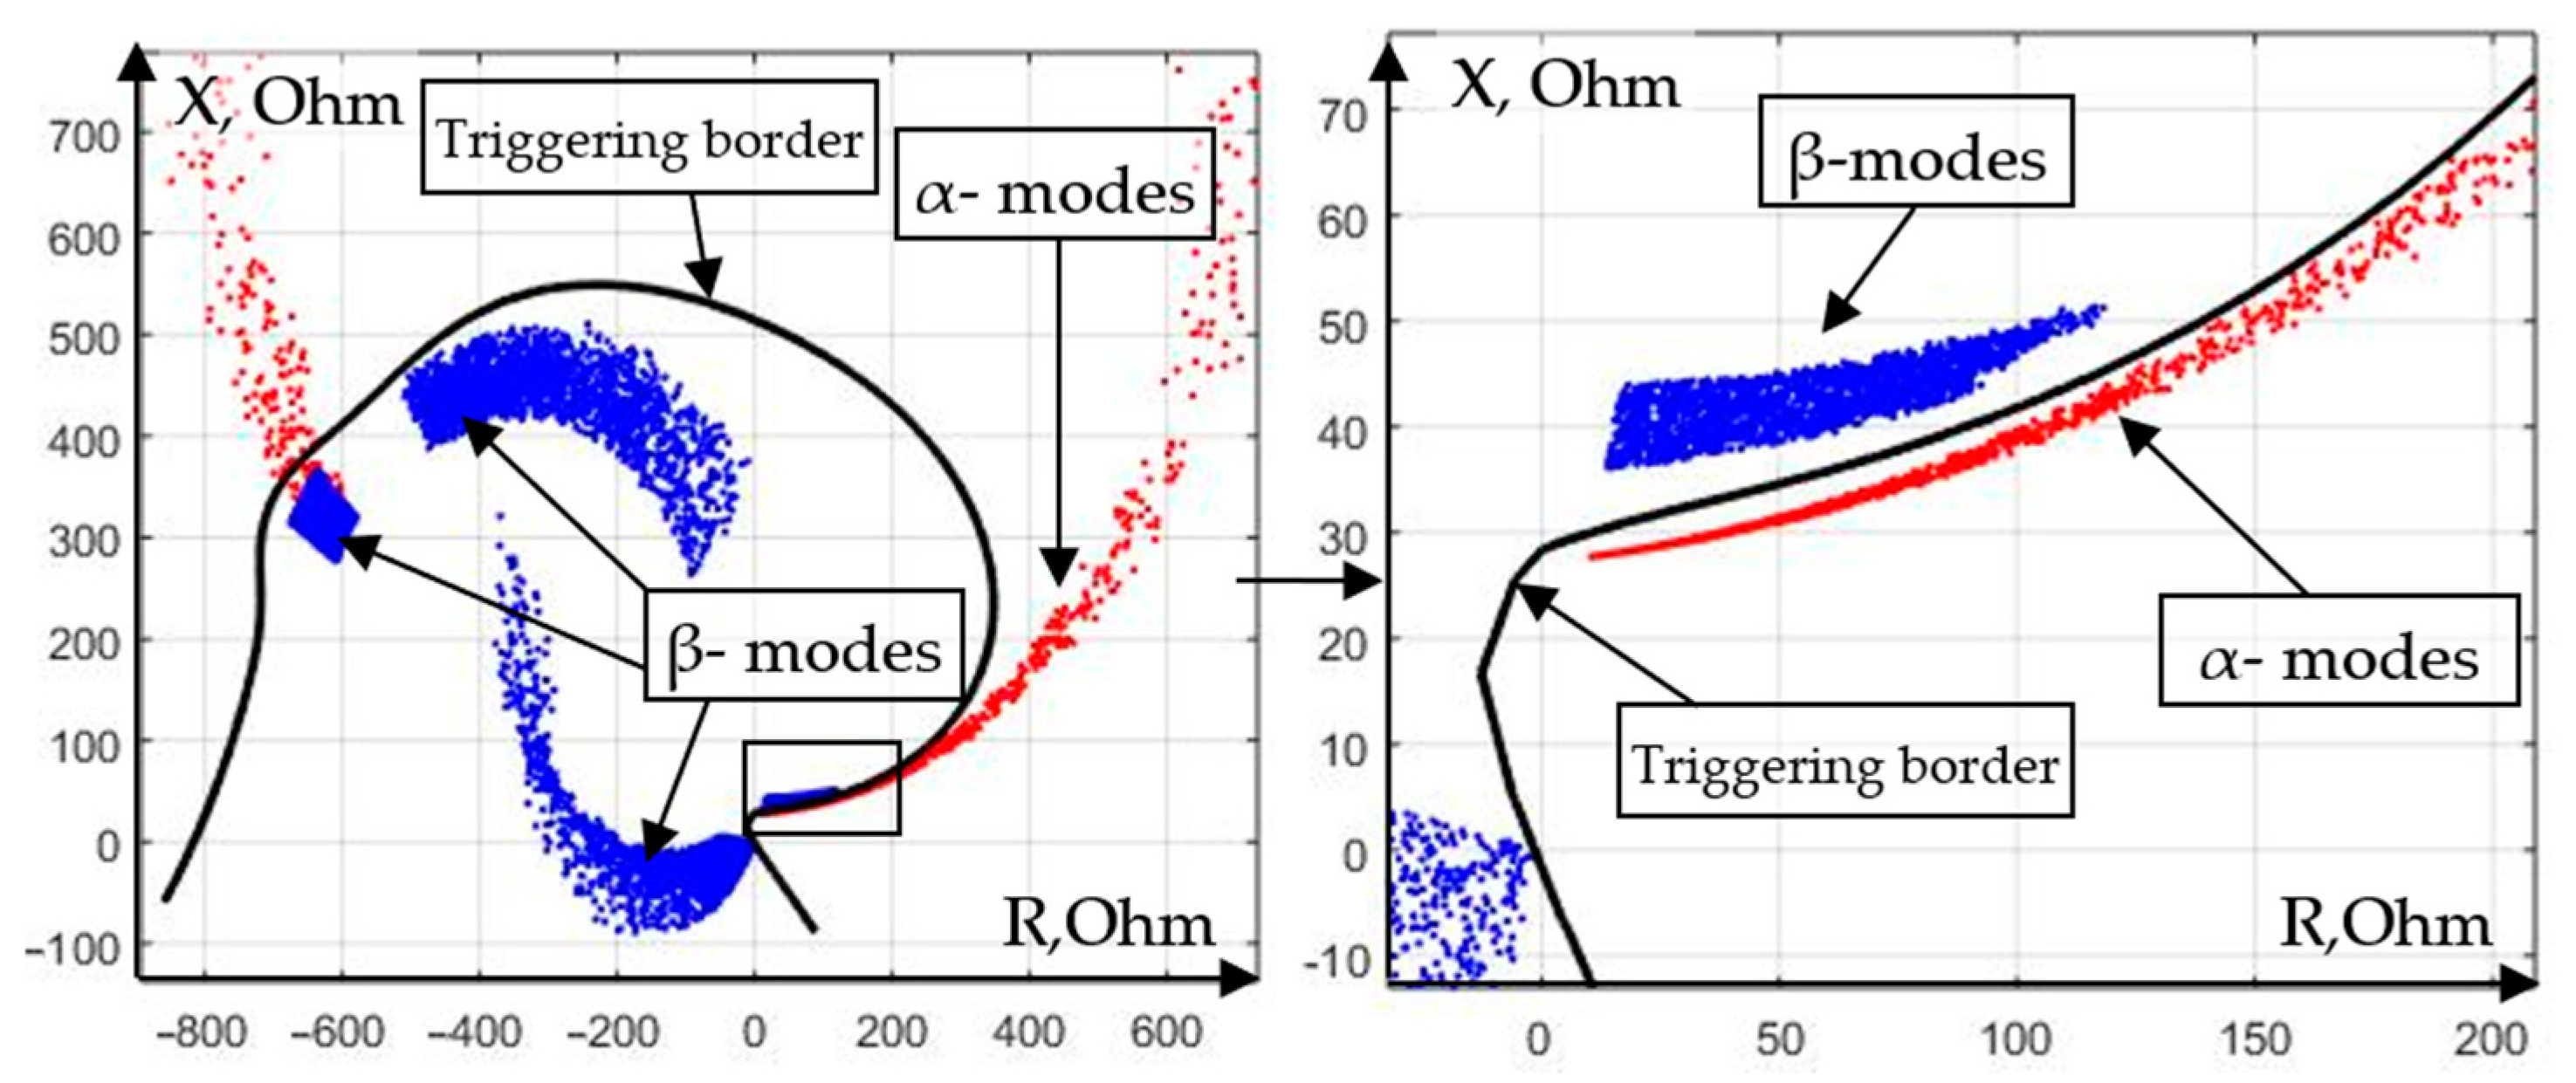
Let us consider the display of α- and β-modes of the triggering element “SVM T
1“ in the feature space formed by the complex plane of the distance element.
Figure 17 shows that in the selected feature space, the data are linearly inseparable, therefore, classification by the support vector machine is only possible using the kernel function. We implement the learning procedure on the obtained sample with a polynomial kernel function with degree 6. The formed separating border is depicted in
Figure 17.
The developed classifier correctly makes decisions at 95% of phase-to-phase short circuits inside the transformer, excluding only short circuits that occurred in close proximity to the neutral and practically do not differ from the normal mode.
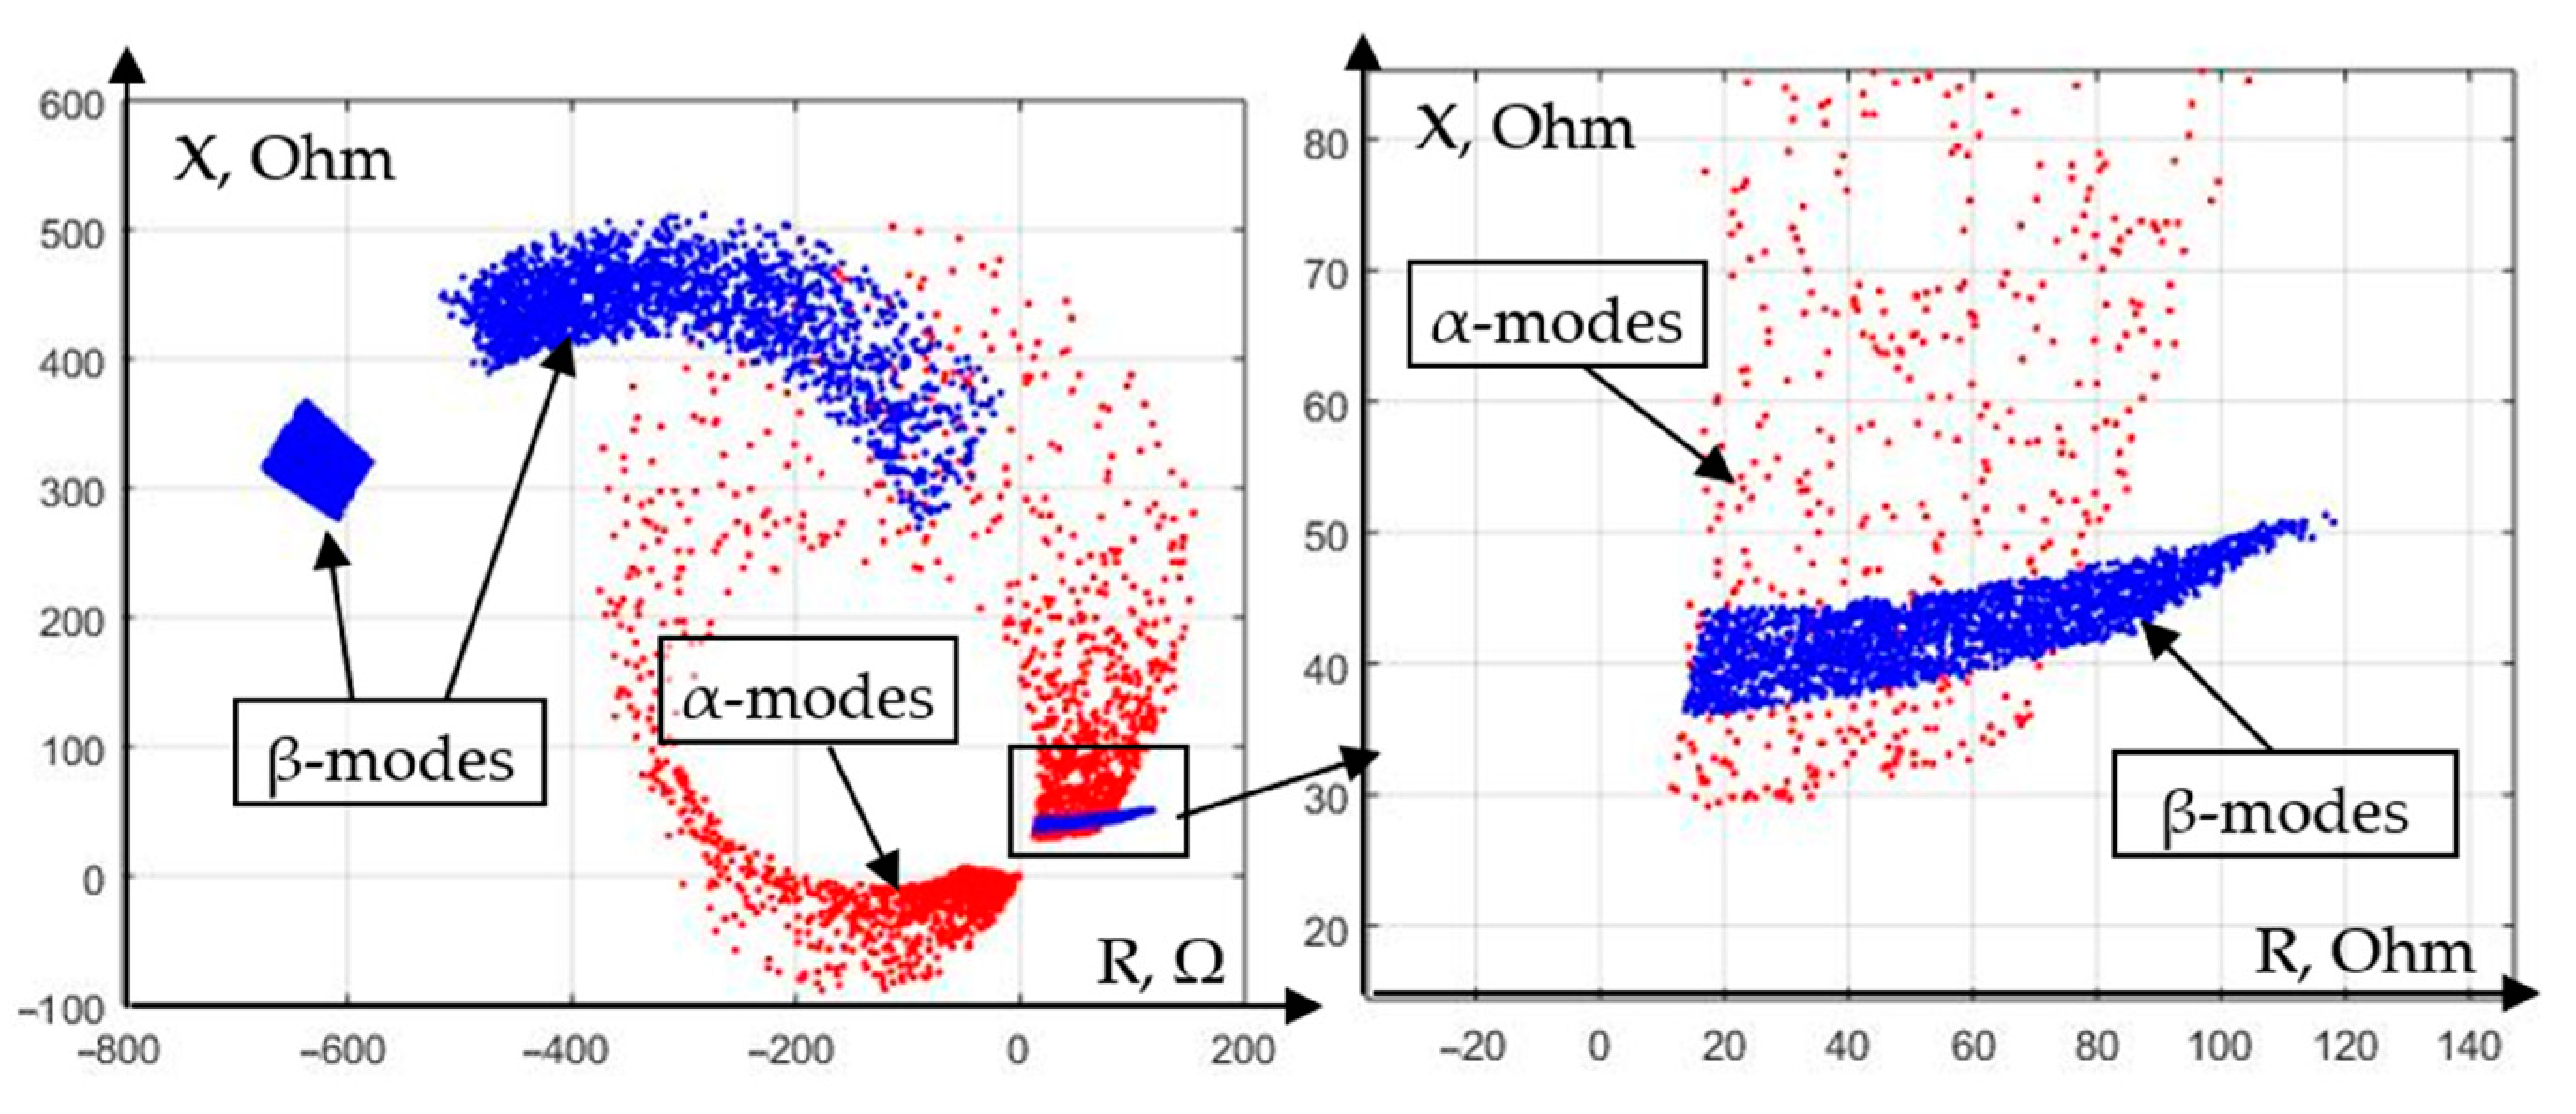
Displays of α- and β-modes of the triggering element “SVM ω
2” in the one used in
Figure 17 feature space are shown in
Figure 18.
In contrast to the case (
Figure 17), in
Figure 18, there are obvious intersections of the regions of α- and β- modes. Thus, it is impossible to draw the triggering border in such a way that it accurately separates the observed and alternative modes. One of the possible ways to solve the problem is to move to a feature space of a higher dimension. Let us add as the third feature the effective value of the line current ω
2, measured from the side of the substation where the designed protection is installed.
In the resulting three-dimensional feature space (
Figure 19), it becomes possible to draw a boundary (separating plane), which ensures an unmistakable separation of the modes under consideration.
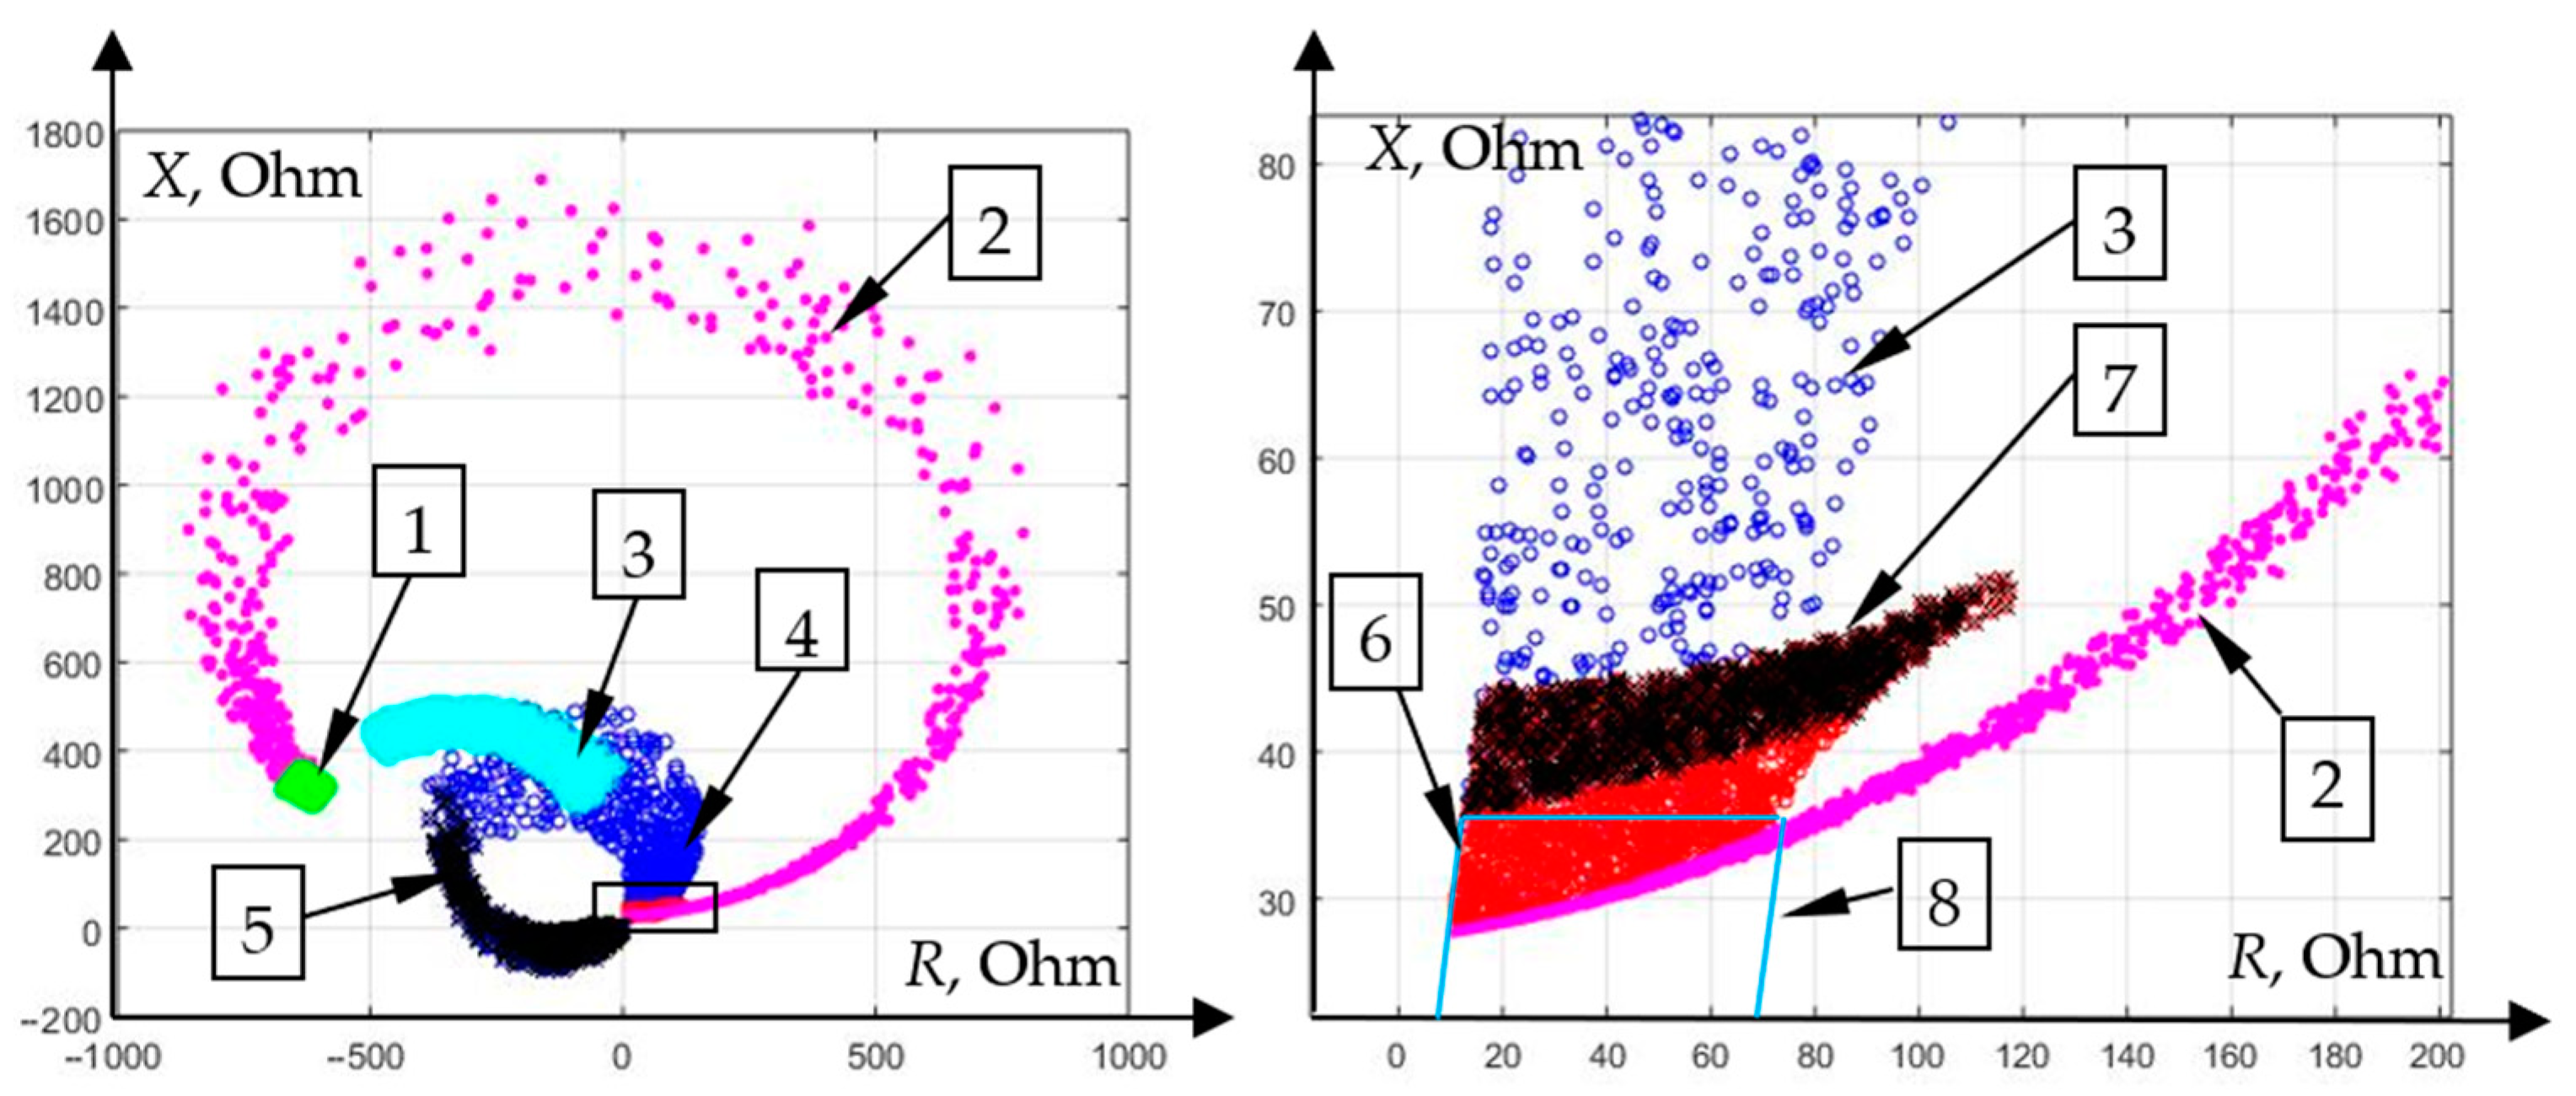
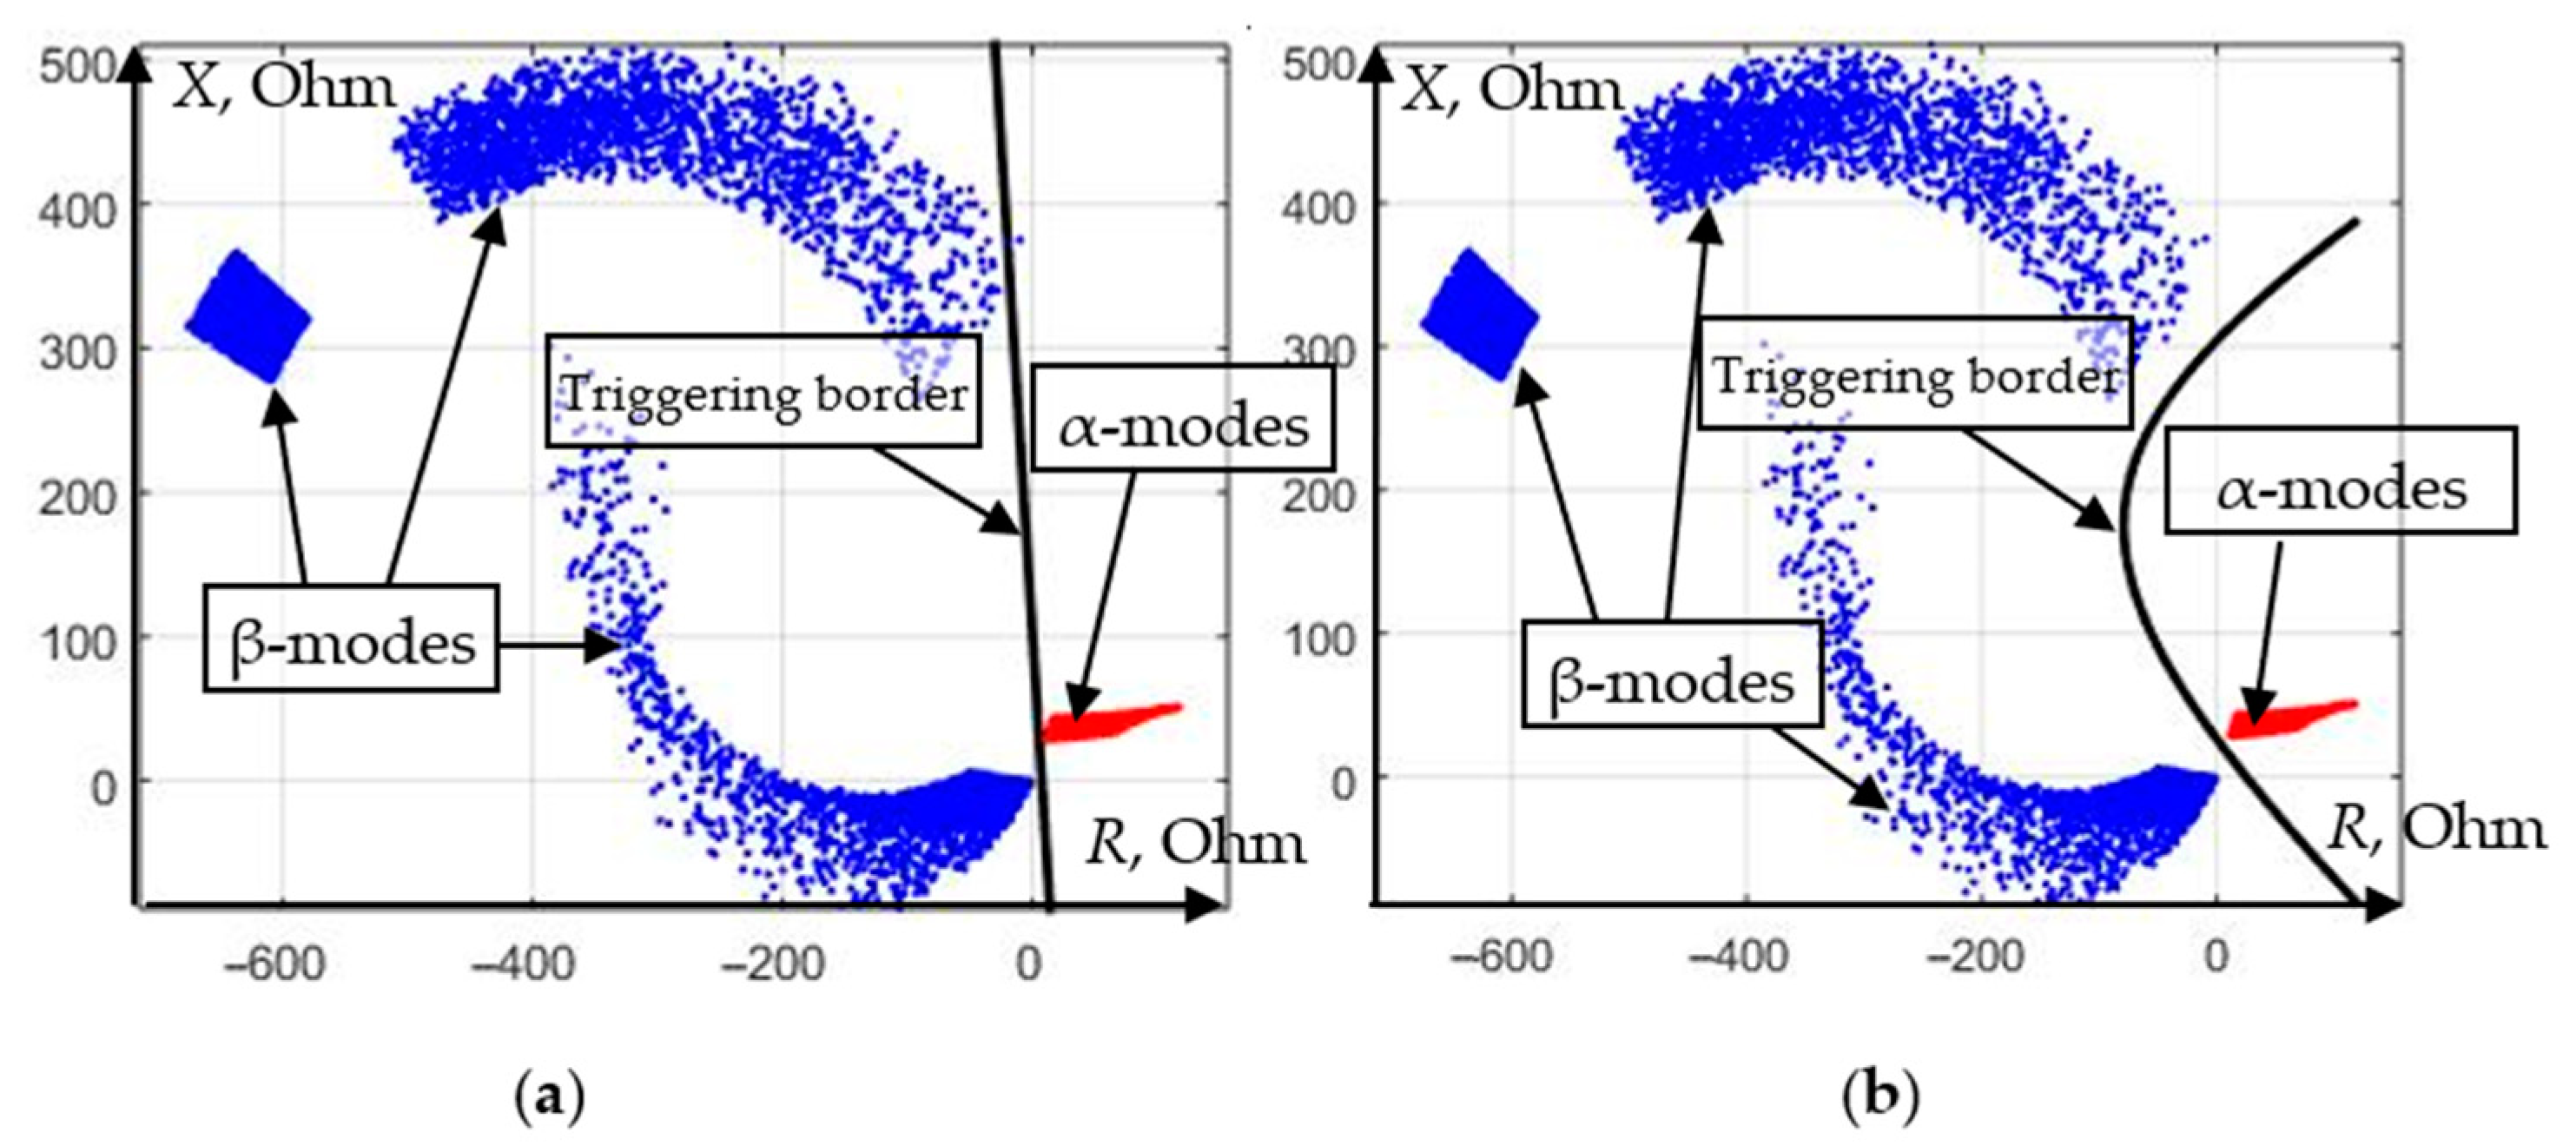
The last developed triggering element “SVM ω
3“, designed to detect short circuits on the line ω
3, has a distribution of α- and β-modes in a two-dimensional feature space formed by the complex plane of the DP, in accordance with
Figure 20.
The case (
Figure 20) is the most “simple” in terms of recognition of emergency modes, because error-free classification is possible in the space of features of dimension 2 with a linear kernel function (
Figure 20a). However, the use of the polynomial kernel function (
Figure 20b) is more preferable, since in this case the separating border is located farther from the points characterizing both α- and β-modes. This guarantees a high probability of correct operation of the recognition algorithm in the event that a mode is presented for classification that slightly goes beyond the set of simulated modes.
Developed on the basis of the support vector machine method, additional RPA triggering elements almost unmistakably identify damaged sections of the electrical network, thereby making it possible to increase the sensitivity of distance protection in the reserve zone. The considered example shows that the use of machine learning in relay protection tasks is promising not only in the formation of new types of protection, but also as an additional tool for increasing the selectivity and speed of existing types of protection.
6. Conclusions
1. It is advisable to carry out statistical simulation experiments when parameterizing the triggering elements of traditional types of relay protection. The characteristic of the distance protection, based on the results of simulation of a test section of the power network, accommodated 17% more short-circuits (faults) in the triggering zone than the characteristic obtained by the analytical method.
2. Two simulation models of power network sections have been used to demonstrate the capabilities of the trained multi-parameter relay protection. The relay protection triggering elements based on such machine learning methods as k-nearest neighbor method, logistic regression method as well as support vector method are implemented. A special feature of this approach is the impossibility of manual adjustment of the triggering area. This is what the above classification methods are for. Each method provides higher efficiency of short-circuit detection in comparison with traditional types of relay protection: current and distance.
3. According to the results of simulation, training, and application of machine learning methods (k-nearest neighbors, logistic regression, support vector machine) for power line relay protection, it was possible to recognize more than 98% of various short circuits, while the distance triggering element was able to disconnect no more than 74% of the total number of simulated short circuits. Thus, an increase in the recognition of accidents by more than 24% was obtained. The reference support vector machine method is preferable for application, with which error-free classification of simulated conditions is realized.
4. Based on the reference support vector machine method, a number of trainable triggering elements aimed at identifying a faulty network element have been developed. By selecting optimal feature spaces and model parameters, it has been possible to provide error-free fault localization. The use of such triggering elements allows a more efficient implementation of redundancy of adjacent sections of the protected transmission line, and therefore it increases the reliability of relay protection.


