1. Introduction
Numerical modeling underlies all performance assessments of deep geological repositories (DGRs) for radioactive waste. In general, performance assessment (PA) aims to evaluate the integrity and performance of the engineered and geological barriers as the disposal system evolves over a period of thousands to millions of years. To evaluate the suitability of a given site for a DGR, site-specific geoscientific data gained from site characterization are integrated with the respective repository project into PA models. When multiple candidate sites simultaneously undergo characterization in the context of site selection for a DGR, similar PA models build upon available data to evaluate the performance at each site. Site-specific performance assessments can make use of consistent and measurable performance indicators across all sites to support a transparent and verifiable site comparison.
Performance assessments of the geological barrier are carried out based on the observed characteristics of the host rock and the overall geological setting at the start of the assessment period, which typically corresponds to the time of repository construction or closure. Furthermore, evolutionary scenarios may arise during the assessment period due to long-term changes in the geology itself and due to effects induced by the repository. The assessments need to consider a certain degree of uncertainty due to practical limitations in methods to characterize and explore the geological barrier. These limitations, based on current information and assumptions, carry over into the ability to predict the long-term evolution of the geologic setting. The long-term performance of the engineered and geological barrier thus depends on several safety-relevant effects. These include, among other things, the tectonic evolution and the impacts of thermal and gas migration introduced by the interaction of the waste with the nearfield. The complexity of the involved thermohydromechanical (THM) processes requires comprehensive modeling workflows that include quantitative performance assessments of site-specific repository projects and an adequate evaluation of the associated uncertainties (i.e., [
1,
2,
3,
4]).
The overarching goal of the present paper is to demonstrate the role of performance assessment modeling in the context of site selection as applied in Switzerland. The Swiss Nuclear Energy Law requires the disposal of all types of radioactive waste in deep geological repositories. The Swiss Radioactive Waste Management Program foresees two types of repositories: a high-level waste repository (HLW repository) for spent fuel, vitrified high-level waste and long-lived intermediate-level waste; and a repository for low- and intermediate-level waste (L/ILW repository), with the option of co-disposal in a combined repository. The procedure for selecting the repository sites in Switzerland was specified in the conceptual part of the Sectoral Plan for Deep Geological Repositories (SGT) and consists of three stages [
5]. In the current and last Stage 3, three candidate regions, Jura Ost, Nördlich Lägern, and Zürich Nordost in northern Switzerland, are examined in detail and, where necessary, supplementary geological investigations are being performed, such as deep exploratory boreholes. The broadened site-specific database forms the basis to select, for each of the repositories, the site for which the general license application will be prepared. Following the specifications in the Sectoral Plan, a criteria-based approach is adopted to ensure a traceable implementation of the site-selection process with the latest version of the site-specific database.
This paper presents a modeling workflow integrated with a criteria-based indicator approach for site selection, aimed at comparing favorable and less favorable aspects of potential siting areas. The workflow comprises a portfolio of numerical models implemented for the three candidate siting regions in Switzerland, addressing different aspects of the long-term safety and suitability of the site-specific repository projects in a quantitative manner. Emphasis of this paper is on criteria related to:
The performance of the geological barrier based on its characteristics as observed today and unperturbed by the DGR;
The long-term evolution of the DGR and potential effects on the barrier integrity and performance;
The reliability of the geological findings in terms of the ease of characterization and exploration as well as in terms of the predictability of the long-term evolution.
The workflow integrates site-specific data with numerical models representing the geological environment, individual repository components, and entire repositories at each site. Evolution scenarios address spatial and temporal uncertainties by means of deterministic and probabilistic approaches adopted for sensitivity, uncertainty, and robustness analyses. To address the selected criteria, assessment aspects are evaluated using quantitative dimensionless performance indices for a consistent comparison of the candidate sites. The modeling workflow aims to provide a traceable, transparent, and verifiable assessment of the candidate repository sites.
2. Site Selection Process and the Criteria-Based Approach
In the conceptual part of the Sectoral Plan, the regulator has defined the goals, procedures, and criteria to be applied in selecting sites for deep geological repositories for all categories of radioactive waste in Switzerland [
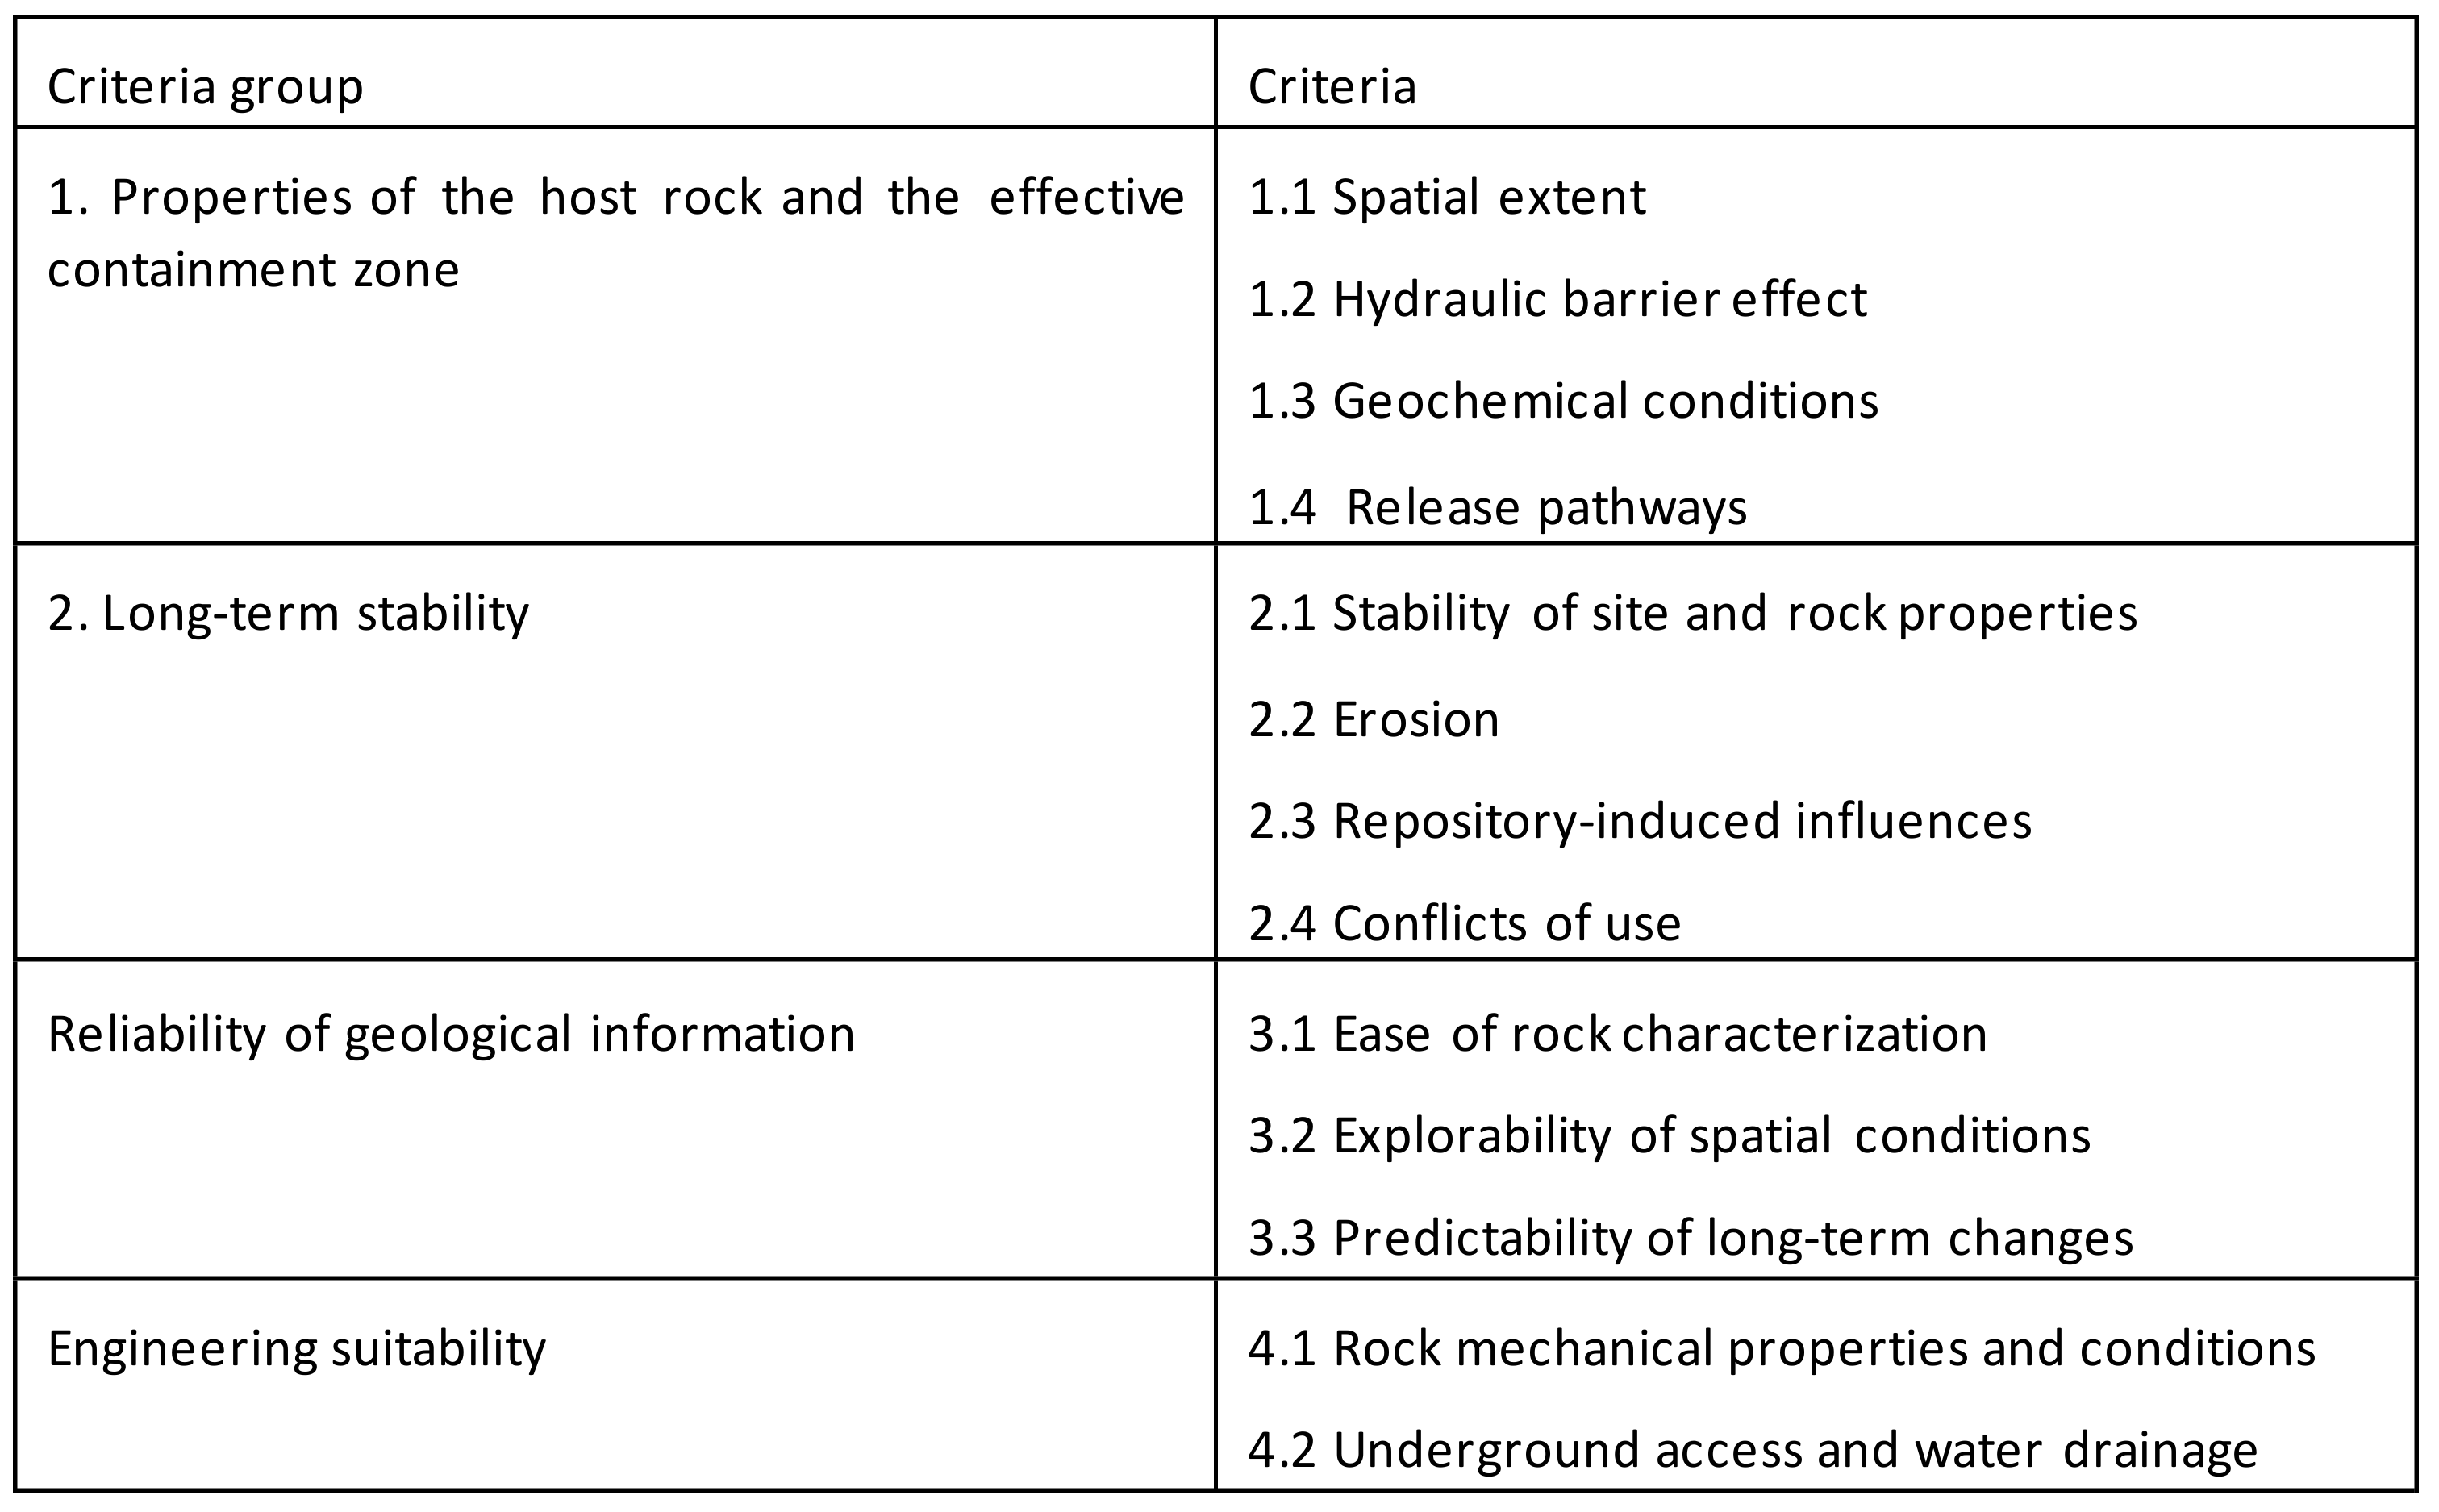
5]. The focus of the stepwise site-selection process is on safety-based criteria and indicators, with land use and socioeconomic aspects playing a secondary role. A total of 13 assessment criteria, split into 4 groups, are defined for the so-called
Effective Confinement Zone (including the host rock and confinement rock zones above and below it) from the viewpoint of safety and technical feasibility (
Figure 1):
Criteria Group 1 considers the performance of the Effective Confinement Zone based on its characteristics at the start of the assessment period;
Criteria Group 2 considers the possible evolution of the Effective Confinement Zone during the assessment period due to geological long-term processes, repository-induced effects, and human actions;
Criteria Group 3 address the impact of uncertainty from practical limitations in the degree to which it is possible to characterize and explore the geological barrier and to predict its long-term evolution;
Criteria Group 4 concentrates on the suitability of the host rock and overlying strata at each site from an engineering perspective.
Figure 1.
Criteria for site selection to be assessed from the viewpoint of safety and technical feasibility according to [
5].
Figure 1.
Criteria for site selection to be assessed from the viewpoint of safety and technical feasibility according to [
5].
These criteria will determine which Effective Confinement Zone is the best repository location. The requirements set out in these criteria call for a balanced combination of site data and model-based assessments. The modeling workflow presented in this paper supports the assessments needed for Criteria Groups 1, 2, and 3.
The Sectoral Plan also specifies, for each of the criteria, the various “aspects to be evaluated” and their corresponding relevance for safety. Among the assessment aspects specified for Criteria Group 1 are the spatial extent (vertical and lateral) of the Effective Confinement Zone and the repository depth (Criterion 1.1), the flow and transport properties of the Effective Confinement Zone (Criterion 1.2) and the release paths along discrete tectonic features (Criterion 1.4). On the other hand, Criterion 2.3 (repository-induced effects that may influence the long-term stability of the geological and engineered barriers) is divided in three assessment aspects that have the potential to discriminate between siting regions, namely the Excavation-Damaged Zone (EDZ), the gas effects in the host rock and in the EDZ, and the thermal effects in the host rock. In Criteria Group 3 the aspects to be evaluated concern the inherent uncertainties associated with the geological conditions in the candidate siting regions which cannot be reduced by additional site investigations. The safety-related comparison of the sites requires different categories of uncertainties to be addressed; namely, parametric uncertainties, conceptual uncertainties, and scenario uncertainties (i.e., geological long-term evolution of the siting regions).
According to the regulator [
6], the qualitative assessment of the
Effective Confinement Zone must refer to the site-specific reference scenario, defined as the expected development of the repository system (including the waste inventory, barrier system, and geological situation), whereas the influence of uncertainties must be systematically assessed within Criteria Group 3. The inherent bandwidths of parameters and development scenarios that cannot be reduced through further site investigation from the surface are to be regarded as part of the reference scenario. On the other hand, conceptual uncertainties are to be identified and introduced into the assessment as additional arguments.
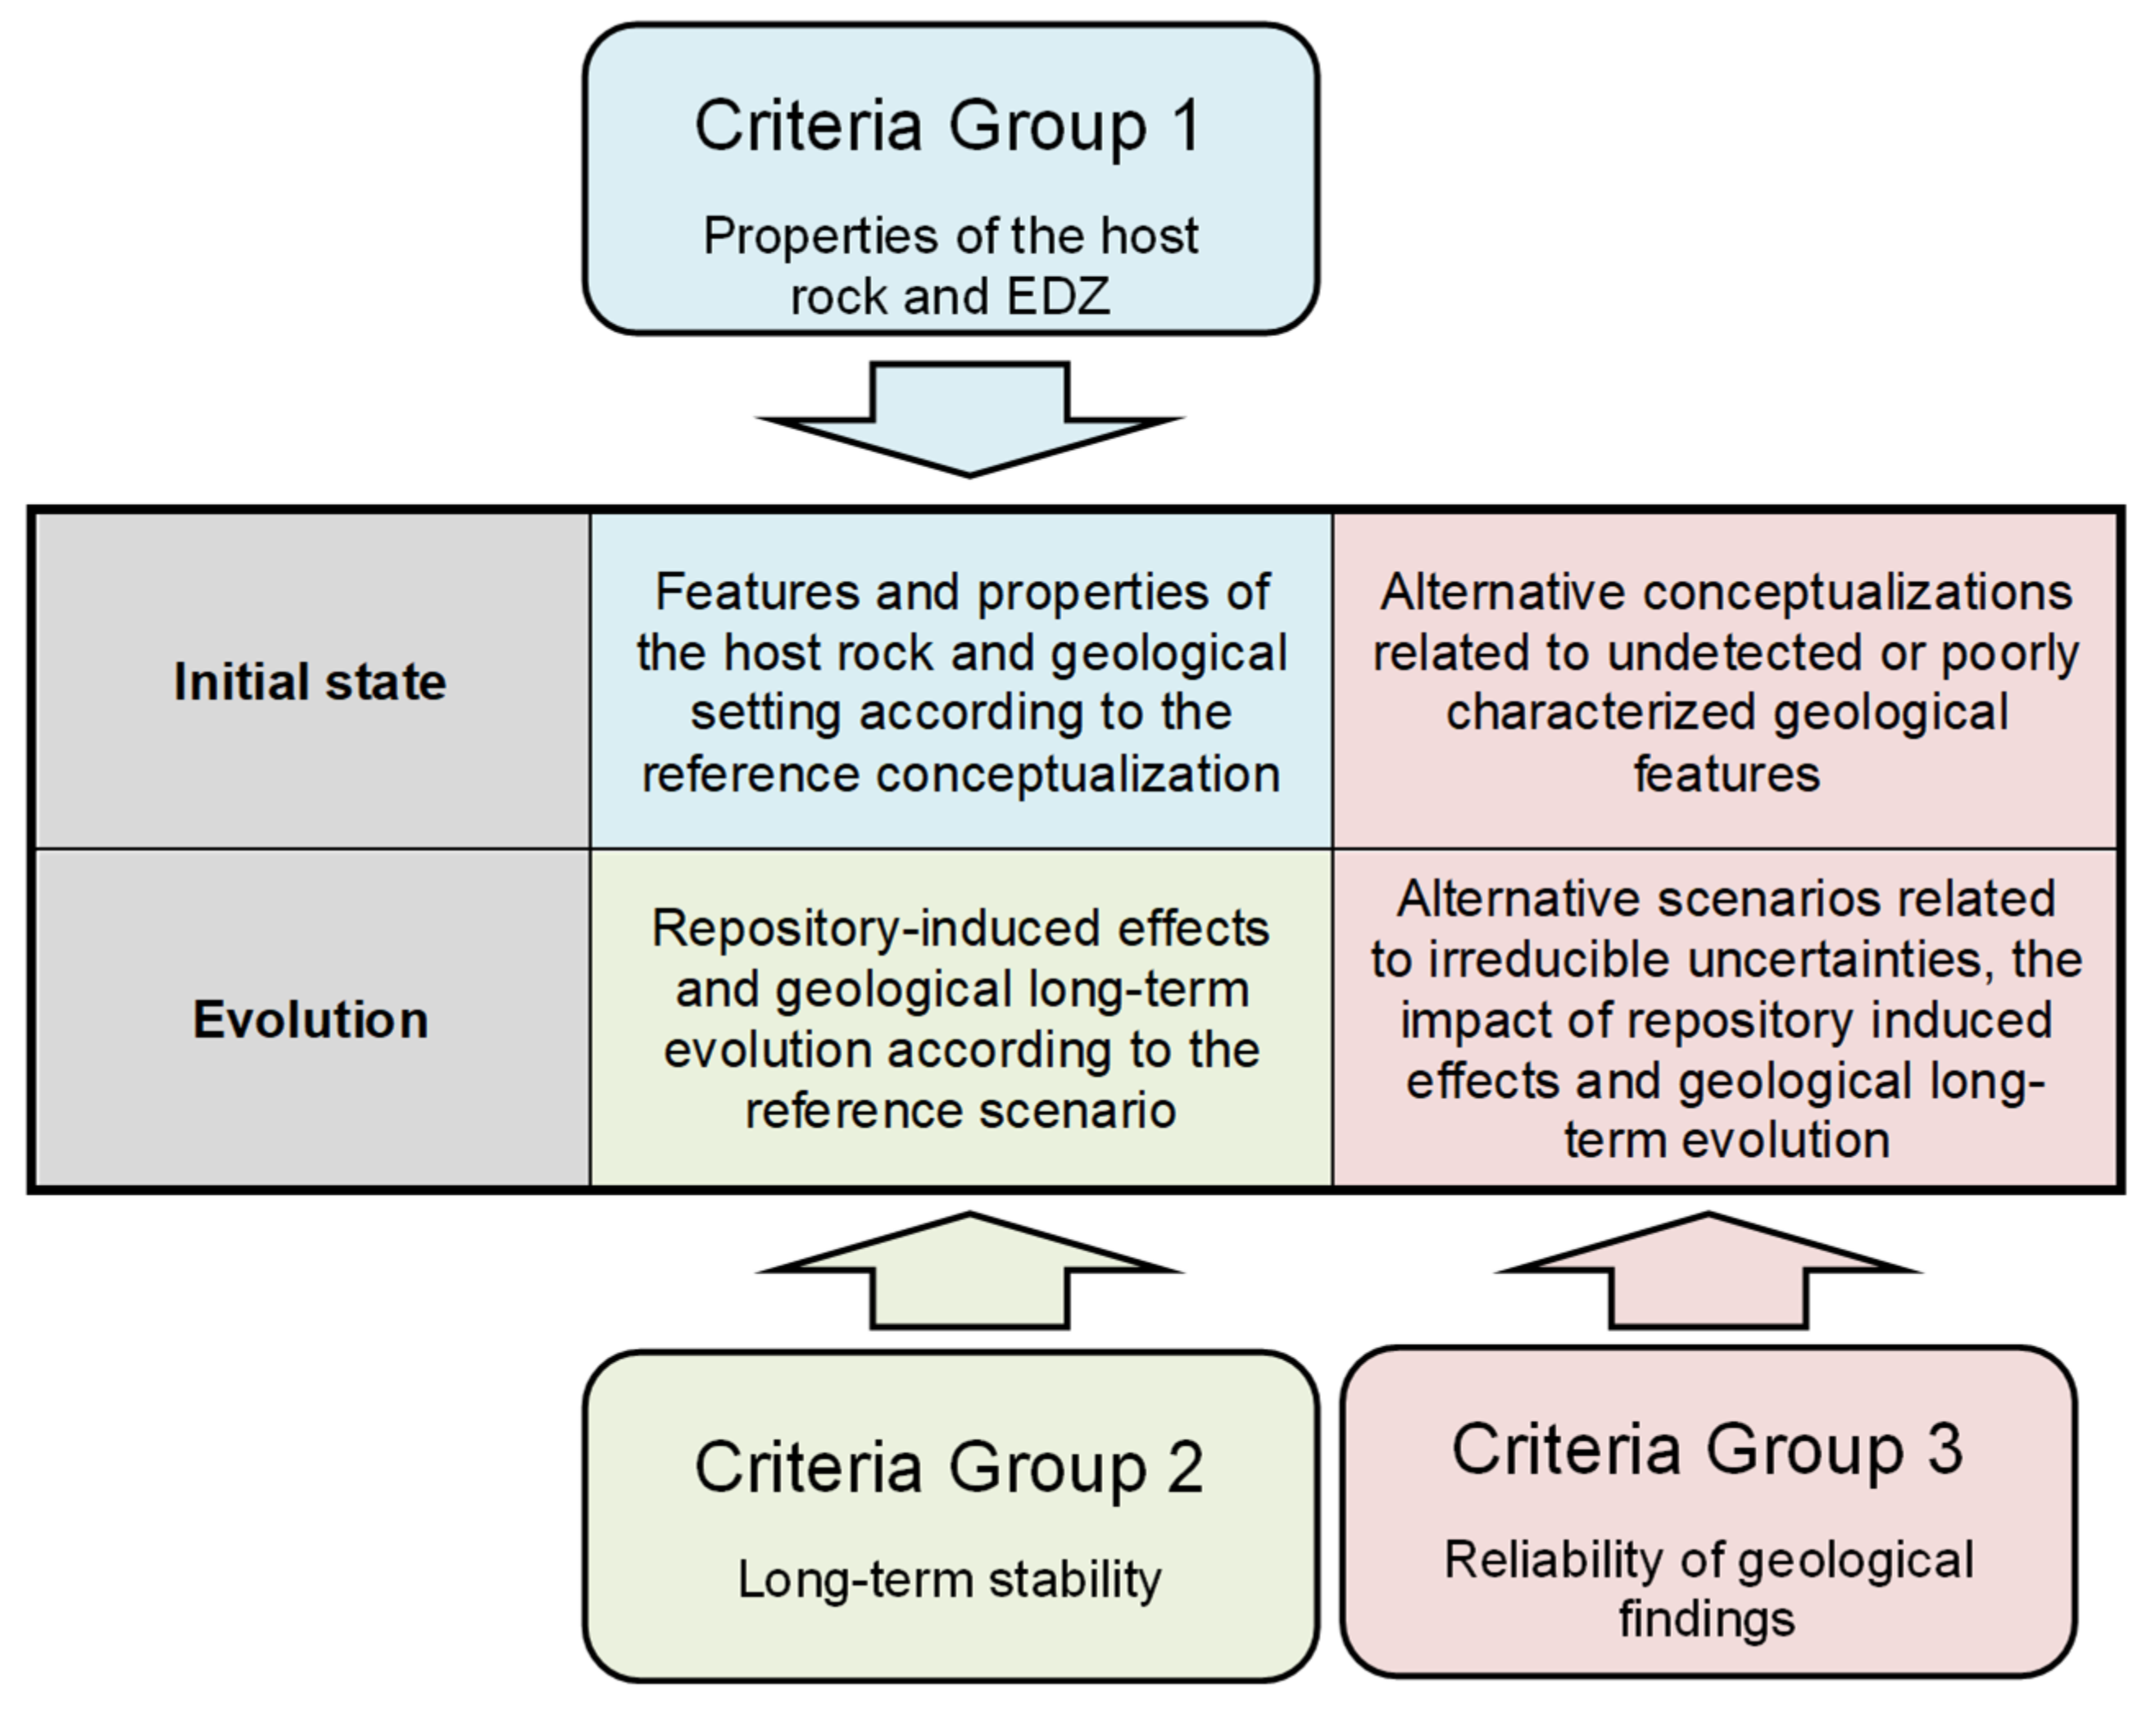
The modeling workflow proposed in this paper is embedded in a general performance assessment methodology with a hierarchical organization of requirements and targets related to the long-term safety, engineering feasibility, and other aspects that any acceptable disposal system must meet. Specifically, the impacts of the different types of uncertainty are investigated by:
Considering a reference scenario and, if necessary, a range of alternative scenarios;
For each scenario, a reference model conceptualization and, if necessary, alternative conceptualizations of the features, events, and processes occurring within that scenario;
For each model, considering a range of different parameter values.
Based on this, the focus of performance assessment when assessing the first 3 criteria groups is summarized in
Figure 2.
3. Modeling Tools for Site-Specific Performance Assessments
To implement the site-specific performance assessments, a portfolio of integrated modeling tools has been developed as described below.
3.1. Overarching Modeling Workflow
The modeling toolbox is based on a descriptive model for each site that integrates site-specific geoscientific data gained from surface-based investigations such as 3D seismic and deep exploratory boreholes. The site descriptive models include the host rock, the upper and lower confining units (UCU and LCU, respectively), and the remaining geological formations from the ground surface to the bottom of the Mesozoic sediments in northern Switzerland (for details, see [
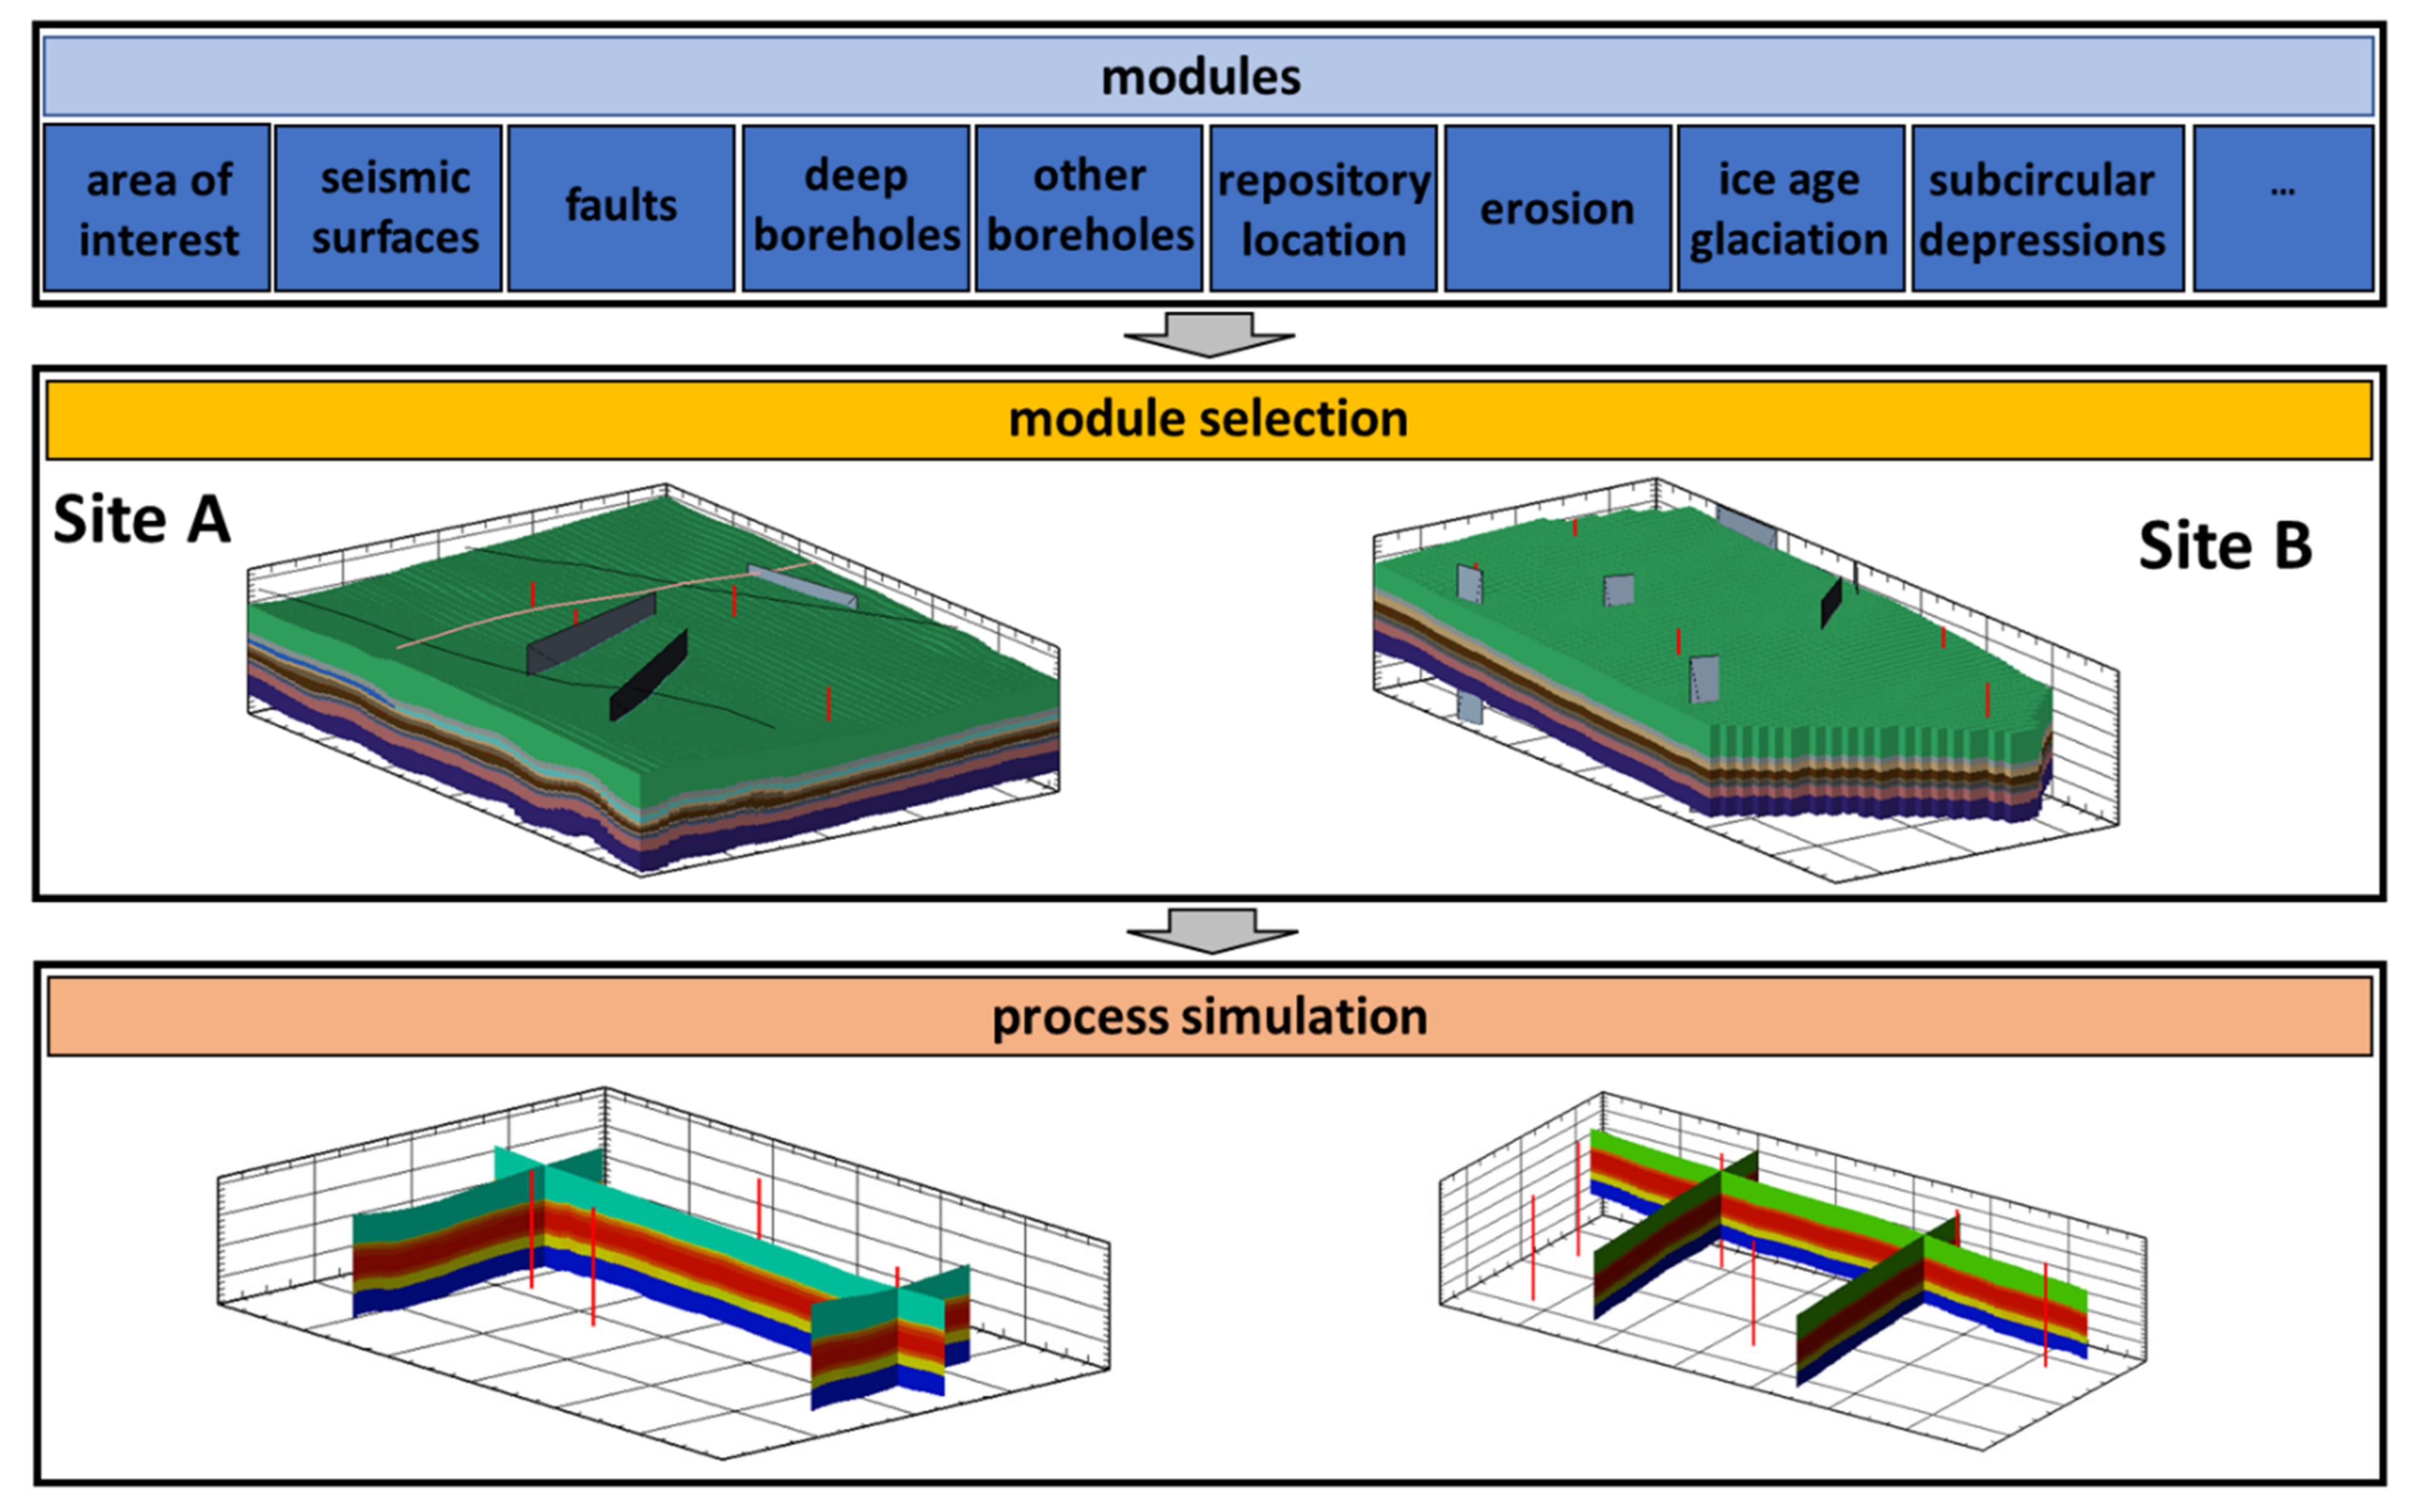
7]). The model development is implemented with a modular model structure through baseline, “parent” models that represent each siting region with all available information (i.e., stratigraphy, deep borehole locations, faults detected from the surface, etc.) and allows the substruction of more detailed, “daughter” sub-models that focus on information and processes relevant to the targeted assessment aspects (
Figure 3). In general, the parent models (one for each site) are built on the coarsest mesh, whereas sub-models make use of finer grids and, where necessary and appropriate, local refinements. Modules available in the workflow for integration into sub-models include, but are not limited to, the geological stratigraphic model that is subject to updates with new seismic and borehole data, regional tectonic structures and faults, deep exploratory boreholes (i.e., for interpretation of borehole measurements), shallow boreholes, erosion scenarios, glaciation scenarios, subcircular depressions in limestone formations, and the geological repository itself. Depending on the model purpose, an area of interest is outlined, and the respective modules are activated for the automatic generation of nested grids with finer meshing near and around features of interest (e.g., discrete faults, repository tunnels). Initial and boundary conditions are accordingly tailored to the model purpose and evolution scenarios to be evaluated. The models are implemented in the iTOUGH2 simulation–optimization framework [
8] which integrates the non-isothermal single- and multi-phase flow and transport simulator TOUGH2 [
9].
3.2. Models for Assessments of the Geological Barrier
In the context of performance assessment, the evaluation of the minimum allowable distance from tectonic features (Criterion 1.1), the water flow, transport of dissolved substances (Criterion 1.2), and the release paths along discrete tectonic features in the Effective Confinement Zone (Criterion 1.4) require transport modeling to determine the fate of constituents released from the repository to the surrounding rock.
In this paper, the source term represents the release of a hypothetical, dissolved, non-sorbing, stable elements from the waste packages, which is required to assess the performance of the host rock as a transport barrier. It is herein assumed that the released constituent can be represented by a conservative tracer that has the same properties as water. For simplicity, the simulations of diffusive/advective transport of dissolved tracers assume a unit release rate at the repository location (unit step function). The transport simulations are performed using the EOS1 module of TOUGH2 for water and tracer [
9].
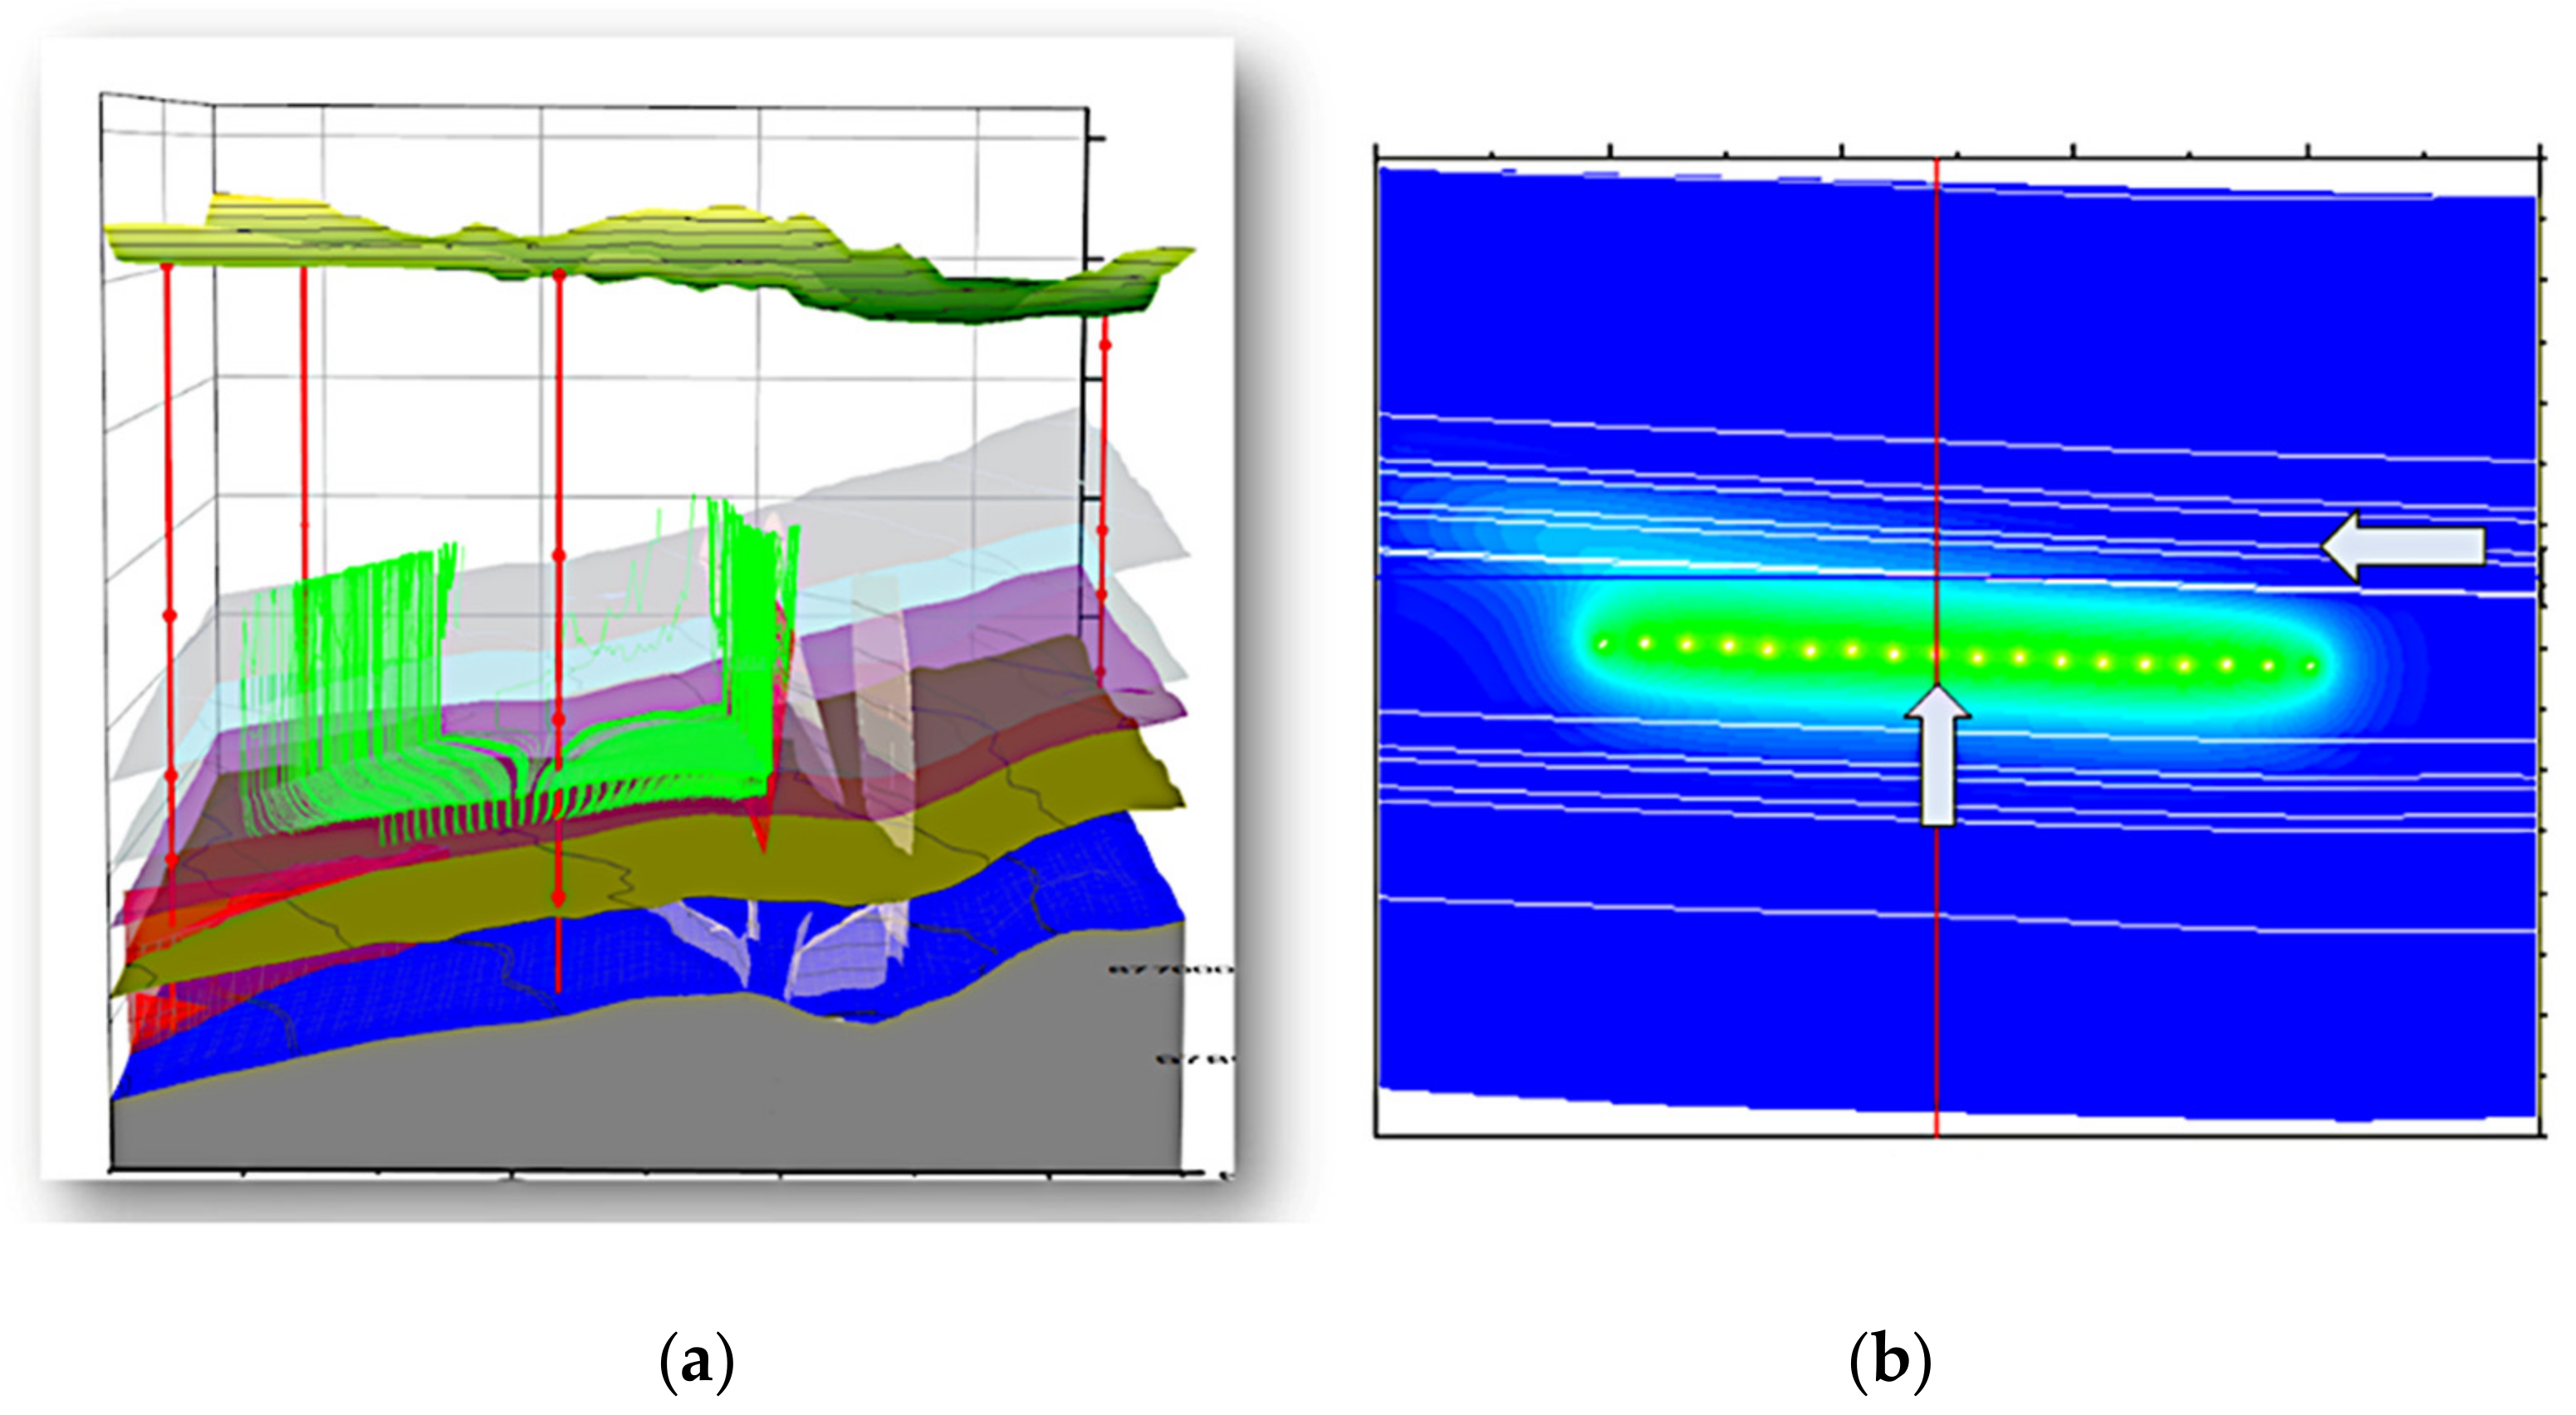
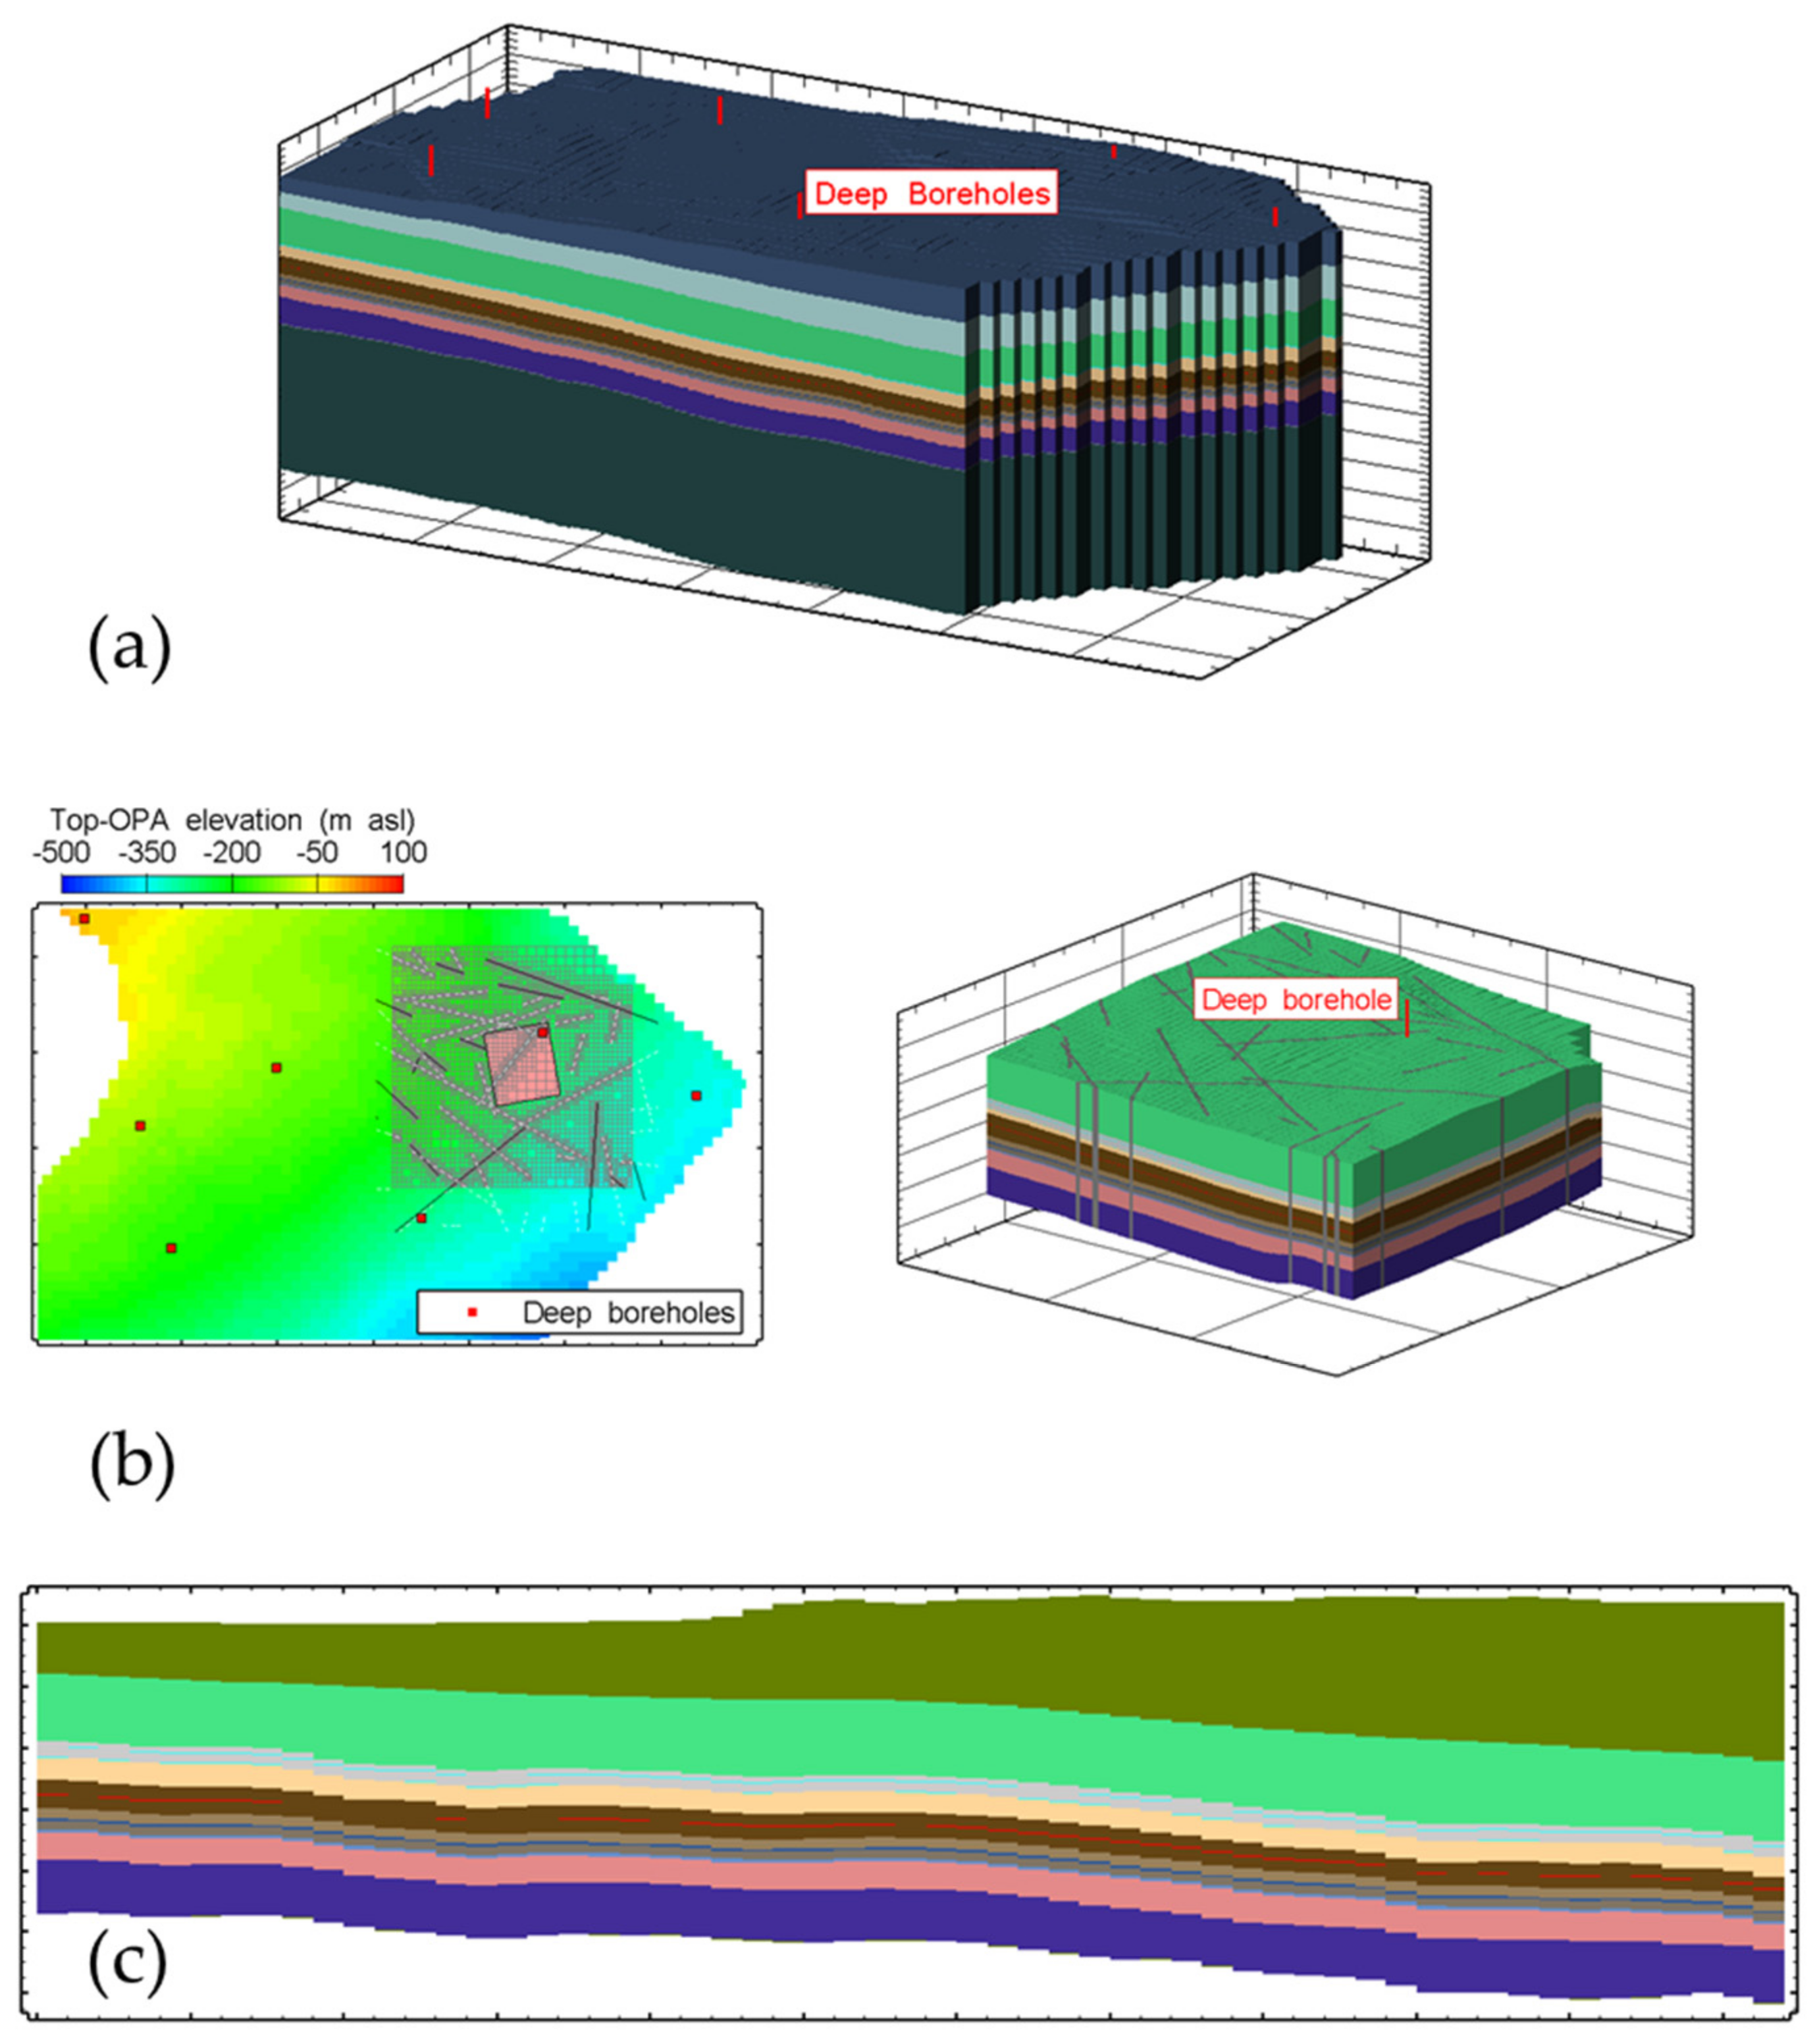
A portfolio of numerical models representing the stack of geological formations has been implemented to address the assessment aspects relevant to the performance of the geological barrier (illustrative examples shown in
Figure 4):
3D models of the entire siting regions, including regional faults and deep exploratory boreholes used for the repository placement within the region. These also determine minimum distances for delineating the Effective Confinement Zone, the water flow and transport, and the release pathways;
3D sub-models of selected repository areas within siting regions including regional faults for particle tracking and detailed assessment of release pathways through tectonic structures;
2D sub-models of cross-sections through the emplacement rooms of the repository for assessments of water flow and transport and release pathways with and without discrete faults in the vicinity of the emplacement rooms.
Figure 4.
Examples of models used for the site-specific assessments of geological barrier: (a) 3D model of siting region; (b) 3D sub-model around a candidate area with refinements around possible fault locations extended vertically from under- and overlying units; (c) 2D sub-model of vertical cross-section.
Accordingly, several assessment scenarios have been implemented to address uncertainty in the conceptualization of the site-specific hydrogeologic systems:
Diffusion-only (the reference scenario), assuming that diffusion is the dominant process in the host rock;
Advection–diffusion with vertical gradient (upflow), allowing advective flow and assuming a unit gradient applied between the formations under- and overlying the host rock;
Advection–diffusion with vertical gradient (upflow) and lateral groundwater flow in over- and/or underlying formations, additionally assuming lateral gradients in local aquifer systems above/below the host rock.
3.3. Models for Assessing Repository Influences
The assessment of gas and thermal effects in the geological repository, EDZ, and surrounding host rock requires non-isothermal two-phase flow and transport modeling. Moreover, assessment of the extent and shape of the EDZ requires mechanical modeling considering the site-specific repository configurations and stress conditions.
Gas in the Swiss DGR concept is mainly generated by anaerobic corrosion of the steel HLW canisters, corrosion and degradation of metals and organic materials in ILW and L/ILW wastes, and corrosion of construction materials [
10]. The degradation of organics and anoxic corrosion of metals will produce various gas products such as H
2, CO
2, CH
4, H
2S, and NH
3. However, H
2 is the dominant species making up more than 97% of the total gas produced. In the framework of SGT Stage 2, comprehensive sensitivity studies were performed to estimate gas generation rates in the HLW and L/ILW repositories. A range of gas generation rates was provided as input for the sensitivity analyses of gas release [
11,
12,
13,
14], representing a reference scenario with upper and lower bounding values.
Heat is generated only in the HLW repository by the decay of the wastes [
15]. Heat generation rates were estimated for different waste types based on Nagra’s waste inventory developed for the preliminary assessments of SGT Stage 2 [
15], see also [
12]. A reference scenario corresponding to the average heat output from all canisters is adopted, supplemented by an upper bounding rate.
The role of the EDZ surrounding the repository tunnels is twofold. In general, the EDZ is expected to have higher permeability and lower capillary strength than the intact rock, thus affecting the re-saturation of the repository and the transport of waste-generated gas to the surrounding rock [
13]. Moreover, the site-specific extent and shape of the EDZ is important to determine the thickness of intact rock above and below the repository. Preliminary site-specific stresses and geomechanical parameters for assessments of the EDZ come from Nagra’s geodata gained in SGT Stage 2 [
7]. They will be complemented with the results of the deep borehole explorations performed in SGT Stage 3.
The non-isothermal two-phase flow and transport simulations are performed using the EOS5 module of TOUGH2 for water and hydrogen [
9]. The extent and shape of the EDZ is calculated with a semi-analytical solution from [
16], verified and validated through benchmarking exercises with fully coupled HM modeling with Code Aster [
17].
The complexity of the involved thermohydraulic(-mechanical) processes calls for an approach that integrates models representing entire repositories (repository scale) with models representing individual components of a repository, such as the emplacement rooms and sealing sections (component scale). Models on the repository scale typically require a certain level of geometric abstraction and homogenization of materials and wastes within the repository tunnels [
10,
13,
14]. On the other hand, modeling on the component scale allows for more detailed representations of the geometries with the emplaced materials and wastes [
18,
19]. Benchmarking between repository- and component-scale models has been performed to evaluate effects of upscaling, including the scaling of source terms and the introduction of effective parameters between 2D and 3D representations [
20,
21]. As illustrated in
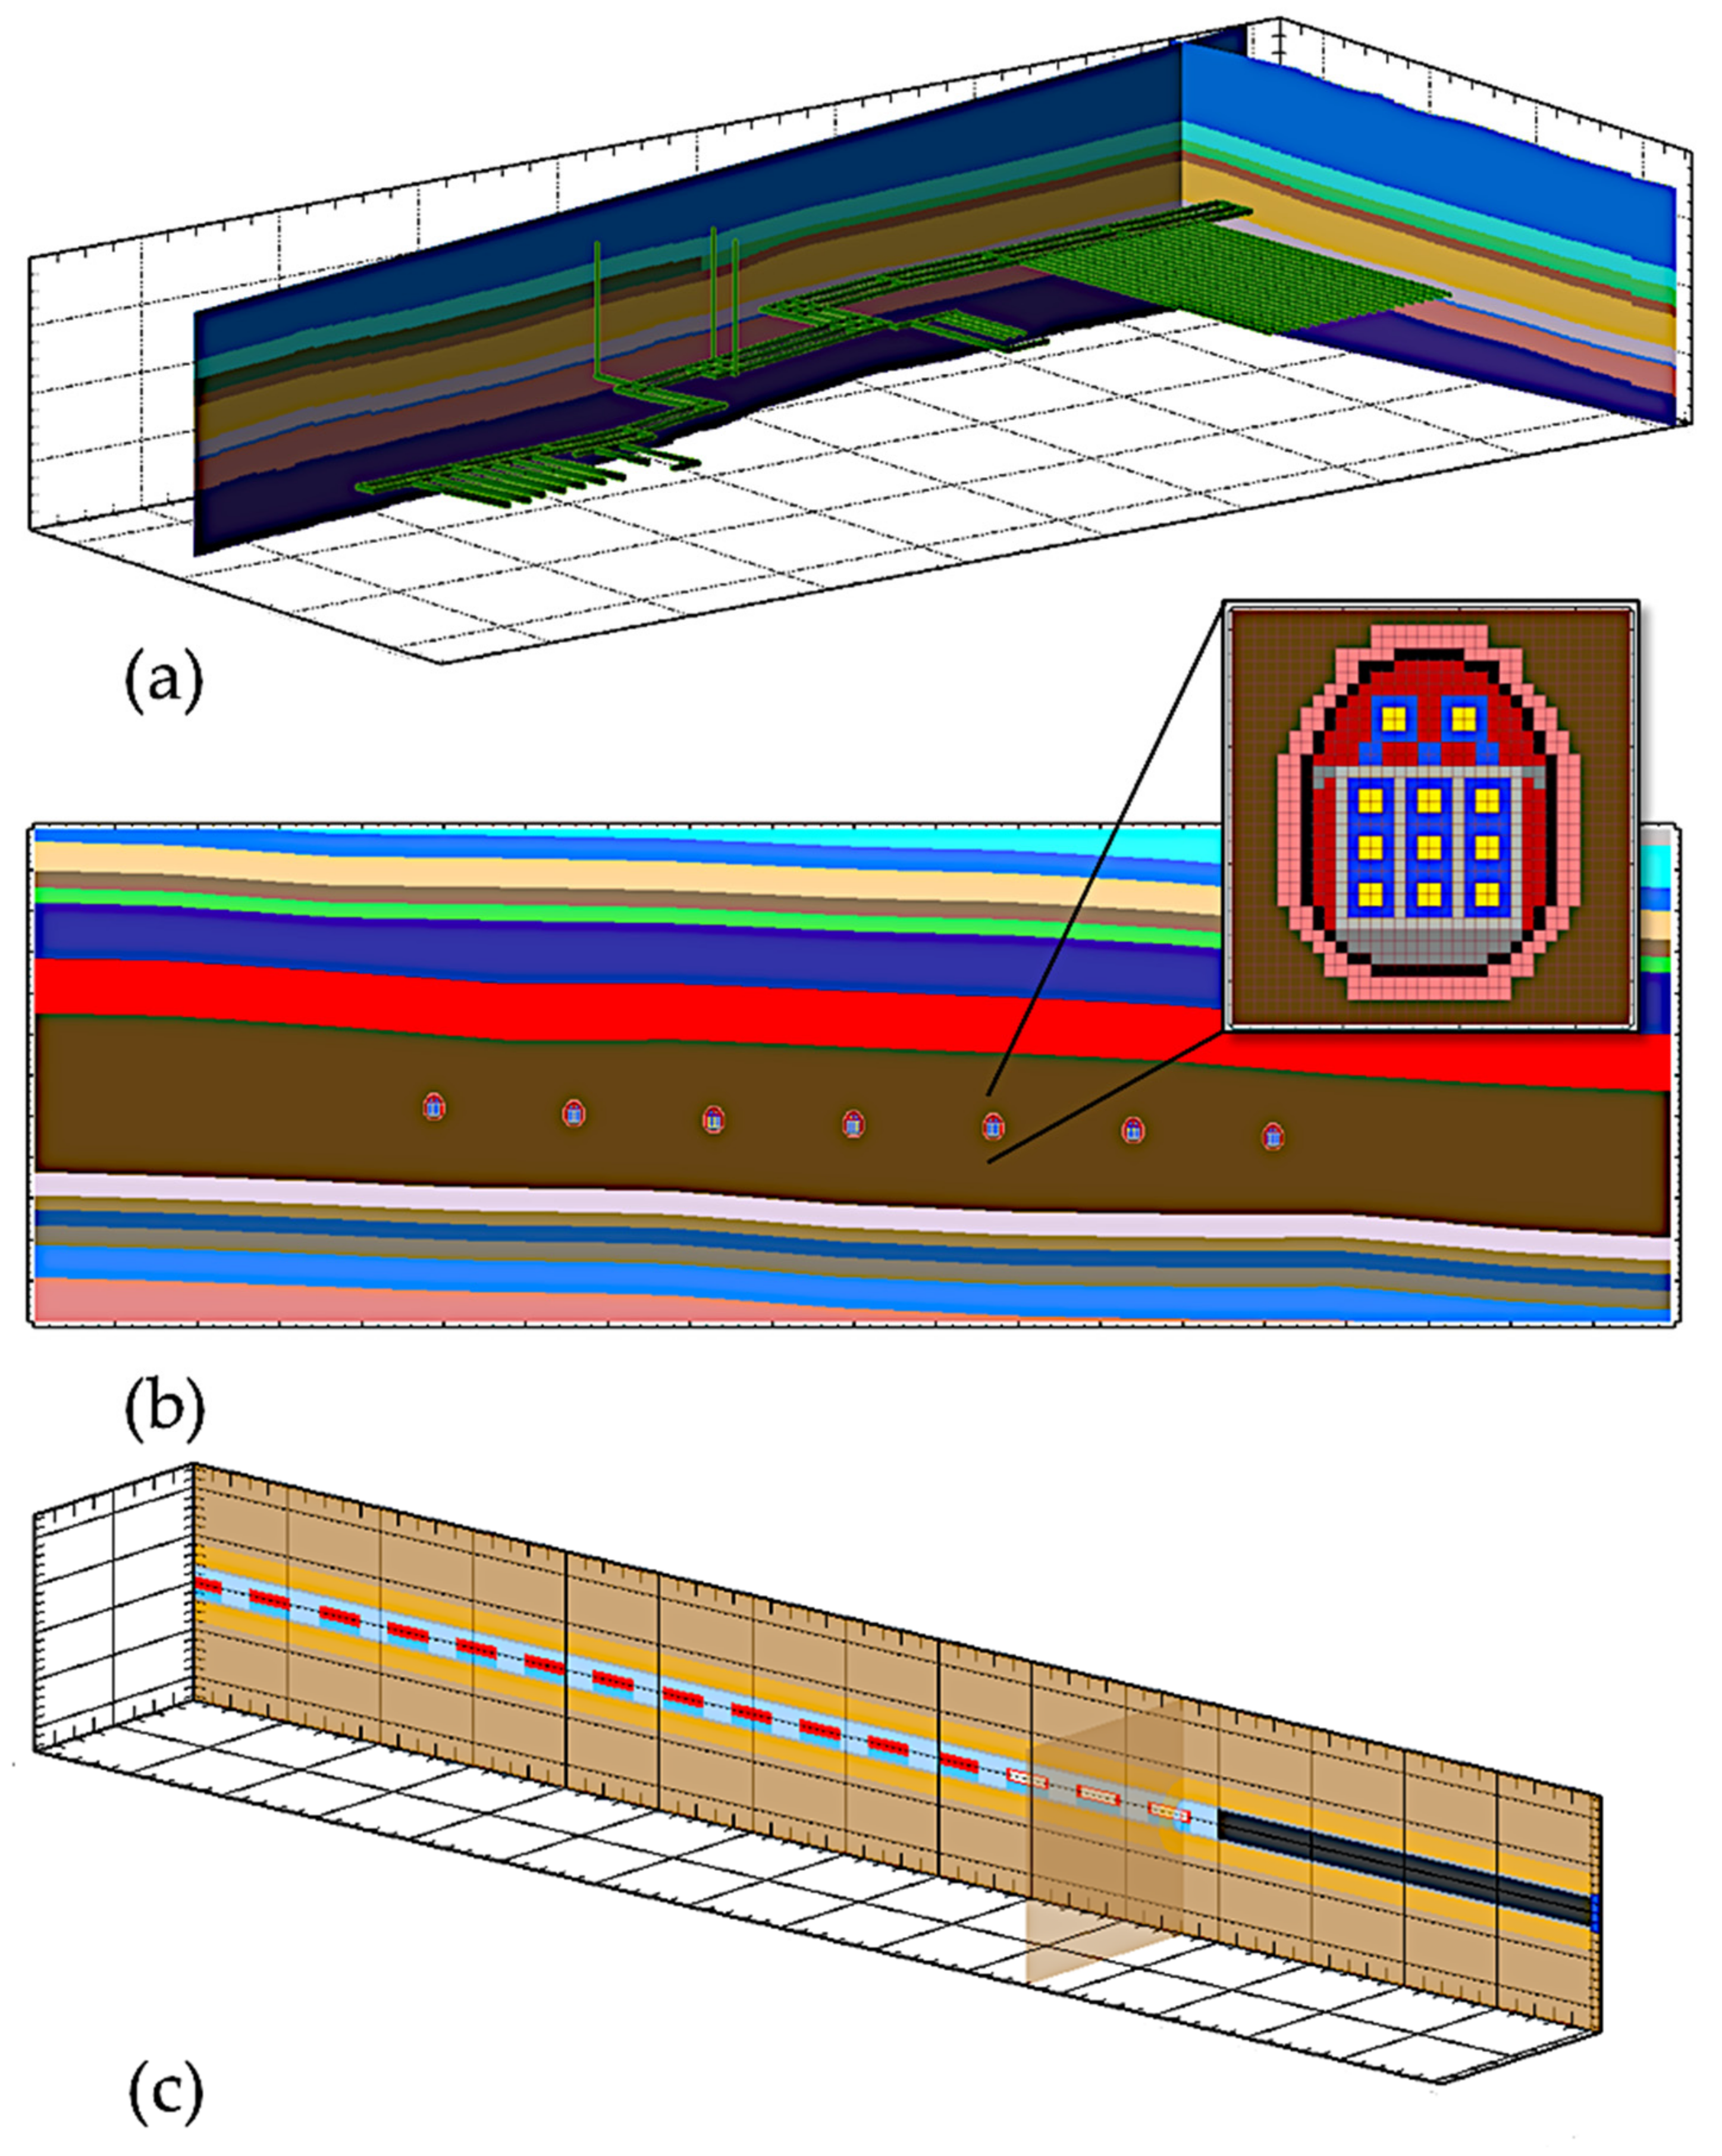
Figure 5, the portfolio of numerical models used for the assessment of repository induced effects includes:
3D models of entire repositories (combined L/ILW and HLW, HLW only, L/ILW only) in each of the three siting regions for the assessment of gas and heat effects considering the layout and design specifications of the repository;
2D sub-models of cross-sections through the emplacement rooms including the site-specific stack of geological formations above and below the repository and detailed representations of the emplaced materials;
3D semi-generic axial models of emplacement rooms and sealing sections.
Figure 5.
Examples of models used for the site-specific assessments of geological barriers: (a) 3D model of combined L/ILW and HLW repository; (b) 2D sub-model of vertical cross-section through the L/ILW repository; (c) 3D semi-generic model of HLW emplacement tunnel with seal and connecting tunnel.
Accordingly, many assessment scenarios have been implemented to address uncertainty in the conceptualization of the site-specific repository projects:
Variants of two-phase diffusion models, including without molecular diffusion (conservative with regards to gas dissolution and pressure build-up);
Scenarios of corrosion embodied by gas generation rates;
Scenarios of heat generation rates related to the emplacement strategy and schedule;
Scenarios related to the sealing system (e.g., gas-permeable versus tight seals, failing seals, lengths of sealing sections);
Scenarios of repository placement relative to the location of emplacement rooms in the host rock.
3.4. Uncertainty Toolbox
Uncertainty in physical systems modeling can be categorized as irreducible or reducible [
22]. Irreducible uncertainty (i.e., variability, aleatory uncertainty) refers to the inherent randomness and variations in physical systems that are being modeled. Examples include variations in system geometric or material properties [
22]. Reducible uncertainty (i.e., epistemic uncertainty) refers to deficiencies that result from a lack of complete information about the system being modeled. An example is the statistical distribution of a system property that is estimated by a limited number of measurements, wherein uncertainty can be reduced with an increasing number of sample size [
22].
The safety-related comparison of the sites needs to address uncertainty that cannot be reduced with additional surface-based investigations, and three different types of irreducible uncertainty (Criteria Group 3): parametric uncertainties, conceptual uncertainties, and scenario uncertainties.
3.4.1. Parametric Uncertainty
Parametric uncertainties refer to inherent bandwidths of parameters, for example, those used as inputs in the performance assessment models. The variability in input parameters within these bandwidths can be propagated through numerical simulations to establish an expected variability of the simulation output quantities. In this paper, Monte Carlo simulation is used as a sampling-based propagation method [
23,
24,
25]. Sampling of input parameters is performed using Latin hypercube from normal, log-normal, or uniform probability distributions (
Table 1). The parameter best estimates and ranges are provided by integrated geological interpretation (or “geosynthesis”) of the deep borehole campaign data for the Opalinus Clay and over- and underlying units, and Nagra’s RD&D program for the EDZ, bentonite, and mortar materials [
20]. The perturbed parameters are the effective diffusion coefficient (D
e), hydraulic conductivity (K), thermal conductivity (λ), pore compressibility (C
p), and rock-grain specific heat (C
h).
For the assessments of the geological barrier, hydraulic conductivity and diffusion coefficients of the geological units are sampled from the reference, minimum, and maximum values provided by the geosynthesis of hydraulic packer testing and laboratory data from tests performed on cores. For the assessments of repository-induced effects, the thermal-hydraulic, two-phase couplings invoke a significantly larger set of uncertain parameters to be considered. To establish the most sensitive parameters among those, Morris screening [
26] has been performed using safety-relevant performance indicators in generic configurations of L/ILW and HLW repositories in the context of SGT Stage 2 [
12,
27,
28]. The selected sensitive parameters and their probability distributions used in the present analysis are given in
Table 1.
3.4.2. Conceptual Uncertainty
Conceptual uncertainties relate to the conceptualization of the physical system in the numerical model representation. Examples of these include boundary conditions related to the aquifer systems and site-specific hydrogeologic conditions, geometric approximations, and constitutive models used in the single-phase transport and two-phase flow and transport mathematical formulations.
The formulation most used in continuum models, including TOUGH2, is based on a representative elementary volume (REV) approach describing the fluid phase in terms of continuous density functions and the porous formations as media with effective transport properties like porosity, permeability, and diffusion coefficient. In cases where transport occurs only through the intact rock matrix, the classical formulation is invoked where formations are described as
single porosity porous media. The formations may be assigned homogenized (effective) transport properties, or heterogeneous spatial distributions of transport properties to represent their variability in space. For the latter, variogram analysis of geophysical logs conditioned to core mineralogical data is used to infer semi-empirical correlations and to simulate stochastic realizations of clay content, porosity, and hydraulic conductivity fields [
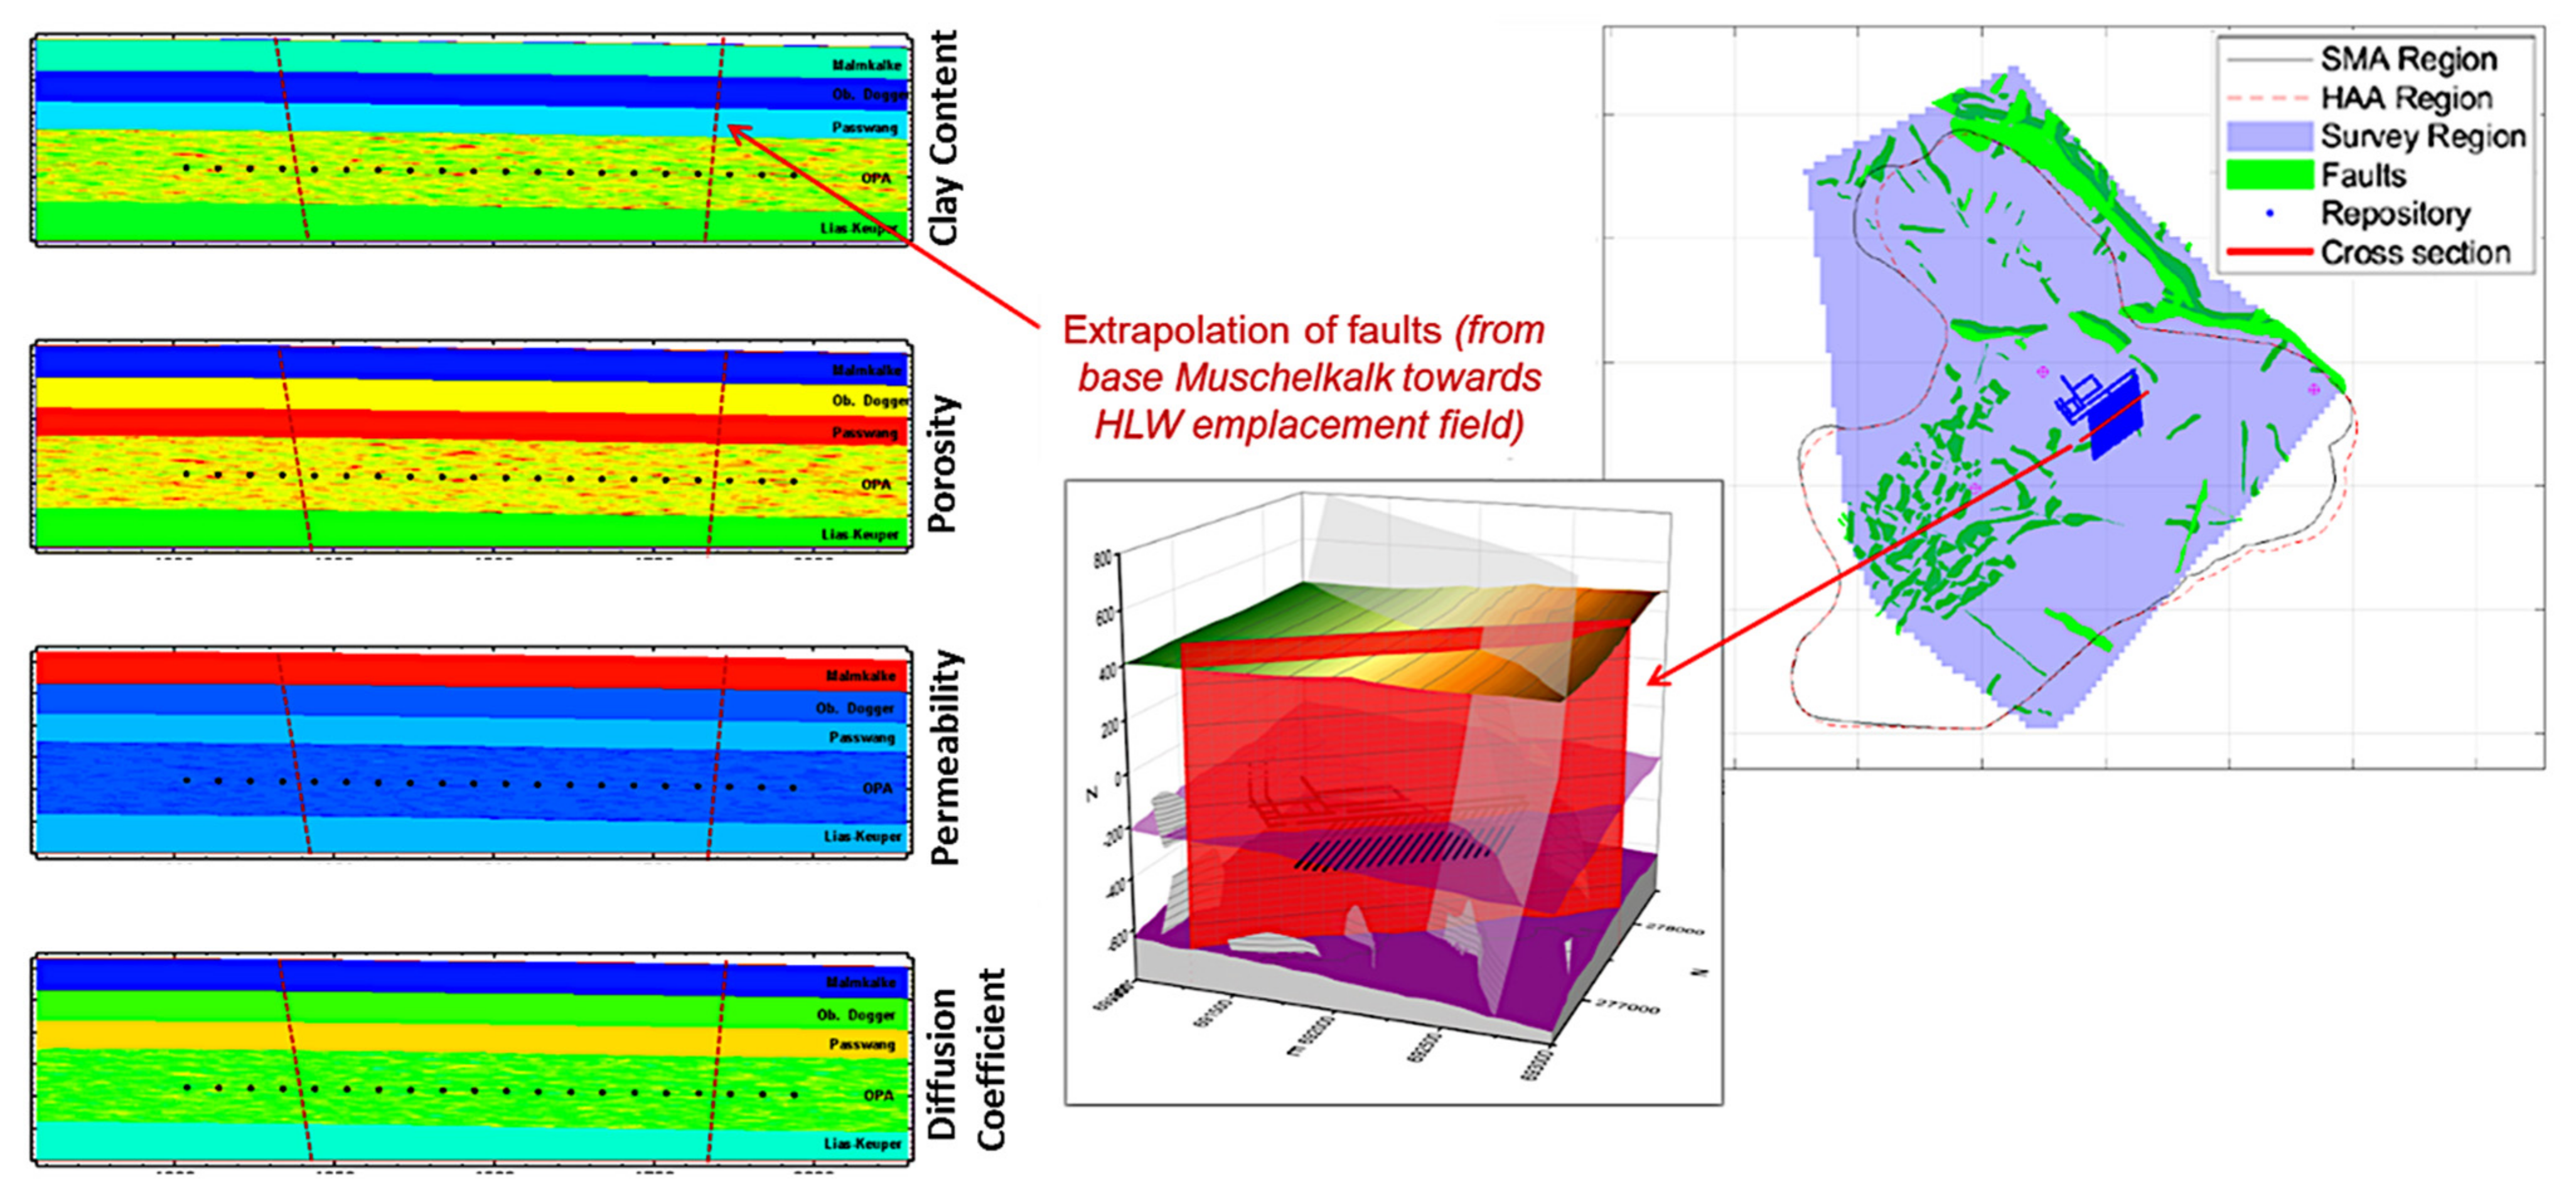
19]. Depending on the interpretation of the geophysical logging data (especially the variogram types and correlation lengths adopted in the analysis), different structures can be evaluated as part of the assessments targeting the spatial variability of facies properties (
Figure 6). In a similar fashion, discrete tectonic features, such as seismic faults, can be represented deterministically as materials resp. domains with different properties than the background geological formations. Note that fractures in clay-rich rocks are expected to demonstrate significant self-sealing behavior. However, the methodology presented in this study considers uncertainty related to release paths through pre-existing faults and fractures when self-sealing potential is lower, as well as any potential activation through perturbations from the geological repository (see also
Section 4.4,
Fault Activation Potential).
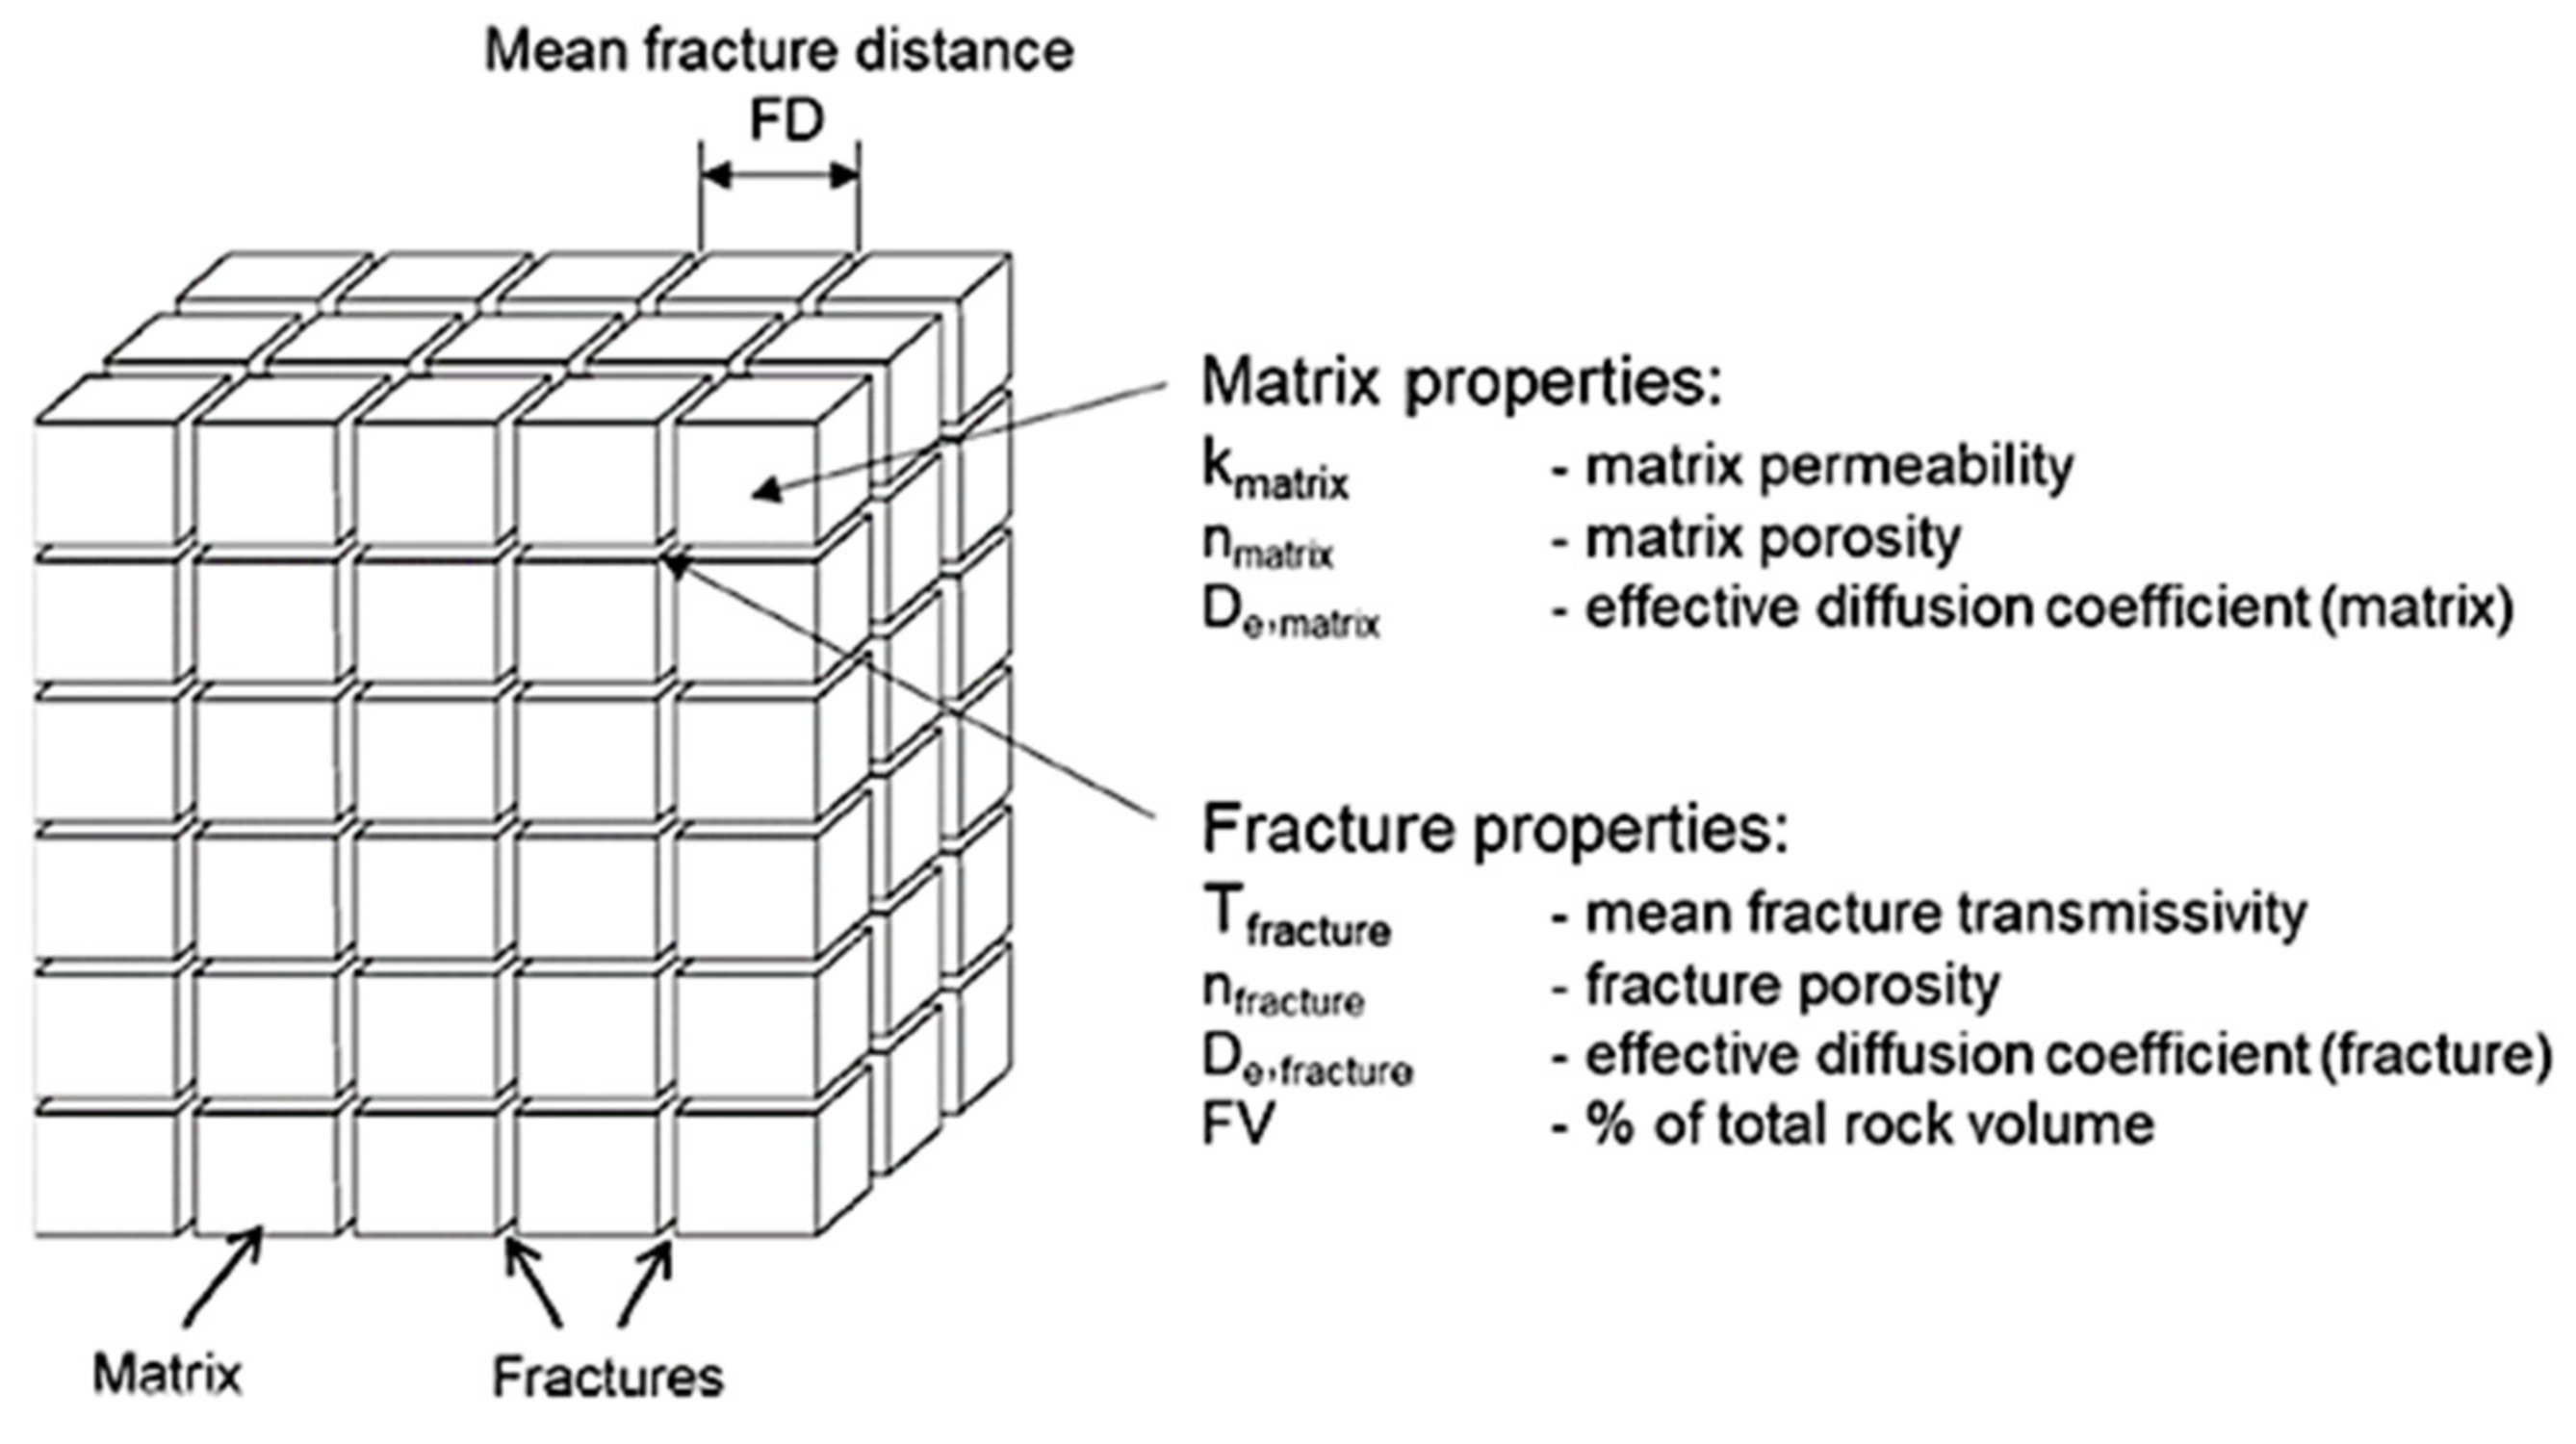
In cases where transport occurs through the rock matrix as well as along a network of tectonic features (e.g., sub-seismic faults) a
double porosity approach can be invoked to describe transport through the fractures, the rock matrix, and the mass exchange between fracture and matrix. To model double porosity phenomena, the MINC approach (multiple interacting continua) of the TOUGH family of codes is used [
9,
29,
30]. In this approach, depicted schematically in
Figure 7, the homogeneous matrix with a matrix permeability k
matrix and an effective diffusion coefficient D
e,matrix is intersected by a system of orthogonal fractures with a mean fracture distance FD [m], a mean fracture hydraulic conductivity K
fault [m/s], fracture porosity n
fault [-], and a fracture volume (% of the total rock volume). The user can specify the dimensions in which fracture and matrix flows take place. In the calculations presented in this report, it is assumed that fracture flow takes place vertically, whereas matrix flow occurs in all three directions.
Like the assessment of parametric uncertainty, Monte Carlo simulations using Latin hybercube sampling are used to evaluate conceptual uncertainty associated with tectonic overprint by modification of fracture distance and conductivity of sub-seismic faults (
Table 2). The parameter ranges are estimated from the synthesis of fluid logging and packer test data.
3.4.3. Scenario Uncertainty
Scenario uncertainties consider the possible scenarios in the geological long-term evolution of the siting regions. These include:
Ice age scenarios;
Overburden evolution (i.e., erosion and uplift scenarios);
Glacial deep erosion;
Fault activation scenarios due to erosion/uplift.
For practical reasons, the simulations addressing scenario uncertainty will not be described in detail.
4. Results
The site-specific performance assessments focus on the assessment aspects to be evaluated in the regulatory criteria. Each criteria group is addressed separately, although some overlap is inherent in the type of analyses performed so that some modeling activities address two or more criteria at the same time.
4.1. Barrier Performance
The geological barrier performance based on its characteristics today is assessed in terms of its horizontal and vertical spatial extent, the properties in terms of flow and transport, and the release paths along discrete features.
The first step of the site-specific performance assessments is the implementation of 3D models to evaluate potential locations of the HLW and L/ILW repositories at each site and associated horizontal extent of the
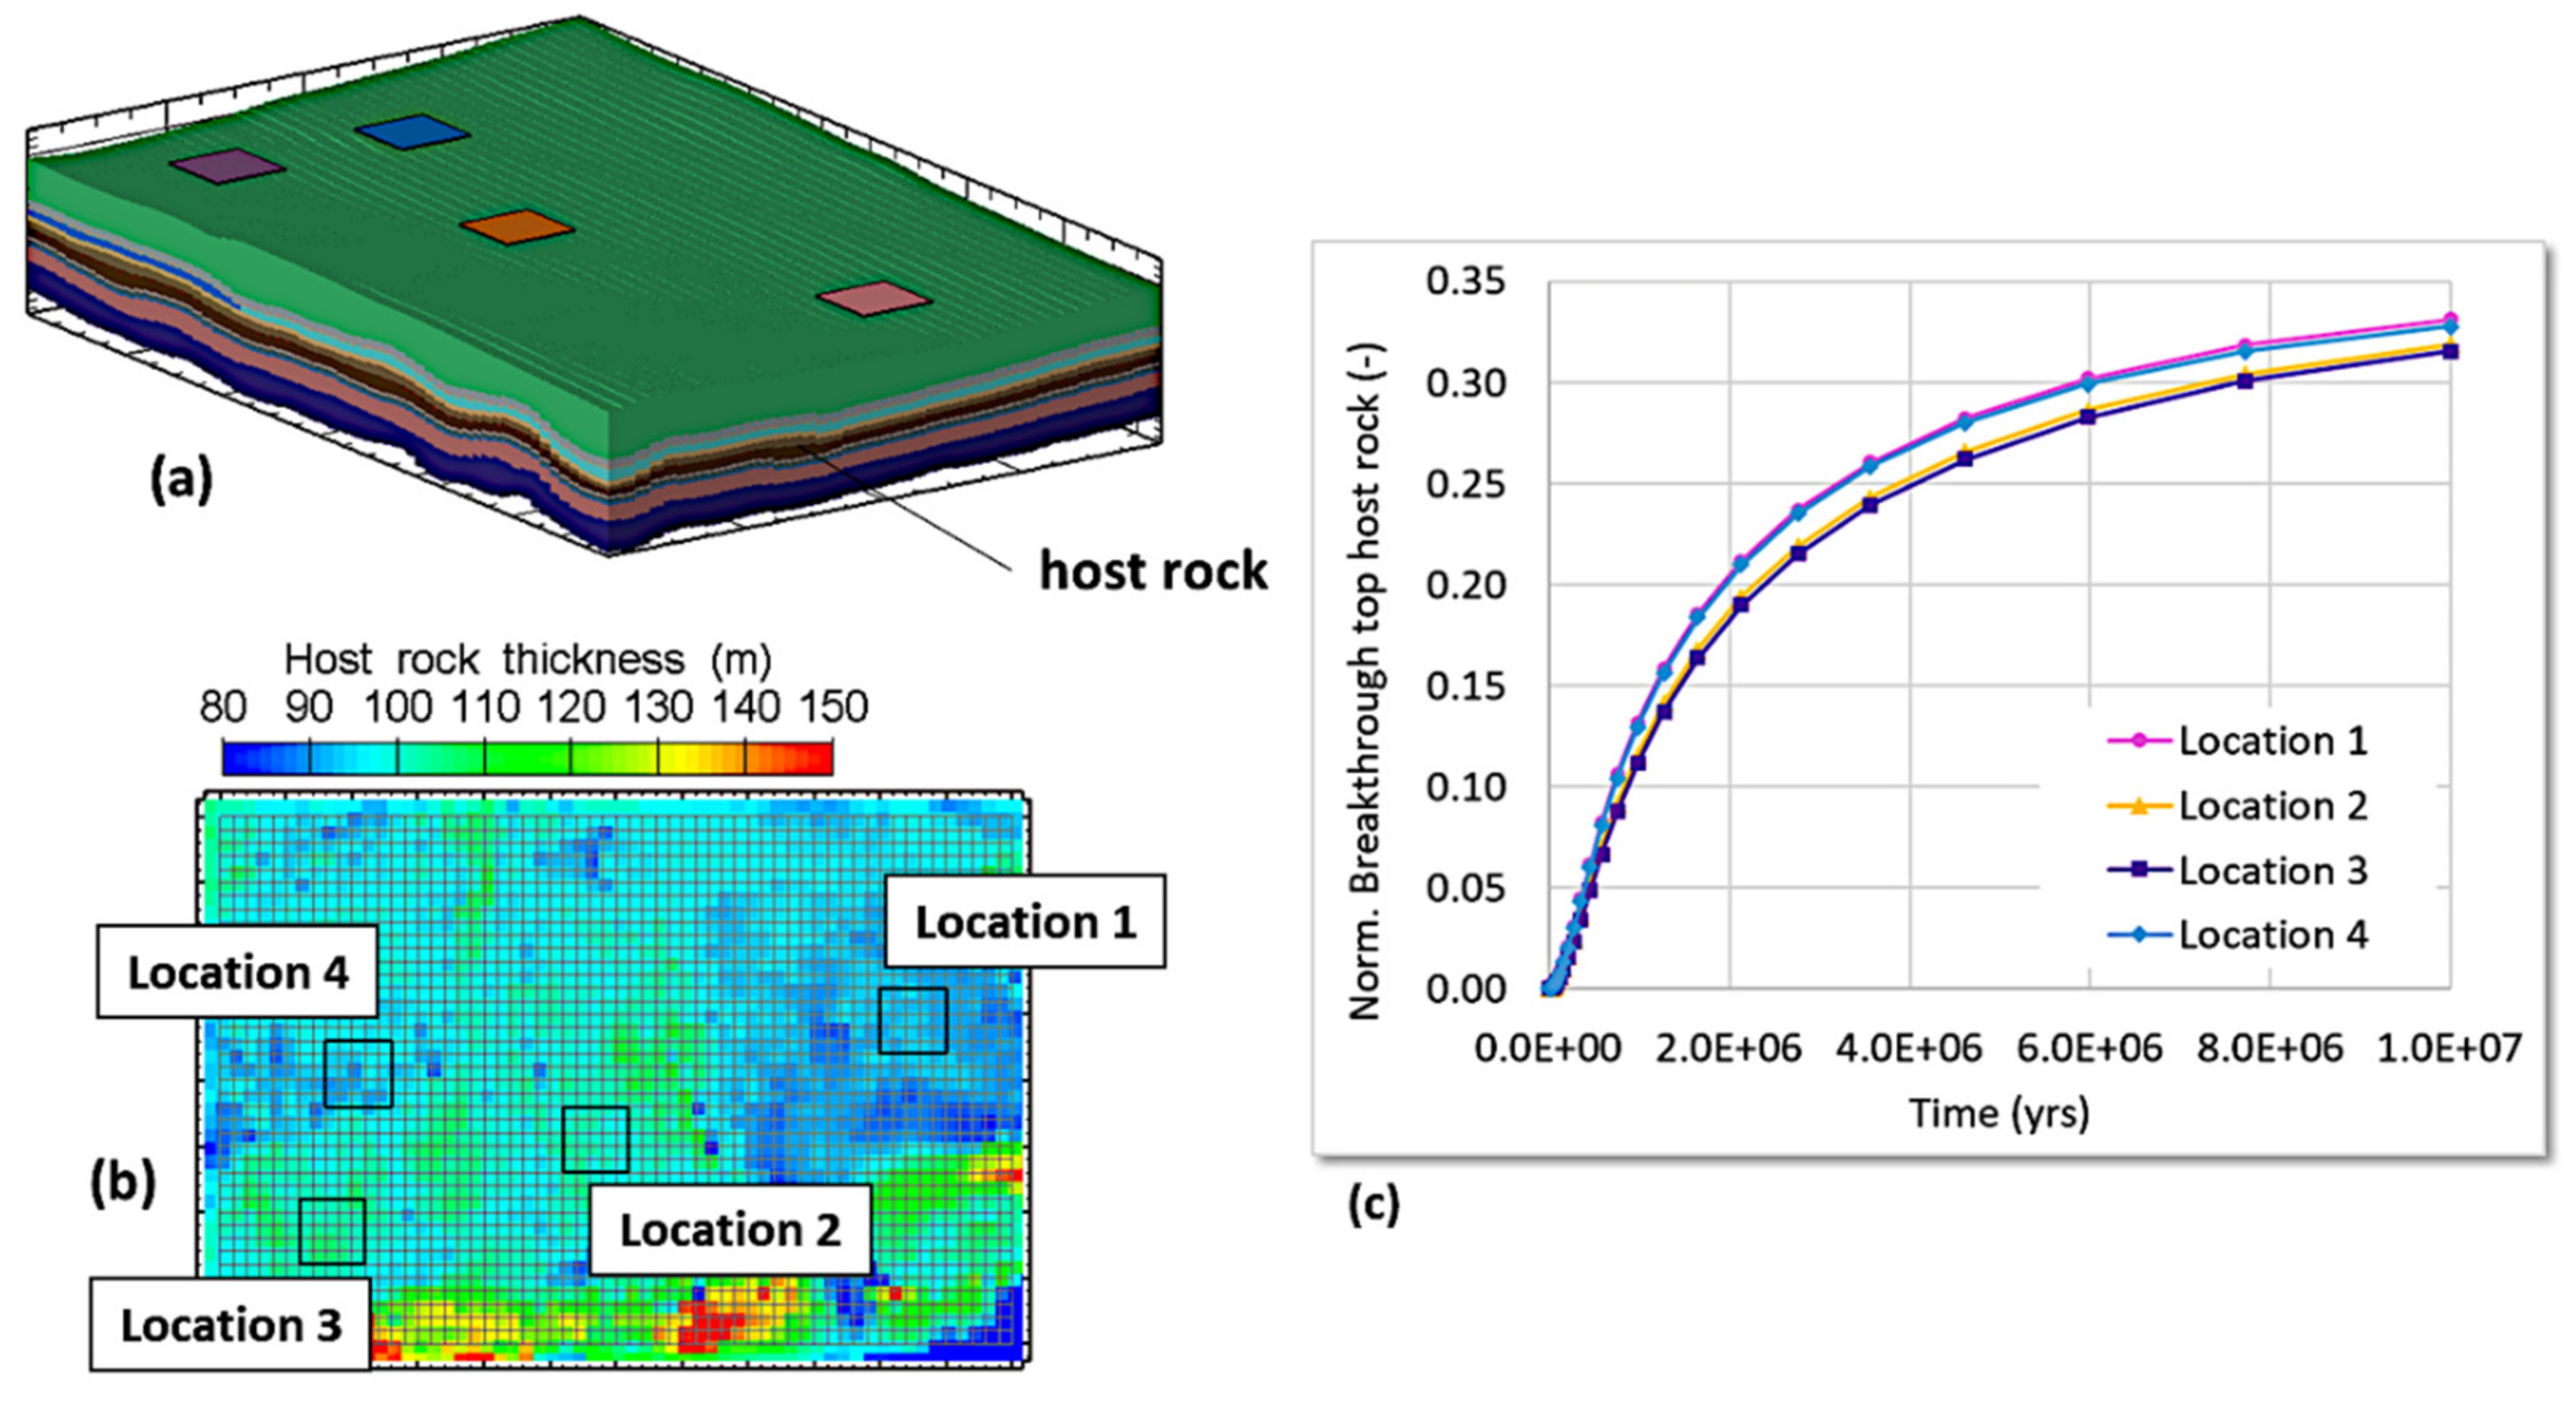
Effective Confinement Zone. The repository inside it is assumed to be at the middle of the Opalinus Clay host rock and is modeled as a constant tracer source term for a period of 10 million years. The reference scenario corresponds to tracer transport to the upper and lower confining units only through diffusion. An example is shown in
Figure 8 of four hypothetical locations within one siting region. Simulated tracer breakthrough curves to the upper/lower confining units are normalized with the tracer release rate at the repository (indicator “
Normalized Tracer Fluxes”). After 1 million years, which corresponds to the assessment period of the performance assessment, approximately 10% of the tracer has reached the upper confining units. After 10 million years, two of the exemplary locations (locations 1 and 4) result in approximately 2% higher breakthrough due to the lower thickness of the host rock at these locations (
Figure 8).
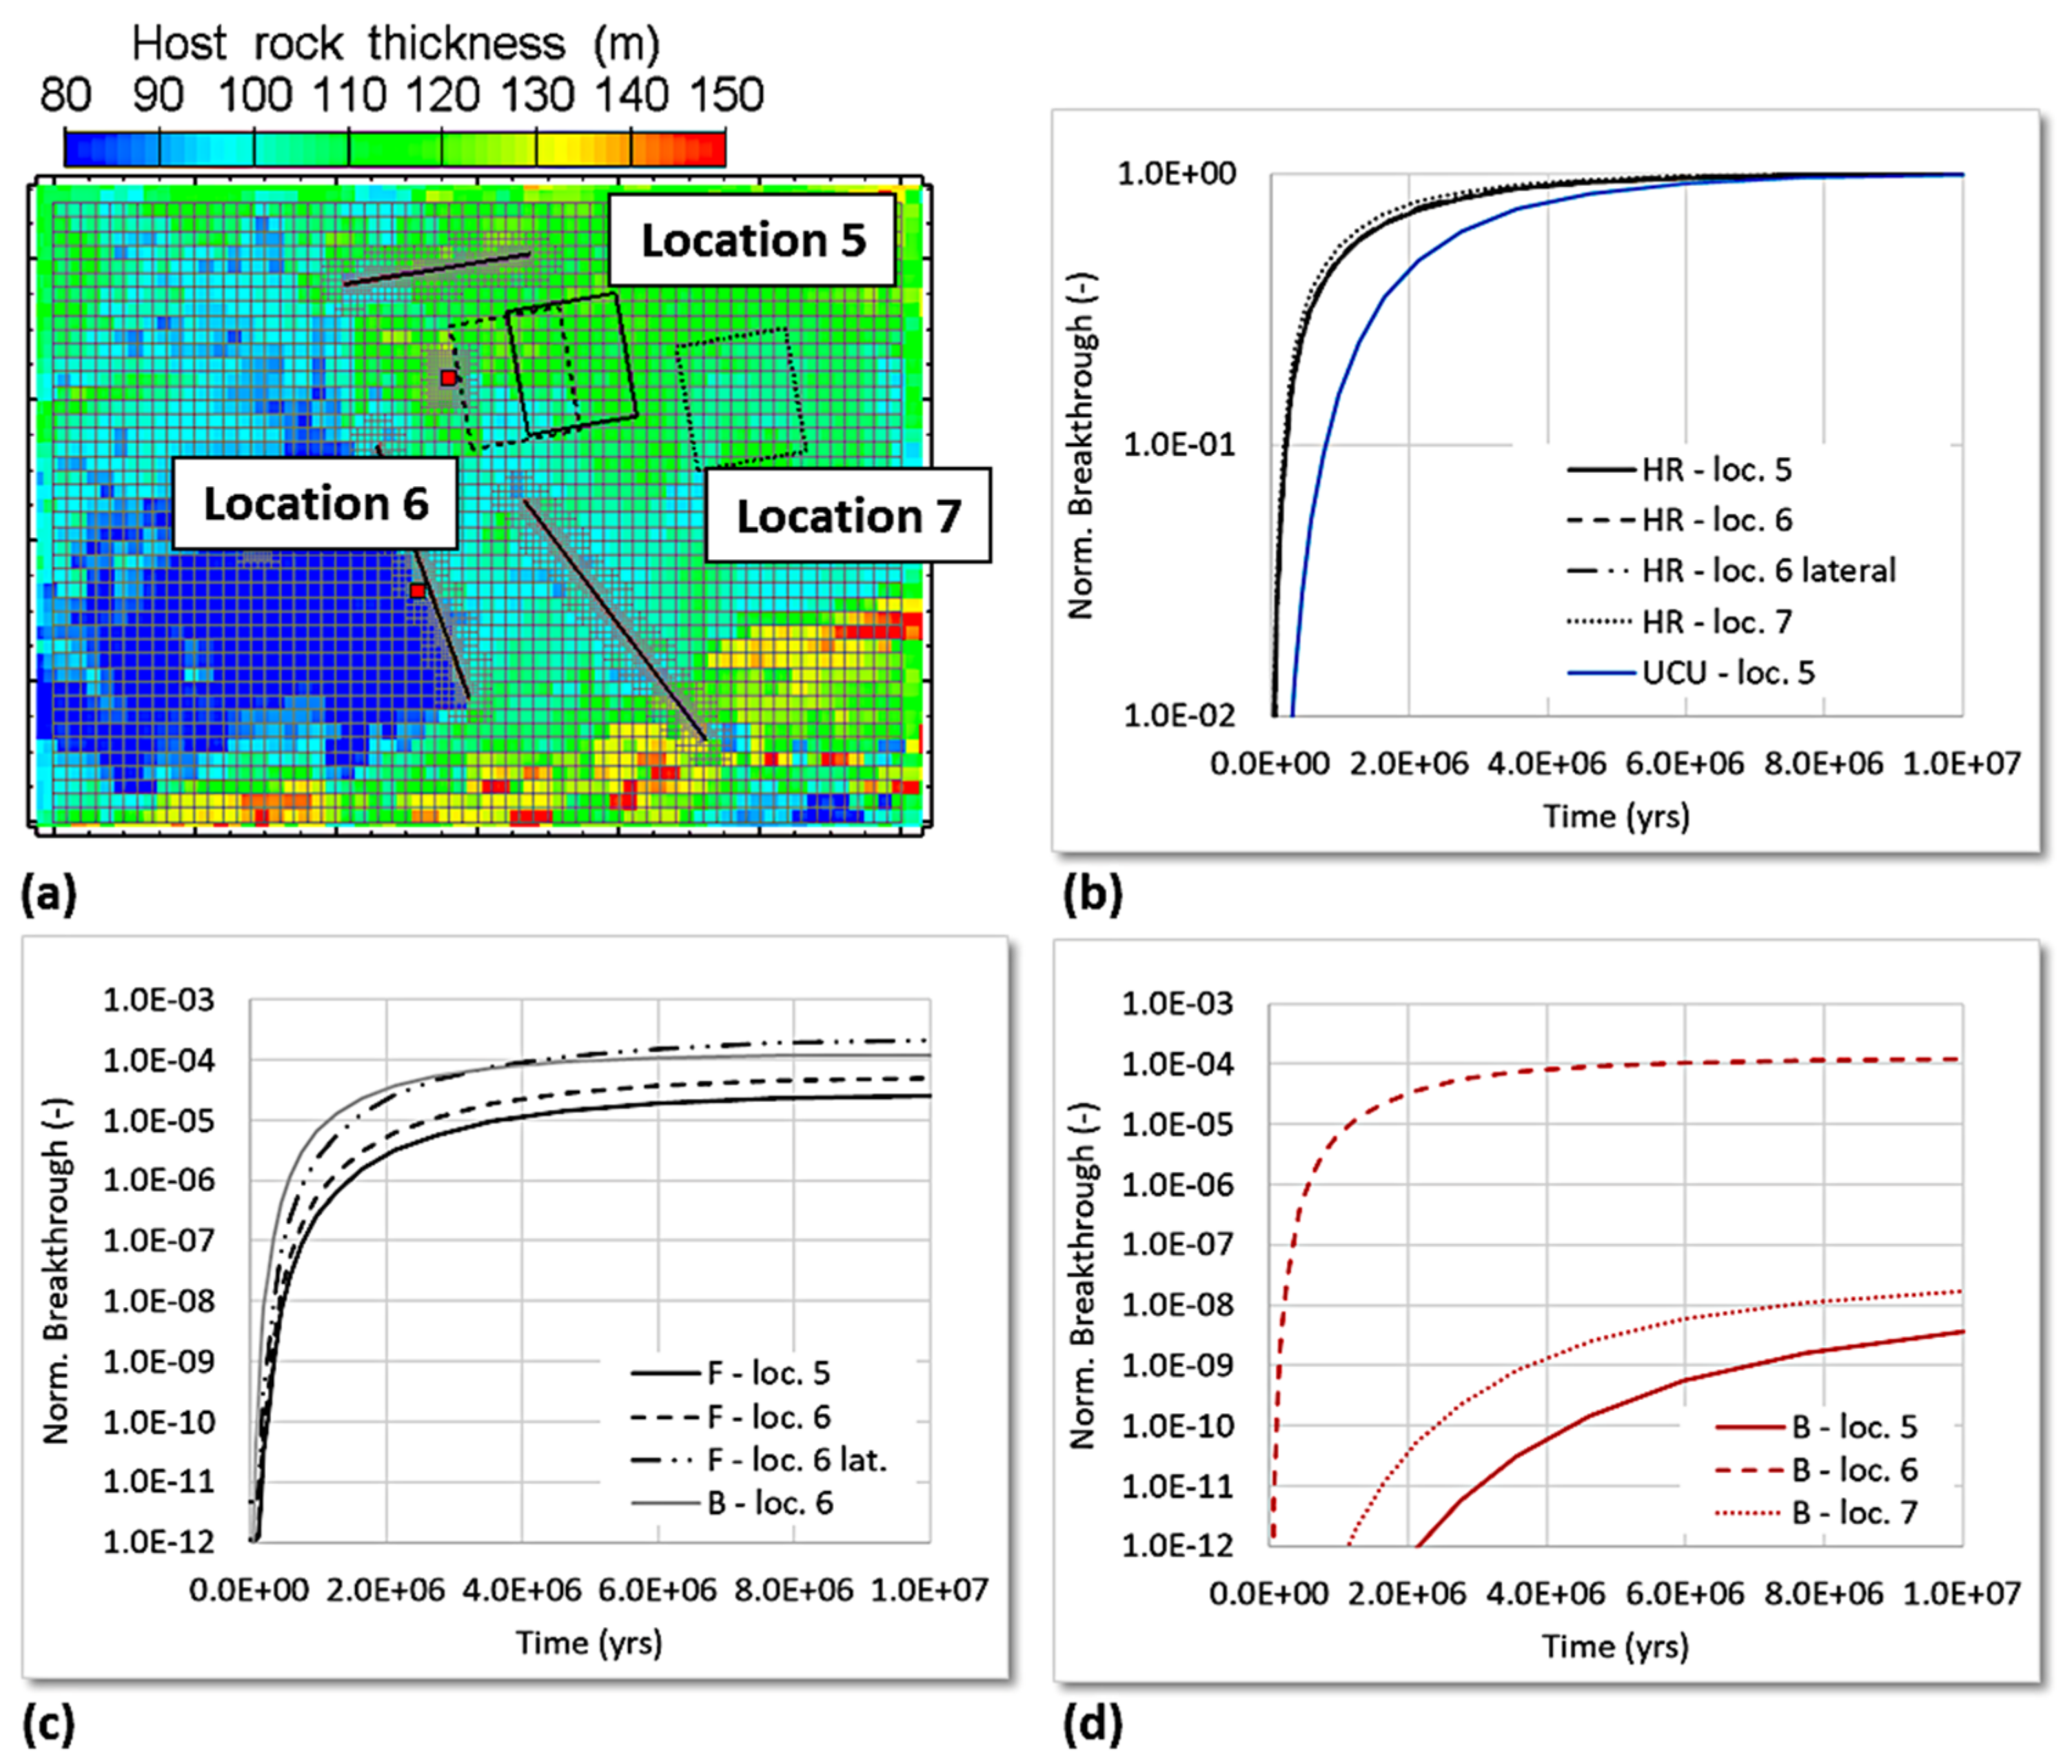
Additional assessment scenarios are performed deterministically for a range of variants related to the hydrogeologic conditions, including hydraulic gradients and the conductivities of the formations. These scenarios are evaluated with 3D models with nested refinement around detectable seismic faults and deep exploratory boreholes in the region (note that not all boreholes shown in the figures have been drilled). An example is shown in
Figure 9 of three hypothetical repository locations within one siting region. The simulations shown here assume a unit upflow hydraulic gradient imposed by the boundary conditions at the top and bottom of the stack of geological formations. The contribution of normalized tracer breakthrough to the upper confining units is illustrated separately for tracer release through faults (F—loc. 5/6), through the intact host rock (HR—loc. 5/6/7), and through boreholes (B—loc. 5/6/7). Additional variants with increased conductivity and lateral gradient imposed in the upper confining units from bottom-right to the shallower top-left part of the formation are shown in the same figure (F—loc. 6 lat., HR—loc. 6 lat.). The results show that, for all locations, the tracer is predominantly released through the intact host rock. Tracer release through faults and boreholes increases when the repository is moved closer to these discrete features but remains orders of magnitude lower for all variants where a minimum horizontal distance of 200 m from the repository is kept. In variants with lateral gradient imposed in the upper confining units, tracer release through the faults increases up to one order of magnitude but remains practically negligible compared to the total amount of tracer released at the repository. The tracer breakthrough from the host rock to the upper confining units is additionally compared to tracer breakthrough from the upper confining units to the overlying aquifer systems (
Figure 9b, UCU—loc. 5) to support the assessment of the vertical extent of the
Effective Confinement Zone. The comparison shows that (1) evaluation of breakthrough at the top of the host rock is more conservative in terms of release times, and (2) the tracer retained within the host rock during the assessment period of 1 million years is significantly higher than within the upper confining units.
Release paths through discrete seismic faults are additionally evaluated with 3D particle tracking simulations, as shown exemplarily in
Figure 10. For this, the velocity fields calculated with TOUGH2 at different time steps are imported in MODPATH [
31]. Variants using upflow and lateral gradients imposed at the model boundaries demonstrate that particles flow predominantly vertically through the host rock before reaching the faults through the more permeable upper confining units where horizontal flow velocities are higher. To evaluate the influence of the upper confining unit properties on the retention capacity of the
Effective Confinement Zone, additional site-specific 2D models are implemented at cross-sections through the repository using finer discretization in the host rock and the upper/lower confining units. Deterministic model variants demonstrate that the retention capacity of the host rock is significantly altered only for transmissivity and Darcy velocity values in the upper confining units that are unrealistically high based on the hydrogeological field data. Additional assessments with the 2D models are discussed in the probabilistic analyses presented in
Section 4.3.
4.2. Long-Term Repository Performance
The long-term repository performance depends on coupled processes that begin with the repository construction and may last through the entire assessment period. These include the formation of an EDZ around the tunnels during excavation, the depressurization and partial desaturation of the EDZ and surrounding host rock during ventilation of the repository tunnels, and the re-saturation with porewater after emplacement and backfilling of the repository structures which takes place concurrently with the generation of gas and heat in different sections of the repository.
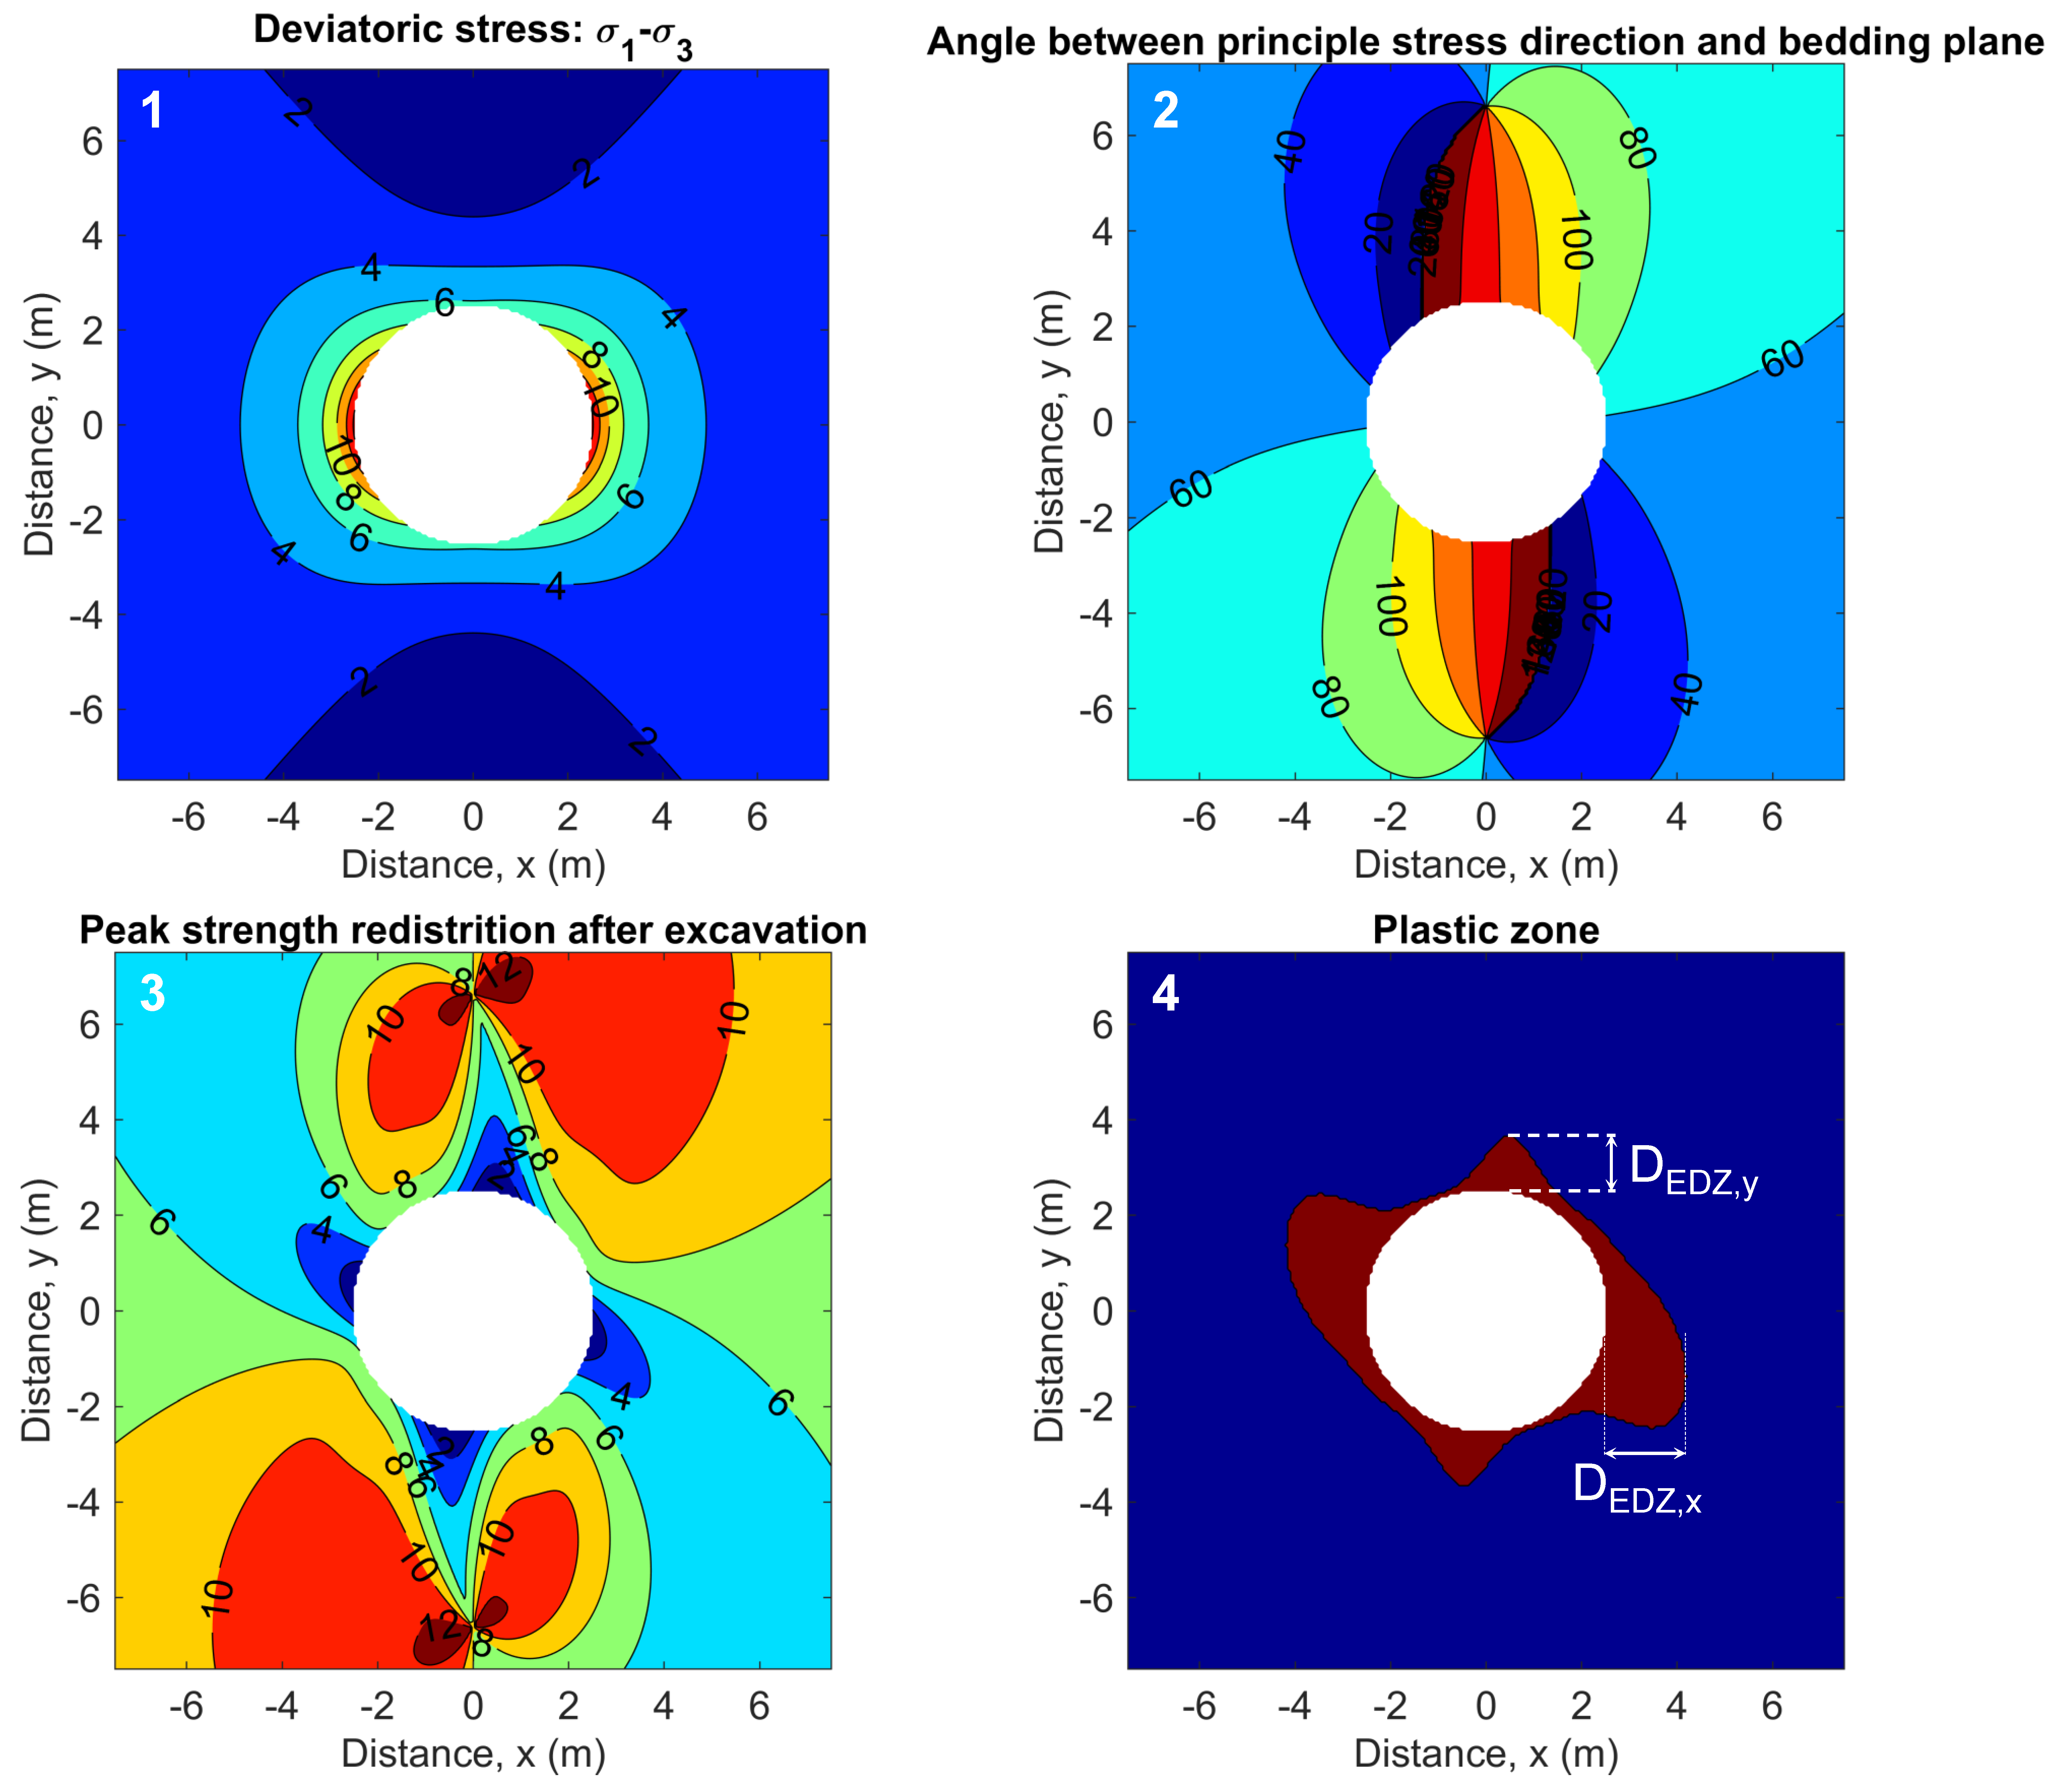
Modeling of the extent of the EDZ is performed through identification of the area of the plastification of the material around the tunnel. Two plasticity models are adopted: a Mohr–Coulomb model and a model from [
32] which accounts for the dependence of the orientation of the maximum principal stress direction for transversely isotropic rocks. The model computes the stress field after tunnel excavation, the angle between the bedding plane and the maximum principal stress (if the model from [
32] is adopted), the plastic potential with the chosen plasticity model, and finally the maximum EDZ extent in the horizontal and vertical directions. An example of the indicator “
EDZ thickness” is shown in
Figure 11.
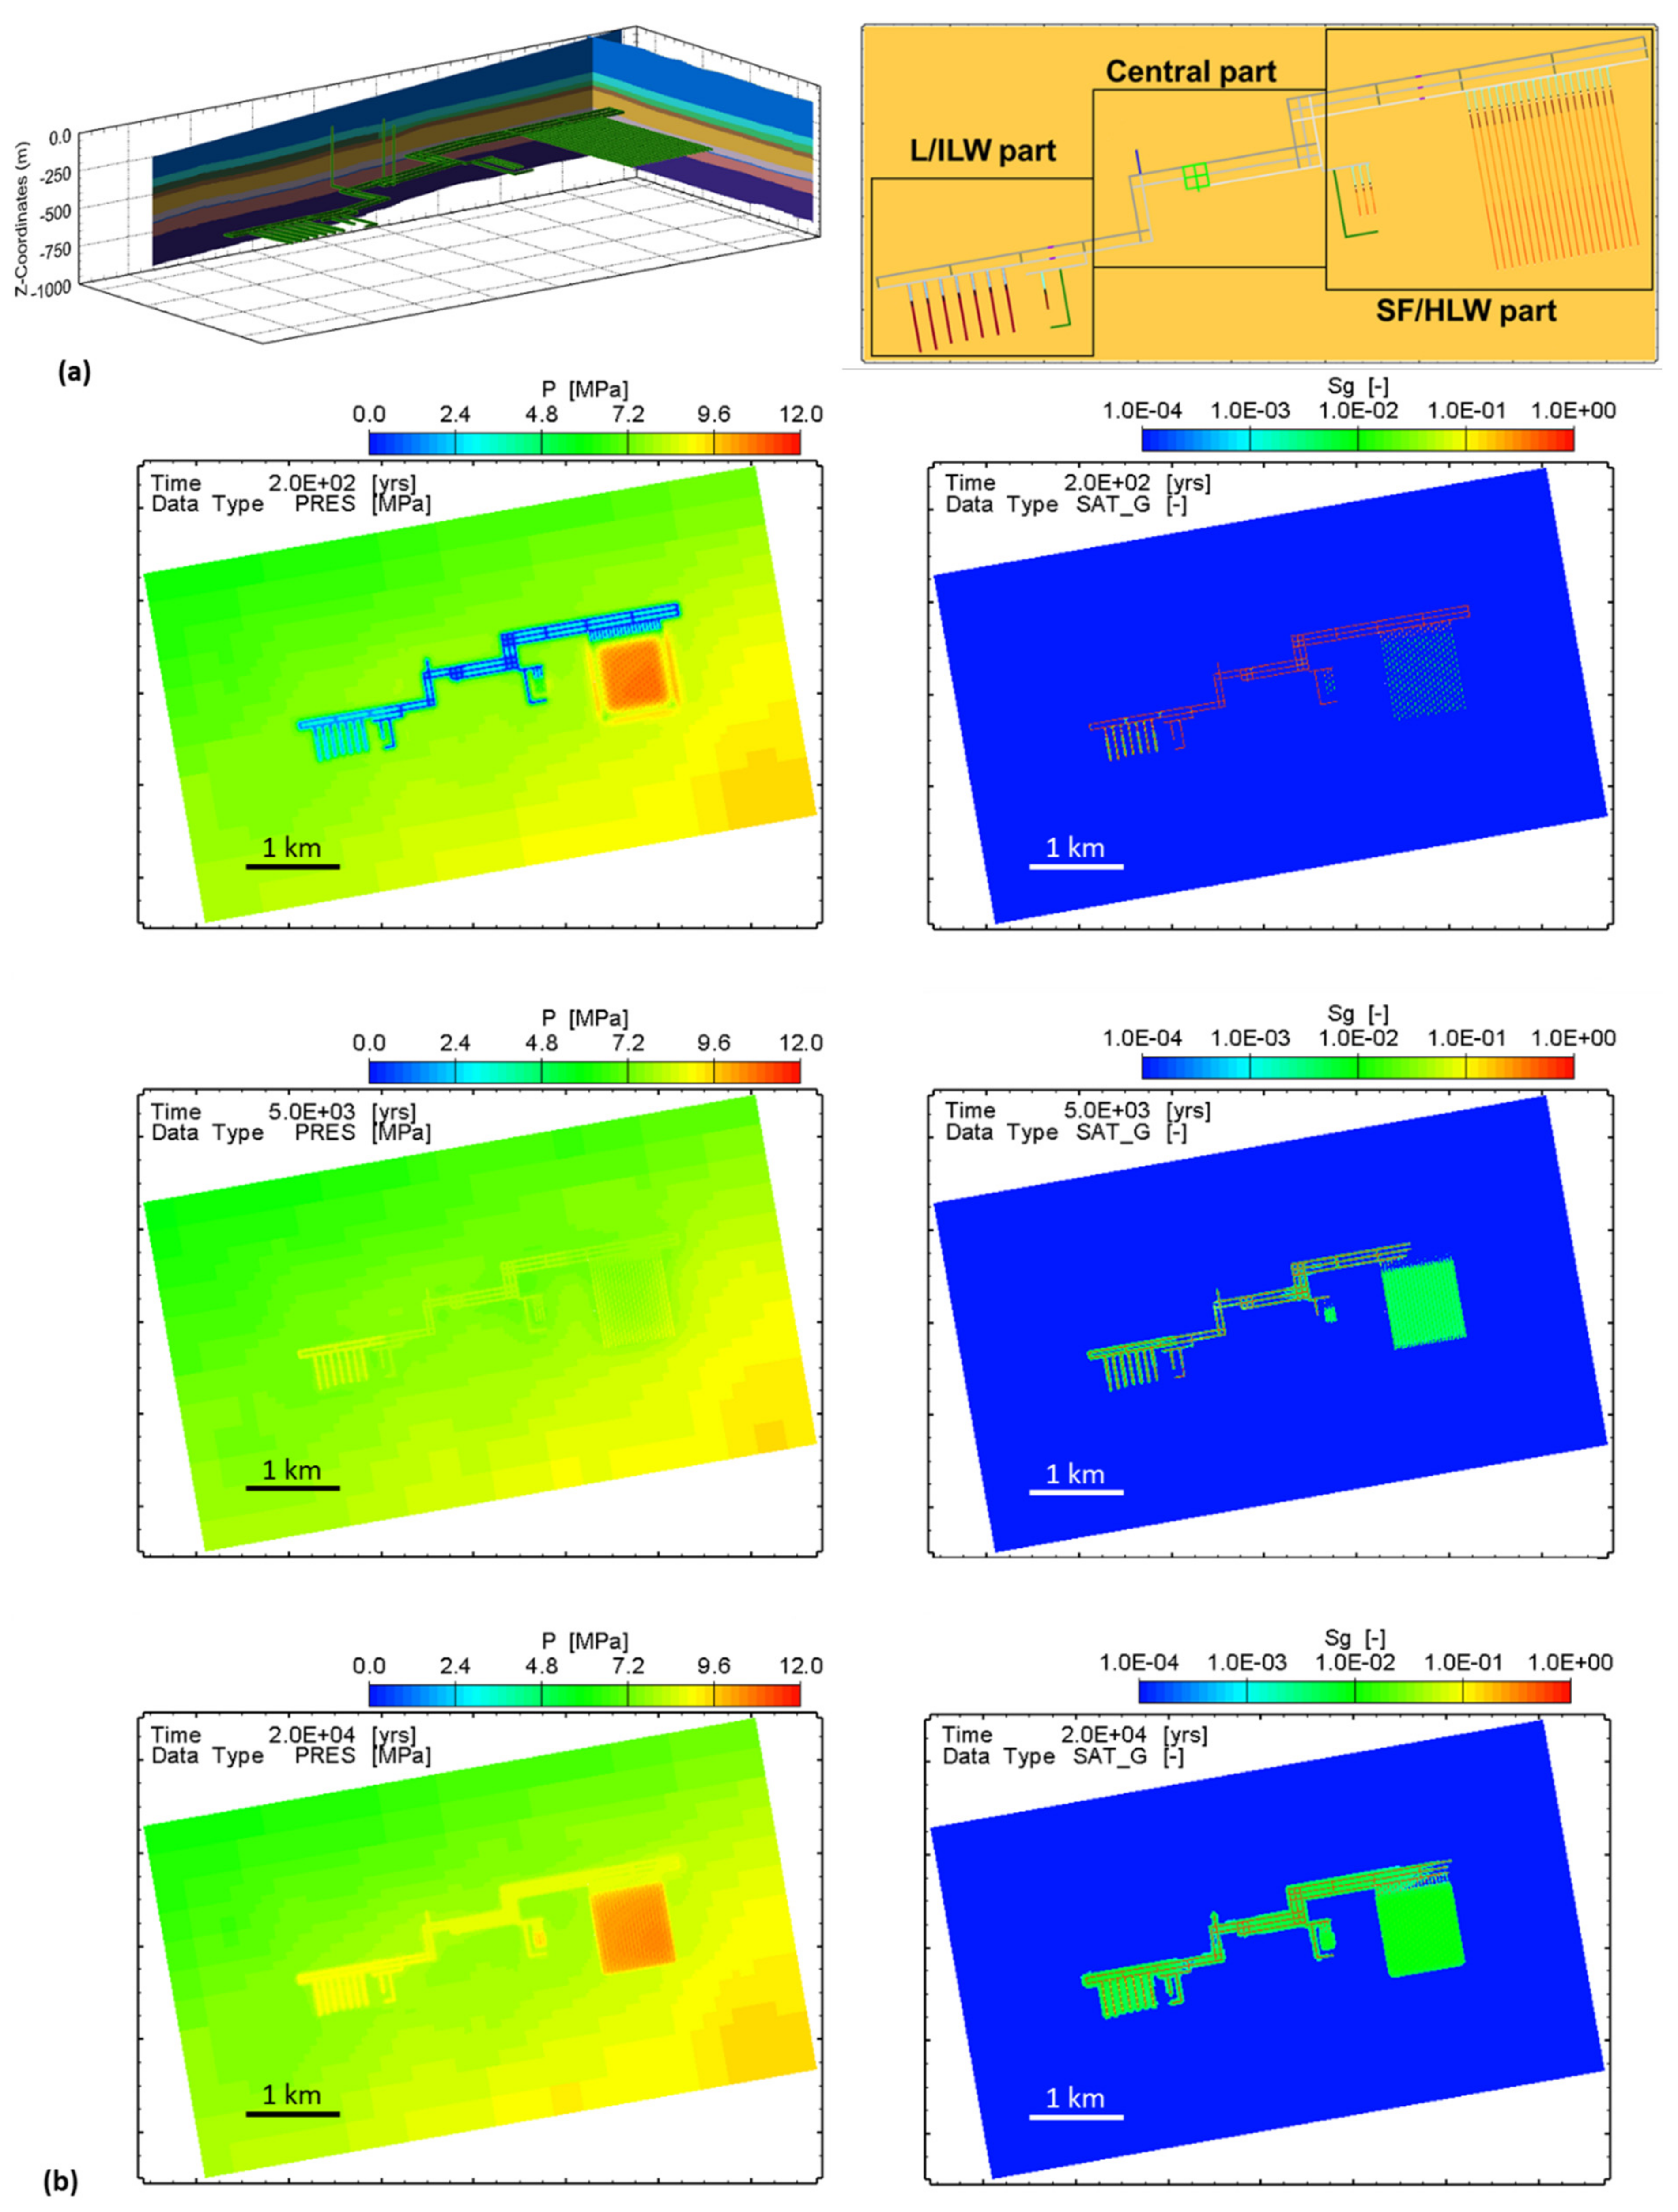
The EDZ is implemented in models of the repository with its components for gas and heat modeling as a homogenized material with the maximum extent expected for the site-specific conditions under consideration of relevant uncertainties. For each repository project, a site-scale repository model is constructed in 3D representing all tunnels of the repository, as shown exemplarily in
Figure 12a. The model accounts for different components of the repository. These include the emplacement rooms for HLW and L/ILW, the plugs at the entrance of the emplacement rooms (V1), the operations and ventilation galleries connected to the emplacement rooms through branch tunnels, the intermediate seals within the galleries (V2), the central area with the test facility, the pilot repositories for L/ILW and HLW, the shafts for access, operation, and ventilation of the repository, and the repository seals within the shafts (V3). The numerical simulations, performed with TOUGH3 [
33], account for the entire lifetime of the repository from construction to backfilling and a post-closure assessment period of 100,000 years.
Figure 12b shows exemplary calculations of pore pressure (indicators “
Calculated gas-induced overpressures” and “
Calculated heat induced porewater overpressures”) and gas saturation in the post-closure phase for a preliminary repository configuration. In the early phase after emplacement of the HLW, the pore pressure increases around the HLW emplacement tunnels due to the differential thermal expansion in the rock mass while the rest of the repository structures remain mostly underpressurized due to the preceding ventilation phases. After a few thousand years, the hydrogen released at waste sections has formed a gas phase that is continuous through most of the backfill and sealing system, enhancing dissolution in the porewater of the surrounding rock and thus limiting gas overpressure in the repository.
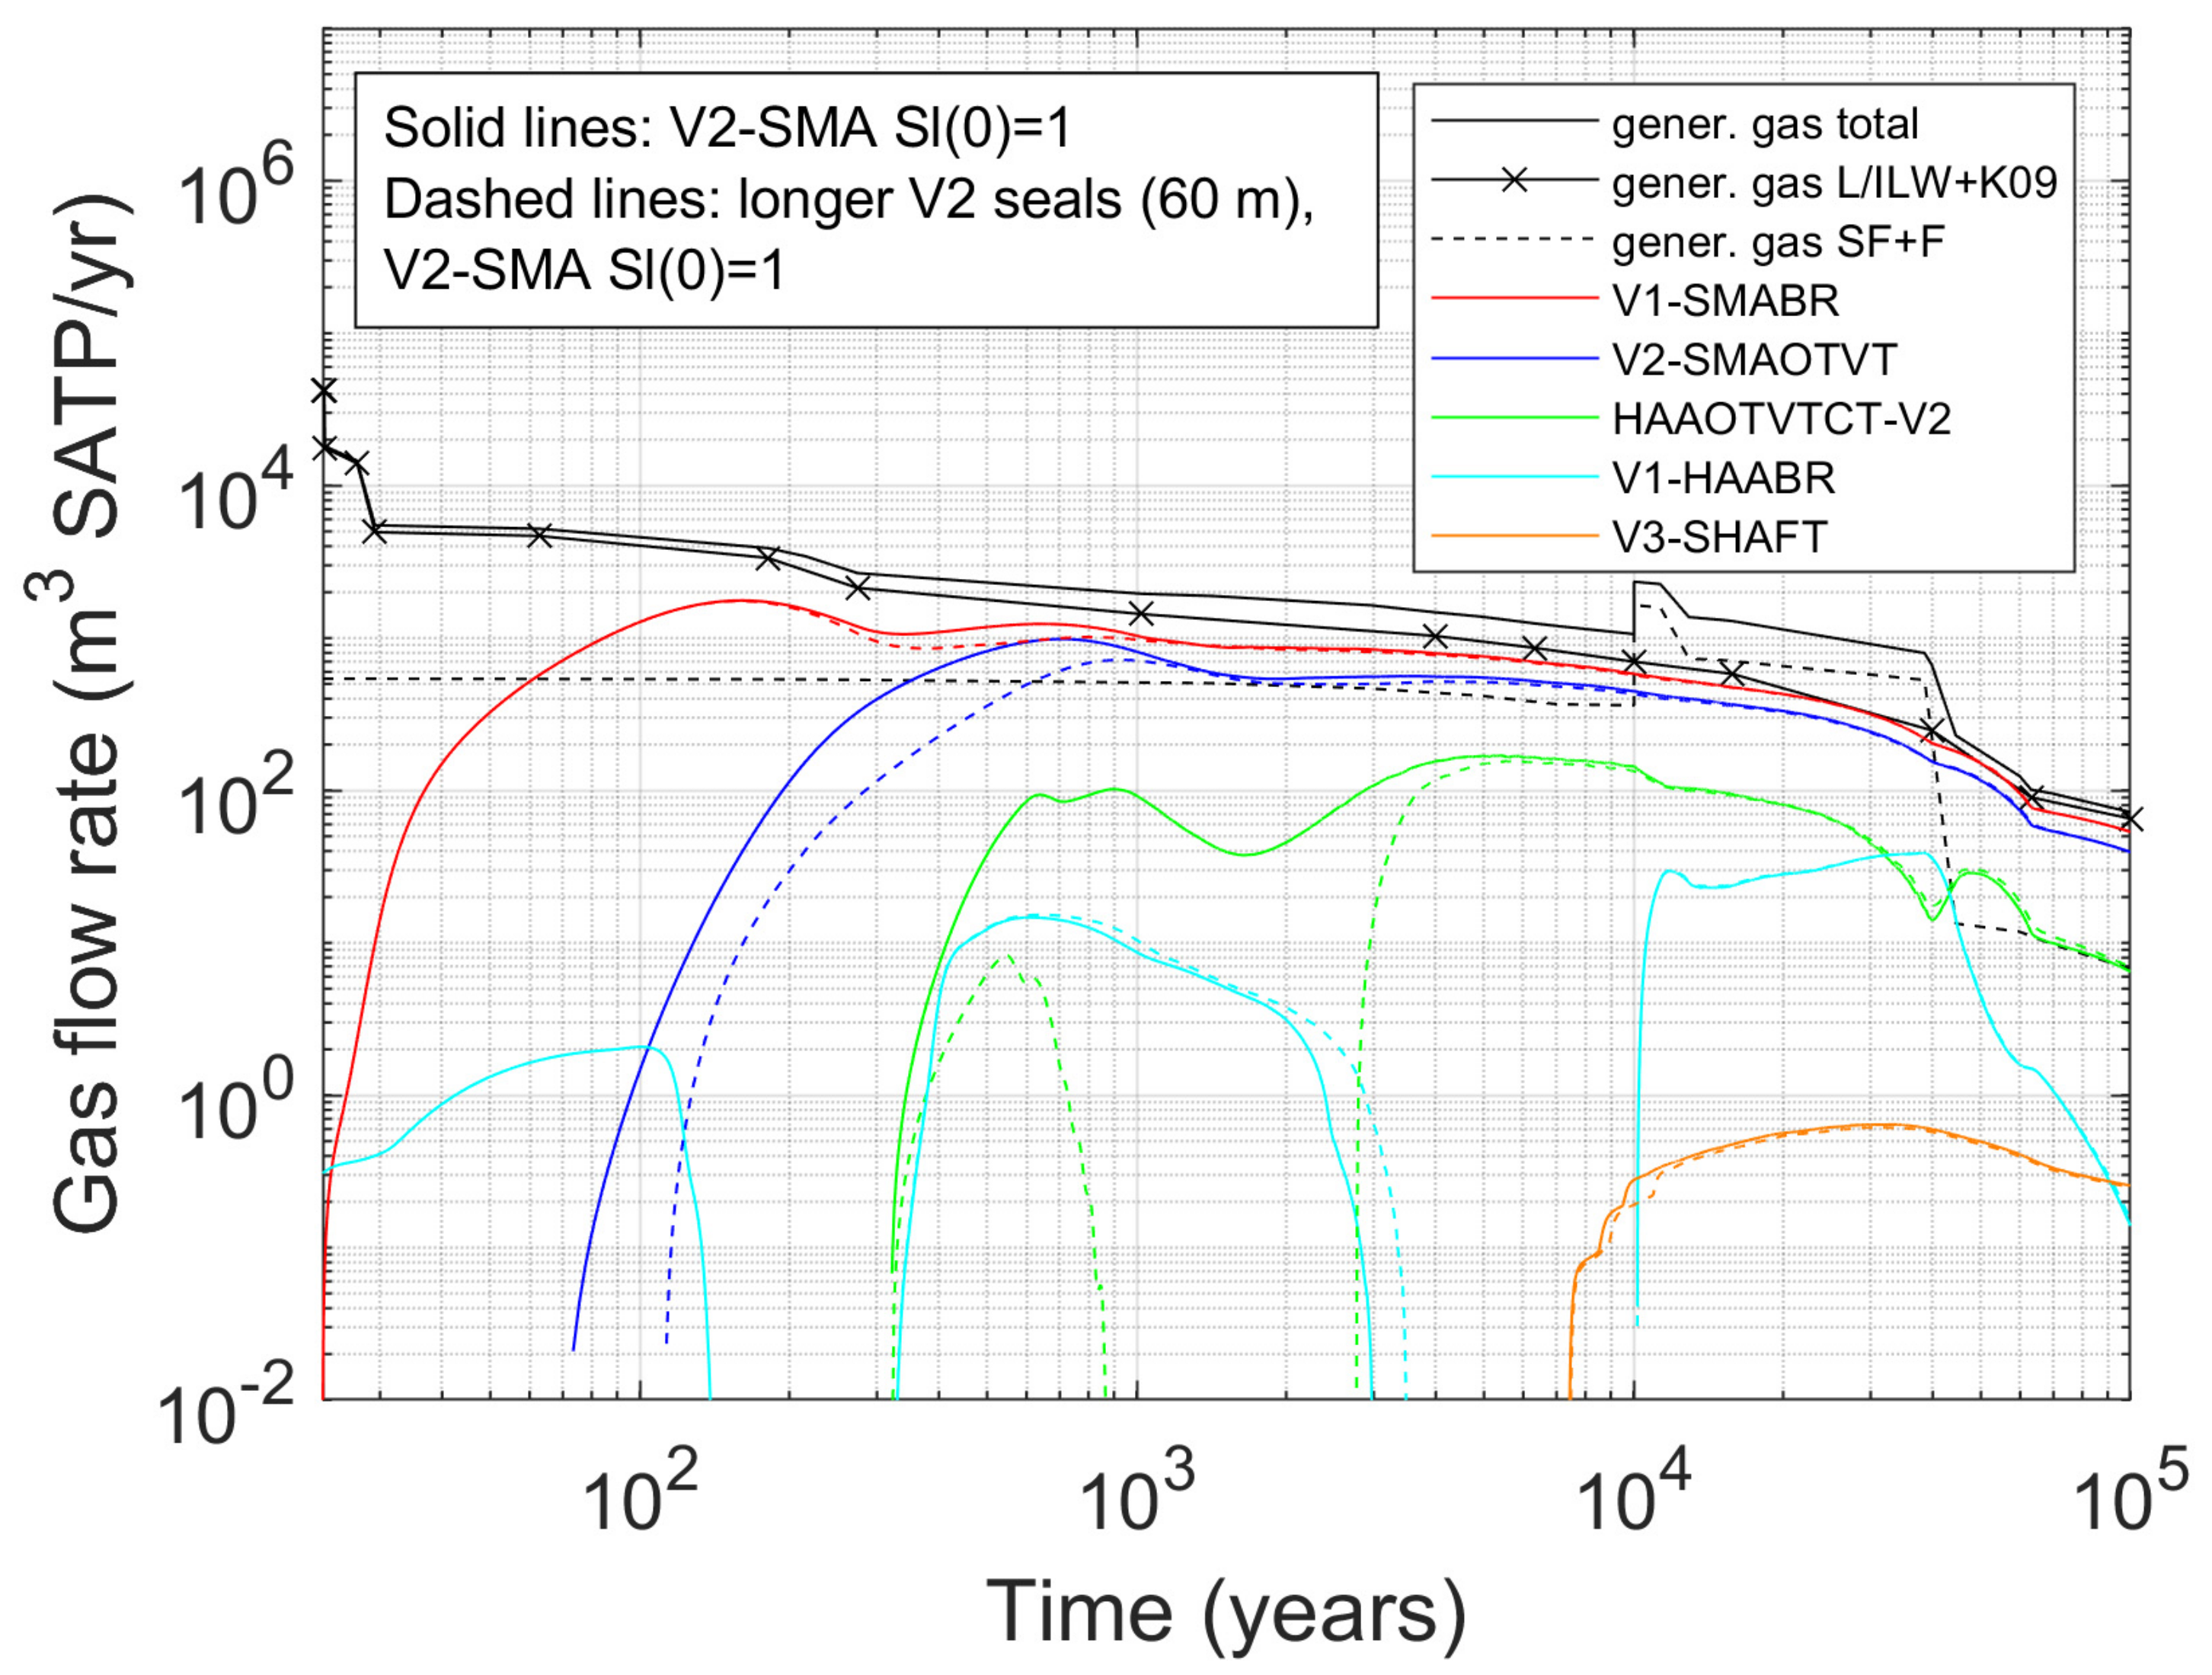
The 3D repository model is used to evaluate options related to the design, configuration, and timeline of the repository as well as scenarios on the evolution of the materials and engineered barriers. The model simulates gas, water, and heat fluxes in sufficient detail to evaluate system responses throughout the entire repository for any changes made in its components. An example is illustrated in
Figure 13 showing gas fluxes when changing the length of the V2 seal at the L/ILW repository.
Additional simulations that allow a more detailed appraisal of nearfield effects in the emplacement rooms are performed using site-specific 2D models of cross sections through the L/ILW and HLW repositories, with an example geometry depicted in
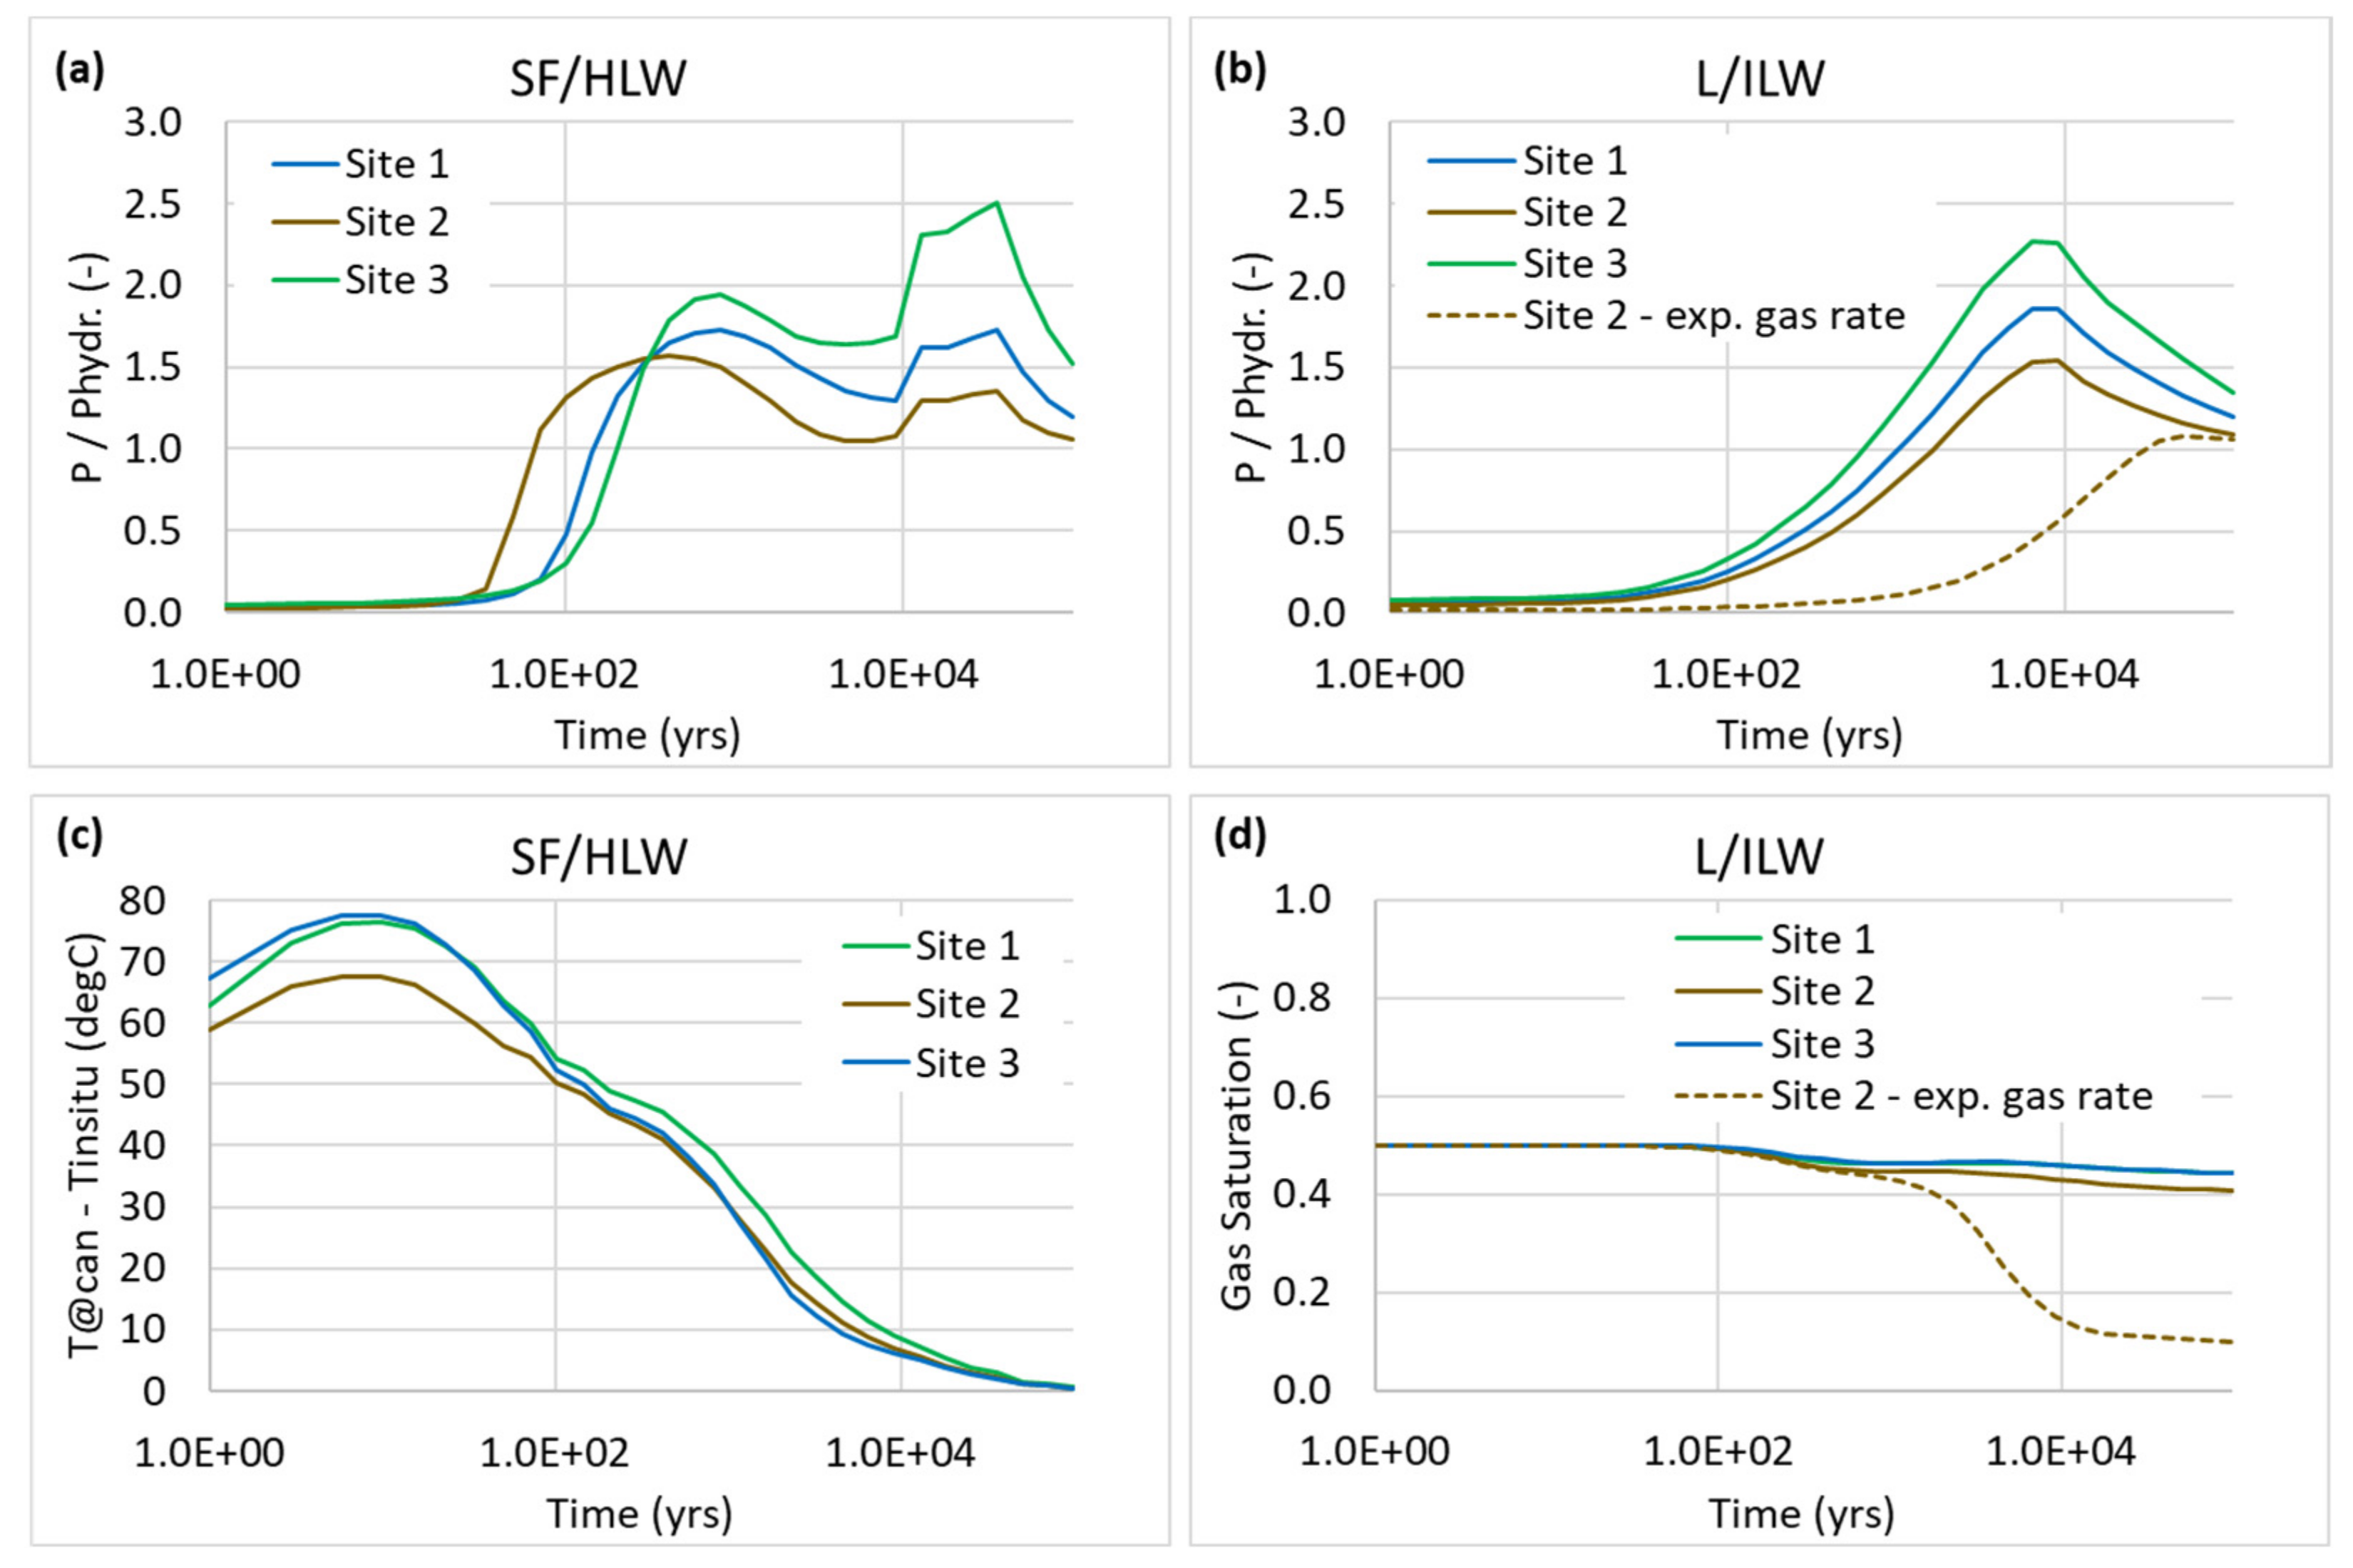
Figure 5b. A comparison between sites is illustrated in
Figure 14 in terms of pore pressure, temperature, and gas saturation at the HLW and L/ILW waste packages. Note that the reference scenario corresponds to the upper bound values of corrosion rates established in SGT—E2 [
10]. The pore pressure and saturation simulated for the expected corrosion rates are shown in the same figure exemplarily for one of the sites. These results indicate that pore pressure buildup can vary significantly between the candidate sites, constituting a potential differentiator in the site comparison. Additional results are presented in the probabilistic analyses discussed below.
4.3. Reliability of Geological Findings and Predictability of Long-Term Evolution
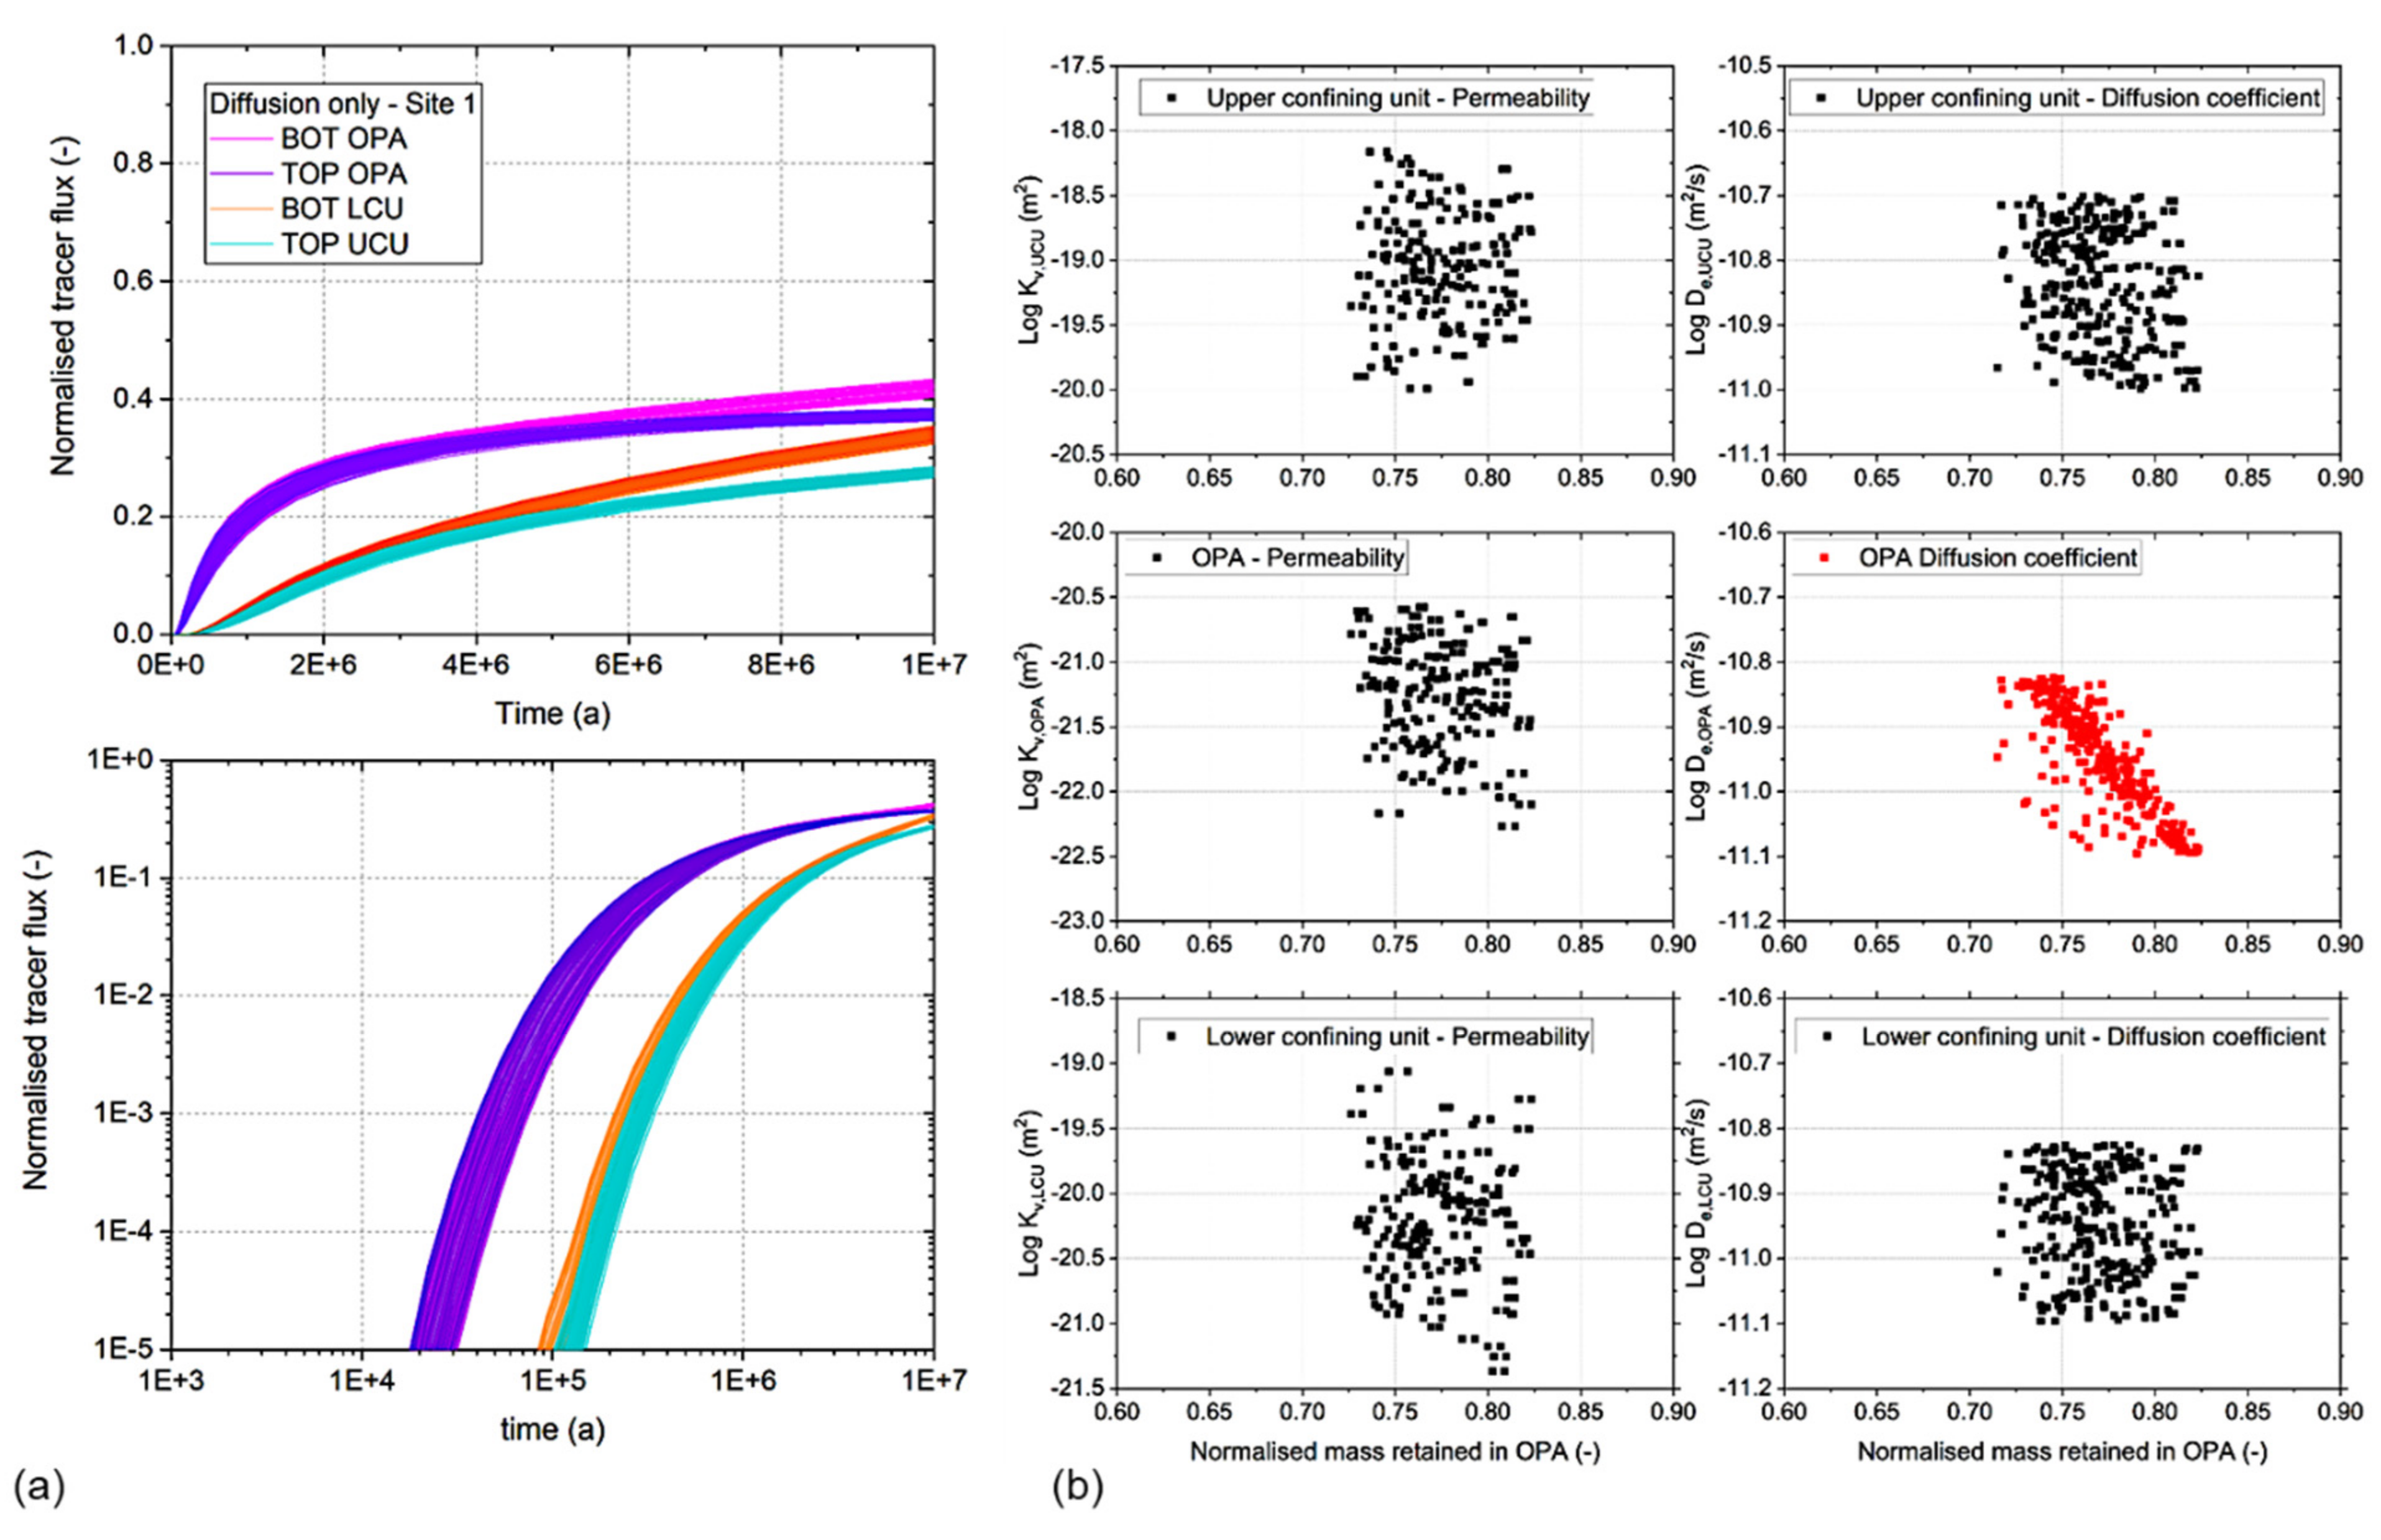
The probabilistic appraisal supports performance assessments of the geological barrier for the range of irreducible uncertainties identified in the hydrogeologic data. Monte Carlo simulations of tracer release at repository locations for the reference scenario (diffusion only) provide the bandwidth of tracer breakthroughs and tracer mass retained in the host rock (indicator “
Retained tracer mass in host rock and confining units”), respectively (
Figure 15a). Cross plots between retained mass and all perturbed input parameters demonstrate a strong correlation to the diffusion coefficient of the Opalinus Clay host rock, whereas transport properties of the upper and lower confining units are shown to be practically irrelevant.
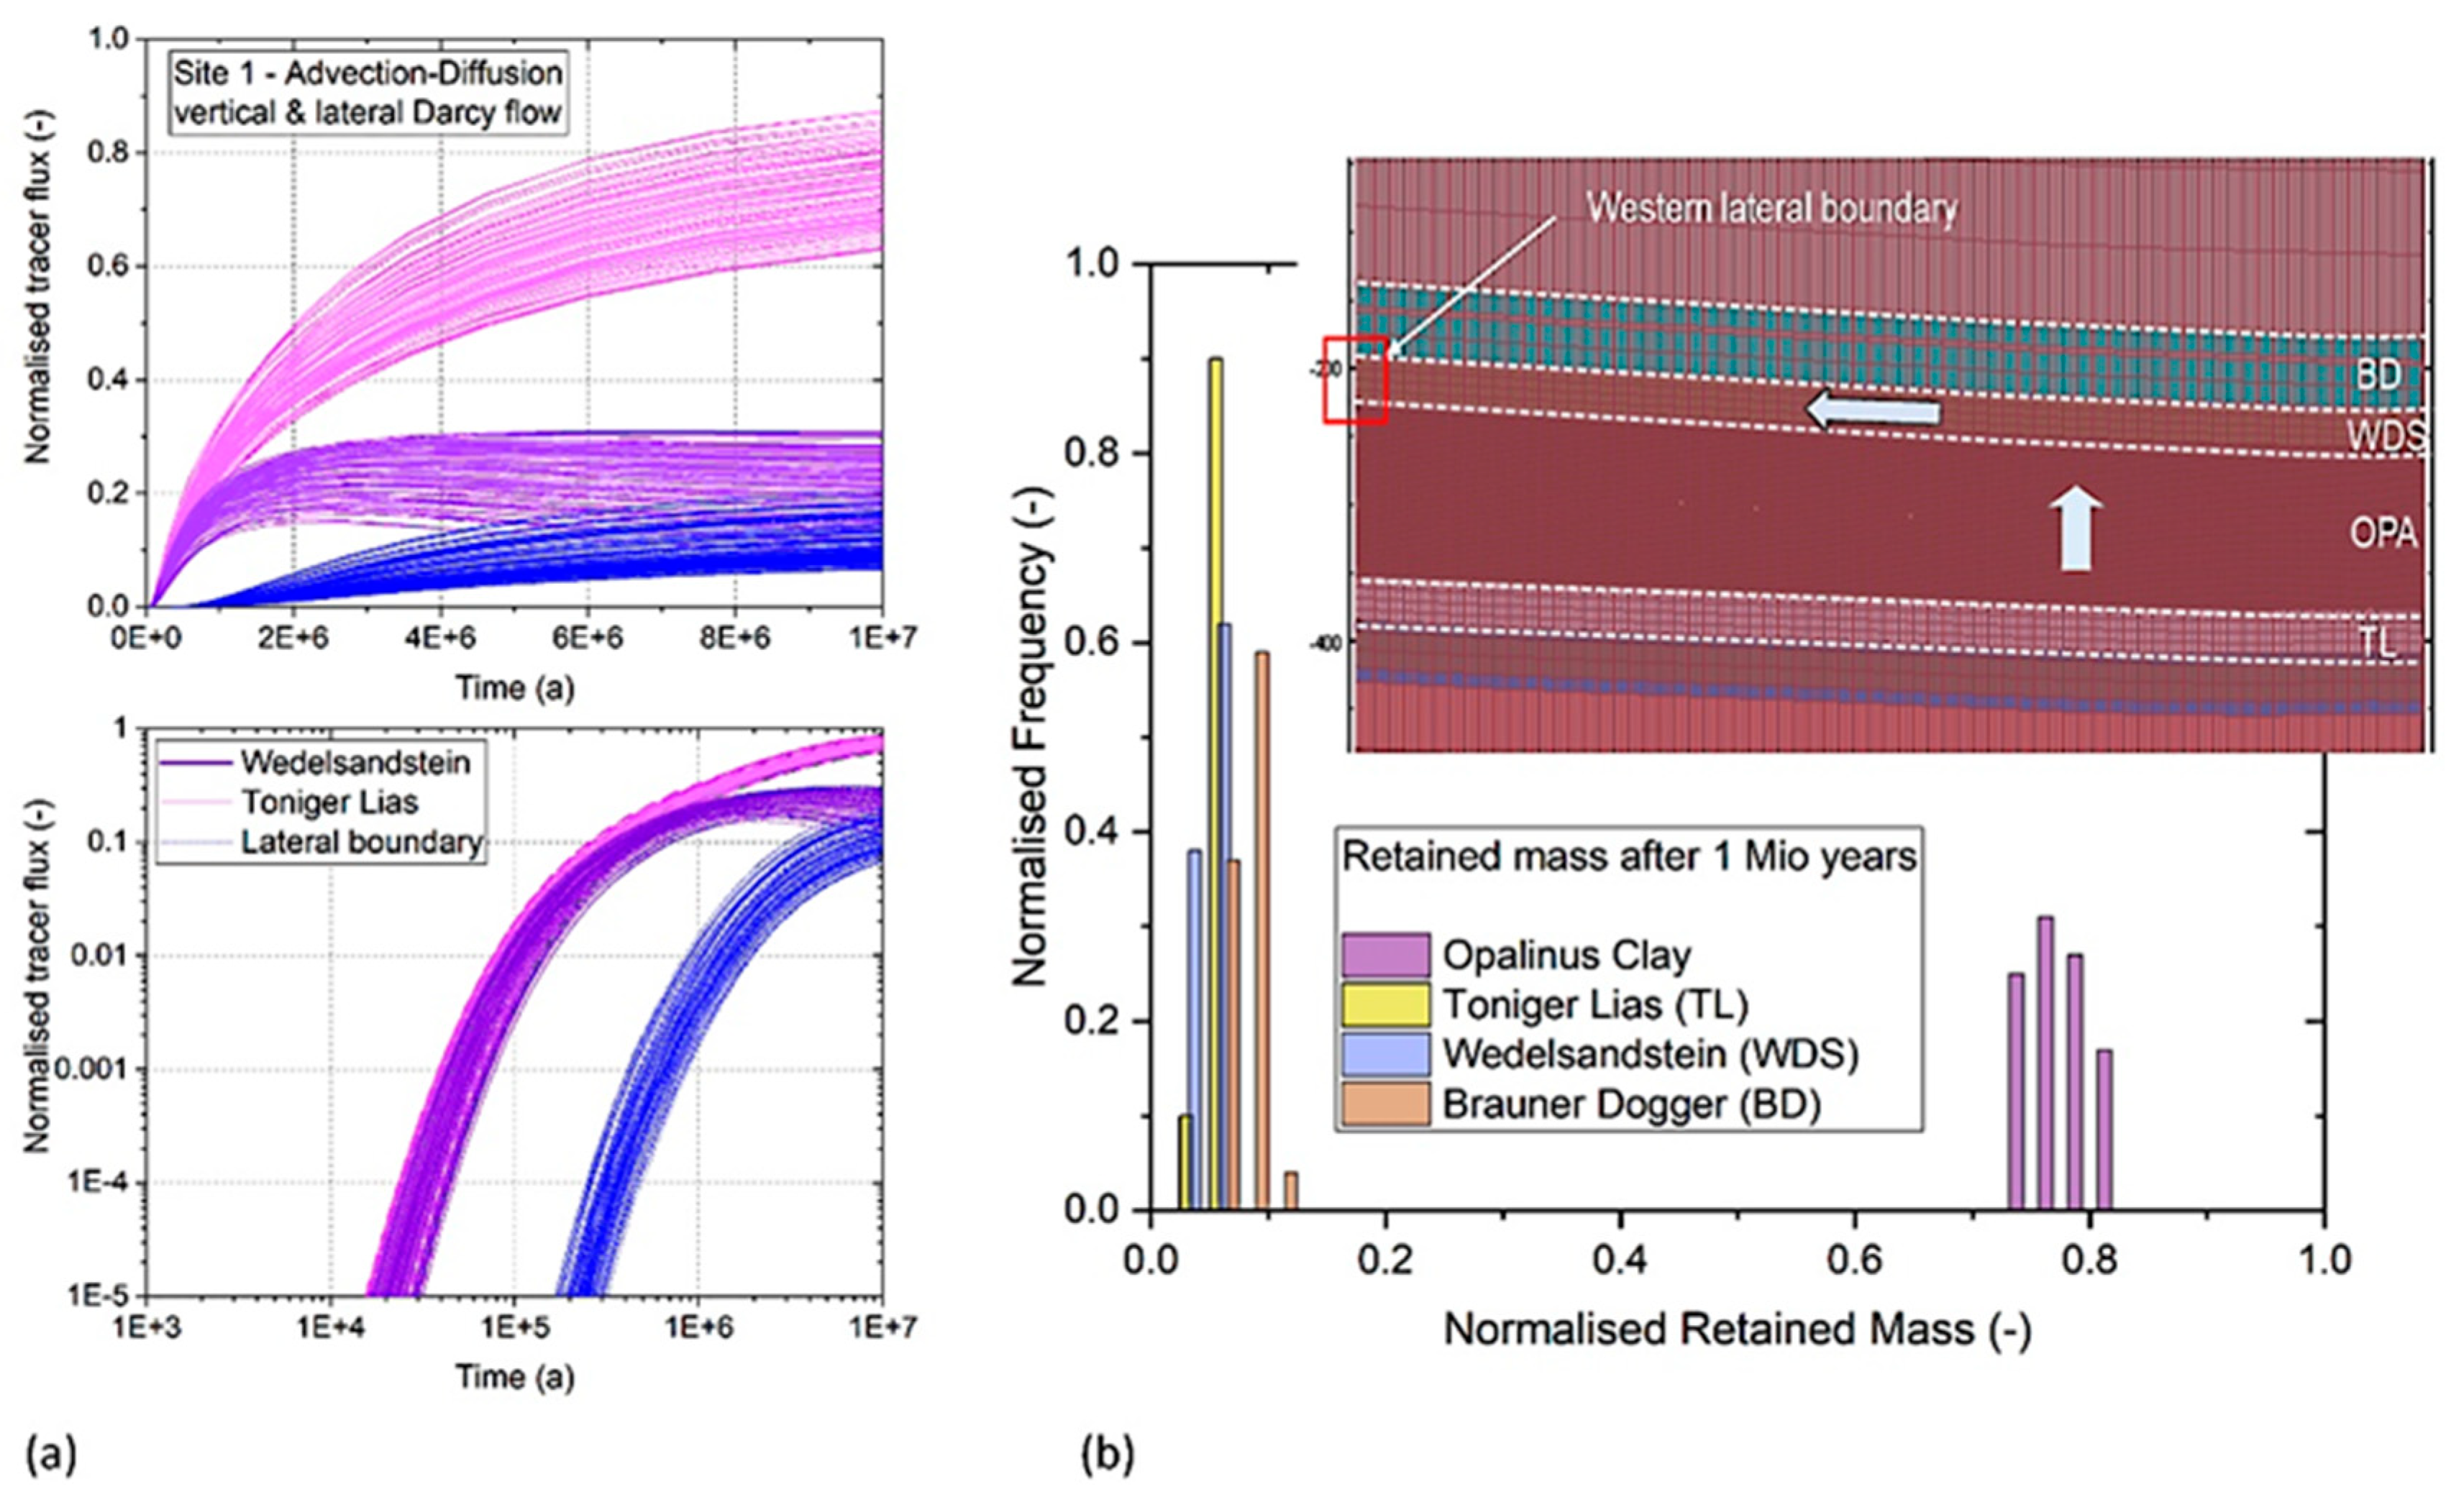
Additional Monte Carlo variants consider conservative estimates of upflow gradients through the stack of geological formations as well as lateral gradients in the upper confining units, as shown exemplarily in
Figure 16. Tracer breakthrough is evaluated at the top and bottom of the host rock as well as the downstream lateral boundary in the upper confining units, located 200 m from the repository footprint (
Figure 16a). Tracer release laterally through the downstream boundary in the upper confining units is orders of magnitude lower than that from the host rock, as depicted also in the histograms of retained mass after 1 million years (
Figure 16b). Approximately 75–85% of released tracer is retained within the Opalinus Clay, 4–12% within the upper and lower confining units, and only 0.2% is released across the lateral boundaries at 200 m from the repository.
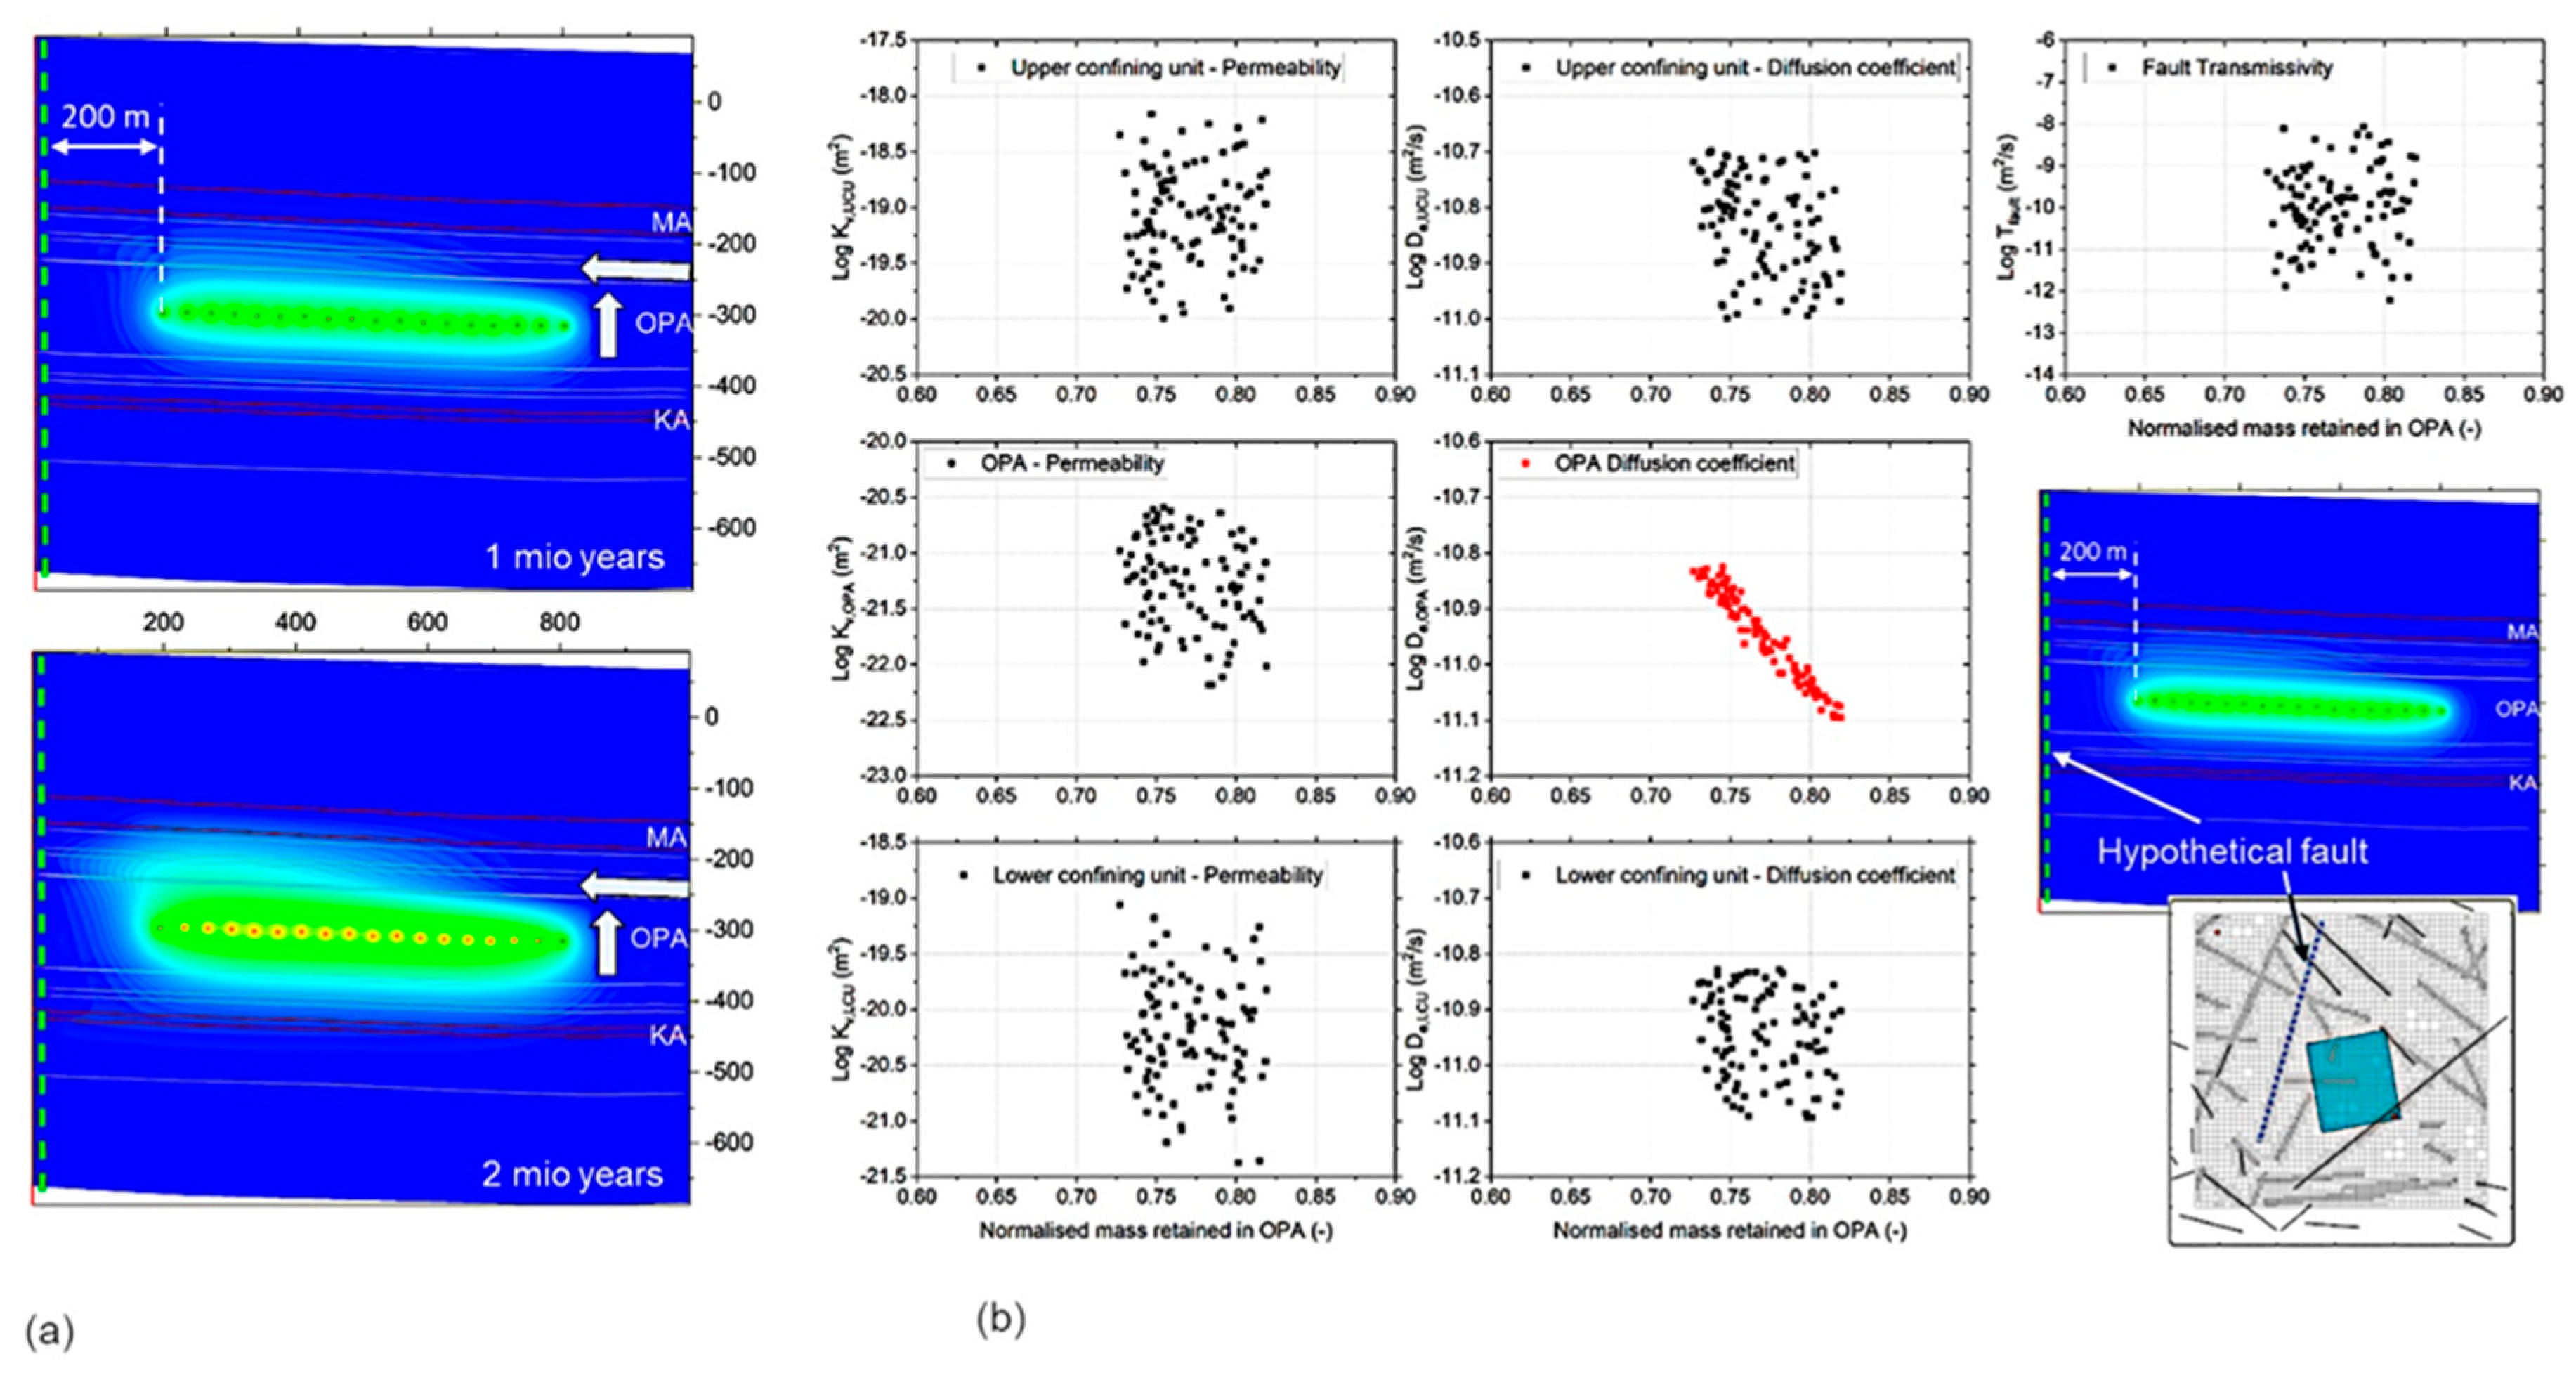
The estimated minimum 200 m distance from potential seismic faults is also assessed with similar Monte Carlo simulations of the same model that include a vertical fault downstream of the repository (
Figure 17a). Cross plots between retained mass and perturbed parameters show correlation between retention and the diffusion coefficient of the host rock but no correlation to fault transmissivity for a fault distance of 200 m (
Figure 17b).
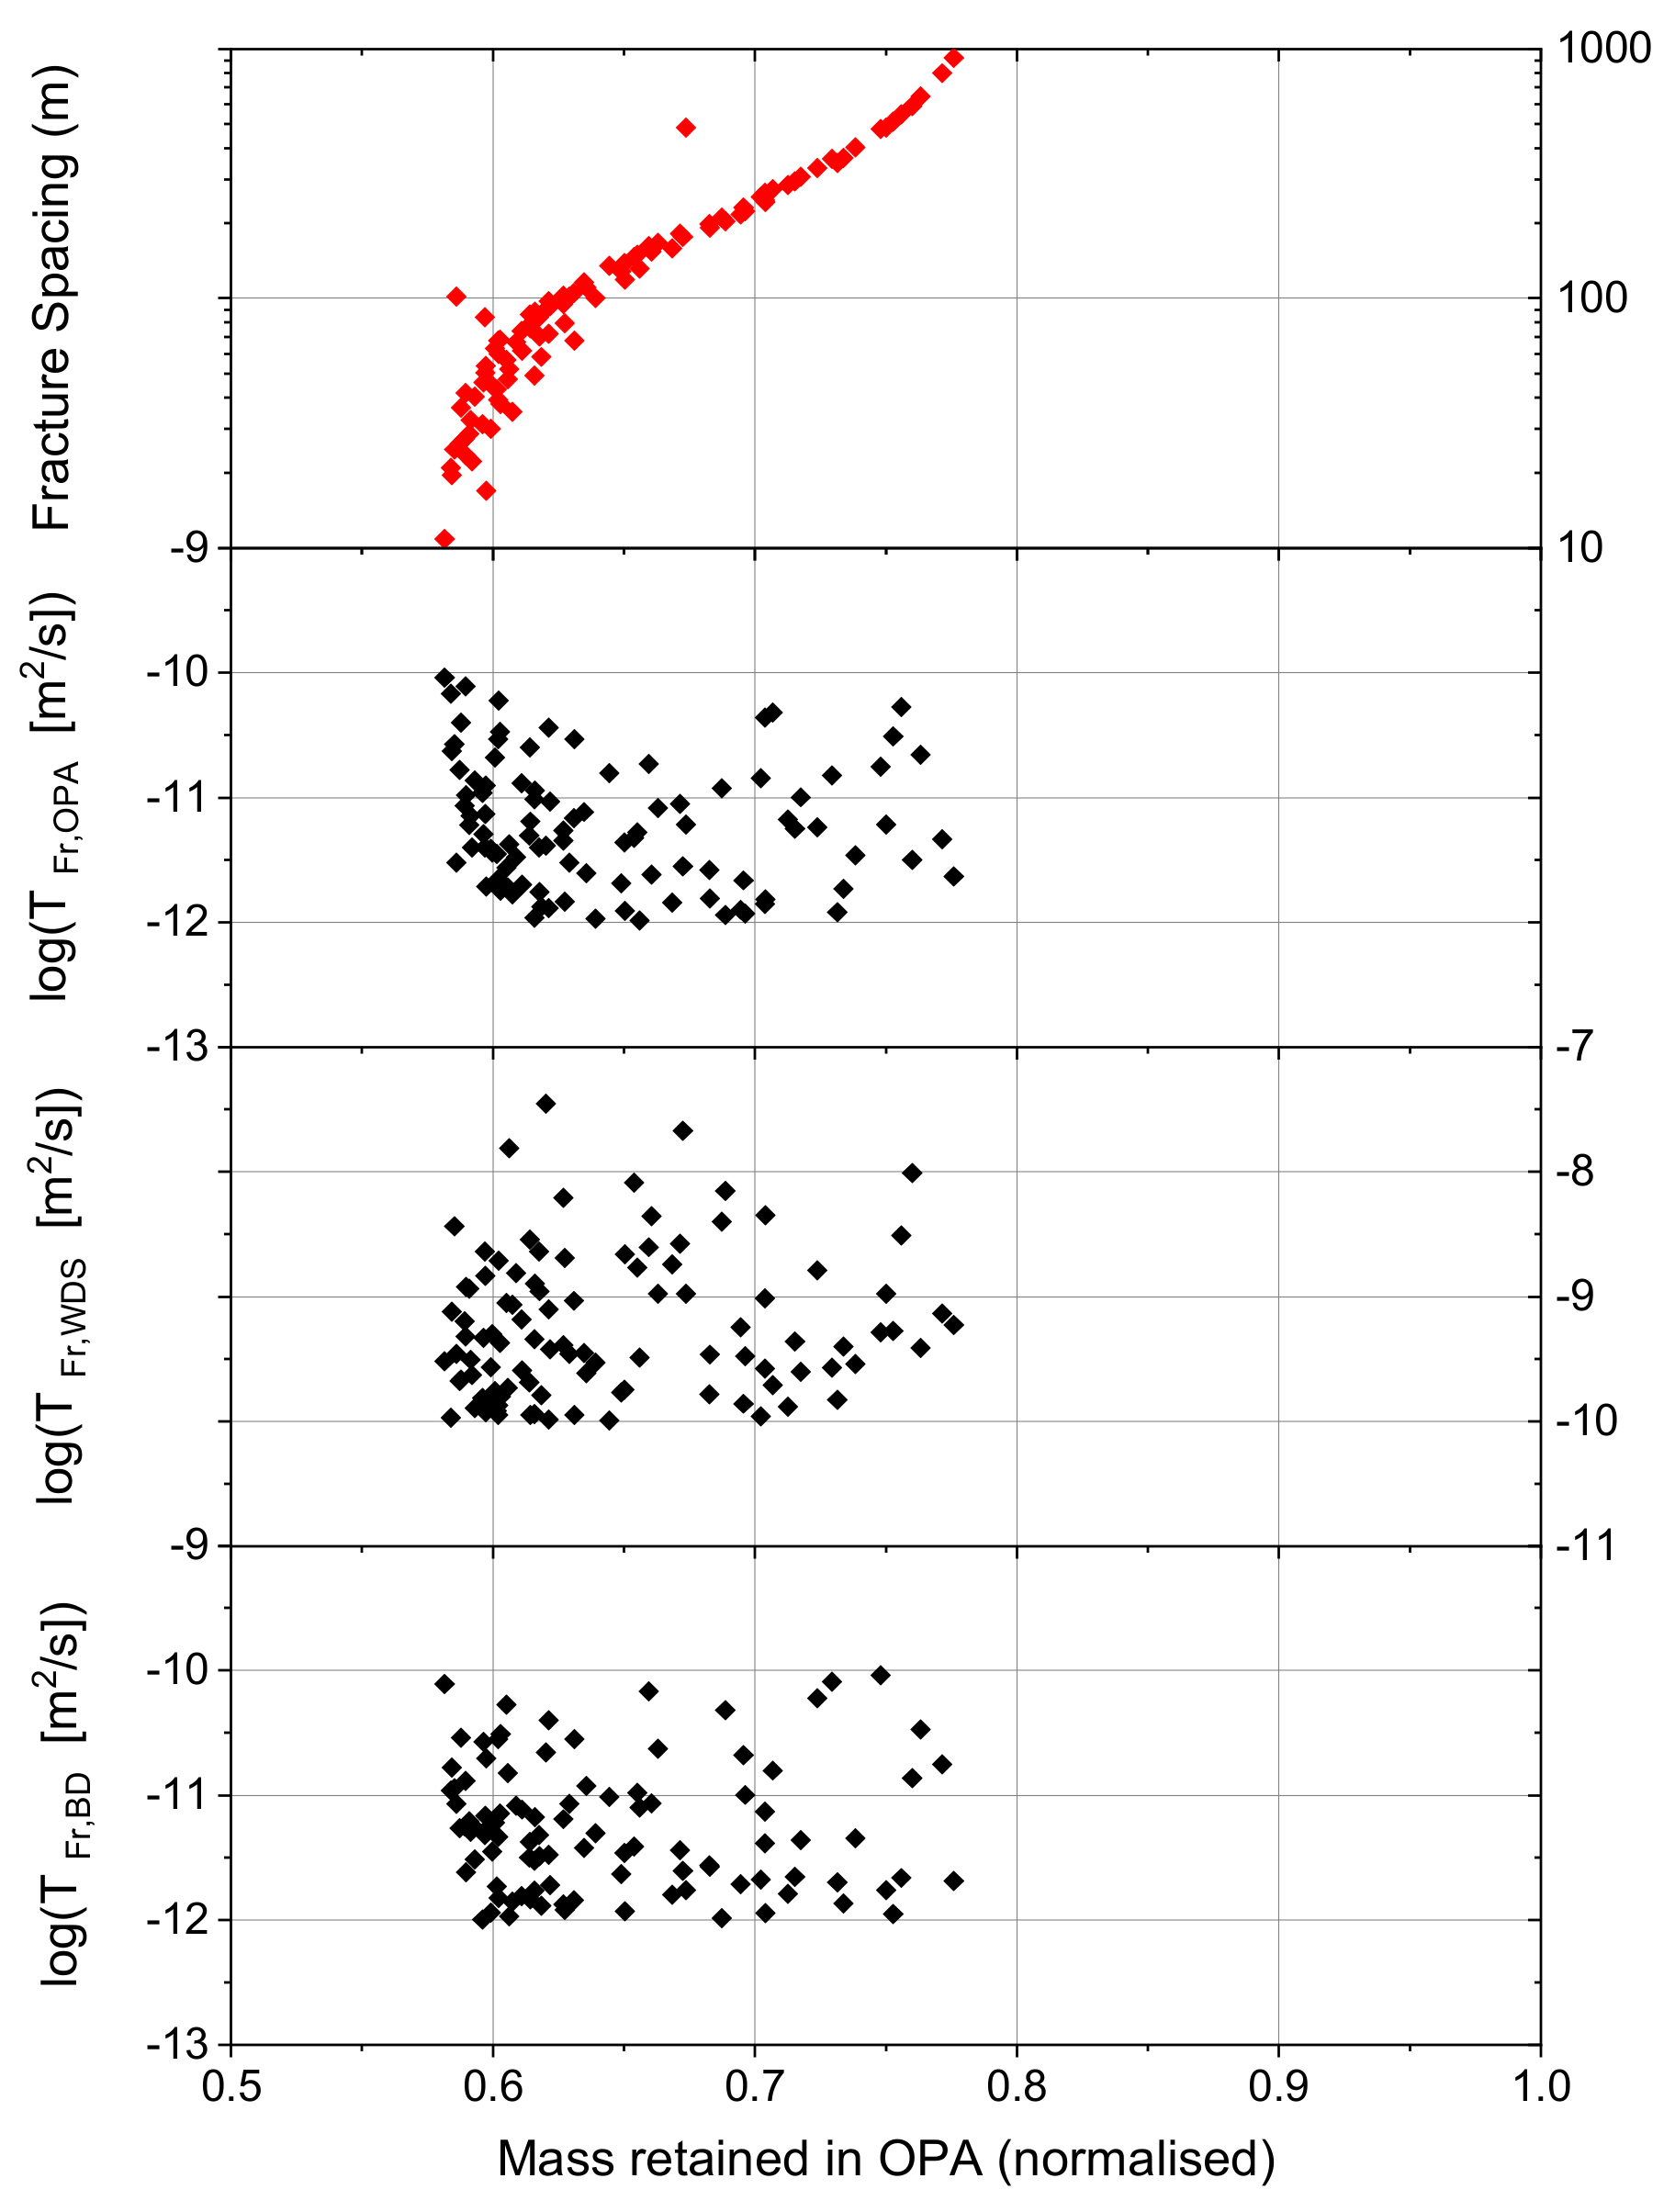
Sub-seismic faults present in the host rock constitute an additional form of irreducible uncertainty as they might impair the barrier function depending on their transport properties and how frequently they occur. To assess this effect, Monte Carlo simulations are performed using the double-porosity approach, and perturbing fault density and transmissivity in the host rock and the upper/lower confining units (
Figure 18). The correlations of perturbed parameters with mass retained in the host rock provide estimates of the minimum fault frequency required to impair the barrier function of the host rock, which is subsequently compared to fracture mapping available from the exploratory boreholes at each site.
Similar Monte Carlo simulations addressing conceptual uncertainty related to facies heterogeneity are performed but not presented in this paper for practical reasons (illustrative example shown in
Figure 6). For the same reason, probabilistic simulations addressing fault activation at different times sampled from probability density functions associated with erosion, uplift, and deep glaciation scenarios are not discussed in further detail.
The uncertainty in the long-term evolution associated with repository-induced effects is addressed with deterministic scenarios (see
Section 3.3 and
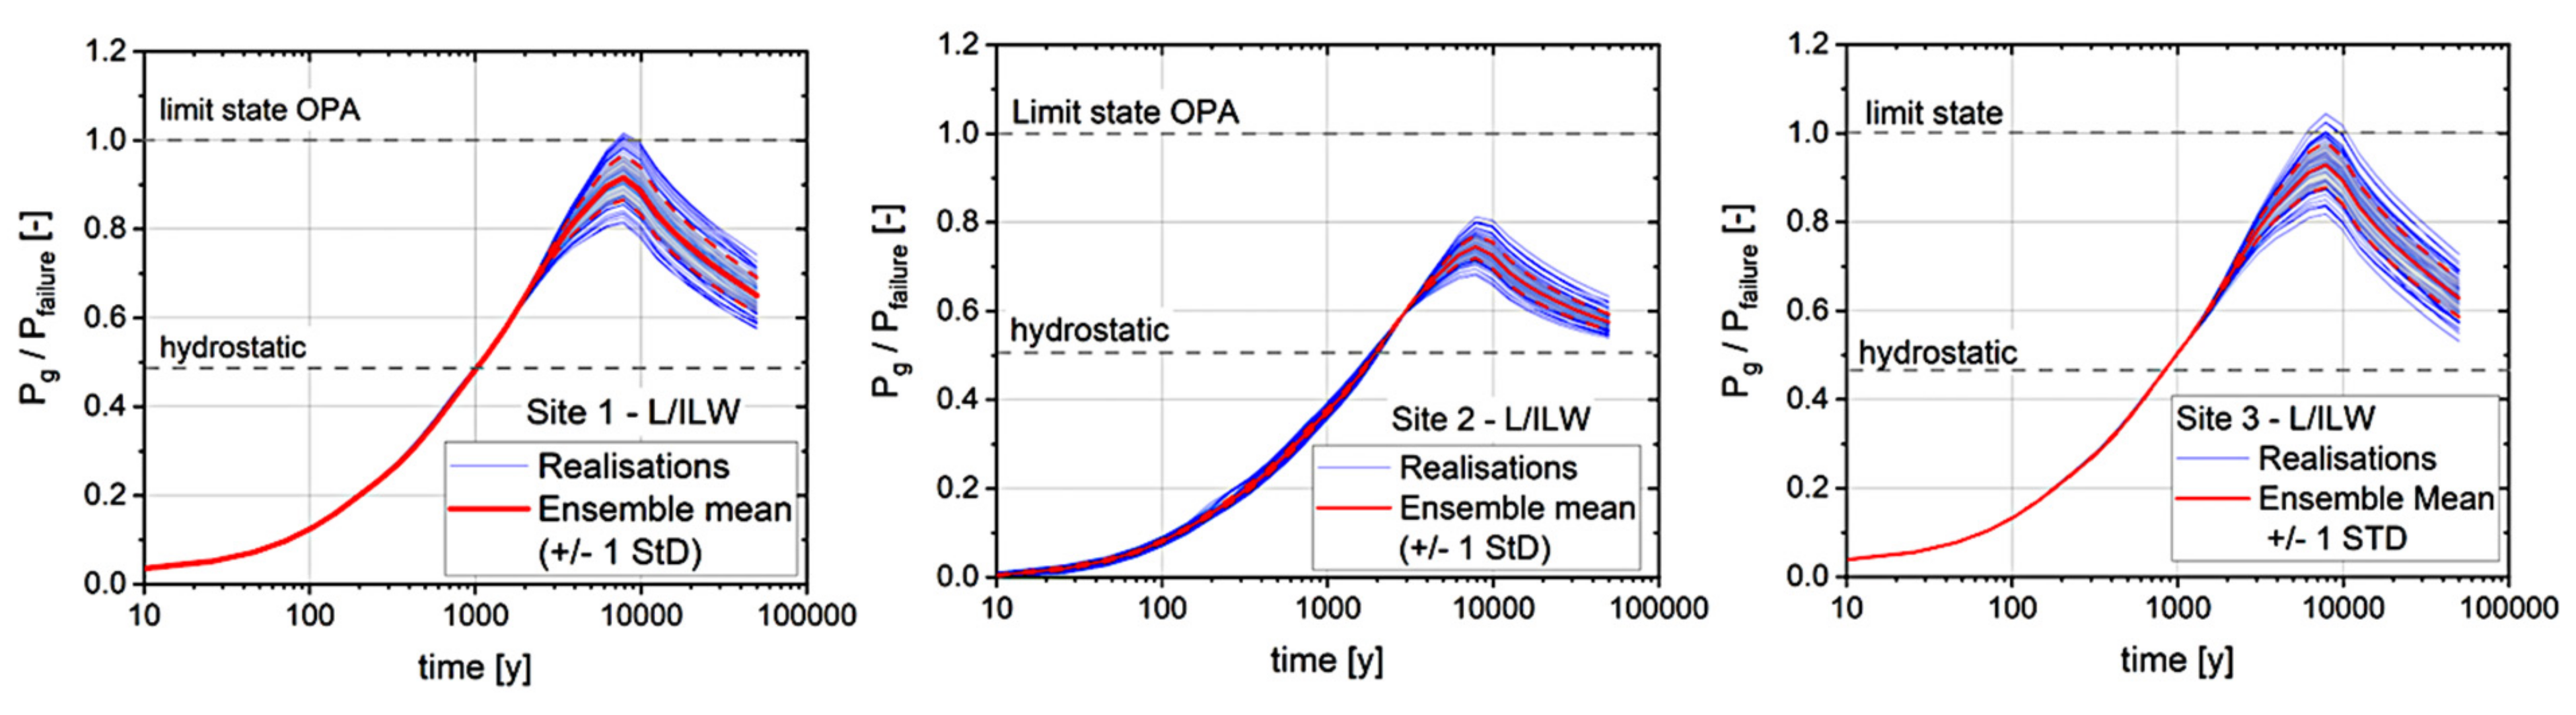
Section 4.2) as well as probabilistic simulations perturbing uncertain parameters relevant to gas- and thermally induced overpressures in the repository and surrounding rock. Complementary to scenarios like those shown in
Figure 14, Monte Carlo simulations provide the bandwidth of pressure build-up for comparison to the site-specific limit state that is expected to lead to the onset of plastification or failure of the geological barrier (
Figure 19).
4.4. Synthesis for the Site Comparison
The model-based performance assessment aims to support the argumentations made to address the regulatory criteria guiding the site selection process. The assessments give emphasis to the Effective Confinement Zone based on its characteristics today, its long-term evolution, and the associated irreducible uncertainties. In general, the numerical simulations consider the expected parametric, conceptual, and scenario uncertainties based on the hydrogeologic data; the simulation results demonstrate a robust barrier function of the Effective Confinement Zone delineated in the candidate sites. The barrier function is shown to perform very well and remain unimpaired for all reference and alternative scenarios if certain conditions are met related to the hydrogeologic setting and tectonic overprint.
However, the direct comparison of the sites requires the implementation of dimensionless performance indices that provide a measurable performance of each site based on the indicators presented in the previous (normalized tracer flux, normalized retained mass, gas- and thermally induced pressures). The derivation of the numerous performance indices used in the site selection process is an extensive topic that is not the subject of this paper. The indices derived from the modeling activities described in the previous can be summarized as follows:
I1—maximum of the time derivative of the release to the UCU/LCU: measure of spreading/dispersion of instant release fraction during transport;
I2—decay during transport: nuclide-specific measure of attenuation of decay during geosphere transport;
I3—release at 1 million years: measure of the maximum breakthrough at one million years;
NPI—normalized path length in intact rock: EDZ-related index evaluating the reduction of effective distance in intact rock between the repository and the upper/lower rock boundaries;
FPI—failure potential in intact rock: measure of the possibility of plastification of the host rock due to gas- and thermally-induced overpressures;
FAP—fault activation potential: measure of the possibility of activation of pre-existing faults in the host rock due to gas- and thermally-induced overpressures.
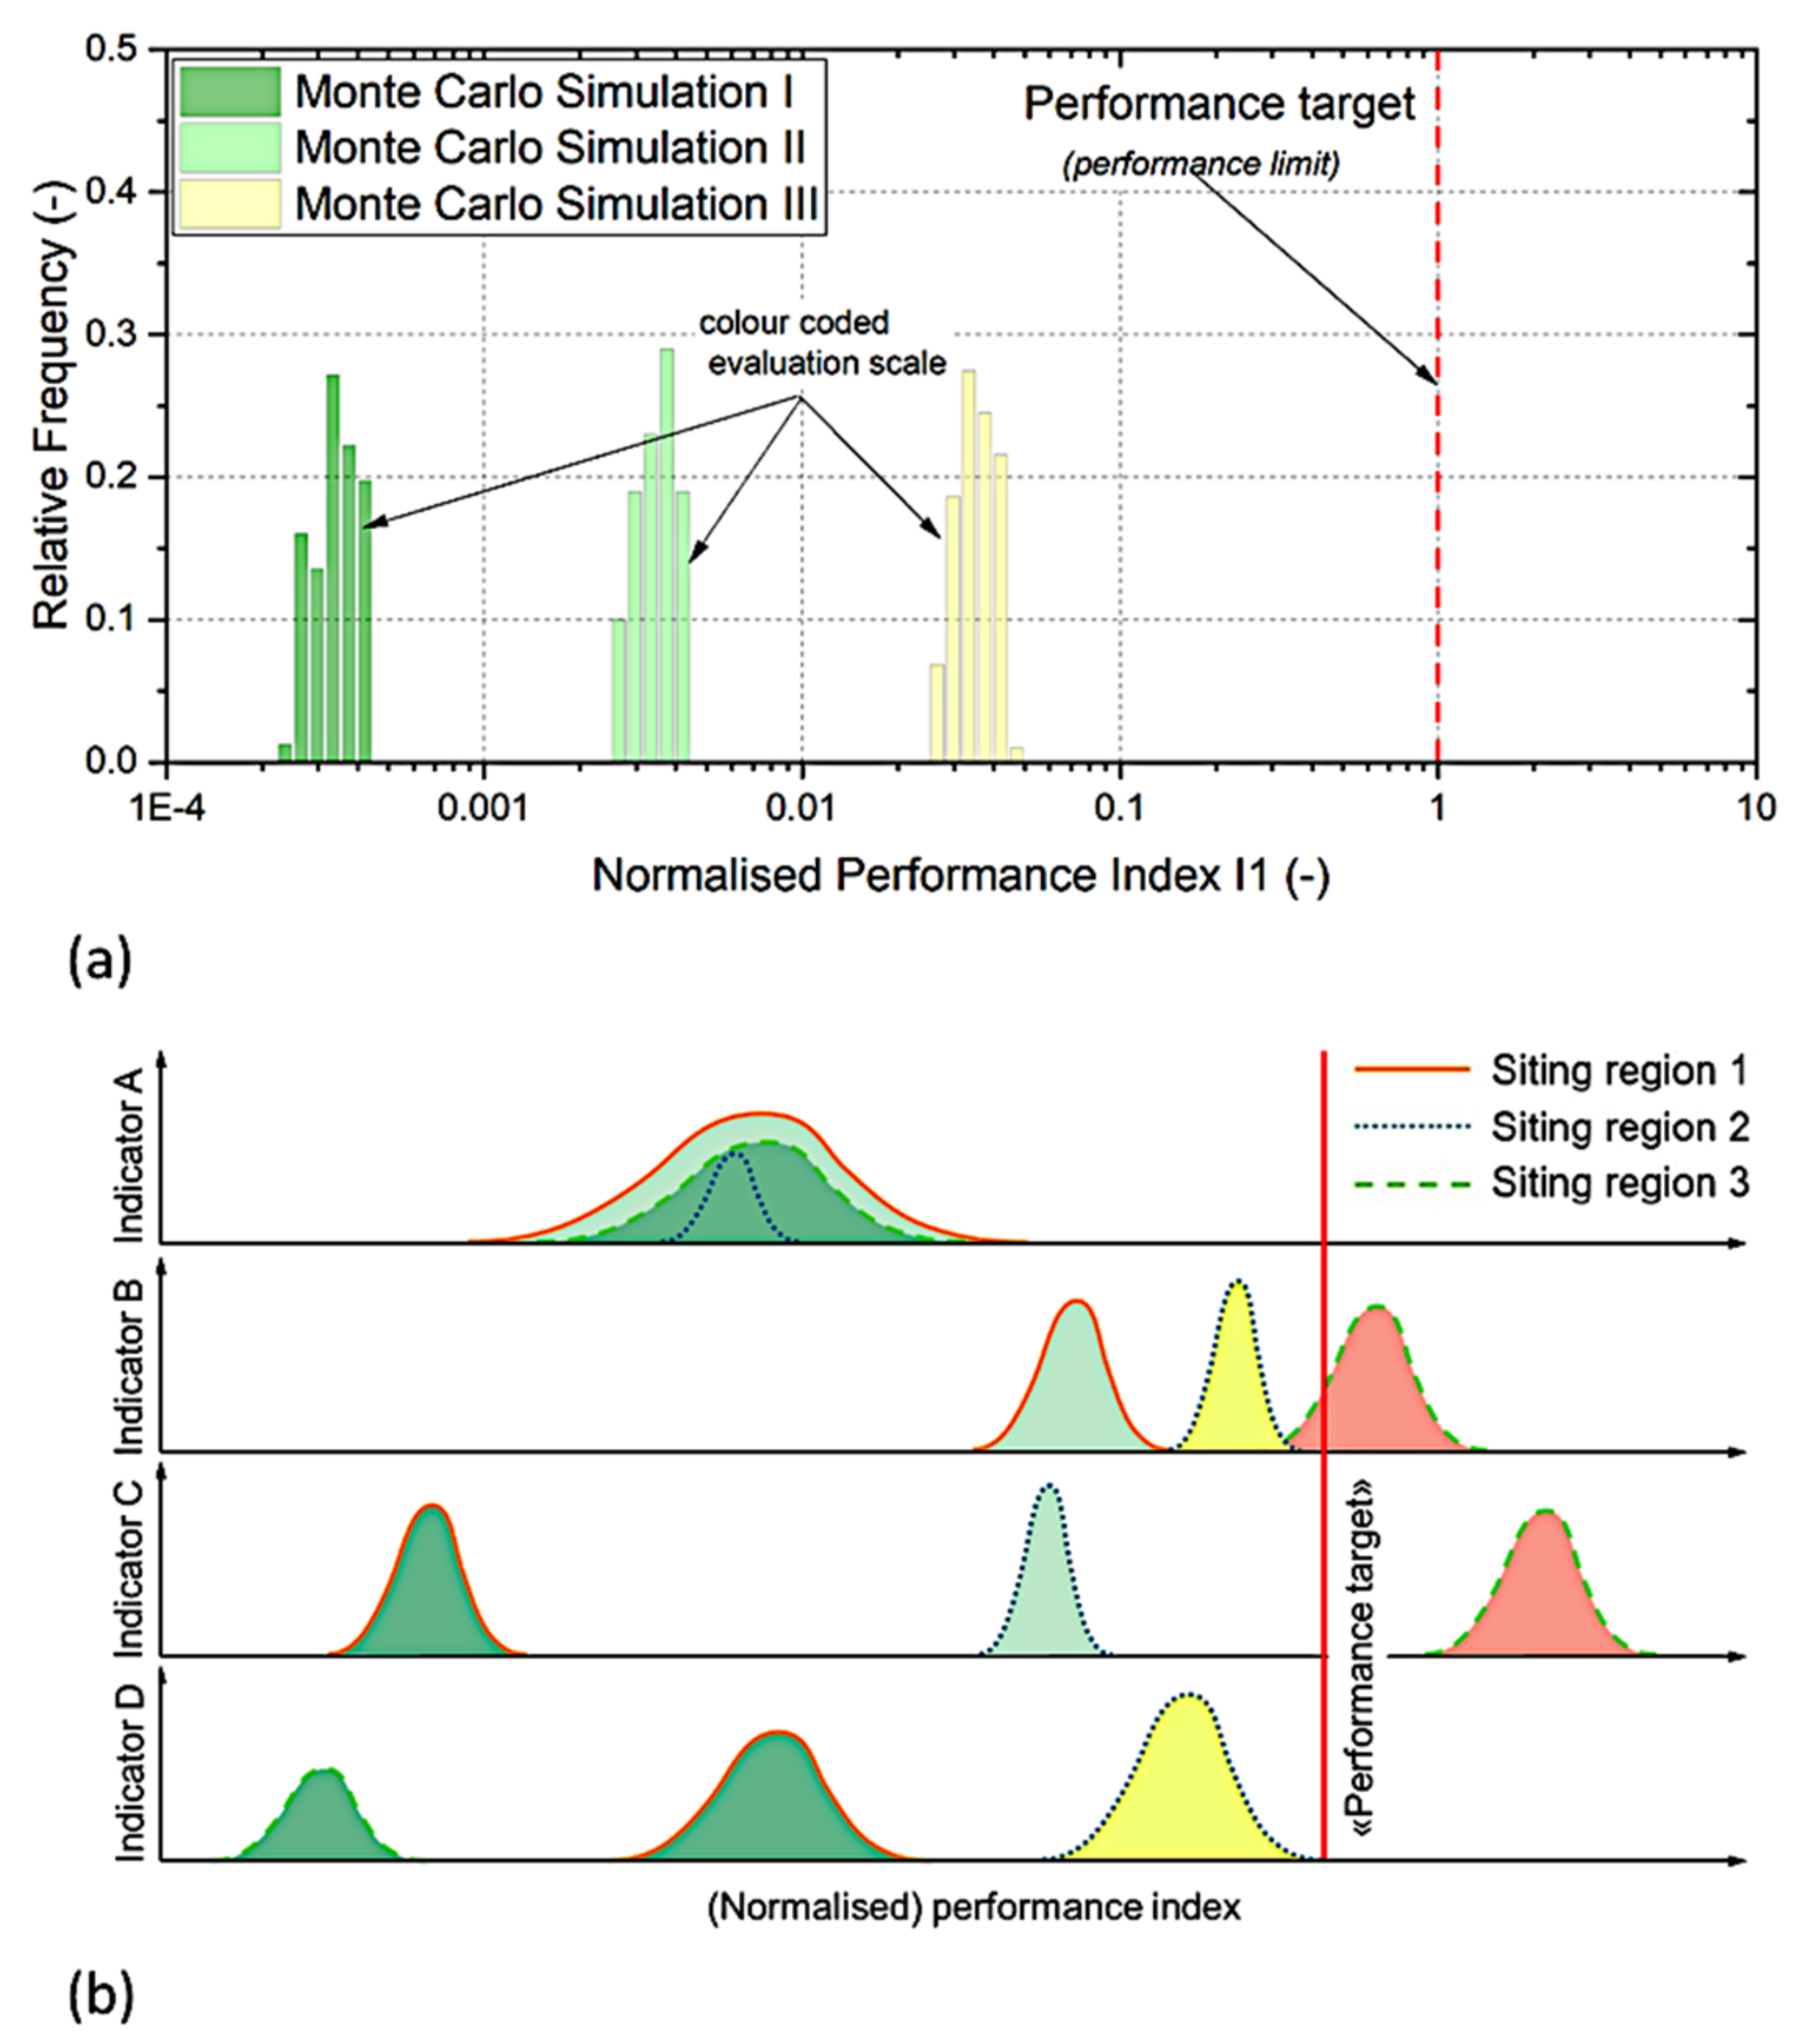
The approach followed is based on the definition of index ranges that correspond to
favorable,
less favorable,
unfavorable, and
unacceptable conditions for each index at each site, as illustrated in
Figure 20a. In the context of site comparison, all indices are synthesized to identify (less) favorable and unfavorable conditions, wherein some indices may perform favorably at all sites whereas other indices may form differentiators for the site selection (
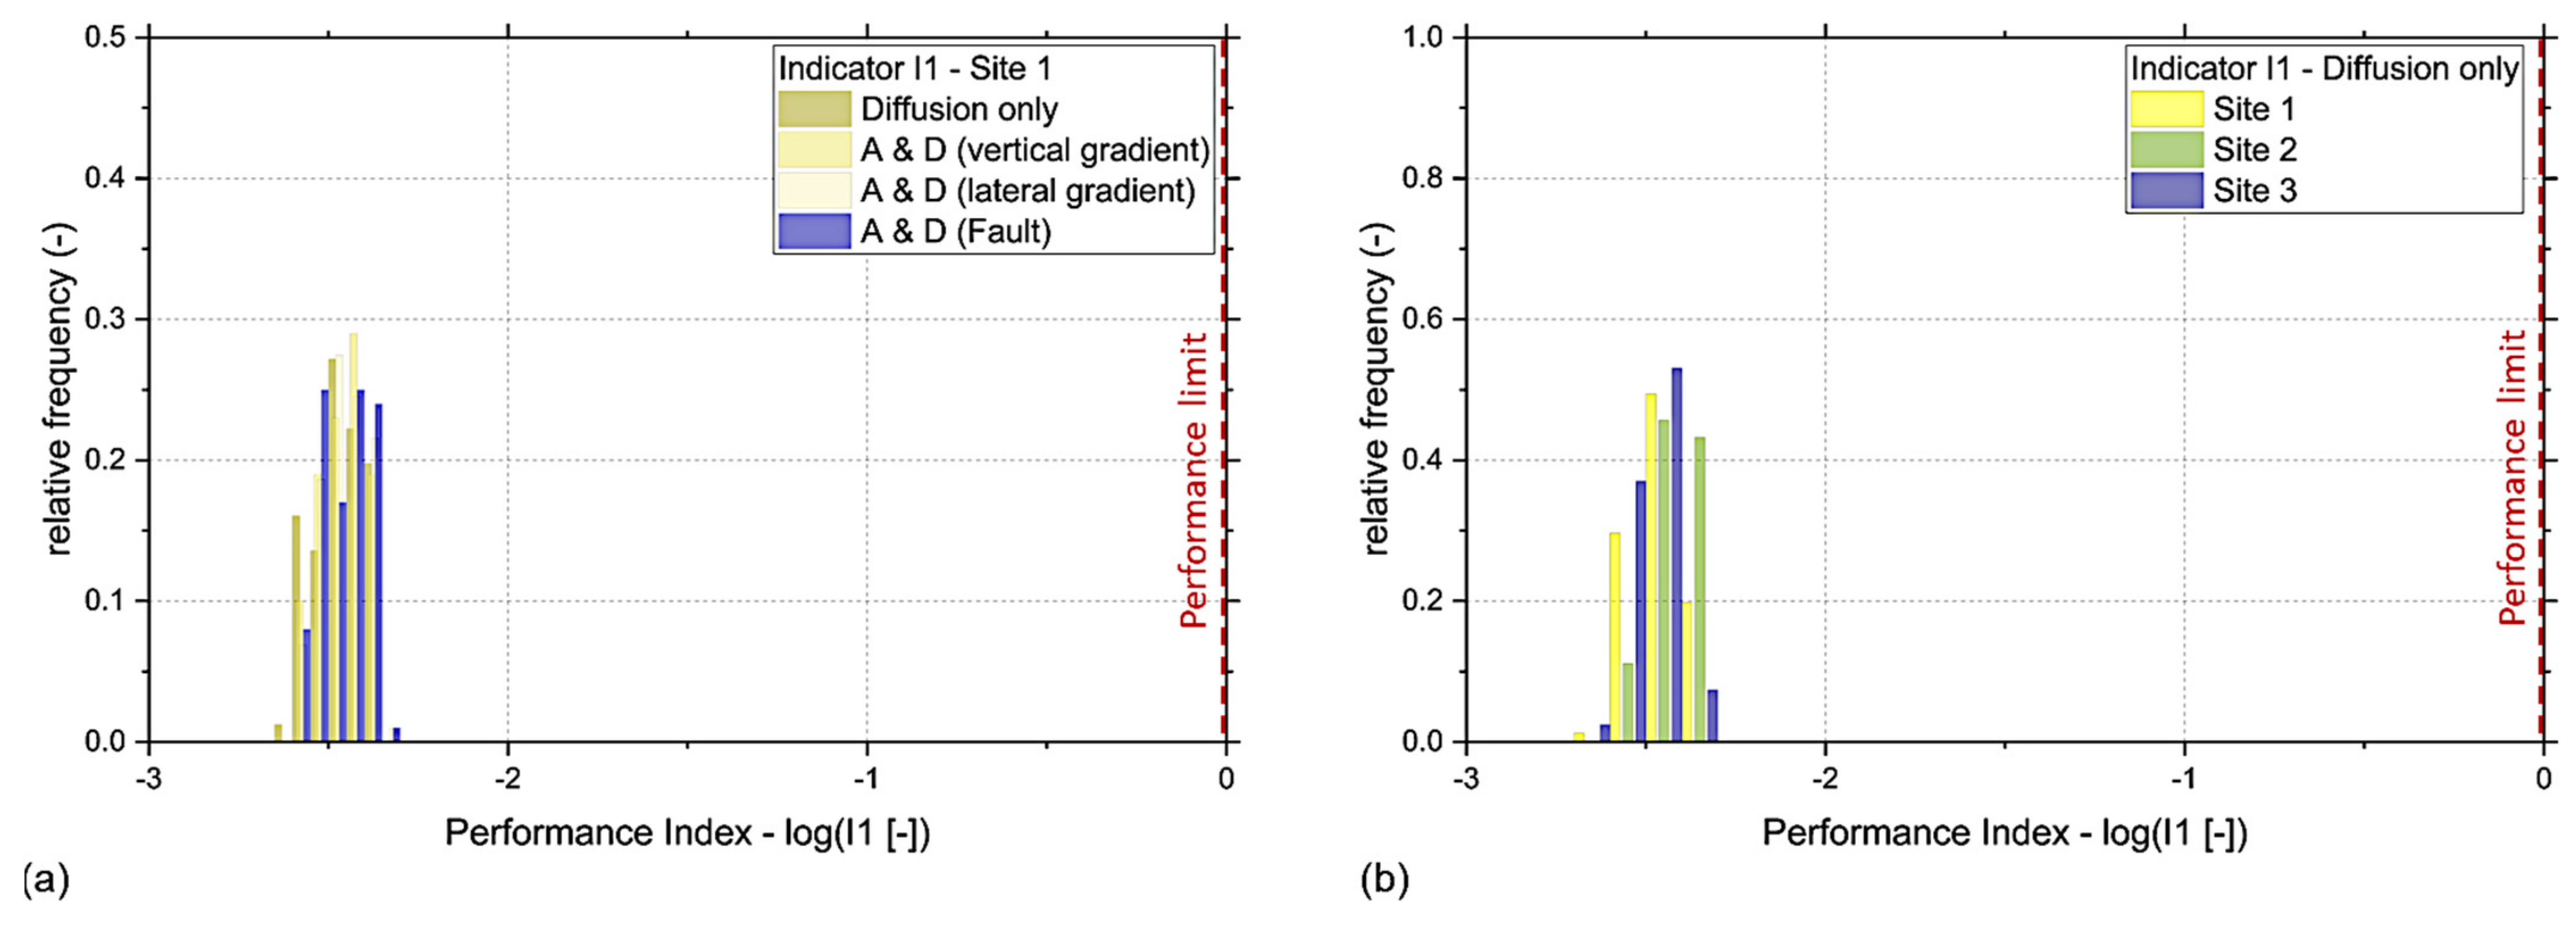
Figure 20b). The propagation of parametric, conceptual, and scenario uncertainties is combined for each index to provide its corresponding
performance envelope at each site. Note that the performance envelopes are evaluated within each site for all scenarios (
Figure 21a) as well as across all sites for each scenario (
Figure 21b). Nagra’s site proposal to the regulatory authorities, which is expected in Fall 2022, will refer to this indicator approach, among other lines of evidence.
5. Discussion and Conclusions
A modeling workflow has been developed for site-specific performance assessments supporting the ongoing site-selection process in Switzerland. The site selection in Switzerland is guided by regulatory criteria addressing the performance of the geological barrier based on its characteristics today, its long-term evolution including the geological repository, and the uncertainties in the characterization and predictability of the barrier in the period of the assessment. The models implemented to address these criteria integrate transport and two-phase flow calculations ranging from the scale of siting regions to the scale of the emplacement nearfield. The results are evaluated in terms of performance indicators, such as mass of released tracer and pore pressure, transformed to dimensionless performance indices that allow for direct comparisons of the sites. The long-term evolution is assessed with probabilistic perturbation of input parameters as well as assessment scenarios addressing conceptual and scenario uncertainty. Performance envelopes are accordingly derived for each performance index used for the assessment aspects of the sites for the entire range of uncertainties. Results in this paper are presented only exemplarily as the submission of Nagra’s proposal to the regulatory authorities is pending (expected in Fall 2022).
In general, the site-specific performance assessments performed for the Swiss program demonstrate the efficiency of the geological barrier at each potential repository location that has been evaluated with the models and the long-term evolution of the repository and surrounding geological environment. These assessments also include analyses of the most important irreducible uncertainties. The following key messages relevant to the Swiss context can be identified in the model analyses presented in detail in this paper:
The Opalinus Clay host rock is the primary geological barrier with well-constrained transport properties. Given the parametric uncertainties (flow and transport properties of the rock, thickness of the host rock section, etc.) the assessed Opalinus Clay sections (in horizontal and vertical direction) at the potential sites perform equally well as a flow and transport barrier.
From a hydrogeological perspective, it is impossible for the over- and underlying units to act as an efficient lateral release path or significantly alter the retention in the host rock.
A distance of 200 m from layout-determining fault zones is sufficient to ensure that the mass fraction of cations along this release path is negligible.
Steeply dipping sub-seismic faults do not significantly impair the barrier function of the confinement zone (based on site investigations, which ensure that the mean fault distance at the repository location is above 1 transmissive fault per 100 m).
Repository-induced effects may constitute differentiators between the sites, depending on the repository configuration and design tailored to each site.
In the general context of evaluating a site for a DGR, the analyses presented in this paper demonstrate the ability of performance assessment models to complement databased assessments and strengthen the argumentation submitted to the regulatory authorities. It is currently well understood that extensive site investigations can reduce but not eliminate uncertainty in the hydrogeological data and the long-term evolution of a site. Irreducible uncertainty requires comprehensive probabilistic analyses to ensure that missing or poorly constrained information may not result in impairment of the barrier at any time during the assessment period. The contribution of performance-assessment modeling to site evaluations can be multifaceted:
Complement the interpretation and evidence found directly in the existing hydrogeological data (i.e., interpretation of natural tracer profiles; not presented in this paper);
Evaluate the performance of the site for the range of uncertainties in the hydrogeological data;
Evaluate the relevance of reducible uncertainties and inform field investigations about data needs relative to complementary investigations;
Assess the relevance of irreducible uncertainties and inform both field investigations and safety analyses on information that can be constrained based on its relevance to safety (i.e., critical fault distance or the frequency of sub-seismic faults);
In the case of site selection, provide consistent, traceable, and verifiable site comparison through the implementation of calculable dimensionless performance indices.
Author Contributions
Conceptualization, P.M. and A.P.; methodology, P.M., A.P. and C.L.; modeling, M.J.H., D.Z., C.L., M.H. and A.P.; validation, M.H., P.M., C.L. and D.Z.; formal analysis, P.M.; resources, P.M. and A.P.; data curation, P.M.; writing—original draft preparation, A.P.; writing—review and editing, C.L., D.Z., M.J.H., M.H., P.M., A.P.; visualization, P.M., A.P., C.L., D.Z., M.J.H.; supervision, P.M. and A.P.; project administration, P.M., A.P., C.L.; funding acquisition, P.M. All authors have read and agreed to the published version of the manuscript.
Funding
This work was funded by Nagra, framework contract “Model Based Assessment of Repository Induced Effects—Phase 3” (“MARIE III”—Work Orders 20’064 and 21’334).
Institutional Review Board Statement
Not applicable.
Informed Consent Statement
Not applicable.
Data Availability Statement
Data supporting reported results can be found on Nagra’s website,
www.nagra.ch.
Acknowledgments
The authors would like to acknowledge the contributions of Olivier Leupin (Nagra, Switzerland) and Paul Smith (Safety Assessment Management GmbH, Switzerland) for their valuable input in the workflow development.
Conflicts of Interest
The authors declare no conflict of interest.
References
- Apted, M.; Ahn, J. Geological Repository Systems for Safe Disposal of Spent Nuclear Fuels and Radioactive Waste; Second Edition; Elsevier Ltd.: Amsterdam, The Netherlands, 2017. [Google Scholar]
- International Atomic Energy Agency (IAEA). Safety Standards: Geological Disposal Facilities for Radioactive Waste; Specific Safety Guide No. SSG-14; International Atomic Energy Agency: Vienna, Austria, 2011. [Google Scholar]
- Nuclear Energy Agency (NEA). Features, Events and Processes (FEPs) for Geologic Disposal of Radioactive Waste. An International Database; OECD: Paris, France, 2000. [Google Scholar]
- Svensk Kärnbränslehantering AB (SKB). Post-Closure Safety for a Proposed Repository Concept for SFL. Main Report for the Safety Evaluation SE-SFL; SKB Technical Report TR-19-01; Svensk Kärnbränslehantering AB (SKB): Stockholm, Sweden, 2019. [Google Scholar]
- Bundesamt für Energie. Sachplan Geologische Tiefenlager—Konzeptteil; Bundesamt für Energie: Bern, Switzerland, 2011. [Google Scholar]
- Eidgenössisches Nuklearsicherheits-Inspektorat (ENSI). Präzisierungen der Sicherheitstechnischen Vorgaben für Etappe 3 des Sachplans Geologische Tiefenlager; ENSI 33/649; Eidgenössisches Nuklearsicherheits-Inspektorat (ENSI): Brugg, Switzerland, 2018. [Google Scholar]
- Nagra. SGT Etappe 2: Vorschlag Weiter zu Untersuchender Geologischer Standortgebiete Mit Zugehörigen Standortarealen für Die Oberflächenanlage; Nagra Technical Report 14-02; Nagra: Wettingen, Switzerland, 2014. [Google Scholar]
- Finsterle, S.; Commer, M.; Edmiston, J.; Jung, Y.; Kowalsky, M.B.; Pau, G.S.H.; Wainwright, H.M.; Zhang, Y. iTOUGH2: A simulation-optimization framework for analyzing multiphysics subsurface systems. Comput. Geosci. 2017, 108, 8–20. [Google Scholar] [CrossRef]
- Pruess, K.; Oldenburg, C.; Moridis, G. TOUGH2 User’s Guide, Version 2; Report LBL-43134; Lawrence Berkeley National Laboratory: Berkeley, CA, USA, 2012. [Google Scholar]
- Diomidis, N.; Cloet, V.; Leupin, O.X.; Marschall, P.; Poller, A.; Stein, M. Production, Consumption and Transport of Gases in Deep Geological Repositories According to the Swiss Disposal Concept; Nagra Technical Report NTB 16-03; Nagra: Wettingen, Switzerland, 2016. [Google Scholar]
- Papafotiou, A.; Senger, R. Sensitivity Analyses of Gas Release from a SF/HLW Repository in the Opalinus Clay in the Candidate Siting Regions of Northern Switzerland; Nagra Work Report NAB 14-10; Nagra: Wettingen, Switzerland, 2014. [Google Scholar]
- Papafotiou, A.; Namhata, A.; Singh, A.; Williams, M.; Jigmond, M.; Marschall, P. A workflow for parametric sensitivity analysis of heat and gas release from a deep geological repository for SF/HLW. In Multiple Roles of Clays in Radioactive Waste Confinement; Norris, S., Neeft, E.A.C., Van Geet, M., Eds.; Geological Society, London, Special Publications: London, UK, 2017; Volume 482. [Google Scholar]
- Papafotiou, A.; Senger, R. Sensitivity Analyses of Gas Release from a L/ILW Repository in the Opalinus Clay Including the Microbial Consumption of Hydrogen; Nagra Work Report 16-07; Nagra: Wettingen, Switzerland, 2016. [Google Scholar]
- Papafotiou, A.; Senger, R. Sensitivity Analyses of Gas Release from a SF/HLW Repository in the Opalinus Clay; Nagra Work Report 16-08; Nagra: Wettingen, Switzerland, 2016. [Google Scholar]
- Nagra. Modellhaftes Inventar für Radioaktive Materialien MIRAM 12; Nagra Work Report NAB 13-39; Nagra: Wettingen, Switzerland, 2013. [Google Scholar]
- Vu, T.M.; Sulem, J.; Subrin, D.; Monin, N. Semi-analytical solution for stresses and displacements in a tunnel excavated in transversely isotropic formation with non-linear behavior. Rock Mech. Rock Eng. 2013, 46, 213–229. [Google Scholar] [CrossRef]
- EDF. Code_Aster Open Source—General FEA Software; EDF: Paris, France, 2016; Available online: www.code-aster.org (accessed on 24 June 2022).
- Senger, R.; Papafotiou, A. Thermohydraulic Simulations of the Near-Field of a SF/HLW Repository during Early and Late-Time Post-Closure Period; Nagra Work Report NAB 14-11; Nagra: Wettingen, Switzerland, 2014. [Google Scholar]
- Papafotiou, A.; Senger, R. Sensitivity Study of Gas Release from a L/ILW Repository—Comparison of the Host Rock Formations in the Candidate Siting Regions; Nagra Work Report NAB 14-98; Nagra: Wettingen, Switzerland, 2014. [Google Scholar]
- Papafotiou, A.; Senger, R. HE-E Extension Modelling to Repository Scale HLW Emplacement; Nagra Work Report NAB 16-31; Nagra: Wettingen, Switzerland, 2016. [Google Scholar]
- Papafotiou, A.; Namhata, A. Development of Models of the Entire L/ILW Repository for the Assessment of Repository Induced Effects in the Siting Regions Jura Ost, Nördlich Lägern, Zürich Nordost; Nagra Work Report 18-20; Nagra: Wettingen, Switzerland, 2018. [Google Scholar]
- Thacker, B.H.; Doebling, S.W.; Hemez, F.M.; Anderson, M.C.; Pepin, J.E.; Rodriguez, E.A. Concepts of Model Verification and Validation; Report LA-14167-MS; Los Alamos National Laboratory: Los Alamos, NM, USA, 2014. [Google Scholar]
- Morgan, M.G.; Henrion, M. Uncertainty: A Guide to Dealing with Uncertainty in Quantitative Risk and Policy Analysis; Cambridge University Press: New York, NY, USA, 1990. [Google Scholar]
- Helton, J.C.; Garner, J.W.; McCurley, R.D.; Rudeen, D.K. Sensitivity Analysis Techniques and Results for Performance Assessment at the Waste Isolation Pilot Plant; Report SAND90-7103; Sandia National Laboratories: Sandia, NM, USA, 1991. [Google Scholar]
- Helton, J. Uncertainty and sensitivity analysis techniques for use in performance assessment for radioactive waste disposal. Reliab. Eng. Syst. Saf. 1993, 42, 327–367. [Google Scholar] [CrossRef]
- Morris, M.D. Factorial sampling plans for preliminary computational experiments. Technometrics 1991, 21, 239–245. [Google Scholar] [CrossRef]
- Papafotiou, A.; Namhata, A.; Singh, A.; Williams, M.; Jigmond, M.; Marschall, P. Parametric Sensitivity Analysis of Heat and Gas Release for a Geological Repository for SF/HLW in Northern Switzerland; Nagra Working Report NAB 17-05; Nagra: Wettingen, Switzerland, 2017. [Google Scholar]
- Papafotiou, A.; Williams, M.; Singh, A.; Jigmond, M. Parametric Sensitivity Analysis of Gas Release from a L/ILW Repository in Opalinus Clay; Nagra Working Report NAB 17-08; Nagra: Wettingen, Switzerland, 2017. [Google Scholar]
- Pruess, K.; Narasimhan, T.N. On fluid reserves and the production of superheated steam from fractured, vapor-dominated geothermal reservoirs. J. Geophys. Res. 1982, 87, 9329–9339. [Google Scholar] [CrossRef]
- Pruess, K.; Narasimhan, T.N. A practical method for modelling fluid and heat flow in fractured porous media. Soc. Pet. Eng. J. 1985, 25, 14–26. [Google Scholar] [CrossRef]
- USGS. User Guide for MODPATH Version 7—A particle tracking model for MODFLOW; Open-File Report 2016-1086; U.S. Geological Survey: Reston, VA, USA, 2016. [Google Scholar]
- McLamore, R.; Gray, K.E. The mechanical behaviour of anisotropic sedimentary rocks. J. Energy Ind. Transl. Am. Soc. Mech. Eng. Ser. B 1967, 89, 62–73. [Google Scholar]
- Jung, Y.; Heng Pau, G.S.; Finsterle, S.; Doughty, C. TOUGH3 User’s Guide, Version 1.0; Report LBNL-2001093; Lawrence Berkeley National Laboratory: Berkeley, CA, USA, 2018. [Google Scholar]
Figure 2.
Focus of performance assessment in the evaluation of Criteria Groups 1–3.
Figure 2.
Focus of performance assessment in the evaluation of Criteria Groups 1–3.
Figure 3.
Modular structure adopted for the implementation of site-specific models individually tailored to specific assessment aspects.
Figure 3.
Modular structure adopted for the implementation of site-specific models individually tailored to specific assessment aspects.
Figure 6.
Substruction of a 2D assessment model from a 3D repository model. Heterogeneous property distributions (top–down: clay content, porosity, hydraulic conductivity, effective diffusion coefficient) assigned to the host rock and implementation of discrete seismic faults through the stack of geological formations.
Figure 7.
Illustration of the double porosity model used for the assessment of transport in fracture networks (adapted from [
9]).
Figure 7.
Illustration of the double porosity model used for the assessment of transport in fracture networks (adapted from [
9]).
Figure 8.
Exemplary 3D model of a siting region used for repository placement: (a) hypothetical repository locations projected to top model boundary; (b) host rock thickness at corresponding locations; (c) normalized tracer breakthrough at the top of the host rock.
Figure 8.
Exemplary 3D model of a siting region used for repository placement: (a) hypothetical repository locations projected to top model boundary; (b) host rock thickness at corresponding locations; (c) normalized tracer breakthrough at the top of the host rock.
Figure 9.
Exemplary 3D model used for variants of hydrogeologic conditions: (a) hypothetical repository locations in the vicinity of seismic faults and deep exploratory boreholes; (b) normalized tracer breakthrough to the upper confining units (UCU) through intact rock; (c) normalized tracer breakthrough to the UCU through faults; (d) normalized tracer breakthrough to the UCU through boreholes.
Figure 10.
(a) Exemplary 3D particle tracking model used for the assessment of release pathways through seismic faults; (b) exemplary 2D simulation used for the assessment of the impact of hydrogeologic conditions on the retention capacity of the host rock.
Figure 10.
(a) Exemplary 3D particle tracking model used for the assessment of release pathways through seismic faults; (b) exemplary 2D simulation used for the assessment of the impact of hydrogeologic conditions on the retention capacity of the host rock.
Figure 11.
A hypothetical EDZ extent determination process for a circular tunnel (diameter 2.5 m): (1) the initial vertical stress is larger than the horizontal; (2) the material is transversely isotropic elastic; (3) the McLamore and Gray elasticity model is adopted; (4) the maximum EDZ extent is characterized in the horizontal and vertical directions by DEDZ,x and DEDZ,y, respectively.
Figure 12.
(a) Example of a site-specific repository project implemented in 3D model; (b) pressure (left) and gas saturation (right) simulated at the repository level with a 3D repository model.
Figure 12.
(a) Example of a site-specific repository project implemented in 3D model; (b) pressure (left) and gas saturation (right) simulated at the repository level with a 3D repository model.
Figure 13.
Gas flow rates through selected sections of the repository (red: V1 seals to branch tunnels, blue: V2 seals to operation tunnels, orange: V3 seals to shaft) for two configurations of the V2-L/ILW seal.
Figure 13.
Gas flow rates through selected sections of the repository (red: V1 seals to branch tunnels, blue: V2 seals to operation tunnels, orange: V3 seals to shaft) for two configurations of the V2-L/ILW seal.
Figure 14.
Example of comparison of nearfield evolution between three candidate sites: (a) pore pressure normalized by hydrostatic pressure at repository depth, HLW emplacement rooms; (b) pore pressure normalized by hydrostatic pressure at repository depth, L/ILW emplacement rooms; (c) temperature increase at HLW canister surface above in situ temperature at repository depth; (d) gas saturation in cementitious backfill between L/ILW packages.
Figure 15.
Delineation of the Effective Confinement Zone: (a) simulated tracer breakthrough at top and bottom of the host rock and upper/lower confining units; (b) correlations between retained mass in host rock and perturbed parameters.
Figure 15.
Delineation of the Effective Confinement Zone: (a) simulated tracer breakthrough at top and bottom of the host rock and upper/lower confining units; (b) correlations between retained mass in host rock and perturbed parameters.
Figure 16.
Assessment of release paths above the host rock: (a) simulated breakthrough at top and bottom of the host rock compared to lateral boundary in upper confining units; (b) histograms of retained mass in host rock, upper/lower confining units.
Figure 16.
Assessment of release paths above the host rock: (a) simulated breakthrough at top and bottom of the host rock compared to lateral boundary in upper confining units; (b) histograms of retained mass in host rock, upper/lower confining units.
Figure 17.
Assessment of minimum distance from fault zones: (a) tracer mass fractions under a conservatively high lateral gradient in the upper confining units; (b) correlations between retained mass in host rock and perturbed parameters. Red symbols plotted in (b) indicate strong correlation.
Figure 17.
Assessment of minimum distance from fault zones: (a) tracer mass fractions under a conservatively high lateral gradient in the upper confining units; (b) correlations between retained mass in host rock and perturbed parameters. Red symbols plotted in (b) indicate strong correlation.
Figure 18.
Assessment of role of sub-seismic faults: correlations between retained mass in host rock and fault frequency and transmissivity. Red symbols depicted in the top plot indicate strong correlation.
Figure 18.
Assessment of role of sub-seismic faults: correlations between retained mass in host rock and fault frequency and transmissivity. Red symbols depicted in the top plot indicate strong correlation.
Figure 19.
Long-term evolution of gas-induced pressures in the L/ILW repository: an example comparison between sites.
Figure 19.
Long-term evolution of gas-induced pressures in the L/ILW repository: an example comparison between sites.
Figure 20.
Schematic illustration of the use of four different indicators to compare siting regions: (a) comparison of different scenarios at one siting region; (b) comparison of different indicators evaluated at each of the siting regions.
Figure 20.
Schematic illustration of the use of four different indicators to compare siting regions: (a) comparison of different scenarios at one siting region; (b) comparison of different indicators evaluated at each of the siting regions.
Figure 21.
Comparison of performance envelope of performance index I1: (a) for different scenarios at one siting region; (b) between three different sites resp. siting regions.
Figure 21.
Comparison of performance envelope of performance index I1: (a) for different scenarios at one siting region; (b) between three different sites resp. siting regions.
Table 1.
Parameter ranges used in Monte Carlo simulations (single-porosity).
Table 1.
Parameter ranges used in Monte Carlo simulations (single-porosity).
| Material | Parameter | Units | Reference | Min | Max | Std | Distribution |
|---|
| Opalinus Clay | De (Site 3) | m2/s | 9.3 × 10⁻¹² | 7.5 × 10⁻¹² | 1.4 × 10⁻¹¹ | - | Uniform |
| De (Site 2) | m2/s | 1.1 × 10⁻¹¹ | 9.0 × 10⁻¹² | 1.7 × 10⁻¹¹ | - | Uniform |
| De (Site 1) | m2/s | 1.5 × 10⁻¹¹ | 8.0 × 10⁻¹² | 1.5 × 10⁻¹¹ | - | Uniform |
| Kz (Site 3) * | m/s | 8.0 × 10⁻¹⁵ | 5.0 × 10⁻¹⁶ | 3.0 × 10⁻¹⁴ | 0.5 | Log-normal |
| Kz (Site 2) * | m/s | 8.0 × 10⁻¹⁵ | 2.0 × 10⁻¹⁵ | 1.0 × 10⁻¹³ | 0.5 | Log-normal |
| Kz (Site 1) * | m/s | 8.0 × 10⁻¹⁵ | 5.0 × 10⁻¹⁶ | 3.0 × 10⁻¹⁴ | 0.5 | Log-normal |
| Cp | 1/Pa | 1.7 × 10−09 | 7.5 × 10⁻¹⁰ | 3.5 × 10⁻⁹ | 8.0 × 10⁻¹⁰ | Normal |
| Ch | J/(kg °C) | 995 | 900 | 1100 | 80 | Normal |
| Upper Confining Units | De (Site 3) | m2/s | 1.1 × 10⁻¹¹ | 7.3 × 10⁻¹² | 1.5 × 10⁻¹¹ | - | Uniform |
| De (Site 2) | m2/s | 1.1 × 10⁻¹¹ | 7.4 × 10⁻¹² | 1.5 × 10⁻¹¹ | - | Uniform |
| De (Site 1) | m2/s | 1.5 × 10⁻¹¹ | 1.0 × 10⁻¹¹ | 2.0 × 10⁻¹¹ | - | Uniform |
| Kz (Site 3) | m/s | 9.3 × 10⁻¹³ | 1.1 × 10⁻¹¹ | 8.1 × 10⁻¹² | 0.5 | Log-normal |
| Kz (Site 2) | m/s | 1.2 × 10⁻¹³ | 1.0 × 10⁻¹⁴ | 1.2 × 10⁻¹¹ | 0.5 | Log-normal |
| Kz (Site 1) | m/s | 9.3 × 10⁻¹³ | 1.1 × 10⁻¹³ | 8.1 × 10⁻¹² | 0.5 | Log-normal |
| Lower Confining Units | De (Site 3) | m2/s | 7.0 × 10⁻¹² | 5.6 × 10⁻¹² | 1.1 × 10⁻¹¹ | - | Uniform |
| De (Site 2) | m2/s | 1.0 × 10⁻¹¹ | 8.0 × 10⁻¹² | 1.5 × 10⁻¹¹ | - | Uniform |
| De (Site 1) | m2/s | 1.0 × 10⁻¹¹ | 8.0 × 10⁻¹³ | 1.5 × 10⁻¹¹ | - | Uniform |
| Kz (Site 3) | m/s | 1.0 × 10⁻¹⁴ | 6.0 × 10⁻¹⁶ | 1.9 × 10⁻¹³ | 0.5 | Log-normal |
| Kz (Site 2) | m/s | 1.5 × 10⁻¹⁴ | 3.5 × 10⁻¹⁵ | 2.0 × 10⁻¹³ | 0.5 | Log-normal |
| Kz (Site 1) | m/s | 6.4 × 10⁻¹⁴ | 3.9 × 10⁻¹⁵ | 1.2 × 10⁻¹² | 0.5 | Log-normal |
| EDZ | Kz (Site 3) * | m/s | 4.0 × 10⁻¹⁴ | 2.5 × 10⁻¹⁵ | 1.5 × 10⁻¹³ | 0.5 | Log-normal |
| Kz (Site 2) * | m/s | 4.0 × 10⁻¹⁴ | 1.0 × 10⁻¹⁴ | 5.0 × 10⁻¹³ | 0.5 | Log-normal |
| Kz (Site 1) * | m/s | 4.0 × 10⁻¹⁴ | 2.5 × 10⁻¹⁵ | 1.5 × 10⁻¹³ | 0.5 | Log-normal |
| Bentonite (HLW) | Kxyz | m/s | 3.5 × 10⁻¹³ | 1.0 × 10⁻¹³ | 1.0 × 10⁻¹² | 0.3 | Log-normal |
| λ(Sl = 1) | W/(m K) | 1.0 | 0.7 | 1.3 | 0.14 | Normal |
| Mortar (L/ILW) | Kxyz | m/s | 1.0 × 10⁻¹³ | 1.0 × 10⁻⁹ | 1.0 × 10⁻⁷ | 0.5 | Log-normal |
Table 2.
Parameter ranges used for sub-seismic faults in Monte Carlo simulations (double-porosity).
Table 2.
Parameter ranges used for sub-seismic faults in Monte Carlo simulations (double-porosity).
| Material | Parameter | Units | Reference | Min | Max | Std | Distribution |
|---|
| Opalinus Clay | Kfault (Site 3) | m/s | 2.0 × 10⁻¹³ | 2.0 × 10⁻¹³ | 2.0 × 10⁻¹¹ | 1.0 | Log-normal |
| Kfault (Site 2) | m/s | 2.0 × 10⁻¹³ | 2.0 × 10⁻¹³ | 2.0 × 10⁻¹¹ | 1.0 | Log-normal |
| Kfault (Site 1) | m/s | 2.0 × 10⁻¹³ | 2.0 × 10⁻¹³ | 2.0 × 10⁻¹¹ | 1.0 | Log-normal |
| FD * | m | 100 | 10 | 1000 | - | Log-uniform |
| Upper Confining Units | Kfault (Site 3) | m/s | 2.0 × 10⁻¹¹ | 2.0 × 10⁻¹¹ | 1.0 × 10⁻⁷ | 1.85 | Log-normal |
| Kfault (Site 2) | m/s | 2.0 × 10⁻¹¹ | 2.0 × 10⁻¹¹ | 1.0 × 10⁻⁸ | 1.0 | Log-normal |
| Kfault (Site 1) | m/s | 2.0 × 10⁻¹¹ | 2.0 × 10⁻¹¹ | 1.1 × 10⁻⁸ | 1.0 | Log-normal |
| FD * | m | 100 | 10 | 1000 | - | Log-uniform |
| Lower Confining Units | Kfault (Site 3) | m/s | 1.0 × 10⁻¹³ | 1.0 × 10⁻¹³ | 1.0 × 10⁻¹¹ | 1.0 | Log-normal |
| Kfault (Site 2) | m/s | 2.0 × 10⁻¹³ | 2.0 × 10⁻¹³ | 2.0 × 10⁻¹¹ | 1.0 | Log-normal |
| Kfault (Site 1) | m/s | 2.0 × 10⁻¹³ | 2.0 × 10⁻¹³ | 2.0 × 10⁻¹¹ | 1.0 | Log-normal |
| FD * | m | 100 | 10 | 1000 | - | Log-uniform |
| Publisher’s Note: MDPI stays neutral with regard to jurisdictional claims in published maps and institutional affiliations. |
© 2022 by the authors. Licensee MDPI, Basel, Switzerland. This article is an open access article distributed under the terms and conditions of the Creative Commons Attribution (CC BY) license (https://creativecommons.org/licenses/by/4.0/).


