Article

Labour Productivity as a Factor of Tangible Investment in Companies Producing Wind Energy Components and Its Impacts: Case of Lithuania

by
Viktorija Bobinaite
1,*,
Inga Konstantinaviciute
1,
Akvile Cibinskiene
2 and
Daiva Dumciuviene
2
1
Laboratory for Energy System Research, Lithuanian Energy Institute, Breslaujos Street 3, LT-44403 Kaunas, Lithuania
2
School of Economics and Business, Kaunas University of Technology, Gedimino Street 50-404, LT-44239 Kaunas, Lithuania
*
Author to whom correspondence should be addressed.
Energies 2022, 15(13), 4925; https://doi.org/10.3390/en15134925
Submission received: 8 June 2022 / Revised: 28 June 2022 / Accepted: 1 July 2022 / Published: 5 July 2022
(This article belongs to the Special Issue Sustainable Development, Energy Economics and Economic Analysis)

Abstract

:
This paper aims at justifying the significance of investment in the improvement of labour productivity (LP) and importance of the latter on economic performance of companies manufacturing wind energy components (WEC) in Lithuania in terms of value added (VA) created, profitability and wage earned. The time period covered is 2000–2020. The following methods have been employed: analysis of legal acts, programmes, strategies, and business structure and finance indicators, interdependence (correlation and regression), trend, case analysis, logical economical reasoning and graphical representation. The research results of current status analysis showed that the business of WEC manufacturing is small in regard to their variety of products but increasing in terms of VA and employment in Lithuania. Investment has been found as a driver of improvement in LP. The calculated historical ratio of change in LP to investment showed that, on average, after 1000 EUR per employee has been invested in tangible assets (TA), the LP increased by 0.13 EUR/h. A higher than average ratio was found in the manufacture of other transport and repair and installation of machinery and equipment (1.41), such as rubber, plastic and other non-metallic mineral products (0.17), but lower in the manufacture of electronic and communication (0.12) and metal (0.06) products. Taking into account the linear curves of LP to investment in TA curve and the average volumes of investment in different manufacturing activities, it is estimated that LP could grow by 5.3% a year in the manufacture of electronic products, and communication equipment are expected to increase by two-fold to 33 EUR/h in 2030, but it could grow only by 2.0% a year in the manufacture of rubber, plastic and other non-metallic mineral products to reach 28 EUR/h in 2030. Due to investment related changes in LP, the VA created by WEC companies could increase by 5.9% a year and account to 2.9 billion EUR during 2021–2030. Net profitability and real wages (and salaries) could also increase in future. Seeking to use the potential of companies to manufacture WEC for domestic wind installations and exports, investment supporting programmes are of high importance in the fields of promotion of innovations, development of human capital and adaptation of new technologies.

1. Introduction

Motivation of research. Global energy consumption is steadily rising due to the growing population and increasing demands. During 2009–2019, the average annual growth rate of global primary energy (PE) consumption was around 2%. In 2020, PE consumption fell by 4.3% due to the global COVID-19 pandemic, the first decline since 2009. The structure of global PE is dominated by fossil fuels (85%). Oil and its products make the largest share (36% in 2020), followed by coal (31%) and natural gas (28%), the consumption of which increased due to the substitution of coal with natural gas and the increase in natural gas consumption in the United States of America (USA) and China. In the European Union (EU), fossil fuel consumption has been declining by an average of 1.1% per year and, in 2020, it decreased by as much as 11.0% to 1092.4 Mtoe. In the structure of global PE consumption, this is equivalent to 10%. Trends of fossil fuel consumption have remained almost unchanged over the last decade and have remained stable at around 5 Mtoe per year in Lithuania [1].
The production and consumption of fossil fuels poses significant environmental challenges, particularly the emission of greenhouse gases (GHG), the growth of which will result in further warming and climate change. Between 2009 and 2019, the global carbon dioxide (CO2) emissions from the combustion of fossil fuels grew at an average rate of 1.7% per year. A short-term drop of 5% was fixed in 2020. As the EU is showing a global leadership in tackling climate change, its CO2 emissions decreased by 1.5% per year between 2009 and 2019. In 2020, EU CO2 emissions from fossil fuel combustion fell by more than twice as much as the rest of the world, i.e., by 10%. Lithuania’s CO2 emissions decreased by only 0.3% per year [1].
In order to reduce environmental problems, renewable energy sources (RES) are used. Between 2009 and 2020, the average annual growth rate of global RES consumption was as high as 6% [1]. It was 6% in the EU and 4.5% in Lithuania. Worldwide, hydro energy dominates in the RES structure, but the contribution of wind energy to the global PE balance is becoming increasingly significant (22.6% in 2020). The share of wind in RES structure in EU and Lithuania was 42% and 8% in 2020, respectively, with a tendency to increase rapidly. Production of wind energy increases under conditions of volatile and increasing global fossil fuel prices and the low costs of wind energy. The average global natural gas and coal prices increased by a third between 2009 and 2020 to 7.5 USD/MBTU and 83 USD/t, respectively [1]. According to [2], the levelized cost of energy (LCOE) of onshore wind farms in Europe is the lowest among electricity production technologies, as it varies from 58 USD/MWh to 76 USD/MWh, while the LCOE of electricity from cogeneration is about 45% higher. In comparison, the LCOE of electricity generated by a nuclear power plant can be several times higher and reach 240 USD/MWh. Moreover, the cost of onshore and offshore wind energy reduced by two-fold over the last decade [3] and if the investment costs of these technologies reduce in the future, it is expected that wind energy could become cheaper.
In 2016, countries around the world reached the Paris Agreement and decided to take actions ensuring that the global average temperature increase would be below 2 °C (in comparison to pre-industrial level) by putting their efforts towards keeping the global temperature increase below 1.5 °C (in comparison to pre-industrial level). This agreement meant that countries could continue to promote development while maintaining GHG emissions at a lower level, thus continuing to provide the necessary funding. Lithuania, together with other EU countries, has committed to a total reduction in GHG emissions of at least 40% by 2030 compared to 1990 levels [4]. In March 2020, the European Commission (EC) presented a long-term strategy for the EU, setting out its vision of a climate-neutral EU economy by 2050 [5].
In line with the provisions of the Paris Agreement, the EU member states have adopted the Climate Change and Energy Guidelines for 2020–2030, outlining the key objectives for EU climate change and energy, including increasing the share of energy from RES to 32% by 2030 (20% by 2020) compared to 1990. At the end of 2019, the EC published a communication entitled “A European Green Deal” (2019), which is the EU’s new growth strategy to transform society into a resource-efficient, competitive and growing economy. Within the framework of the European Green Deal, the European Industrial Strategy [6], the Circular Economy Action Plan [7], the European Commission Communication “Wider Europe 2030 Climate Ambition: Investing in the Future of Climate-Neutral People” and “Marine Renewable Energy Strategy” [8] have been adopted. These request an increase in the use of RES energy (RES to be 38.5% by 2030) [8] and an increase in European offshore wind farms from the current 12 GW to 60 GW by 2030, and up to 300 GW in 2050. Until 2050, ocean energy and other new technologies (including floating wind and solar power) will have a capacity of 40 GW.
Supporting the ambition of the Paris Agreement and meeting the requirements set out in the Climate Change and Energy Guidelines 2020–2030, Lithuania intends to increase the share of RES in final energy consumption to 45% [9]. Wind energy will be the main resource for electricity generation. The electricity from RES will be generated in the Baltic Sea. A 330 kV substation at sea and a new cable line will be built. The new 330 kV transmission lines connecting the wind farm to the transmission network will be constructed in the Baltic Sea [10].
In such a context of significant global and regional issues, as well as policies dealing with them, the self-supply with wind energy components (WEC) for the construction of wind farms and, therefore, the development of related manufacturing business is of high importance.
Focus of research. Thus, this paper focuses on a historical and perspective scale that manufacturing companies in Lithuania could use to produce and supply WEC domestically and for export. Particularly, in agreement with [11], it addresses the role of labour productivity (LP) as the most important factor of the above. In line with [12], the paper considers that “…higher productivity comes, at least in part, from preceding investment outlays…” and it takes into account the results of investigations performed by [13], who found that in “…all European countries, a 1% increase in gross investment in tangible goods (G.I.T.G.) per person employed (P.E.) has a 0.0373% long-run effect on apparent labour productivity (A.L.P.) …”.
Goals of research. Taking this into account, the goal of this paper is threefold: (1) an analysis of the economic performance of companies manufacturing WEC for the purposes of identifying drivers of LP, tendency of it, and justification of the role of LP for growth; based on that (2) the determination of the relationship between investment in tangible assets (TA) and change in labour productivity (LP) of companies manufacturing WEC in the country and, finally, (3) taking these into account evaluating the perspective changes in value added (VA) created, net profitability and wages (and salaries) earned by WEC companies in Lithuania.
Aim of research. With respect to the identified goals, this paper aims to assess the development perspectives of WEC companies in Lithuania, taking into account a company’s established link between investment in TA and LP.
Contributions of research. From a practical point of view, the contribution of this research is the fact that, for the first time, WEC manufacturing activities have been identified as a relevant business supporting the Green Deal, analysing its development perspectives from the point of view of changes in LP determined by a function of investment. From a scientific point of view, the descriptive and trend analysis, as well as the analysis of business structure research indicators instead of econometric methods, have been used to understand the links and channels through which the growth of WEC manufacturing companies could be assured.
Organization of paper. The rest of the paper is organized as follows. Section 2 reviews the literature on LP issues. Section 3 briefly introduces the research method applied. Section 4 presents an analysis of the economic performance of WEC companies, determining the ratio of change in LP to investment in TA, drawing the curve of LP to investment in TA, providing perspective estimates of LP and the impacts of investment caused improvements in LP from the perspective of the growth of WEC companies (net profitability and wages (and salaries)) and its contribution to the country’s economy (VA created). Section 5 discusses the results achieved. Finally, in Section 6, the conclusions are drawn.

2. Literature Review

2.1. Concept of Labour Productivity

Freeman [14] defines productivity as the ratio of the outputs of a system to the inputs used to produce those outputs. It can measure efficiency of activity. Productivity measures are used at the level of companies, industries and the entire economy. Frankel et al. [15] stated that productivity can be calculated for all production factors: land, labour and capital. Of all the factors of production, labour is the most basic and most obvious factor used in any production or in the provision of services. The use of any factor of production is impossible without labour [16]. Therefore, when calculating productivity, labour costs should take preference over other costs.
LP is an economic indicator reflecting the performance of an economic system in terms of the quantity of goods and services produced over a given period of time with the use of given resources, per worker or per hour worked. LP measures the hourly output of a country’s economy. In practice productivity is calculated per unit of working time or per worker and integrates actual intensity. In general, intensity is closely related to a worker’s skills and the equipment used in the production process.
Gross domestic product (GDP) or VA are the most commonly used indicators for measuring LP at national level. Therefore, LP is often treated as a measure of the economic performance. Change in LP as a measure could be considered too [17,18]. It is affected by the changes in the amount of capital (tangible and intangible) per employee and the changes in multifactor productivity (MFP) [19], which itself refers to combined inputs, including labour, capital, land, etc. Regardless of the level at which LP is analysed and evaluated, the need to analyse LP is driven by the search for opportunities to promote growth in LP.
An industry advances by using less to make more. In [20], it was stated that improvements in productivity can basically be caused by five different relationships: output increases faster than input; more output from the same input; more output with a reduction in input; same output with fewer inputs; output decreases, but input decreases more. From the perspective of the individual company, the second case is the more ambitious, but from a social point of view, the first case is more ambitious.
In [15], it was argued that LP is an especially sensitive indicator of this economizing process and is one of the main indicators used to measure the economic progress of a country or a sector. The overall increase in a country’s LP means that more goods and services are produced per worker than before. This view is shared by many other studies, including Saari [21], Ross [22] Gomez-Salvador [23], etc.

2.2. Impacts of Labour Productivity

LP is a relevant economic indicator, which is closely interrelated to economic growth [24,25], competitiveness [26,27] and living standards [28] within an economy and wellness [29]. According to Gomez-Salvador et al. [23] “…productivity gains are a key factor driving long-term economic growth and increases in living standards. In the short to medium term, productivity also affects business cycle developments, inflation, exchange rates and other key macroeconomic variables, such as consumption, investment and employment…”. In [30], it was observed that growth in productivity contributes to higher wages, lower prices, higher profits and stronger economic growth. In contrast, poor labour productivity hurts living standards—“…when productivity growth is lower, wage growth tends to be lower too, meaning some families need to work long hours to achieve decent incomes. The result is they have less time to spend with family and in the community….” [31]. Korkmaz et al. [32] confirmed productivity has effects on economic growth by means of reducing input costs and the efficient use of the production factor. In this way, productivity leads to sustainable economic growth in developed countries. Auzina-Emsina [27] investigated the relationship between productivity growth and economic growth of Baltic countries in the pre-crisis and post-crisis period. The results proved that there was a weak relationship between productivity growth and economic growth before the crisis. However, the increase in LP during the crisis was a significant driver of the economy growth after a same period of time. The performed analysis showed that due to growth in LP and the positive impact of other factors, the Baltic countries have gained back the global competitiveness that was lost during the crisis period. LP analysis is necessary seeking to identify opportunities for economic growth in a country and/or a sector and competitiveness. It is, therefore, necessary to analyse the drivers that lead to improvements in labour productivity.

2.3. Drivers of Growth in Labour Productivity

Any production process is a complex and socio-economic system. The reconciliation of the interrelationship between labour, capital and socio-organisational environment into one integrated whole is essential. The promotion of growth in LP depends on the successful identification and use of the drivers of the socio-economic system framework.
Growth in LP depends on three main factors: saving and investment in physical capital, new technology, and human capital [33]. Levanon et al. [34] confirmed that LP depends on the quality of the workers and on how much capital is available per employee. The main factor in increasing LP is the growth in the amount of capital per employee, which is called the capital intensity. LP is determined by the efficiency at which labour and capital are used during the production process, which is called the total factor productivity (TFP). Tang et al. [35] agreed that the effects of different factors on LP are manifested through capital deepening and an increase in TFP. Growth of TFP could be achieved introducing technological innovations and ensuring technological efficiency. The basic premise behind the framework is to measure LP as a function of physical capital intensity, labour quality, and an efficiency-enhancing parameter. Tang et al. [35] confirmed that LP growth is a function of capital intensity, human capital, and technology progress. In [36] capital deepening, growth of labour quality and TFP were segregated as key sources of productivity. These factors have a direct impact on labour productivity.

2.3.1. Human Capital

The concept of human capital is multidimensional, encompassing a person’s knowledge, skills, education, experience, intelligence, creativity, health and other attributes that make it possible to increase a person’s LP and wage income [37]. The human capital also affects economic development. Education and health expenditure are seen as key elements of human capital accumulation [38,39,40]. This means that increasing investment in education and health should lead to higher levels of labour productivity.
According to [41], the investigation performed using the Autoregressive Distributed Lag (ARDL) method in Indonesia showed that the quality of human resources is cointegrated with LP. The outputs of the analysis showed that education (including primary, secondary and tertiary) and health variables have a significant positive impact on LP, especially in the short-run analysis. In the long-run analysis, only primary and secondary educations showed a significant positive influence on LP, while the health variable has a positive but not significant effect. In [42], it was analysed how the three basic levels of education (primary, secondary and tertiary) contribute to the growth in LP in the selected 125 countries in the period 1999–2014. For this analysis, the model was based on the neoclassical production function enhanced with human capital. The results showed that tertiary education has the strongest impact on LP across the considered economies. Similarly, the relationship between the education and the LP across the selected European countries was analysed in [43]. It was found that part of variability in the LP can be explained by the differences in the number of schooling years (measured as the school life expectancy). The results of the performed analysis also confirmed the importance of education in countries across Europe. Le et al. [44], using the ARDL model and the Granger causality test with the data of the 1986–2014 period in Vietnam, affirmed that human capital and foreign direct investment has a positive impact on LP in the long-term. The results revealed that that more investment should be directed to education and training. Numerous scholars [45,46,47] have emphasised that the health of an employee is related to productivity, i.e., healthy people are more productive. Therefore, the impact of investments in improving health on LP is direct.

2.3.2. Capital Intensity

Numerous studies on the EU, Canada, the USA and other countries have pointed out the importance of tangibles and, especially, intangibles for growth in LP of the advanced countries.
The authors in [48] analysed the relationship between intangible capital and growth in LP using the largest, up-to-date macro database (2000–2015) of 16 EU countries. The relationship was disclosed during the global economic crisis (2008–2013) and the recovery of economies (2014–2015). The results of the analysis showed that intangibles were the dominant source of growth in LP in EU, explaining up to 66% of growth. During the economic crisis, in contrast to tangible capital, the results detected a solid positive relationship between intangibles and growth in LP, and for the economic recovery period the results confirmed a highly significant and remarkably strong relationship between intangible capital and growth in LP. A study at the macro-level on investment in TA and intangible assets (IA) for European countries and the USA over the period 2000–2013 was performed in [49]. It was found that capital deepening was the main driver of growth in LP, with TA and IA accounting for 80% and 20% in the EU, while both accounting for 50% in the USA. The authors in [50] analysed the relationship between the current level of LP and a set of indicators representing investments, human capital and organisational capabilities. This empirical study also confirmed the immediate positive impact of intangible investments and a lag-distributed positive impact for tangible investment. An analysis of LP and its determinants in the manufacturing and service sectors of Kenya, based on the World Bank’s Enterprise Survey’s database for 2013, was carried out by [51]. Their results showed that capital intensity significantly and positively affected LP. In [52], a medium-run approach was applicated in order to investigate the development of LP and the components of six advanced economies after the global economic crisis of 2007–2009. The performed analysis provided evidence that a lack of investment was one of the major factors for the slowdown of growth in LP. An analysis of two different types of capital services (information and communication technologies (ICT) capital services and non-ICT capital services) revealed that the contribution of ICT capital deepening to growth in LP was much lower in European countries than it was in the USA before the economic crisis. In [53], it was argued that capital accumulation is the main driving force of growth in LP. This evidence was based on the established relationship between growth in LP and ICT capital development using the set of data of 14 OECD countries during 1995–2005 and a non-parametric approach. However, this study found that ICT capital could produce an opposite effect on growth in productivity: an increase through capital accumulation and a decrease through technological change. This result confirmed the hypothesis that ICT technologies require complementary investments, i.e., without complementary investments, the LP gains from ICT capital will not be fully realised. In [54], a review of the literature provided evidence of the increasing role of investment in IA in explaining the dynamics of LP change. The findings of the literature review argued that additional investment in IA by firms is needed to reap the full benefits of investment in ICT and artificial intelligence (AI). The importance of IA for the transformation of the developed economy into a fully-fledged knowledge economy is widely recognised in the literature. In [55], researchers found that foreign direct investment improves the LP of the host country, which causes a positive impact on economic growth, both in the short- and in the long-run; therefore, in order to maintain long-run sustainable LP, foreign direct investment must be enhanced. This conclusion was based on an analysis of the data of 19 OECD countries during 1980–2009, using the generalized method of moments to study the causalities between foreign direct investment, LP and economic growth. In [56], an empirical analysis was carried out covering 32 countries and 30 industries between 1990 and 2014 in order to test the hypothesis that access to finance was more important for growth in productivity in intangibles-intensive sectors. The research results confirmed that it varies according to the institutional set-up of a given country and specific sectoral characteristics such as IA intensity, financial structure and dependence on external finance. In general, intangible investment is becoming an increasingly important driver of productivity growth in OECD countries. The authors in [57] presented the results of an econometric analysis using the EU KLEMS 2019 data, which covers EU, USA and Japan, focussing on the role of ICT and IA employing a growth and confirmed that ICT capital and IA are related to economic competences (in particular, advertising and market research assets) and are important drivers of output and growth in LP. The results suggested that economic policies should facilitate the accumulation of IA and ICT capital, which are indispensable for growth in productivity and competitiveness. The authors in [58] examined the contribution of IA to growth in LP in the Canadian business sector. Analysis results showed that investment in innovative property and investment in economic competencies (i.e., investments in human capital via management and training investments as well as management consulting services) made a significant contribution to annual growth in LP: around 0.2–0.3 percentage points of growth in LP in the business sector. In [59], the study stated that growth in LP in major advanced countries has been experiencing a slowdown in recent years. An examination of low growth in LP in Japan using the growth accounting framework to decompose led to the conclusion that this was affected mainly by a slowdown in TFP. Japan’s productivity decline was due to underinvestment in IA. Therefore, investment in IA is essential in order to lead to technological innovation and productivity improvements. In [60], it was observed that “… a weakness or a slowdown in ICT investment can therefore negatively affect MFP and labour productivity growth…”. Furthermore, long-lasting structural problems, including financial and economic crises, led to the slowdown of LP in developed and emerging economies. In [13], the results of the study showed a negative and inverse relationship between LP and the level of investment (investment in TA divided by VA), i.e., changes in apparent LP led to changes in investment in TA, but not vice versa. The negative correlation between apparent LP and the level of investment indicated that investment in TA is ineffective.

2.4. Factors of Slow down in Labour Productivity

The potential impact of climate change on LP is an important economic issue. Negative changes in LP will have a direct impact on national output and personal income. Changes in the environment conditions are affecting LP. Current climate change already negatively affects LP, particularly in tropical countries. In [61], an empirical multi-model study based a large collection of micro-survey data aggregated to sub-national regions across the world was used to estimate the robust global and regional temperature and wet-bulb globe temperature exposure-response functions for labour supply. Study results confirmed that future warming will have a significant negative impact on LP. These results provided evidence that the effect of temperature on labour supply is heterogeneous across the world regions and work conditions. The results of this study [62] showed that climate change will result in declines of up to 17% in daily outdoor LP by the end of the century, under a high warming scenario. The largest impacts for LP are projected for Southern Europe. In Northern European countries, the average daily outdoor productivity will also decline with climate change. However, in these countries, the decline in LP is much smaller than in Southern European countries and will be around 2–4% by the end of the century. Study [63] also confirmed that LP could be 1.6% lower in Europe in the 2080s, with a clear geographical gradient showing that southern and eastern regions are much more affected due to global warming and the resulting increase in heat stress. Reduced LP also reduces GDP, which can put more pressure on economic growth in countries that would otherwise grow faster. An analysis performed by [64] showed that temporary employment has a negative impact on productivity growth, especially in skilled sectors. The decrease in LP growth would be about 1–1.5% in skilled sectors and 0.5–0.8% in unskilled sectors when the share of temporary employment increases by 10 percentage points. In [65], the authors found that high shares of temporary employment had a negative impact on the company’s investment in innovations. An analysis of the impact of some socio-economic drivers on the dynamics of LP performed by [66] confirmed that the share of temporary employment in total employment is likely to be a drag on productivity.

2.5. Policies and Strategies for Growth in Labour Productivity

Various policies and strategies could be employed to improve LP. In [17], the policy taxonomy for the improvement of productivity was given. This included policies for knowledge creation (for example, coherence and transparency of regimes of intellectual property rights, university-private sector collaboration, public investment in higher education and basic research, etc.), knowledge diffusion (for example, injecting competition, trade and investment agreements, etc.) and efficient reallocation of resources (for example, housing policy to support mobility, adult learning, etc.). In [66], nine points for a new productivity strategy in Europe were given in light of slowed down productivity in the region. Strong innovation policy, targeted promotion of technology diffusion and sustainable investment were identified as key pillars of the proposed new productivity strategy. In [67], the idea of improving skills development to improve LP was proposed, particularly for industries. Particularly, apprenticeships and retraining the labour force through appropriate training was found to be a solution. Sustainable investments in research and development (R & D) are needed with a special focus on upgrading technology to boost LP. In [68], the analysis of about one thousand small businesses in Spain showed that social responsibility policies could contribute to short-term growth in LP. In [69], it was argued that labour market policies, including employment protection legislation, minimum wages, parental leave and unemployment benefits, could influence productivity through impacts on employment. In general, due to growth in employment the improvement in LP could slow down as more low-skilled employees find jobs. Therefore, incentives for employees to invest in training are needed. However, the channels of the impact of labour market policies on LP are found to be multiple in [69]. Based on a UK analysis [70], LP policies could include R & D tax credits to increase innovation activity and a reduction in corporation tax rates to impact investment in enterprises. The authors in [71] proposed restoring declines in LP by implementing policies oriented towards: the investment in human capital, which will foster a more-educated and more-skilled labour force; the technology and infrastructure available to employees; governmental spending on R & D and infrastructure; reforms in the intellectual property system to promote innovation; and limitations to unnecessary regulations and impediments to new business formation. In [36], it was stated that when seeking to improve productivity, the policies should address investment in human capital and technology improvement for better access to information; accessible and affordable education; and investment in ICT. Based on the established relationship between LP and competitiveness in Vietnam in [26], it was proposed to focus on policies developing thinking and creative capacity, creating dynamic and flexible workers, attracting all economic sectors in a way they take part in human resource training for the purpose of improving competitiveness.

3. Research Method

Object of research. The paper analyses the development of the LP of companies manufacturing WEC in Lithuania from the perspective of investment in TA and in relation to the economic development of WEC companies. A total of 40 companies manufacturing different WEC were identified in Lithuania. The companies were grouped in accordance to Statistical Classification of Economic Activities in the European Community, Rev. 2, in a way that at least 3 WEC companies made a group. This is the confidentiality requirement set by Lithuania Statistics [72]. The following groups have been identified:
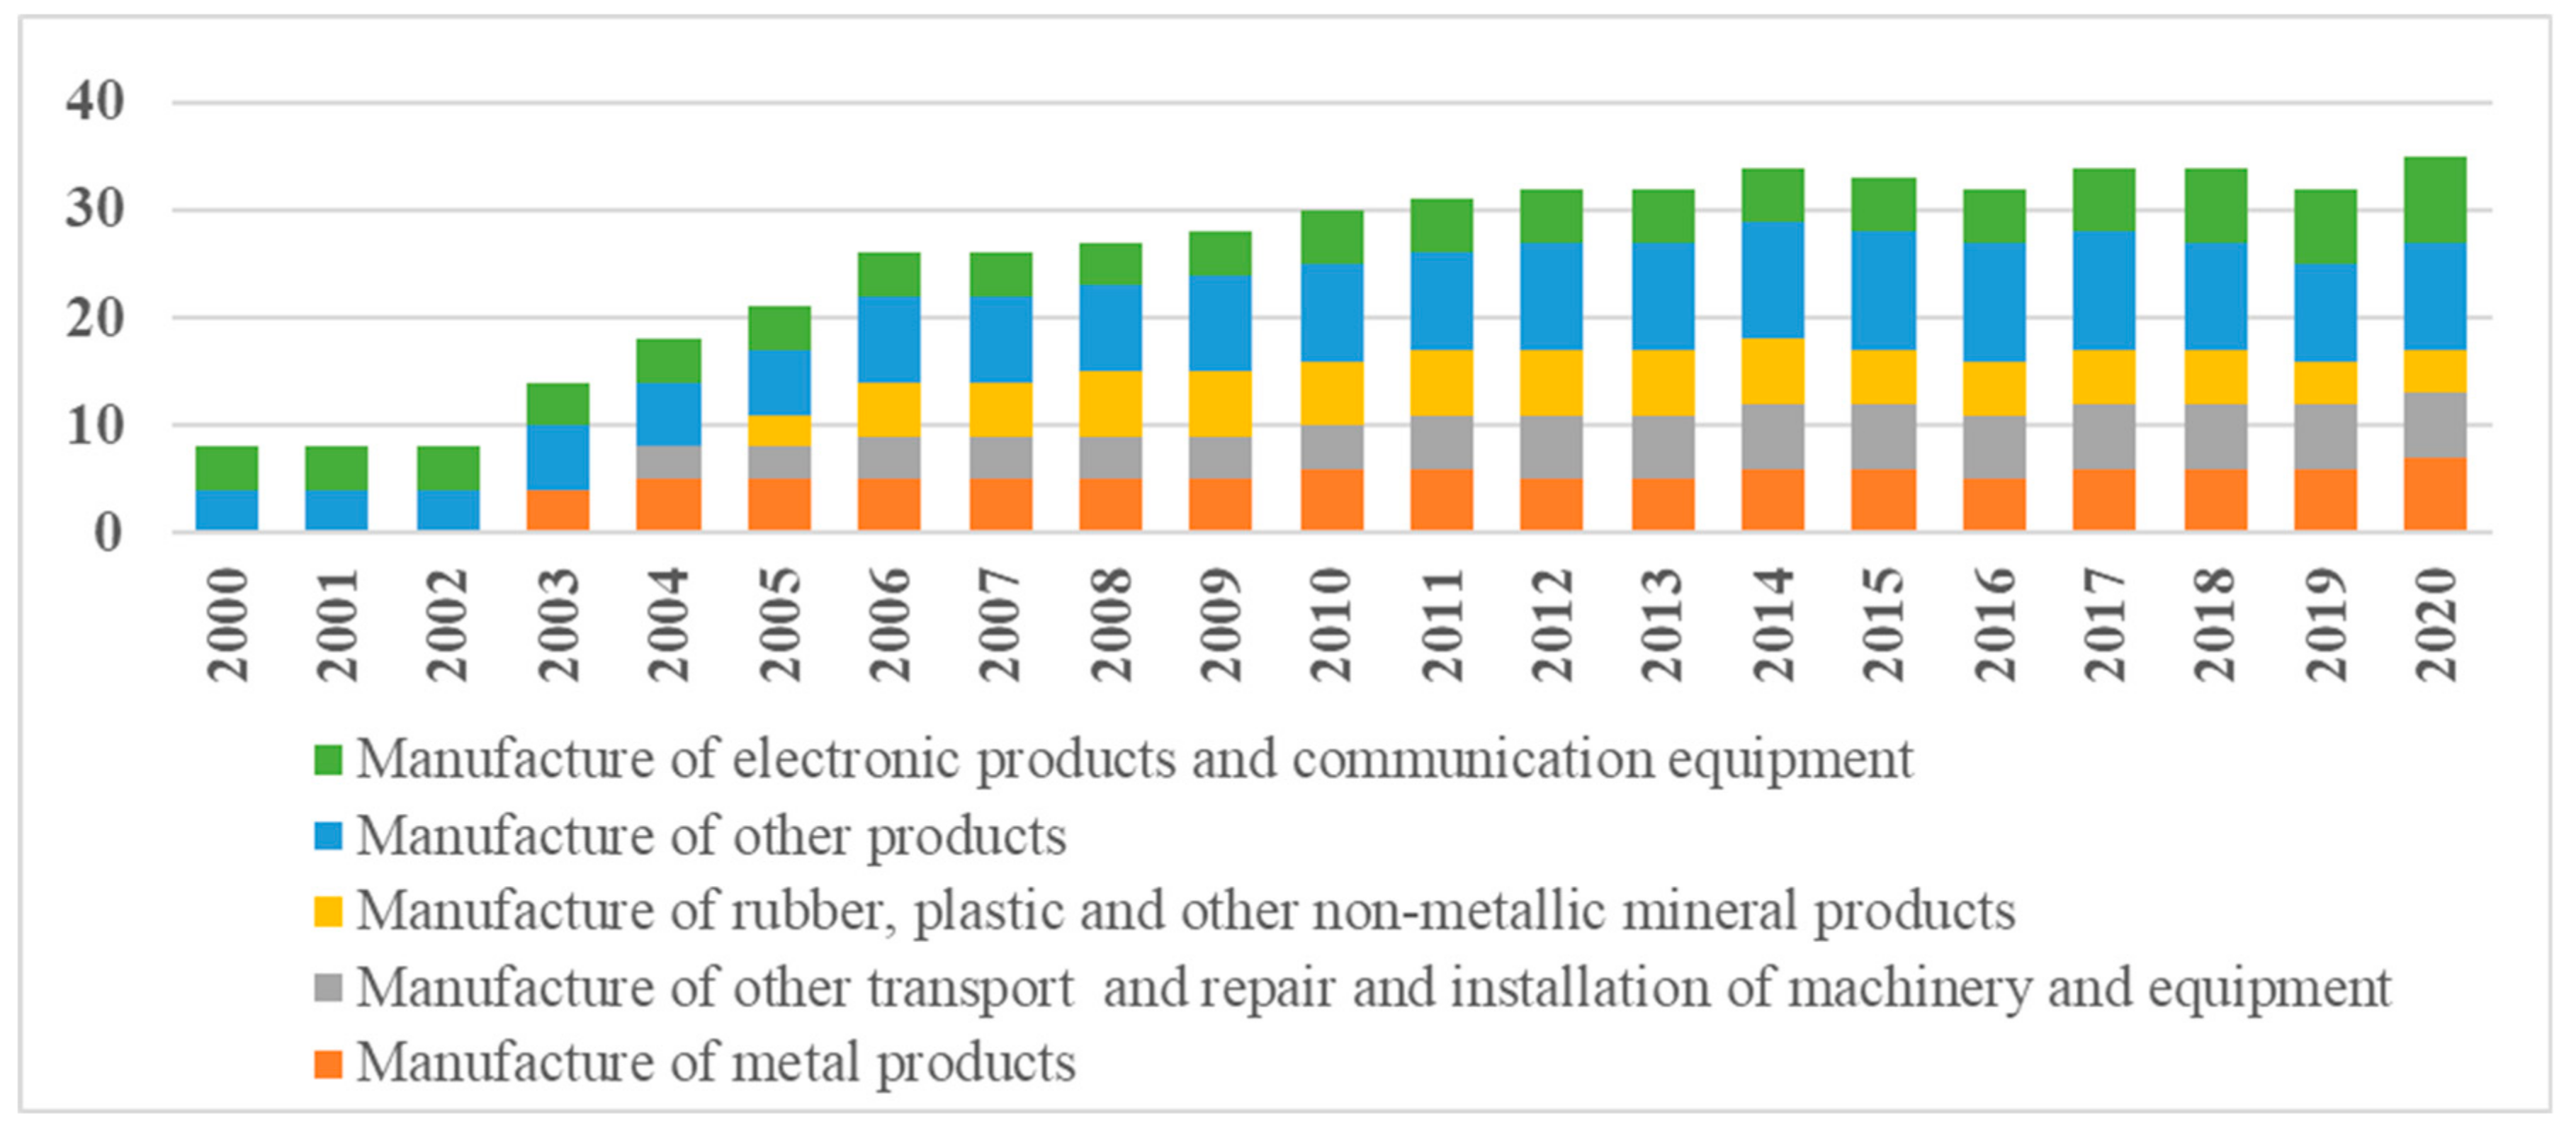
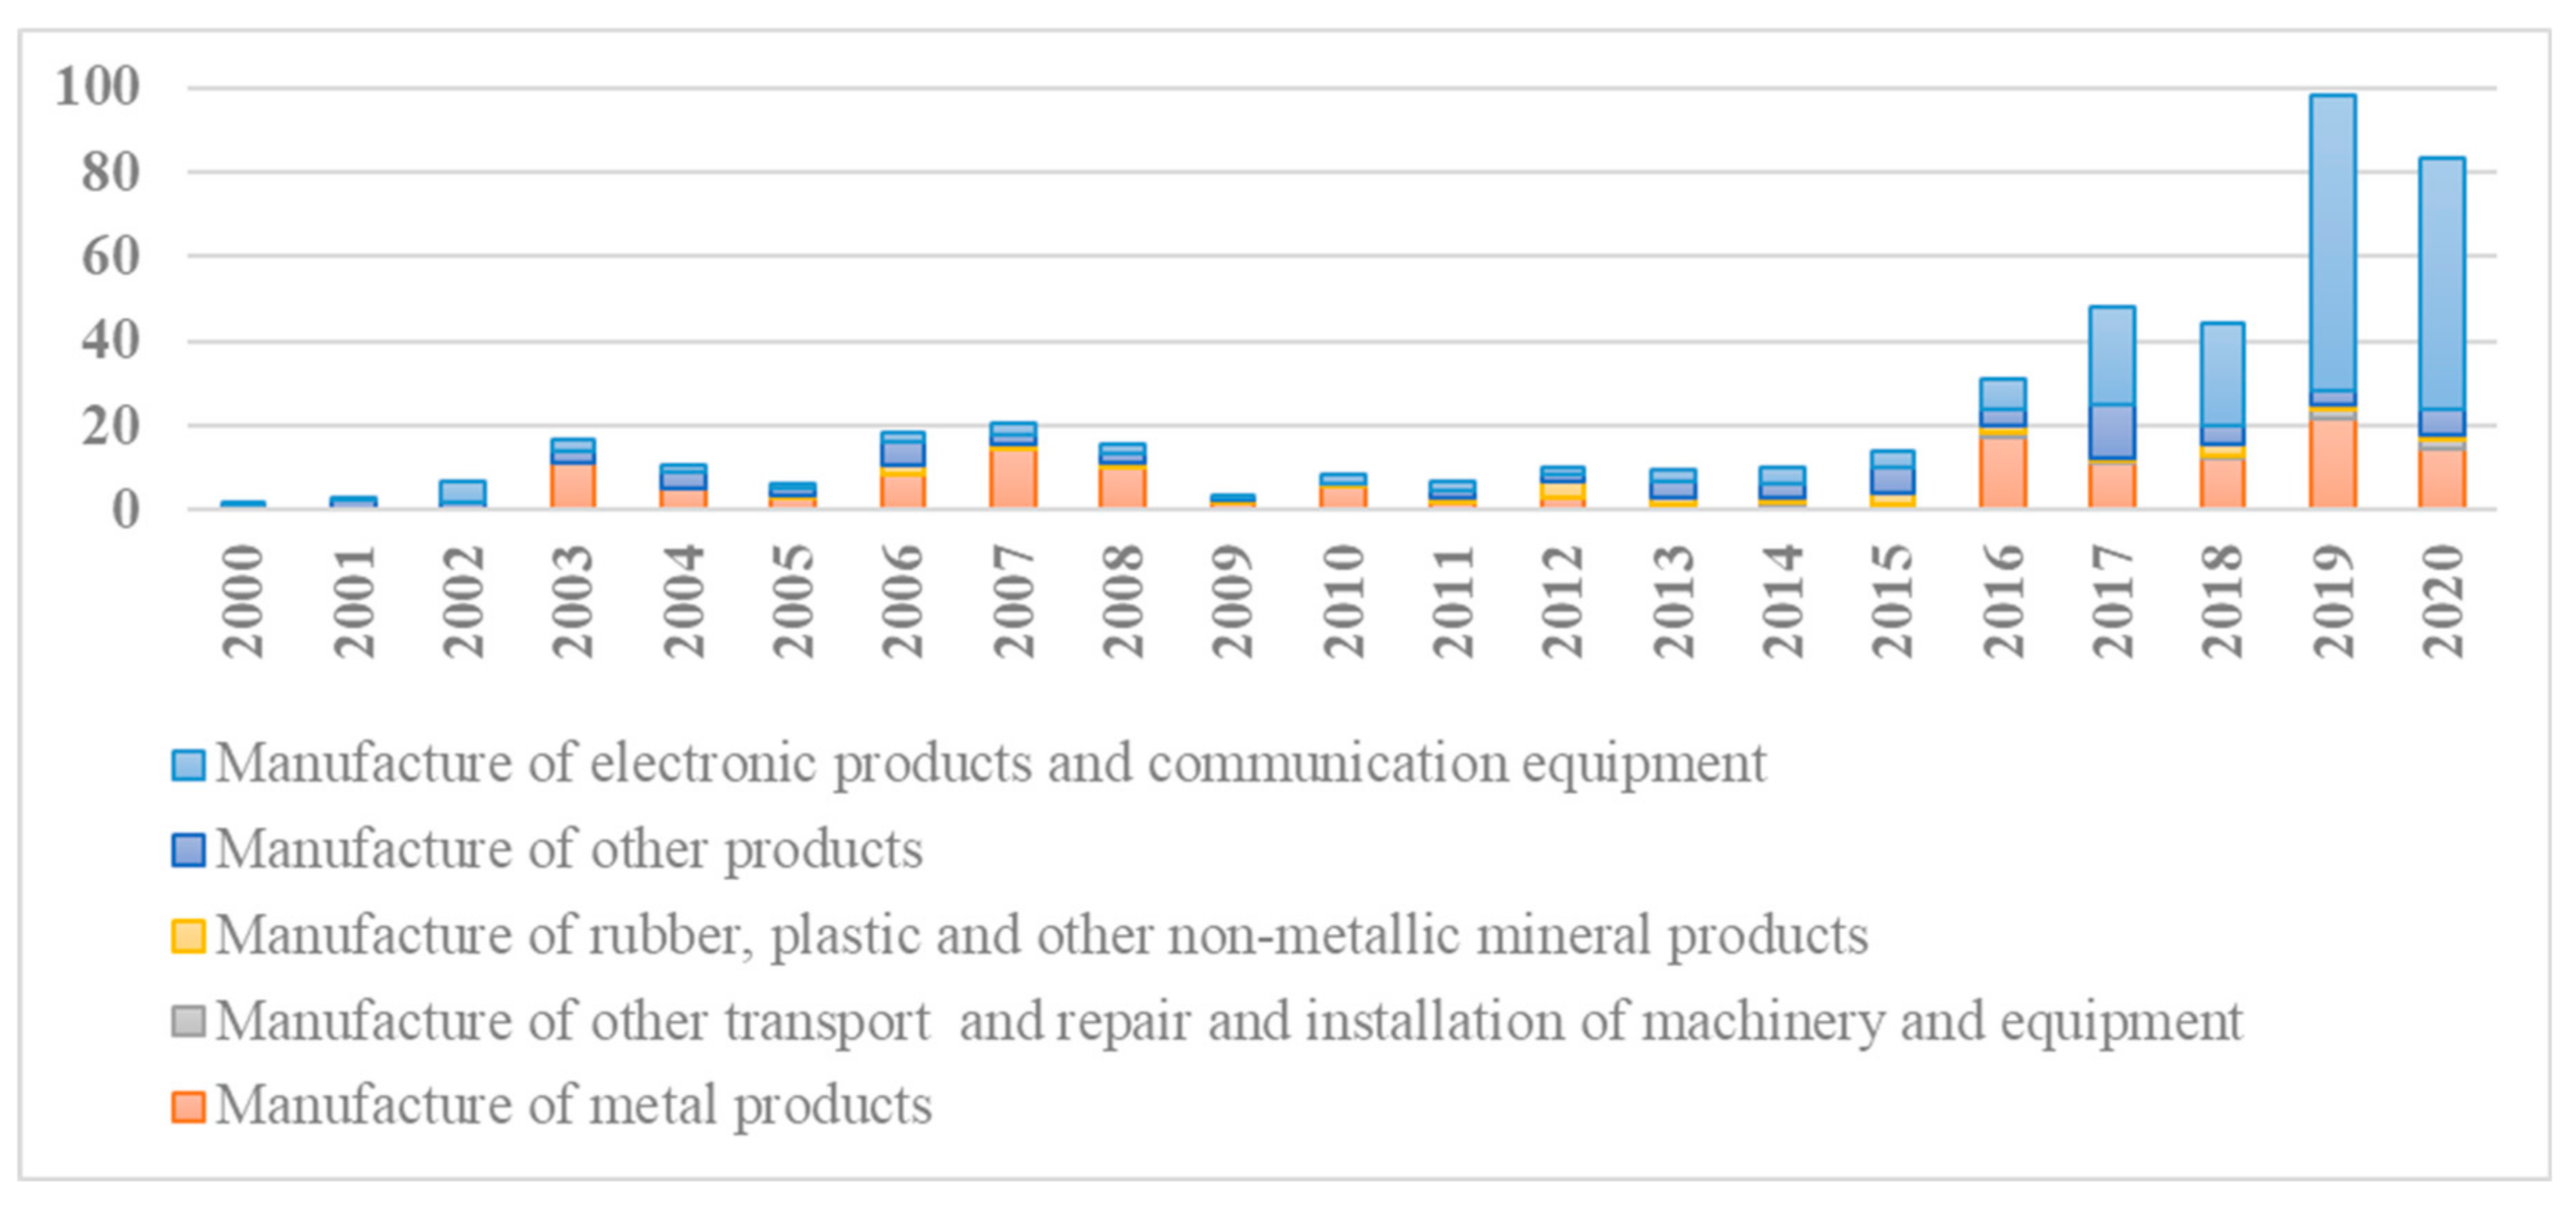
  • Manufacture of metal products;
  • Manufacture of rubber, plastic and other non-metallic mineral products;
  • Manufacture of electronic products and communication equipment
  • Manufacture of other transport and repair and installation of machinery and equipment;
  • Manufacture of other products.
Figure 1 provides information about the number of WEC companies, the data of which have been extracted from the database of Lithuania Statistics and covered by the paper.
The following hypotheses of development of LP and its impacts were formed:
Hypothesis 0 (H0).
Real investment in TA is a relevant driver of improvement in LP in companies manufacturing WEC in Lithuania.
Hypothesis 1 (H1).
Improving LP impacts on growth of WEC companies.
Data collection. Data for H0 and H1 hypothesis testing were collected during December 2021 by Lithuania Statistics based on the list of grouped WEC companies, which themselves were identified between March and July 2021. Lithuania Statistics provided the time series of business structure and finance indicators, i.e., both time series data and cross-sectional data were collected.
Time spam. The time series covered the period 2000–2020. It responds to the beginning of the performance of economic activities of WEC companies and includes their development over the next 20 years. This is a sufficient time span to observe trends and, based on that, to develop forecasts for 2030, which coincides with the time period of the European Climate and Energy Framework.
Steps of research. The analysis of LP of WEC companies was conducted taking in account the approach of the step-by-step implementation of research activities with reference to the activity-specific research methods and indicators, as shown in Figure 2.
The research was accomplished on the strength of five formulated research activities: are the names of the constructs in Figure 2, as described below:
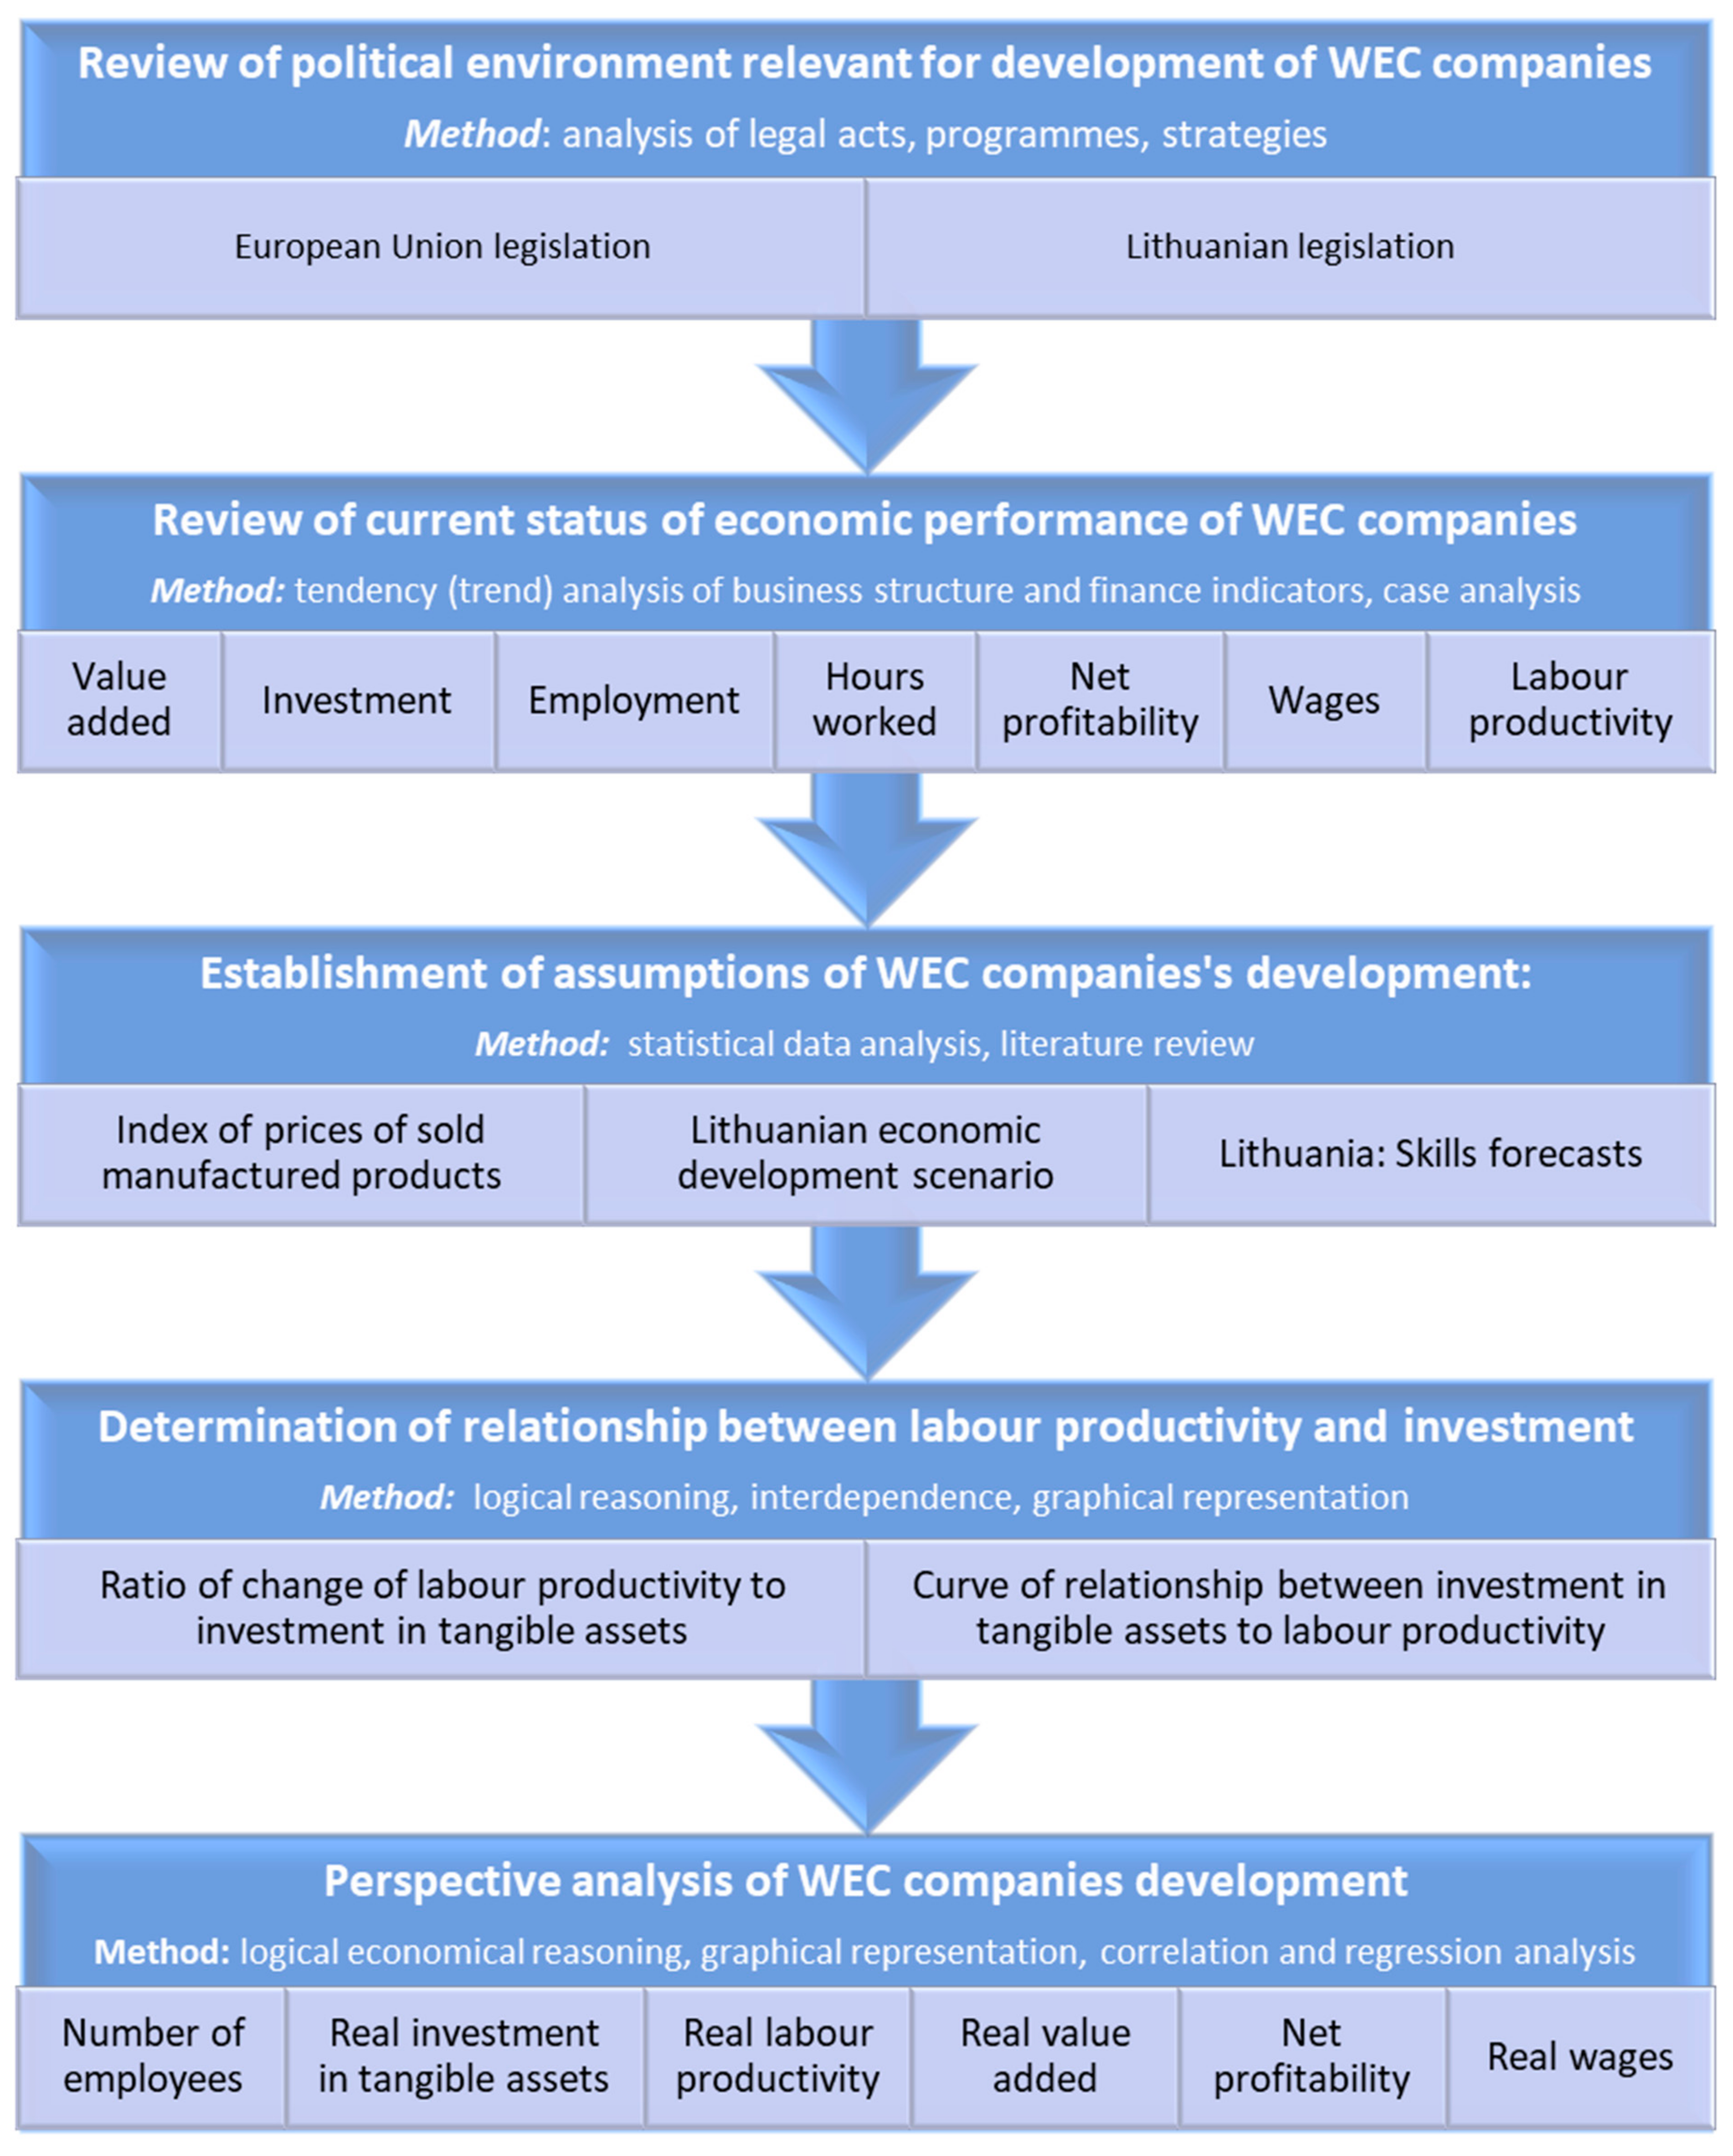
  • Firstly, a review of EU and Lithuanian legislation was performed. Its results allowed justifying the increasing demand of economic activities performed by the WEC companies in the country.
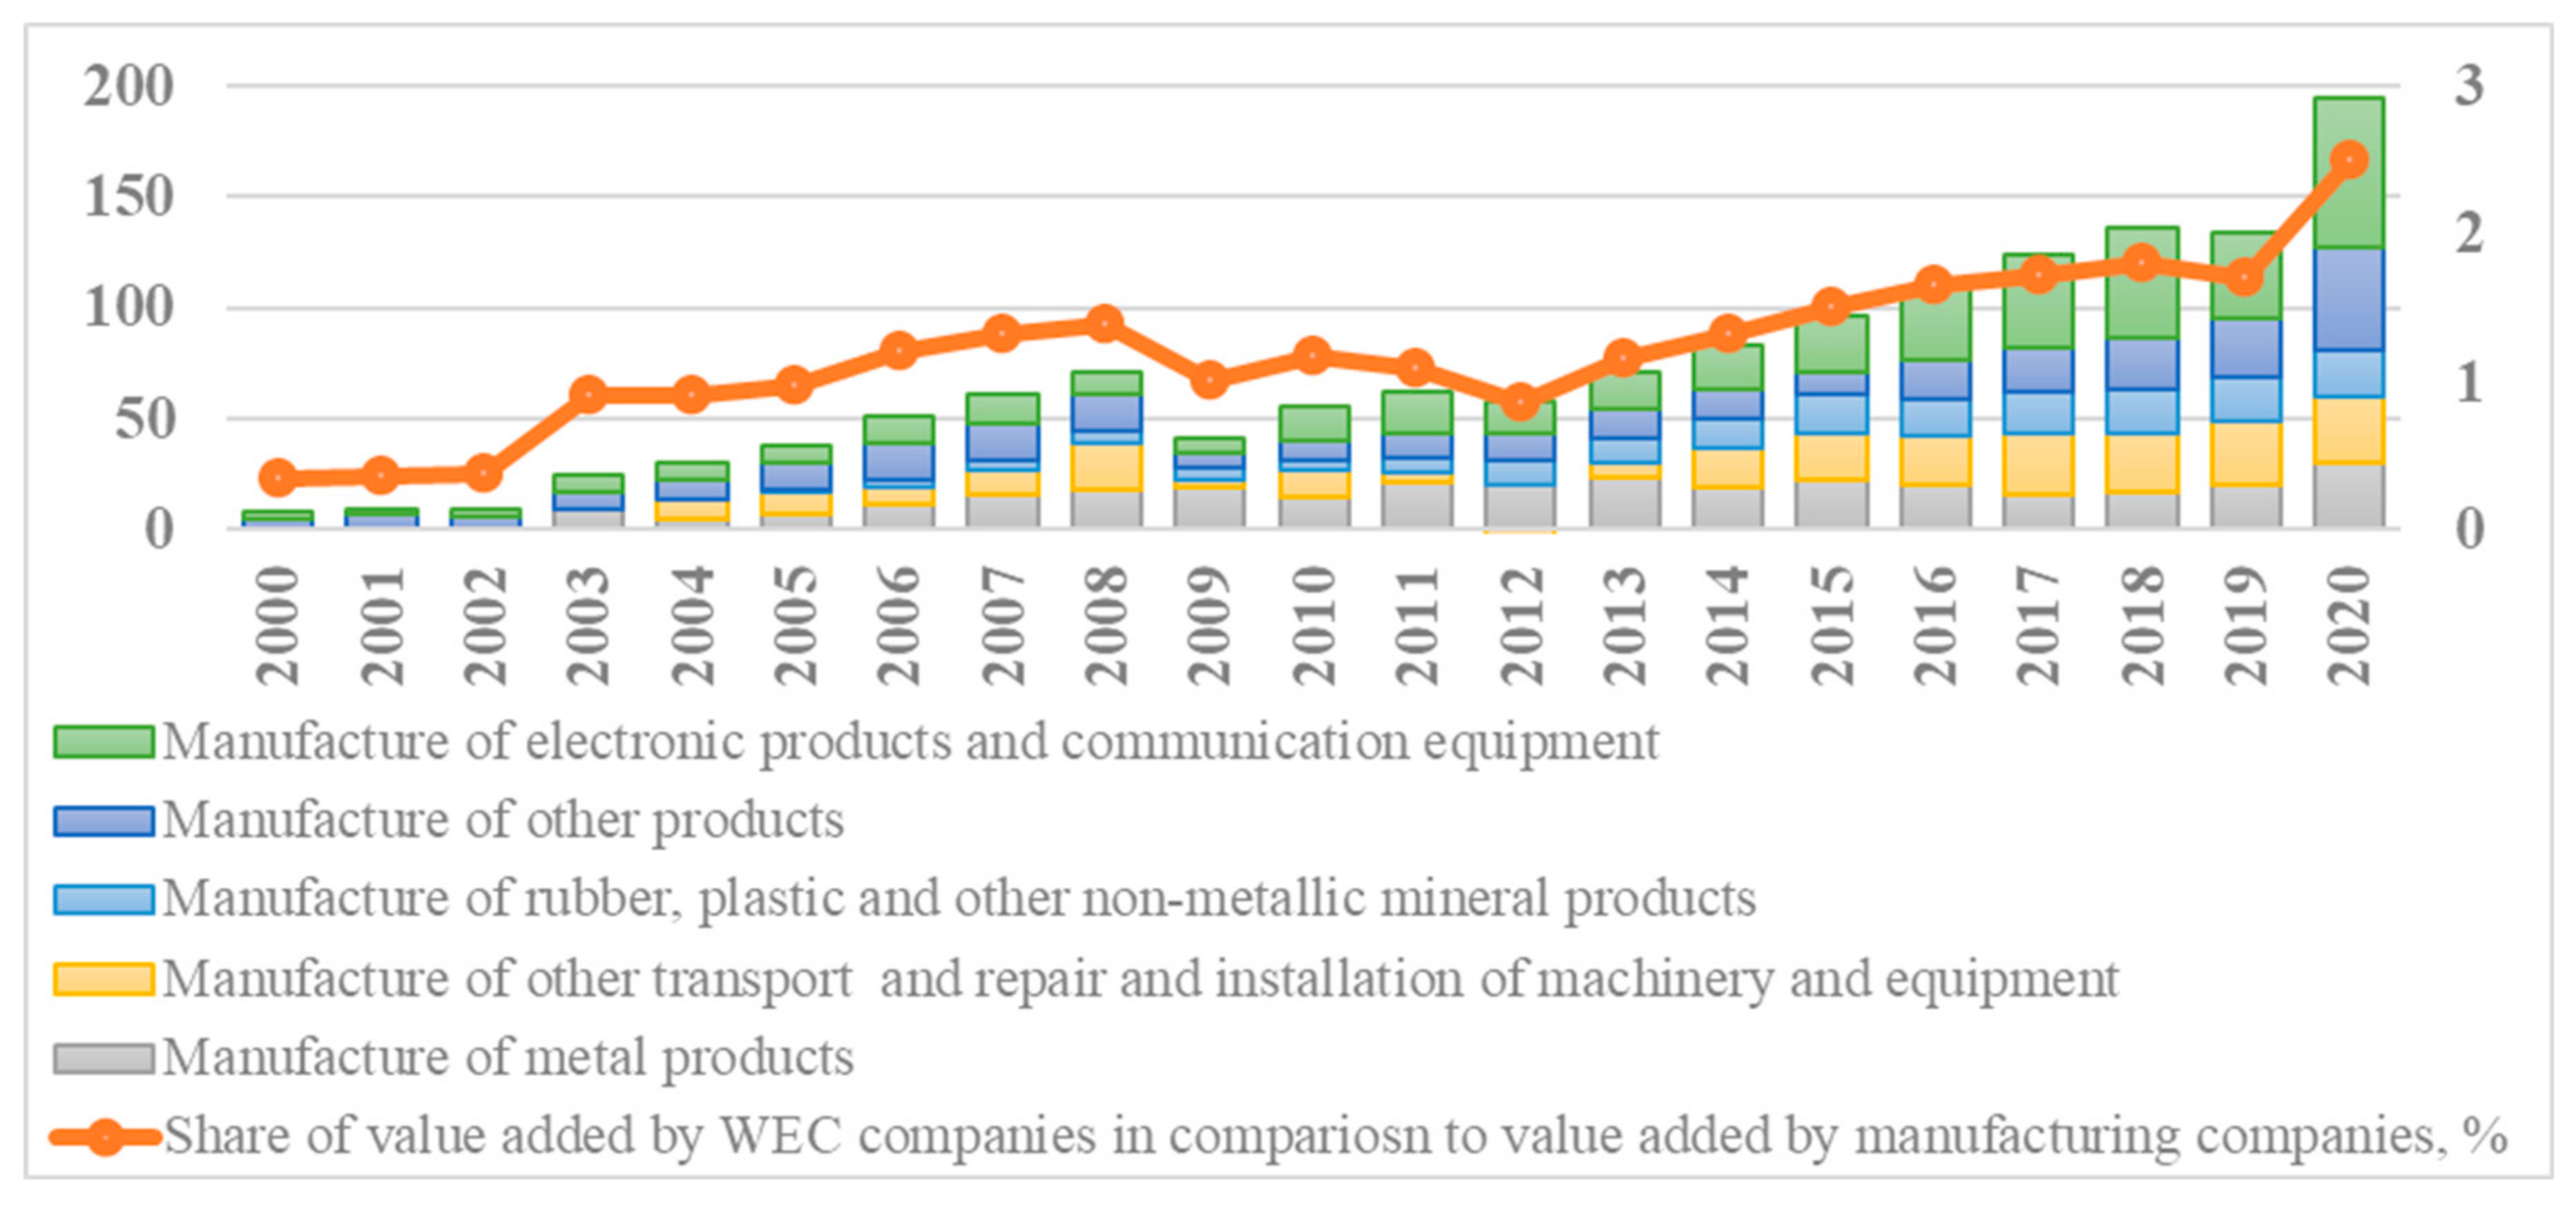
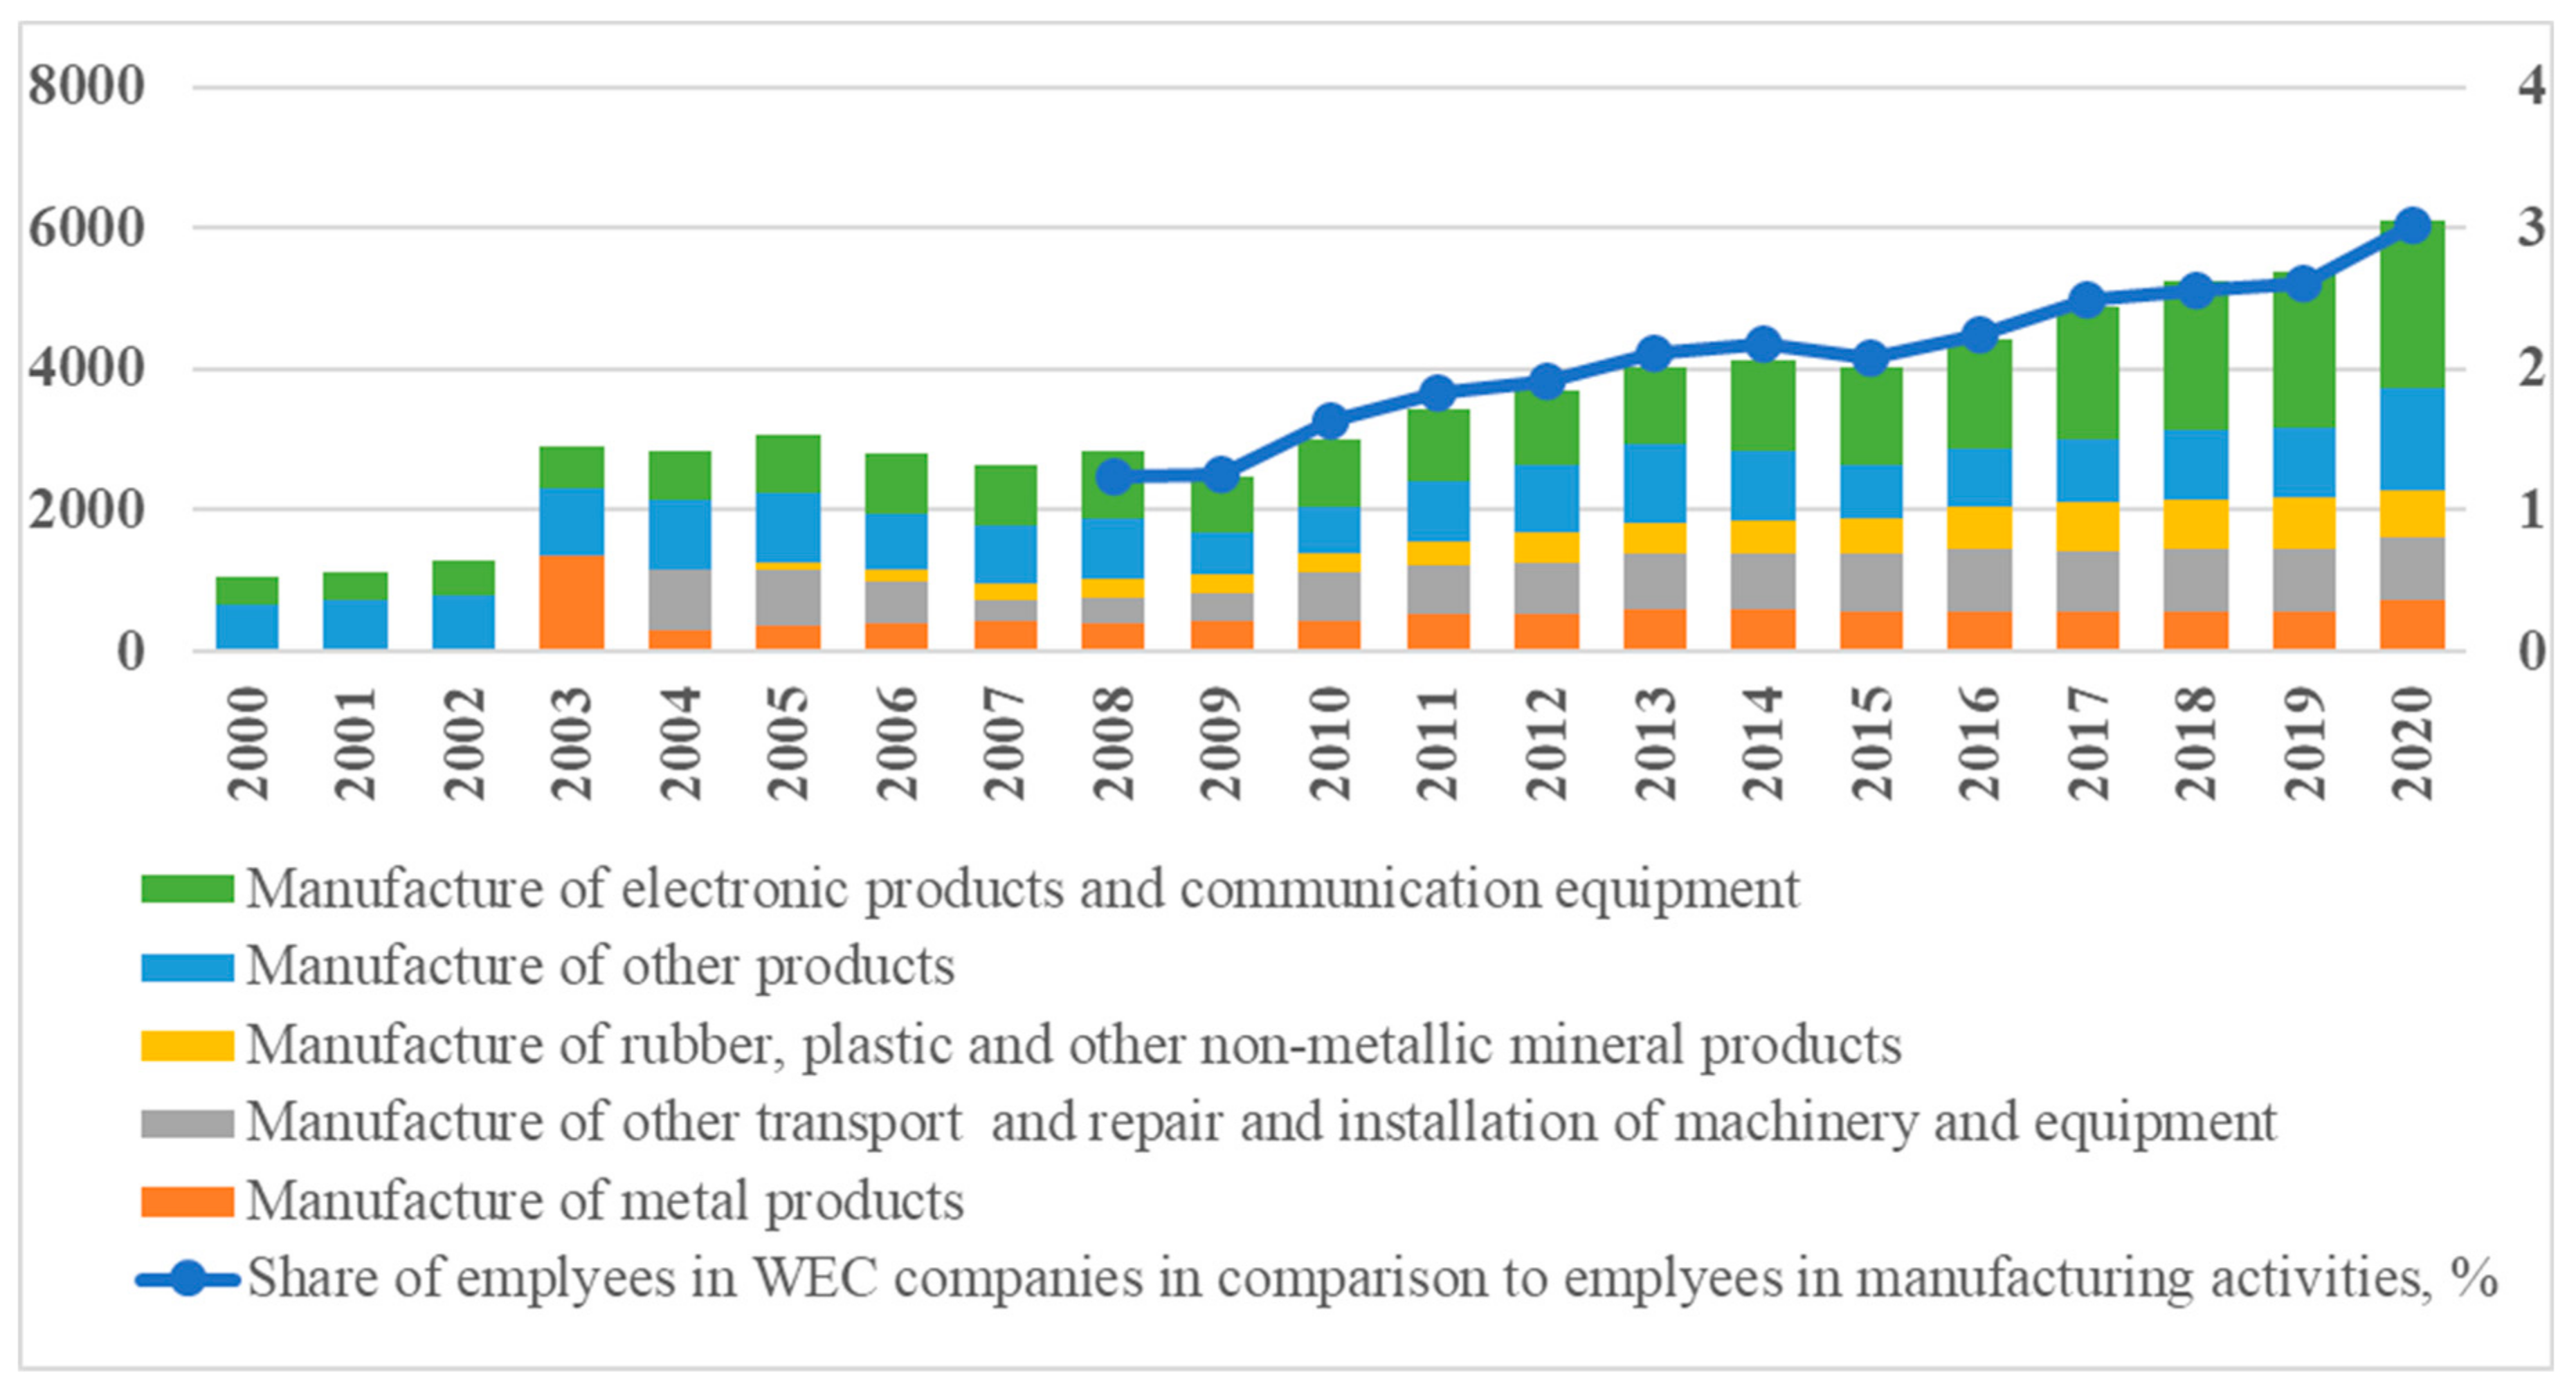
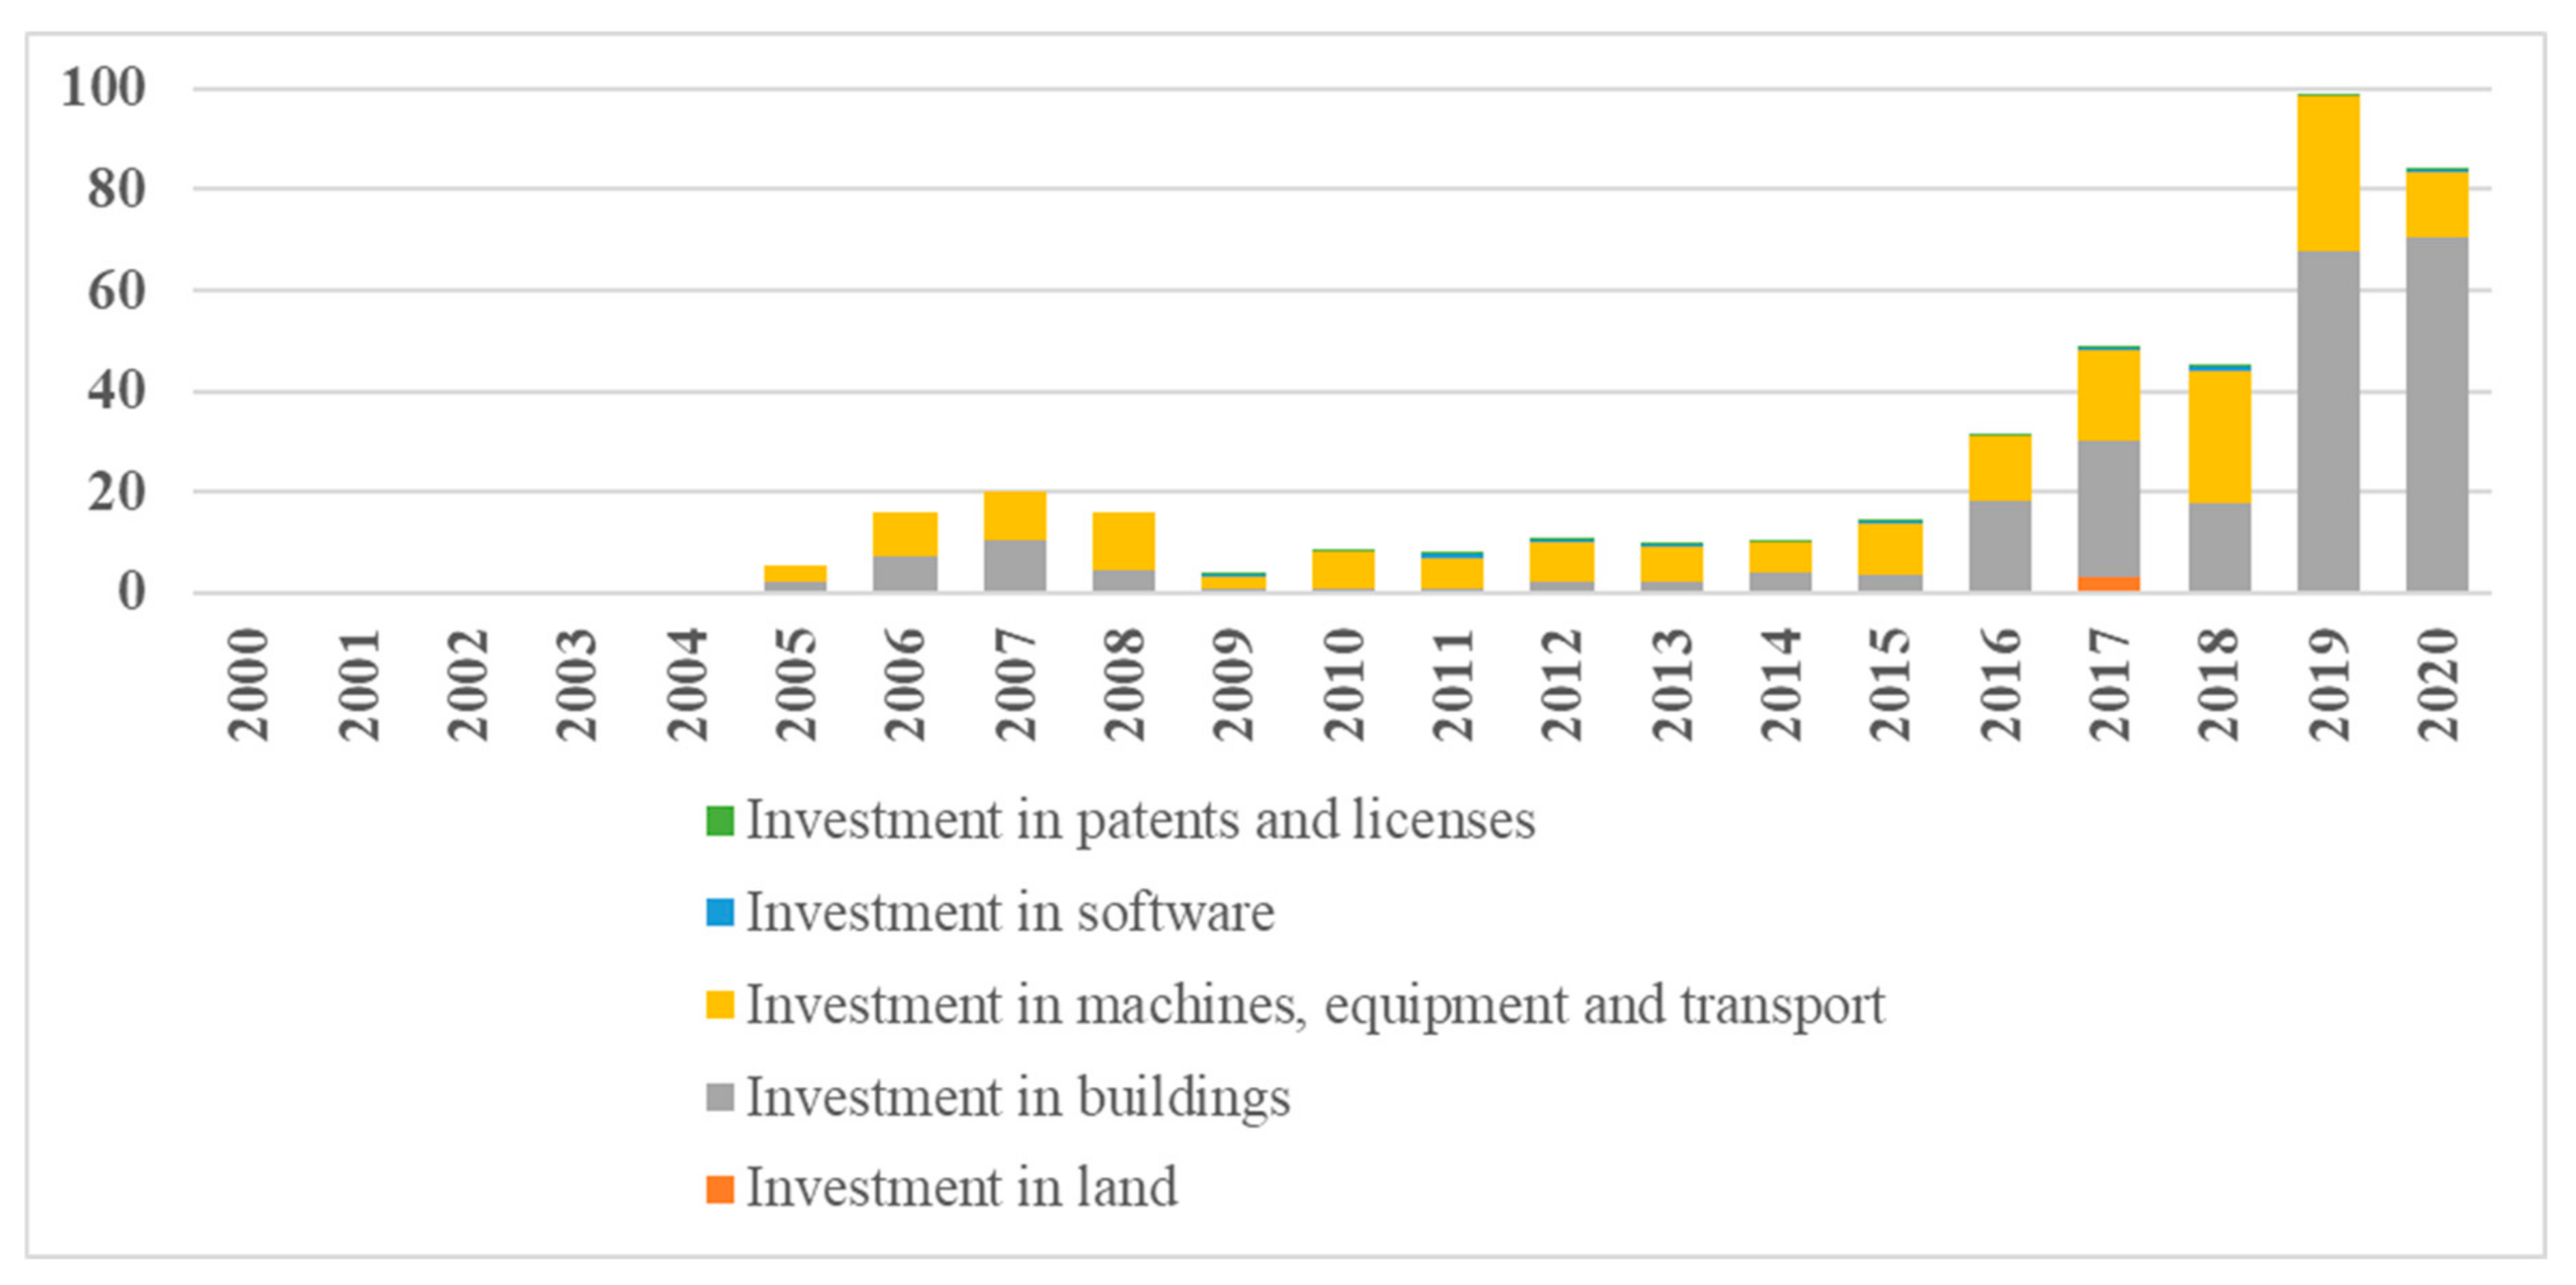
  • Secondly, the current status of the WEC companies was analysed. The business structure and finance analysis method were used to disclose the structure and scale of manufacturing activities of WEC companies in terms of VA created, persons employed and hours worked, investments made and profits (losses) earned.
  • Thirdly, assumptions of WEC companies’ development were determined considering the Lithuanian Economic Development Scenario prepared by the Ministry of Finance of the Republic of Lithuania [73] and the publication of [74]. These important sources of information were used to understand the changes in LP and employment in the future. Furthermore, data were compared corresponding to the average values of WEC companies. Then, decisions were taken about assumptions for the perspective analysis of WEC companies’ development. Particularly, the Index of Prices of Sold Manufactured Products (2000 = 100%) provided by Lithuania Statistics [75] was applied to eliminate the impacts of price changes on nominal values of different indicators.
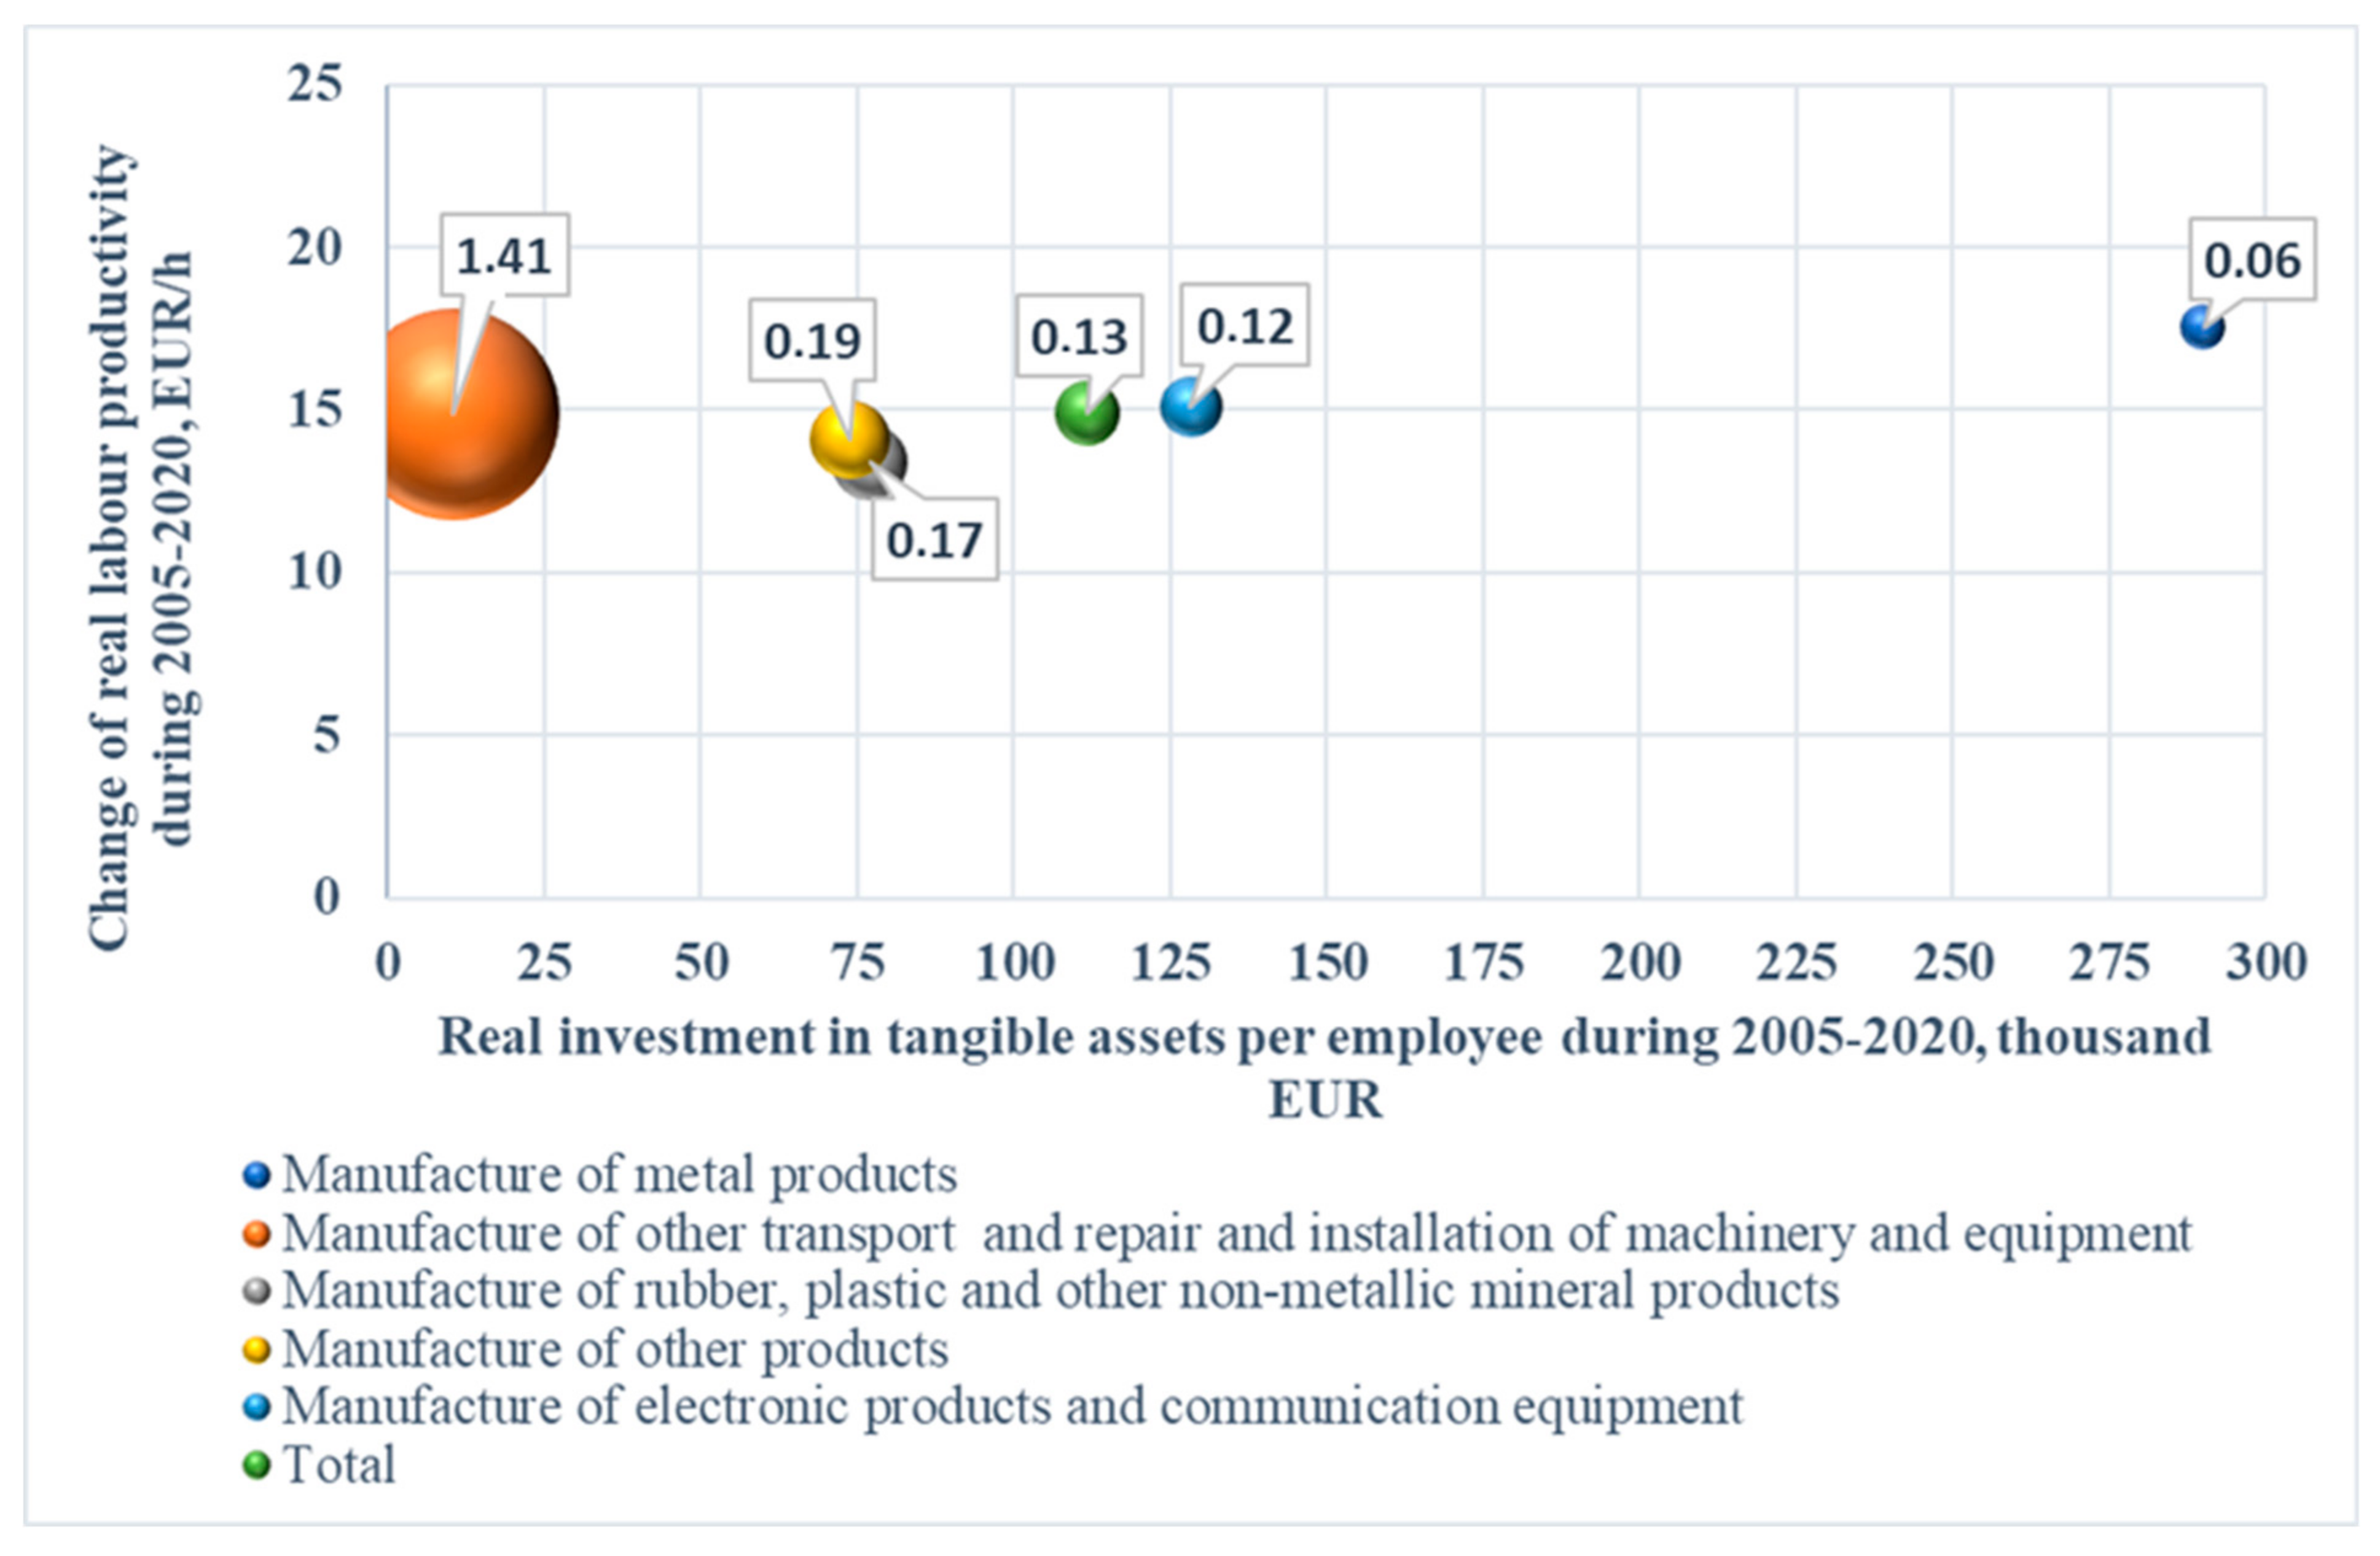
  • Fourthly, the relationship between LP and investment in TA was determined, as the paper focuses on the impact of LP as a factor of investment on economic performance in terms of VA created by WEC companies. For that purpose, the ratio of change in LP to investment in TA was calculated. It showed the scale 1000 EUR of investment in TA per employee makes on a change in LP of that employee. The indicator was used to draw a curve showing the relationship between the demand of investment requested to achieve the expected value of LP.
  • Fifthly, the logical economical reasoning and interdependence as a strategy was used in making forecasts of economic performance of the WEC companies with a focus on the impact of changes in LP. In detail, the number of employees was calculated based on:
E t = E t 1 × 1 + e t    
here Et−1—number of employees during year t − 1, et—percentage change of employees referring to [74].
Real investment in TA was calculated based on:
I T A ,       t = I T A ;   E ;   T   × E t  
here I T A ;   E ;   T —investment in TA per employee during time period T (2005–2020).
Ratio of change in LP to investment in TA per employee during time period T based on:
R = L P 2020 L P 2005 I T A ;   E ;   T
here LP2020LP in 2020, LP2005LP in 2005.
Real LP was calculated based on:
L P t = L P t 1 + R × I T A ;   t
here LPt−1LP during year t − 1.
Real VA was calculated based on:
V A t = L P t × H ¯ E ;   T × E t
here H ¯ E ;   T —average hours a year worked by employee during T.
The correlation and regression analysis methods were employed to assess the interdependence between LP and net profitability and real wages of WEC companies. Taking into account the results, forecasts of the latter economic indicators were prepared.

4. Results

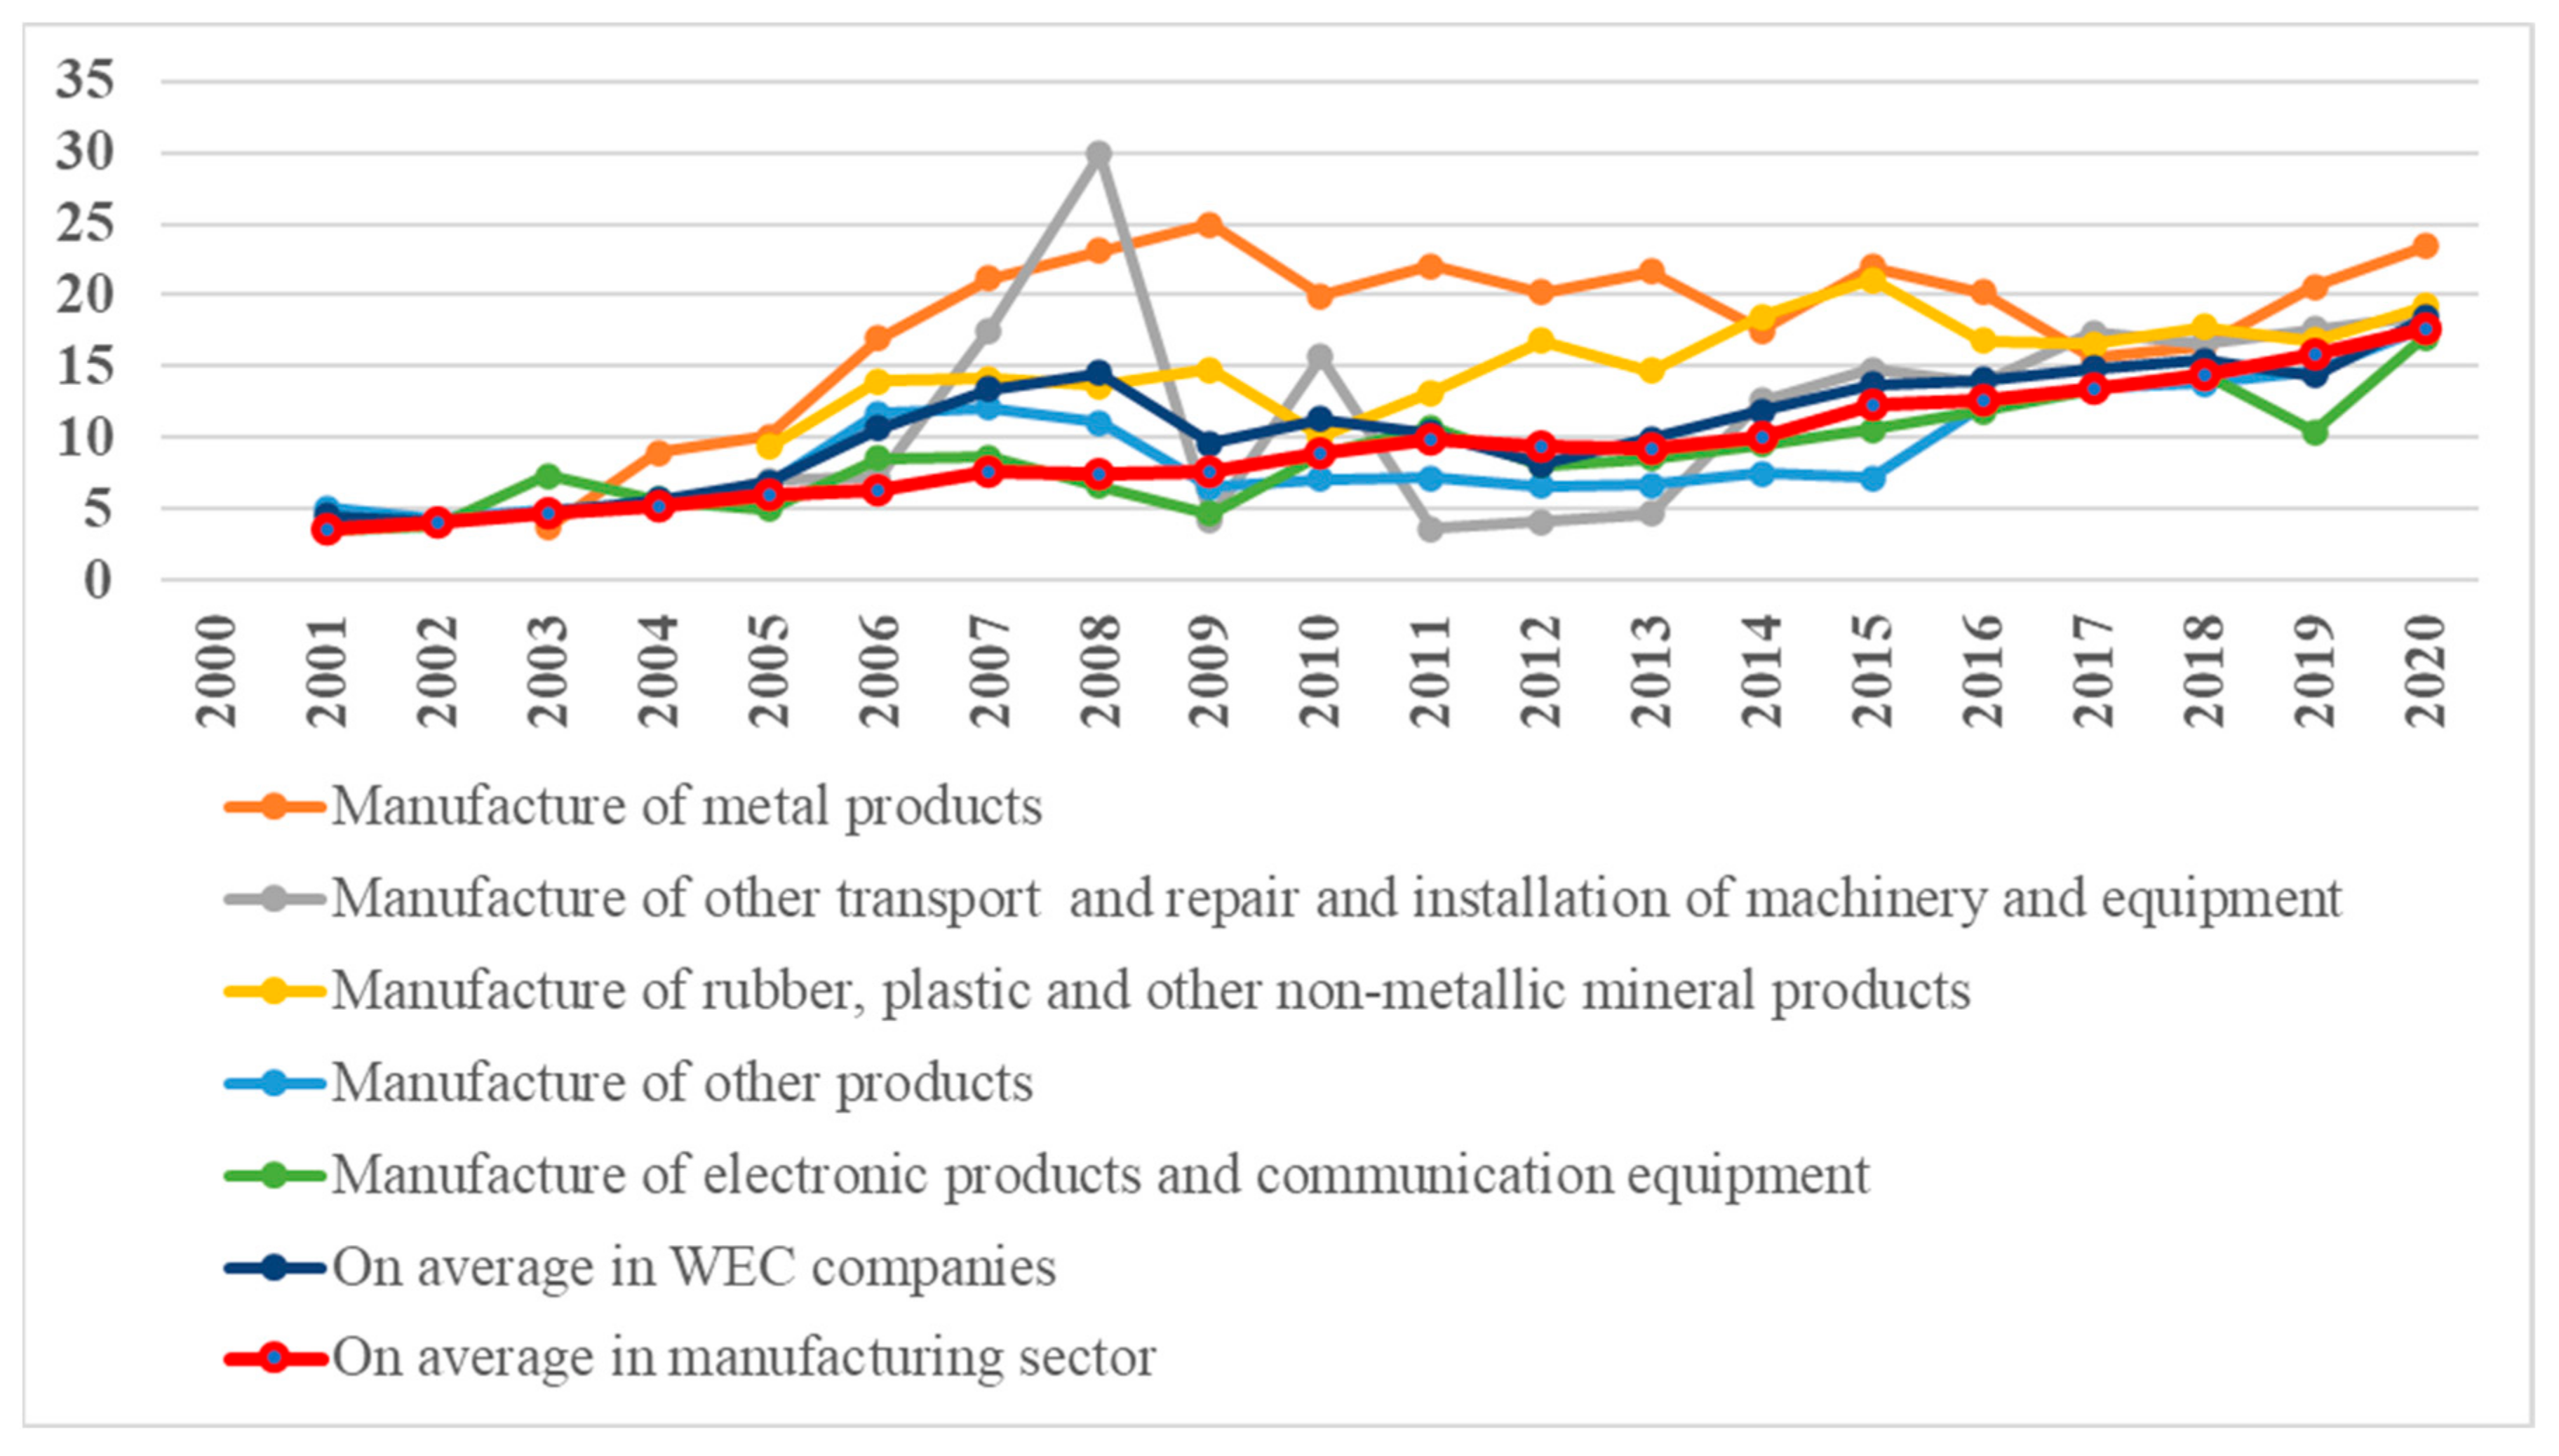
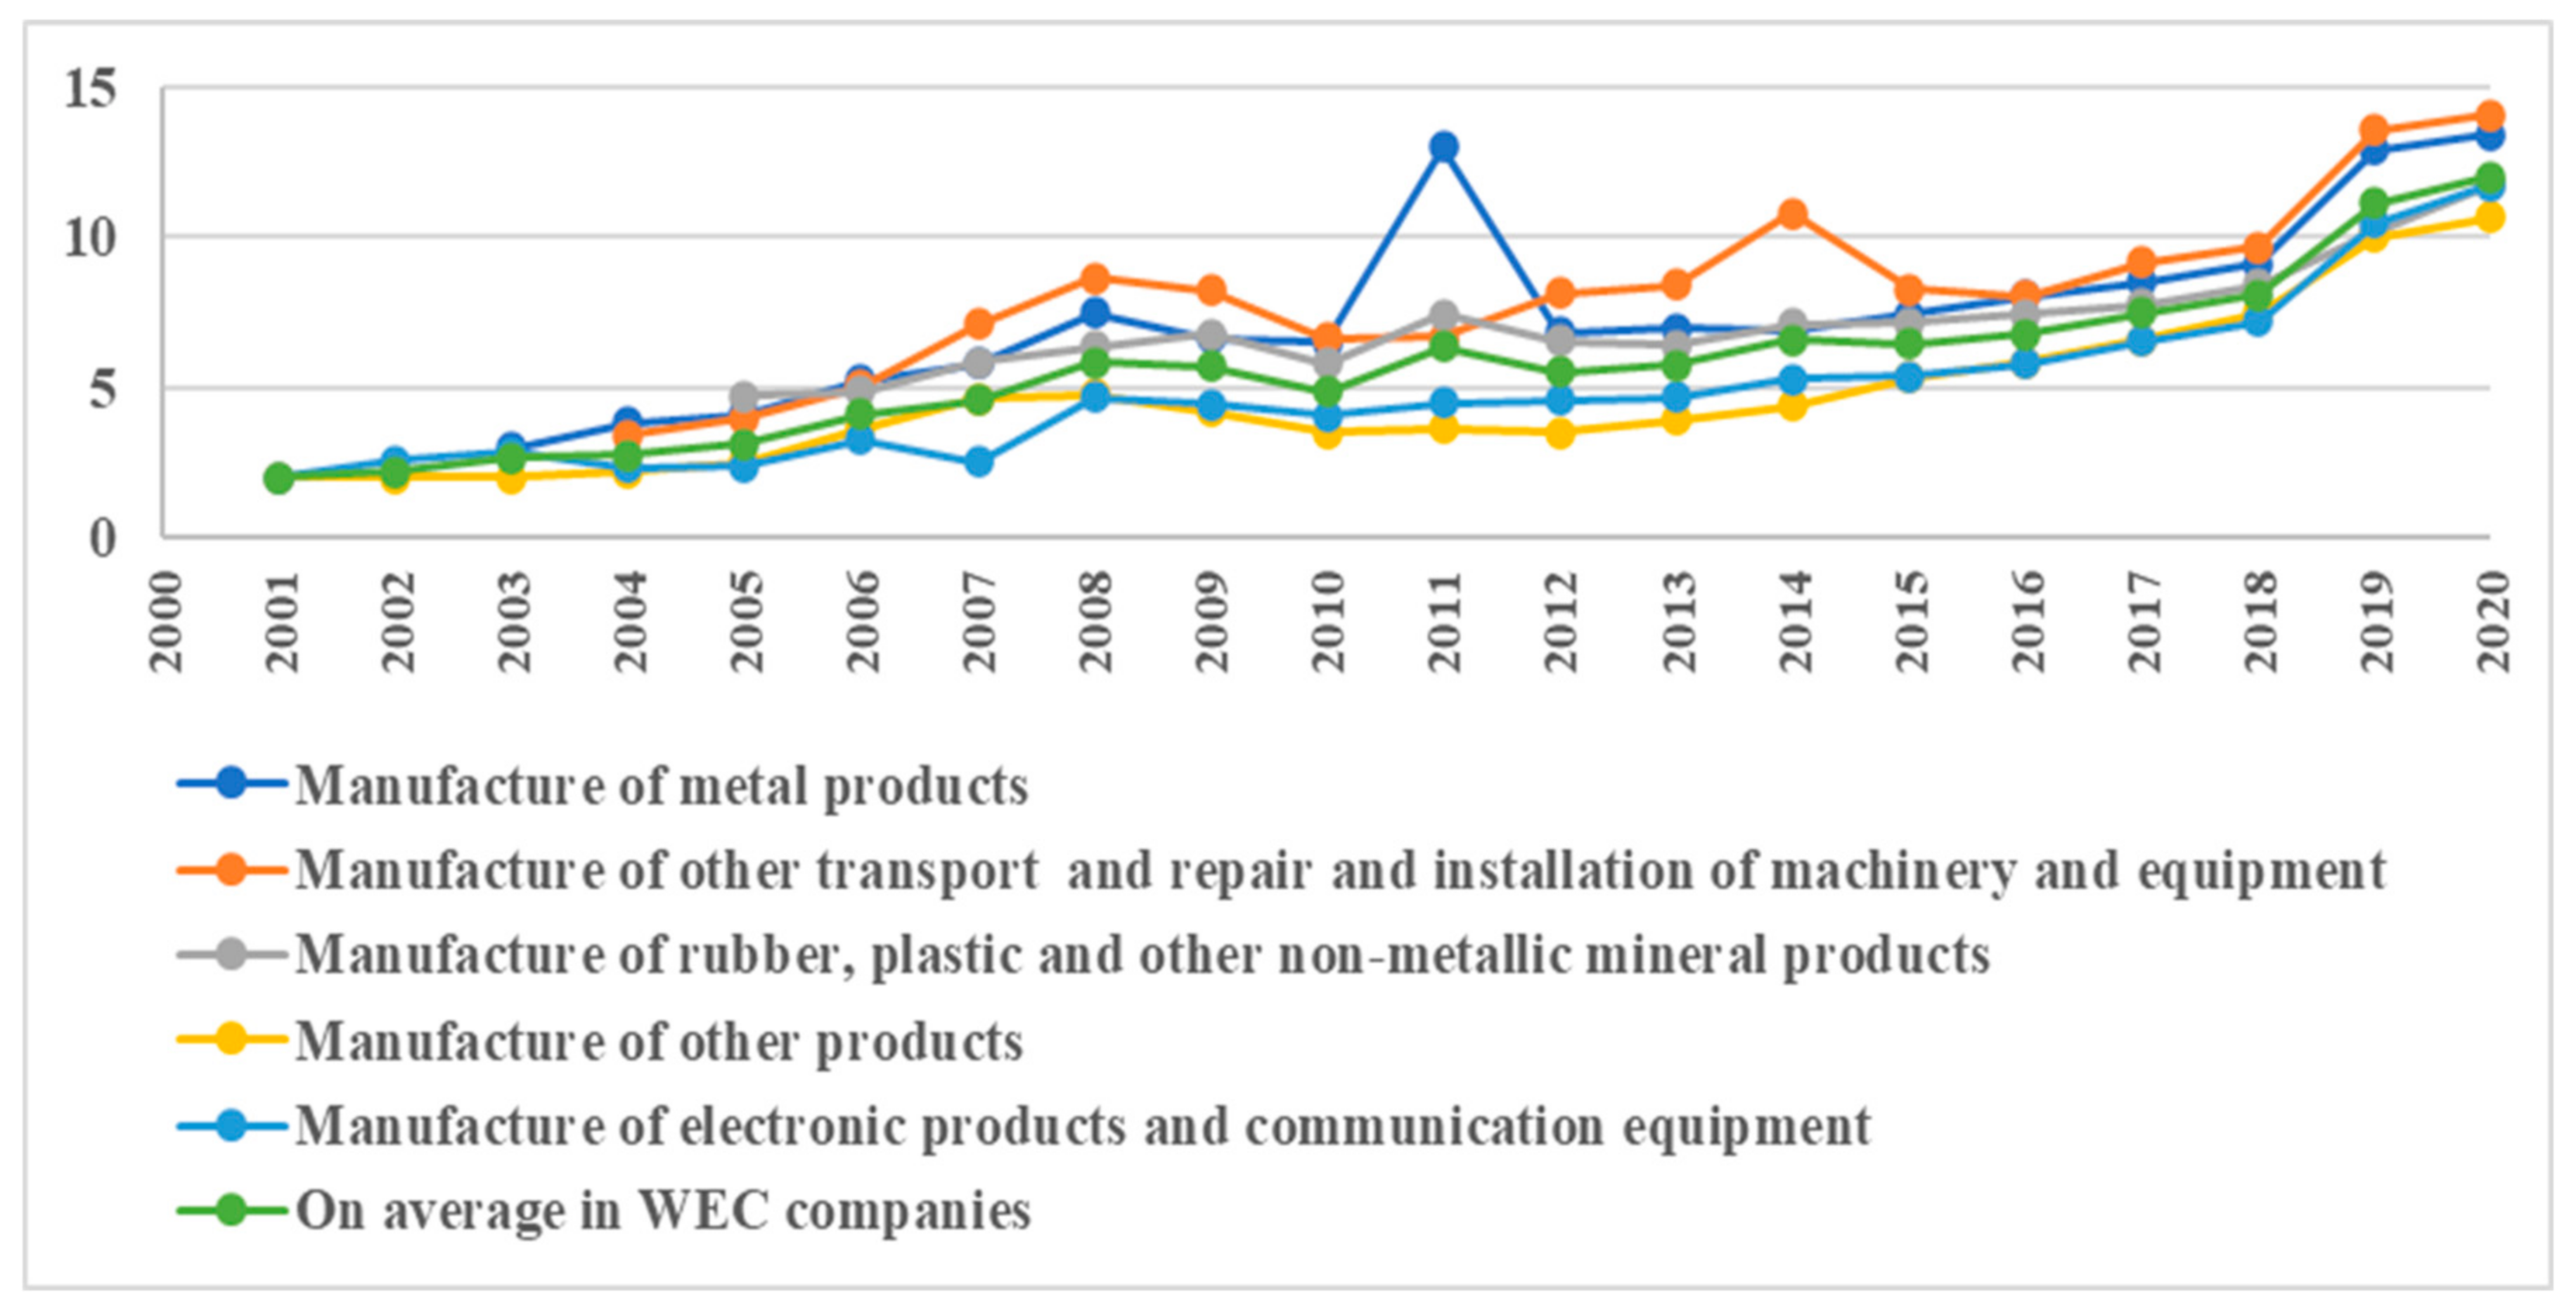
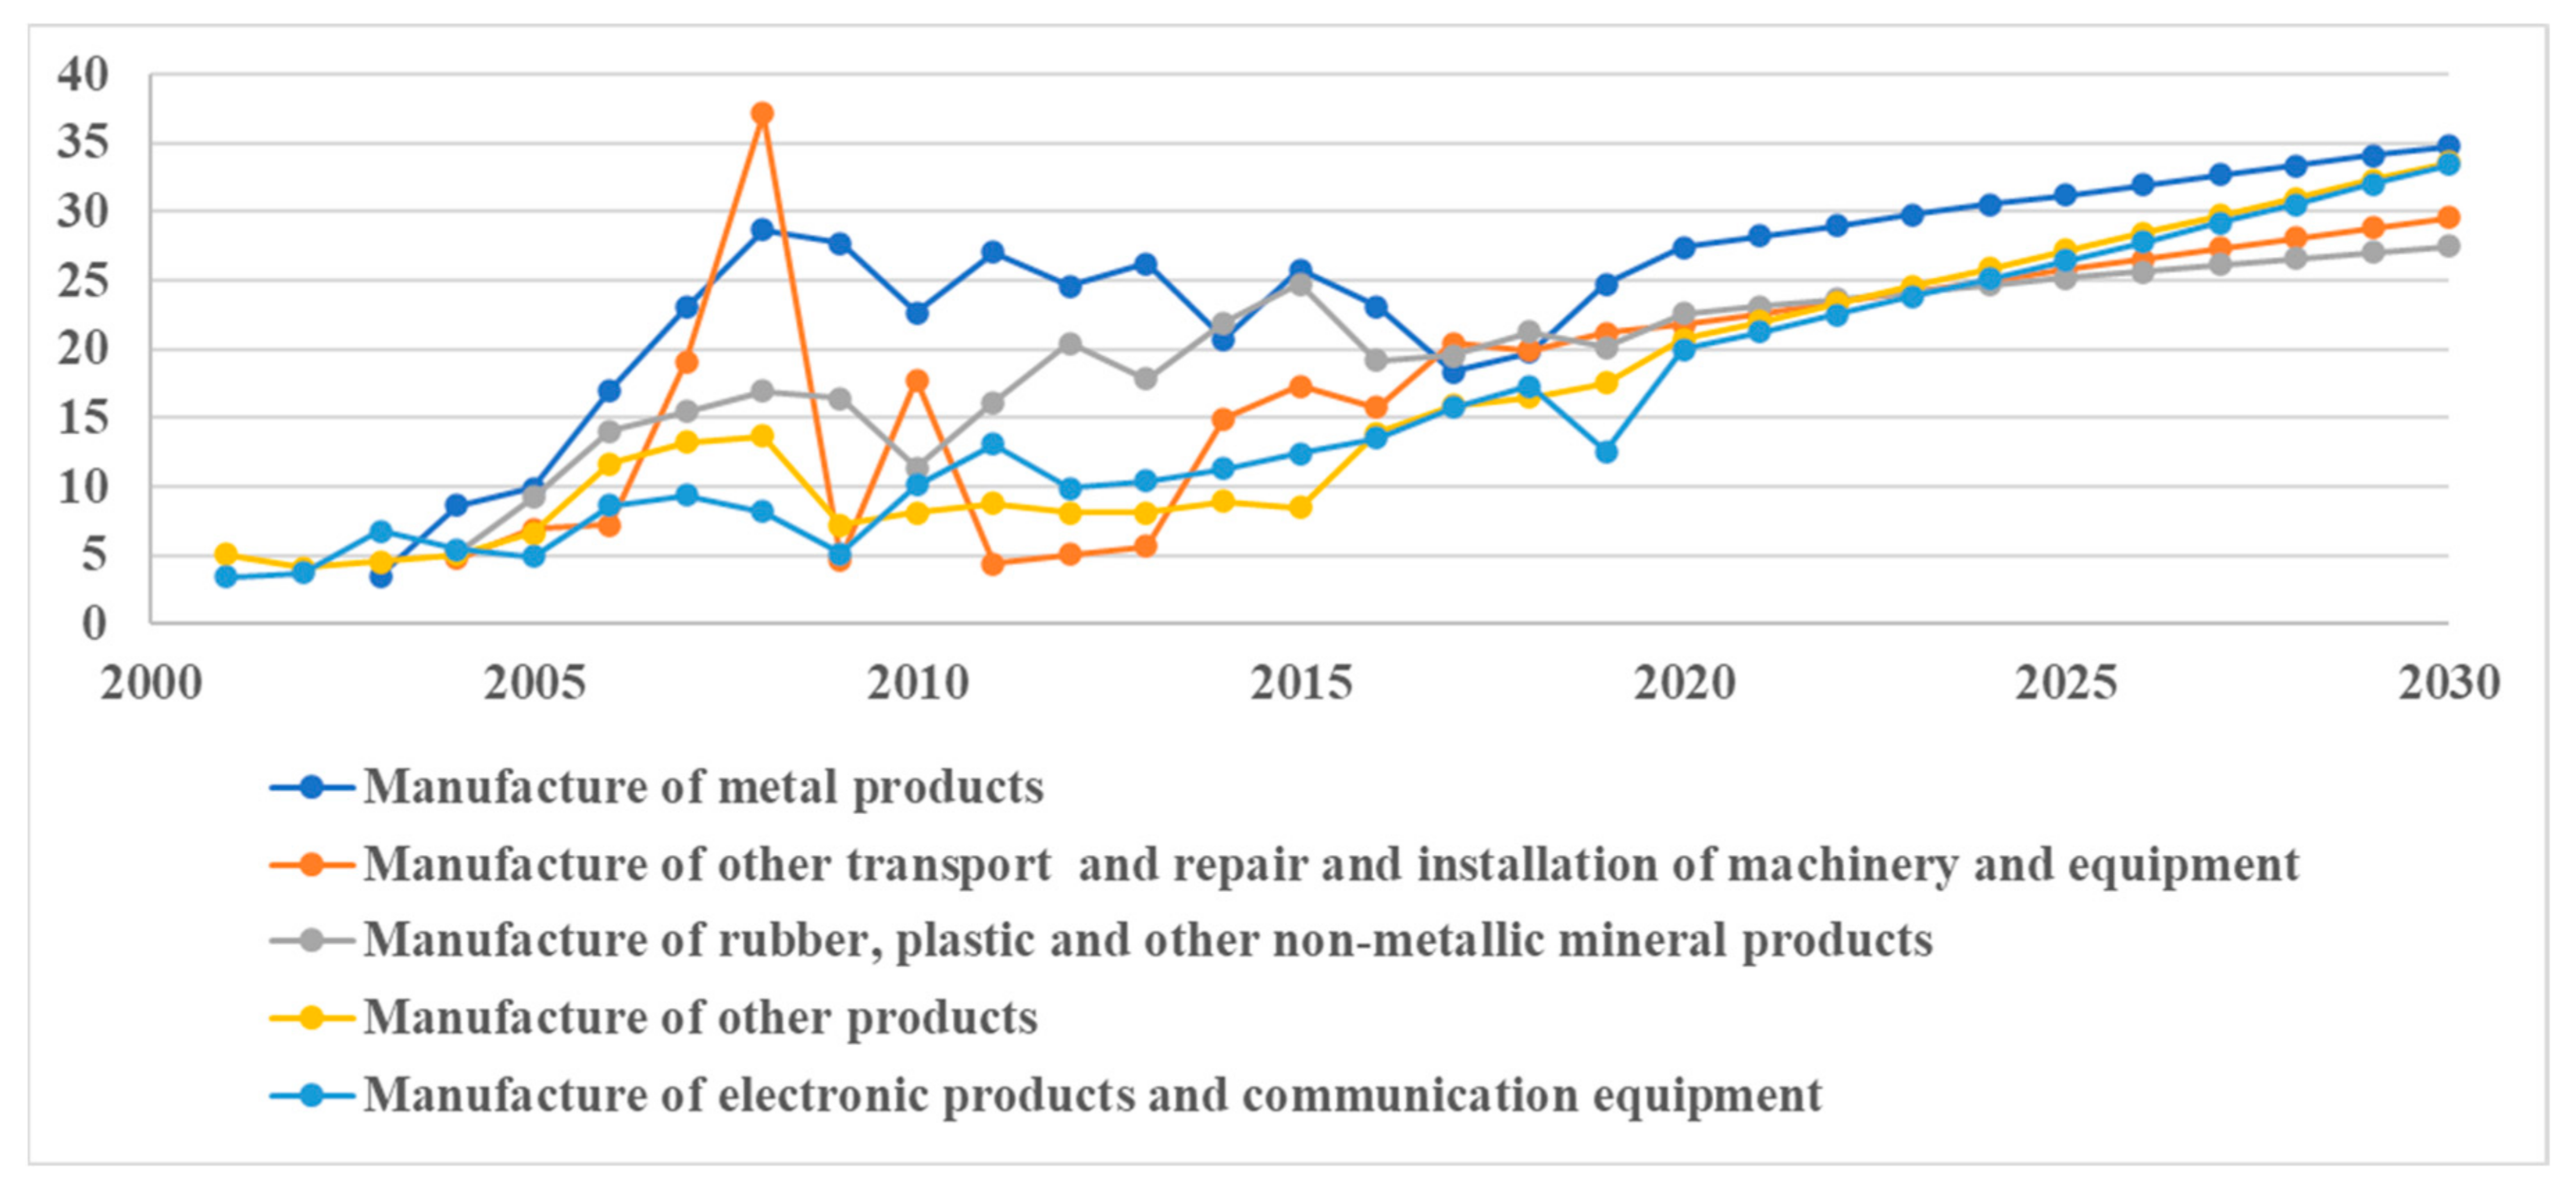
4.1. Analysis of Economic Performance of WEC Companies

WEC companies manufacture wind turbine blades, fillings for blades, frame from glass-plastic, glass, carbon and hybrid fabrics, modular transformers for wind projects, cement and concrete, anchor bolts for foundation structures, as well as provide programming work for wind turbines in Lithuania. WEC are mainly produced for export and a very small share is used in the country. In the production structure of the largest WEC companies, the WEC make 70–100%. In other WEC companies, they account for 10% of production.
The contribution of WEC companies to the country’s economy is small but increasing in terms of VA created (Figure 3). In early 2000, WEC companies generated 0.3% of total VA created by the manufacturing companies, but during the following two decades, their contribution has increased. Therefore, the share reached 2.5% in 2020. The development of VA is characterized by significant growth and drop rates. Since 2000, it has been increasing by 30% a year. Then, an upward trend was halted by the financial crisis. A drop of 43% was fixed in 2009. The decrease was so significant that it required 5 years to again achieve the pre-crisis level. In comparison, the decrease rate of VA of the Lithuanian manufacturing sector was also relevant, but twice as low (20% in 2009) and in two years, the sector returned to its pre-crisis level. Since 2013, the growth rates of VA of WEC companies have been twice as low (by 16% a year), except in 2020, when the highest yearly increase (by 45%) was monitored. In that year, WEC companies created 194.72 million EUR. Manufacturers of electronic products and communication equipment alone created one-third (35%) of the total VA, while manufacturers of metal products and manufacturers of other transport and repair and installation of machinery and equipment—16% and 15%, respectively. Contribution of manufacturers of rubber, plastic and other non-metallic mineral products was 11%.
Technically, an increase in the total VA was determined, both by the growth of the number of employees (Figure 4) and the LP (Figure 5).
Since 2008, employment in WEC companies has increased by 6.6% a year, faster than the average in the manufacturing sector. Therefore, the share of employees in WEC companies in comparison to employees in the manufacturing sector has increased, although thus far it remains low. In 2020, WEC companies employed 3.0% employees of the manufacturing sector (i.e., 6100 persons) in comparison to 1.2% (2840 persons) in the pre-crisis level (Figure 5).
In the pre-crisis period, on average, the LP in WEC companies demonstrated faster improvement rates (by 18% a year) than on average in the manufacturing sector (by 11% a year). This resulted in twice as much LP in WEC companies than on average in the manufacturing sector in 2008, i.e., 14.6 EUR/h and 7.4 EUR/h, respectively. LP in WEC companies manufacturing metal products increased the most—to 23.1 EUR/h in 2008, followed by manufacturers of rubber, plastic and other non-metallic mineral products (13.7 EUR/h). The LP in WEC companies was affected by the financial crisis. It lost the improvement direction and the stability of level. The situation lasted up to 2013. Since that year, on average, the LP in WEC companies has moved in hand with manufacturing sector. In 2020, the LP was about 18.5 EUR/h in WEC companies in comparison to 17.6 EUR/h in the manufacturing sector. It had been the lowest in the manufacture of electronic products and communication equipment. Further improvement in LP is unlikely under the conditions of loaded production capacities. Lithuanian Statistics [75] showed that at the end of 2020, the use level of production capacities was about 75%. In detail, it was 80.3% in chemicals, 76.3% in metals, 75.9% electronics, 74.5% in rubber and plastics and 73.5% in other non-metallic mineral products industries. The results of the assessment of production capacities [75] disclosed the increasing share of valuations by manufacturers, confirming an insufficient amount of production capacity available and a reducing share of sufficient quantity available. Therefore, investment is essentially requested.
Yearly investment by type of assets attracted by WEC companies is shown in Figure 6. Distribution of investment in TA by economic activity of WEC companies is presented in Figure 7.
Responding to loaded production capacities, investment already increased by 98.7 million EUR in 2019 and 83.9 million EUR in 2020. Up to 85% was invested in buildings. Investment in IA (software, patents and licenses) was negligible (up to 1%). The last two years alone has seen the same investment rates as during the decade from 2009 to 2018. Moreover, during 2009–2015, investment was very low and more than half of it had been made in machines, equipment and transport.
The manufacture of electronic products and communication equipment attracted 47% (218 million EUR) of investment made during 2000–2020. However, 60% of investment was made during 2019–2020. Over 140 million EUR has been invested in the manufacture of metal products (31% of total during 2000–2020). The specifics of investment in the manufacture of metal products had been its relatively greater annual intensity in comparison to investment in other economic activities. Here, investment has started to increase since 2016. Investment in rubber, plastic and other non-metallic mineral products has remained among the lowest, i.e., 24 million EUR during 2000–2020 (5% of total). However, the stability of the invested amount has been the most even (1.5 million a year).
Wages (and salaries) also increased (Figure 8).
As shown in Figure 8, on average, wages (and salaries) in WEC companies increased significantly (by 6 times) from 2 EUR/h (2001) to 12 EUR/h in 2020. The highest wages (and salaries) were paid for manufacturing other transport and repairing and installation of machinery and equipment (14.1 EUR/h in 2020), but the lowest was for manufacturing of other products (10.7 EUR/h in 2020). In WEC companies, wages (and salaries) increased the most (by almost 6 times) in the manufacture of electronic products and communication equipment; however, this was 2.4% lower than on average in WEC companies in 2020.
Performance efficiency in terms of net profitability of WEC companies is presented in Figure 9.
Net profitability presents different results by different manufacturers, but on average there was about 5.0% in WEC companies during 2000–2020, except during 2012–2013 and in 2017 when companies suffered losses. The highest (48.6%) and the lowest (−62.3%) profitability was faced by the manufacturers of metal products. This discloses the significant volatility of economic performance of that activity. Remarkable drops in profitability were observed by the manufacturers of other transport and repair and installation of machinery and equipment (−25.7%) in the 2012 and by the manufacturers of electronic products and communication equipment (−24.0%) in 2017. Over the last several years, lower than average profitability rates, especially in the manufacture of electronic products and communication equipment activity, have been demonstrated, with no profitability or even losses of 3.0% in 2019. The following below explains in detail the changes in performance efficiency through the ratio of LP to investment, curve of LP to investment in TA, and the correlation between LP and net profitability.
Thus, the current status analysis disclosed the positive developments of WEC companies in terms of VA created, persons employed, LP, investment made, wages (and salaries) paid and net profitability achieved. Following these tendencies, the WEC companies has potential to grow. Taking this into account, the relevance of investment in TA for the improvement in LP and the impact of the latter on growth (increase in VA, profitability and wages (and salaries)) is researched by sequential testing of H0 and H1 hypotheses.

4.2. Role of Real Investment in TA for Improvement in LP in Companies Manufacturing WEC

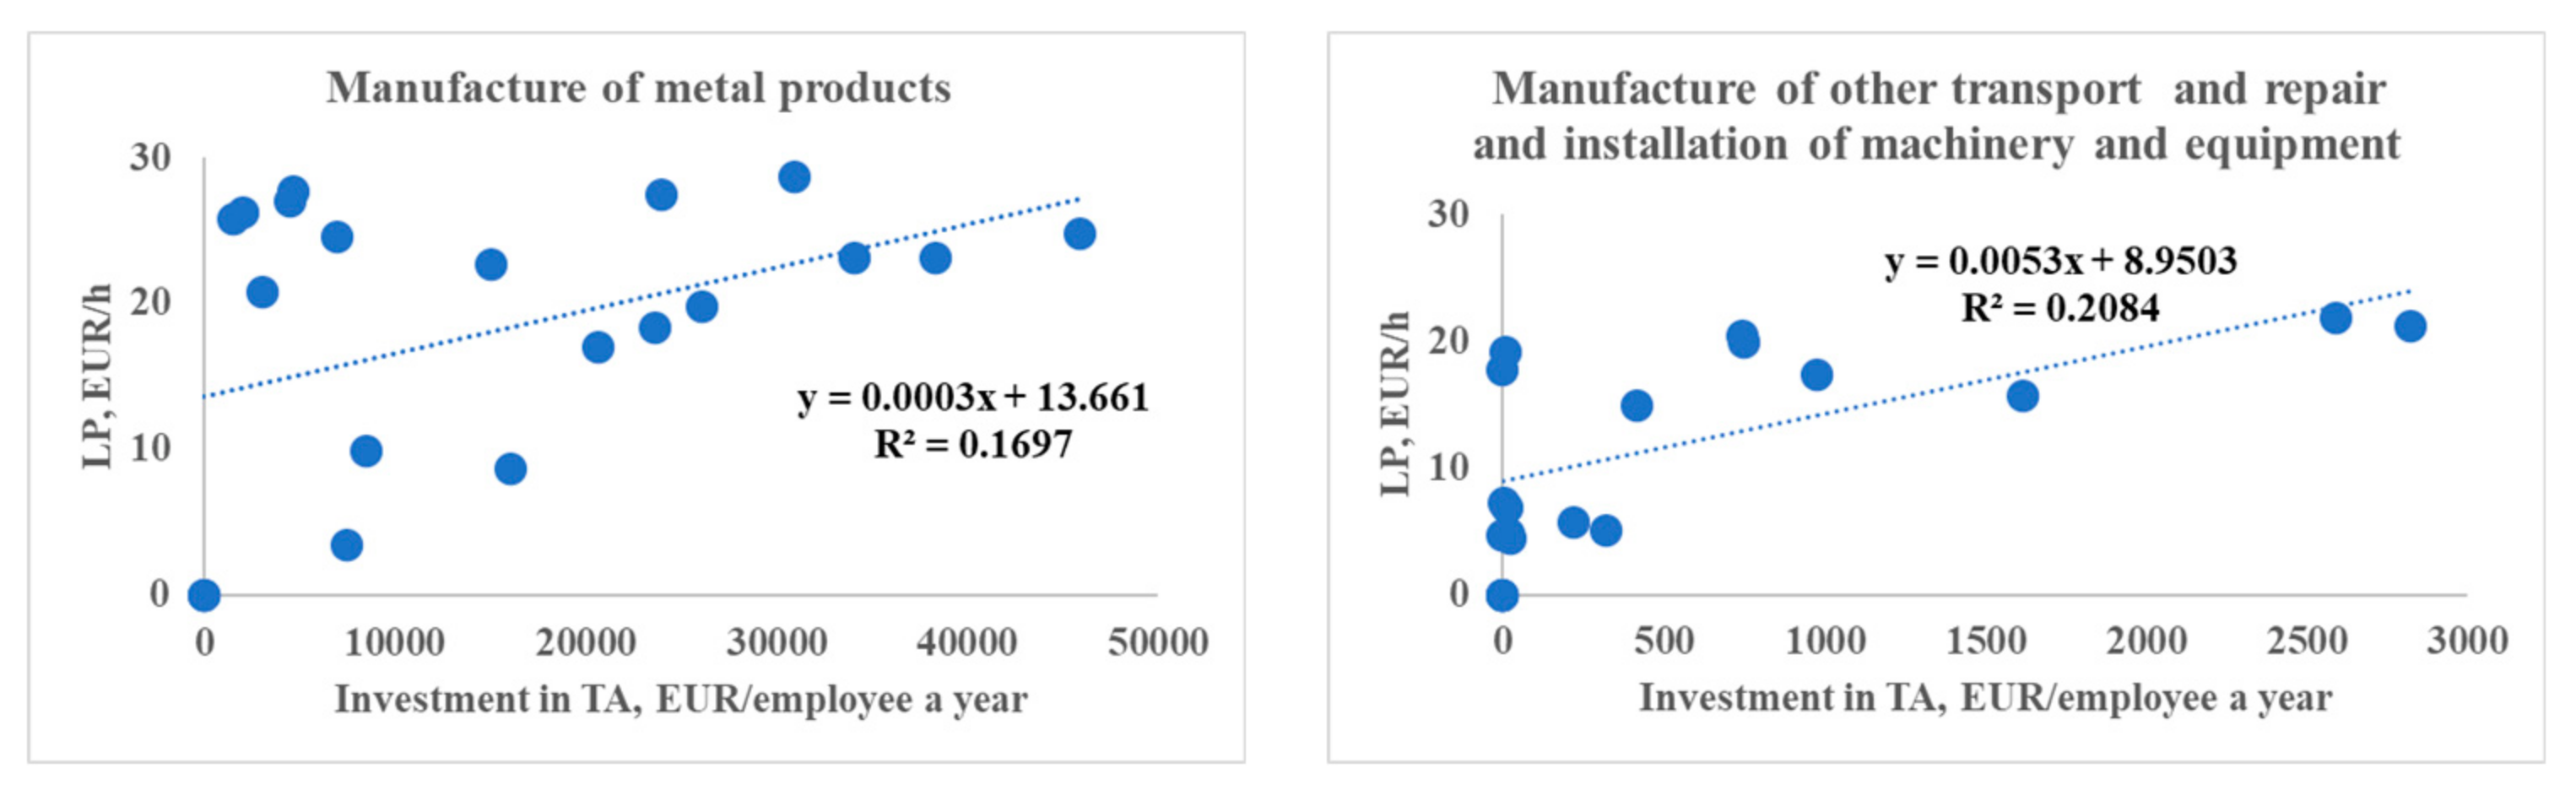
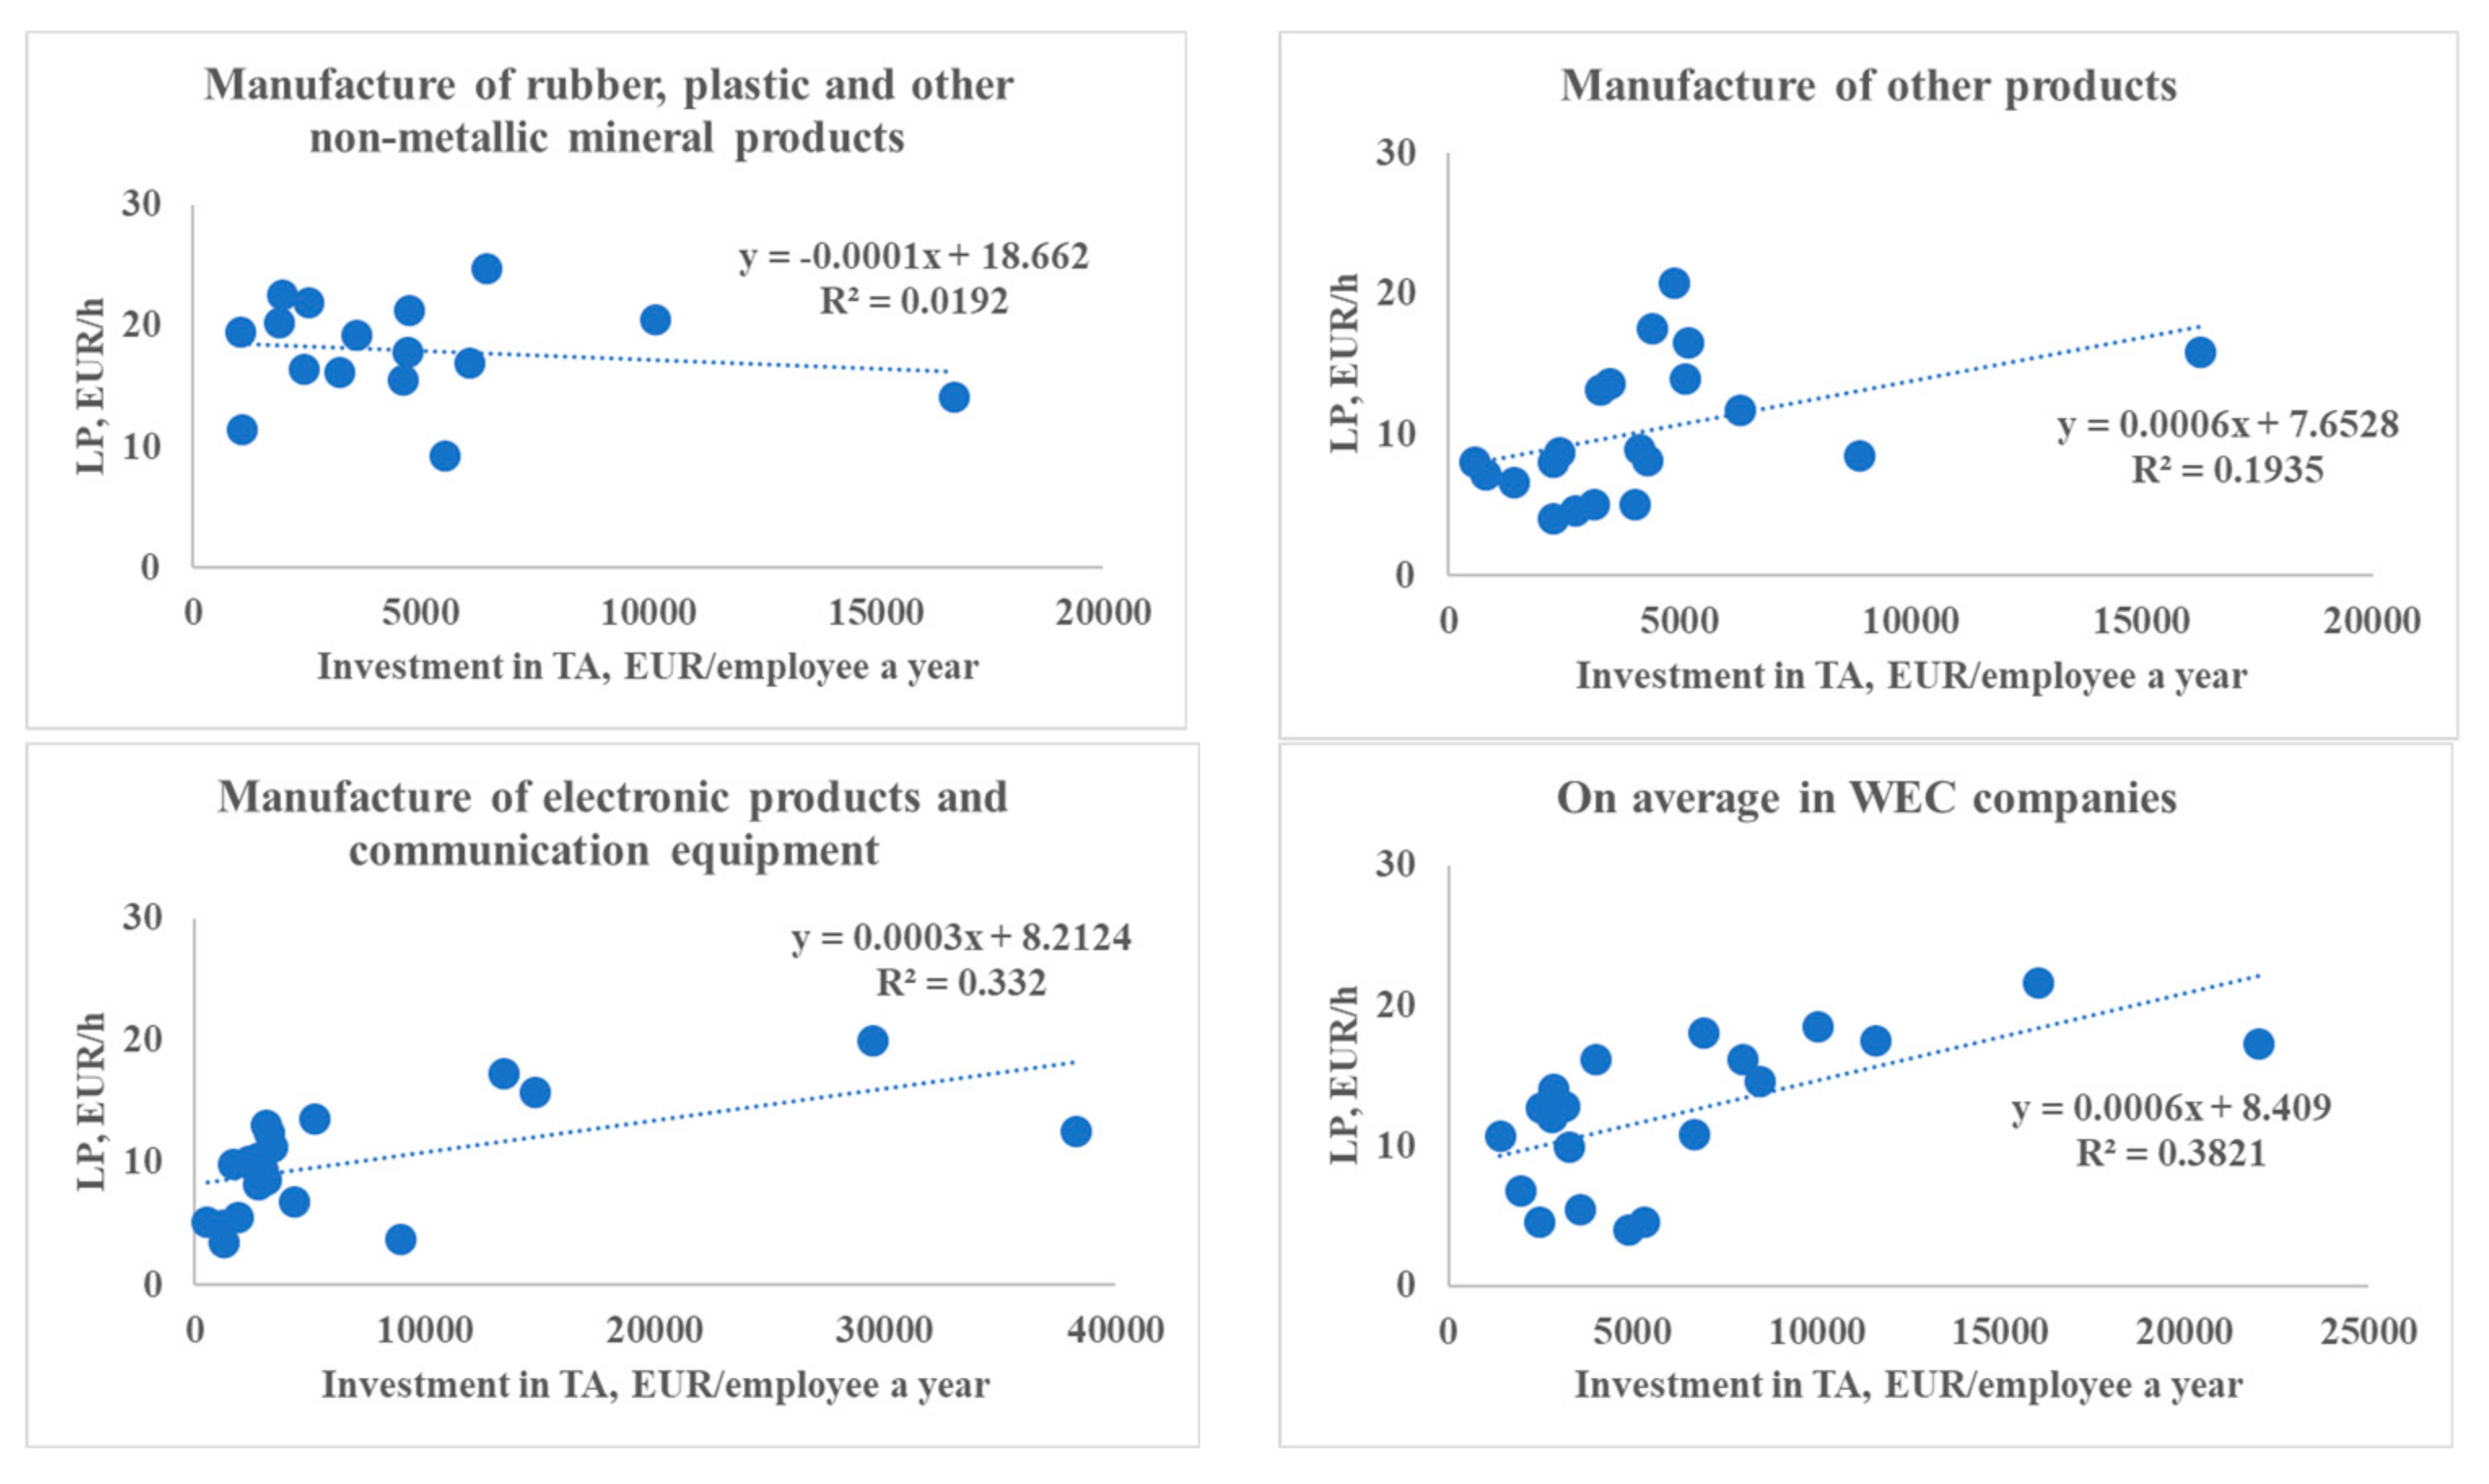
4.2.1. Ratio of Change in Labour Productivity to Investment in Tangible Assets

For the H0 hypothesis testing, we began by estimating the historical ratio of change in LP to investment in TA. The estimated historical ratio and its structural parts are graphically represented in Figure 10.
Figure 10 allows us to identify the relationship between investment in TA and improvements in LP during 2005–2020. In detail, LP in the manufacture of metal products increased the most (by 17.6 EUR/h), representing the largest amount of real investment in TA (290 thousand EUR per employee), while it grew the least in the manufacture of rubber, plastic and other non-metallic mineral industries (by 13.4 EUR/h), where real investment in TA amounted to 77 thousand EUR per employee. The specifics of the manufacture of other transport and the repair and installation of machinery and equipment are one of the largest increases in LP (by 14.9 EUR/h), achieved with the lowest investment in TA (11 thousand EUR per employee). These represent a very high ratio of change in LP to investment in TA in the manufacture of other transport and the repair and installation of machinery and equipment (1.41), but a very low ration in the manufacture of metal products (0.06) in comparison to the total manufacture of WEC (0.13). In economic terms, the ratio discloses that, historically, the increase in investment in TA by 1000 EUR per employee was related to the growth of LP by 1.41 EUR/h, 0.06 EUR/h and 0.13 EUR/h, respectively. Thus, the effectiveness of investment was the highest in the manufacture of other transport and the repair and installation of machinery and equipment, but the lowest in the manufacture of metal products. In other manufacturing companies, the ratio is distributed in regard to the value of the total manufacture of WEC. Taking this into account, the curves of LP to investment in TA were drawn (Figure 10).

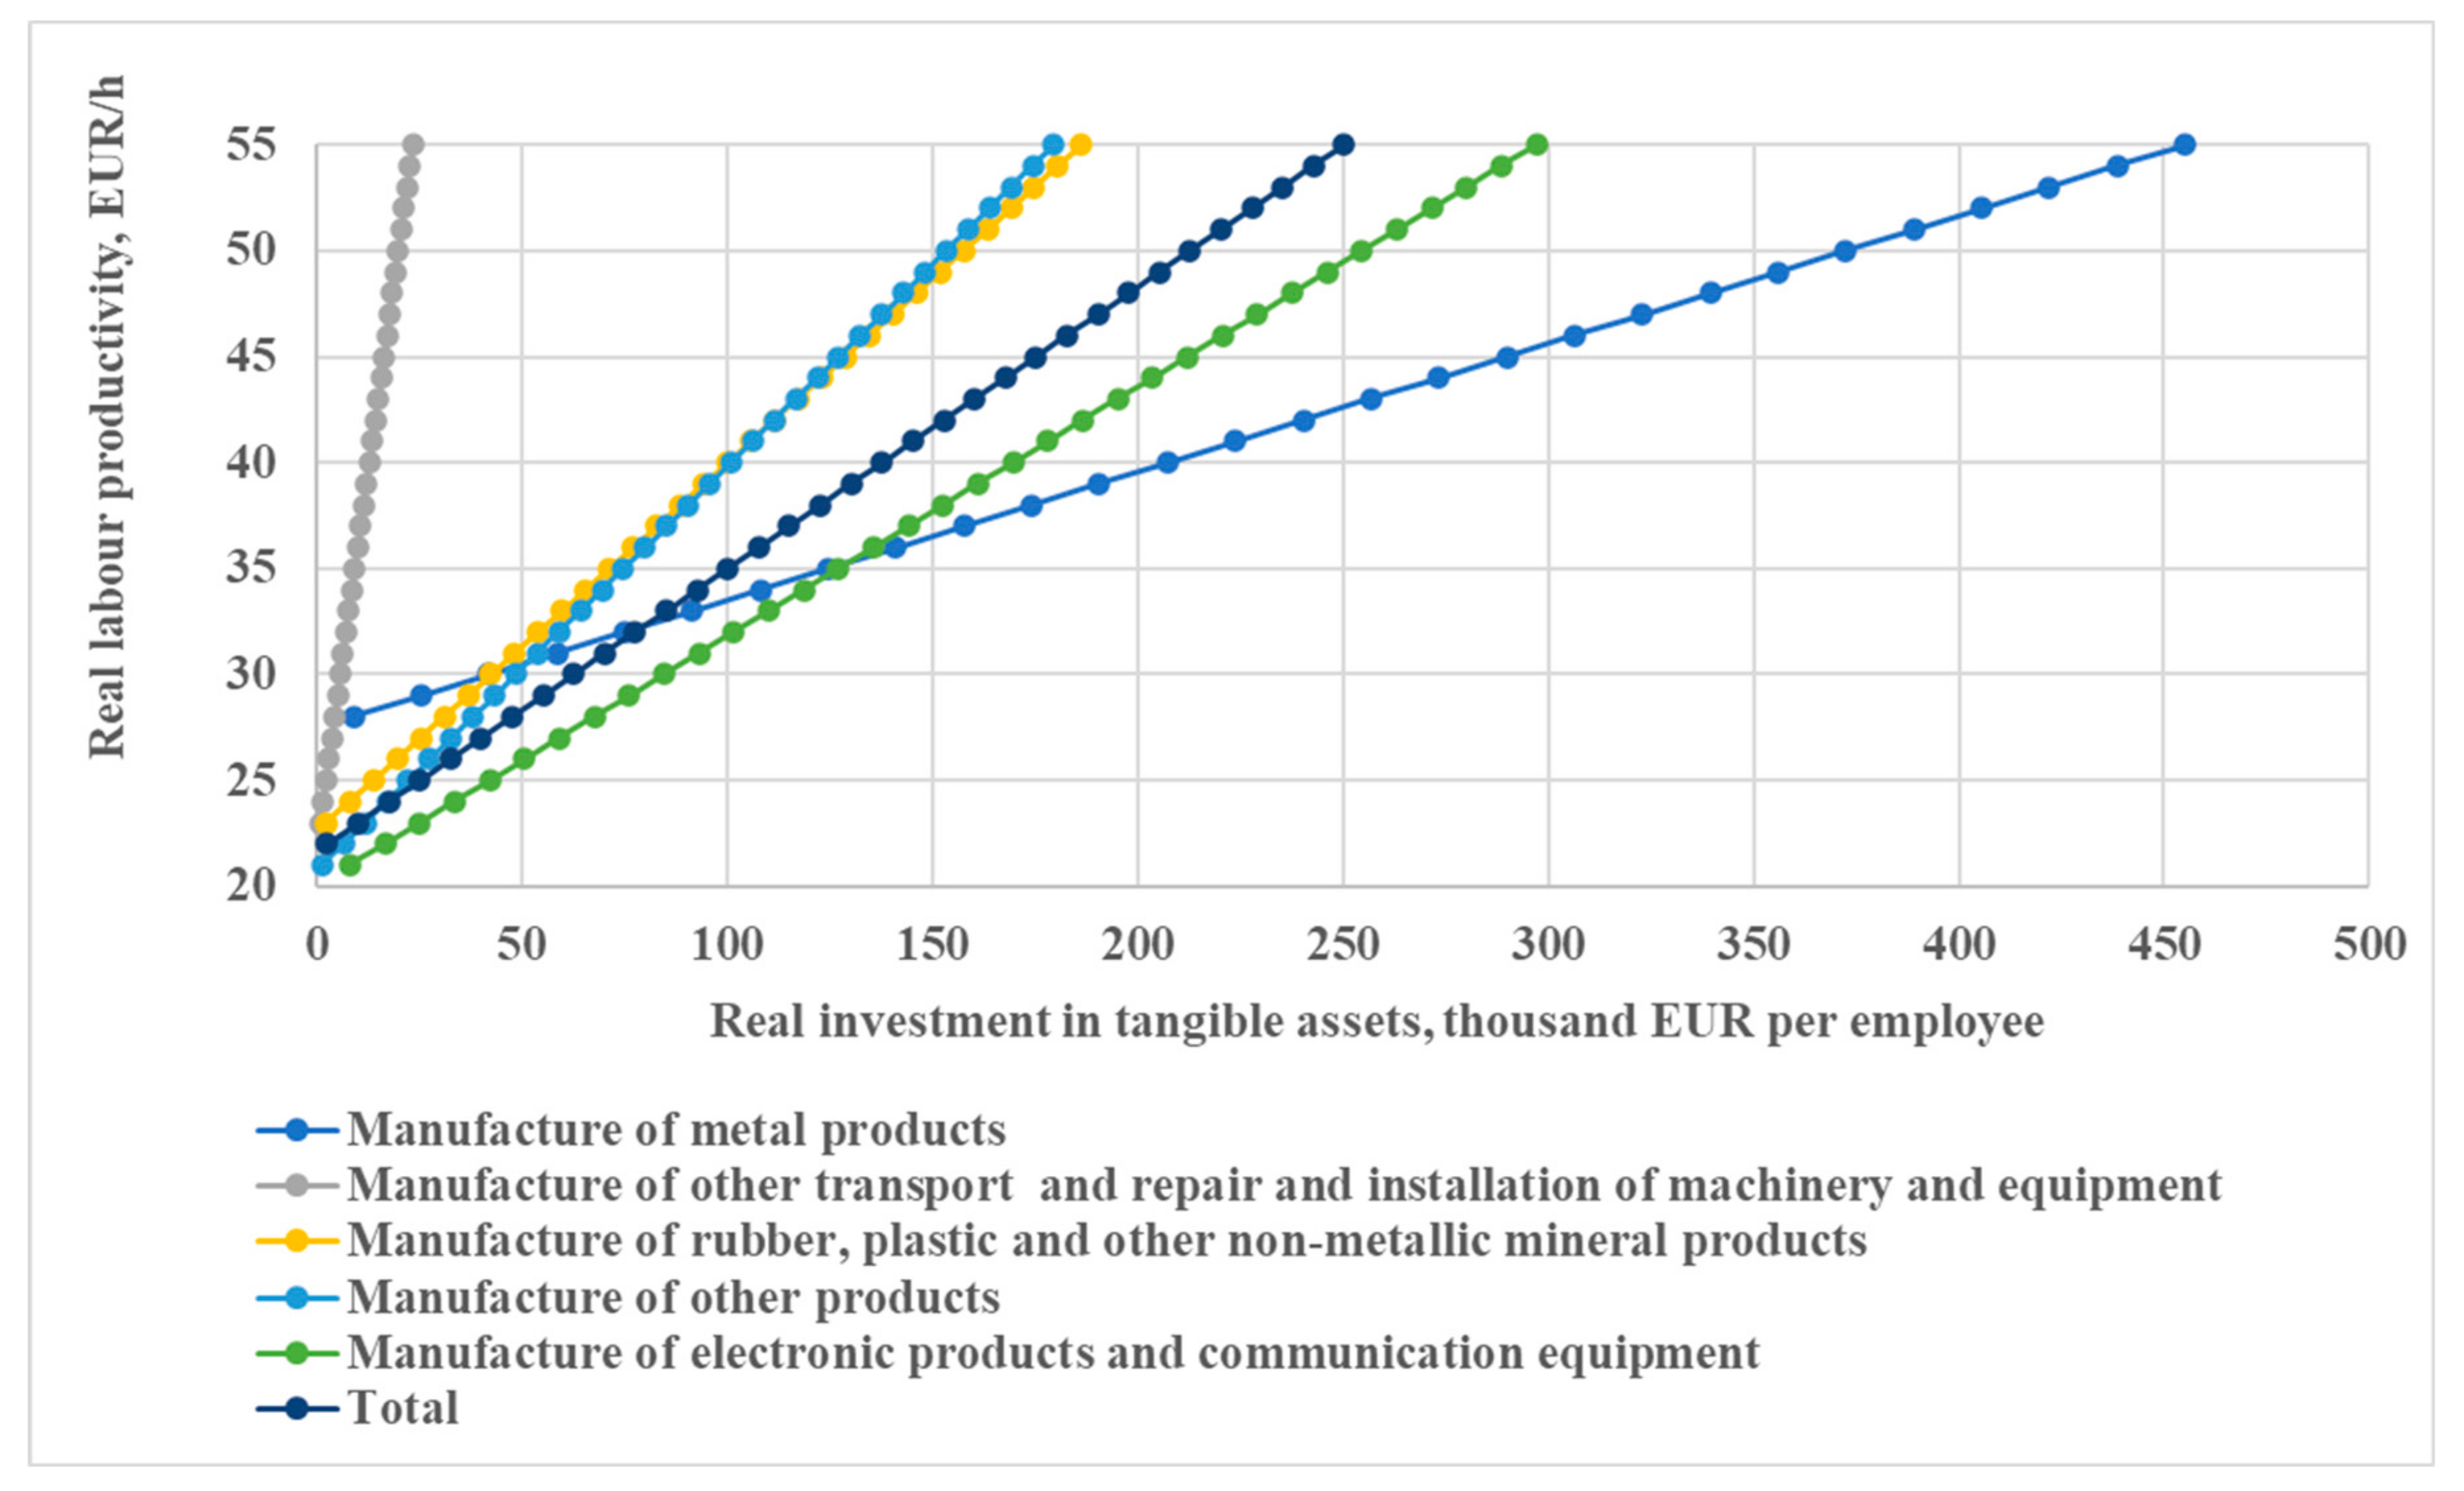
4.2.2. Curve of Labour Productivity to Tangible Investment

Figure 11 provides information on the demands for the amount of real investment in TA (in 1000 EUR per employee) to increase LP from its current level (2020) to up to 55 EUR/h, when the slope of the curves is the estimated historical ratio (Figure 10).
Figure 11 shows that seeking to significantly improve LP (to 55 EUR/h), on average, 250 thousand EUR per employee should be invested; specifically, 24 thousand EUR per employee working in the manufacture of other transport and the repair and installation of equipment and machinery, and even 455 thousand EUR per employee working in the manufacture of metal products. The manufacture of electronic products and communication should attract at least 300 thousand EUR per employee, while the manufacture of rubber, plastic and other non-metallic mineral products should attract 186 thousand EUR per employee. However, these improvements in LP and demands for investment are theoretical and are not supported, at least, with an observation of historical tendencies of aforementioned indicators, for which the economic assessments are presented in Figure 12 and Figure 13 below.

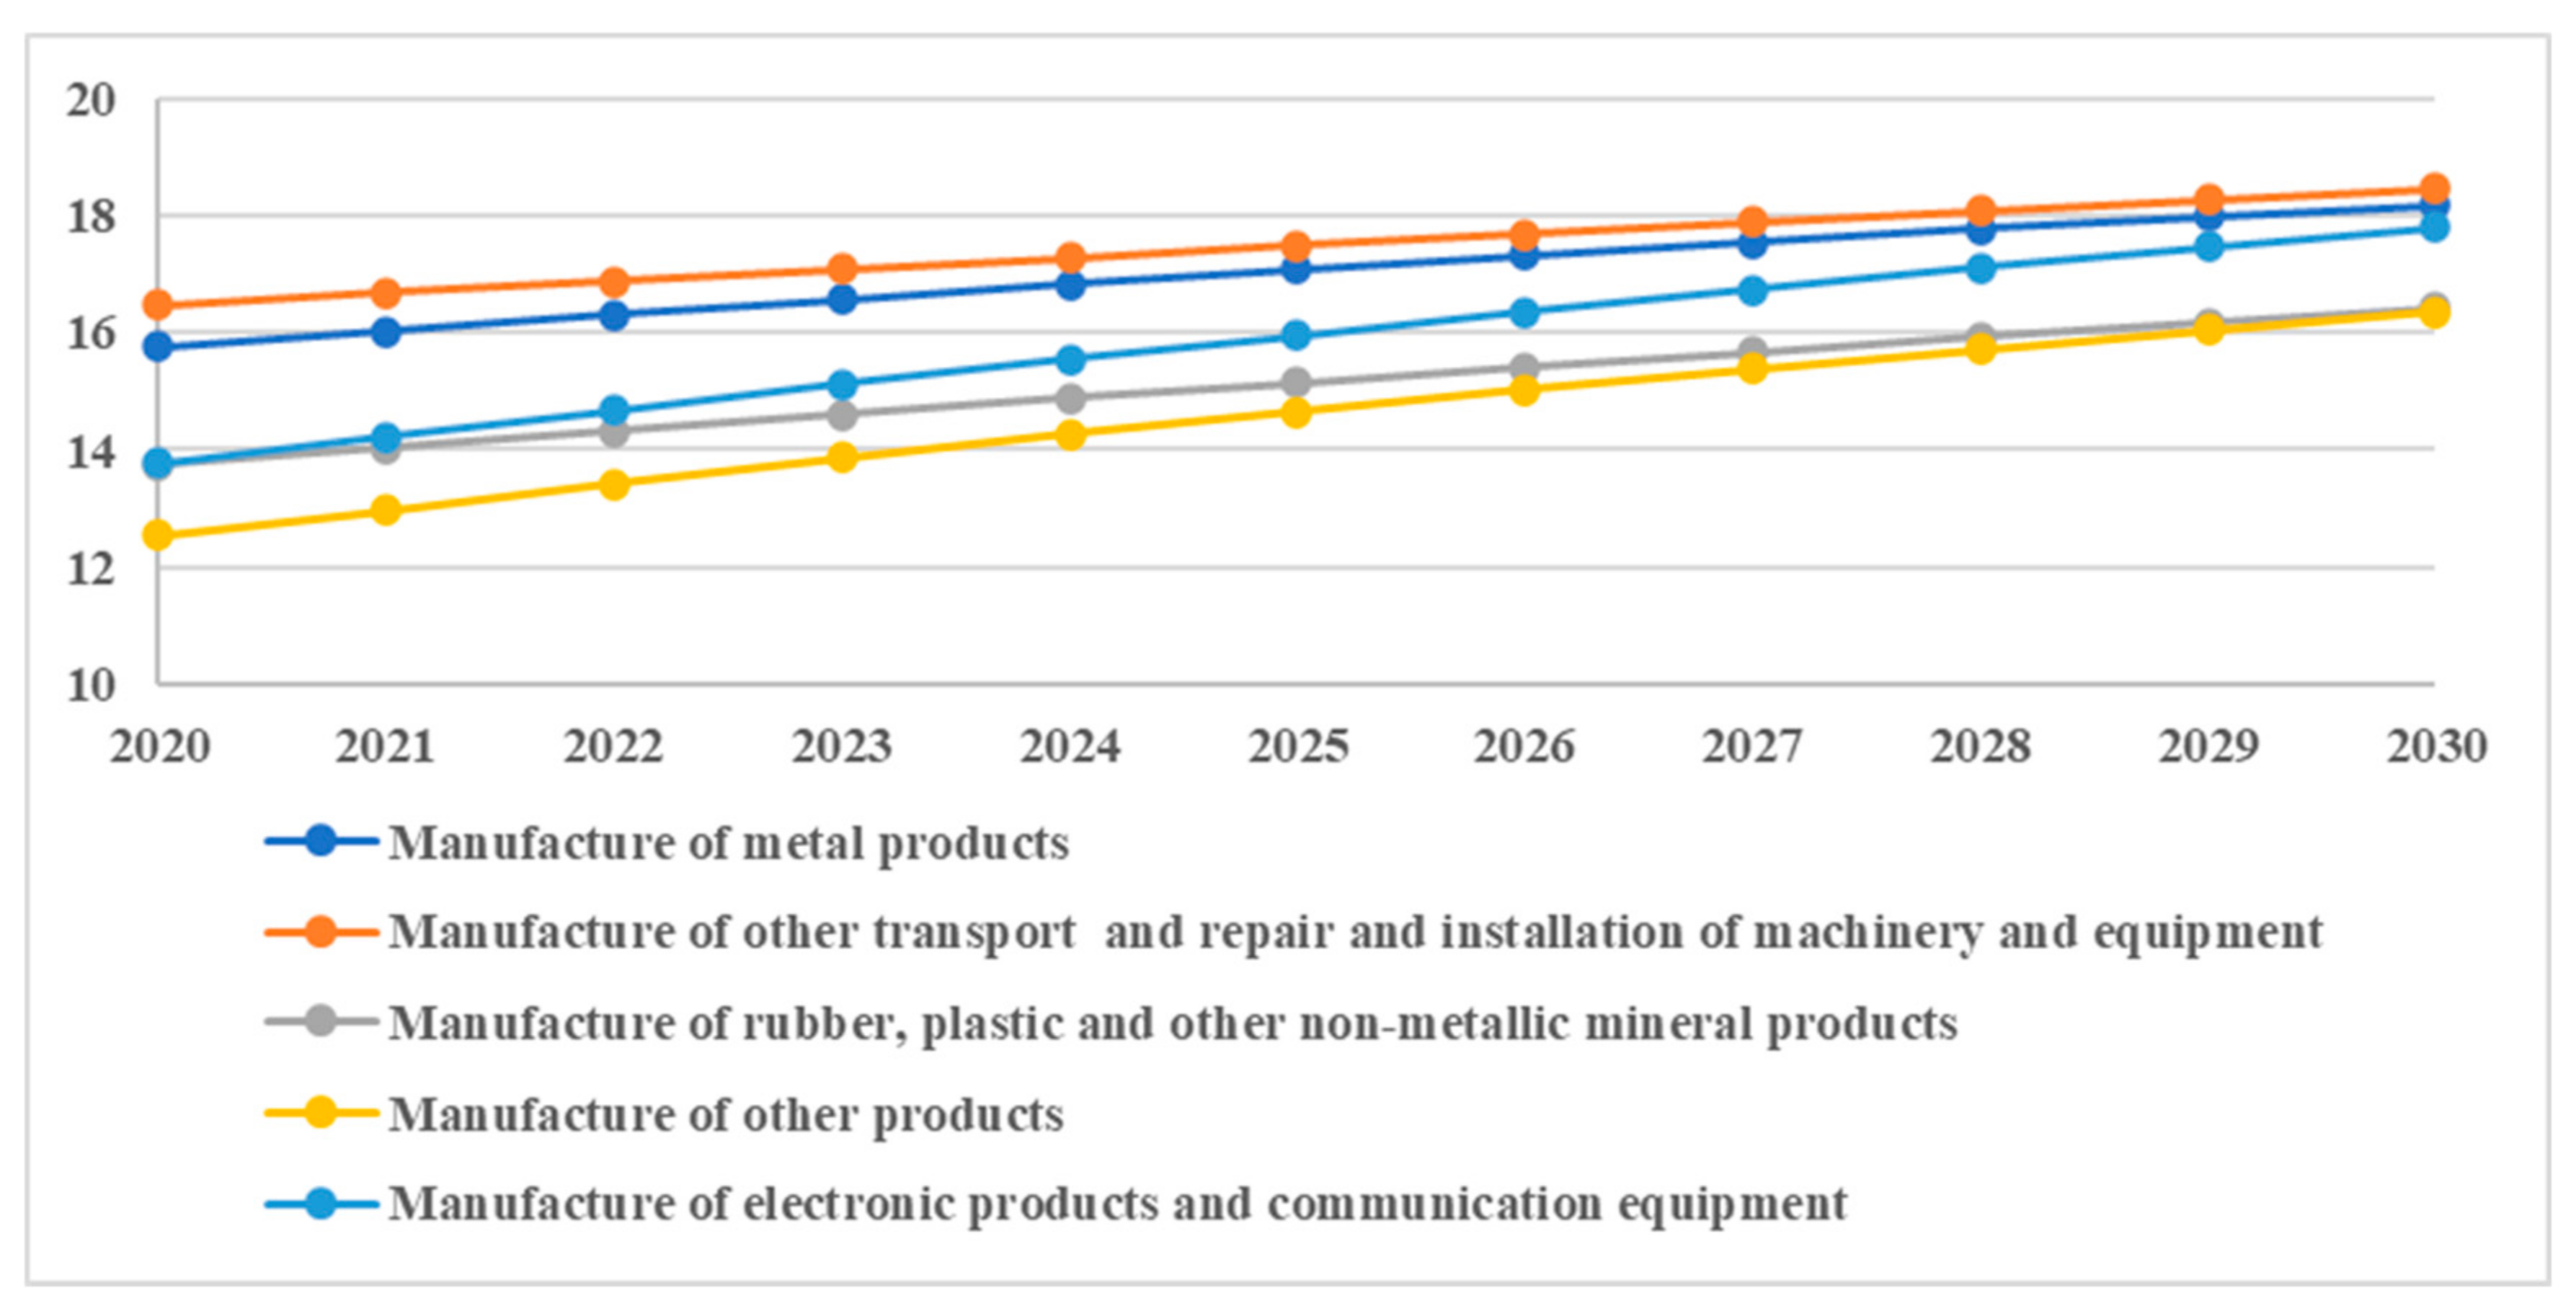
4.2.3. Expected Demand for Investment in Tangible Assets

Historically, WEC companies have invested in TA for the manufacturing of other transport and repairing and installing machinery and equipment invested about 660 EUR per employee a year (based on data presented in Figure 4 and Figure 7). For those who work in the manufacture rubber, plastic and other non-metallic mineral products and other products, about 4600 and 4800 EUR per employee has been invested a year, respectively; while manufacturers of WEC-related electronic products and communication equipment saw an investment of twice as much, i.e., 8000 EUR per employee. Investments in the manufacture of metal products amounted to about 18,100 EUR per employee. Taking into account the forecasted developments in employment referred to in [76], the actual and expected real investment in TA until 2030 are provided in Figure 12.
As it is seen from Figure 12, WEC companies could attract about 33 million EUR a year or totally up to 330 million EUR, two-thirds of which could be invested in the manufacture of metal and electronic products and communication equipment between 2021 and 2030.

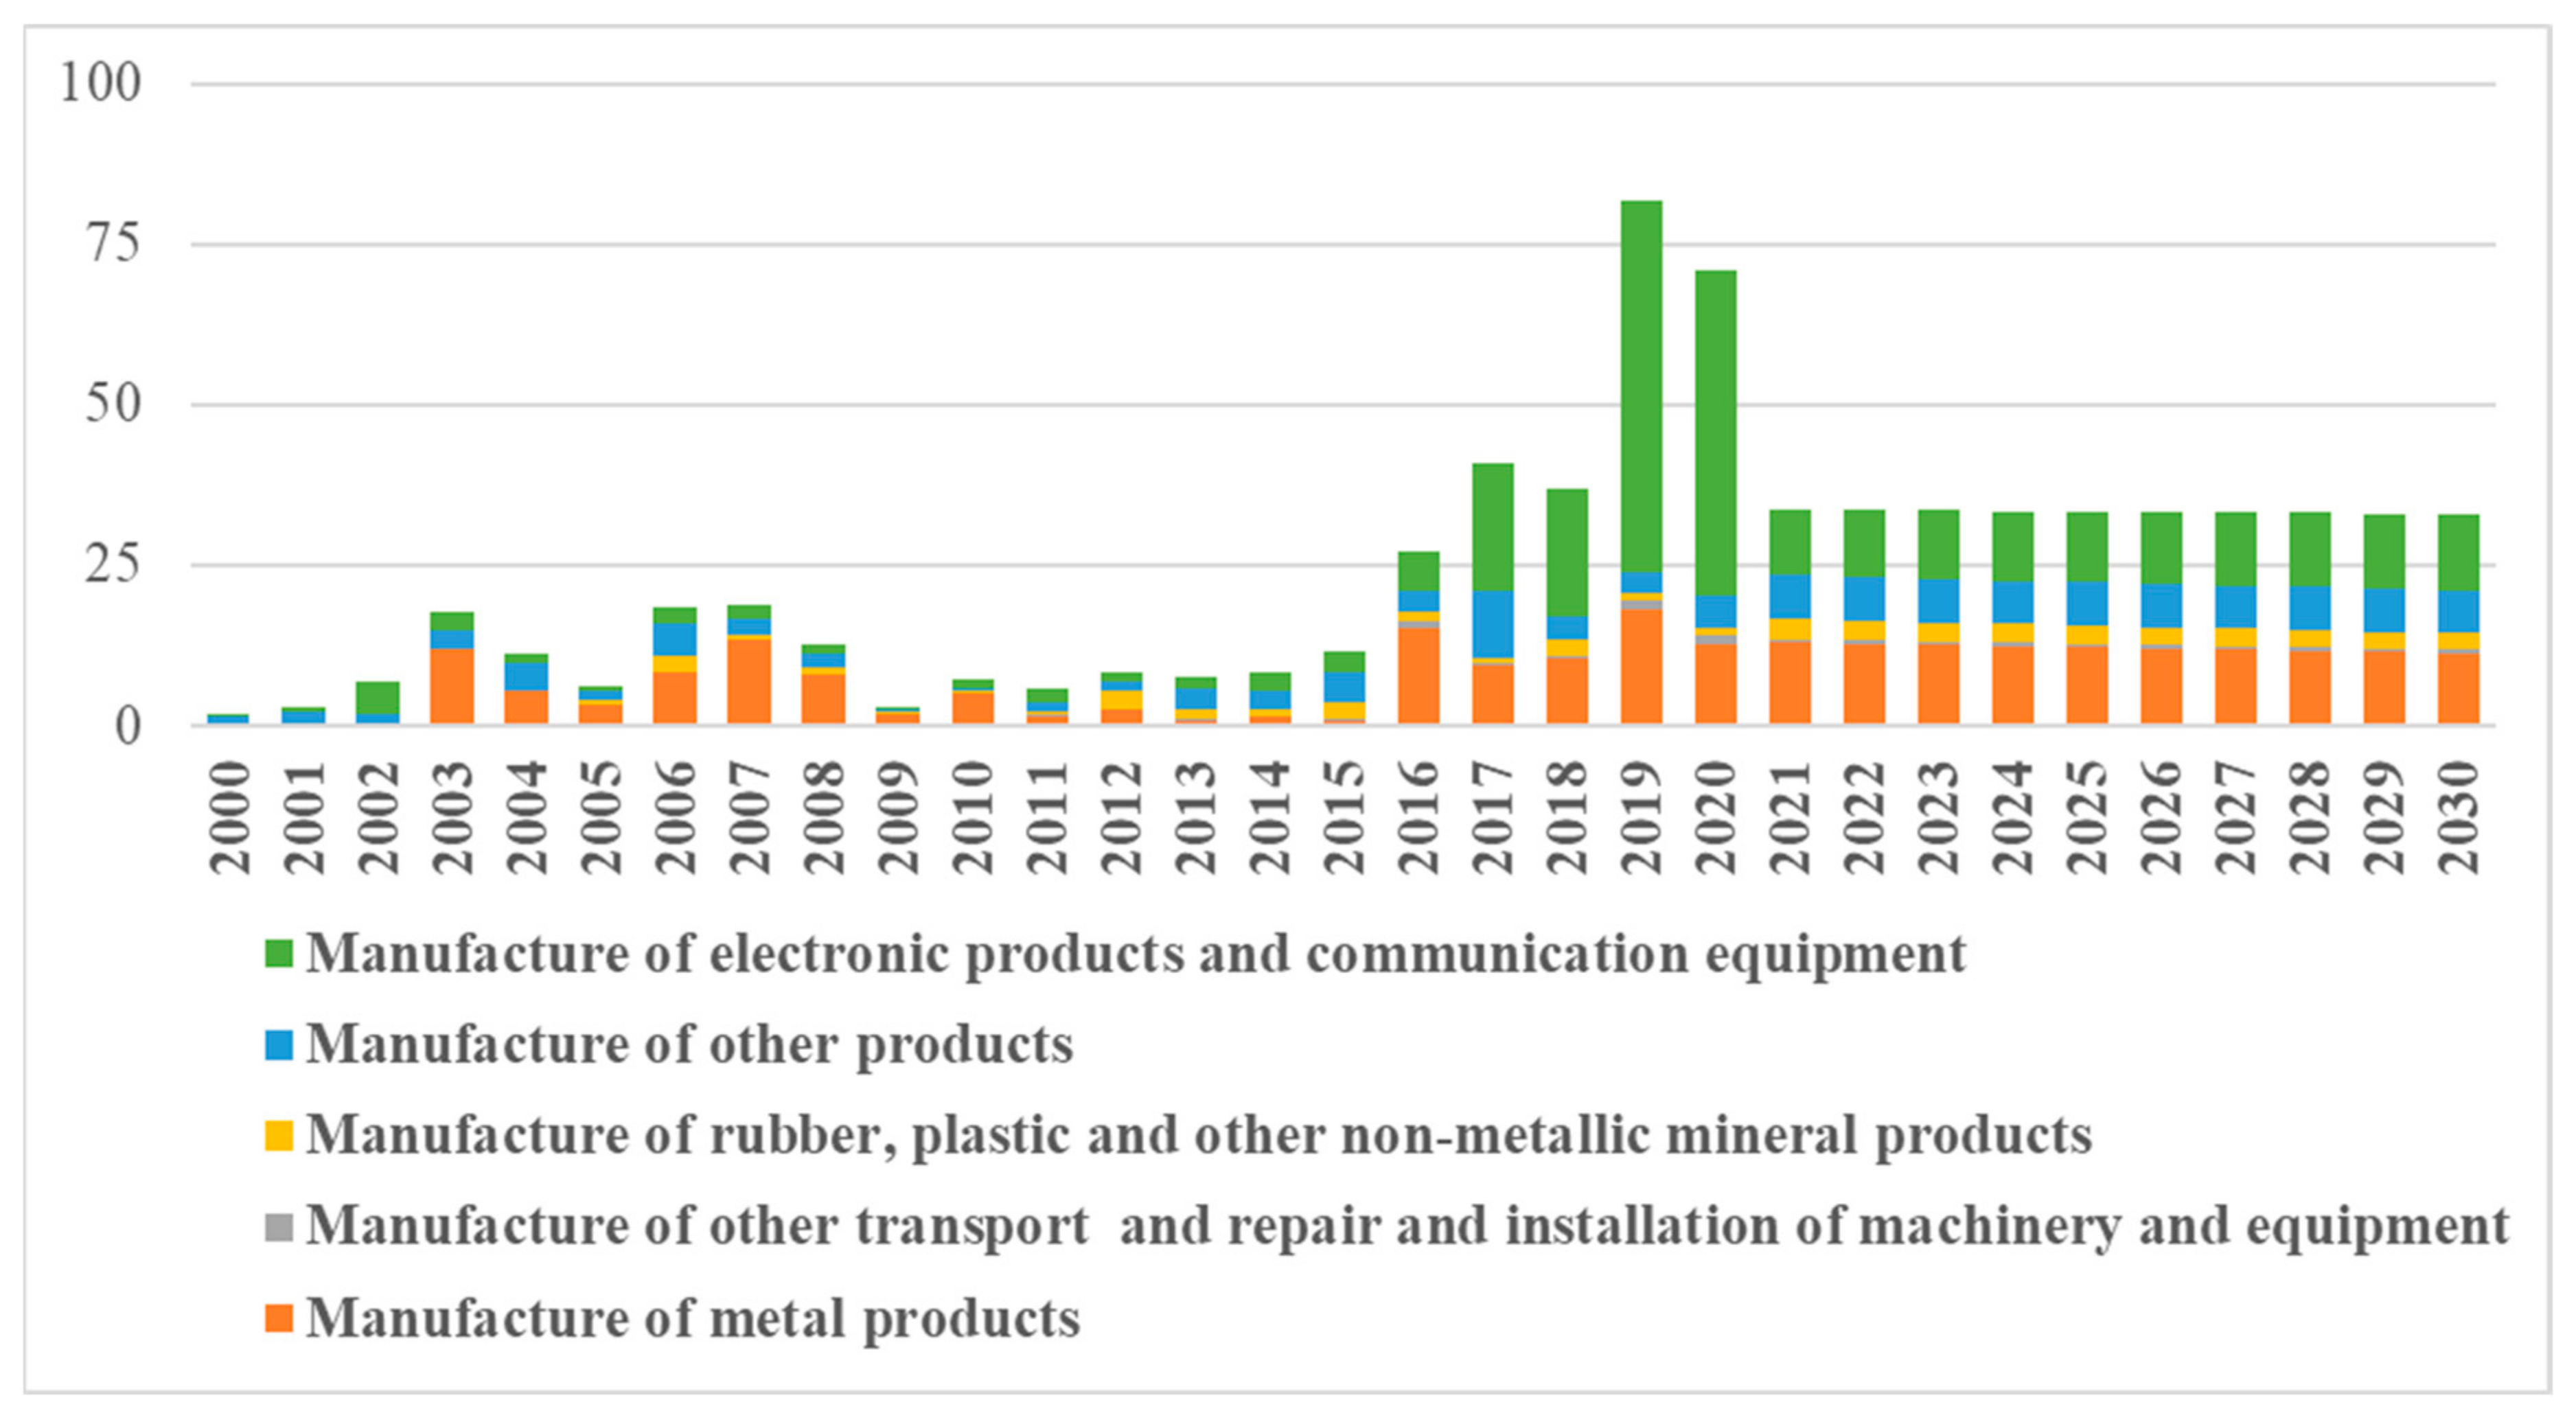
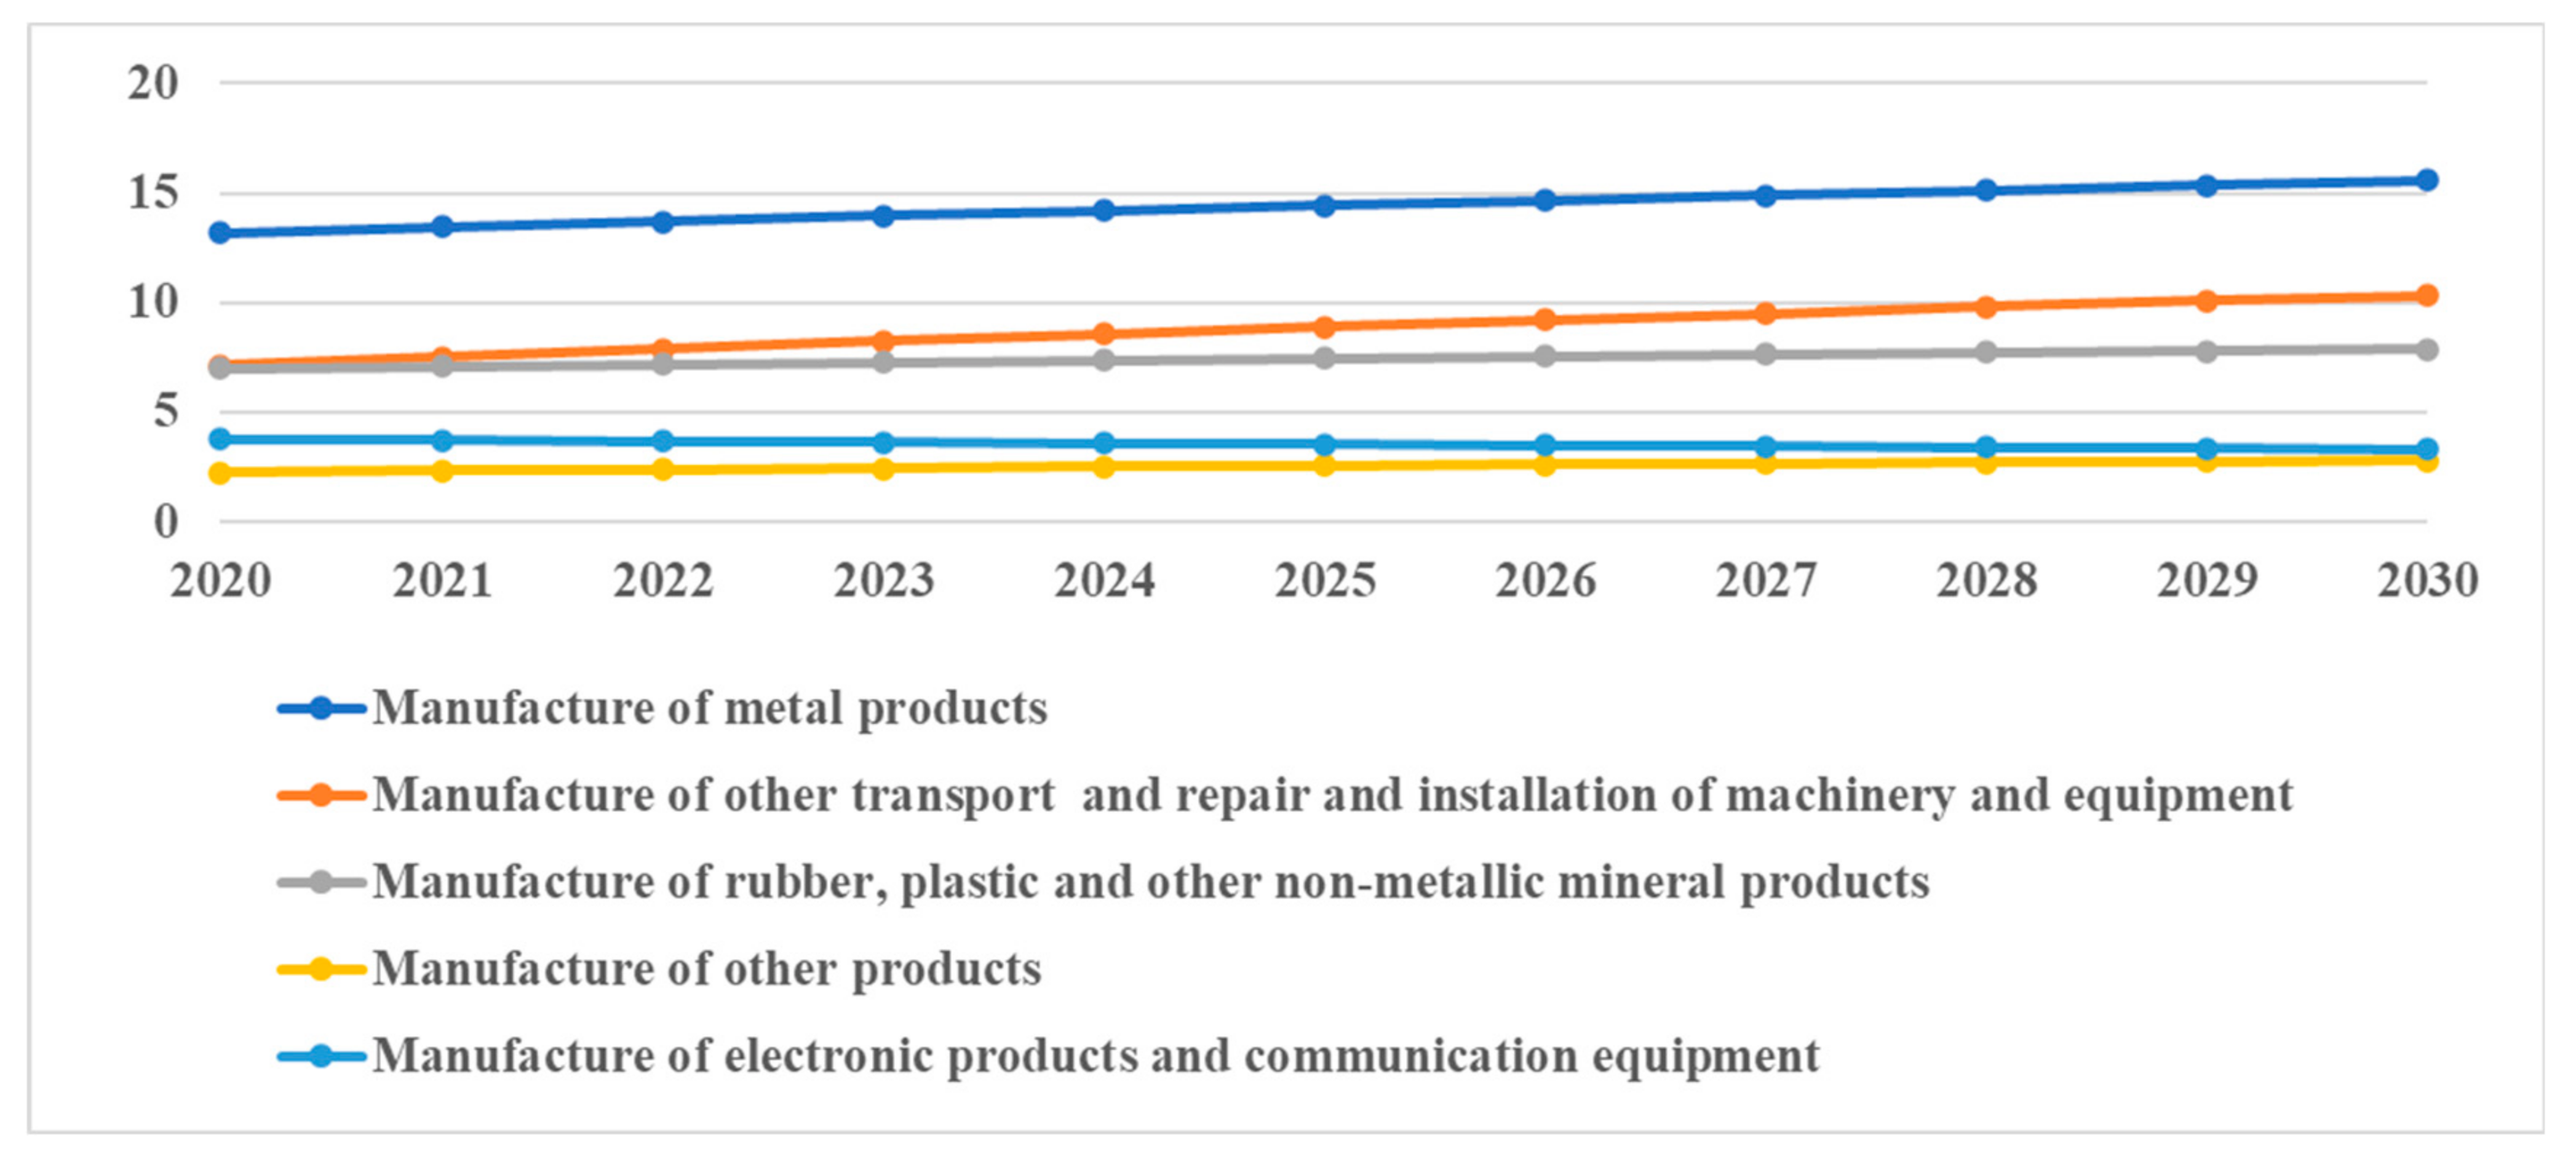
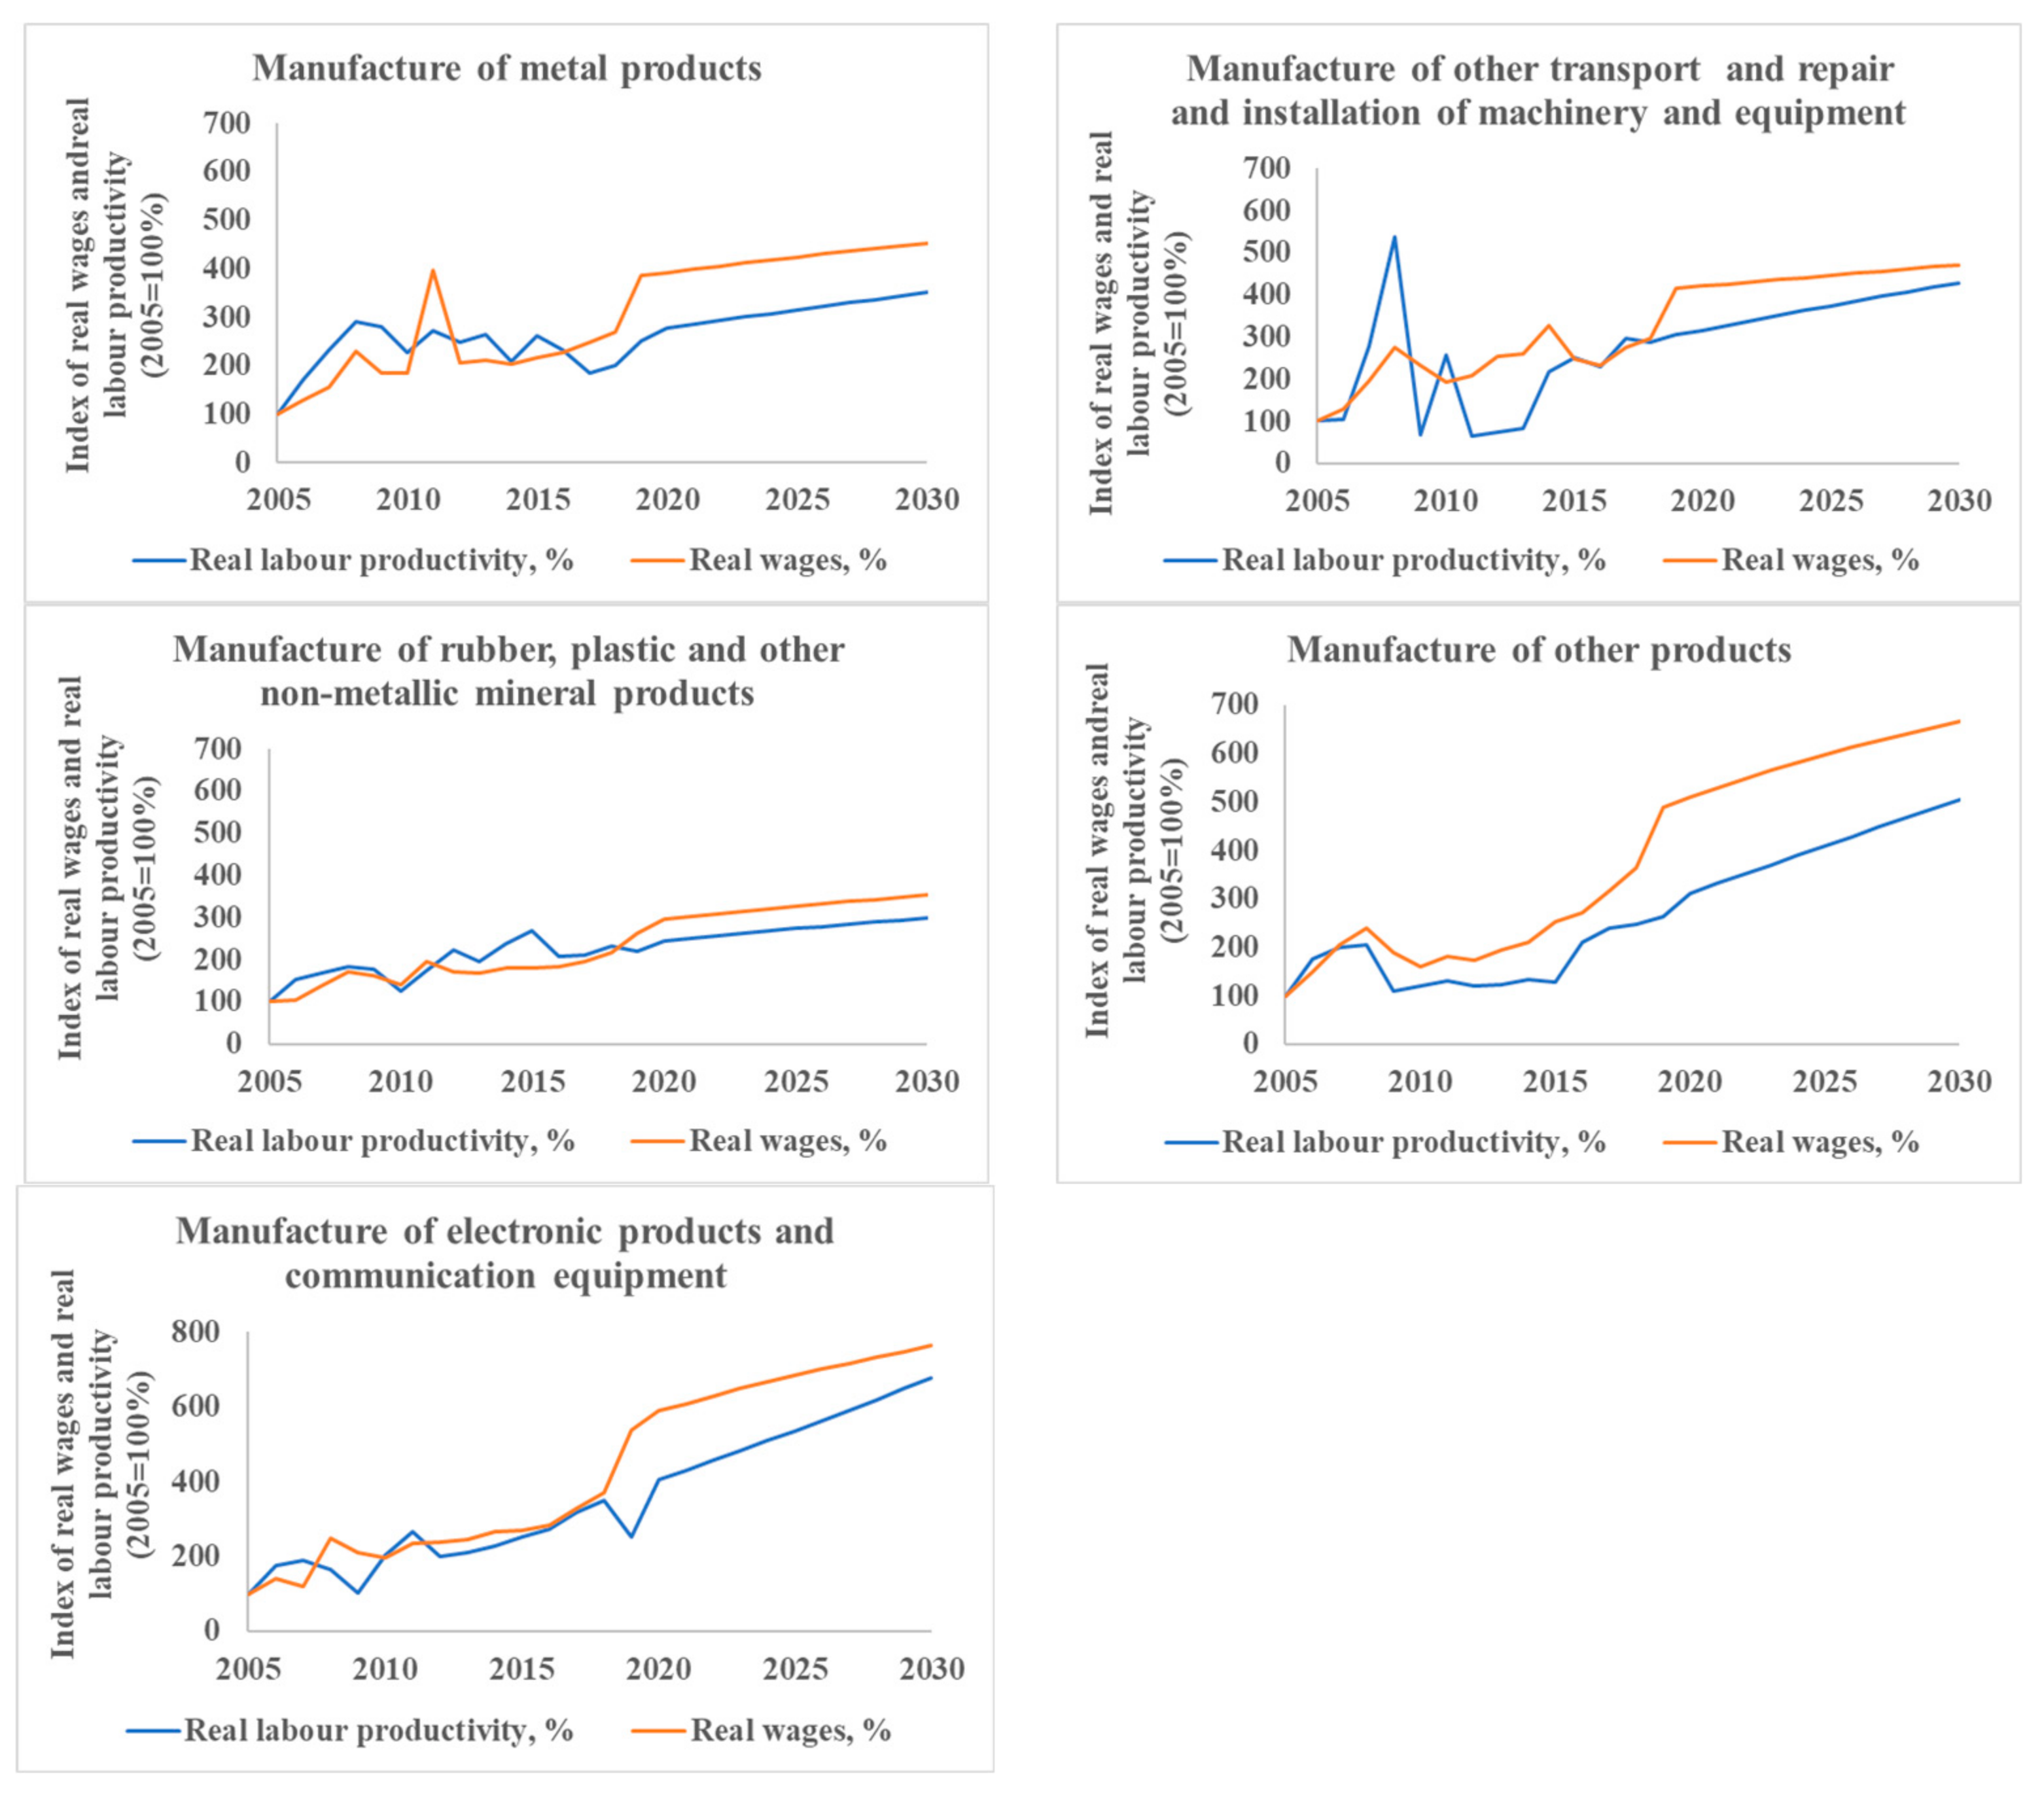
4.2.4. Expected Development of Labour Productivity till 2030

Due to expected investment in TA (Figure 12), the LP could increase in the future (Figure 13).
Estimations in Figure 13 show that the real LP should grow by 5.3% a year in the manufacture of electronic products and communication equipment, an increase to 33 EUR/h in 2030. The growth in LP in the manufacture of other products, other transport and the repair and installation of machinery and equipment is expected to be twice as slow, i.e., 4.9% and 3.1% a year, respectively. Therefore, it should account to 34 EUR/h and 30 EUR/h for manufacturing companies in 2030. The slowest development of LP is expected in the manufacture of rubber, plastic and other non-metallic mineral products by 2.1% a year. This should have an impact on LP of 28 EUR/h in 2030. LP in the manufacture of metal products should improve slowly, i.e., by 2.4% a year. However, it should be among the highest in 2030, 35 EUR/h. In comparison, the Lithuanian Economic Development Scenario [73] assumes that LP in the manufacturing sector should increase by 3.9% a year.
Thus, the step-by-step analysis proves the H0 hypothesis that real investment in TA is a relevant driver of improvement in LP in companies manufacturing WEC in Lithuania.

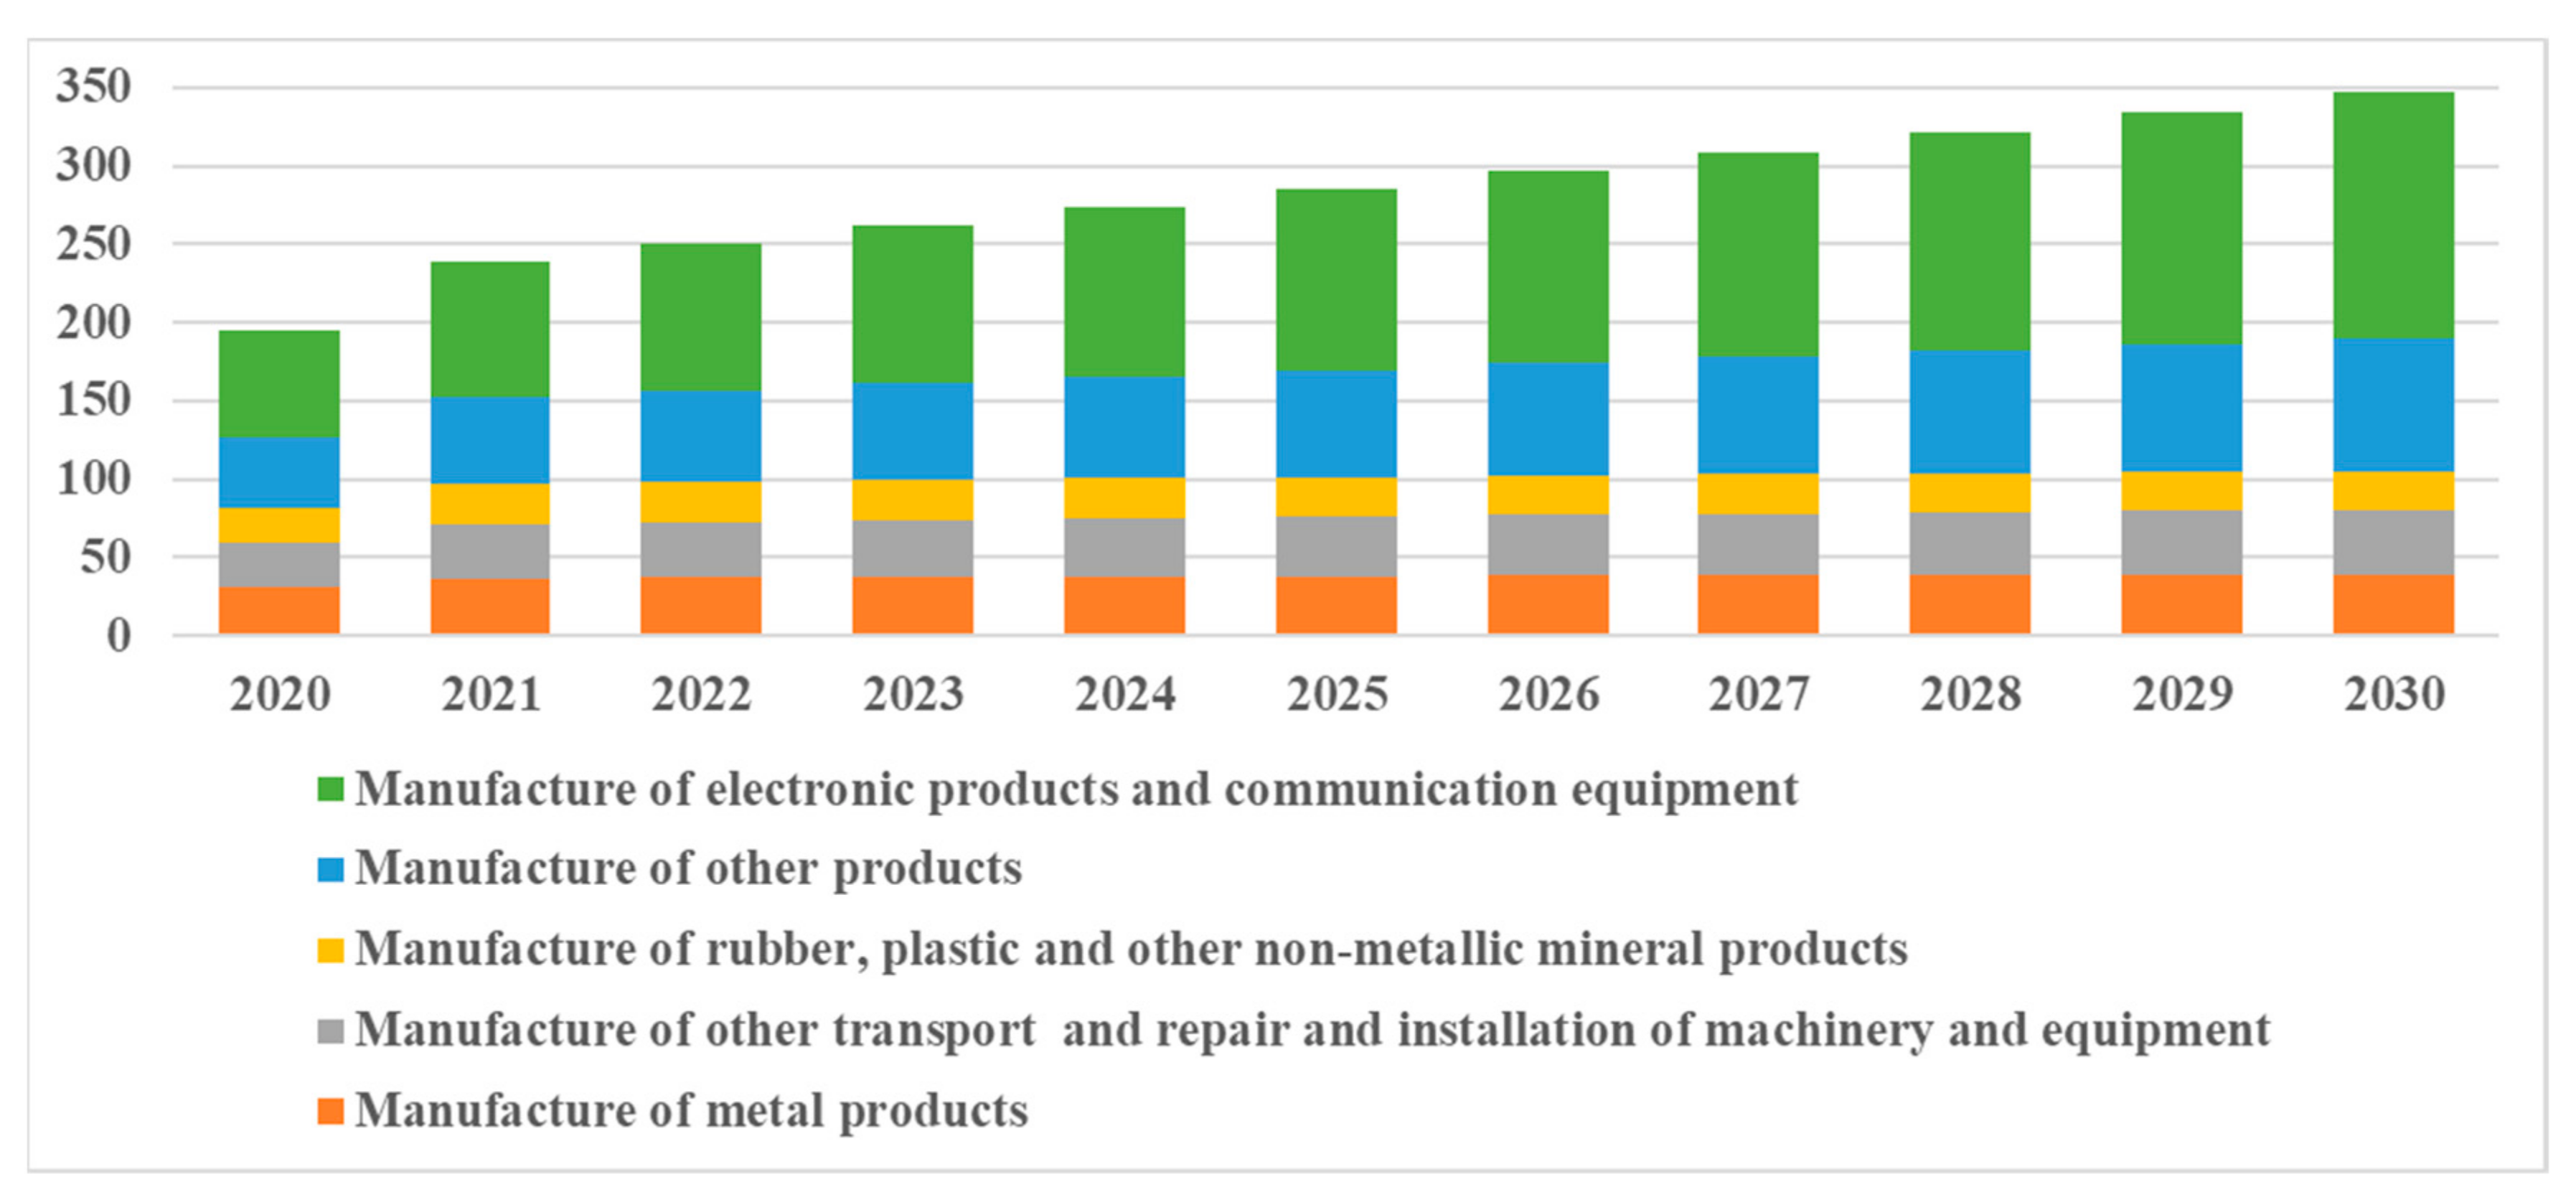
4.3. Expected Impacts of Improvement in Labour Productivity of WEC Companies

Taking into account the observations of [23,24,25] and [30], this section provides evidence, tests and proves the H1 that improving LP impacts on the growth of WEC companies, i.e., higher wages, net profitability and VA created.
Expected improvement in LP could impact on the increase in VA created by 5.9% a year (Figure 14).
Between 2021 and 2030, WEC companies could create up to 2.9 billion EUR, from which 41% could be created by WEC companies of electronic products and communication equipment. In comparison, the Lithuanian Economic Development Scenario [73] assumes that LP in the manufacturing sector should increase by 1.9–3.4% a year during 2021–2025. Transposing these rates into an analysis of VA created by WEC companies, it is expected that during 2021–2030, VA by WEC companies could reach 2.7 billion EUR. Taking into account the historic growth in LP of WEC companies in projections of LP, it is expected that VA created could be 3.7 billion EUR during 2021–2030. Thus, the analysis justifies the significance of investment in TA in WEC companies for the facilitation of economic growth in terms of increase in VA created by WEC companies. Therefore, investment funds, programmes and measures developed by the Government and EU are important.
Improvement in LP has been found positively correlated (the coefficient of determination (R2) and was found very low (up to 0.2)) with net profitability of WEC companies; therefore, based on the estimated relationship, it could be expected that due to improvements in LP, the net profitability could increase in WEC manufacturing companies (Figure 15).
As seen from Figure 15, net profitability of WEC companies manufacturing metal products could reach up to 15%, while it could be around 3% in WEC companies manufacturing electronic products and communication equipment, as well as other products by 2030.
Following the estimated positive correlation between LP and real wage (and salaries) in WEC companies (when the coefficient of determination had been found in ranges of low to high, i.e., R2 0.3–0.8), real wages could also increase (Figure 16).
As shown in Figure 16, real wages (and salaries) in WEC companies manufacturing other transport and repairing and installing machinery and equipment could increase by 12% till 18.5 EUR/h in the next decade. Economic activity was found to correlate with the highest real wages (and salaries) in 2030. The increase in real wages (and salaries) in WEC companies manufacturing metal products was estimated to be 15% during 2020–2030, with the second highest real wages (and salaries) of 18.2 EUR/h in 2030. The lowest real wages (and salaries) (16.4 EUR/h) are expected to be in WEC companies manufacturing rubber, plastic, other non-metallic mineral products and other products. However, the growth of real wages (and salaries) in these companies was found to be one of the highest, i.e., 31% and 20%, respectively.
Thus, the impact analysis confirmed the H1 that improving LP impacts on the growth of WEC companies in terms of higher wages, net profitability and VA created.

5. Discussion

The discussion is provided in a way to place the results of the research in the context of global studies in the field of LP, its drivers and impacts, as well as strategies to improve LP for the purpose of economic growth, competitiveness and improved living standards.
The regulatory context of the EU, underpinned by the Paris Agreement, the European Green Deal, the European Commission’s Communication “Wider Europe 2030 Climate Ambition: Investing in the Future of Climate-Neutral People”, as well as the European Industrial Strategy [6] and the Circular Economy action Plan [7], is favourable to the development of WEC manufacturing activities in EU and Lithuania, as it creates a demand for WEC accelerated by regulations and facilitates its variety. In the context of the request and call for affordable and clean energy, the promotion of sustainable and inclusive growth and urgent actions to combat climate change identified in the 2030 Agenda for Sustainable Development [77], WEC manufacturing significance becomes even more relevant. Therefore, the perspectives of WEC companies could be valued as positive in Lithuania. In order to meet RES targets in 2030, Europe needs to install 35 GW of wind power plants a year [76,78]. In 2021, the EU deployed 11 GW of wind energy [78]. Therefore, if wind energy-related issues [76] were solved by proposed measures [78], the annual gaps could be transposed into additional WEC manufacturing in Lithuania and other EU countries.
The research presented in the paper substantiates the statement that the growth of WEC companies depends on improvement in LP, which itself is impacted by increased investment in TA. This is partially in line with [13], who found a positive long-run relationship between the latter two variables in all EU countries. In detail, the interdependence analysis of investment in TA and LP in WEC companies by economic activity (Figure 17) finds the statement of [13] to be correct on average in WEC companies, including in WEC companies manufacturing metal and electronic products, communication equipment and other transport, as well as repairing and installing machinery and equipment. In these companies, a higher LP had been achieved subject to a higher amount of investment in TA. However, the estimated relationship has been found to be statistically insignificant, as coefficient of determination (R2) has been determined to be low. The specifics of interdependence of variables in WEC companies manufacturing rubber, plastic and other non-metallic mineral products lies in the observation that subject to high amounts of investment in TA, lower LP is achieved. In [12], it was found that productivity may decline when companies adopt new technologies connected with investment, but later improves as employees acquire experience with new systems. Moreover, in [12] it was found that, on average, the TFP of companies with investment spikes falls in subsequent periods. Such an aspect has not been researched in this paper.
Instead, this research supplements the existing literature [27] by disclosing that business cycles have a role in investment and LP in WEC companies. Particularly, during an economic recession (2008–2009), VA in WEC companies reduced almost twice (Figure 3), annual investment by 4.5 times (Figure 6) and LP by, on average, one-third (Figure 5); while during the period of rapid economic growth (2000–2007), the post-crisis (recovery) (2012–2018) and the global COVID-19 period (2019–2020), VA, investment and LP had increased in WEC companies. In [79], it is stated that “…the rapid growth of the global wind power market with increasing wind turbine manufacturing activities is one of top factors driving the wind turbine components market…”; therefore, the global WEC industry possessed a steady growth until 2019. With reference to [80], “…30 wind turbine manufacturers installed 104.7 GW of new wind power capacity in 2021 despite continuing disruptions caused by the COVID-19 pandemic and increasing pressure from commodity price increases and logistical problems…”. This supports the findings that even during the lockdown, which saw delays in supply chains and an absence of workforce as vendors migrated to their hometowns due to the uncertainties in the income [81], the slowed down growth could be available in WEC companies. This is due to the shifting trend toward the domestic supply chain, which reduced the reliance on foreign imports and encouraged domestic production of wind turbines and the implementation of digitization solutions in remote monitoring, thereby limiting the labour force [82].
Based on the results (Figure 14), in the future, WEC companies in Lithuania could grow by 5.9% a year to reach 350 million EUR in 2030. In comparison, in [81], it was estimated that the global wind turbine component market will grow by 6.34% a year to account 102.4 billion USD in 2030. There are prepared scenarios [83] in which the growth of the market is expected to be significant (7.7% a year), reaching 171.1 billion USD already in 2027. Similarly, in [84,85,86], it was estimated that the global wind turbine condition monitoring market will grow by 6.6% a year, while in Europe it will grow by 6.7% a year to 170.52 million USD by 2028. The comparison of various results discloses that the growth of WEC companies in Lithuania is slower and its contribution to the global wind turbine component market is small. However, recent distortions in supply chains due to COVID-19 and Russia’s actions in Ukraine could change the expected relationships between economic variables and, as a result, impact on growth; decision makers may reconsider the use of RES goals towards more ambitious and change supply routes. WEC companies could find new opportunities to play a bigger role in the regional and global supply chains of WEC if they are able to adapt their strategies quickly enough.
Continuing the theme of growth due to improved LP in WEC companies in context of the regulatory framework aiming at climate neutrality and sustainable development (Section 1), the research results supplement the literature [30] in a way that the manufacture of WEC contributes to sustainable economic growth through its relevant contributions to the power sector with significant shares of RES.
The results of the research made in [87] show that LP of the Lithuanian manufacturing sector remains one of the lowest in the EU. It has been stated that rising labour costs and lagging LP in the Lithuanian manufacturing sector are expected to become a major obstacle to the sector’s future competitiveness. The stated misgiving could also be applied in the context of competitiveness of WEC companies. The comparative analysis of the estimated improvements in LP and increases in wages (and salaries) (Figure 18) showed that the competitiveness of WEC could reduce in future if nothing is done. This comes from the observation that wages (and salaries) tend to increase faster than LP in WEC companies up to 2030 and they remain lower (Figure 18) than LP (Figure 13).
Considering the taxonomy of policies [17] and a nine-point strategy [66] to improve LP, policy makers could help WEC companies to improve LP by promoting innovative activities, human capital development and investment in the adaptation of new technologies.

6. Conclusions

The research substantiated the relevance of investment in TA for the improvement of LP and significance of the latter on the economic performance of companies producing WEC in Lithuania during 2000–2020 and later on till 2030.
The analysis of WEC and the identified manufacturing companies has showed that the sector is small, consisting only of a number companies with a small variety of products they manufacture. Several dozen WEC companies specialize in the manufacture of metal, rubber, plastic, non-metallic mineral, electronic and communication products, as well as the repair and installation of machinery and equipment, mainly for export. In Lithuania, these industries have gained several advantages, including access to a cheaper labour force and manual labour, a developed infrastructure (road and sea port) and a convenient geographical location in relation to the placement of installations of wind power plants, for which WEC are supplied and require experiences to use composite material for the shipbuilding. Due to realised investment and improved LP in Lithuania, the internationally performed WEC companies benefited in terms of reloading production capacities in neighbouring countries (Sweden) and thereby keeping their existing customers and acquiring new ones with globally increasing demands for and orders of WEC; to increase the variety of WEC manufactured and therefore to increase turnover, VA and profitability.
By applying the business structure research indicators and the trend analysis, the current status of economic performance of WEC companies has been analysed. It was found that the contribution of WEC companies to the country’s economy has remained negligible but has increased in terms of VA and employment. It has been observed that the development of VA has been characterized by considerable growth and decrease rates impacted by the economic cycle. WEC companies have attracted employees more intensively than on average in the Lithuanian manufacturing sector. Significantly improving LP in WEC companies was suspended by the financial crisis of 2008. Since 2013, on average, the LP in WEC companies has been moving hand-in-hand with the manufacturing sector. Investment has intensified during the last four years. It is a driver for improvement in LP.
The established ratio between change in LP to investment has showed that, on average, LP could increase by 0.13 EUR/h if 1000 EUR per employee is invested in tangible assets. A higher than average ratio has been estimated for the manufacture of other transport and repair and installation of machinery and equipment (1.41), rubber, plastic and other non-metallic mineral products (0.17) but lower in the manufacture of electronic and communication (0.12) and metal (0.06) products. Taking into account the linear curves of LP compared to tangible investment curve and the average volumes of investment in different manufacturing activities, it has been estimated that LP could grow by 5.3% a year in the manufacture of electronic products, and communication equipment is estimated to increase to 33 EUR/h in 2030, but it could grow only by 2.1% a year in the manufacture of rubber, plastic and other non-metallic mineral products to reach 28 EUR/h in 2030.
Due to investment related changes in LP, the VA created by WEC companies could increase by 5.9% a year and account to 2.9 billion EUR during 2021–2030.
Seeking to use the potential of companies to manufacture WEC for domestic wind installations and exports, investment supporting programmes are of high importance.
The research has its own limitations. Firstly, the linear curves of labour productivity to tangible investment were considered. In practice, the interrelations between the indicators could be more complex, therefore, other functions describing the links could be used. Secondly, the method of historical average was used to calculate real investment in TA. It does not reflect real demands for investment. In future research, the issue could be solved by at least relating the demand for investment in TA with expected installations of wind power plants, both regionally and globally. Thirdly, the perspective analysis was carried out considering the business structure research indicators of the existing WEC companies but does not take into account the indicators of companies that could take part in WEC manufacturing activities in the future.
This research has been performed as part of a study aiming at identifying and assessing the opportunities and development prospects of value chain for WEC in Lithuania. Taking this into account in future research, the concept of value chain for WEC in Lithuania will be expanded. In detail, value chain for WEC should include both main and supporting activities, as it is requested by M. Porter’s concept of the value chain. Furthermore, the structure of the wind energy sector is formed by wind turbine manufacturers, wind farm developers, their builders, companies providing operation and maintenance services, financial and insurance companies, consulting companies, research institutes and others. Taking this into account, as well as M. Porter‘s concept of the value chain, the value chain for WEC should be defined as the totality of economic activities of companies from planning and development of wind energy projects to storage and warehousing of end-of life WEC. According to the Lithuanian Wind Power Association, about 30 different businesses are involved in the development of the wind farm, while the paper researched only companies manufacturing WEC.

Author Contributions

Conceptualization: V.B.; methodology: V.B.; software: V.B.; validation: V.B.; investigation: V.B., I.K., A.C. and D.D.; supervision: V.B; writing and review: V.B., I.K., A.C. and D.D. All authors have read and agreed to the published version of the manuscript.

Funding

This research received no external funding.

Institutional Review Board Statement

Not applicable.

Informed Consent Statement

Not applicable.

Data Availability Statement

Data available in a publicly accessible repository that does not issue DOIs. Publicly available datasets were analyzed in this study. This data can be found here: [https://www.stat.gov.lt/home].

Conflicts of Interest

The authors declare no conflict of interest.

References

  1. Our World in Data. Available online: https://ourworldindata.org/ (accessed on 5 January 2022).
  2. BloombergNEF. Wind Energy Is the Cheapest Source of Electricity Generation. 2019. Available online: https://windeurope.org/policy/topics/economics/ (accessed on 5 January 2022).
  3. IRENA. Wind Summary Charts: Typical Onshore Wind Farm Installed Cost Breakdown. 2020. Available online: https://www.irena.org/costs/Charts/Wind (accessed on 5 January 2022).
  4. Submission by Latvia and the European Commission on Behalf of the European Union and its Member States. Intended Nationally Determined Contribution of the EU and its Member States. 2015. Available online: https://www4.unfccc.int/sites/ndcstaging/PublishedDocuments/Lithuania%20First/LV-03-06-EU%20INDC.pdf (accessed on 5 January 2022).
  5. Submission by Croatia and the European Commission on behalf of the European Union and its Member States. Long-Term Low Greenhouse Gas Emission Development Strategy of the European Union and Its Member States. 2020. Available online: https://unfccc.int/sites/default/files/resource/HR-03-06-2020%20EU%20Submission%20on%20Long%20term%20strategy.pdf (accessed on 5 January 2022).
  6. Europos Komisija. Europos Įmonių Parengimas Ateičiai. Nauja Pasaulyje Konkurencingos, Žaliosios ir Skaitmeninės Europos Pramonės Strategija. 2020a. Available online: https://ec.europa.eu/commission/presscorner/detail/lt/ip_20_416 (accessed on 5 January 2022).
  7. Europos Komisija. Žiedinės Ekonomikos Veiksmų Planas. 2020. Available online: https://ec.europa.eu/commission/presscorner/detail/lt/ip_20_420 (accessed on 5 January 2022).
  8. Europos Komisija. Jūrų Atsinaujinančiųjų Išteklių Energijos Strategija. 2020. Available online: https://ec.europa.eu/commission/presscorner/detail/lt/ip_20_2096 (accessed on 5 January 2022).
  9. National Energy and Climate Action Plan of the republic of Lithuania for 2021–2030. Available online: https://ec.europa.eu/energy/sites/ener/files/documents/lt_final_necp_main_en.pdf (accessed on 5 January 2022).
  10. LITGRID. Development of the Lithuanian Electric Power System and Transmission Grids. 2014. Available online: http://www.leea.lt/wp-content/uploads/2015/05/Network-development-plan-2015.pdf (accessed on 17 January 2022).
  11. Grzegorzewska, E.; Biernacka, J.; Podobas, I. Trends in employment and labour productivity in the woodworking industry in selected EU countries. Ann. Wars. Univ. Life Sci.-SGGW For. Wood Technol. 2019, 108, 111–118. Available online: https://www.semanticscholar.org/paper/Trends-in-employment-and-labour-productivity-in-the-Grzegorzewska-Biernacka/f5d6f88edd35dd49580f42bf1ab9c520cf4d016d (accessed on 15 January 2022). [CrossRef]
  12. Gradzewicz, M. Capital Investment Versus Labour Productivity: Evidence from Poland. 26 March 2020. Available online: https://voxeu.org/article/capital-investment-versus-labour-productivity (accessed on 15 January 2022).
  13. Stundziene, A.; Baliute, A. Link between Tangible Investment Rate and Labour Productivity in the European Manufacturing Industry. Panoeconomicus 2021, 1–29. Available online: https://panoeconomicus.org/index.php/jorunal/article/view/1557/674 (accessed on 15 March 2022). [CrossRef]
  14. Freeman, R. Labour Productivity Indicators. OECD Statistics Directorate: 2008. p. 94. Available online: https://www.oecd.org/sdd/productivity-stats/40605524.pdf (accessed on 17 January 2022).
  15. Frankel, M.; Kendrick, J.W. Productivity. Encyclopedia Britannica. 2014. Available online: https://www.britannica.com/topic/productivity (accessed on 15 March 2022).
  16. Singh, M.K. Labour Productivity in Indian Industry; Ankur Composer at Sunil Printers: New Deli, India, 1989. [Google Scholar]
  17. Albirizio, S.; Nicoletti, G. Boosting Productivity: A Framework for Analysis and a Checklist for Policy. 2016, p. 35. Available online: https://www.oecd.org/global-forum-productivity/events/Boosting%20Productivity.pdf (accessed on 17 January 2022).
  18. Eurostat. Productivity Trends Using Key National Accounts Indicators. 2022. Available online: https://ec.europa.eu/eurostat/statistics-explained/index.php?title=Productivity_trends_using_key_national_accounts_indicators#Decomposition_of_key_labour_productivity_indicators_into_periods (accessed on 17 January 2022).
  19. OECD. Multifactor Productivity. Available online: https://data.oecd.org/lprdty/multifactor-productivity.htm (accessed on 17 January 2022).
  20. Tangen, S. Demystifying Productivity and Performance. Int. J. Product. Perform. Manag. 2005, 54, 34–46. [Google Scholar] [CrossRef] [Green Version]
  21. Saari, S. Productivity. Theory and Measurement in Business. European Productivity Conference, Espoo. 2006. Available online: http://www.mido.fi/Index_tiedostot/Productivity%202006_tiedostot/Productivity_EPC2006_Saari.pdf (accessed on 15 March 2022).
  22. Ross, S. Why Is Productivity Important in Economics? Investopedia. 2021. Available online: https://www.investopedia.com/ask/answers/040615/why-productivity-important-concept-economics.asp (accessed on 14 March 2022).
  23. Gomez-Salvador, R.; Musso, A.; Stocker, M.; Turunen, J. Labour Productivity Developments in the Euro Area. Occosional Paper Series. European Central Bank. 2006. Available online: https://papers.ssrn.com/sol3/papers.cfm?abstract_id=923369 (accessed on 15 March 2022).
  24. Ark, B.; Monnikhof, E. Productivity and Unit Labour Cost Comparisons. International Labour Organization. 2000. Available online: https://www.ilo.org/wcmsp5/groups/public/---ed_emp/documents/publication/wcms_142286.pdf (accessed on 14 March 2022).
  25. Mahmud, M.; Rashid, A. Labor Productivity and Economic Growth, What Causes What: An Empircal Analysis. IBT J. Bus. Stud. (JBS) 2006, 2, 69–81. Available online: https://www.researchgate.net/publication/4737262_Labor_Productivity_and_Economic_Growth_What_Causes_What_An_Empirical_Analysis (accessed on 23 April 2022).
  26. Dong, N.T.; Diem, T.T.A.; Chinh, B.T.H.; Hien, N.T.D. The Interaction between Labor Productivity and Competitiveness in Vietnam. J. Asian Financ. Econ. Bus. 2020, 7, 619–627. [Google Scholar] [CrossRef]
  27. Auzina-Emsina, A. Labour productivity, economic growth and global competitiveness in post-crisis period. Procedia-Soc. Behav. Sci. 2014, 156, 317–321. [Google Scholar] [CrossRef] [Green Version]
  28. Nolan, P.; Reece, P.; Guanyu, Z. Productivity by the Numbers: 2019. New Zealand Productivity Commission. 2019. Available online: www.productivity.govt.nz (accessed on 23 April 2022).
  29. Bagley, S. How to Calculate Productivity of Labour. 2010. Available online: http://worldwidescience.org/topicpages/l/labor+productivity.html (accessed on 14 March 2022).
  30. Reserve Bank of Australia. Explainers: Productivity: 2022. Available online: https://www.rba.gov.au/education/resources/explainers/productivity.html (accessed on 14 March 2022).
  31. New Zeeland Productivity Commission. Poor Productivity Hurts Living Standards. 2019. Available online: https://www.productivity.govt.nz/news/poor-productivity-hurts-living-standards/ (accessed on 23 April 2022).
  32. Korkmaz, S.; Korkmaz, O. The Relationship between Labor Productivity and Economic Growth in OECD Countries. Int. J. Econ. Financ. 2017, 9, 71. [Google Scholar] [CrossRef] [Green Version]
  33. Jasperson, H.D. What Is Labor Productivity? Investopedia. 2020. Available online: https://www.investopedia.com/terms/l/labor-productivity.asp (accessed on 28 March 2022).
  34. Levanon, G.; Tait, K. Twenty Year View of Labor Productivity in Advanced Countries. The Conference Board. 2013. Available online: https://www.conference-board.org/blog/postdetail.cfm?post=1426&blogid=7 (accessed on 28 March 2022).
  35. Tang, J.; MacLeod, C. Labour Force Ageing and Productivity Performance in Canada. Can. J. Econ. 2006, 39, 582–603. [Google Scholar] [CrossRef]
  36. Jorgenson, D.; Vu, K. Technology and Labor Productivity. Development Outreach. World Bank. 2011. Available online: https://openknowledge.worldbank.org/bitstream/handle/10986/6101/deor_13_1_45.pdf?sequence=1&isAllowed=y (accessed on 23 April 2022).
  37. Benos, N.; Zotou, S. Education and economic growth: A meta-regression analysis. World Dev. 2014, 64, 669–689. [Google Scholar] [CrossRef] [Green Version]
  38. Goldin, C. Human capital. In Handbook of Cliometrics; Diebolt, C., Haupert, M., Eds.; Springer: Berlin/Heidelberg, Germany, 2016; pp. 55–86. [Google Scholar]
  39. Shafuda, C.P.P.; De, U.K. Government Expenditure on Human Capital and Growth in Namibia: A Time Series Analysis. J. Econ. Struct. 2020, 9, 1–14. Available online: https://doi.org/10.1186/s40008-020-00196-3 (accessed on 23 April 2022). [CrossRef]
  40. MacLeod, W.B. Viewpoint: The human capital approach to inference. Can. J. Econ. 2017, 5, 5–39. [Google Scholar] [CrossRef] [Green Version]
  41. Baharin, R.; Aji, R.H.S.; Yussof, I.; Saukani, N.M. Impact of Human Resource Investment on Labor Productivity in Indonesia. Iran. J. Manag. Stud. 2020, 13, 139–164. [Google Scholar]
  42. Kocourek, A.; Nedomlelová, I. Three levels of education and the economic growth. Appl. Econ. 2018, 50, 2103–2116. [Google Scholar] [CrossRef]
  43. Nedomlelová, I.; Kocourek, A. Human Capital: Relationship between Education and Labour Productivity in the European Countries. In Proceedings of the 10th International Days of Statistics and Economics, Prague, Czech Republic, 8–10 September 2016; pp. 1315–1324. Available online: https://msed.vse.cz/msed_2016/article/271-Nedomlelova-Iva-paper.pdf (accessed on 28 March 2022).
  44. Le, N.H.; Duy, L.V.Q.; Ngoc, B.H. Effects of Foreign Direct Investment and Human Capital on Labour Productivity: Evidence from Vietnam. J. Asian Financ. Econ. Bus. 2019, 6, 123–130. [Google Scholar] [CrossRef]
  45. Katz, A.S.; Pronk, N.P.; Mclellan, D.; Dennerlein, J.; Katz, J.N. Perceived workplace health and safety climates: Associations with worker outcomes and productivity. Am. J. Prev. Med. 2019, 57, 487–494. [Google Scholar] [CrossRef]
  46. Haapakangas, A.; Hallman, D.M.; Erik, S.; Jahncke, H. Self-rated productivity and employee well-being in activity-based offices: The role of environmental perceptions and workspace use. Build. Environ. 2018, 145, 115–124. [Google Scholar] [CrossRef]
  47. Amirul, S.R.; Pazim, K.H.; Amirul, S.M.; Mail, R.; Dasan, J. Developing and Validating the Qualitative Labour Productivity Measurement in Service Industry. Qual. Quant. 2021, 251. [Google Scholar] [CrossRef]
  48. Roth, F. Revisiting Intangible Capital and Labor Productivity Growth, 2000–2015: Accounting for the Crisis and Economic Recovery in the EU. Intangible Capital and Growth. Contrib. Econ. 2020, 21, 17–42. [Google Scholar] [CrossRef]
  49. Corrado, C.; Haskel, J.; Jona-Lasinio, C.; Iommi, M. Intangible investment in the EU and US before and since the great recession and its contribution to productivity growth. J. Infrastruct. Policy Dev. 2018, 2, 11–36. [Google Scholar] [CrossRef] [Green Version]
  50. Bini, M.; Nascia, L.; Zeli, A. Industry profiles and economic performances: A firm-data-based study for Italian industries. Statitica Appl.—Ital. J. Appl. Stat. 2014, 23, 331–345. [Google Scholar]
  51. Heshmati, A.; Rashidghalam, M. Labour Productivity in Kenyan Manufacturing and Service Industries. Determ. Econ. Growth Afr. 2018, 259–286. [Google Scholar]
  52. Herzog-Stein, A.; Horn, G.A. The productivity puzzle: It’s the lack of investment, stupid! Intereconomics 2018, 53, 69–75. Available online: https://www.intereconomics.eu/contents/year/2018/number/2/article/the-productivity-puzzle-its-the-lack-of-investment-stupid.html (accessed on 23 April 2022). [CrossRef] [Green Version]
  53. Ceccobelli, M.; Gitto, S.; Mancuso, P. ICT capital and labour productivity growth: A non-parametric analysis of 14 OECD countries. Telecommun. Policy 2012, 36, 282–292. [Google Scholar] [CrossRef] [Green Version]
  54. Roth, F. Intangible Capital and Labour Productivity Growth: A Review of the Literature. Hamburg Discussion Papers in International Economics 2019, No. 4. Available online: https://www.econstor.eu/bitstream/10419/207163/1/hdpie-no04.pdf (accessed on 27 April 2022).
  55. Alam, A.; Arshad, M.U.; Rajput, W. Relationship of labor productivity, foreign direct investment and economic growth: Evidence from OECD countries. J. Bus. Manag. Sci. 2013, 1, 133–138. Available online: http://pubs.sciepub.com/jbms/1/6/3 (accessed on 28 April 2022).
  56. Demmou, L.; Stefanescu, I.; Arquie, A. Productivity Growth and Finance: The Role of Intangible Assets—A Sector Level Analysis; OECD Economics Department Working Papers; OECD Publishing: Paris, France, 2019; p. 1547. [Google Scholar] [CrossRef]
  57. Adarov, A.; Stehrer, R. Tangible and Intangible Assets in the Growth Performance of the EU, Japan and the US. Research Report 2019, No. 442. Available online: https://wiiw.ac.at/tangible-and-intangible-assets-in-the-growth-performance-of-the-eu-japan-and-the-us-dlp-5058.pdf (accessed on 27 April 2022).
  58. Baldwin, J.R.; Gu, W.; Macdonald, R. Intangible Capital and Productivity Growth in Canada. The Canadian Productivity Review 2012 No. 29. Available online: https://ssrn.com/abstract=2093526 (accessed on 27 April 2022).
  59. Nakamura, K.; Kaihatsu, S.; Yagi, T. Productivity improvement and economic growth: Lessons from Japan. Econ. Anal. Policy 2019, 62, 57–79. [Google Scholar] [CrossRef]
  60. Dasgupta, S.; van Maanen, N.; Gosling, S.N.; Piontek, F.; Otto, C.; Schleussner, C.F. Effects of climate change on combined labour productivity and supply: An empirical, multi-model study. Lancet Planet. Health 2021, 5, e455–e465. Available online: https://www.thelancet.com/action/showPdf?pii=S2542-5196%2821%2900170-4 (accessed on 29 April 2022). [CrossRef]
  61. Gosling, S.N.; Zaherpour, J.; Ibarreta, D. PESETA III: Climate Change Impacts on Labour Productivity. European Commission, Joint Research Centre. 2018. Available online: https://doi.org/10.2760/07911(accessed on 29 April 2022). [CrossRef]
  62. Szewczyk, W.; Mongelli, I.; Ciscar, J.C. Heat stress, labour productivity and adaptation in Europe—A regional and occupational analysis. Environ. Res. Lett. 2021, 16, 105002. [Google Scholar] [CrossRef]
  63. Lisi, D.; Malo, M.A. The impact of temporary employment on productivity. J. Labour Mark. Res. 2017, 50, 91–112. [Google Scholar] [CrossRef] [Green Version]
  64. Kleinknecht, A.; van Schaik, F.N.; Zhou, H. Is flexible labour good for innovation? Evidence from firm-level data. Camb. J. Econ. 2014, 38, 1207–1219. [Google Scholar] [CrossRef]
  65. Pariboni, R.; Tridico, P. Structural change, institutions and the dynamics of labor productivity in Europe. J. Evol. Econ. 2020, 30, 1275–1300. [Google Scholar] [CrossRef] [Green Version]
  66. Neufeind, M.; Priesmeier, C. A New Productivity Strategy for Europe. Bertelsmann Stiftung Inclusive Growth for Europe Policy Paper April 2020. Available online: http://aei.pitt.edu/103237/1/BST_PB_IW_E03lay.pdf (accessed on 17 May 2022).
  67. Zulu, J.J.; Banda, B.M. The impact of labour productivity on economic growth: The case of Mauritius and South Africa. S. Afr. J. Policy Dev. 2015, 2, 6. Available online: https://scholarship.law.cornell.edu/sajpd/vol2/iss1/6/ (accessed on 17 May 2022).
  68. Sánchez, P.E.; Benito-Hernández, S. CSR policies: Effects on labour productivity in Spanish micro and small manufacturing companies. J. Bus. Ethics 2015, 128, 705–724. Available online: https://oa.upm.es/29428/2/INVE_MEM_2013_170190.pdf (accessed on 18 May 2022). [CrossRef] [Green Version]
  69. Bassanini, A.; Venn, D. The Impact of Labour Market Policies on Productivity in OECD Countries. International Productivity Monitor. 1 September 2008. p. 17. Available online: http://www.csls.ca/ipm/17/IPM-17-bassanini.pdf (accessed on 18 May 2022).
  70. Abramovsky, L.; Bond, S.; Harrison, R.; Simpson, H. Productivity Policy. The Institute of Fiscal Studies. 2005. Available online: https://ifs.org.uk/uploads/publications/bns/05ebn6.pdf (accessed on 17 May 2022).
  71. Moss, E.; Nunn, R.; Shambaugh, J. The Slowdown in Productivity Growth and Policies That Can Restore It. 2020 June. Available online: https://www.brookings.edu/wp-content/uploads/2020/06/Productivity_Framing_LO_6.16_FINAL.pdf (accessed on 18 May 2022).
  72. Statistics Lithuania. Available online: https://www.stat.gov.lt/home (accessed on 19 May 2022).
  73. Ministry of Finance of Republic of Lithuania. Ekonominės Raidos Scenarijus. 2021. Available online: https://finmin.lrv.lt/lt/aktualus-valstybes-finansu-duomenys/ekonomines-raidos-scenarijus (accessed on 31 March 2022).
  74. Lithuania: Skills Forecasts up to 2025. European Centre for the Development of Vocational Training 2015. Available online: https://www.cedefop.europa.eu/lt/country-reports/lithuania-skills-forecasts-2025 (accessed on 20 May 2022).
  75. Statistics Lithuania. Available online: https://osp.stat.gov.lt/statistiniu-rodikliu-analize?hash=b11b44cc-e2f3-4241-a923-94f0b70259c2#/ (accessed on 22 May 2022).
  76. Wind Europe. How to Accelarate Permitting for Wind Energy. WindEurope’s Recommendations to RepowerEU Action Plan. 2022 May. Available online: https://windeurope.org/wp-content/uploads/files/policy/position-papers/20220517-WindEurope-position-paper-Wind-industry-permitting-recommendations.pdf (accessed on 25 June 2022).
  77. United Nations. Agenda for Sustainable Development. Available online: https://sdgs.un.org/2030agenda (accessed on 25 June 2022).
  78. Wind Europe. European Wind Energy Supply Strugling, Green Deal at Risk. 2022 February. Available online: https://windeurope.org/wp-content/uploads/files/policy/position-papers/20220222-WindEurope-letter-to-President-von-der-Leyen.pdf (accessed on 25 June 2022).
  79. Global Wind Turbine Manufacturing Industry Grows, Boosting the Demand of Wind Turbine Components. 22 July 2019. Available online: https://blog.technavio.org/blog/global-wind-turbine-manufacturing-industry (accessed on 24 June 2022).
  80. Global Wind Energy Council. Wind Turbine Suppliers See Record Year for Deliveries Despite Supply Chain and Market Pressures. 19 May 2022. Available online: https://gwec.net/wind-turbine-suppliers-see-record-year-for-deliveries-despite-supply-chain-and-market-pressures/ (accessed on 24 June 2022).
  81. Precedence Research. Wind Turbine Market (By Axis: Vertical, Horizontal; By Installation: Offshore, Onshore; By Components: Rotator Blade, Generator, Gearbox, Nacelle; By Application: Residential, Utility, Industrial, Commercial; By Capacity: Small, Medium, Large; By Connectivity; By Rating)—Global Industry Analysis, Size, Share, Growth, Trends, Regional Outlook, and Forecast 2022–2030. Available online: https://www.precedenceresearch.com/wind-turbine-market (accessed on 25 June 2022).
  82. Allied Martket Research. Wind Energy Market by Type (Offshore and Onshore) and End-User (Industrial, Commercial, and Residential): Global Opportunity Analysis and Industry Forecast, 2020–2027. Available online: https://www.alliedmarketresearch.com/wind-energy-market-A10536 (accessed on 25 June 2022).
  83. Imarcgroup. Wind Turbine Components Market: Global Industry Trends, Share, Size, Growth, Opportunity and Forecast 2022–2027. Available online: https://www.imarcgroup.com/wind-turbine-components-market (accessed on 25 June 2022).
  84. The Insight Partners. Wind Turbine Condition Monitoring Market Forecast to 2028—COVID-19 Impact and Global Analysis By Component (Hardware, Software, and Services) and Application (Rotor, Tower, Gearbox, Generator, and Others). 2022 February. Available online: https://www.theinsightpartners.com/reports/wind-turbine-condition-monitoring-market/ (accessed on 25 June 2022).
  85. Available online: https://www.businessmarketinsights.com/ (accessed on 25 June 2022).
  86. Panevezio Pletros Agentura. Mazu ir Vidutiniu Imoniu Kompetenciju Poreikio Siekiant Pasiruosti ir Iveikti PRAMONE 4.0 Issukius Analize. 2020. Available online: https://www.esf.lt/data/public/uploads/2020/07/mvi-kompetenciju-poreikio-siekiant-pasiruosti-ir-iveikti-pramone-4.0-iss....pdf (accessed on 25 June 2022).
  87. Dragašius, E.; Bobinaitė, V.; Čibinskienė, A.; Dumčiuvienė, D.; Jūrėnas, V.; Kavaliauskienė, L.; Marčiukaitis, M.; Krilavičius, T.; Urniežius, R. Lietuvos vėjo energetikos komponentų vertės grandinę formuojančių pramonės įmonių verslo aplinkos, konkurencingumo ir plėtros analizė. Mokslo Studija 2021. Available online: https://ktu.edu/projects/lietuvos-pramones-dalyvavimo-vejo-energetikos-komponentu-vertes-grandineje-galimybiu-tyrimas-vegrand/ (accessed on 25 June 2022).
Figure 1. Number of WEC companies covered by the research.
Energies 15 04925 g001
Figure 2. Logical scheme of research performance (own work).
Energies 15 04925 g002
Figure 3. Value added, million EUR (at current prices).
Energies 15 04925 g003
Figure 4. Number of employees, in persons and %.
Energies 15 04925 g004
Figure 5. Labour productivity, EUR/h.
Energies 15 04925 g005
Figure 6. Investment by asset type, million EUR.
Energies 15 04925 g006
Figure 7. Investment by economic activity, million EUR.
Energies 15 04925 g007
Figure 8. Wages (and salaries), EUR/h.
Energies 15 04925 g008
Figure 9. Net profitability, %.
Energies 15 04925 g009
Figure 10. Ratio of change of labour productivity to investment in tangible assets during 2005–2020 (own estimation).
Energies 15 04925 g010
Figure 11. Linear curves of labour productivity to tangible investment (own estimation).
Energies 15 04925 g011
Figure 12. Real investment in tangible assets till 2030, million EUR (own estimation).
Energies 15 04925 g012
Figure 13. Real labour productivity till 2030, EUR/h (own estimation).
Energies 15 04925 g013
Figure 14. Real value added till 2030, million EUR (own estimation).
Energies 15 04925 g014
Figure 15. Net profitability till 2030, % (own estimation).
Energies 15 04925 g015
Figure 16. Real wages (and salaries) till 2030, EUR/h (own estimation).
Energies 15 04925 g016
Figure 17. Interdependence of investment in tangible assets and labour productivity during 2000–2020 (own estimation).
Energies 15 04925 g017aEnergies 15 04925 g017b
Figure 18. Index of real wages (and salaries) and real labour productivity during 2005–2020 (own estimation).
Energies 15 04925 g018
Publisher’s Note: MDPI stays neutral with regard to jurisdictional claims in published maps and institutional affiliations.

