
Measuring Pollution Control and Environmental Sustainable Development in China Based on Parallel DEA Method


Abstract
:1. Introduction
2. Literature
- (1)
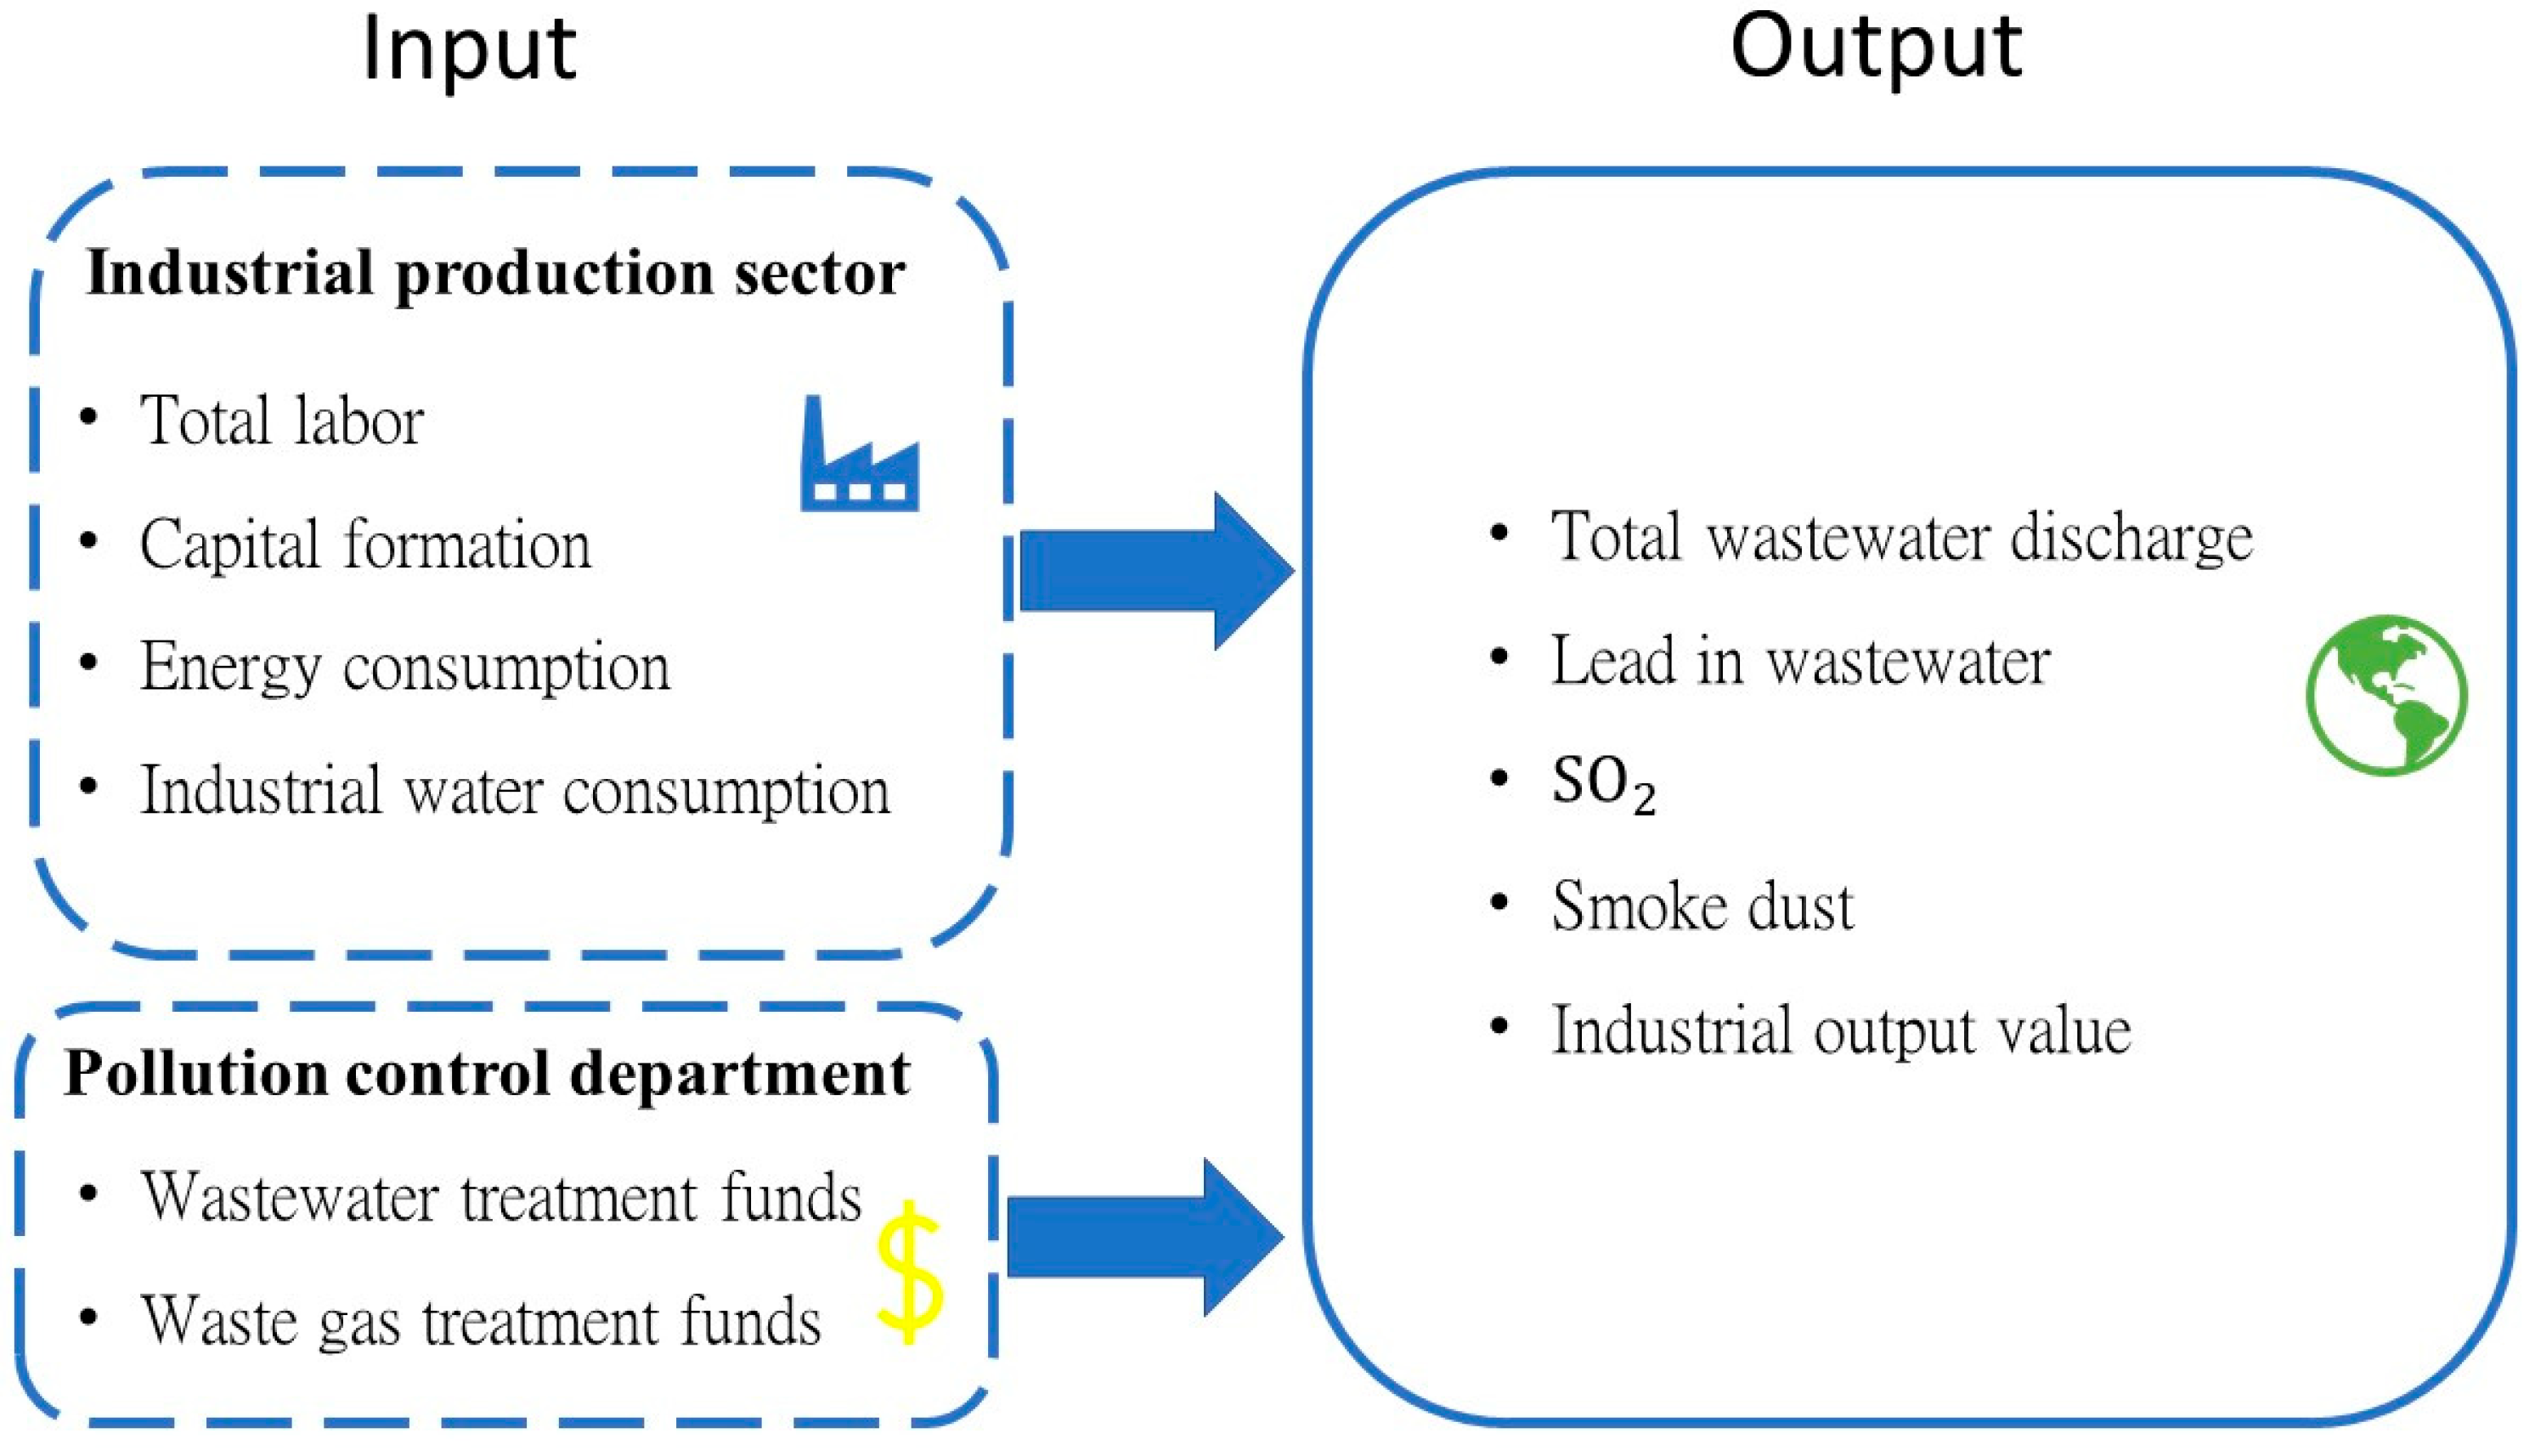
- Different from the previous literature results, this study uses the parallel method and takes the industrial production department and the pollution control department as input variables to objectively evaluate the impact of pollution prevention and control funds on industrial production efficiency in 31 provinces and municipalities in China;
- (2)
- This study compares the changes in industrial production efficiency and the technology gap between the Yellow River Basin and Non-Yellow River Basin, which is conducive to mastering the situation of pollution control and production efficiency in 31 provinces and municipalities in China, and provides objective suggestions as a reference for SDG-6- and SDG-9-related policy making.
3. Research Method
3.1. Directional Distance Function, DDF
3.2. Technology Gap Ratio, TGR
4. Data Analysis and Empirical Results
4.1. Selection of Data Sources and Variables
4.2. Input and Output Variables Statistical Analysis
4.3. Empirical Results
- (1)
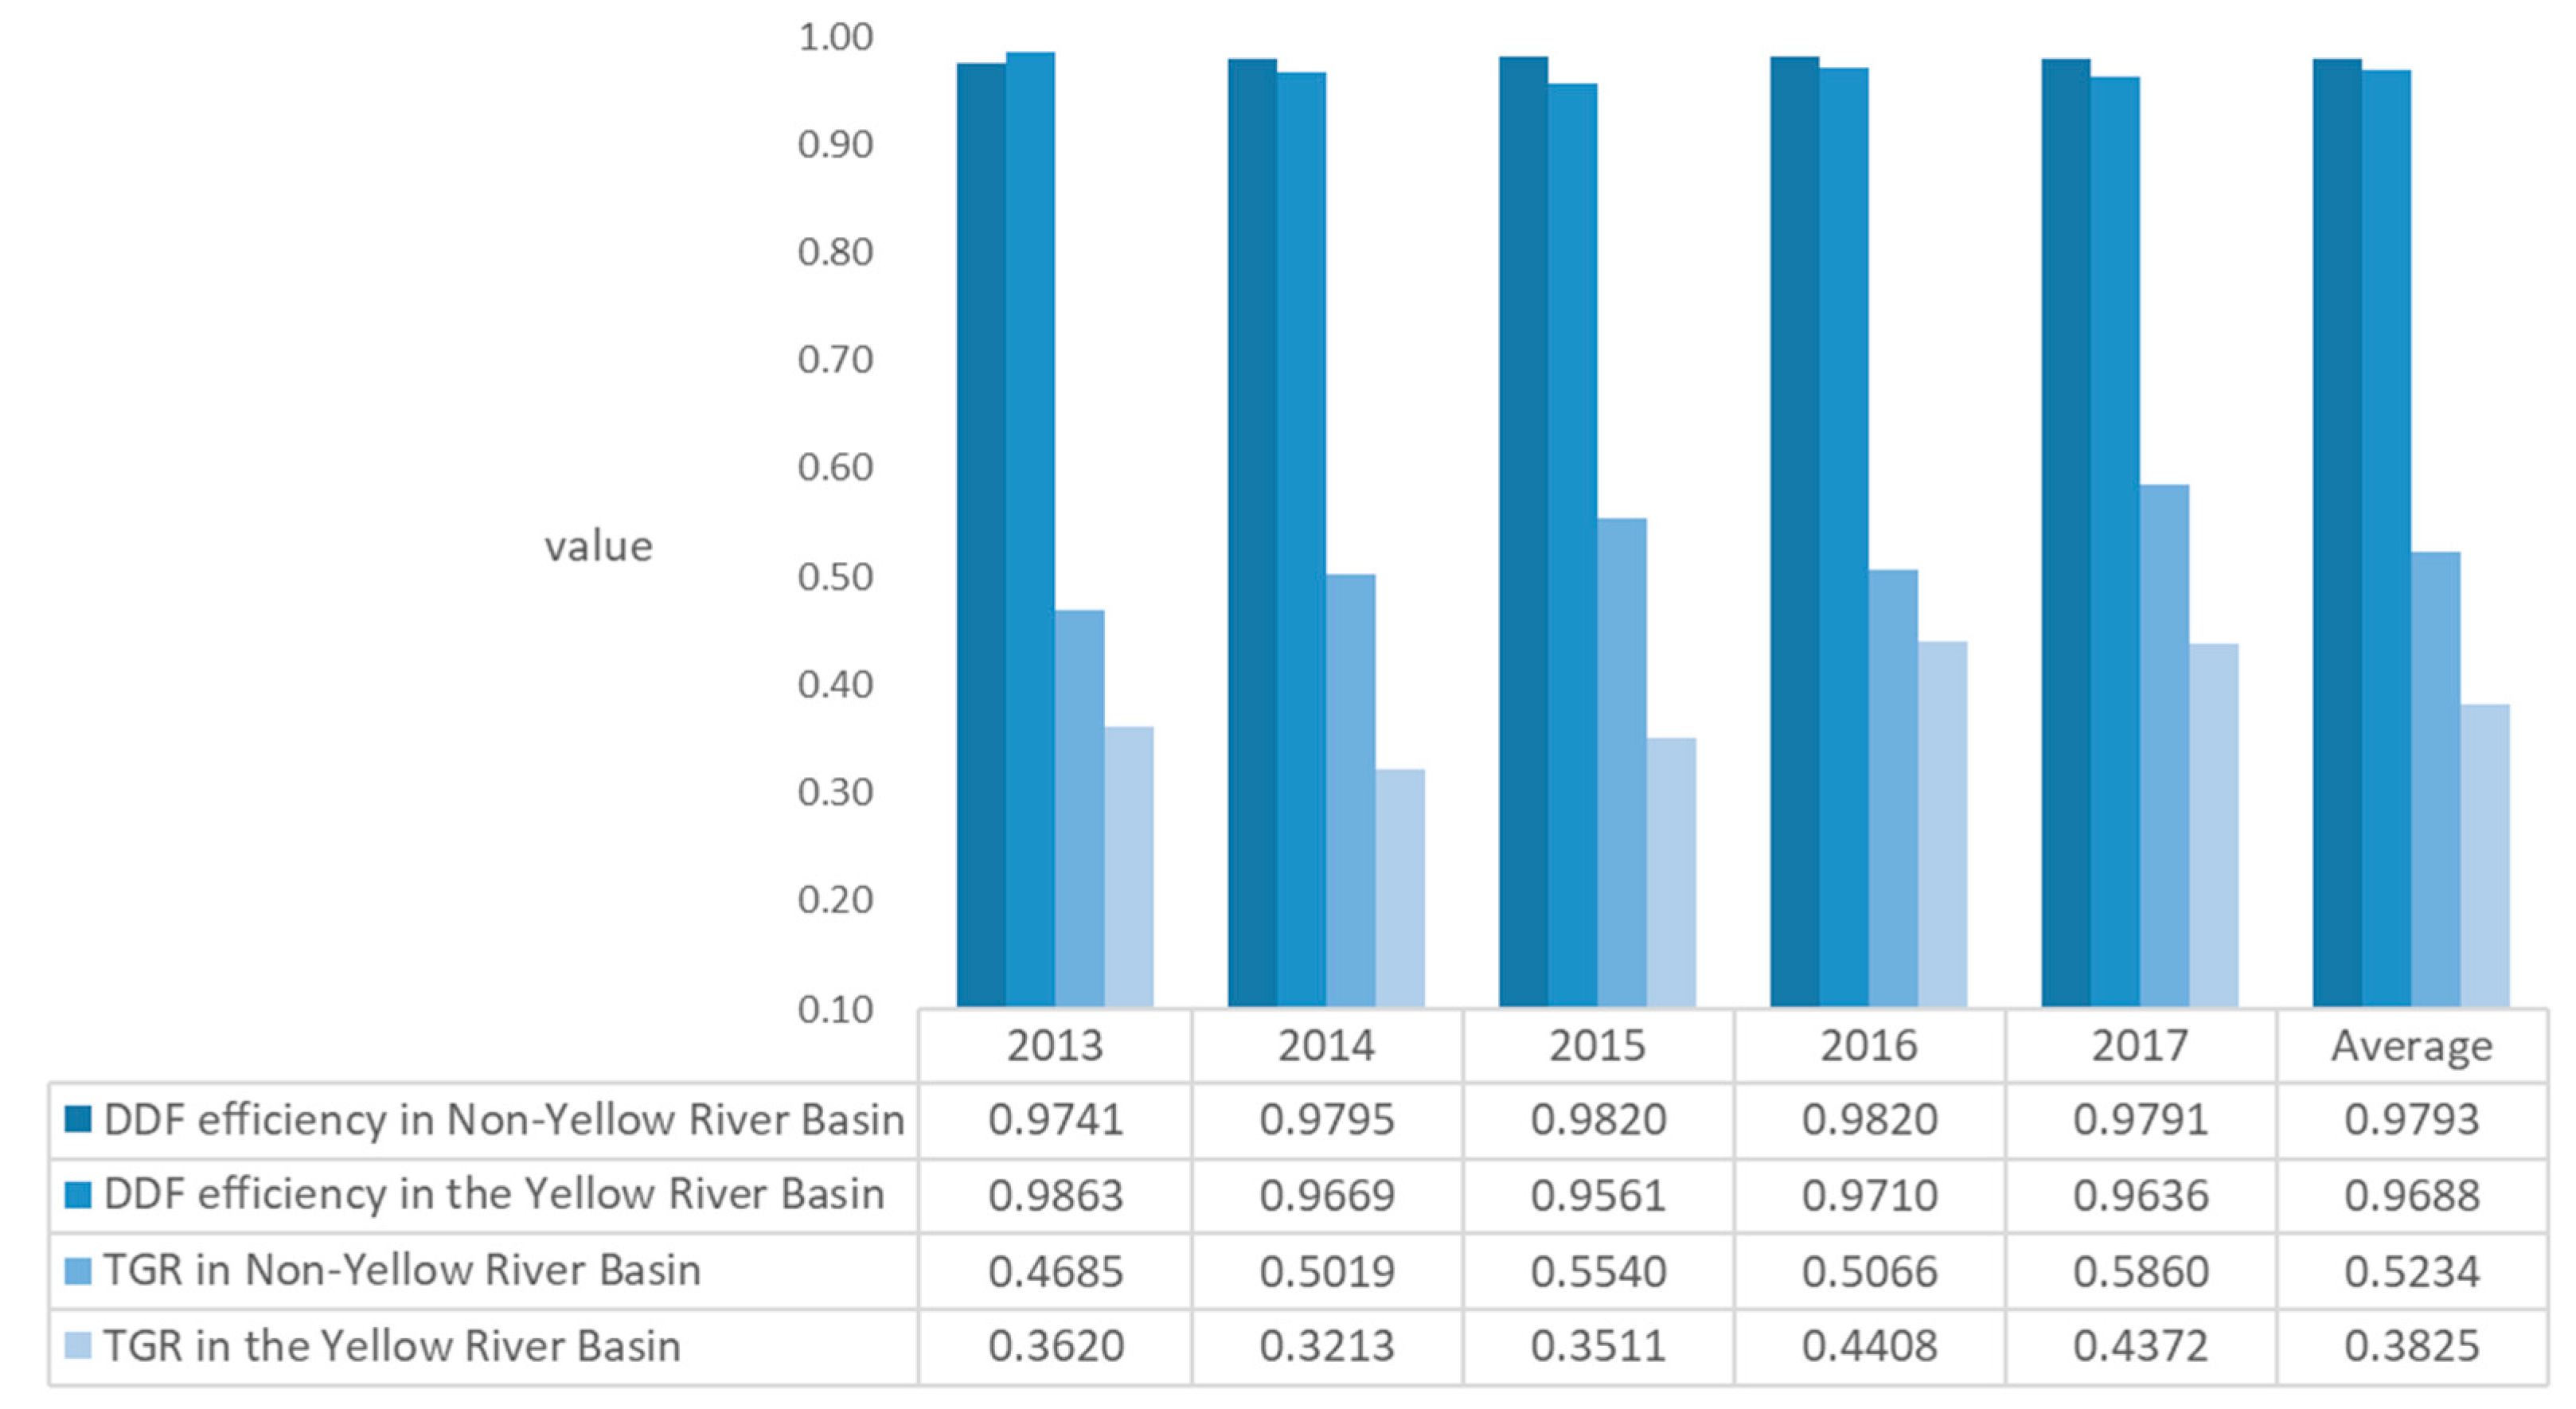
- Industrial production efficiency of DDF in the Yellow River and Non-Yellow River Basins
- (2)
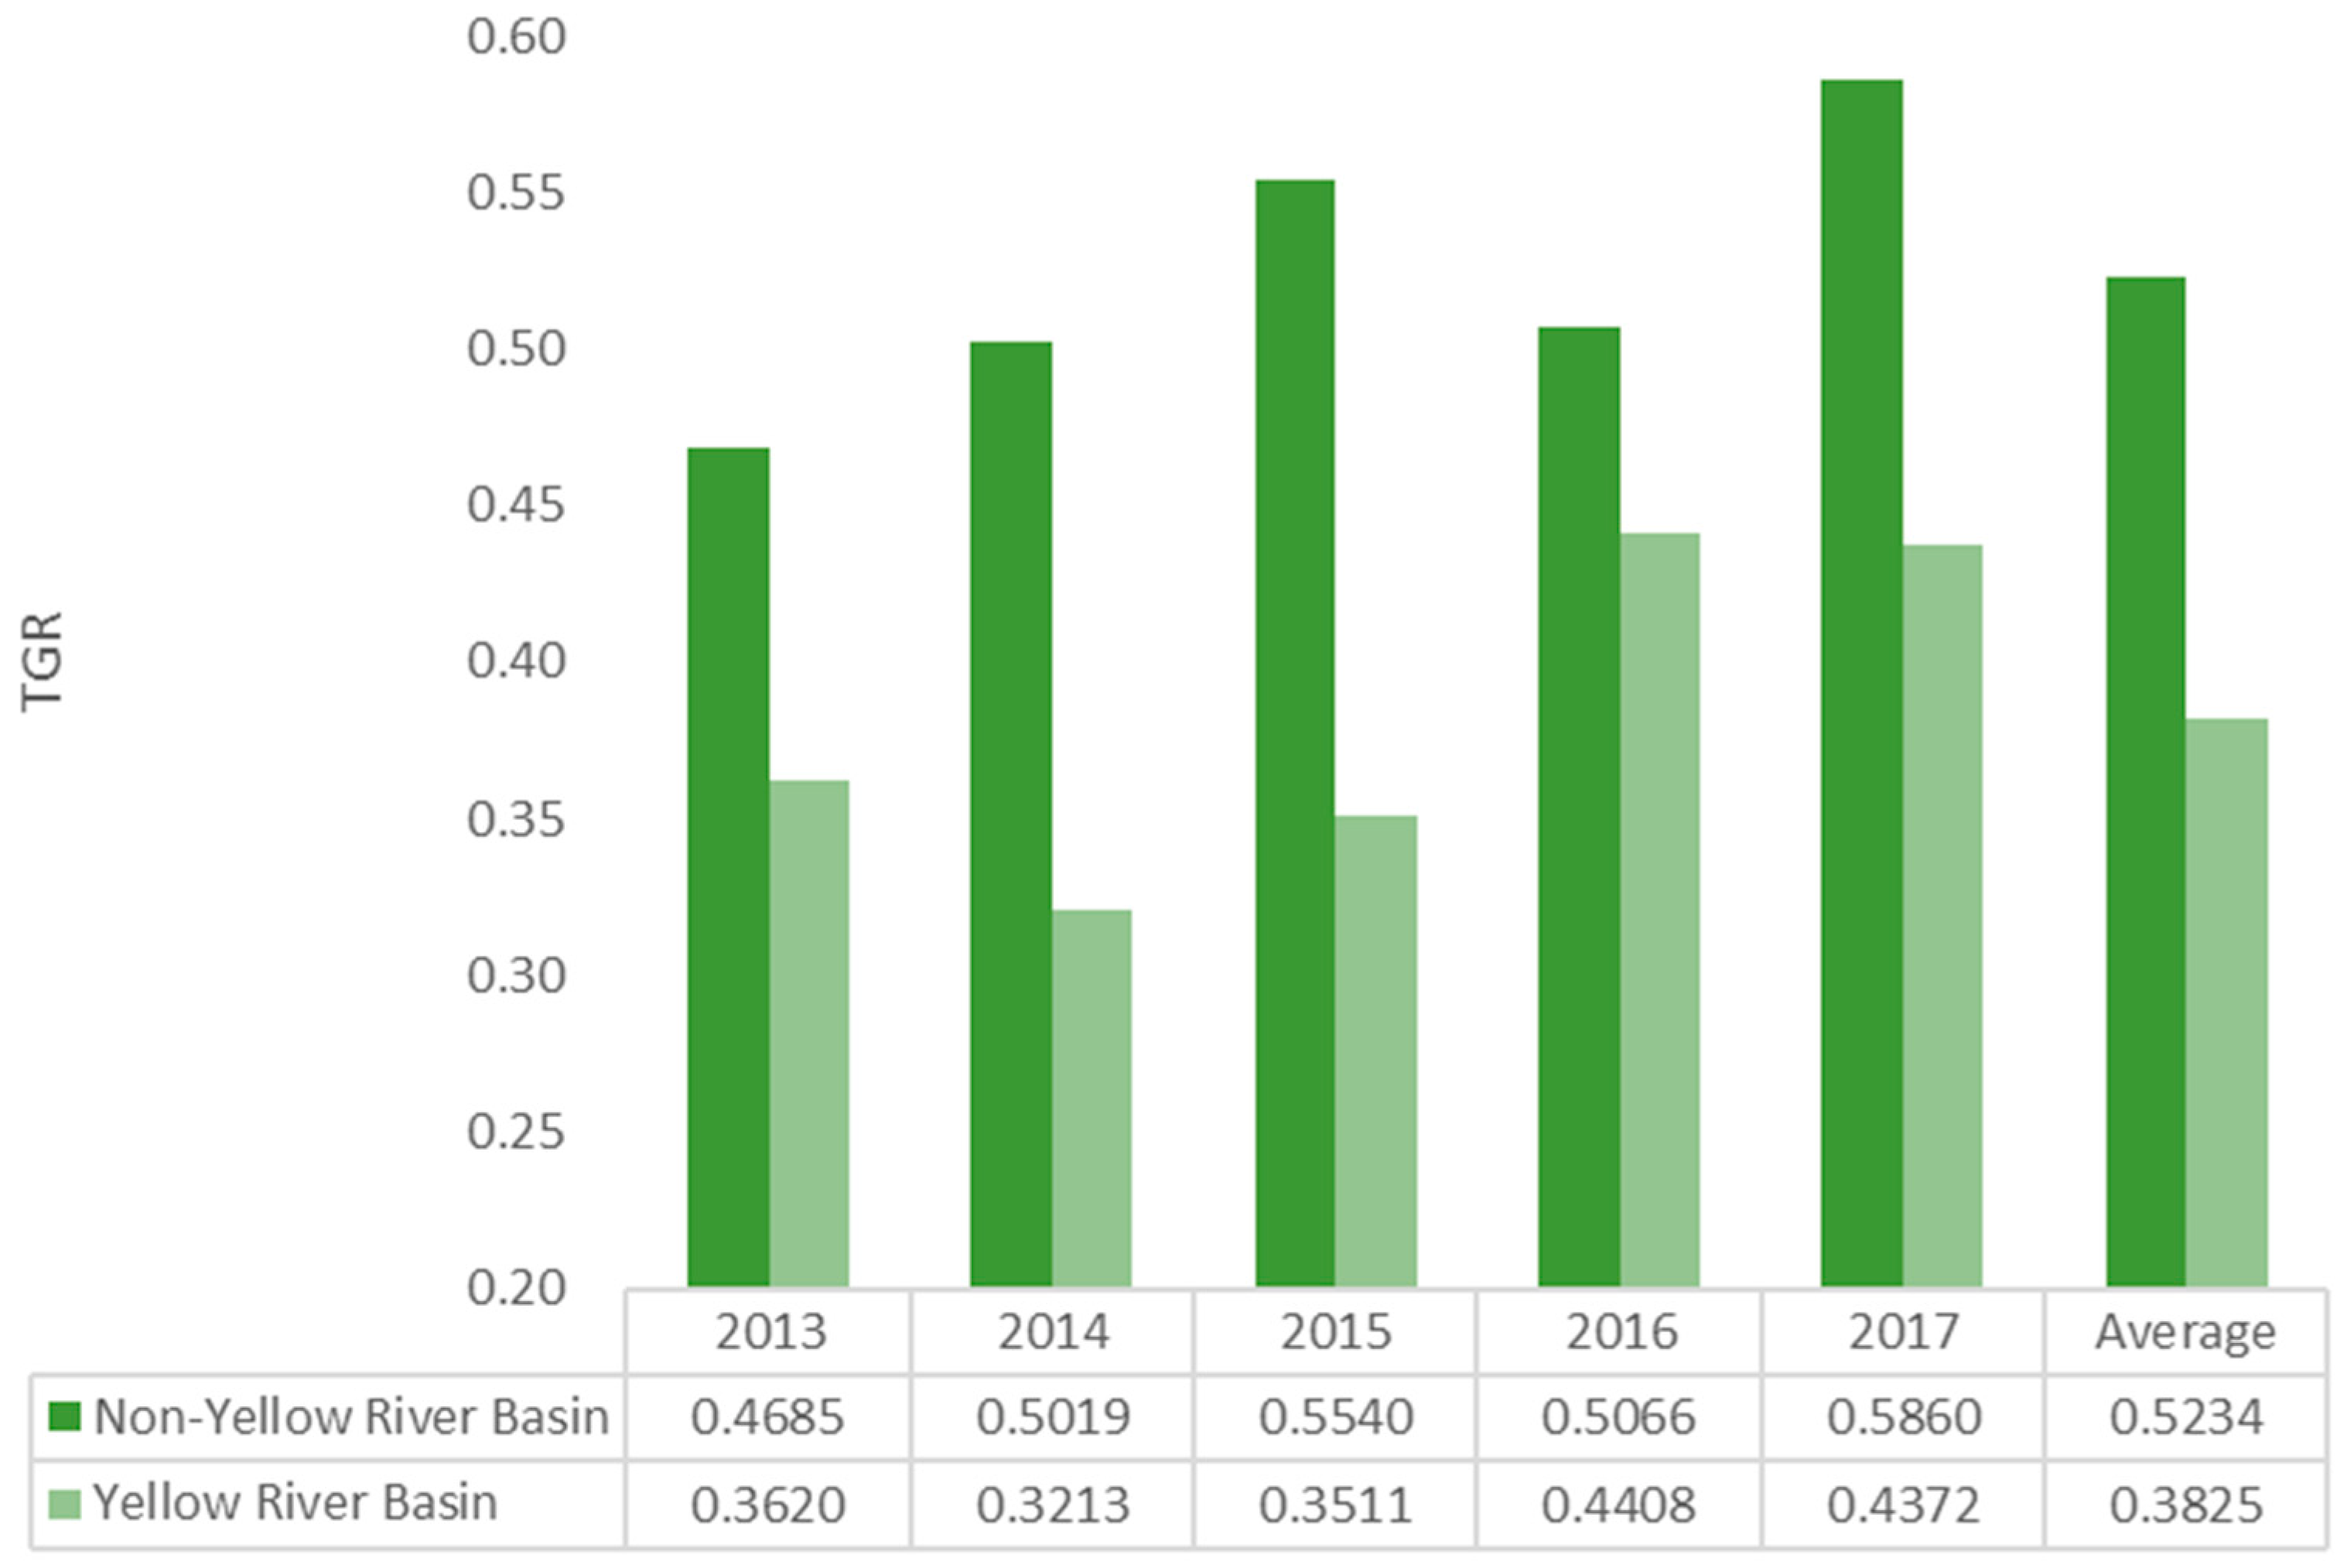
- Analysis of TGR technology gap ratio between the Yellow River and Non-Yellow River Basins
5. Conclusions and Suggestions
5.1. Conclusions
- (1)
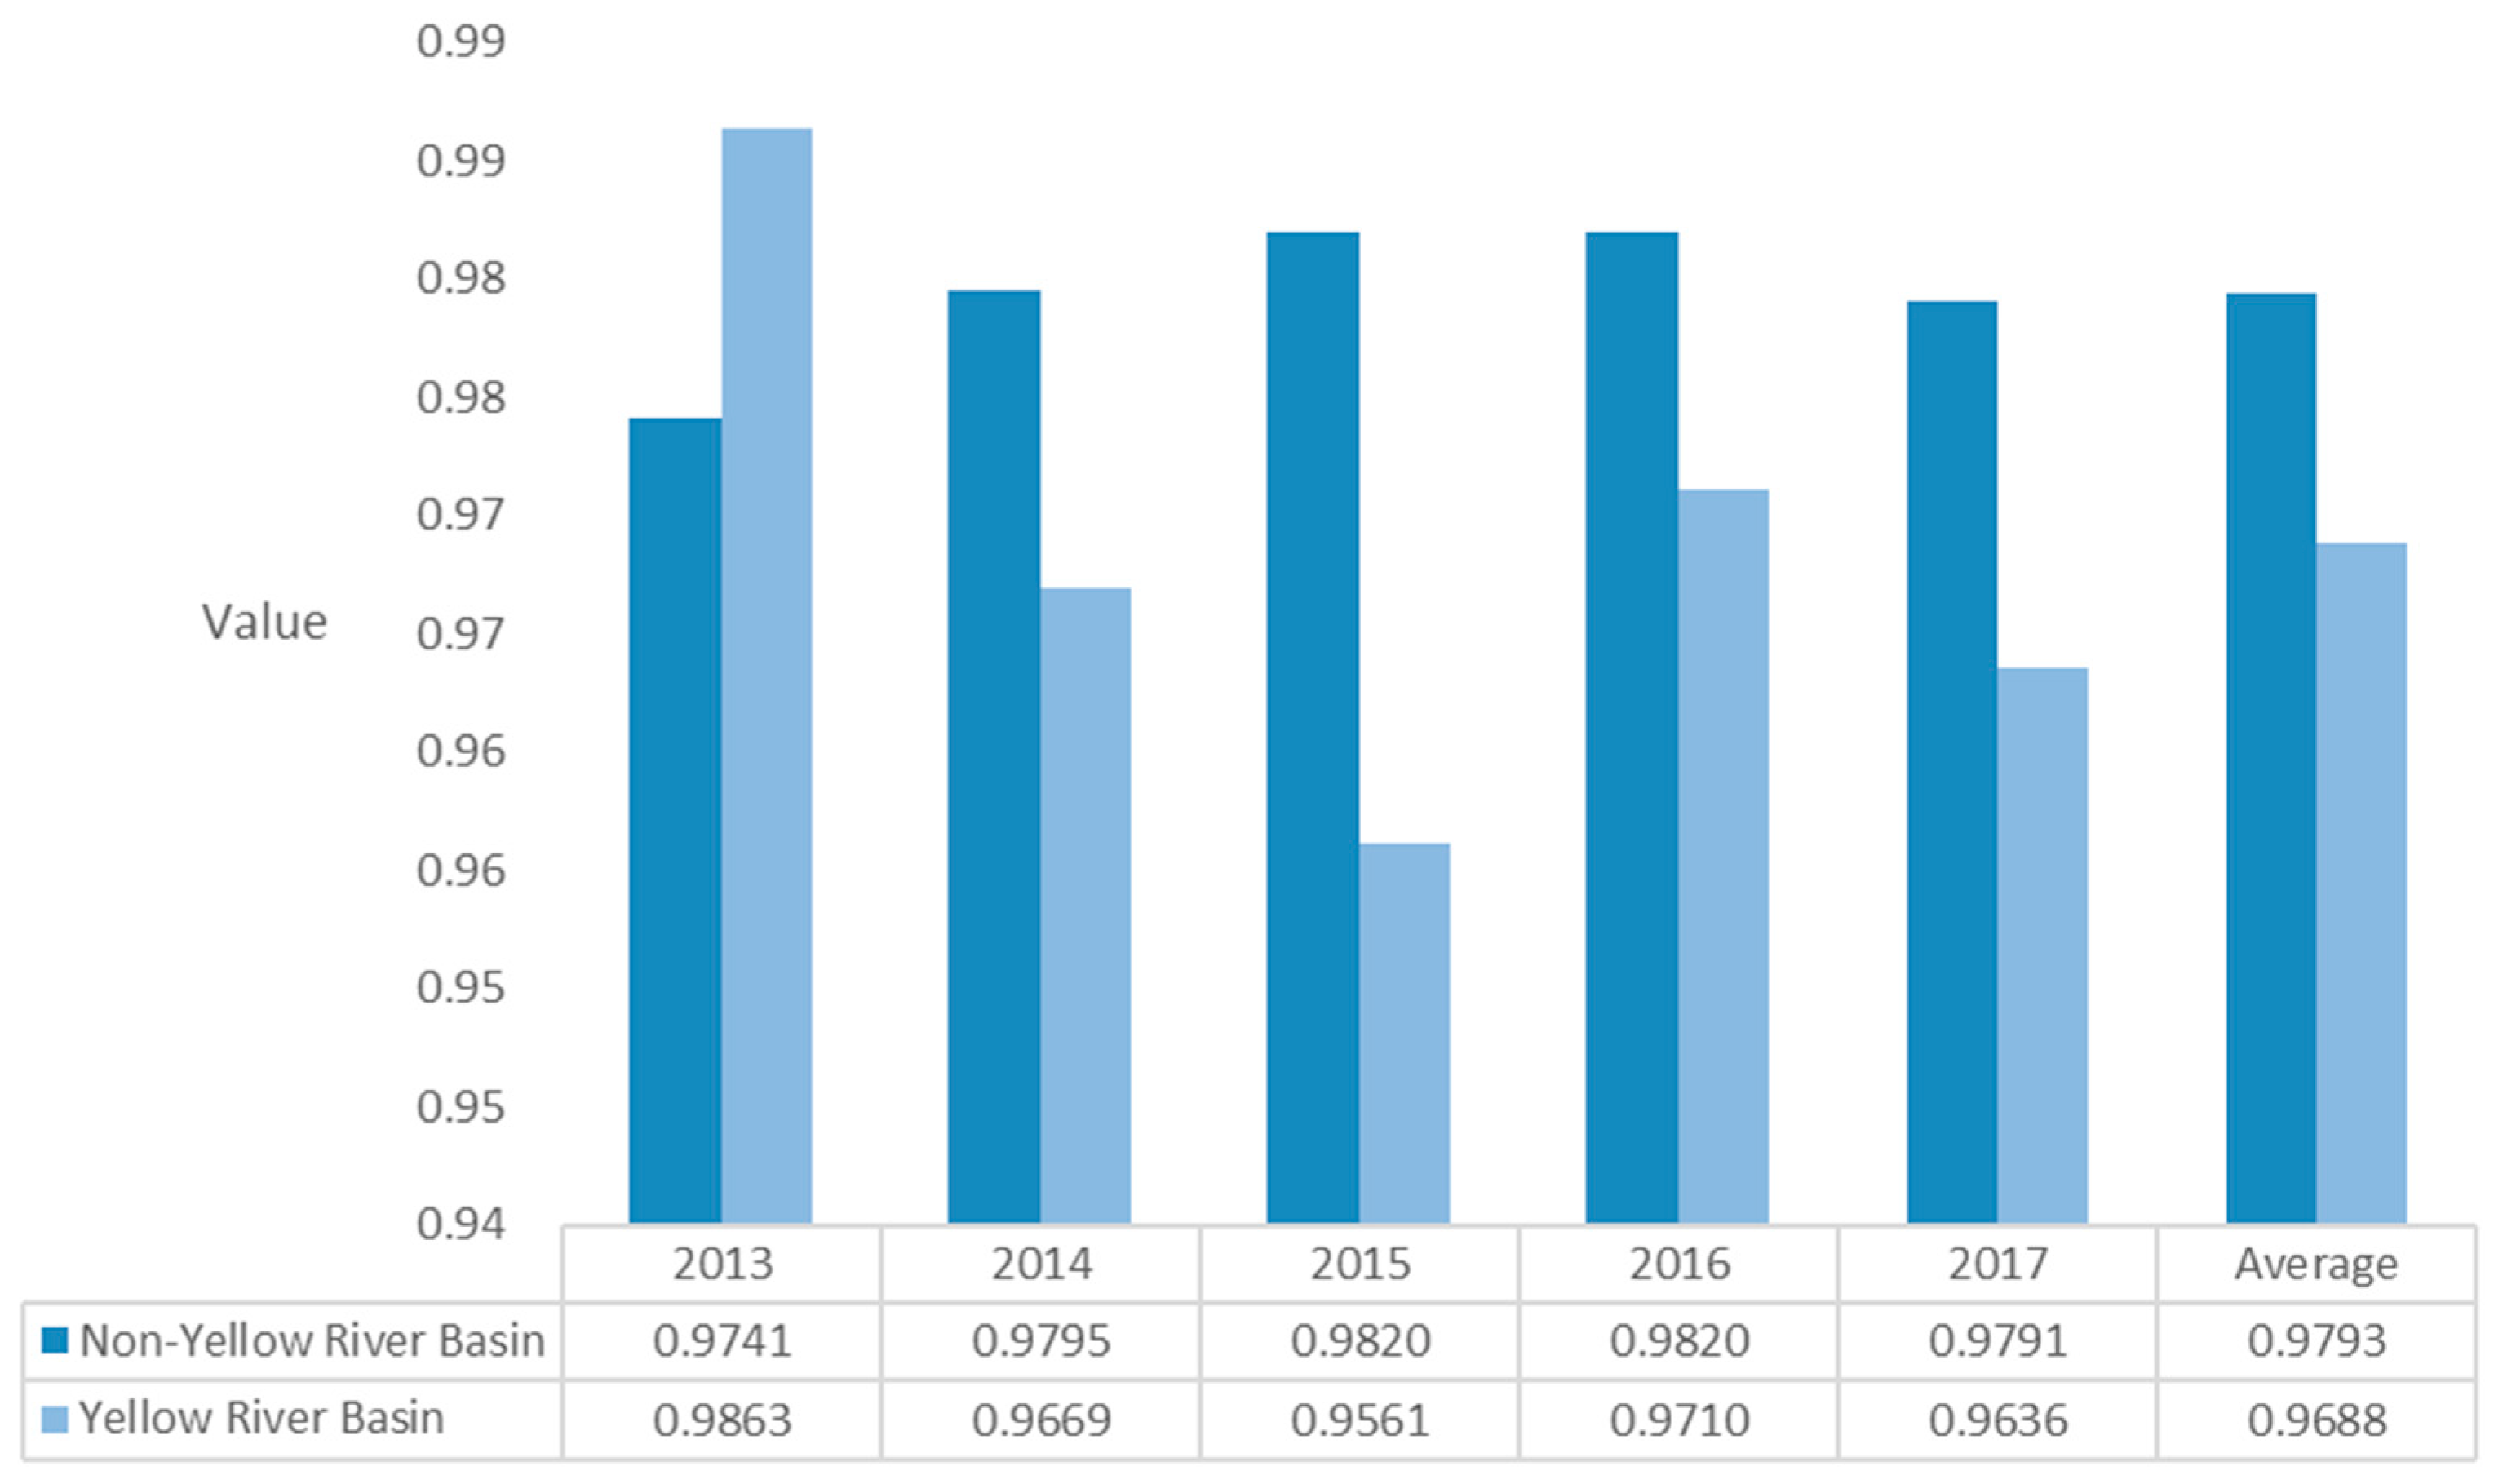
- During the study period, the total efficiency of the Non-Yellow River Basin was 0.9793, slightly better than that of the Yellow River Basin of 0.9688. Among the 17 provinces and cities with a total efficiency of 1, only Shandong and Sichuan were located in the Yellow River Basin, and the other 15 provinces and cities were located in the Non-Yellow River Basin, indicating that the industrial production efficiency still had significant regional differences due to the input of production factors and pollution control funds.
- (2)
- During the study period, the TGR values of 31 provinces and municipalities in the Yellow River Basin and Non-Yellow River Basin were less than 1, while the average TGR value of the Yellow River Basin was 0.3825, which was lower than the average TGR value of Non-Yellow River Basin by 0.5234, indicating that the technical level did not reach the technical level on the common boundary, and there is still room for substantial improvement. In order to achieve the sustainable development goals of SDG-6 and SDG-9, in addition to the cost of pollution prevention and control, clean energy should be developed to reduce pollution, and rational allocation of resources should be used to improve industrial production technology and overall efficiency.
- (3)
- The main contribution of this study is in introducing the method of parallel DEA; in addition to many input variables in the industrial production sector, we also discuss the impact of the financial input of the pollution control department on wastewater, exhaust emissions and total efficiency. In addition, this study covers the research scope of the Yellow River Basin and the Non-Yellow River Basin, which helps to provide broader policy recommendations.
5.2. Research Recommendations
Author Contributions
Funding
Institutional Review Board Statement
Informed Consent Statement
Data Availability Statement
Conflicts of Interest
Appendix A

| DMU | 2013 | 2014 | 2015 | 2016 | 2017 | Average | |
|---|---|---|---|---|---|---|---|
| Non-Yellow River Basin | Beijing | 1 | 1 | 1 | 1 | 1 | 1 |
| Tianjin | 1 | 1 | 1 | 1 | 1 | 1 | |
| Hebei | 1 | 1 | 1 | 1 | 1 | 1 | |
| Liaoning | 1 | 1 | 1 | 1 | 1 | 1 | |
| Jilin | 1 | 1 | 1 | 1 | 1 | 1 | |
| Black Dragon River | 1 | 1 | 0.9822 | 1 | 0.9153 | 0.9795 | |
| Shanghai | 1 | 1 | 1 | 1 | 1 | 1 | |
| Jiangsu | 1 | 1 | 1 | 1 | 1 | 1 | |
| Zhejiang | 1 | 1 | 1 | 1 | 1 | 1 | |
| Anhui | 1 | 1 | 1 | 1 | 1 | 1 | |
| Fujian | 0.9452 | 0.9623 | 0.9628 | 0.9739 | 1 | 0.9688 | |
| Jiangxi | 1 | 1 | 1 | 1 | 1 | 1 | |
| Hubei | 0.9752 | 1 | 1 | 1 | 1 | 0.9950 | |
| Hunan | 1 | 1 | 1 | 1 | 1 | 1 | |
| Guangdong | 1 | 1 | 1 | 1 | 1 | 1 | |
| Guangxi | 0.9851 | 0.9599 | 0.9883 | 1 | 0.9535 | 0.9774 | |
| Hainan | 1 | 1 | 1 | 1 | 1 | 1 | |
| Chongqing | 1 | 1 | 1 | 1 | 1 | 1 | |
| Guizhou | 0.8202 | 0.8524 | 0.956 | 1 | 1 | 0.9257 | |
| Yunnan | 0.7197 | 0.7832 | 0.8194 | 0.8017 | 0.7779 | 0.7804 | |
| Tibet | 1 | 1 | 1 | 1 | 1 | 1 | |
| Xinjiang | 0.9856 | 0.9906 | 0.8959 | 0.829 | 0.8928 | 0.9188 | |
| Average | 0.9741 | 0.9795 | 0.9820 | 0.9820 | 0.9791 | 0.9793 | |
| DMU | 2013 | 2014 | 2015 | 2016 | 2017 | Average | |
| Yellow River Basin | Shanxi | 0.9803 | 0.9184 | 0.8889 | 0.9211 | 1 | 0.9417 |
| Inner Mongolia | 1 | 1 | 1 | 1 | 0.9912 | 0.9982 | |
| Shandong | 1 | 1 | 1 | 1 | 1 | 1 | |
| Henan | 1 | 0.9553 | 0.9696 | 1 | 1 | 0.9850 | |
| Sichuan | 1 | 1 | 1 | 1 | 1 | 1 | |
| Shaanxi | 1 | 1 | 0.9871 | 1 | 1 | 0.9974 | |
| Gansu | 0.9196 | 0.9101 | 0.7593 | 0.8367 | 0.8763 | 0.8604 | |
| Qinghai | 1 | 1 | 1 | 0.9816 | 0.9041 | 0.9771 | |
| Ningxia | 0.9771 | 0.9183 | 1 | 1 | 0.9005 | 0.9592 | |
| Average | 0.9863 | 0.9669 | 0.9561 | 0.9710 | 0.9636 | 0.9688 |
Appendix B
| DMU | 2013 | 2014 | 2015 | 2016 | 2017 | Average | |
|---|---|---|---|---|---|---|---|
| Non-Yellow River Basin | Tibet | 0.9999 | 0.9905 | 0.9475 | 0.9999 | 1.0000 | 0.9876 |
| Hainan | 0.8629 | 1.0000 | 1.0000 | 0.6278 | 0.9917 | 0.8965 | |
| Liaoning | 0.7303 | 0.9488 | 0.9319 | 0.8129 | 0.9134 | 0.8675 | |
| Black Dragon River | 1.0000 | 0.8539 | 0.7762 | 0.8059 | 0.9007 | 0.8673 | |
| Beijing | 0.3992 | 0.8811 | 1.0000 | 0.9602 | 1.0000 | 0.8481 | |
| Tianjin | 0.8239 | 0.8445 | 0.8448 | 0.6499 | 0.9749 | 0.8276 | |
| Chongqing | 0.7837 | 0.6317 | 0.8055 | 0.7210 | 1.0000 | 0.7884 | |
| Shanghai | 0.6246 | 0.8022 | 0.6441 | 0.5595 | 1.0000 | 0.7261 | |
| Hebei | 0.5811 | 0.6070 | 0.5647 | 0.5945 | 0.6271 | 0.5949 | |
| Jilin | 0.6069 | 0.6110 | 0.5334 | 0.4927 | 0.7060 | 0.5900 | |
| Jiangsu | 0.4275 | 0.4250 | 0.4565 | 0.6617 | 0.8183 | 0.5578 | |
| Zhejiang | 0.5043 | 0.5831 | 0.4352 | 0.5733 | 0.5748 | 0.5341 | |
| Guizhou | 0.2885 | 0.2245 | 0.6365 | 0.8179 | 0.3949 | 0.4725 | |
| Xinjiang | 0.4264 | 0.4511 | 0.4149 | 0.2540 | 0.2649 | 0.3623 | |
| Yunnan | 0.1555 | 0.1228 | 1.2204 | 0.1098 | 0.1180 | 0.3453 | |
| Guangdong | 0.2396 | 0.2759 | 0.2457 | 0.2527 | 0.3327 | 0.2693 | |
| Fujian | 0.1190 | 0.1098 | 0.1074 | 0.5034 | 0.2717 | 0.2223 | |
| Anhui | 0.1420 | 0.1688 | 0.1492 | 0.2067 | 0.3441 | 0.2022 | |
| Jiangxi | 0.2279 | 0.1759 | 0.1545 | 0.1403 | 0.1336 | 0.1664 | |
| Hubei | 0.1083 | 0.1171 | 0.1063 | 0.1685 | 0.2065 | 0.1413 | |
| Guangxi | 0.1500 | 0.1202 | 0.1116 | 0.1289 | 0.1498 | 0.1321 | |
| Hunan | 0.1053 | 0.0971 | 0.1026 | 0.1043 | 0.1685 | 0.1156 | |
| Average | 0.4685 | 0.5019 | 0.5540 | 0.5066 | 0.5860 | 0.5234 | |
| DMU | 2013 | 2014 | 2015 | 2016 | 2017 | Average | |
| Yellow River Basin | Ningxia | 0.7257 | 0.5888 | 0.9243 | 1.0000 | 0.5335 | 0.7545 |
| Qinghai | 0.5908 | 0.5105 | 0.6123 | 0.5184 | 0.6219 | 0.5708 | |
| Shandong | 0.4784 | 0.5117 | 0.5014 | 0.7260 | 0.4879 | 0.5411 | |
| Shanxi | 0.5274 | 0.3898 | 0.2413 | 0.6932 | 0.8063 | 0.5316 | |
| Gansu | 0.2921 | 0.2695 | 0.2941 | 0.2438 | 0.2970 | 0.2793 | |
| Henan | 0.1332 | 0.1277 | 0.2076 | 0.2589 | 0.6282 | 0.2711 | |
| Sichuan | 0.2343 | 0.2222 | 0.1036 | 0.2253 | 0.1971 | 0.1965 | |
| Shaanxi | 0.1672 | 0.1651 | 0.1600 | 0.1811 | 0.2375 | 0.1822 | |
| Inner Mongolia | 0.1090 | 0.1059 | 0.1154 | 0.1205 | 0.1254 | 0.1152 | |
| Average | 0.3620 | 0.3213 | 0.3511 | 0.4408 | 0.4372 | 0.3825 |
References
- Mahmoud AE, D.; Hosny, M.; El-Maghrabi, N.; Fawzy, M. Facile synthesis of reduced graphene oxide by Tecoma stans extracts for efficient removal of Ni (II) from water: Batch experiments and response surface methodology. Sustain. Environ. Res. 2022, 32, 22. [Google Scholar] [CrossRef]
- Chen, S.; Oliva, P.; Zhang, P. The effect of air pollution on migration: Evidence from China. J. Dev. Econ. 2022, 156, 102833. [Google Scholar] [CrossRef]
- Mahmoud AE, D.; Umachandran, K.; Sawicka, B.; Mtewa, T.K. Water resources security and management for sustainable communities. In Phytochemistry, the Military and Health; Elsevier: Amsterdam, The Netherlands, 2021; pp. 509–522. [Google Scholar]
- Hu, H.; Jin, Q.; Kavan, P. A study of heavy metal pollution in China: Current status, pollution-control policies and countermeasures. Sustainability 2014, 6, 5820–5838. [Google Scholar] [CrossRef] [Green Version]
- Lin, H.; Chen, H.; Zhang, L.; Luo, Y.; Shi, Y.; Zou, W. Energy consumption, air pollution, and public health in China: Based on the Two-Stage Dynamic Undesirable DEA model. AirQual. Atmos. Health 2021, 14, 1349–1364. [Google Scholar] [CrossRef]
- Miao, C.-L.; Meng, X.-N.; Duan, M.-M.; Wu, X.-Y. Energy consumption, environmental pollution, and technological innovation efficiency: Taking industrial enterprises in China as empirical analysis object. Environ. Sci. Pollut. Res. 2020, 27, 34147–34157. [Google Scholar] [CrossRef]
- Kynčlová, P.; Upadhyaya, S.; Nice, T. Composite index as a measure on achieving Sustainable Development Goal 9 (SDG-9) industry-related targets: The SDG-9 index. Appl. Energy 2020, 265, 114755. [Google Scholar] [CrossRef]
- Zaim, O. Measuring environmental performance of state manufacturing through changes in pollution intensities: A DEA framework. Ecol. Econ. 2004, 48, 37–47. [Google Scholar] [CrossRef] [Green Version]
- Wu, J.; Lv, L.; Sun, J.; Ji, X. A comprehensive analysis of China’s regional energy saving and emission reduction efficiency: From production and treatment perspectives. Energy Policy 2015, 84, 166–176. [Google Scholar] [CrossRef]
- Valadkhani, A.; Roshdi, I.; Smyth, R. A multiplicative environmental DEA approach to measure efficiency changes in the world’s major polluters. Energy Econ. 2016, 54, 363–375. [Google Scholar] [CrossRef]
- Geng, Z.; Dong, J.; Han, Y.; Zhu, Q. Energy and environment efficiency analysis based on an improved environment DEA cross-model: Case study of complex chemical processes. Appl. Energy 2017, 205, 465–476. [Google Scholar] [CrossRef]
- Sueyoshi, T.; Yuan, Y.; Goto, M. A literature study for DEA applied to energy and environment. Energy Econ. 2017, 62, 104–124. [Google Scholar] [CrossRef]
- Halkos, G.E.; Polemis, M.L. The impact of economic growth on environmental efficiency of the electricity sector: A hybrid window DEA methodology for the USA. J. Environ. Manag. 2018, 211, 334–346. [Google Scholar] [CrossRef] [PubMed]
- Fehri, R.; Khlifi, S.; Vanclooster, M. Disaggregating SDG-6 water stress indicator at different spatial and temporal scales in Tunisia. Sci. Total Environ. 2019, 694, 133766. [Google Scholar] [CrossRef] [PubMed]
- Hu, Z.; Yan, S.; Yao, L.; Moudi, M. Efficiency evaluation with feedback for regional water use and wastewater treatment. J. Hydrol. 2018, 562, 703–711. [Google Scholar] [CrossRef]
- Song, M.; Wang, R.; Zeng, X. Water resources utilization efficiency and influence factors under environmental restrictions. J. Clean. Prod. 2018, 184, 611–621. [Google Scholar] [CrossRef]
- Yang, L.; Zhang, X. Assessing regional eco-efficiency from the perspective of resource, environmental and economic performance in China: A bootstrapping approach in global data envelopment analysis. J. Clean. Prod. 2018, 173, 100–111. [Google Scholar] [CrossRef]
- Li, J.; See, K.F.; Jin, C. Water resources and water pollution emissions in China’s industrial sector: A green-biased technological progress analysis. J. Clean. Prod. 2019, 229, 1412–1426. [Google Scholar] [CrossRef]
- Zhou, Z.; Wu, H.; Song, P. Measuring the resource and environmental efficiency of industrial water consumption in China: A non-radial directional distance function. J. Clean. Prod. 2019, 240, 118169. [Google Scholar] [CrossRef]
- Chen, Y.; Yin, G.; Liu, K. Regional differences in the industrial water use efficiency of China: The spatial spillover effect and relevant factors. Resour. Conserv. Recycl. 2021, 167, 105239. [Google Scholar] [CrossRef]
- Wang, K.-L.; Miao, Z.; Zhao, M.-S.; Miao, C.-L.; Wang, Q.-W. China’s provincial total-factor air pollution emission efficiency evaluation, dynamic evolution and influencing factors. Ecol. Indic. 2019, 107, 105578. [Google Scholar] [CrossRef]
- Wang, H.; Wang, M. Effects of technological innovation on energy efficiency in China: Evidence from dynamic panel of 284 cities. Sci. Total Environ. 2020, 709, 136172. [Google Scholar] [CrossRef] [PubMed]
- Chen, L.; He, F.; Zhang, Q.; Jiang, W.; Wang, J. Two-stage efficiency evaluation of production and pollution control in Chinese iron and steel enterprises. J. Clean. Prod. 2017, 165, 611–620. [Google Scholar] [CrossRef]
- Zhang, H.; Wang, S.; Hao, J.; Wang, X.; Wang, S.; Chai, F.; Li, M. Air pollution and control action in Beijing. J. Clean. Prod. 2016, 112, 1519–1527. [Google Scholar] [CrossRef]
- Sarkodie, S.A.; Strezov, V. Effect of foreign direct investments, economic development and energy consumption on greenhouse gas emissions in developing countries. Sci. Total Environ. 2019, 646, 862–871. [Google Scholar] [CrossRef] [PubMed]
- Farrell, M.J. The Measurement of Productive Efficiency. J. R. Stat. Soc. 1957, 120, 253–290. [Google Scholar] [CrossRef]
- Charnes, A.; Cooper, W.W.; Rhodes, E. Measuring the efficiency of decision making units. Eur. J. Oper. Res. 1978, 2, 429–444. [Google Scholar] [CrossRef]
- Banker, R.D.; Charnes, A.; Cooper, W.W. Some Models for Estimating Technical and Scale Inefficiencies in Data. Envelopment Analysis. Manag. Sci. 1984, 30, 1078–1092. [Google Scholar] [CrossRef] [Green Version]
- Chambers, R.G.; Chung, Y.; Fare, R. Benefit and distance functions. J. Econ. Theory 1996, 70, 407–419. [Google Scholar] [CrossRef]
- Ray, S.C. The directional distance function and measurement of super-efficiency: An application to airlines data. J. Oper. Res. Soc. 2008, 59, 788–797. [Google Scholar] [CrossRef]
- Färe, R.; Grosskopf, S. Directional distance functions and slacks-based measures of efficiency. Eur. J. Oper. Res. 2010, 200, 320–322. [Google Scholar] [CrossRef]
- Tone, K. A slacks-based measure of efficiency in data envelopment analysis. Eur. J. Oper. Res. 2001, 130, 498–509. [Google Scholar] [CrossRef] [Green Version]
| Labor Force | Total Capital Formation | Energy Consumption | Total Industrial Water Consumption | Wastewater Treatment Funds | Waste Gas Treatment Funds | ||
|---|---|---|---|---|---|---|---|
| Average | 2013 | 148.6032 | 11,812.7645 | 1723.3352 | 459,258.0645 | 45,272.5484 | 83,133.5484 |
| 2014 | 182.6548 | 12,682.8452 | 1794.7323 | 453,709.6774 | 40,284.6129 | 206,745.4194 | |
| 2015 | 182.1581 | 13,043.6935 | 1836.5487 | 437,548.3871 | 37,176.5806 | 254,643.0645 | |
| 2016 | 176.2806 | 13,773.8355 | 1927.3248 | 430,580.6452 | 38,198.0645 | 168,325 | |
| 2017 | 170.4032 | 14,564.3548 | 2034.7742 | 421,935.4839 | 34,916 | 181,119.3871 | |
| Max | 2013 | 561 | 30,952.9 | 4956.62 | 1,931,000 | 263,797 | 303,865 |
| 2014 | 1052.4 | 33,780.8 | 5235.23 | 2,201,000 | 150,634 | 701,240 | |
| 2015 | 1046 | 35,587.4 | 5310.69 | 2,380,000 | 175,141 | 1,281,351 | |
| 2016 | 1011.7 | 34,647.1 | 5610.13 | 2,390,000 | 164,863 | 781,673 | |
| 2017 | 991 | 39,657.5 | 5959 | 2,486,000 | 158,518 | 966,722 | |
| Min | 2013 | 1.5 | 899.1 | 30.65 | 17,000 | 922 | 174 |
| 2014 | 2.1 | 1052.1 | 33.98 | 17,000 | 572 | 466 | |
| 2015 | 2.1 | 1032 | 40.53 | 17,000 | 90 | 1453 | |
| 2016 | 2.3 | 1162.8 | 49.22 | 14,000 | 893 | 273 | |
| 2017 | 1.6 | 1376.1 | 58 | 16,000 | 15 | 47 | |
| St. Dev | 2013 | 134.3751 | 7620.3602 | 1242.815 | 440,588.3164 | 51,282.9423 | 73,775.0457 |
| 2014 | 209.0452 | 8142.8745 | 1289.1049 | 460,820.1524 | 38,242.0501 | 162,597.069 | |
| 2015 | 211.8303 | 8407.9079 | 1365.0845 | 475,238.4551 | 37,554.2495 | 260,514.5884 | |
| 2016 | 205.8528 | 8924.2812 | 1451.4981 | 479,438.3363 | 41,606.7403 | 159,393.1626 | |
| 2017 | 200.9428 | 9999.0218 | 1520.3991 | 490,473.7122 | 38,104.0369 | 197,602.603 | |
| Total Wastewater Discharge | Lead in WASTEWATER | SO2 | Smoke and Dust | Industrial Output Value | |||
| Average | 2013 | 224,336.5161 | 2455.2355 | 85.181 | 41.231 | 8629.4897 | |
| 2014 | 231,024.1613 | 2360.7935 | 63.6906 | 56.1532 | 8946.4632 | ||
| 2015 | 237,200.8387 | 2562.2484 | 59.9719 | 49.6135 | 8874.8148 | ||
| 2016 | 229,385.5806 | 1707.4355 | 35.5765 | 32.6023 | 9199.2548 | ||
| 2017 | 225,697.129 | 1237.0387 | 28.2394 | 25.6861 | 9731.27 | ||
| Max | 2013 | 862,471 | 24,318.6 | 663 | 131.33 | 27,426.26 | |
| 2014 | 905,082 | 21,609.3 | 159.02 | 179.77 | 29,144.15 | ||
| 2015 | 911,523 | 18,172.8 | 152.57 | 157.54 | 30,259.49 | ||
| 2016 | 938,261 | 14,564.8 | 113.45 | 125.68 | 32,650.89 | ||
| 2017 | 882,020 | 7656.9 | 73.91 | 80.37 | 35,291.83 | ||
| Min | 2013 | 5005 | 2.6 | 0.42 | 0.68 | 61.16 | |
| 2014 | 5450 | 2.5 | 0.42 | 1.39 | 66.16 | ||
| 2015 | 5883 | 3.6 | 0.54 | 1.71 | 69.88 | ||
| 2016 | 6143 | 5.1 | 0.54 | 1.65 | 86.44 | ||
| 2017 | 7176 | 3.7 | 0.35 | 0.66 | 102.16 | ||
| St. Dev | 2013 | 184,430.1127 | 4632.3228 | 114.938 | 30.1237 | 7120.6401 | |
| 2014 | 190,473.1071 | 4170.2846 | 39.6557 | 42.5921 | 7468.1265 | ||
| 2015 | 195,601.8016 | 4068.4679 | 37.3853 | 38.3135 | 7741.992 | ||
| 2016 | 194,225.7237 | 3159.2792 | 25.0893 | 26.6502 | 8400.5834 | ||
| 2017 | 185,112.1309 | 1898.2696 | 19.5832 | 18.5803 | 9102.946 |
Publisher’s Note: MDPI stays neutral with regard to jurisdictional claims in published maps and institutional affiliations. |
© 2022 by the authors. Licensee MDPI, Basel, Switzerland. This article is an open access article distributed under the terms and conditions of the Creative Commons Attribution (CC BY) license (https://creativecommons.org/licenses/by/4.0/).
Share and Cite
Feng, Y.; Yang, C.-Y.; Lu, C.-C.; Tang, P.-Y. Measuring Pollution Control and Environmental Sustainable Development in China Based on Parallel DEA Method. Energies 2022, 15, 5697. https://doi.org/10.3390/en15155697
Feng Y, Yang C-Y, Lu C-C, Tang P-Y. Measuring Pollution Control and Environmental Sustainable Development in China Based on Parallel DEA Method. Energies. 2022; 15(15):5697. https://doi.org/10.3390/en15155697
Chicago/Turabian StyleFeng, Ying, Chih-Yu Yang, Ching-Cheng Lu, and Pao-Yu Tang. 2022. "Measuring Pollution Control and Environmental Sustainable Development in China Based on Parallel DEA Method" Energies 15, no. 15: 5697. https://doi.org/10.3390/en15155697
APA StyleFeng, Y., Yang, C.-Y., Lu, C.-C., & Tang, P.-Y. (2022). Measuring Pollution Control and Environmental Sustainable Development in China Based on Parallel DEA Method. Energies, 15(15), 5697. https://doi.org/10.3390/en15155697