Article

Optimisation of Induced Steam Residual Moisture Content in a Clothing Conditioner Based on a Genetic Algorithm

1
School of Mechanical Engineering and IEDT, Kyungpook National University, Daegu 41566, Korea
2
School of Engineering, Cardiff University, Queen’s Buildings, The Parade, Cardiff CF24 3AA, Wales, UK
3
Abu Dhabi Maritime Academy, Abu Dhabi P.O. Box 54477, United Arab Emirates
*
Author to whom correspondence should be addressed.
Energies 2022, 15(15), 5696; https://doi.org/10.3390/en15155696
Submission received: 8 July 2022 / Revised: 29 July 2022 / Accepted: 3 August 2022 / Published: 5 August 2022

Abstract

:
This paper presents the modelling of heat and moisture transfer in a clothes-conditioning unit with the aim of improving the moisture content distribution to the clothes. A multicomponent, non-reacting, two-phase Eulerian–Eulerian model was utilised to solve the computational model. The clothes inside the conditioning unit were modeled as retangular towels (porous medium) of uniform thickness. Mass flow distribution of air and steam through the clothes was studied by systematically varying the steam nozzle angle (30° to 75°) and air inflow grill angle (45° to 105°). The simulation results were studied to identify the impact of design parameters on the mass flow distribution inside the clothes-conditioning unit. The mass flow of steam and the air–steam mixture were calculated through each towel in the forward and reverse direction. Response surface analysis was conducted to correlate the total mass flow rate and steam mass flow rate through each towel with the design variables. Moreover, a multiobjective genetic algorithm was employed to optimise the mass flow through the clothes and ascertain the optimal design configuration. The geometric configuration with a steam nozzle angle of 45° and air grill angle of 105° resulted in optimal steam and mixture distribution.

1. Introduction

Precipitation caused by mundane daily life activities and the presence of air pollutants [1,2] (generated by walking, smoking, cooking, or operating any equipment) can adversely affect clothes and damage human comfort. To eliminate this problem, the clothes need to be washed and maintained on a daily basis. The state-of-the-art clothes-conditioning unit (CCU) can sanitise and refresh clothes regularly, eliminating the cost of dry cleaning. It sanitises the clothes using hot air and high-temperature steam within the clothes-conditioning chamber, removes wrinkles, freshens up the garments, and reduces static cling. The CCU is equipped with air, lint, and odour filters to eliminate hazardous viruses (adenovirus, influenza, coronavirus, and herpesvirus, based on testing by the Korea University Lab [3]), bacteria, house mites, odours (sweat, tobacco, food, and dry cleaning), and harmful substances (perchloroethylene). Moreover, it uses low-temperature heat-pump drying to dry clothes and other apparel such as overalls and raincoats without causing shrinkage or heat damage.
Moisture management is governed by different factors such as the sorption of heat and moisture evaporation/condensation. The coupling of heat and moisture transfer in porous clothing materials makes it a complicated mechanism.
The literature review indicates that a large number of studies have been conducted on the general subject of heat and mass transfer in porous mediums, from the general formulation of the phenomenon to specific applications such as heat and moisture transport in soils and food products. Ogniewicz and Tien [4] first investigated heat and moisture transfer coupled with condensation/evaporation with the assumption of pendular-state condensate. Later, Motakef and El-Masri [5] and Shapiro and Motakef [6] extended the heat and moisture transfer model to incorporate mobile condensate. Bouddour et al. [7] analytically investigated the heat and mass transfer in wet porous media with evaporation/condensation utilizing the homogenisation method. Fan et al. [8] simulated heat and moisture transfer with sorption and condensation, incorporating the effect of radiative heat transfer and presented moisture content and liquid water content in porous clothing assemblies. Fan and Cheng [9] studied the heat and moisture transfer experimentally through porous fibrous battings enveloped within a thin covering of fabric. They reported that the temperature distribution occurred within 30 min of the experiments and it depended on the moisture absorption ability of the fibres. Furthermore, the water content gathering and distribution occurred due to the combination of moisture absorption, condensation, and movement. Later, in the second part of their study [10], they developed a theoretical model to incorporate moisture movement due to partial water vapour pressure, the saturation state in the condensing region, dynamic moisture absorption, and liquid condensate movement. They conducted a numerical simulation based on the theoretical model and proposed a clothing assembly for exercise in cold weather conditions. Li and Zhu [11] formulated a mathematical model of heat and moisture transfer with the consideration of gravity in porous textile material. Wu and Fan [12] solved the heat and moisture transfer model utilising the finite volume technique to investigate the thermal performance of clothing by varying fibrous battings. Xu et al. [13] numerically simulated dynamic heat and moisture transfer with condensation and studied temperature and moisture distribution in porous fabric. Aihua et al. [14] proposed a set of multiscale, nonlinear models to define coupled heat and moisture transport in a human body, fabrics, fibre material, and phase change material. In addition, they simulated the multiscale system using the finite volume method and validated the simulation results with the experimental results under the same clothing and wearing conditions. Su et al. [15] simulated heat and moisture transfer by considering the impinging jet flow between the steam nozzle and fabric, and incorporated skin heat transfer and Henriques’ burn integral models. They analysed the performance of the protective clothing by varying its thickness when exposed to hot steam. Moreover, they reported that the protective performance of the clothing significantly depended on the porosity of the fabric and initial moisture content. It is evident from the literature review that multiple researchers have worked on the modelling of the heat and moisture transport model by assuming certain assumptions. However, to the best of the authors’ knowledge, heat and moisture transport within an actual CCU has not been investigated in the literature.
Therefore, the motivation for the present research is to investigate multiphase flow physics and optimise the geometric parameters to achieve improved flow distribution within a commercial CCU. A multicomponent, non-reacting, two-phase Eulerian–Eulerian model is employed to simulate air and steam flow in the clothing chamber. A systematic study based on the geometric parameters, air grill angle, and steam nozzle angle is performed to determine the impact of the design parameters on the flow distribution inside the clothing chamber. Different geometric configurations based on the variation of air grill angle (45°–105°) and steam nozzle angle (30°–75°) are modelled. Clothes are modelled as towels to reduce the complexity of the computational domain. In order to quantify the flow distribution inside the clothing chamber, the mass flow rate of steam and the air–steam mixture penetrating through the clothes is studied for different geometric configurations. In addition, the response surface method is utilised to correlate the mass flow rate of the steam and mixture with the air grill angle and steam nozzle angle. A genetic algorithm is employed to estimate the optimal geometric configuration that results in the highest mass flow distribution in the clothes.
The next section explains the physical model of the CCU, followed by the computational model and the computational grid and boundary conditions. Subsequent sections include the design optimisation strategy, results, and lastly, the conclusion section.

2. Numerical Model

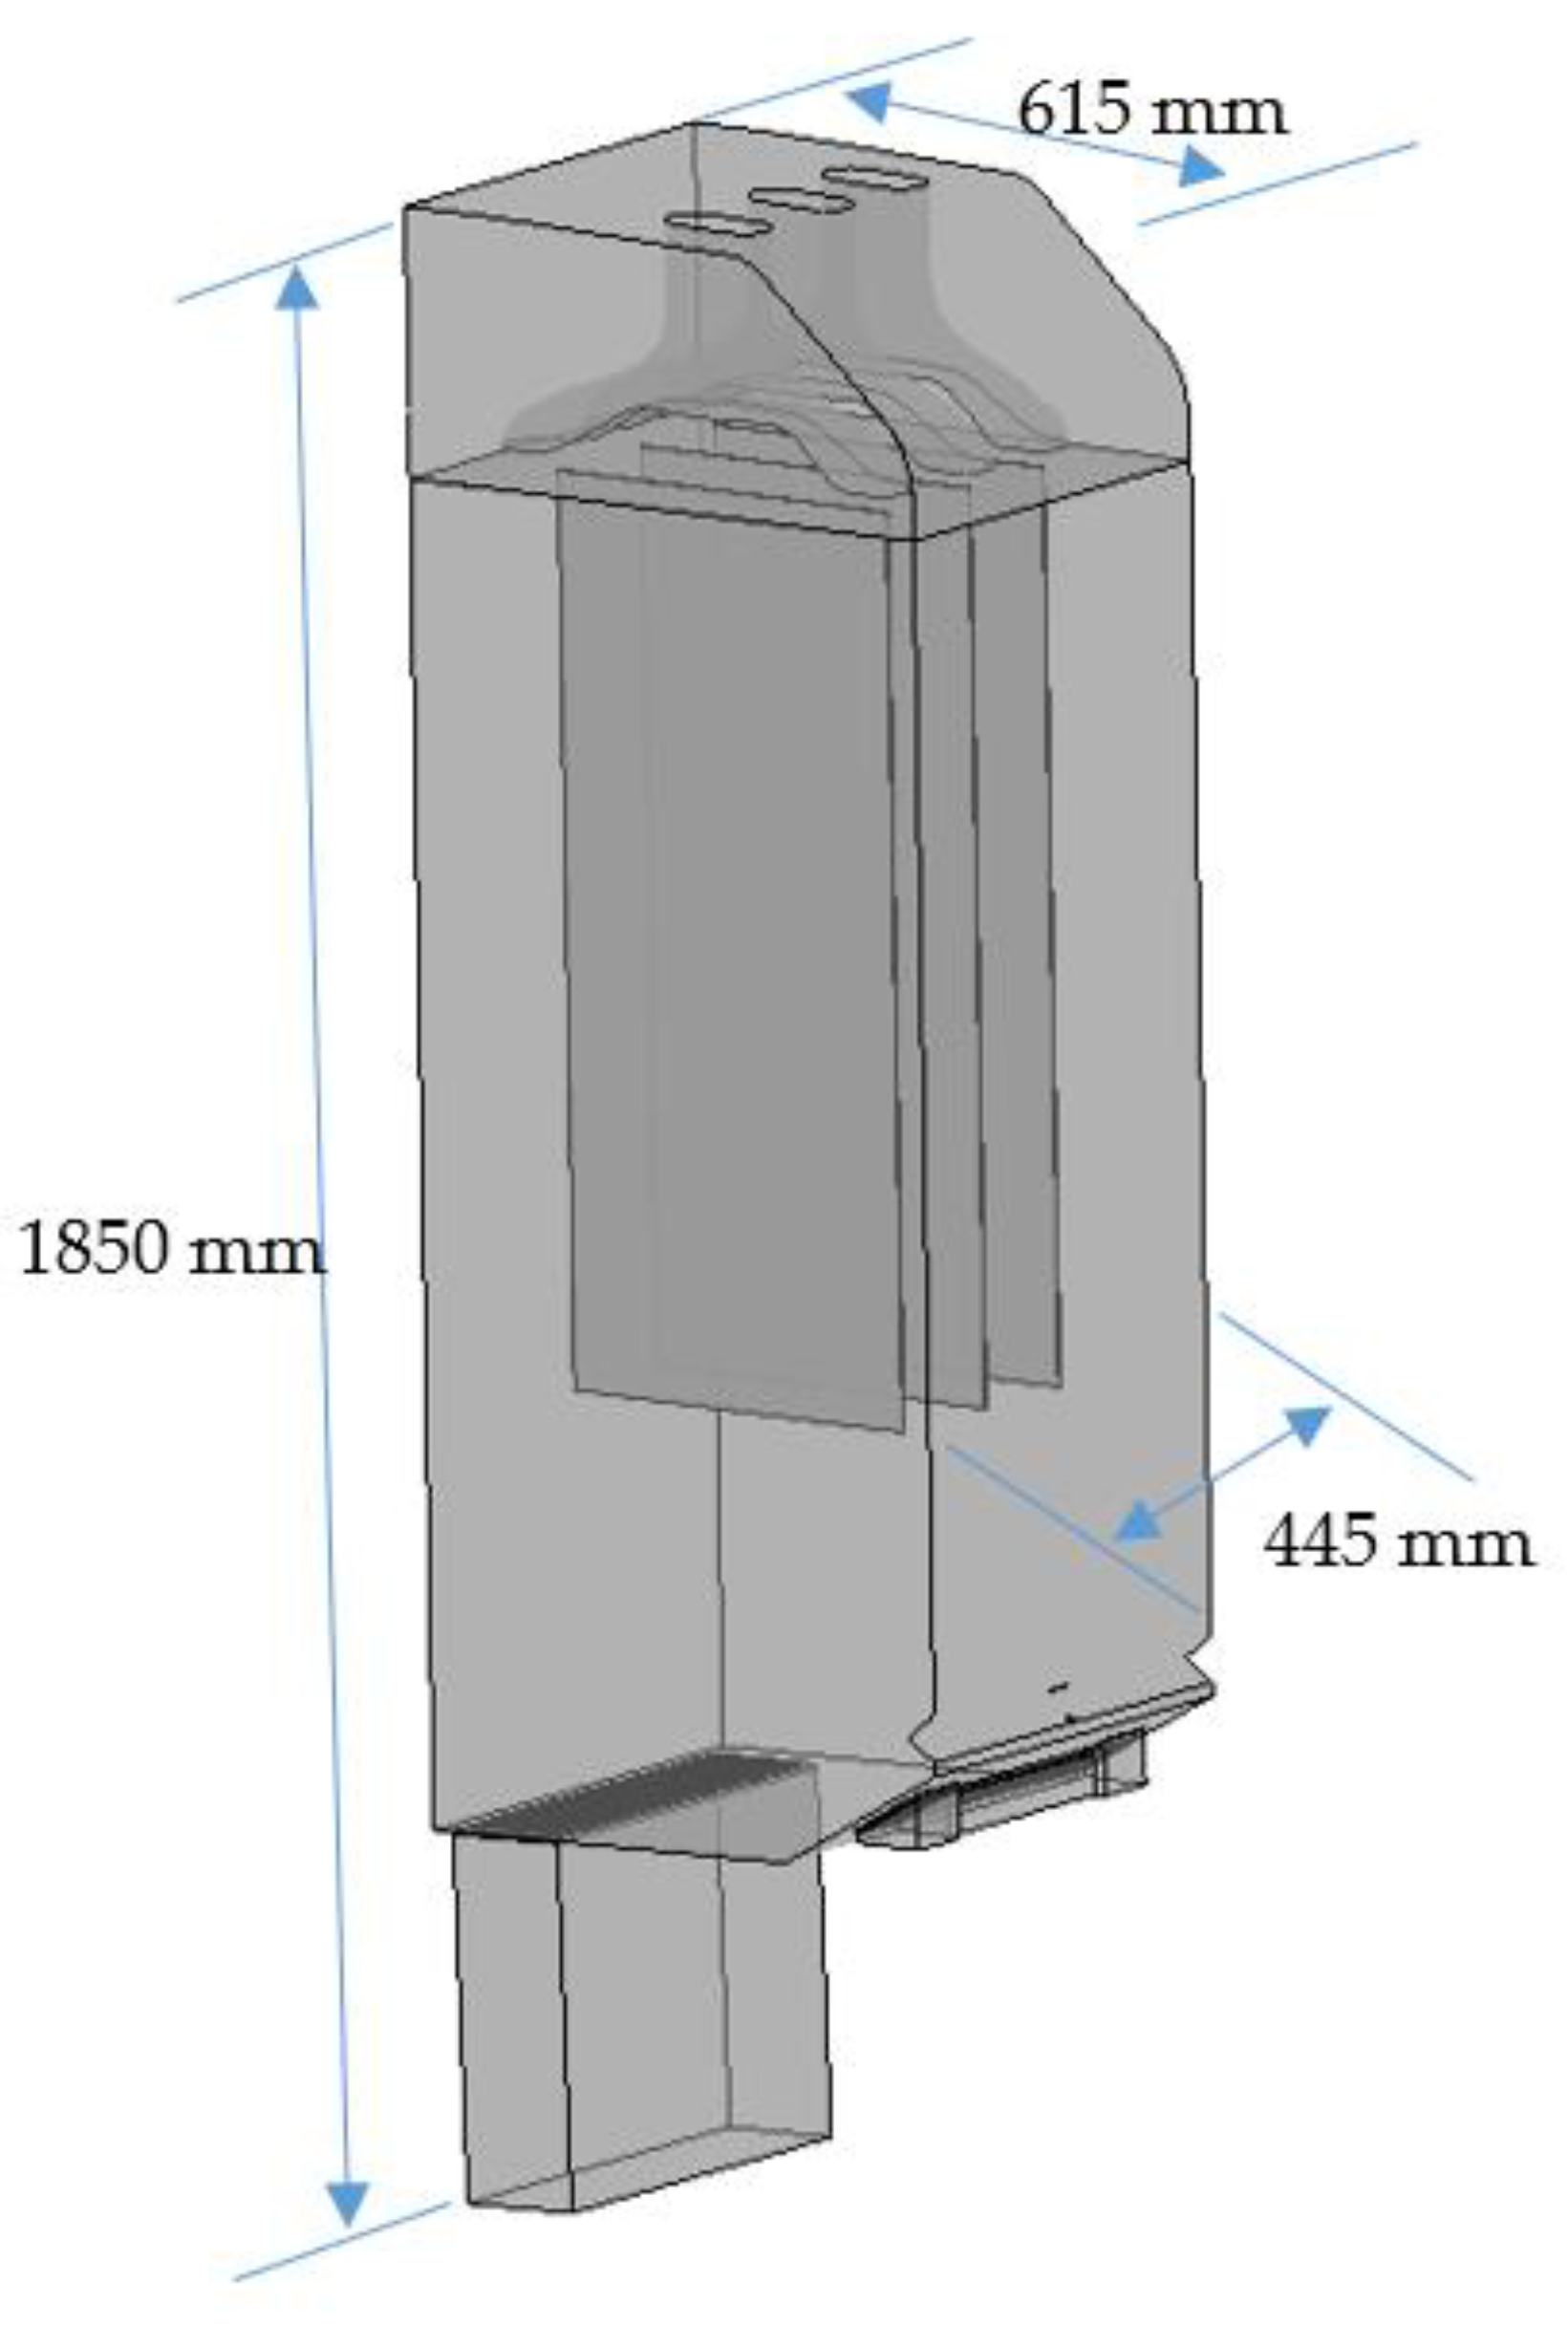
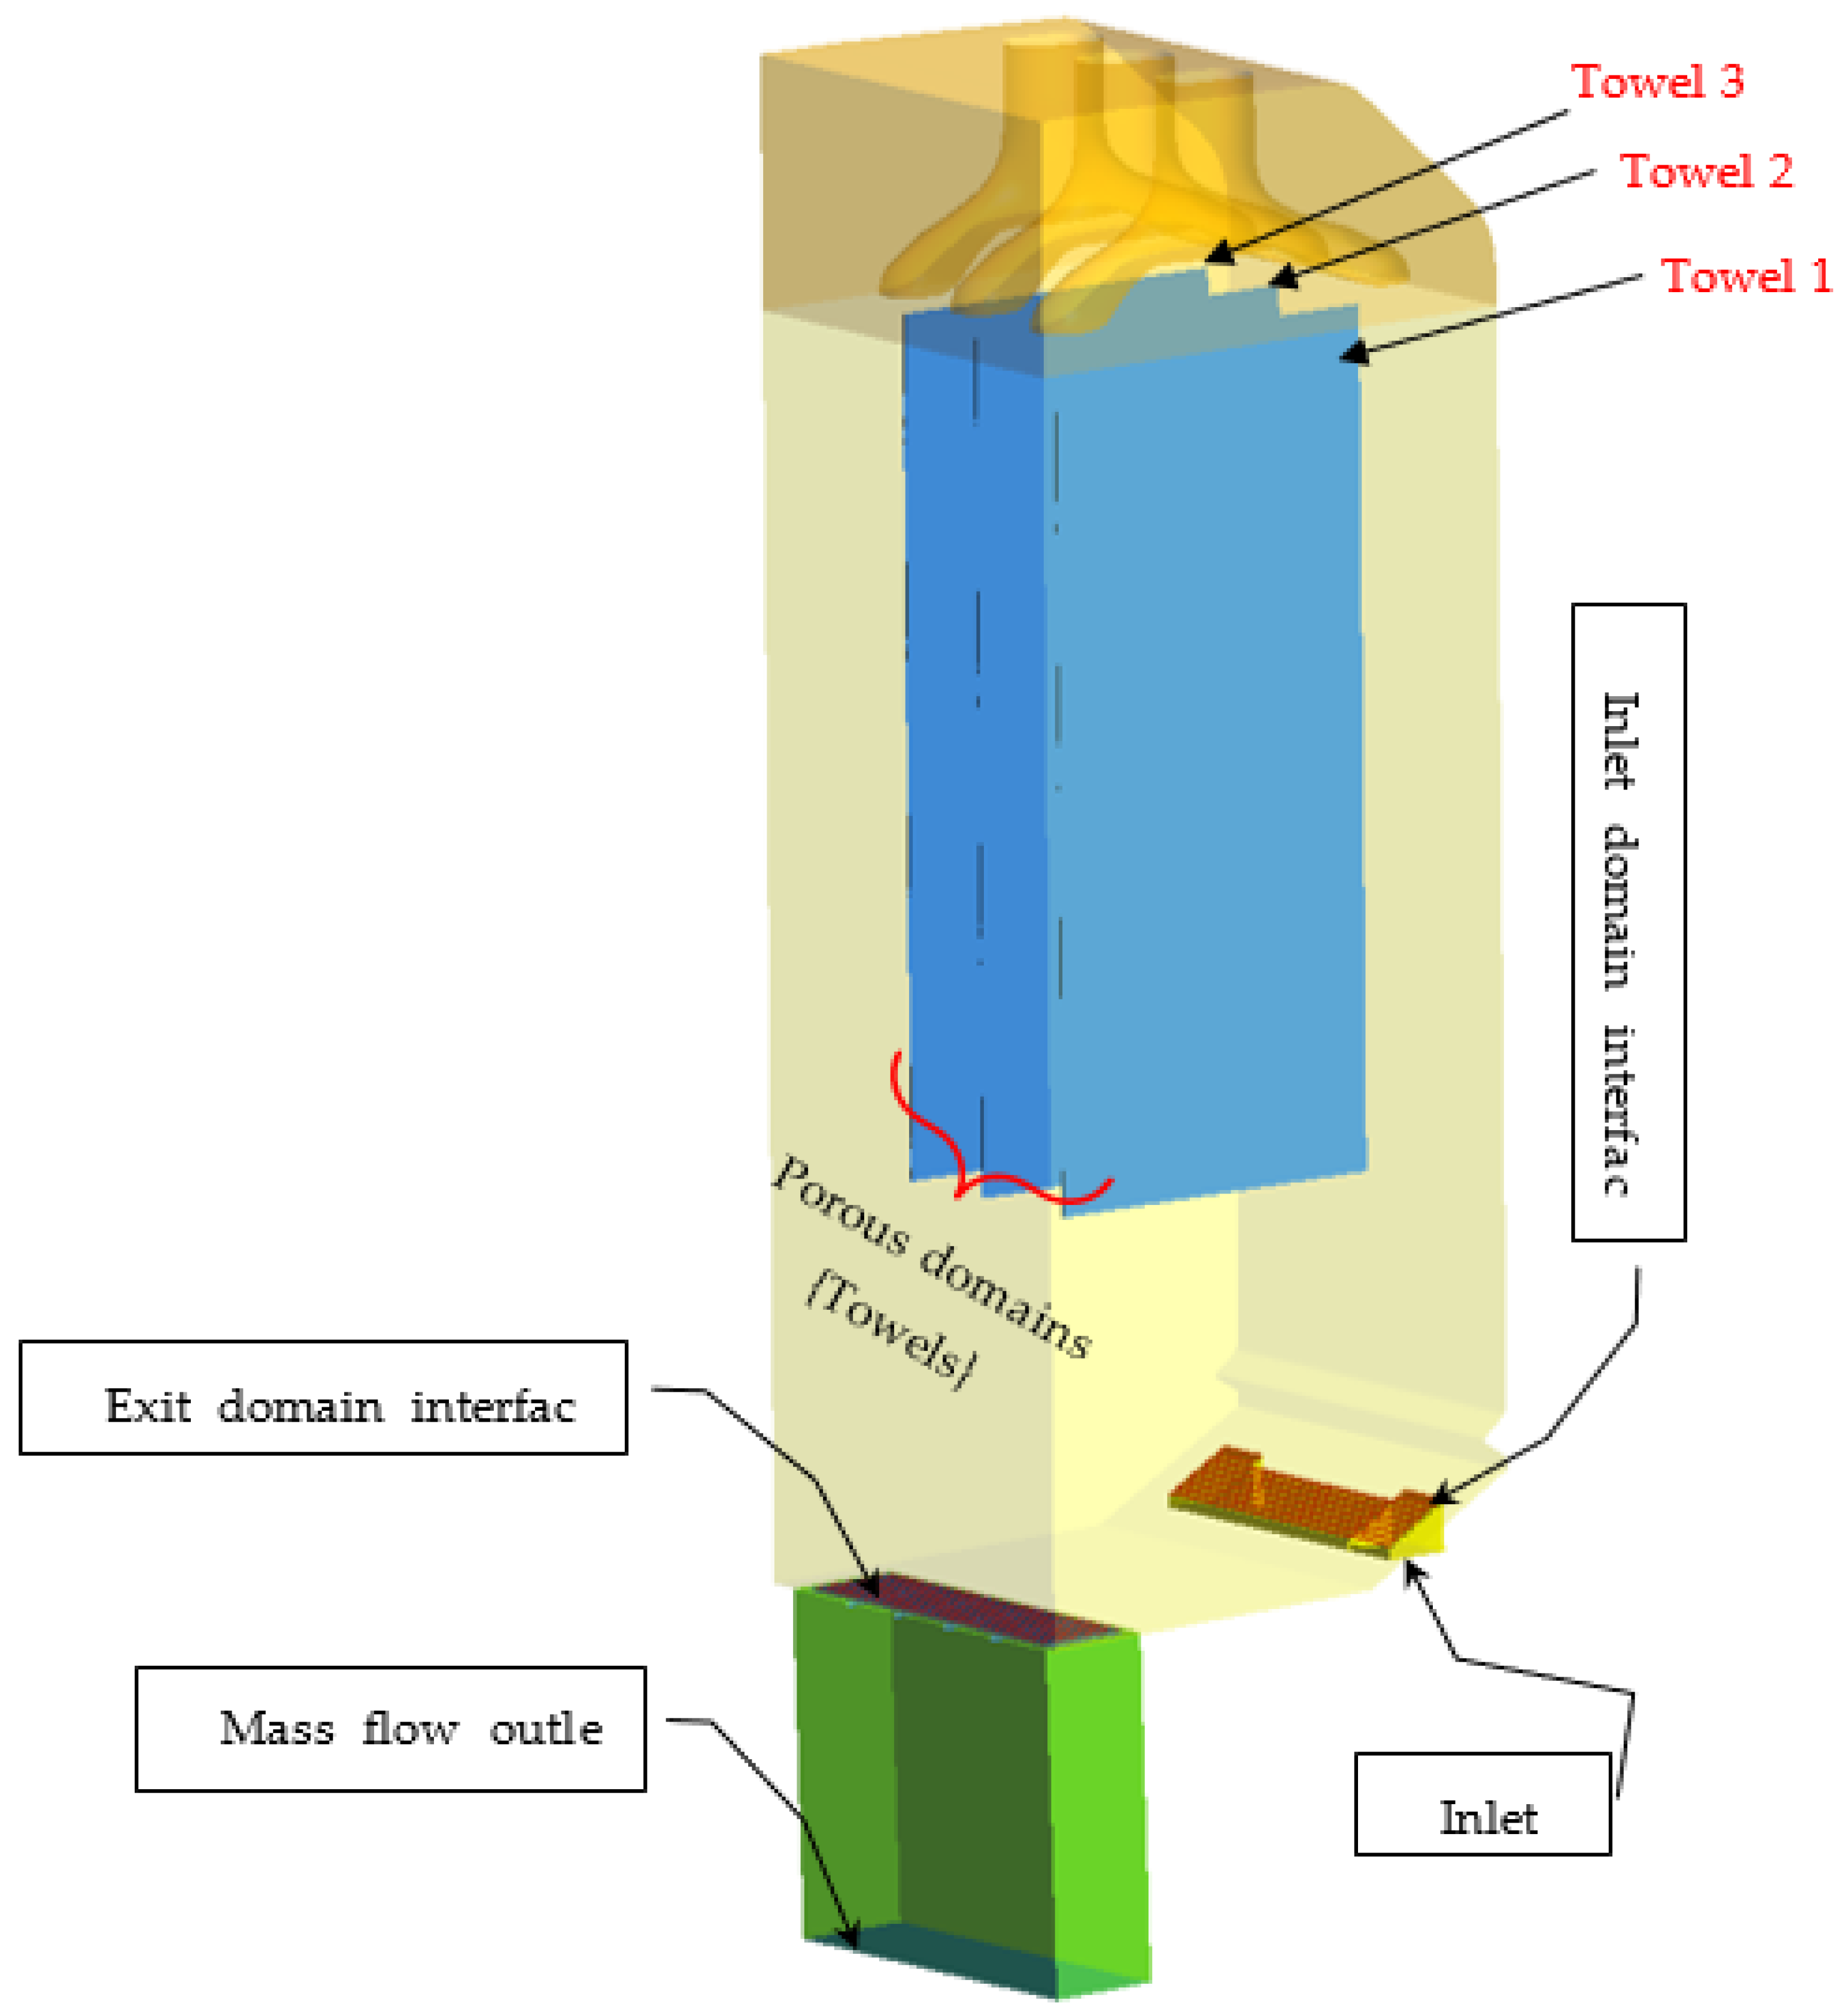
2.1. Physical Model Description

Multiple parts/components, small features, and details add to the complexity when it comes to the modelling of a clothes-conditioning unit. Therefore, design filtration was performed to simplify the geometry for the sake of computational analysis. The clothes are modelled as stationary and porous media. The geometric model of the CCU is shown in Figure 1.

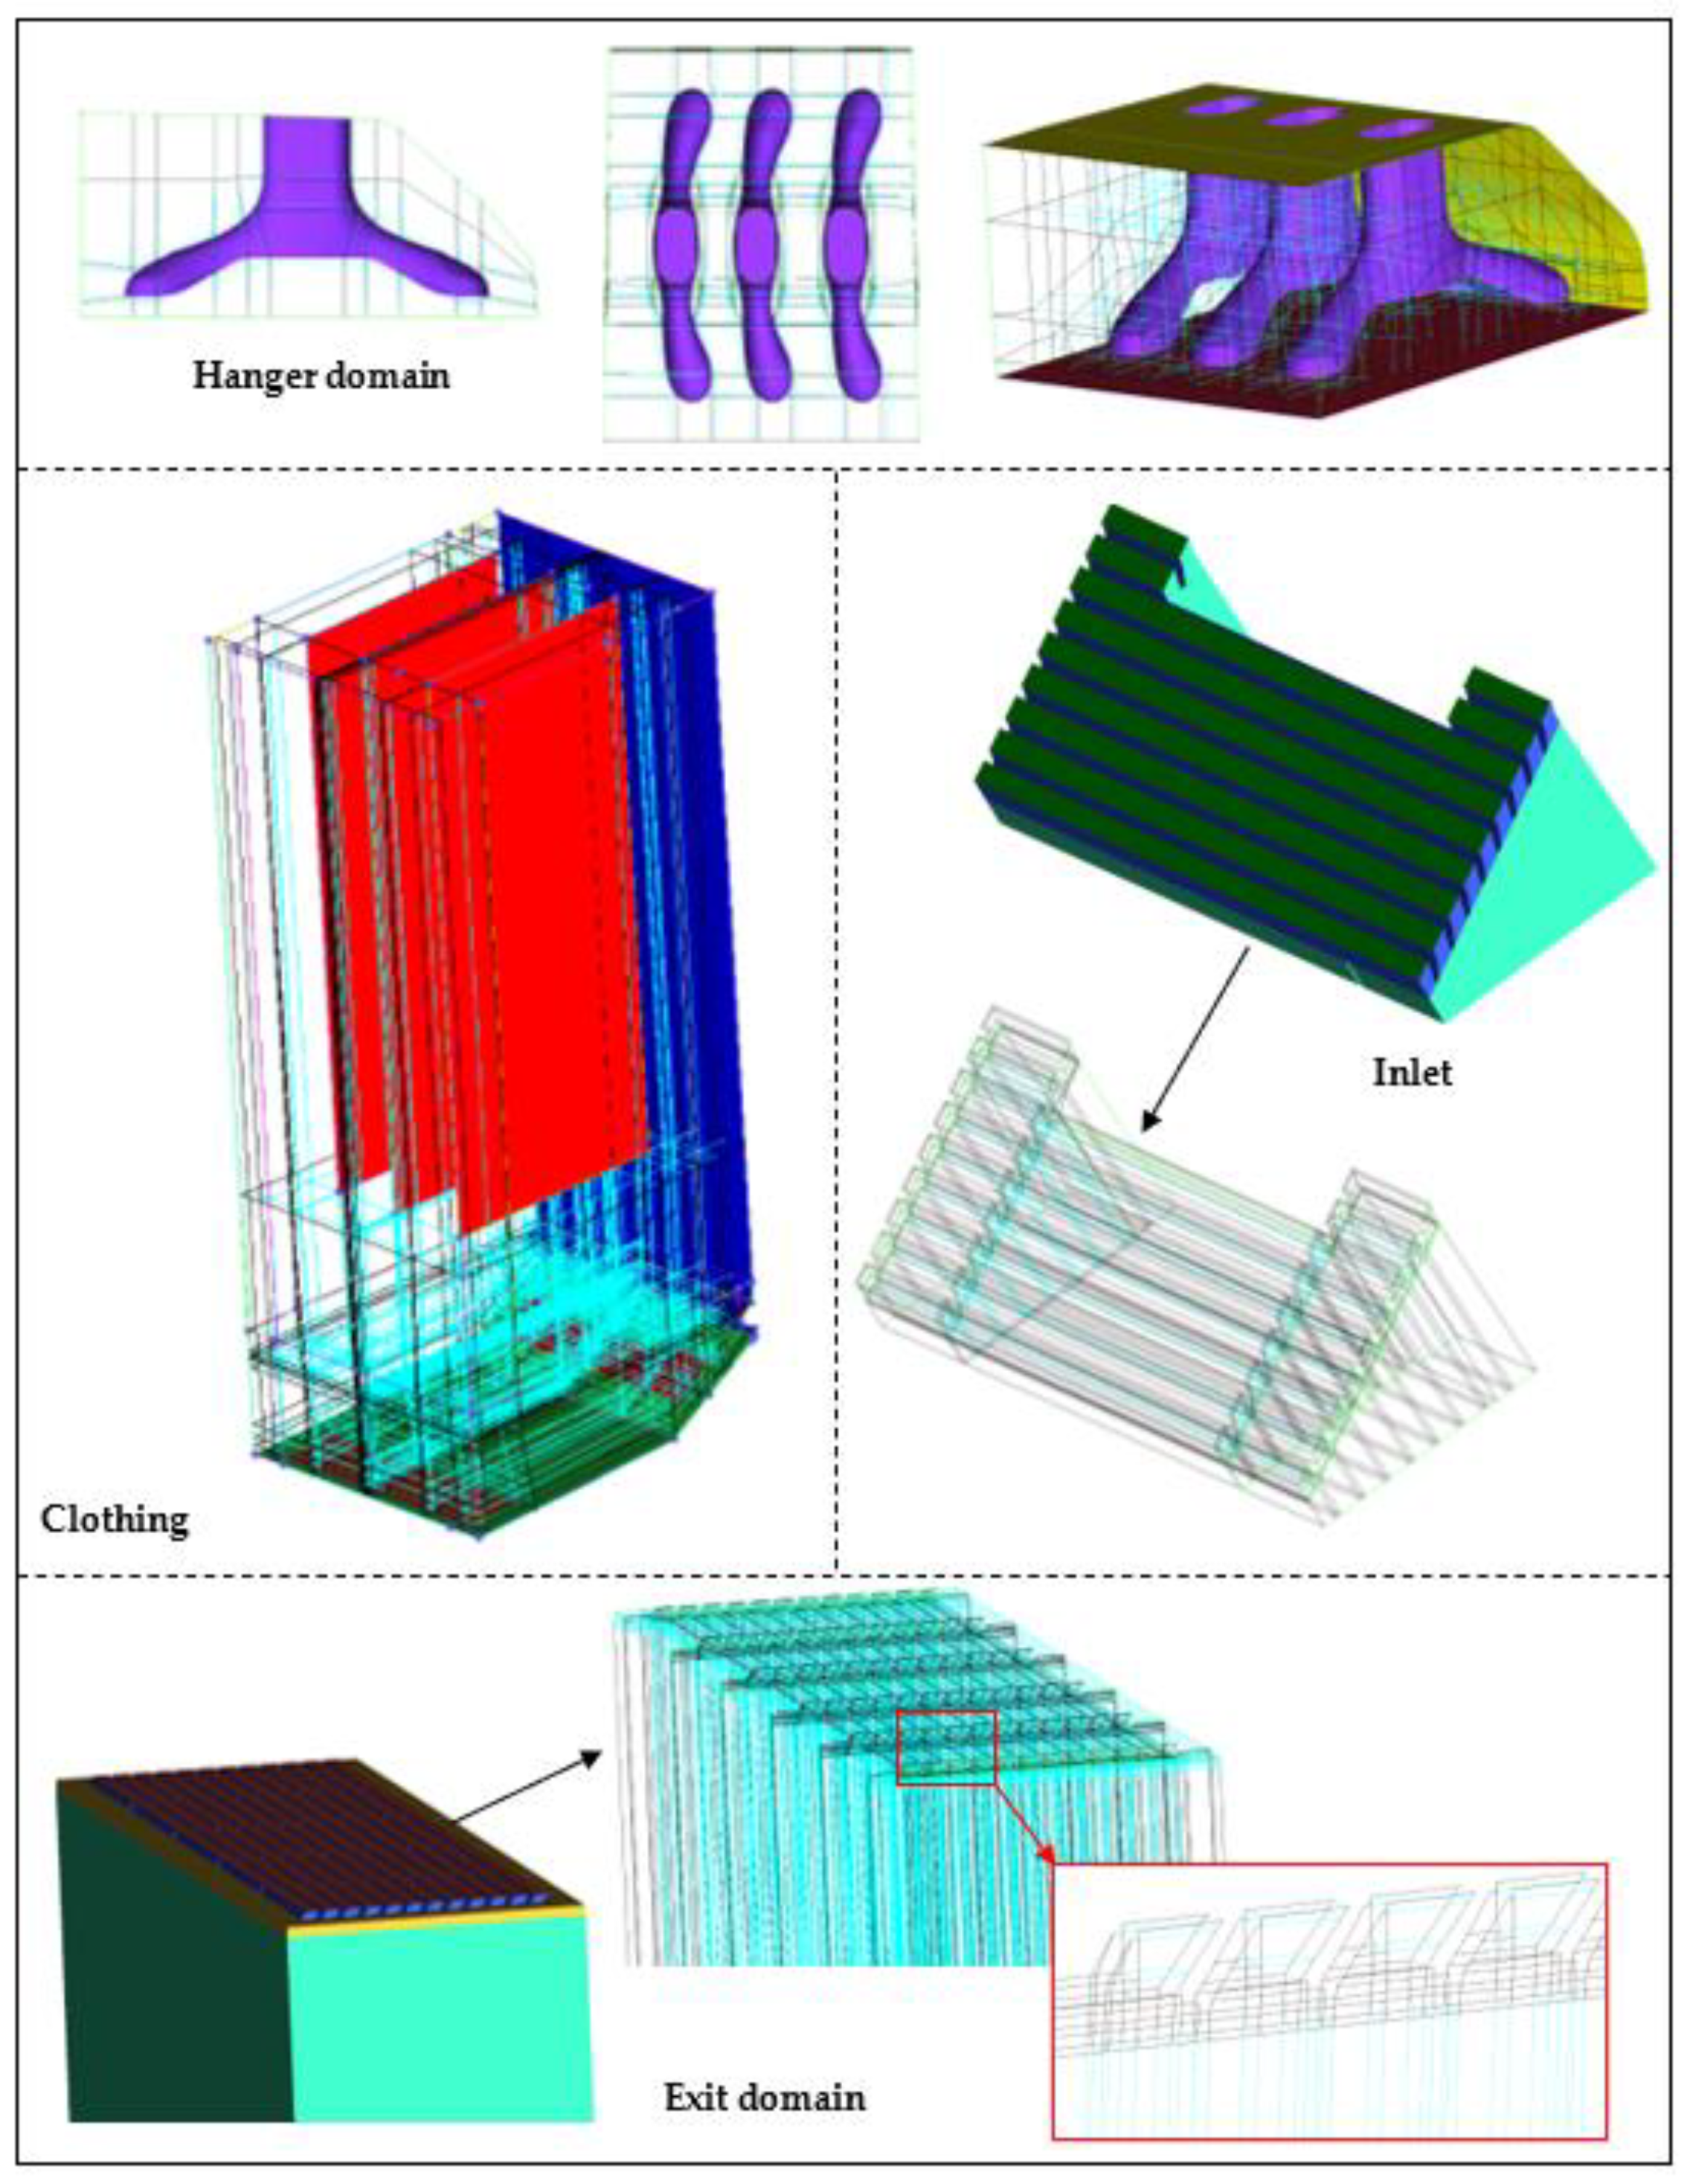
2.2. Computational Model

In the current study, a multicomponent, non-reacting, Eulerian–Eulerian two-phase approach was adopted. In this approach, a transport equation for volume fraction via the continuity equation for the dispersed phase is solved, whereas the momentum equation is solved for both phases. The phases mix at length scales larger than molecules; however, mixing is also at scales smaller than the resolved scales. The phases share the same volume in space; each phase is assumed present in each control volume (cell) and assigned a volume fraction equal to the fraction of the volume occupied. Volume fractions are determined by the solution of the continuity equation for each phase. In general, each phase has its own field variables. Variables which are assumed homogeneous are shared between phases. The phases are coupled by interphase models for energy, an additional variable (mass), and momentum transfer. Interphase transfer models are provided as empirical input to the problem specification and are highly problem dependent. These equations have the same form as they would for a single-phase flow, except that they have been weighted by the volume fraction r α and interphase transfer terms have been added:
t ( ρ α r α ϕ α ) + . ( ρ α r α U α ϕ α r α Γ α ϕ α ) = r α S α + T α
There are two sets of source terms on the right-hand side. The first is a standard volume fraction-weighted source term. The second represents the interphase transfer.
For two-phase flows:
T 1 = c 12 ( ϕ 2 ϕ 1 )
where c 12 ( ϕ 2 ϕ 1 ) is the interphase transfer term due to the exchange of energy (heat) or momentum (drag).
Phasic continuity equation:
t ( ρ α r α ) + . ( ρ α r α U α ) = β = 1 N p ( m ˙ α β m ˙ β α )
The continuity equation given above shows the interphase mass transfer terms on the right-hand side.
Momentum equation:
t ( ρ α r α U α ) + . [ r α { ρ α U α U α μ α ( U α + [ U α ] T ) } ] = r α ( B p α ) + β = 1 N p c α β ( U β U α )
The Schiller–Naumann correlation [16] is used to model the interphase drag force and the Ranz–Marshall model [17] is employed to simulate the interphase heat transfer with the liquid evaporation model. ANSYS CFX was used as a pseudo-transient solution approach for steady-state computations. The timescale of the pseudo-transient solution method was selected iteratively (0.01 s), as a large timescale value may result in numerical instability and divergence, whereas too small of a timescale can lead to a significantly longer solution time.
The wall function-based turbulence models are unable to capture the flow boundary layer, flow separation, pressure drop, and recirculation accurately [18], whereas the computational cost of the direct numerical simulation (DNS), large-eddy simulation (LES) and detached-eddy simulation (DES) turbulence models is significant [19]. A shear-stress transport (SST) turbulence model is widely used in the literature due to its accuracy in the prediction of flow characteristics and computational economy [20,21,22]. Therefore, the k ω SST turbulence model was adopted to simulate the flow field in the present study; the formulation details of the SST turbulence model can be found in [23].

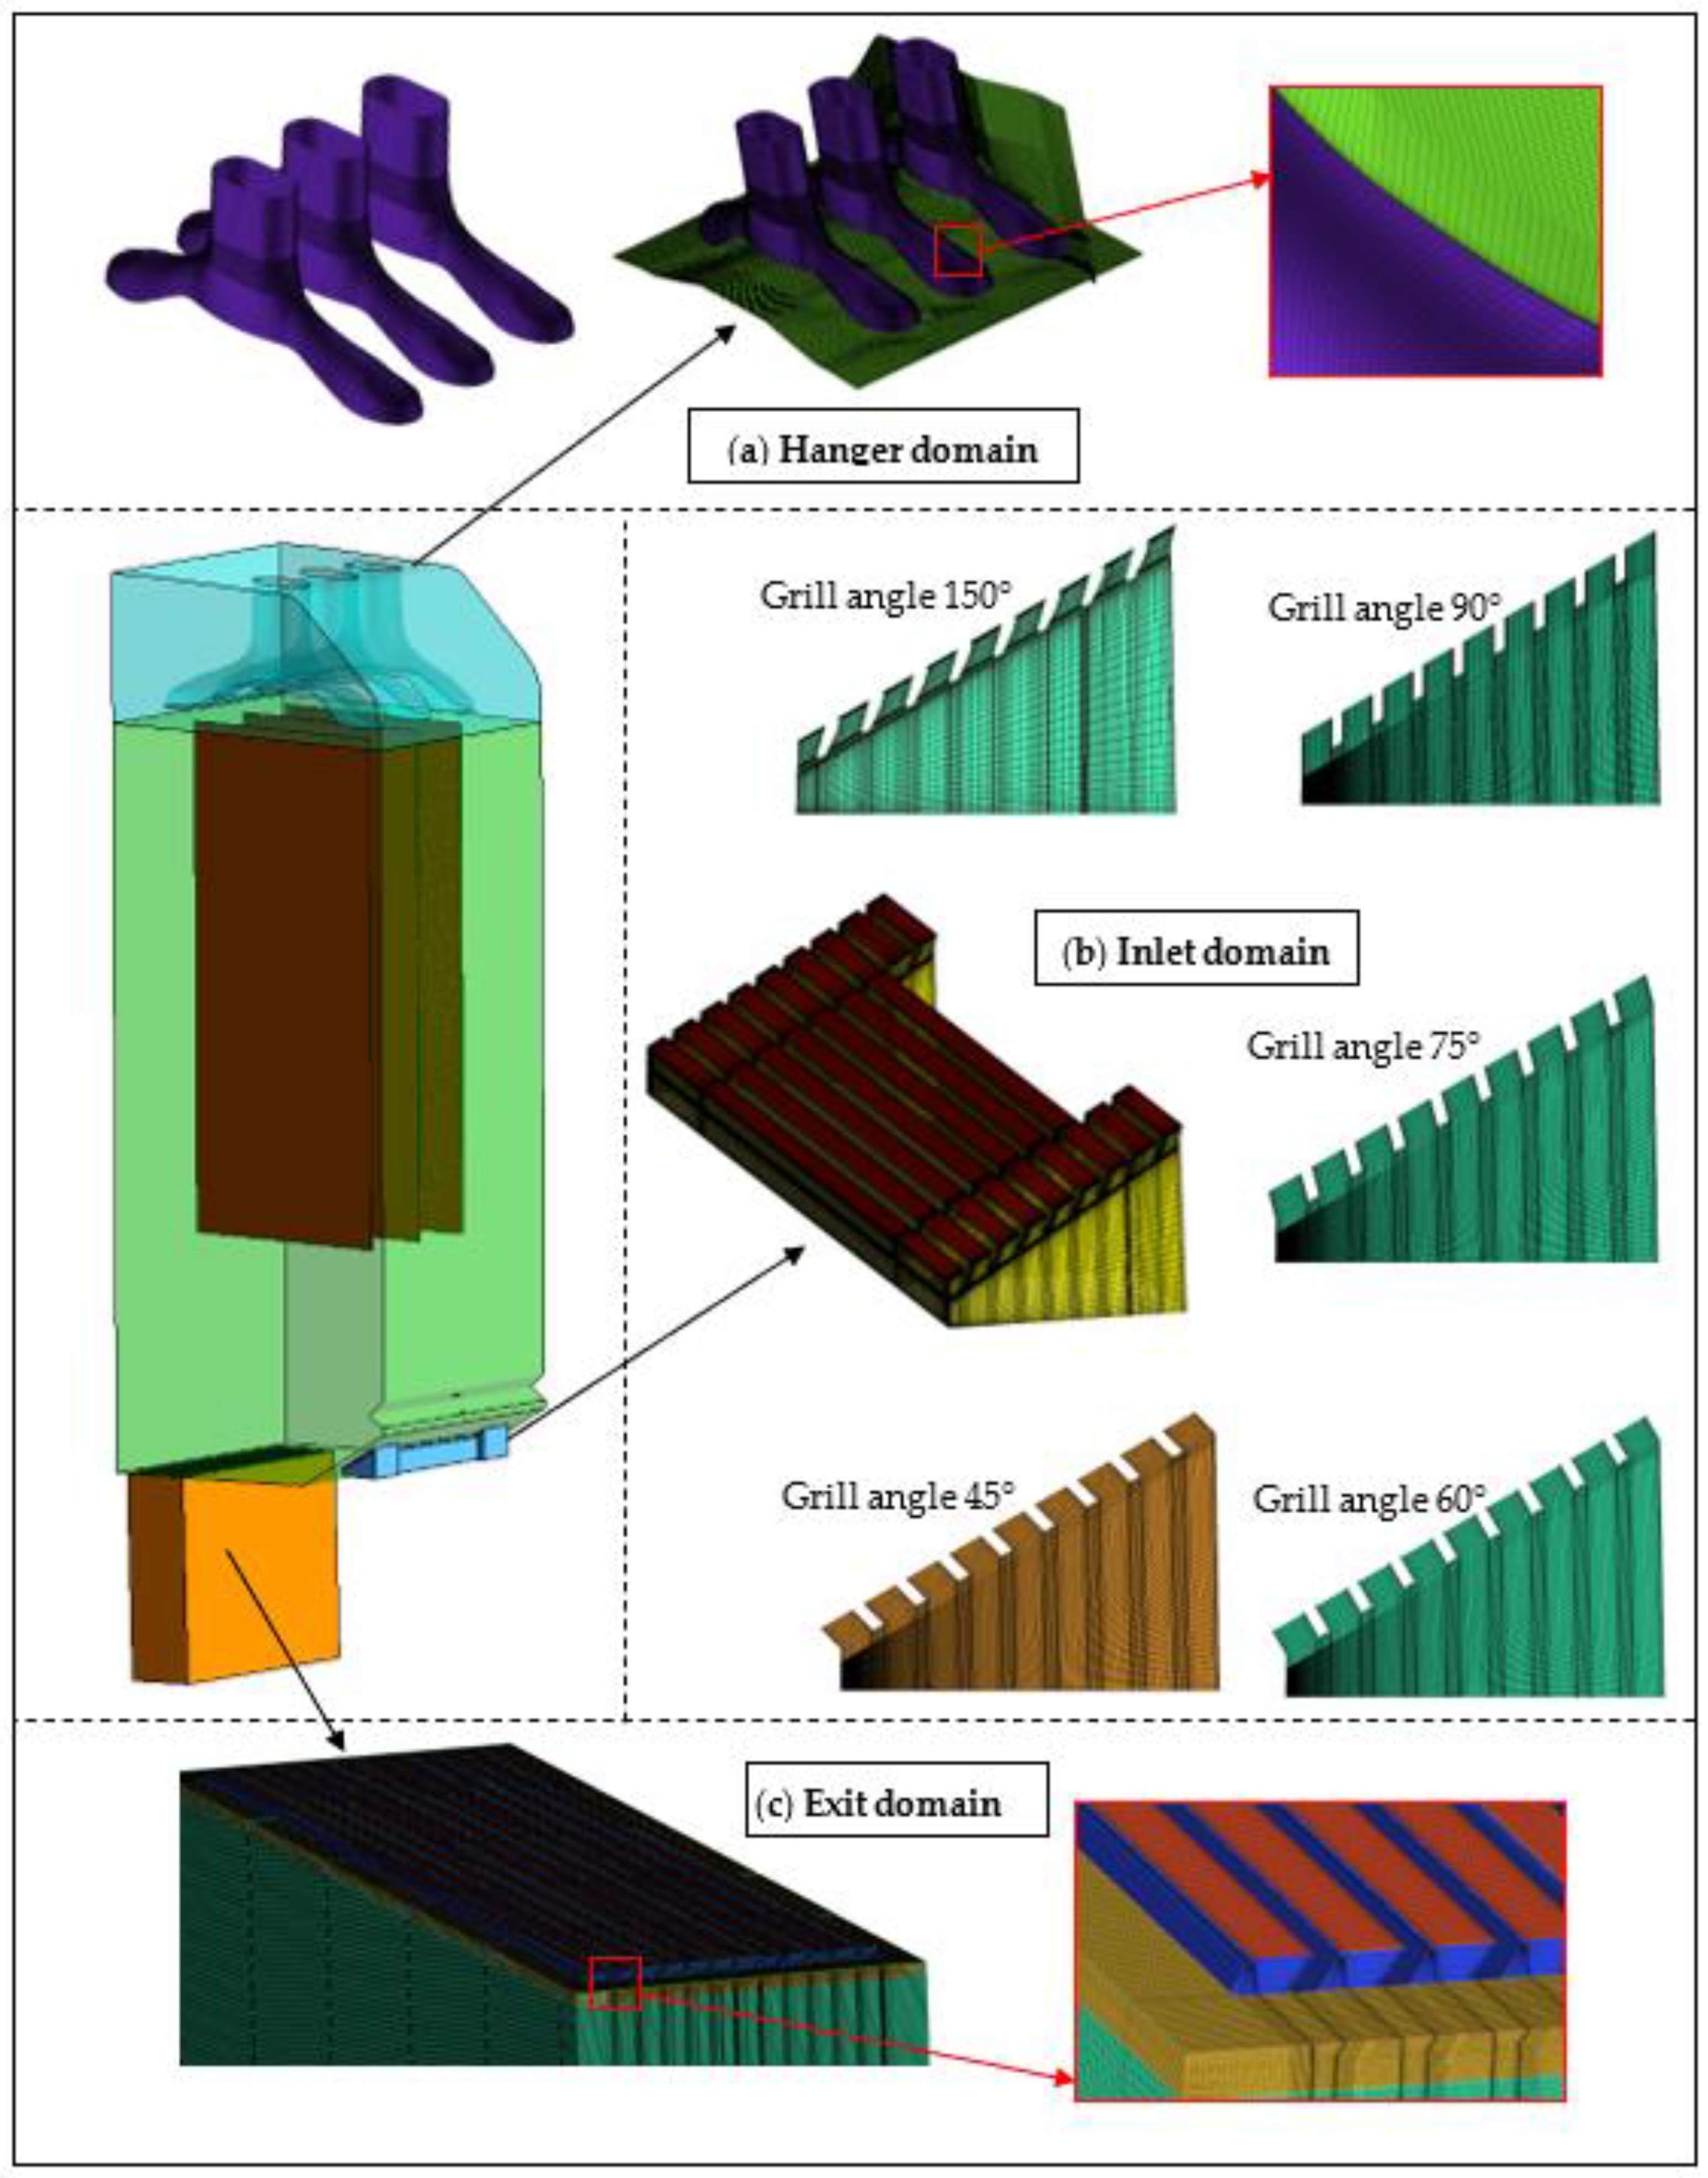
2.3. Boundary Conditions and Numerical Settings

The computational model of the CCU consisted of five subdomains; four fluid domains including the air inflow domain, the clothing chamber domain, the hangers domain, and the exit domain, and one porous medium domain of towels. A mass flow boundary condition was imposed as normal to the air inlet to maintain a volumetric flow rate of 1.35 m3/min and an air inlet temperature of 320 K. The steam enters the CCU at 373 K through two nozzles, nozzle 1 and nozzle 2, with a mass flow rate of 5.4 × 10⁻⁴ and 1.4 × 10⁻⁴ kg/s, respectively. Five different air inflow domains were modelled based on the variation of the grill angle ( θ g ) from 45°–105°. The steam flow direction is varied by defining Cartesian components in y and z coordinates corresponding to the nozzle angles ( θ n ) of 30°–75°. A pressure outlet with zero relative pressure was used at the exit boundary. Details of the boundary conditions imposed to solve the computational domain are shown in Figure 2. The inlet domain, exit domain, main chamber, and towels domain were meshed separately and then connected using a grid-to-grid interface (GGI) to minimise the interface losses. Pressure losses in the towels modelled as a porous media were defined using the expression given below in Equation (5), formulated based on experimental data [24]. The volume porosity was set to 0.3 and the superficial directional velocity loss model was employed. Operating conditions for the simulation are provided in Table 1.
d p d x = 13654 x 2   + 23135 x
The ANSYS CFX solver takes advantage of the collocated grid to maintain the same control volume for all transport equations in pressure velocity coupling. This can result in a decoupled pressure field [18]; however, to alleviate this problem, Rhie and Chow [25] proposed an alternate discretisation of the mass flow. Majumdar [26] modified this discretisation to eliminate the dependence of a steady-state solution on the time step. A high-resolution advection scheme was imposed and turbulence numerics were solved utilising the first-order discretisation scheme. Upwind advection along with the first-order backward Euler scheme is used in the first-order discretisation of turbulence numerics. The second-order backward Euler scheme leads to inappropriate results for the volume fractions and turbulence quantities. Thus, the accuracy of the results is not affected by the use of the second-order discretisation scheme for k and omega [27]. To reach convergence, residuals of flow properties in all simulations performed in the present study were ensured to be below 1 E 5 .

2.4. Computational Mesh and Grid Independence Study

The computational domain is divided into five subdomains to facilitate the blocking process. The subdomains are, namely, the inlet domain, the outlet domain, the main chamber, the towels domain, and the hangers domain. The blocking topology used for the computational domain is shown in Figure 3. The blocking of the CCU was carried out such that the inlet domain, outlet domain, clothing chamber, hangers domain, and towels domain had 260, 2224, 1135, 364, and 3 blocks, respectively. For mesh generation, a fully structured mesh with hexahedral elements was generated using ICEM-CFD for better control on the mesh, less computational time, and better accuracy. For the mesh optimisation study, the same methodology was used as was used previously [28,29,30]. The mesh of the different sections of the CCU is shown in Figure 4.
In addition, to fully benefit from the SST turbulence model, the near-wall element is placed at a distance from the wall such that y + is maintained as less than 1 through the entire computational domain. The details of grid density variation are detailed in Table 2.

3. Design Optimisation Strategy

3.1. Response Surface Method

It is important to account for all the possible combinations of the design variables to conduct a parametric study. To direct the design of the experiments, a response surface methodology was employed [31]. To formulate the simulation matrix for two design variables of three levels each, the central composite design (face-centred) was utilised due to its high fidelity across the entire design range. Numerical computations were performed and objective function was calculated for different geometric configurations based on the design variables. To predict the objective function, a response surface model based on the Levenberg–Marquardt nonlinear least-squares algorithm [32] was developed. In this study, a second-order polynomial (shown in Equation (6)) was employed as the response surface model. All the simulations were performed in ANSYS CFX based on the design of the experiments; it is noteworthy that the computational cost of running the simulations without an efficient design of experiments is significantly higher.
f ( x ) = a 0 + i = 1 n a i x i + i = 1 n a i i x i 2 + i = 1 n 1 j = i + 1 n a i j x i x j
Here, a 0 , a i ,   a i , i , and a i , j are regression coefficients, namely, intercept, linear, quadratic, and interaction for the objective function expression. x i and x j are design variables, and n represents the number of design variables.

3.2. Genetic Algorithm

The optimisation algorithms are designed to provide a solution to complex scientific problems. However, the availability of several optimisation algorithms of different fidelities makes the selection of the appropriate search algorithm very difficult. Several optimisation techniques are available in the literature; for example, the gradient optimisation method operates on the simple and generic approach of following the gradient vector at each iteration, and the particle-swarm optimisation method imitates the bird flock’s motion and, thus, is similar to the bio-inspired or evolutionary algorithms. Based on Darwin’s evolution theory, the genetic algorithm (GA) was introduced first by John Holland in 1960 [33], and later extended by David Goldberg [34] in 1989. It is a global search, non-gradient method, extensively used to solve multifaceted, discontinuous, and multimodal problems due to its high accuracy and low computational cost. It avoids local optima by not relying on gradient data and performing a fitness evaluation of the entire search space. Therefore, to determine the design variables for the optimal geometric configuration of the CCU, the genetic algorithm was adopted in the present study.
The initial population (consisting of phenotypes of individuals) undergoes the evaluation process where the entire population is scored on the basis of fitness. Bio-inspired evolution (mutation, selection, and crossover) is mimicked for the evolution of the genetic algorithm. The population candidates with the highest fitness score qualify for the new population pool called the offspring. The offspring candidates again go through the evaluation process for parent/individual selection. In the present study, the fitness score of each candidate of the population depends on the amount of mixture and steam mass flow through the towels since the objective function is formulated to optimise the mass flow rate. The properties of the genetic algorithm such as the population size, crossover rate, and mutation rate are selected as given in [35].

4. Results

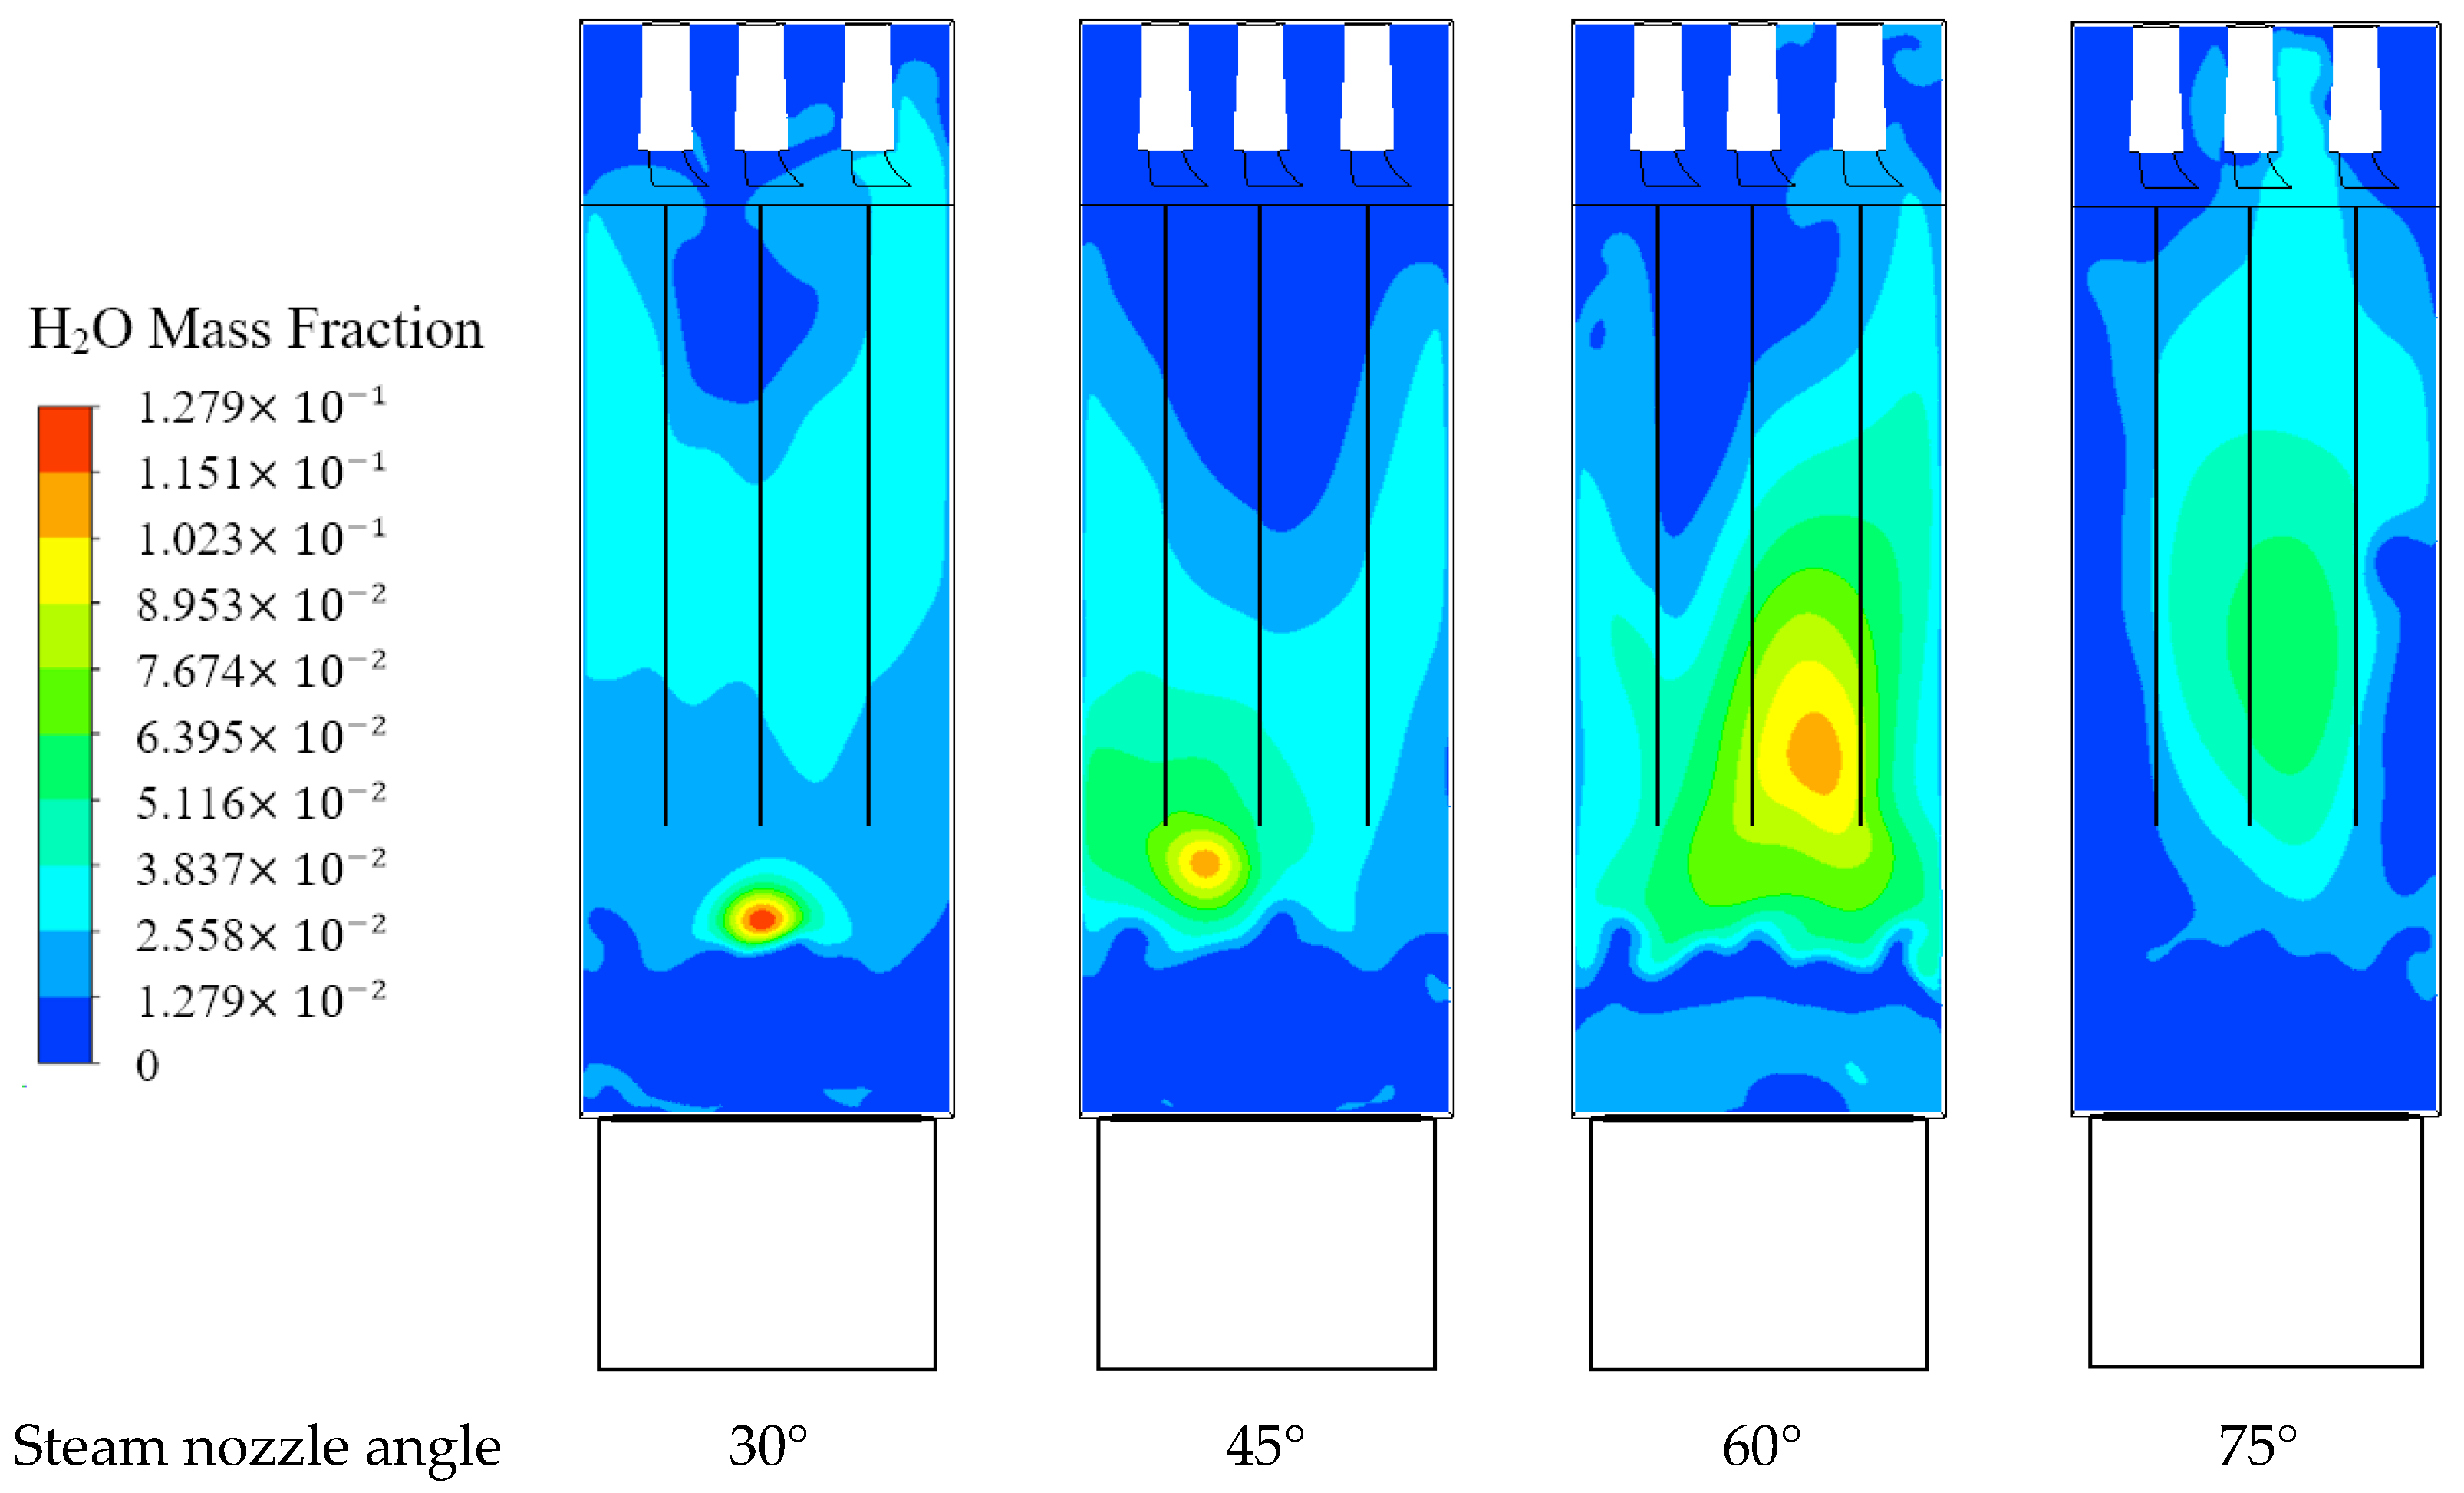
4.1. Impact of Design Parameters

To evaluate the performance of the CCU based on the design parameters, the mass flow of the steam and air–steam mixture through the towels was studied. The air–steam mixture passes through the towels in both a forward and reverse direction, resulting in a very small value of net mass flow rate. To calculate the actual net mass flow rate through the towels, the mass flow rate in the forward and reverse direction is calculated separately based on the direction of the normal velocity vector in each cell and then integrated over the whole towel area. The CFX expression language (CEL) is incorporated to calculate the mass flow rate using a step function and Equations (7)–(10).
V n = ( v . n ^ ) n ^
where V n is the normal velocity, v is the velocity vector, and n ^ is the unit vector.
m ˙ f w d = A ρ V n . d A
m ˙ r e v = A ρ V n . d A
where mass flow in the forward and reverse direction is represented by m ˙ f w d and m ˙ r e v , respectively, whereas ρ and A represent the density and area. The total mass flow rate is calculated by the summation of the absolute mass flow rate in the forward and reverse direction, as shown below.
m ˙ t = | m ˙ f w d | + | m ˙ r e v |
The computational results are demonstrated using surface plots to better understand the effect of variation of the grill angle and nozzle angle simultaneously. Figure 5, Figure 6 and Figure 7 show the mass flow rate of the air–vapour mixture passing through towel 1, 2, and 3, respectively, at different air grill angles ranging from 45° to 105° and steam nozzle angles varying from 30° to 75°. The maximum mixture mass flow rate passing through towel 1 was observed for the CCU configuration with an air grill angle of   ( θ g )   90 ° and a steam nozzle angle of   ( θ n )   45 ° , whereas the maximum mixture mass flow rate through towel 2 and towel 3 was observed for the CCU where θ g = 105 ° and θ n = 30 ° , and θ g = 105 ° and θ n = 45 ° , respectively. The highest mixture flow through all towels transpired for the geometric configuration with the grill and nozzle angles of 90° and 30° with 18% steam. It is evident that higher mixture mass flow rates correspond to higher air grill angles, i.e., 75° to 105°, and lower steam nozzle angles, i.e., 30° to 45°.
To better understand the flow distribution, air flow streamlines inside the clothing chamber with varying grill angles are plotted in Figure 8. The flow appears to demonstrate clockwise circulation for grill angles of 45, 60, and 75 degrees, whereas anticlockwise circulation is observed for higher grill angles of 90 and 105 degrees. It is noteworthy that the position of the air inflow grill is positioned below the steam nozzle such that it assists the distribution of steam inside the clothing chamber.
The steam flow rate through towel 1, towel 2, and towel 3 was plotted against varying nozzle angles for each air grill angle setting. From Figure 9, Figure 10 and Figure 11, the maximum steam mass flow rate passing through Towel 1 was observed in the air-dresser setting when the air grill angle θ g = 90 ° and the steam nozzle angle   θ n = 30 ° . However, the maximum steam mass flow rate through towel 2 and towel 3 was observed in the cases where θ g = 105 °   and   θ n = 60 ° , and θ g = 105 °   and   θ n = 45 ° ,   respectively . Geometric configuration with the grill and nozzle angle of 105° and 45° resulted in the highest total steam flow through towels, constituting 69% of the mixture. Higher steam mass flow rates correspond to higher air grill angles, i.e., 90° to 105°, and steam nozzle angles in the range of 30° to 60°.
The response surface graphs indicate that the steam mass flow rate passing through the towels almost diminishes at small grill angles. The reduced dispersal of steam at lower grill angles can be explained by the vorticity contours shown in Figure 12. At lower grill angles, the direction of the airflow is such that it does not properly distribute the steam inside the clothing chamber; however, at higher grill angles, the air jet carries the plumes of steam and creates better distribution.
Figure 13, Figure 14, Figure 15, Figure 16 and Figure 17 show concentrations of the steam mass fraction on the central plane perpendicular to towel 1, towel 2, and towel 3 for different air grill angles ranging from 105° to 45°. For each air grill angle, the steam nozzle angle varied from 30 o to 75 o . The results suggest the concentration of the steam is well distributed for the air grill angle of 105°, followed by the setting with the air grill angle of 90°. On the other hand, it can be observed from Figure 15, Figure 16 and Figure 17 that the distribution of the steam for air grill angles 75°, 60°, and 45° is poor for all steam nozzle angles ranging from 30° to 75°. The results suggest the mass flow rate of the air through the towels is relatively uniform and well distributed among all towels. However, the mass flow rate of the steam is not uniformly distributed in comparison with the air flow rate.
The steam concentration contours show the highest steam concentration in the middle of the clothing chamber due to an undispersed plume of steam directly coming out of the nozzle. The higher concentration of the steam mass fraction appears to vary its location in different geometric configurations. The location of the steam-concentrated region moves down vertically with the decrease in the steam nozzle angle. At the maximum nozzle angle of 75°, poor steam distribution occurs for all grill angles with the exception of the grill angle of 105°.

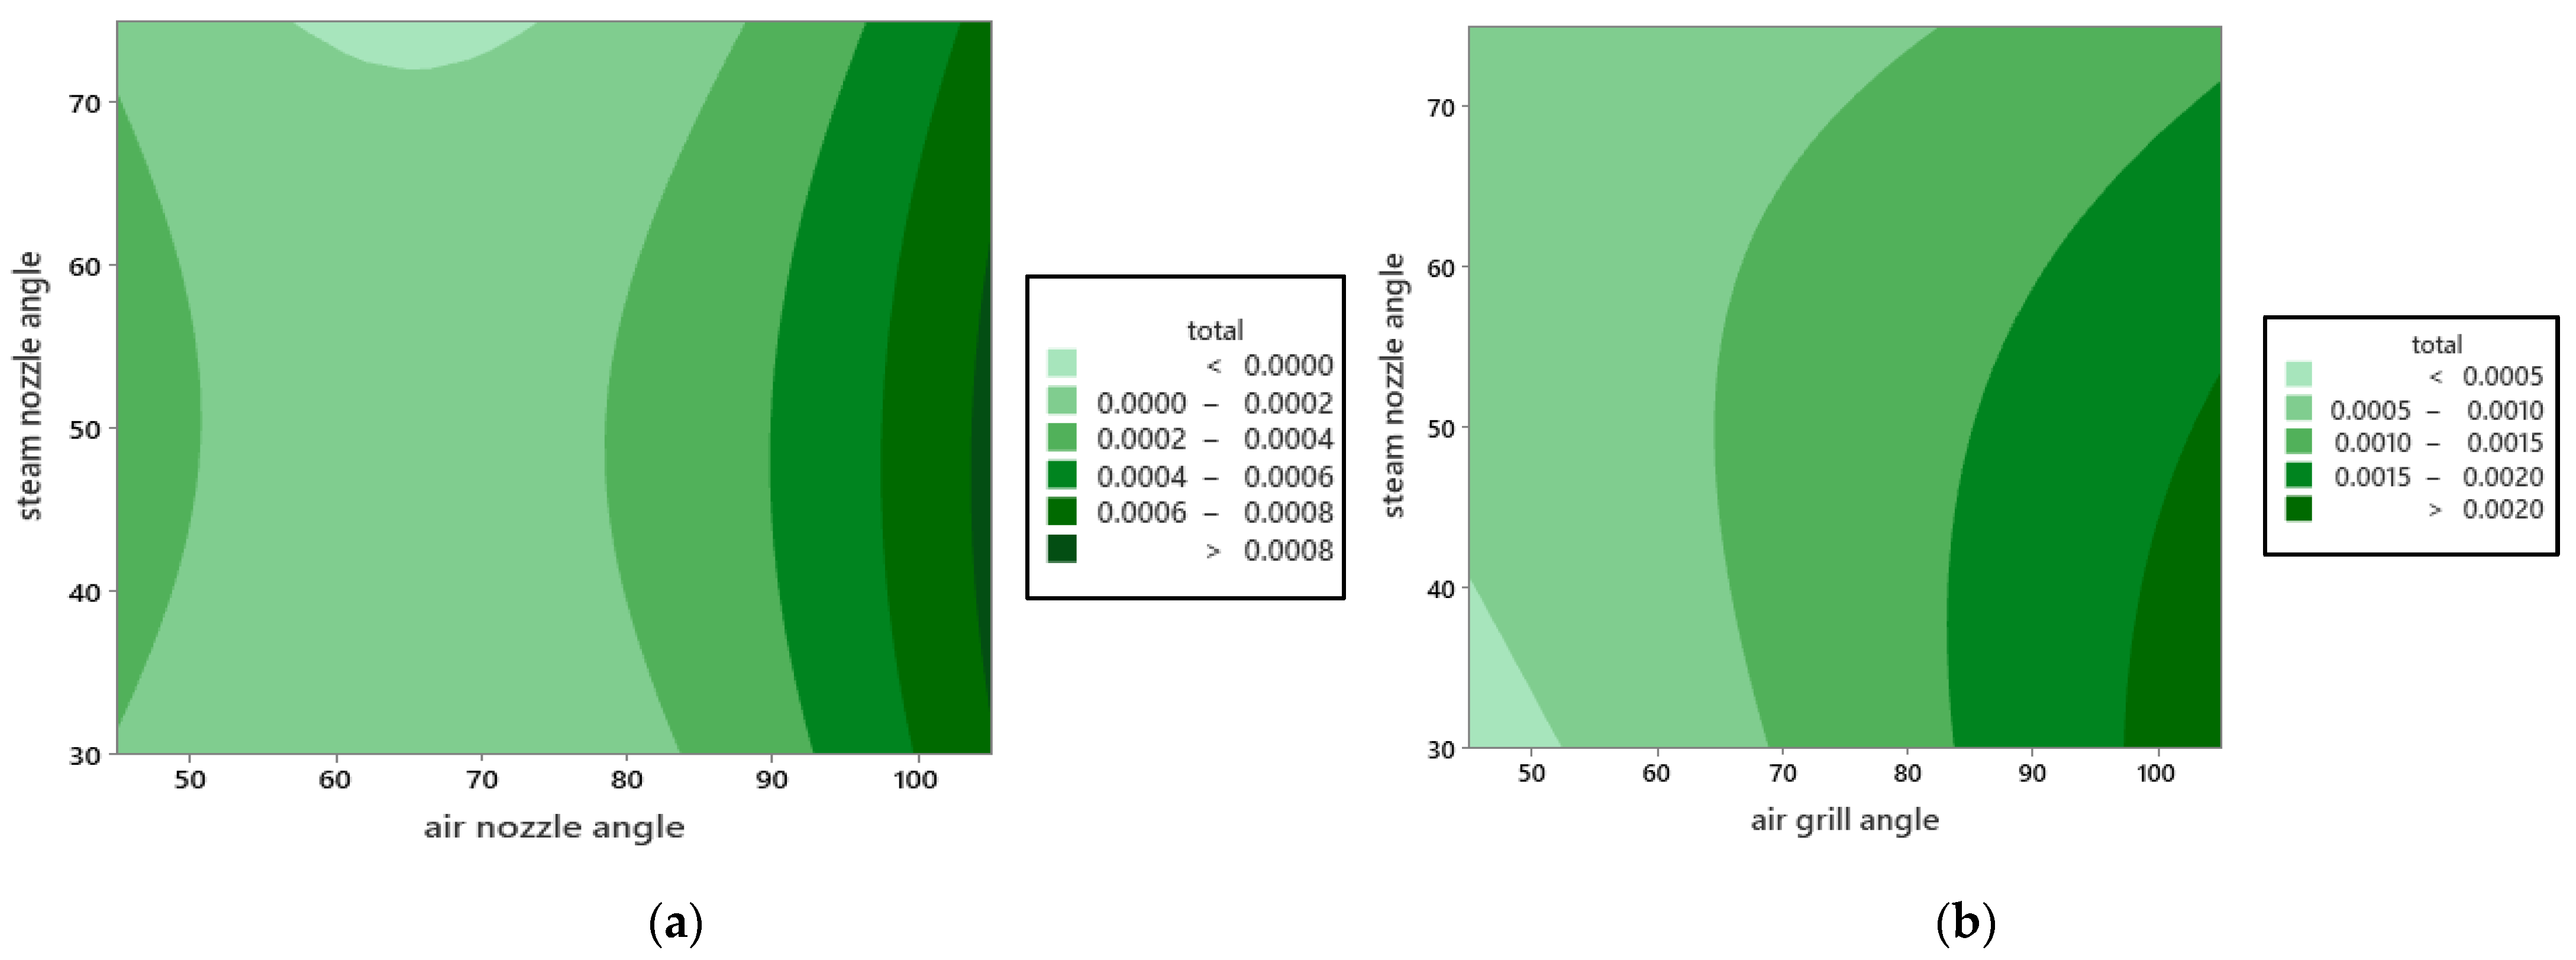
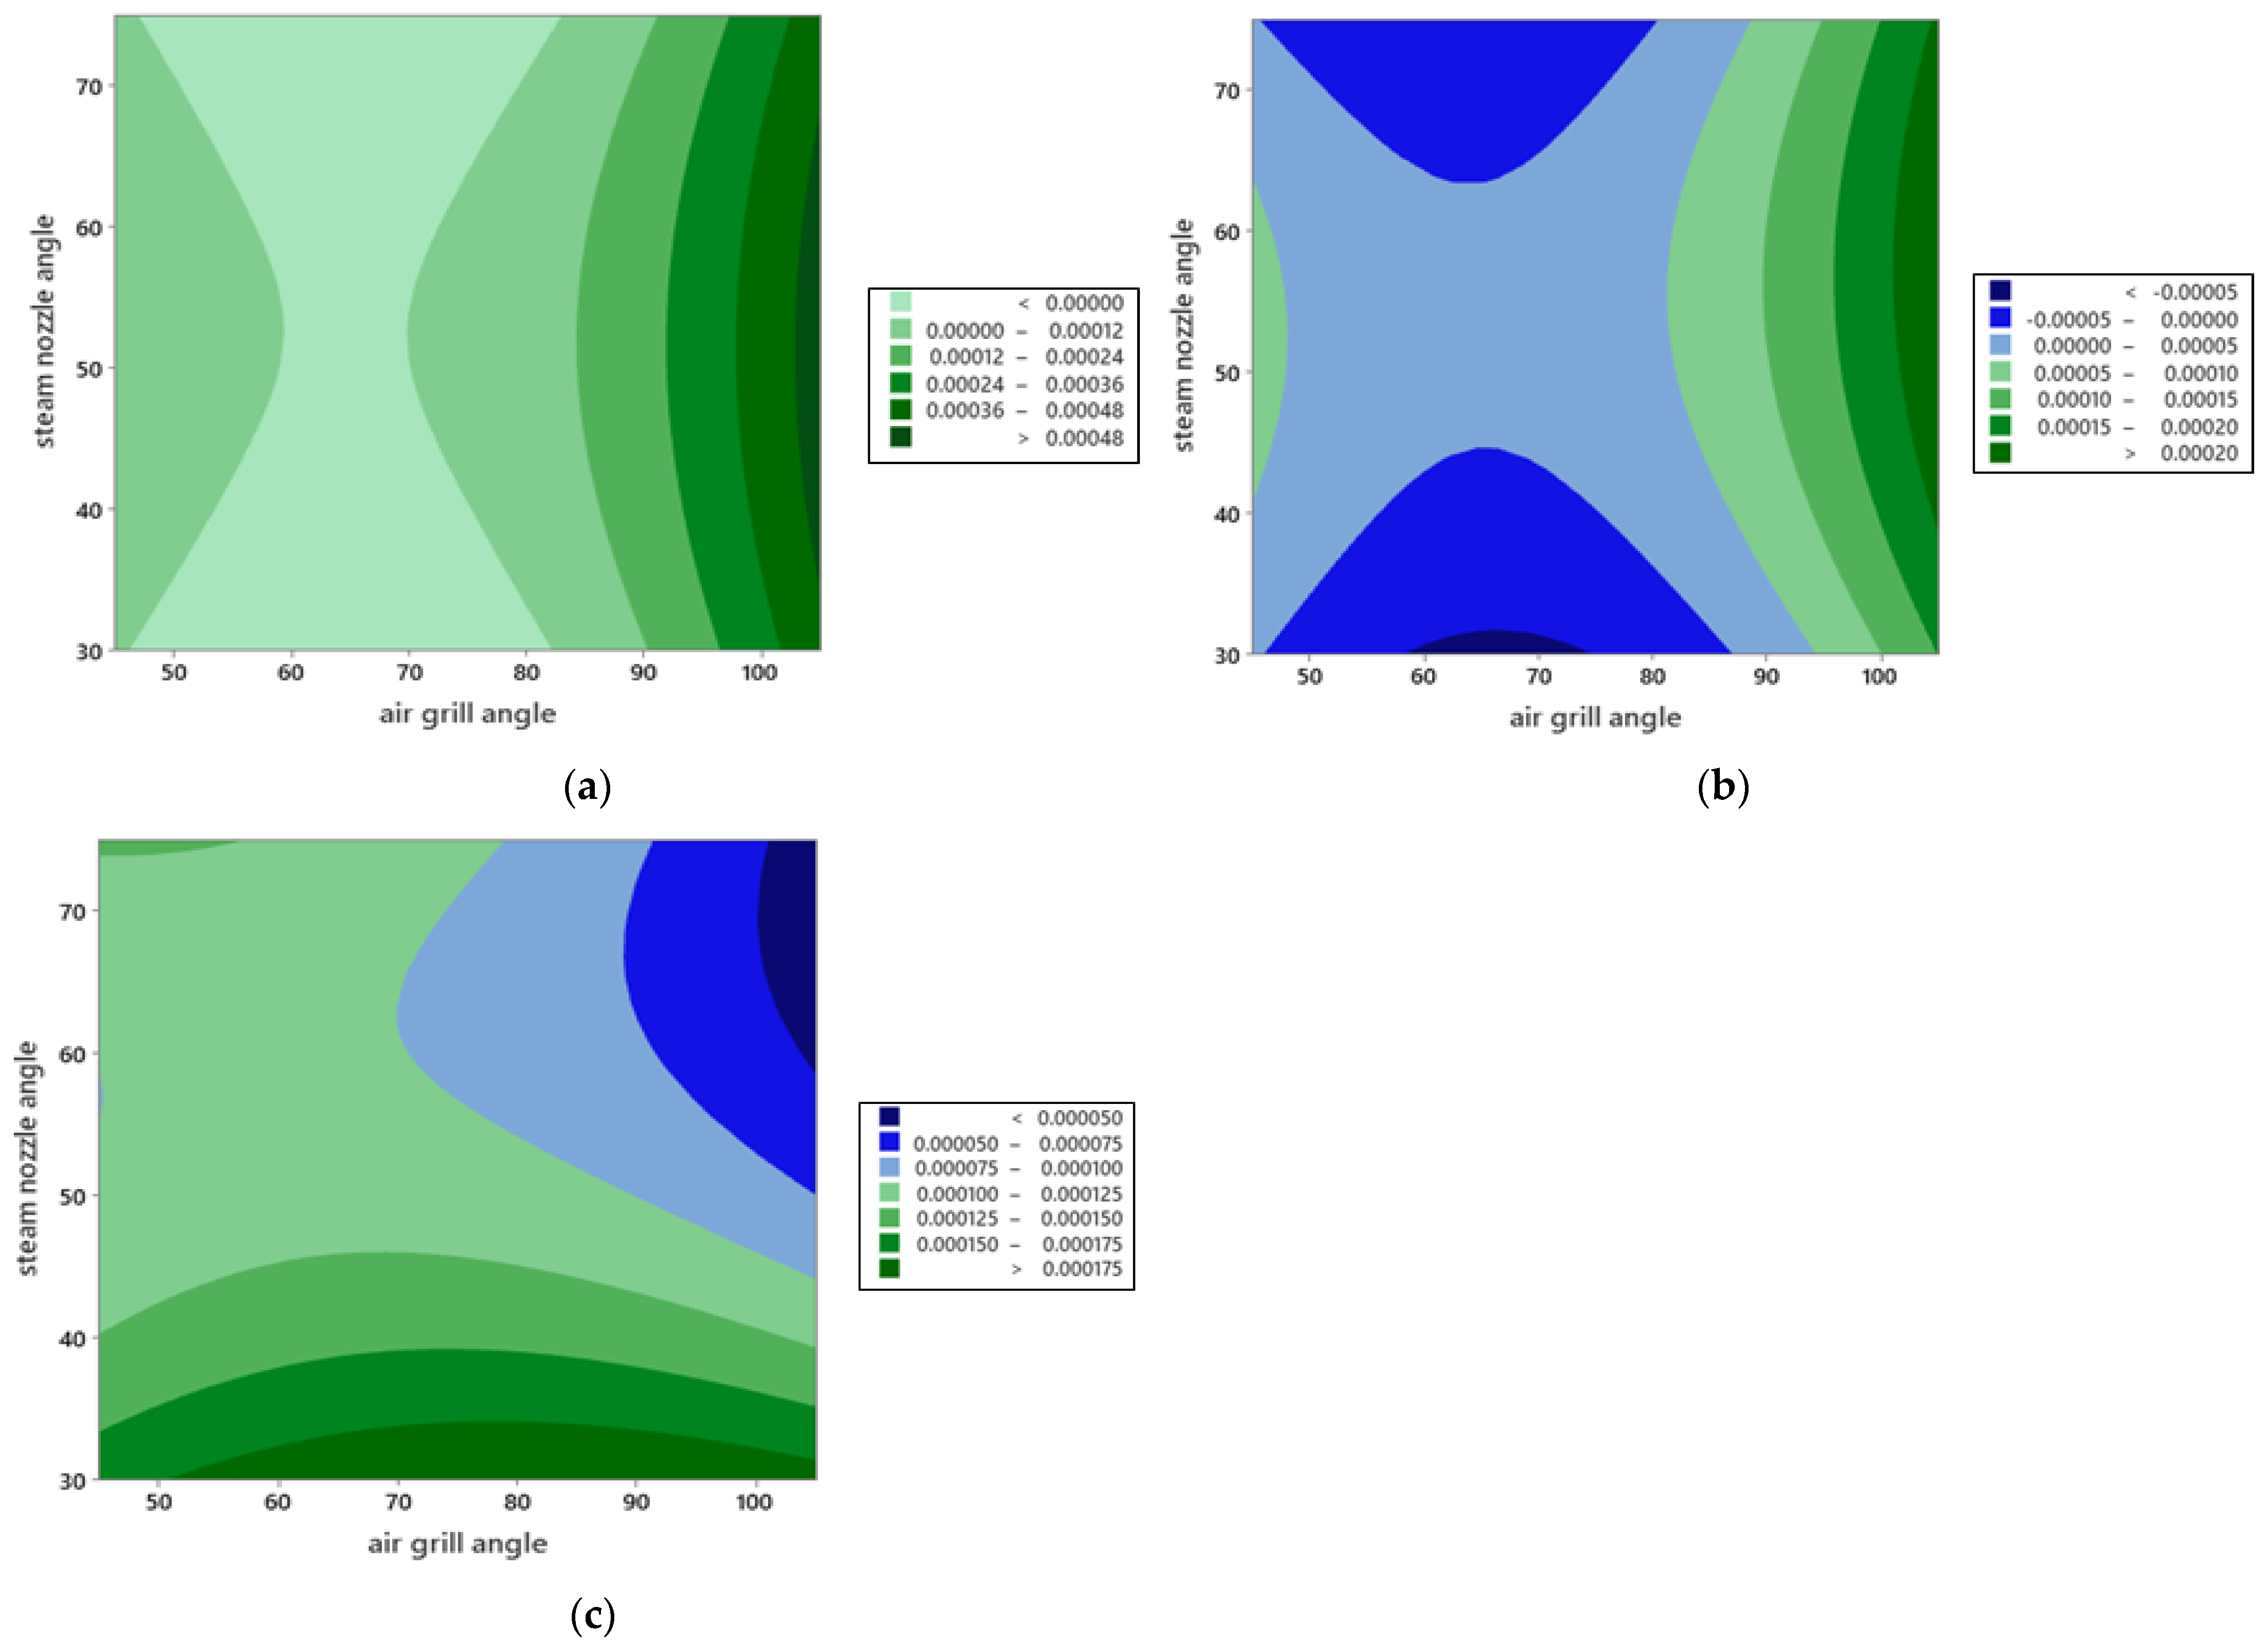
4.2. Regression Analysis

The response surface method is employed to conduct the regression analysis for the total mass flow rate of the steam and mixture (air and steam) through the towels. Correlations for the mass flow rate of the steam and mixture through all towels are formulated, as given in Equations (11)–(16). Here, subscripts t1, t2, and t3 represent towel 1, towel 2, and towel 3, respectively; the value of theta is in radians.
m t 1 ( m i x t u r e ) = 1.06 + 0.96   θ g + 1.51   θ n 0.091   θ g θ g 0.698   θ n θ n       0.252   θ g θ n
m t 2   ( m i x t u r e ) = 0.353 0.440   θ g 0.139   θ n + 0.599   θ g θ g + 0.547   θ n θ n 0.811 θ g θ n
m t 3   ( m i x t u r e ) = 1.59 + 1.23   θ g + 2.32   θ n 0.145   θ g θ g 1.002   θ n θ n 0.444   θ g θ n
m t 1     ( s t e a m ) = 0.799 2.426   θ g + 1.22   θ n + 1.092   θ g θ g 0.643   θ n θ n + 0.039   θ g θ n
m t 2   ( s t e a m ) = 0.325 1.115   θ g + 0.669   θ n + 0.465   θ g θ g 0.398   θ n θ n + 0.071   θ g θ n
m t 3     ( s t e a m ) = 0.201 + 0.307   θ g 0.480   θ n 0.084   θ g θ g + 0.293   θ n θ n     0.133   θ g θ n
Based on the computed correlations, the variation of total mass flow rates of the steam and mixture passing through all towels is shown in Figure 18. The contours show a strong dependence of the mass flow rate over the air grill angle. At a small grill angle, a reduced mass flow rate of the air–steam mixture flows through the towels; however, as the air grill angle increases by approximately 85, the mass flow rate rises significantly. The steam flow rate appears to be independent of the nozzle angle; nonetheless, the mixture flow rate decreased at higher nozzle angles.
The mass flow variation in each towel as a function of the air grill angle and steam nozzle angle is plotted in Figure 19 and Figure 20. Towel 1 shows the highest amount of mass flow rate passing through, followed by towel 2 and towel 3. This can be attributed to the reduction in intensity of the steam plumes as they cross through the towels. In addition, the steam mass flow through towel 1 to 3 demonstrates diverse behaviour; towel 3 and towel 2 show strong reliance on the air grill angle with a higher flow rate at higher angles; conversely, towel 1 presents a distinct trend with no significant variation caused by the air grill angle.
The air–steam mass flow distribution through different towels is presented in Figure 20. All three towels present an intensified mass flow that occurred with a large air grill angle and small steam nozzle angle. Moreover, towel 1 and 3 demonstrated somewhat identical trends with a higher mass flow compared to towel 2.

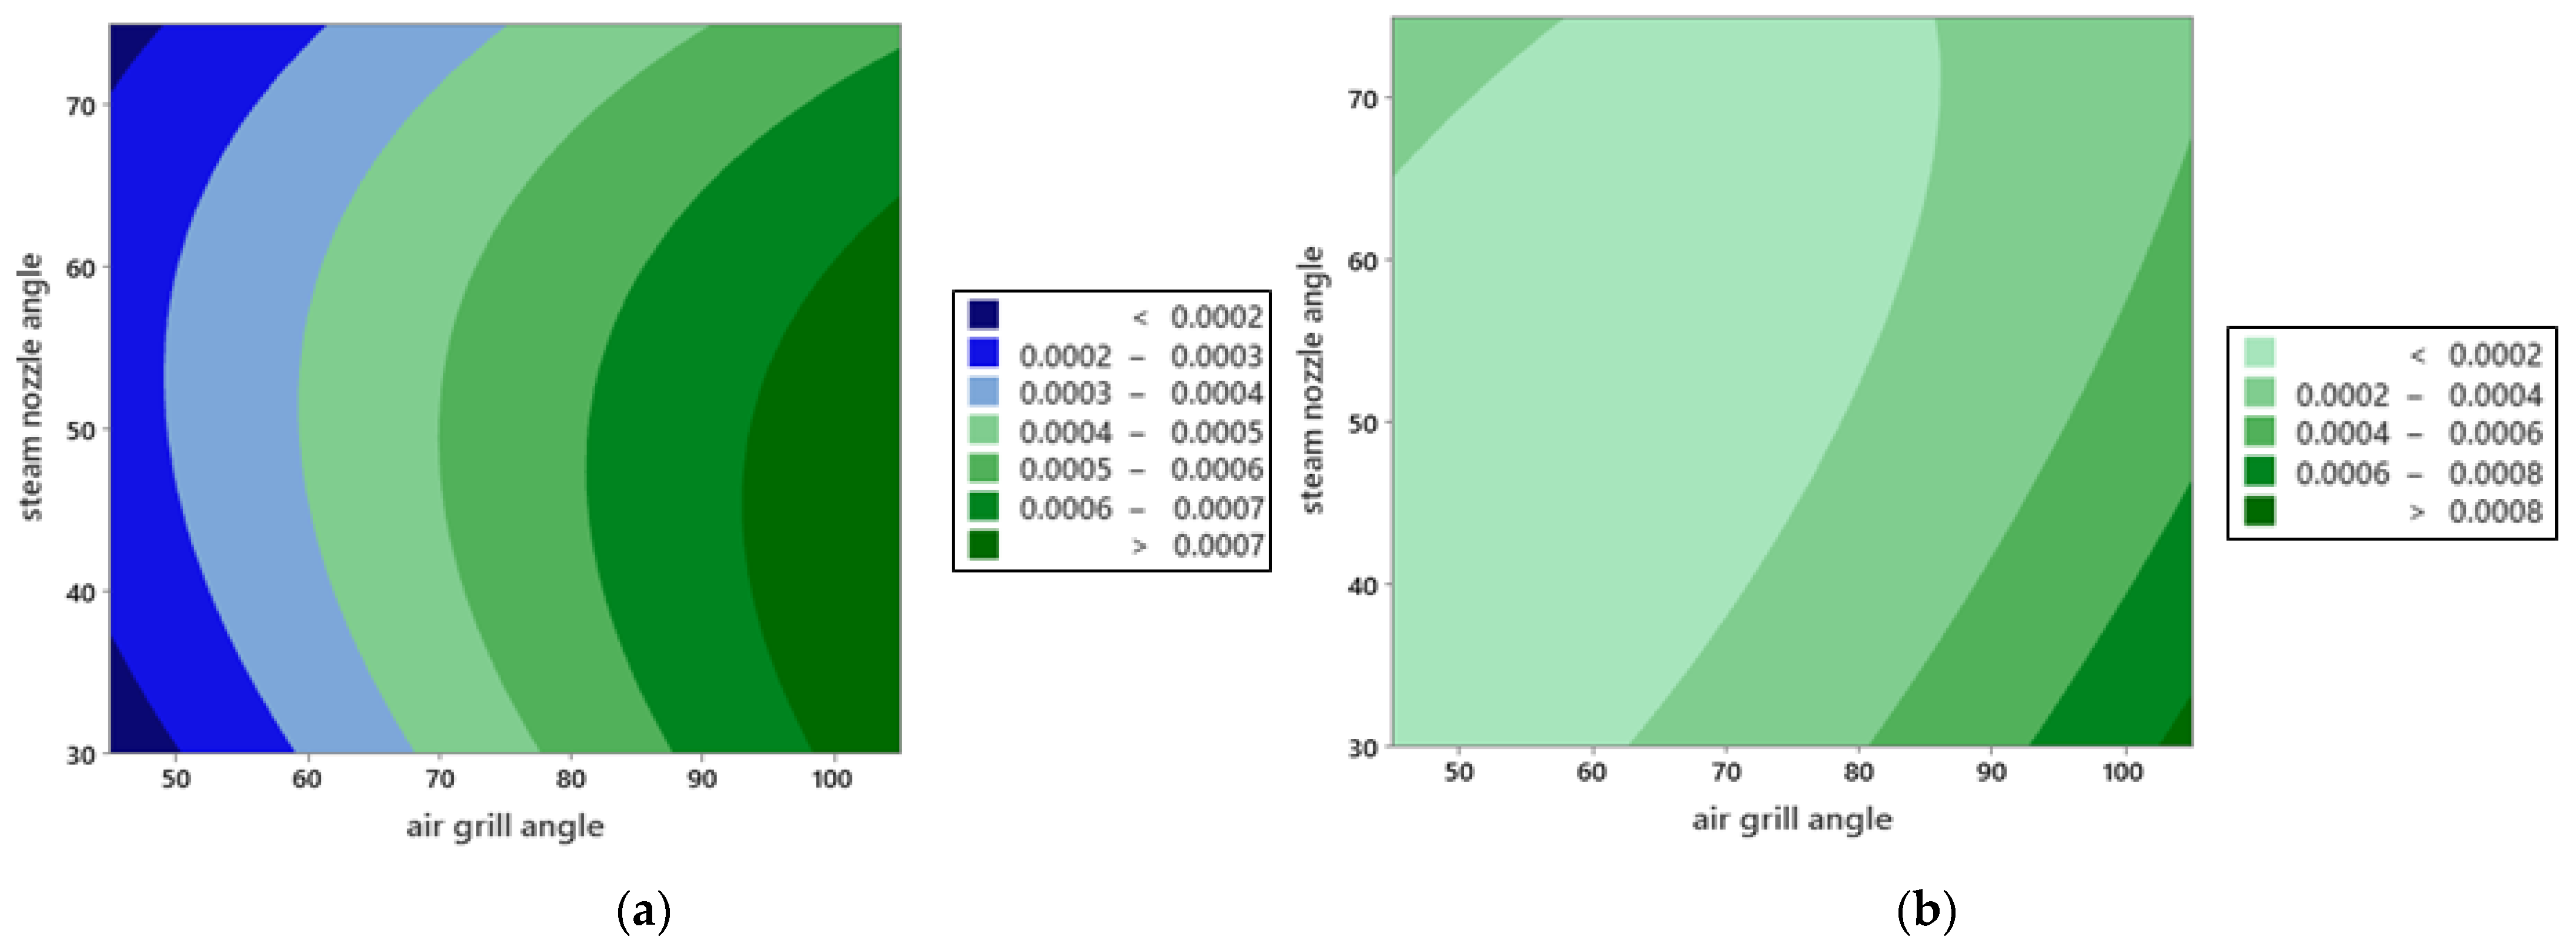
4.3. Design Optimisation

The objective of the study was to optimise the flow rate of the steam and mixture through the towels based on the set of equations formulated by the regression analysis of the numerical data. Therefore, the multiobjective genetic algorithm optimisation study based on the computed relations was conducted, where the upper and lower bounds of the design parameters are given as below.
LB = [45, 30]
 UB = [105, 75]
The Pareto front of the two objection functions is shown in Figure 21 and the Pareto front data is listed in Table 3. Optimisation results suggest that the maximum flow rate of the steam and mixture is associated with the values of the air grill angle and steam nozzle angle of 105° and 45°, respectively.

5. Conclusions

The flow field in a clothes-conditioning unit (CCU) was solved numerically to optimise the moisture distribution to clothes inside the clothing chamber. A two-phase Eulerian–Eulerian model with a k ω SST turbulence model was employed to solve the computational flow domain such that the clothes were modelled as porous media. A systematic study was performed to investigate the impact of geometric parameters, with the air grill angle and steam nozzle angle utilising the design of the experiments based on the central composite design method. The response surface method was employed for regression analysis and the genetic algorithm was incorporated to optimise the moisture passing through the clothes. The findings of the study can be concluded as:
  • Variation of both the air grill angle and steam nozzle angle resulted in variation of flow distributed to the clothes inside the clothing chamber of a CCU.
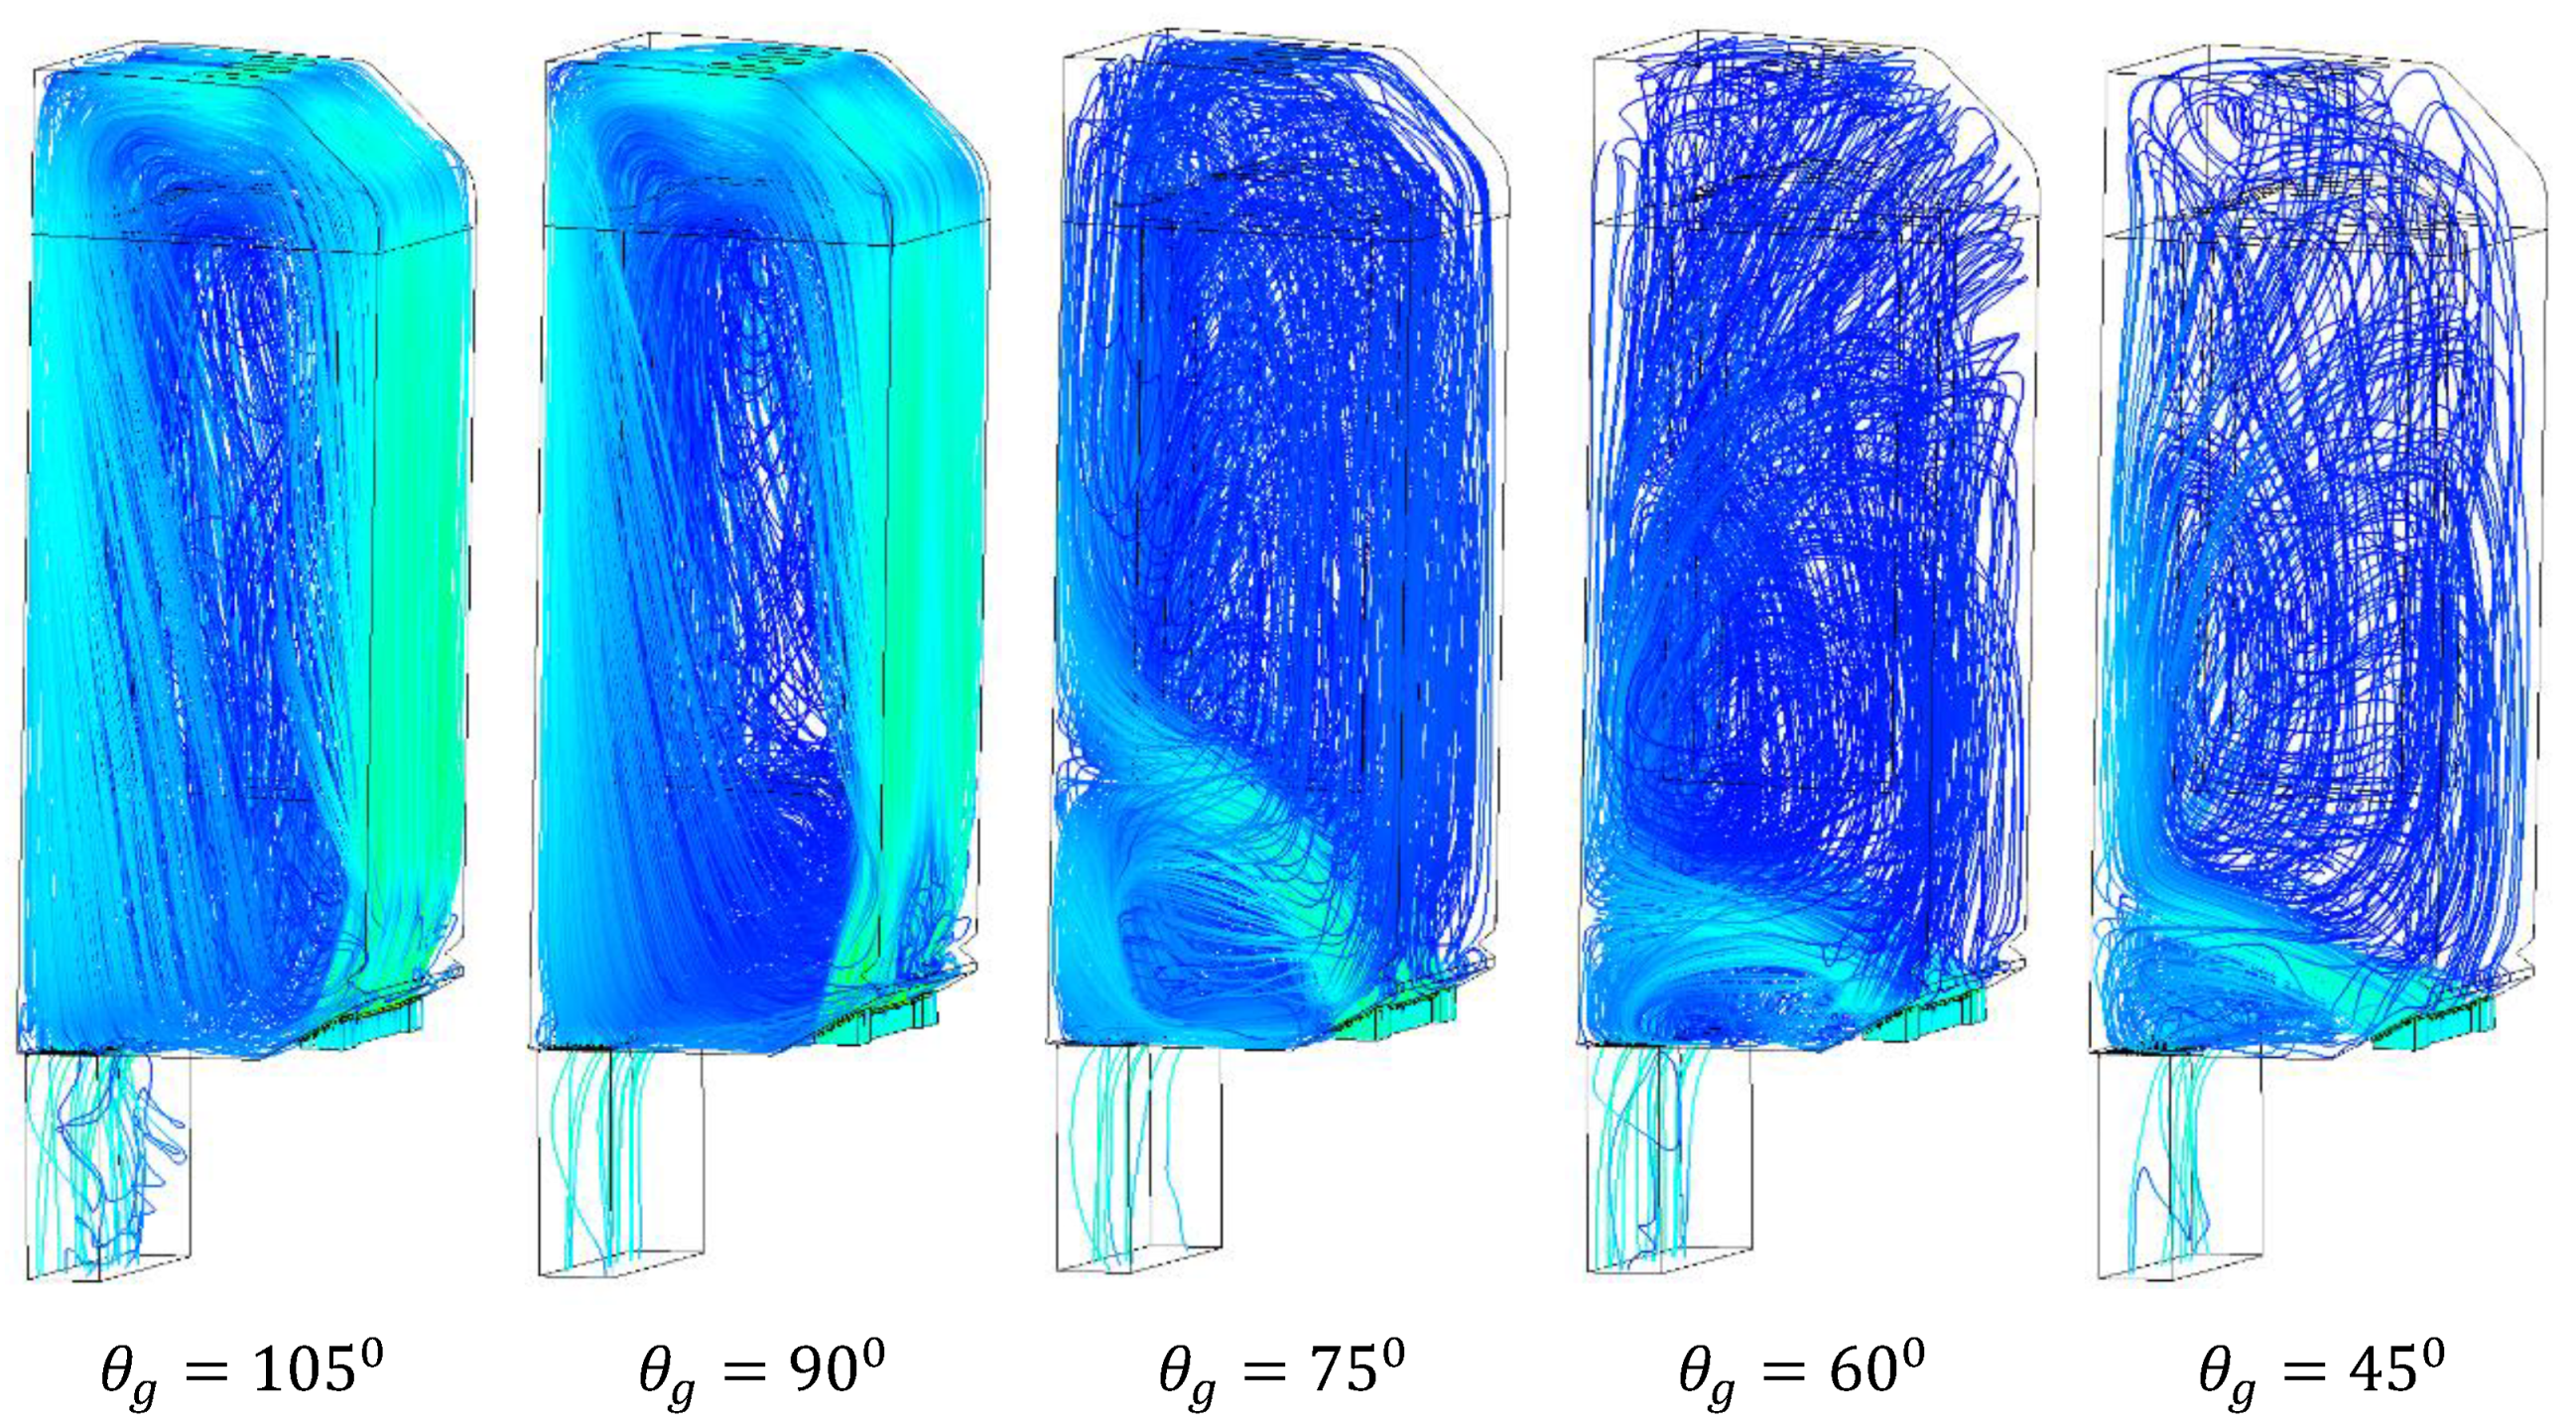
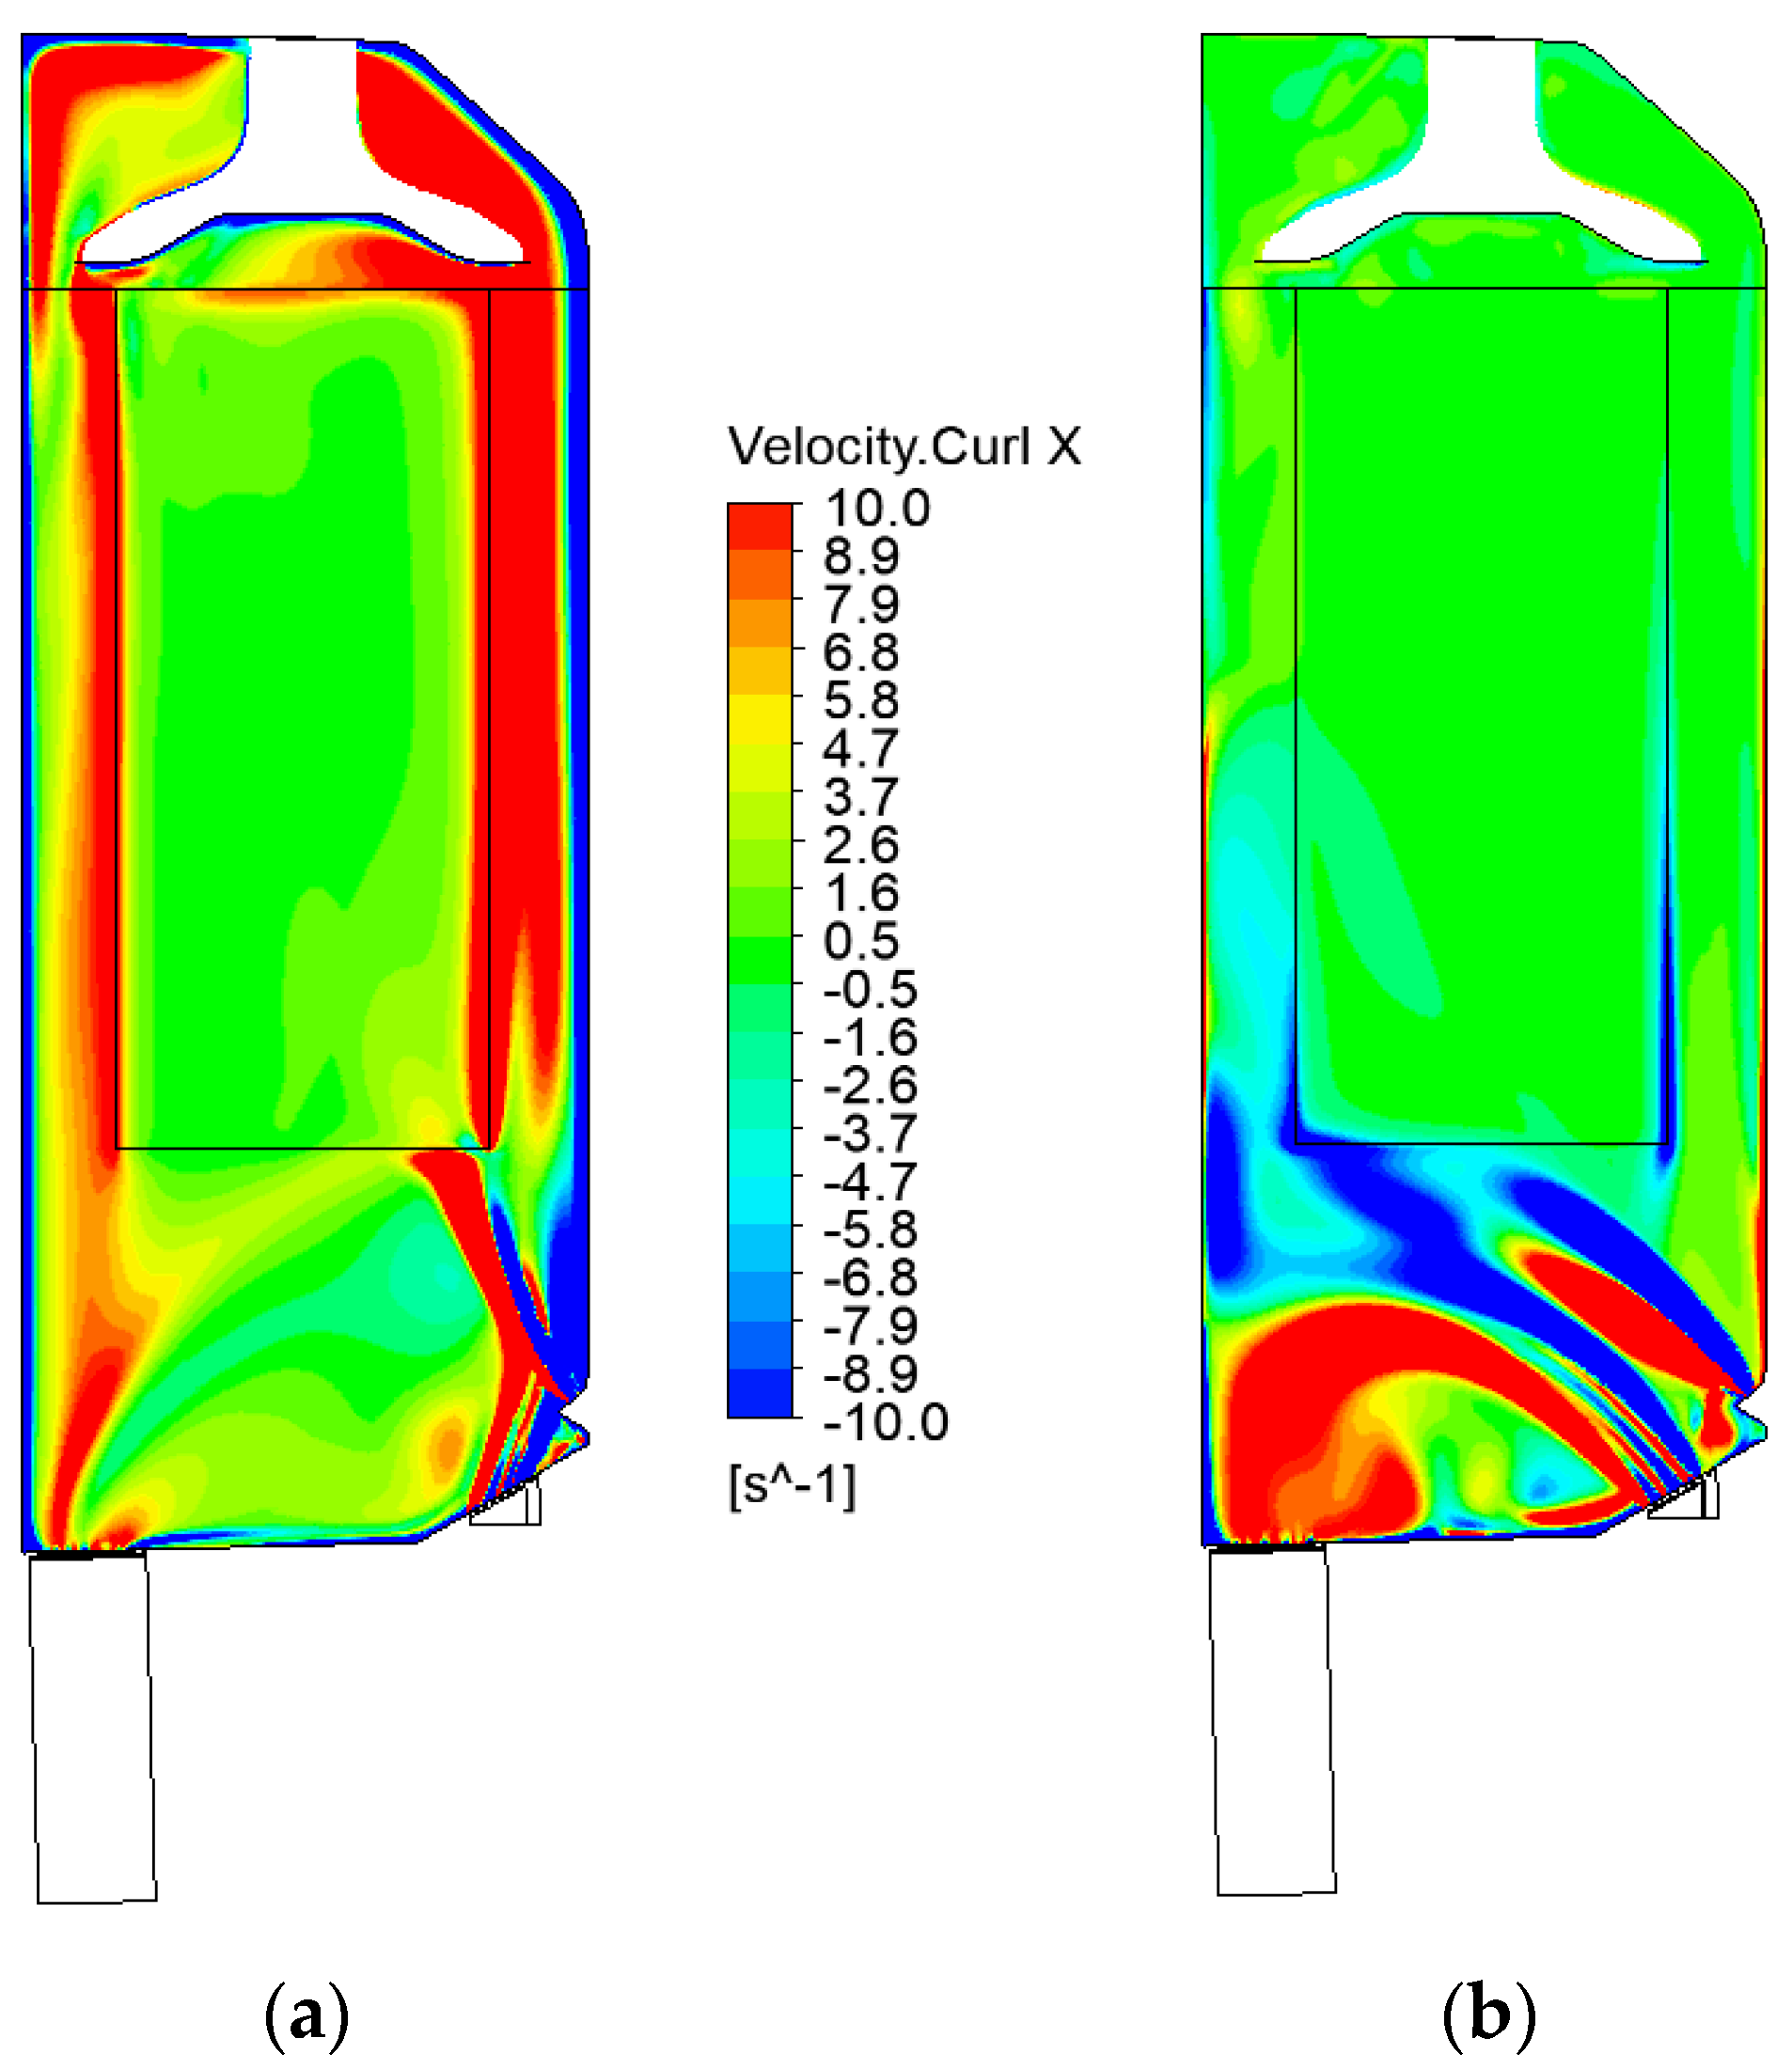
  • A clockwise flow circulation in the clothing chamber was observed at small air grill angles (45–75°); however, an opposite trend (anticlockwise circulation) appeared at higher grill angles (90–105°).
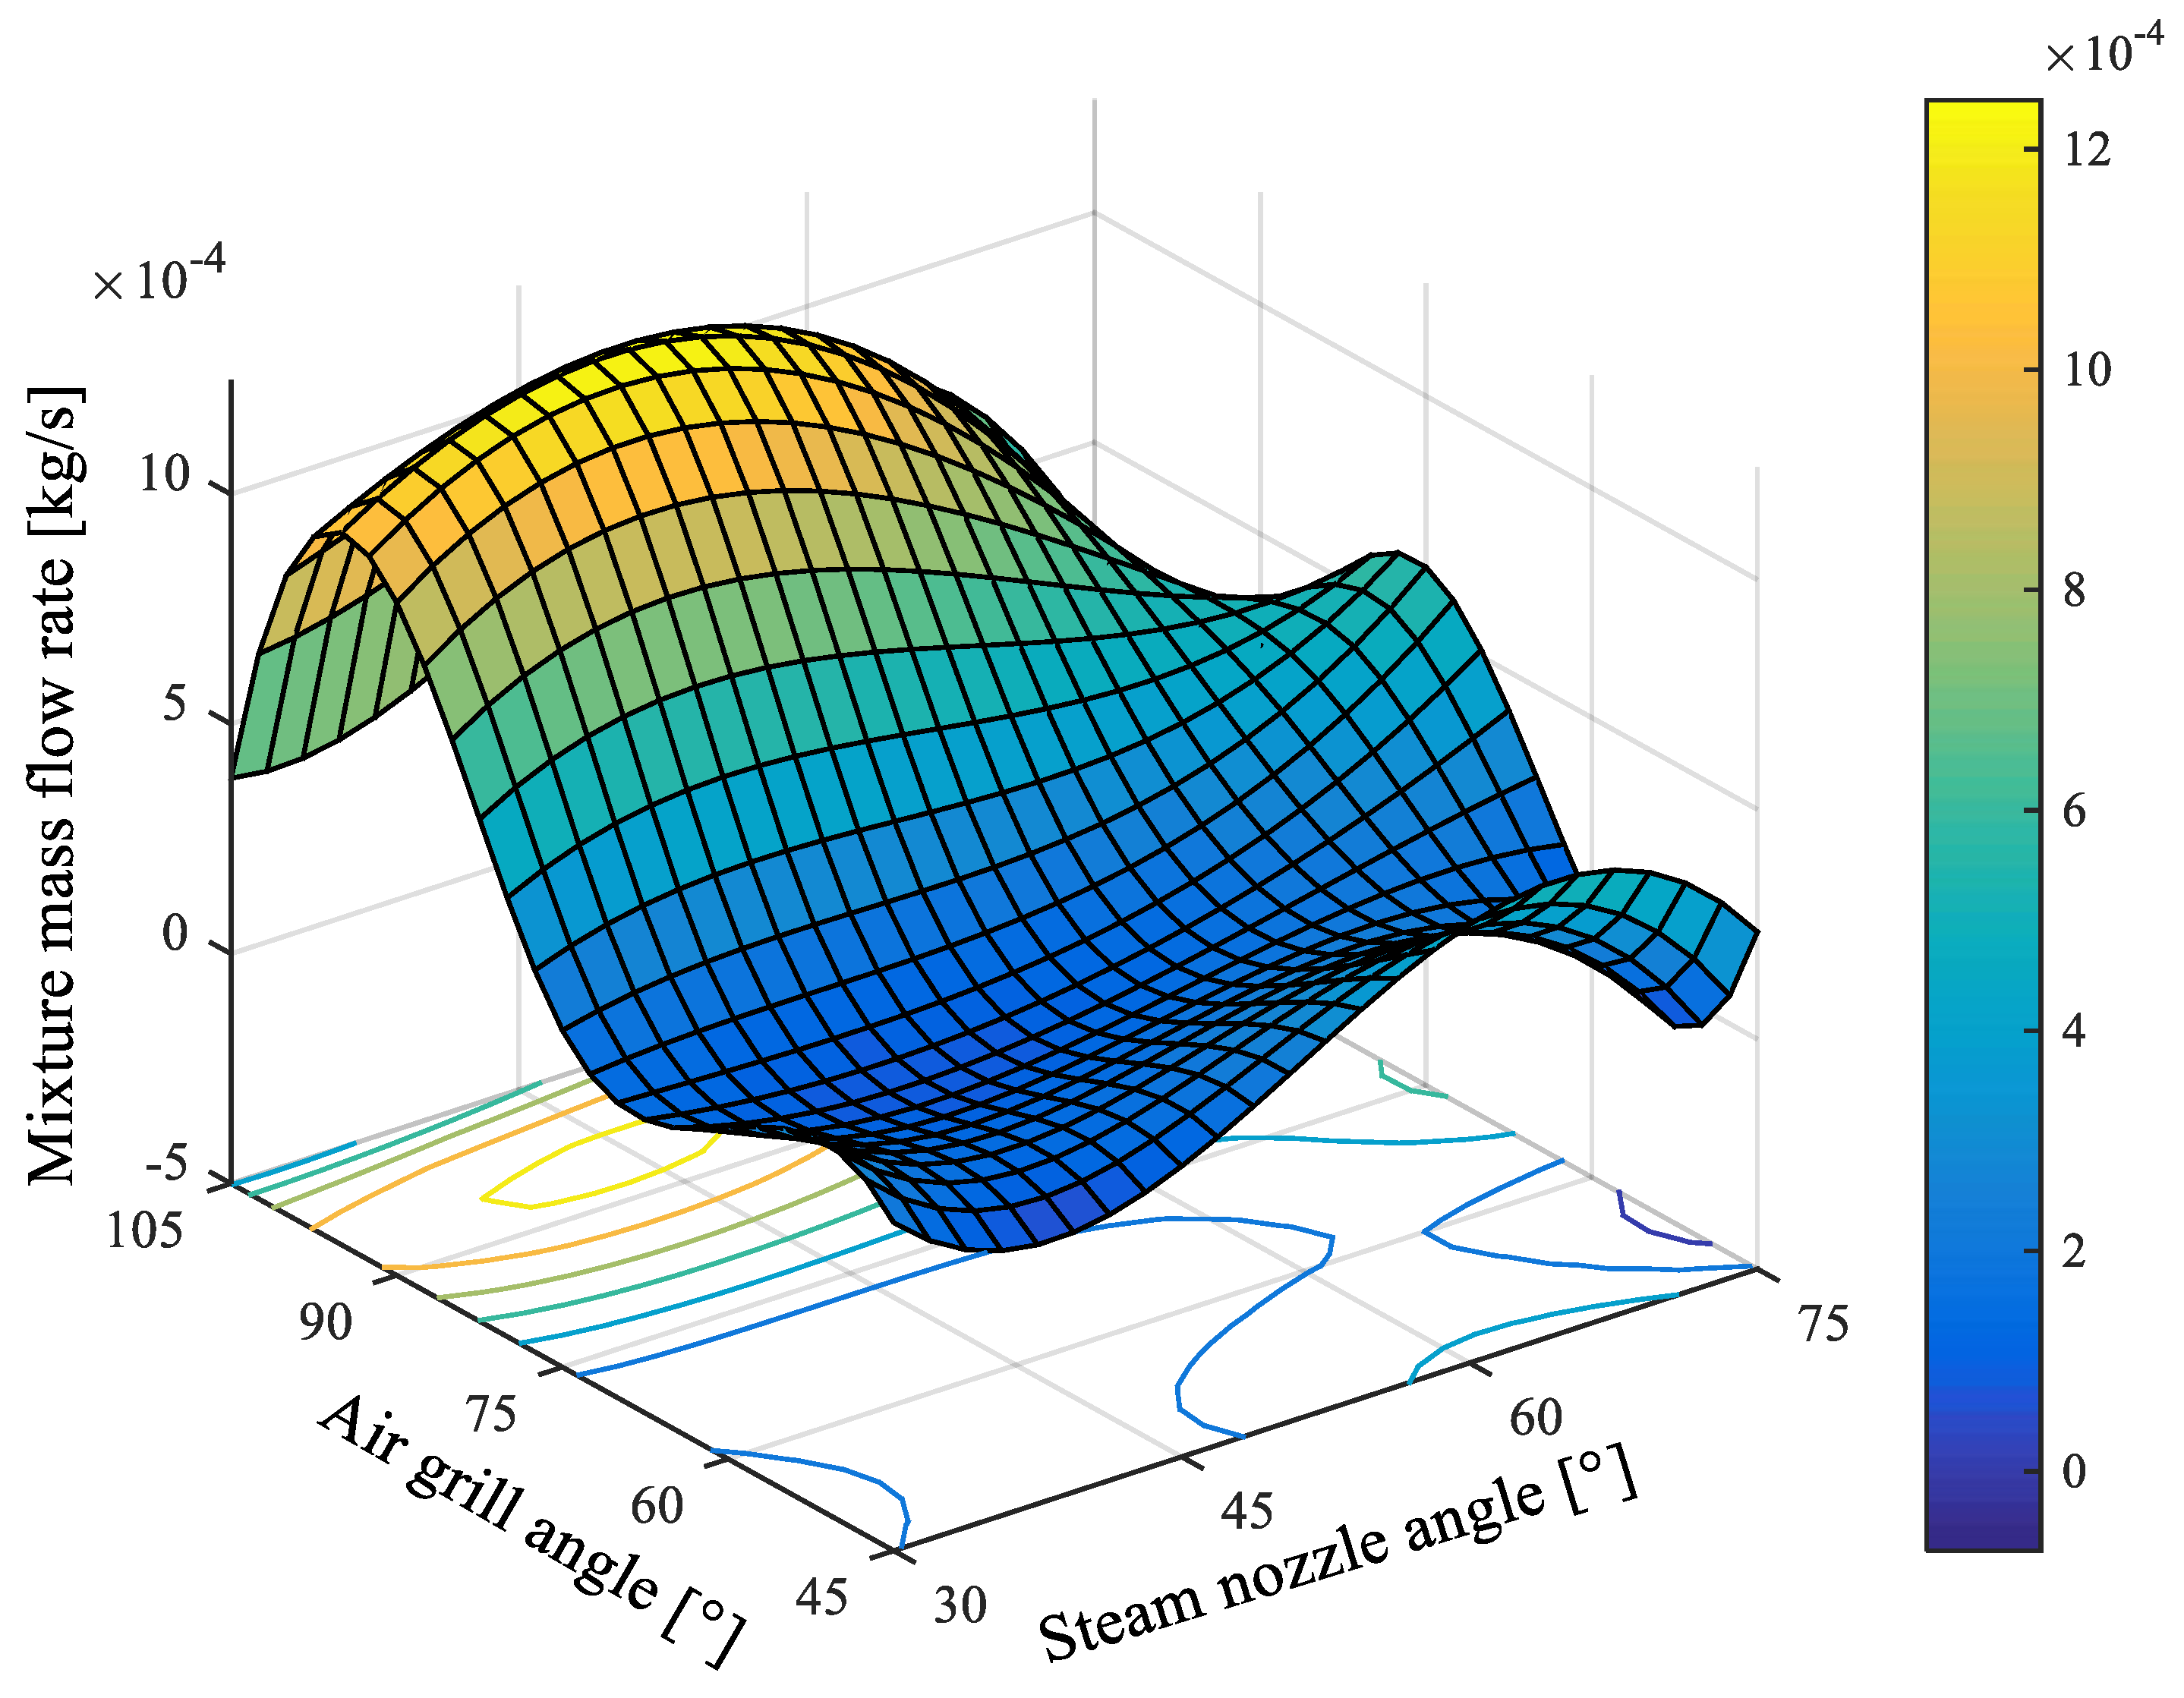
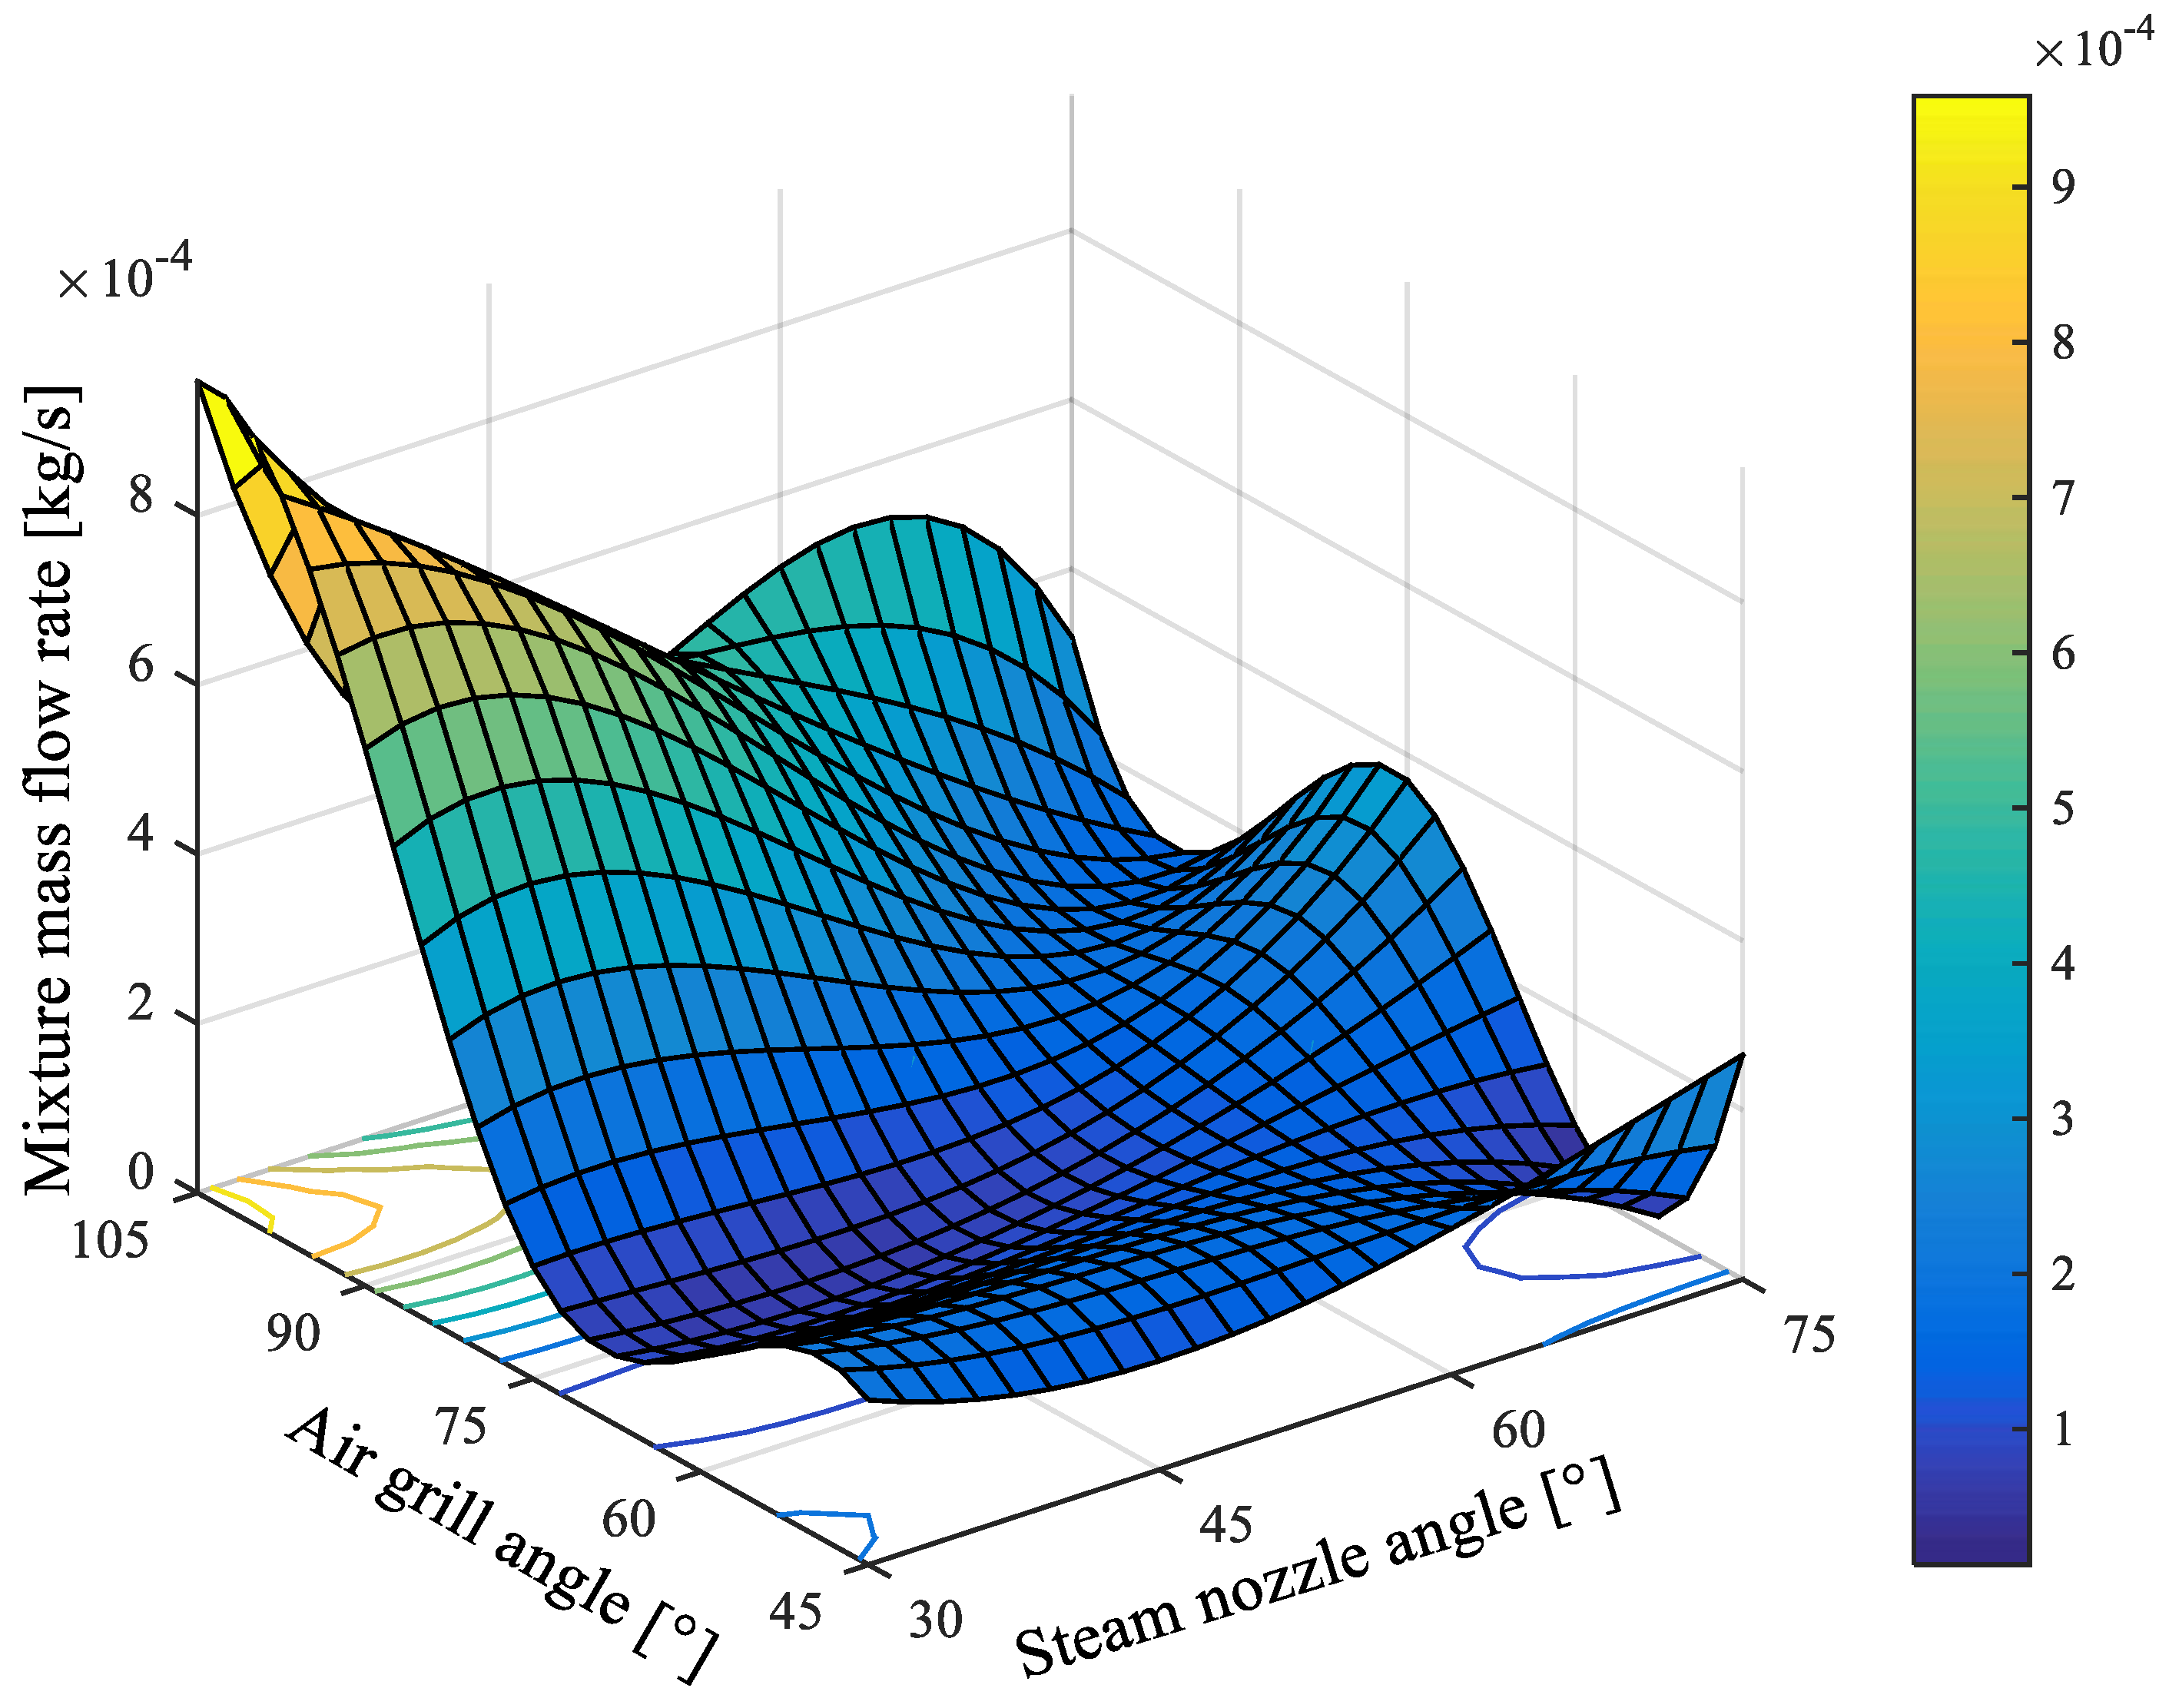
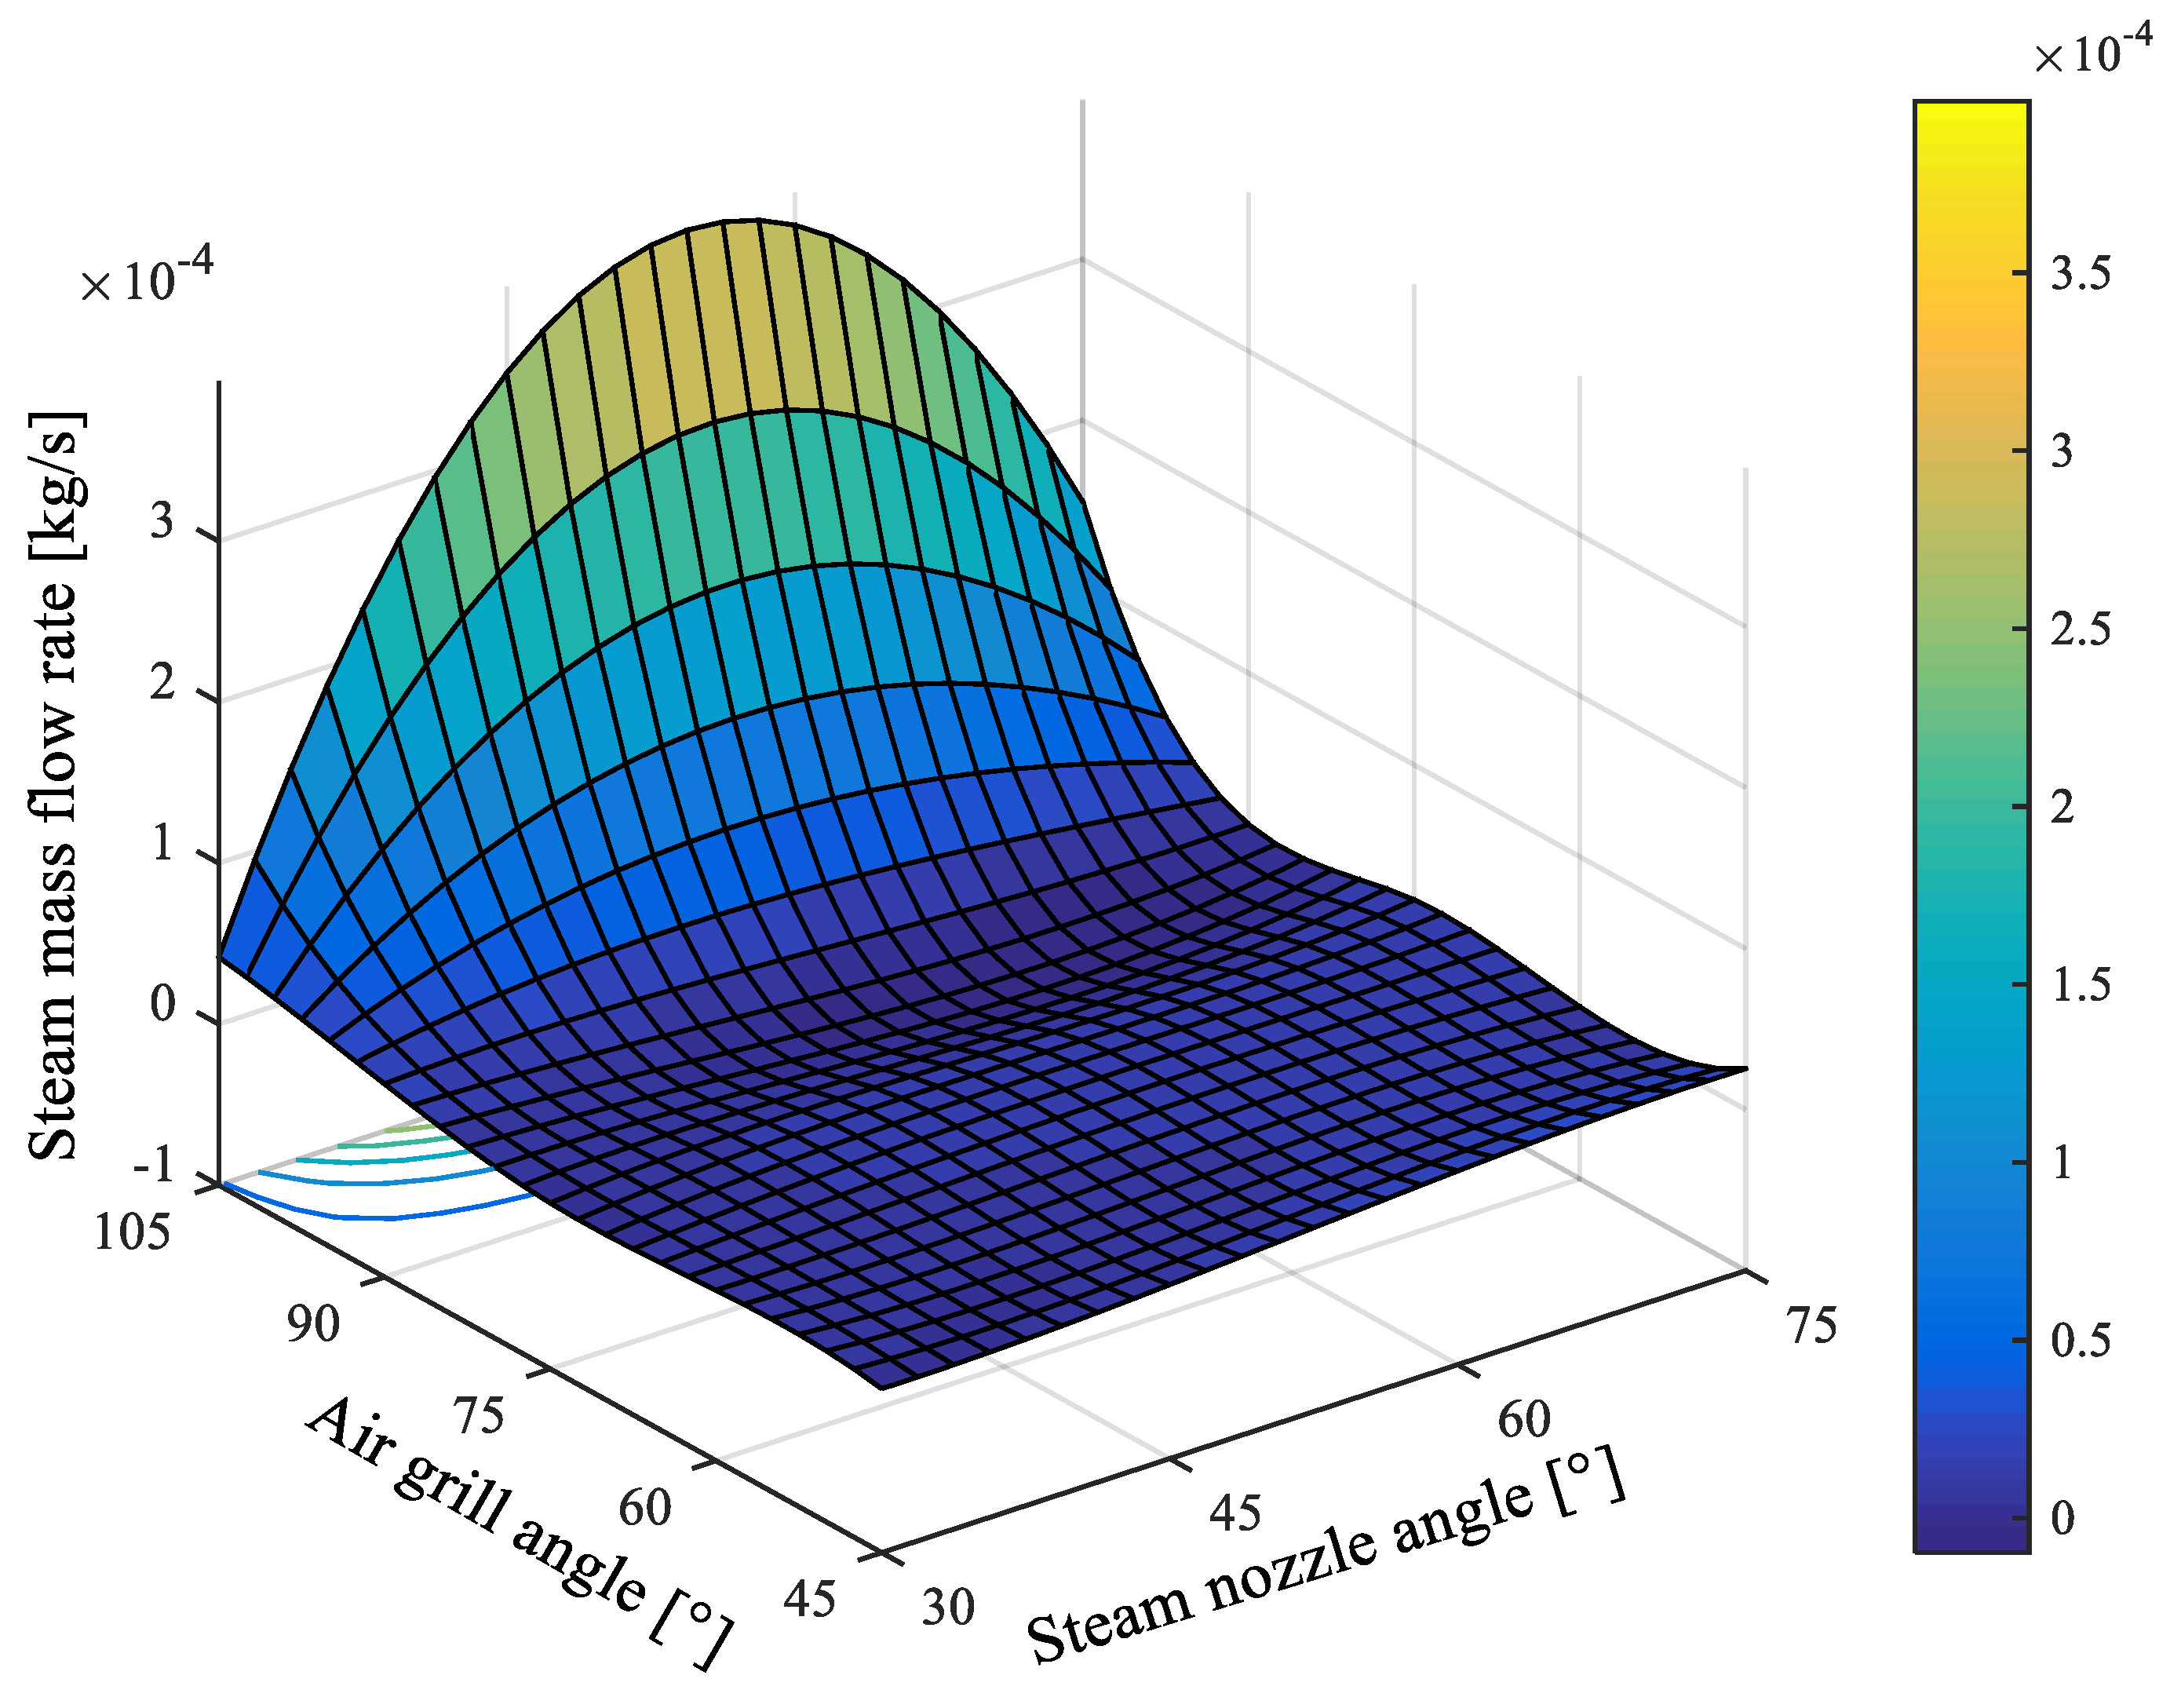
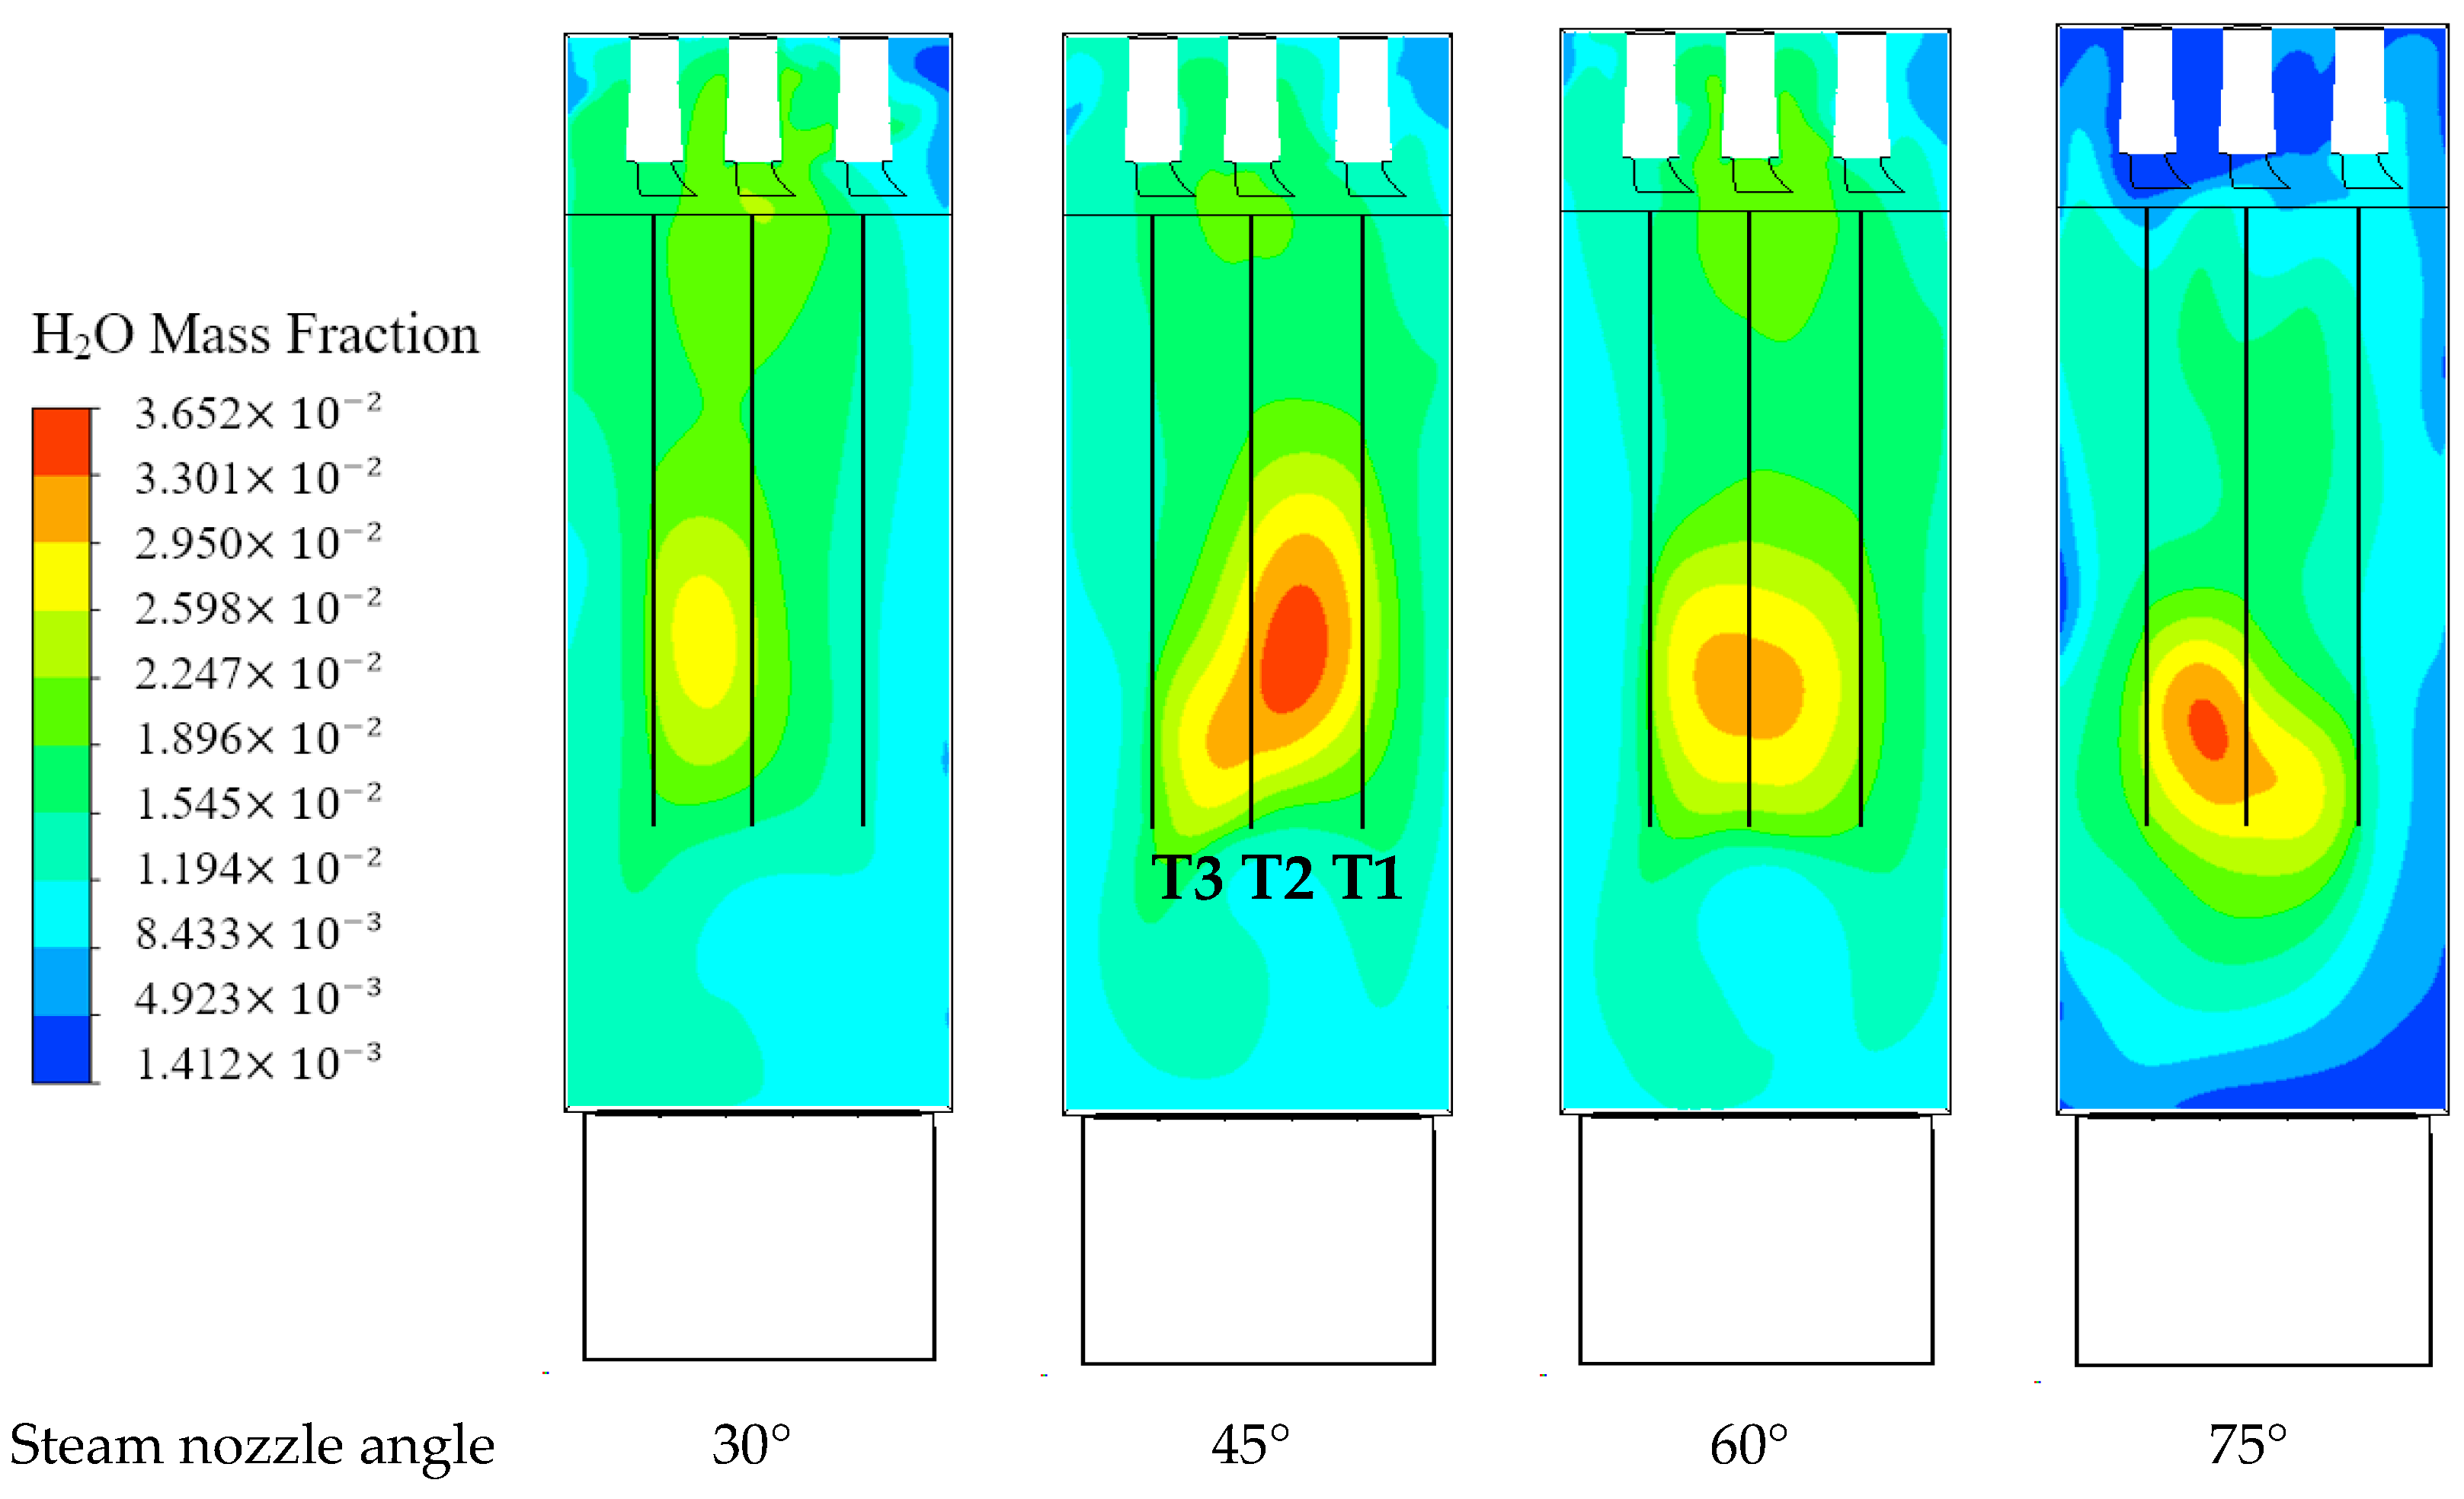
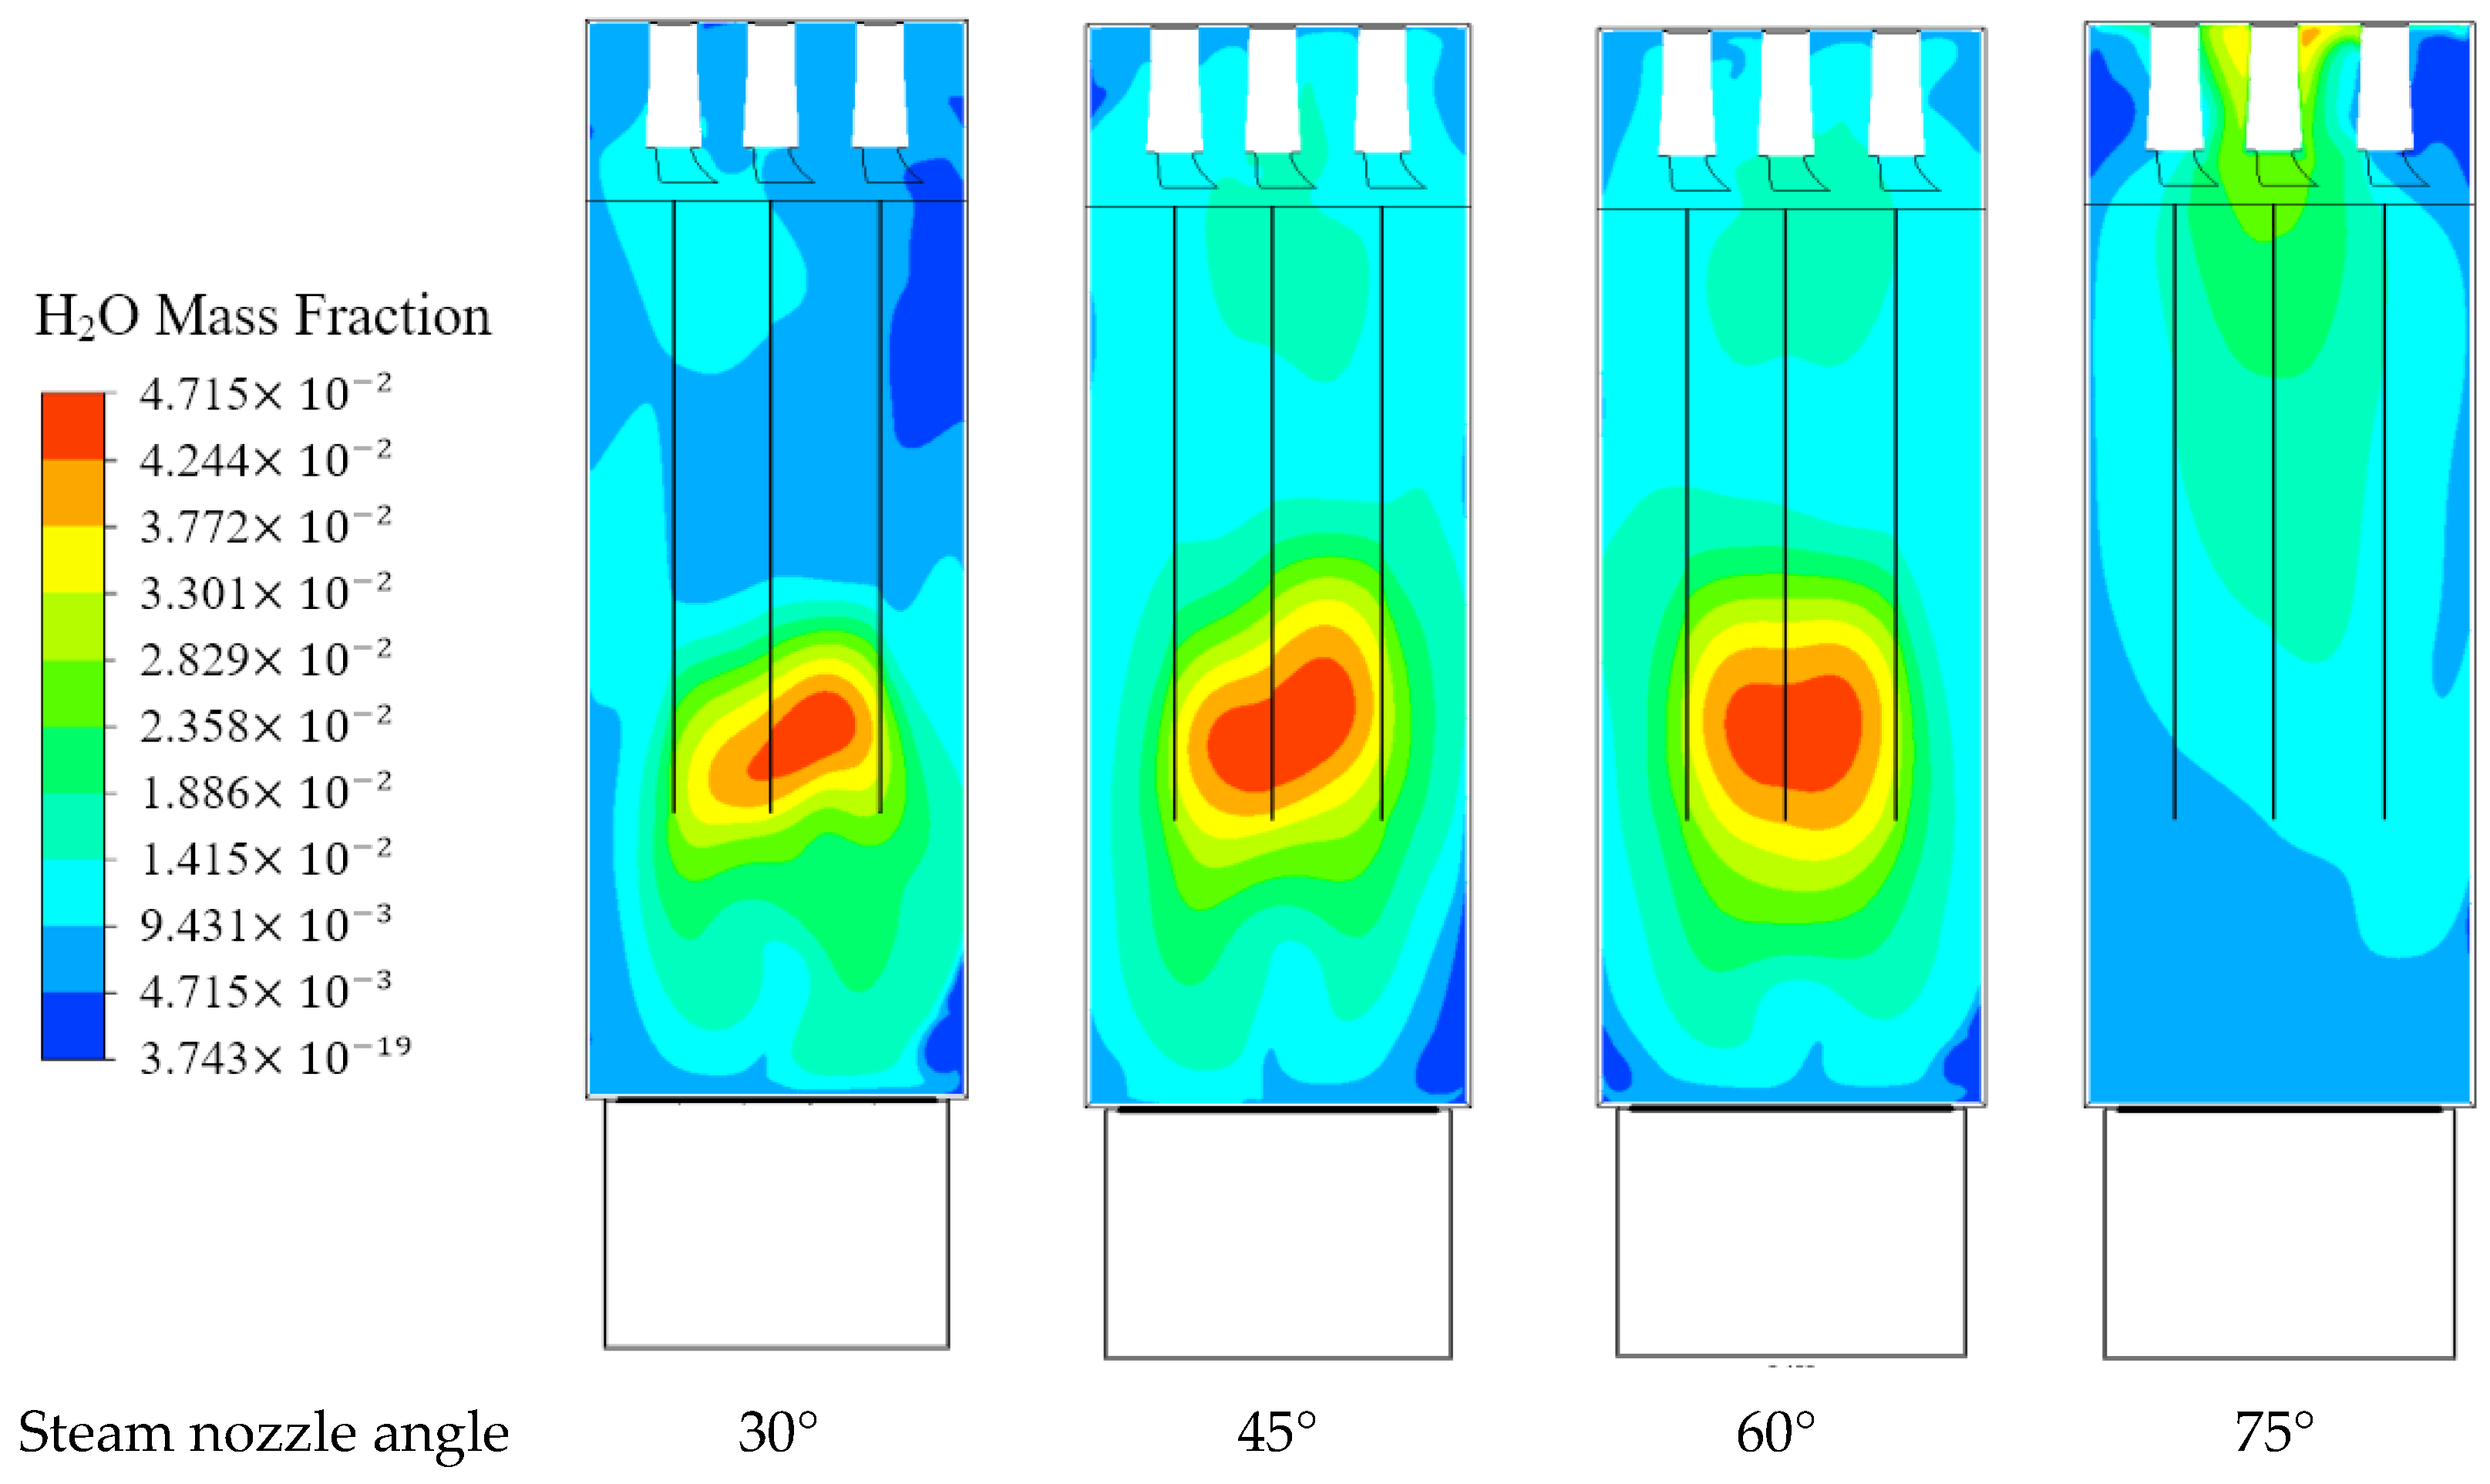
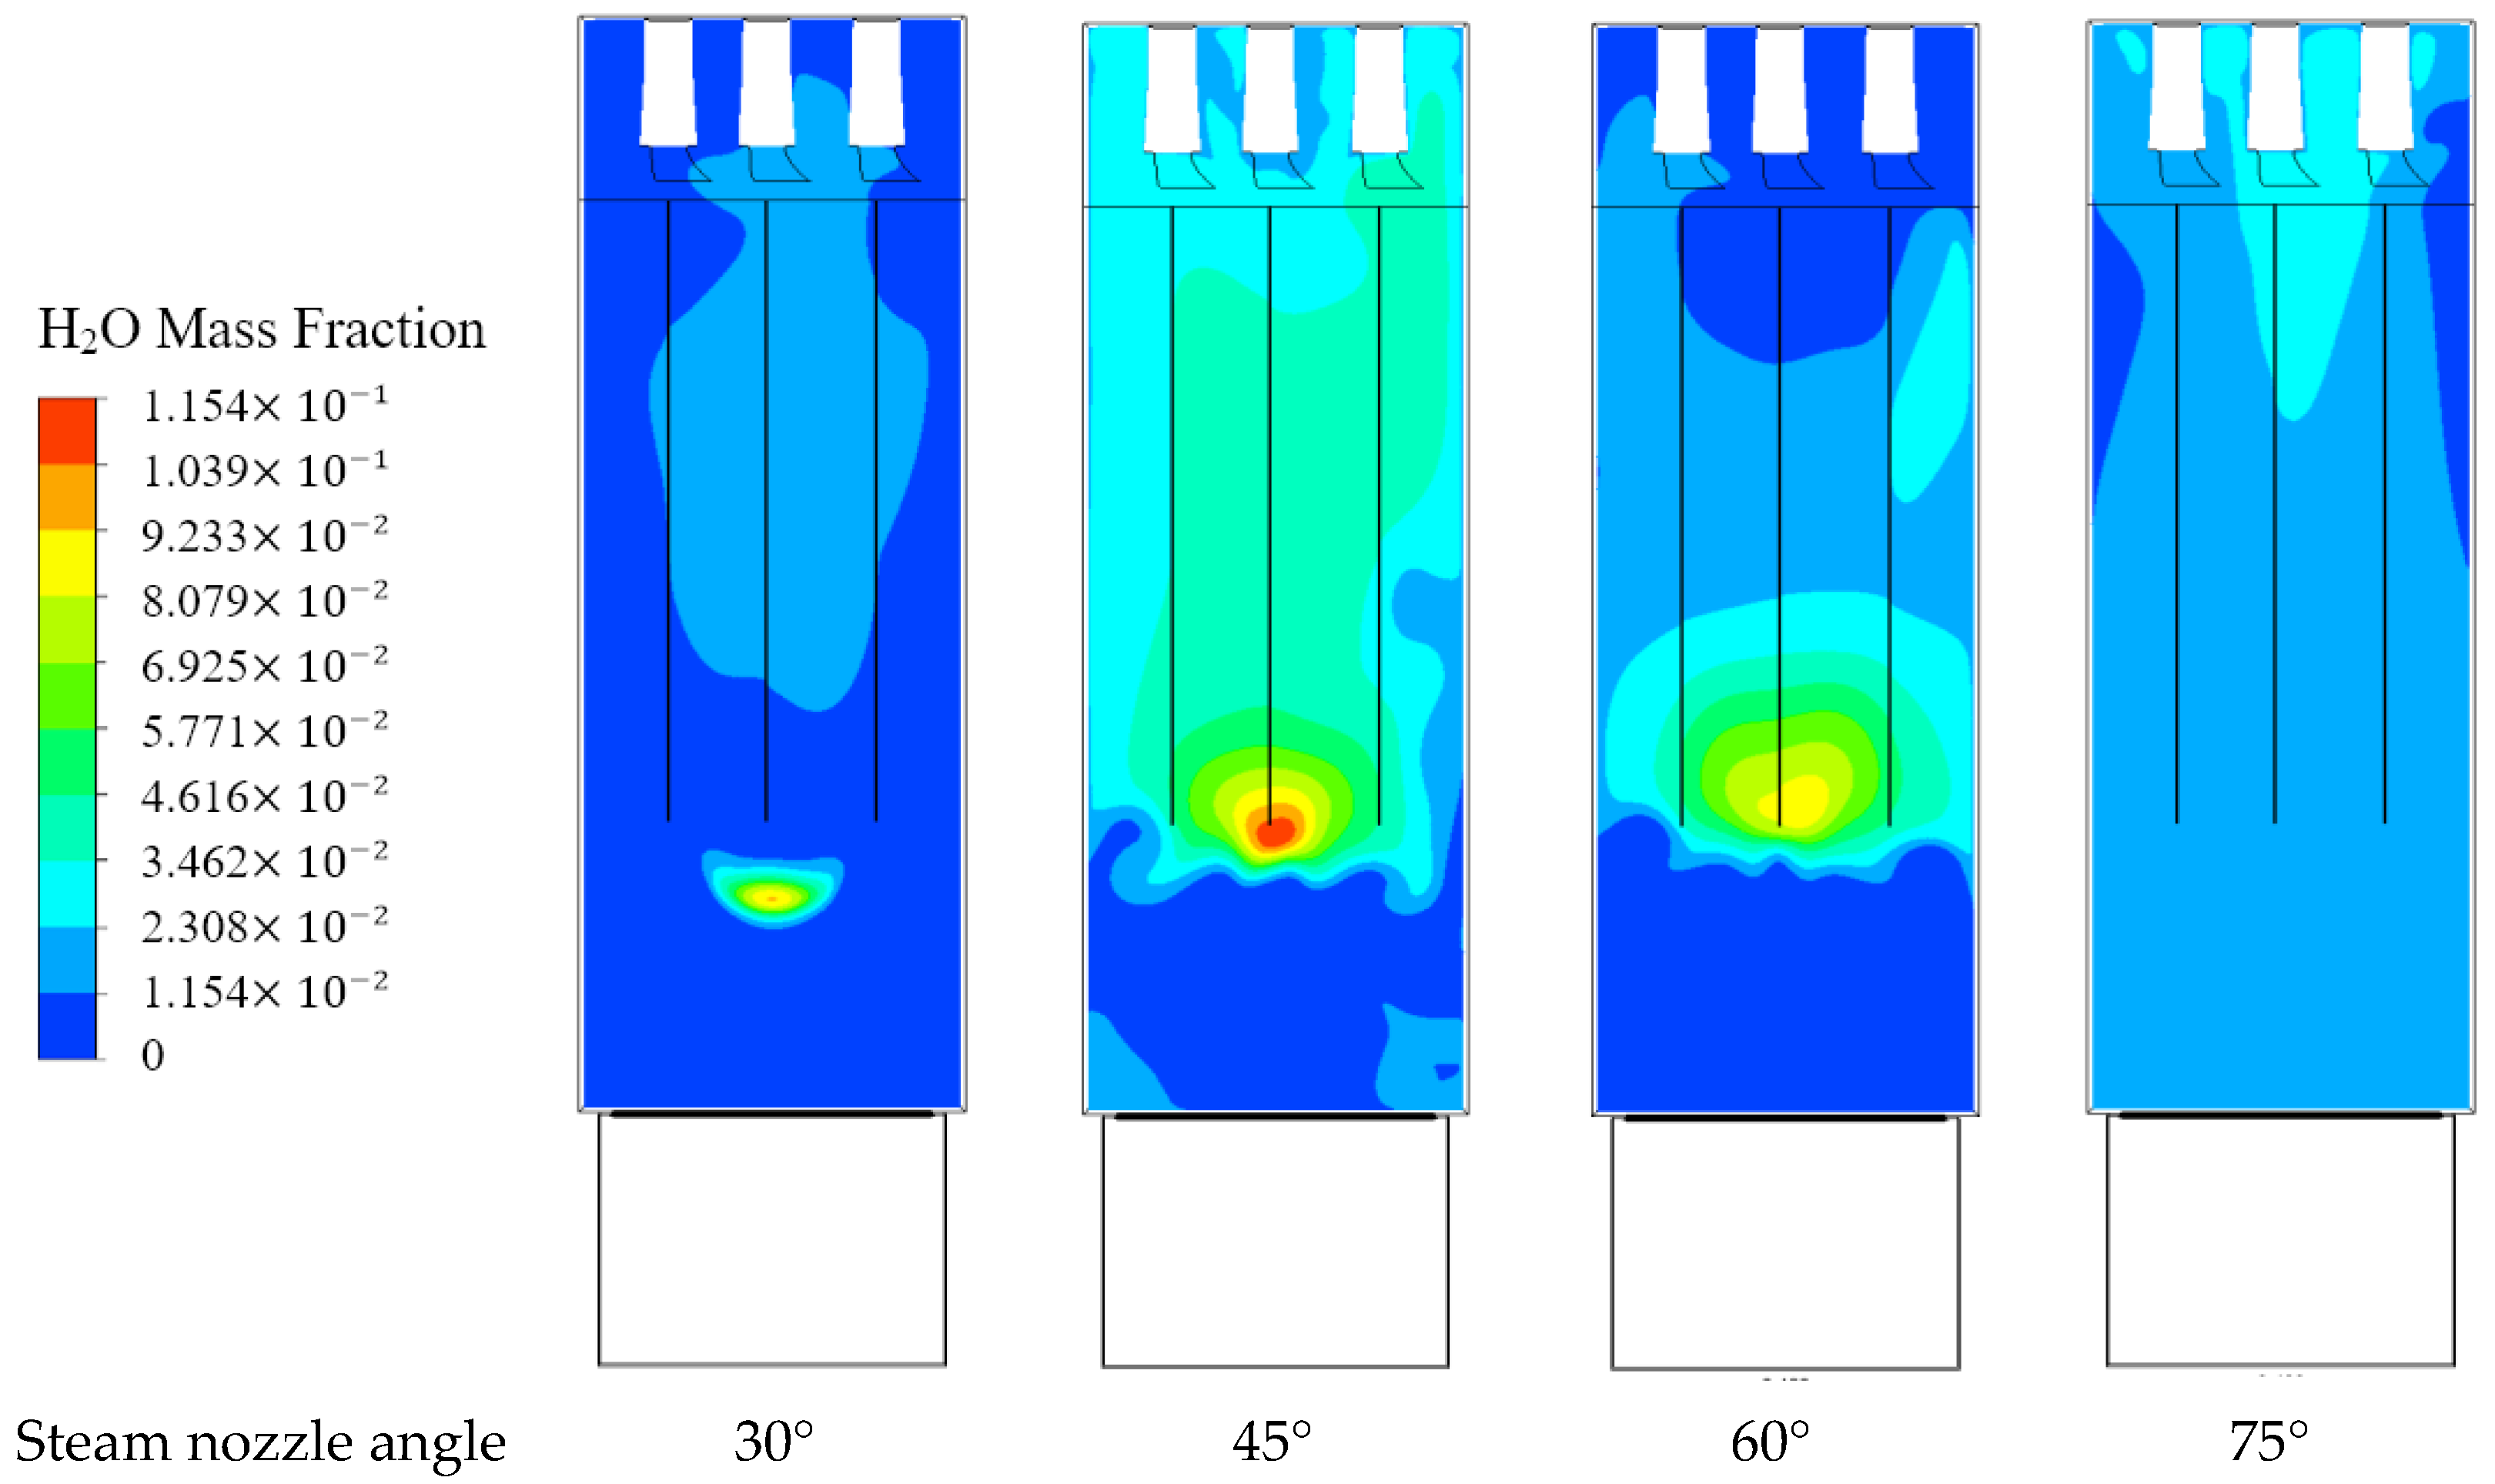
  • The highest air–steam mixture passing through all towels occurred for the geometric configuration with an air grill and steam nozzle angle of 90° and 30°, respectively, whereas the highest steam flow through towels transpired for the CCU model with an air grill and steam nozzle angle of 105° and 45°, respectively.
  • Empirical correlation for the steam and mixture flow rate was formulated as a function of the air grill angle and steam nozzle angle utilizing the response surface method. Moreover, multiobjective genetic optimisation showed that the air grill angle of 105° and the steam nozzle angle of 45° led to optimal flow distribution among the clothes in a CCU.
The present study can provide the basis for a preliminary design analysis of a CCU to improve flow distribution. However, the limitations of the present study include that it was a simplified modelling approach for clothes; taking into account other flow parameters such as relative humidity can help further the design and operation of the CCU.

Author Contributions

Formal analysis, A.S.; Funding acquisition, M.-H.K.; Investigation, A.S. and M.S.; Methodology, M.S.; Project administration, M.-H.K.; Software, A.S.; Supervision, M.-H.K.; Writing—original draft, A.S.; Writing—review & editing, M.S. and M.-H.K. All authors have read and agreed to the published version of the manuscript.

Funding

This work partly supported by Korea Evaluation Institute of Industrial Technology (KEIT) grant funded by the Korea government (MOTIE) (Project No. 20014863) and Samsung Electronics Company.

Institutional Review Board Statement

Not applicable.

Informed Consent Statement

Not applicable.

Data Availability Statement

Data is contained within the article.

Acknowledgments

We are grateful to Samsung Electronics Company for providing some data for this research.

Conflicts of Interest

The authors declare no conflict of interest.

Nomenclature

A Area   ( m 2 )
m Mass (kg)
m ˙ Mass   flow   ( kgs 1 )
n Number of design variables
n ^ Unit vector (-)
p Pressure   ( Pa )
Q Volumetric   flow   rate   ( m 3 s 1 )
r Volume fraction (-)
T Temperature
t Time   ( s )
U , V Velocity   vector   ( m   s 1 )
x Thickness
Greek Symbols
α Phase 1
β Phase 2
ρ Density   ( kg / m 3 )
θ Angle   ( ° )
Γ Thermal   conductivity   ( W / mK )
μ Viscosity   ( Pa s )
ϕ Flow variable
Sub- and Superscripts
f w d Forward
g Grill
n Nozzle
r e v Reverse
t Towels
Acronyms
C C U Clothes-conditioning unit
L B Lower bound
R S M Response surface method
S S T Shear-stress transport
U B Upper bound

References

  1. Wang, B.; Tang, Z.; Li, Y.; Cai, N.; Hu, X. Experiments and Simulations of Human Walking-Induced Particulate Matter Resuspension in Indoor Environments. J. Clean. Prod. 2021, 295, 126488. [Google Scholar] [CrossRef]
  2. Vicente, E.D.; Evtyugina, M.; Vicente, A.M.; Calvo, A.I.; Oduber, F.; Blanco-Alegre, C.; Castro, A.; Fraile, R.; Nunes, T.; Lucarelli, F.; et al. Impact of Ironing on Indoor Particle Levels and Composition. Build. Environ. 2021, 192, 107636. [Google Scholar] [CrossRef]
  3. Samsung. AirDresser. Available online: https://www.samsung.com/ae/washers-and-dryers/airdresser/airdresser-with-3-jacket-and-3-pants-capacity-crystal-mirror-df60r8600cg-eu/ (accessed on 1 March 2020).
  4. Ogniewicz, Y.; Tien, C.L. Analysis of Condensation in Porous Insulation. Heat Mass Transf. 1981, 24, 421–429. [Google Scholar] [CrossRef]
  5. Motakef, S.; El-Masri, M.A. Simultaneous Heat and Mass Transfer with Phase Change in a Porous Slab. Int. J. Heat Mass Transf. 1986, 29, 1503–1512. [Google Scholar] [CrossRef]
  6. Shapiro, A.P.; Motakef, S. Unsteady Heat and Mass Transfer with Phase Change in Porous Slabs: Analytical Solutions and Experimental Results. Analysis 1990, 33, 163–173. [Google Scholar] [CrossRef]
  7. Bouddour, A.; Auriault, J.L.; Mhamdi-Alaoui, M.; Bloch, J.F. Heat and Mass Transfer in Wet Porous Media in Presence of Evaporation-Condensation. Int. J. Heat Mass Transf. 1998, 41, 2263–2277. [Google Scholar] [CrossRef]
  8. Fan, J.; Luo, Z.; Li, Y. Heat and Moisture Transfer with Sorption and Condensation in Porous Clothing Assemblies and Numerical Simulation. Int. J. Heat Mass Transf. 2000, 43, 2989–3000. [Google Scholar] [CrossRef]
  9. Fan, J.; Cheng, X.Y. Heat and Moisture Transfer with Sorption and Phase Change through Clothing Assemblies: Part I: Experimental Investigation. Text. Res. J. 2005, 75, 99–105. [Google Scholar] [CrossRef]
  10. Fan, J.; Cheng, X.Y. Heat and Moisture Transfer with Sorption and Phase Change through Clothing Assemblies: Part II: Theoretical Modeling, Simulation, and Comparison with Experimental Results. Text. Res. J. 2005, 75, 187–196. [Google Scholar] [CrossRef]
  11. Li, Y.; Zhu, Q. A Model of Coupled Liquid Moisture and Heat Transfer in Porous Textiles with Consideration of Gravity. Numer. Heat Transf. Part A Appl. 2003, 43, 501–523. [Google Scholar] [CrossRef]
  12. Wu, H.; Fan, J. Study of Heat and Moisture Transfer within Multi-Layer Clothing Assemblies Consisting of Different Types of Battings. Int. J. Therm. Sci. 2008, 47, 641–647. [Google Scholar] [CrossRef]
  13. Xu, D.H.; Ge, M.B.; Zhang, H.L. Numerical Solution of a Dynamic Model of Heat and Moisture Transfer in Porous Fabric under Low Temperature. Int. J. Heat Mass Transf. 2013, 61, 149–157. [Google Scholar] [CrossRef]
  14. Aihua, M.; Jie, L.; Guiqing, L.; Yi, L. Numerical Simulation of Multiscale Heat and Moisture Transfer in the Thermal Smart Clothing System. Appl. Math. Model. 2016, 40, 3342–3364. [Google Scholar] [CrossRef]
  15. Su, Y.; Li, R.; Song, G.; Li, J.; Xiang, C. Modeling Steam Heat Transfer in Thermal Protective Clothing under Hot Steam Exposure. Int. J. Heat Mass Transf. 2018, 120, 818–829. [Google Scholar] [CrossRef]
  16. Schiller, V.L. A Drag Coefficient Correlation. Z. Ver. Deutsch. Ing. 1935, 77, 318–320. [Google Scholar]
  17. Ranz, W.; Marshall, W. Evaporation from Drops. Chem. Eng. Prog. 1952, 48, 141–146. [Google Scholar]
  18. Patankar, S. Numerical Heat Transfer and Fluid Flow; Series in Computational Methods in Mechanics and Thermal Sciences; CRC Press: Boca Raton, FL, USA, 1980; pp. 1–197. [Google Scholar]
  19. Versteeg, H.K.; Malalasekera, W. An Introduction to Computational Fluid Dynamics—The Finite Volume Method; Fluid Flow Handbook; McGraw-Hill: New York, NY, USA, 1995; p. 267. [Google Scholar]
  20. Saleem, A.; Kim, M.-H. Effect of Rotor Axial Position on the Aerodynamic Performance of an Airborne Wind Turbine System in Shell Configuration. Energy Convers. Manag. 2017, 151, 587–600. [Google Scholar] [CrossRef]
  21. Saeed, M.; Kim, M.-H. Aerodynamic Performance Analysis of an Airborne Wind Turbine System with NREL Phase IV Rotor. Energy Convers. Manag. 2017, 134, 278–289. [Google Scholar] [CrossRef]
  22. Saleem, A.; Kim, M.-H. Aerodynamic Analysis of an Airborne Wind Turbine with Three Different Aerofoil-Based Buoyant Shells Using Steady RANS Simulations. Energy Convers. Manag. 2018, 177, 233–248. [Google Scholar] [CrossRef]
  23. Saleem, A.; Kim, M.H. Performance of Buoyant Shell Horizontal Axis Wind Turbine under Fluctuating Yaw Angles. Energy 2019, 169, 79–91. [Google Scholar] [CrossRef]
  24. Kim, W.J. (Samsung Elecronics Company, Suwon, Korea). Private Communication. 1 March 2020. [Google Scholar]
  25. Rhie, C.M.; Chow, W.L. Numerical Study of the Turbulent Flow Past an Airfoil with Trailing Edge Separation. AIAA J. 1983, 21, 1525–1532. [Google Scholar] [CrossRef]
  26. Majumdar, S. Role of Underrelaxation in Momentum Interpolation for Calculation of Flow with Nonstaggered Grids. Numer. Heat Transf. 1988, 13, 125–132. [Google Scholar] [CrossRef]
  27. ANSYS 16. ANSYS-CFX User Manual; ANSYS: Canonsburg, PA, USA, 2009. [Google Scholar]
  28. Saeed, M.; Kim, M.-H. Airborne Wind Turbine Shell Behavior Prediction under Various Wind Conditions Using Strongly Coupled Fluid Structure Interaction Formulation. Energy Convers. Manag. 2016, 120, 217–228. [Google Scholar] [CrossRef]
  29. Saleem, A.; Kim, M.H. Effect of Rotor Tip Clearance on the Aerodynamic Performance of an Aerofoil-Based Ducted Wind Turbine. Energy Convers. Manag. 2019, 201, 112186. [Google Scholar] [CrossRef]
  30. Saleem, A.; Kim, M.H. Aerodynamic Performance Optimization of an Airfoil-Based Airborne Wind Turbine Using Genetic Algorithm. Energy 2020, 203, 117841. [Google Scholar] [CrossRef]
  31. Montgomery, D.C. Design and Analysis of Experiments; John Wiley & Sons: Hoboken, NJ, USA, 2017; ISBN 9781119113478. [Google Scholar]
  32. Gavin, H.P. The Levenberg-Marquardt Algorithm for Nonlinear Least Squares Curve-Fitting Problems; Duke University: Durham, NC, USA, 2019; pp. 1–19. [Google Scholar]
  33. Holland, J.H. Adaptation in Natural and Artificial Systems; MIT Press: Cambridge, MA, USA, 1975; Volume 18, ISBN 1109600690266. [Google Scholar]
  34. Goldberg, D.E. Genetic Algorithms in Search, Optimization, and Machine Learning; Addison-Wesley Publishing Company: Boston, MA, USA, 1989; ISBN 0201157675. [Google Scholar]
  35. Crossley, W.A.; Nankani, K.; Raymer, D.P. Comparison of Bit-String Affinity and Consecutive Generation Stopping Criteria for Genetic Algorithms. AIAA Pap. 2004, 449, 783–793. [Google Scholar] [CrossRef]
Figure 1. Geometric model of the clothes-conditioning unit.
Energies 15 05696 g001
Figure 2. Discretisation of computational domain and details of boundary conditions.
Energies 15 05696 g002
Figure 3. Blocking of the computational domain.
Energies 15 05696 g003
Figure 4. Structured mesh of the computational domain.
Energies 15 05696 g004
Figure 5. Mass flow rate of air and steam mixture through towel 1 with air grill and steam nozzle angle variation.
Energies 15 05696 g005
Figure 6. Mass flow rate of air and steam mixture through towel 2 with air grill and steam nozzle angle variation.
Energies 15 05696 g006
Figure 7. Mass flow rate of air and steam mixture through towel 3 with air grill and steam nozzle angle variation.
Energies 15 05696 g007
Figure 8. Air flow streamlines with variation of the air grill angle.
Energies 15 05696 g008
Figure 9. Steam mass flow rate through towel 1 with air grill and steam nozzle angle variation.
Energies 15 05696 g009
Figure 10. Steam mass flow rate through towel 2 with air grill and steam nozzle angle variation.
Energies 15 05696 g010
Figure 11. Steam mass flow rate through towel 3 with air grill and steam nozzle angle variation.
Energies 15 05696 g011
Figure 12. Air–steam mixture vorticity flow field at different CCU settings. (a) θ g = 105 ° ; θ n = 45 ° . (b) θ g = 60 ° ; θ n = 45 ° .
Energies 15 05696 g012
Figure 13. Concentration of the steam mass fraction (air grill angle 105 ° ) (T1 → Towel 1; T2 → Towel 2; T3 → Towel 3).
Energies 15 05696 g013
Figure 14. Concentration of the steam mass fraction (air grill angle 90 ° ).
Energies 15 05696 g014
Figure 15. Concentration of the steam mass fraction (air grill angle 75 ° ).
Energies 15 05696 g015
Figure 16. Concentration of the steam mass fraction (air grill angle 60 ° ).
Energies 15 05696 g016
Figure 17. Concentration of the steam mass fraction (air grill angle 45 ° ).
Energies 15 05696 g017
Figure 18. Total mass flow rate of the steam and air–steam mixture with steam nozzle angle and air grill angle. (a) Steam flow rate (kg/s). (b) Mixture flow rate (kg/s).
Energies 15 05696 g018
Figure 19. Variation in the steam mass flow through towel 1, 2, and 3 with steam nozzle angle and air grill angle. (a) Steam flow rate, towel 1 (kg/s). (b) Steam flow rate, towel 2 (kg/s). (c) Steam flow rate, towel 3 (kg/s).
Energies 15 05696 g019
Figure 20. Variation in the air–steam mass flow through towel 1, 2, and 3 with steam nozzle angle and air grill angle. (a) Mixture flow rate, towel 1 (kg/s). (b) Mixture flow rate, towel 2 (kg/s). (c) Mixture flow rate, towel 3 (kg/s).
Energies 15 05696 g020aEnergies 15 05696 g020b
Figure 21. Pareto front data along with the converge history of the multiobjective GA.
Energies 15 05696 g021
Table 1. Test conditions of the simulated cases.
ParametersOperating Time, t ( s ) Steam Amount Generated, m   ( g ) Air Flow Rate, Q   ( m 3 / min ) Incoming Air Temperature, T a i r   ( K ) Grill Angle, θ g   ( ° ) Nozzle Angle, θ n   ( ° )
4002751.35320.1545, 60, 75, 90, 10530, 45, 60, 75
Table 2. Mesh details of the computational domain.
Mesh DetailsM1M2M3M4
Inlet domainNumber of nodes1,674,2862,079,5352,413,9512,698,659
Number of elements1,587,3541,952,8462,291,5982,581,645
Exit domainNumber of nodes2,822,6583,591,6854,150,4894,682,458
Number of elements2,718,6473,485,7153,992,0634,526,927
Clothing chamberNumber of nodes5,809,3297,724,9549,387,24910,548,000
Number of elements5,642,3517,532,1789,182,48410,912,683
Hangers domainNumber of nodes1,834,7122,336,5192,855,9083,358,241
Number of elements1,765,9452,248,7582,773,8273,264,584
Towels domainNumber of nodes85,274118,453172,500296,755
Number of elements72,648102,869135,432285,621
CCUTotal nodes12,226,25915,851,14618,980,09721,584,113
Total elements11,786,94515,322,36618,375,40421,571,460
Table 3. Pareto front data.
S. No.Flow Rate of SteamMixture Flow RateAir Grill Angle Steam Nozzle AngleS. No.Flow Rate of SteamMixture Flow RateAir Grill Angle Steam Nozzle Angle
50.00−0.84−2.16105.0044.2325.00−0.85−2.15105.0045.14
49.00−0.81−2.27105.0035.1224.00−0.82−2.25105.0036.69
48.00−0.80−2.28105.0032.7223.00−0.85−2.14105.0045.69
47.00−0.85−2.12105.0046.7722.00−0.84−2.16105.0044.35
46.00−0.84−2.18105.0043.0021.00−0.85−2.13105.0046.09
45.00−0.82−2.25105.0036.3820.00−0.81−2.28105.0033.74
44.00−0.84−2.20105.0041.2219.00−0.85−2.14105.0045.39
43.00−0.83−2.24105.0038.1918.00−0.84−2.15105.0044.68
42.00−0.83−2.22105.0039.6517.00−0.85−2.13105.0046.38
41.00−0.80−2.28105.0033.0316.00−0.84−2.18105.0042.66
40.00−0.83−2.24105.0037.7315.00−0.80−2.28105.0032.97
39.00−0.84−2.18105.0043.1314.00−0.80−2.28105.0033.45
38.00−0.83−2.24105.0037.8913.00−0.81−2.27105.0034.54
37.00−0.84−2.22105.0040.0212.00−0.83−2.23105.0038.41
36.00−0.84−2.19105.0042.1111.00−0.84−2.16105.0043.98
35.00−0.82−2.25105.0036.5410.00−0.81−2.27105.0033.97
34.00−0.84−2.19105.0042.409.00−0.84−2.20105.0041.54
33.00−0.82−2.26105.0035.308.00−0.84−2.21105.0040.77
32.00−0.83−2.23105.0039.107.00−0.84−2.21105.0040.63
31.00−0.84−2.15105.0044.796.00−0.81−2.27105.0034.87
30.00−0.81−2.27105.0034.345.00−0.82−2.25105.0037.10
29.00−0.84−2.17105.0043.564.00−0.85−2.12105.0046.52
28.00−0.83−2.23105.0038.793.00−0.83−2.23105.0038.61
27.00−0.85−2.12105.0046.892.00−0.84−2.19105.0041.80
26.00−0.83−2.24105.0037.351.00−0.85−2.12105.0046.89
Publisher’s Note: MDPI stays neutral with regard to jurisdictional claims in published maps and institutional affiliations.

