
Li-Ion Battery Anode State of Charge Estimation and Degradation Monitoring Using Battery Casing via Unknown Input Observer


Abstract
:1. Introduction
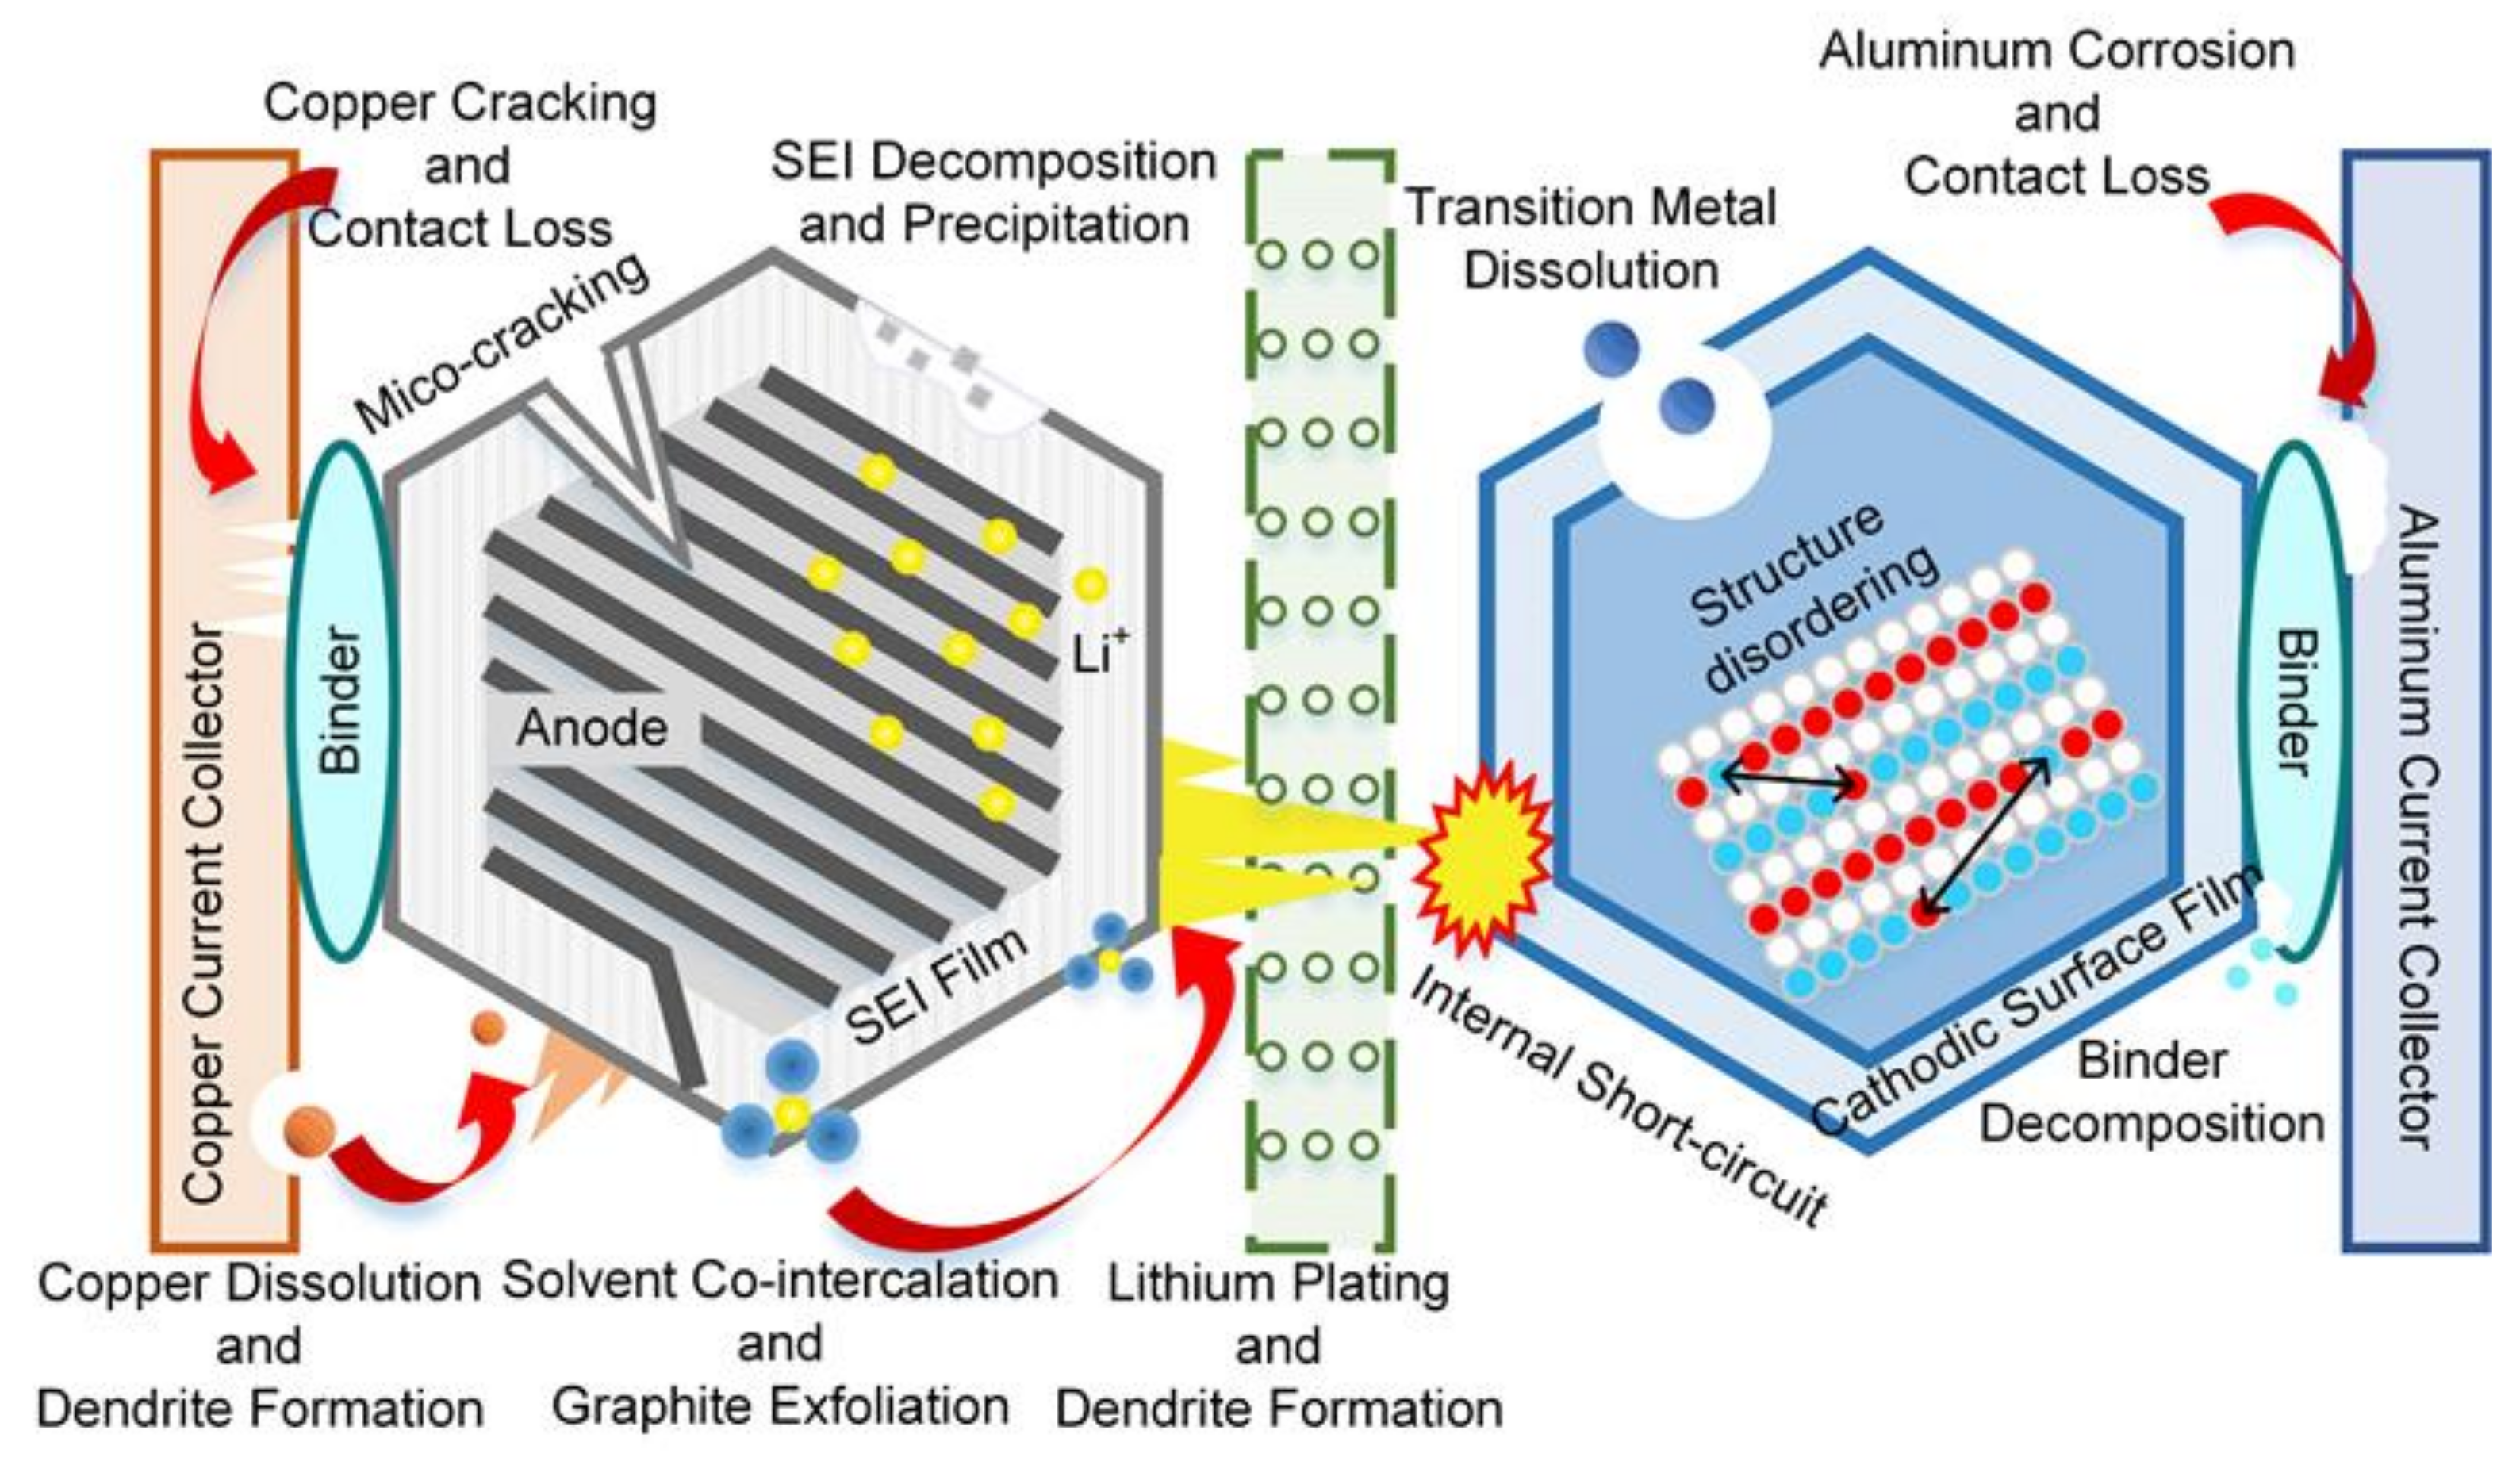
1.1. Background
1.2. Current Status
1.3. Research Gaps and Contributions
2. Methodology
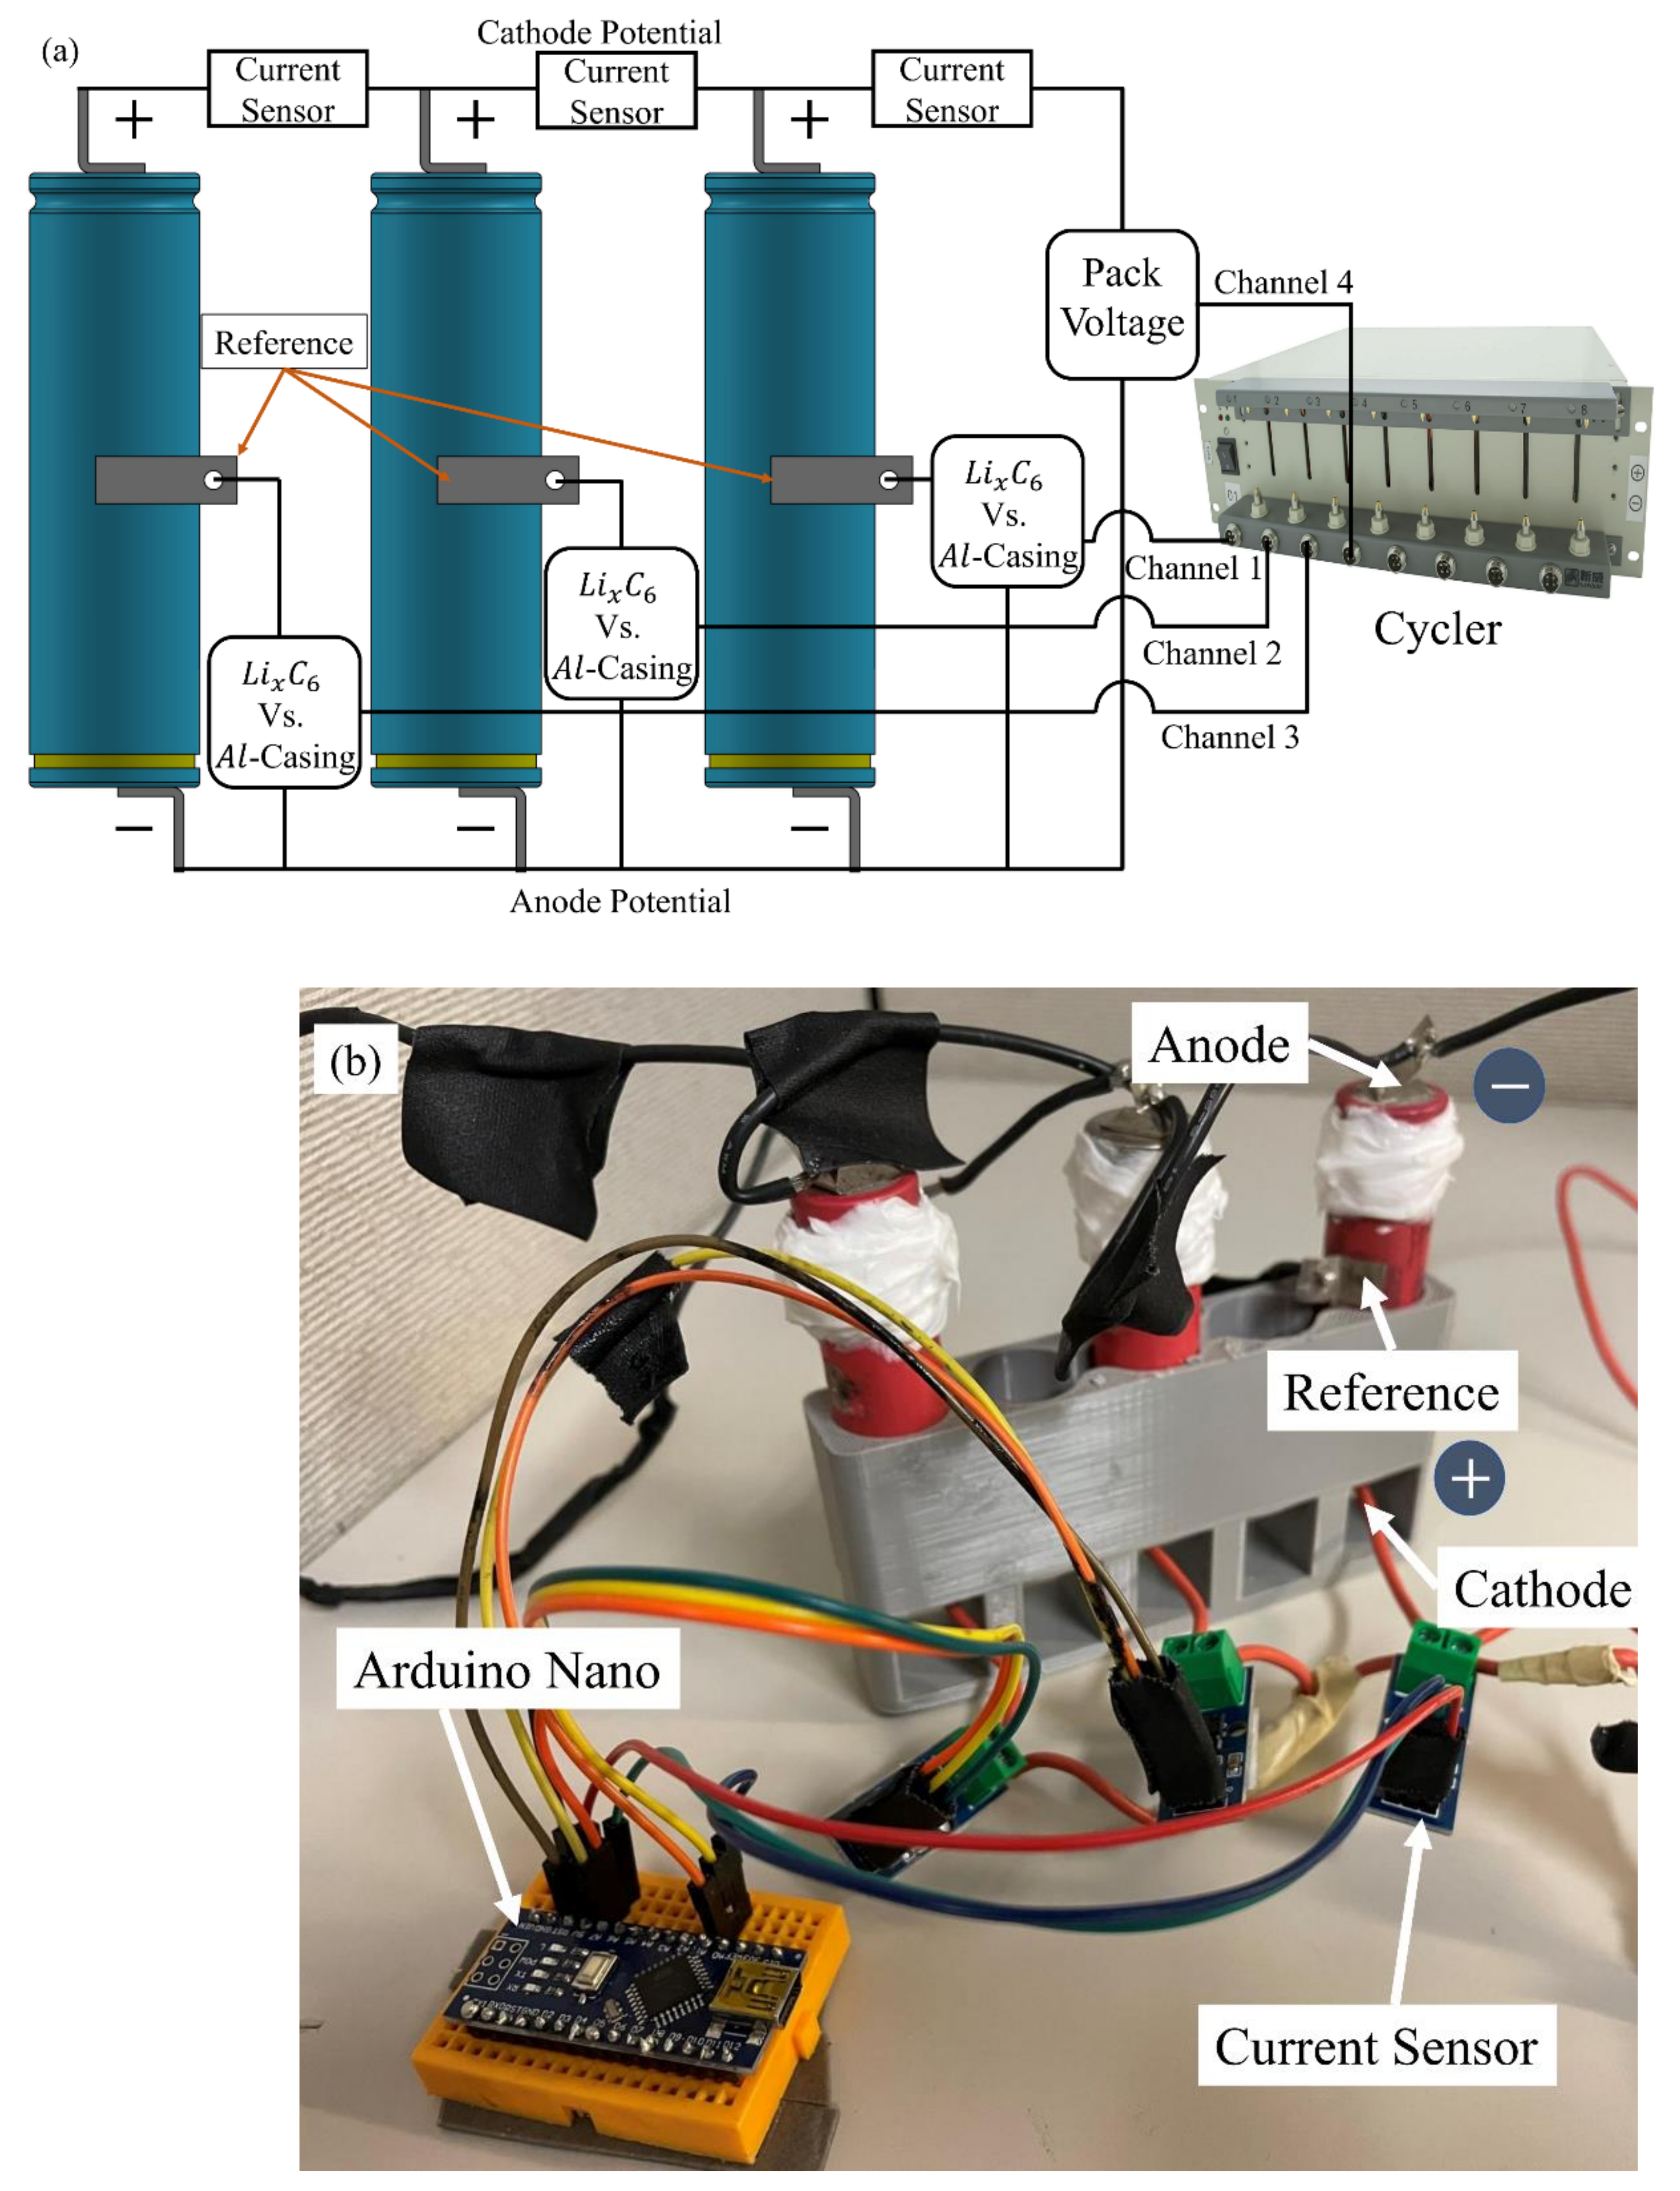
2.1. Experimental Setup
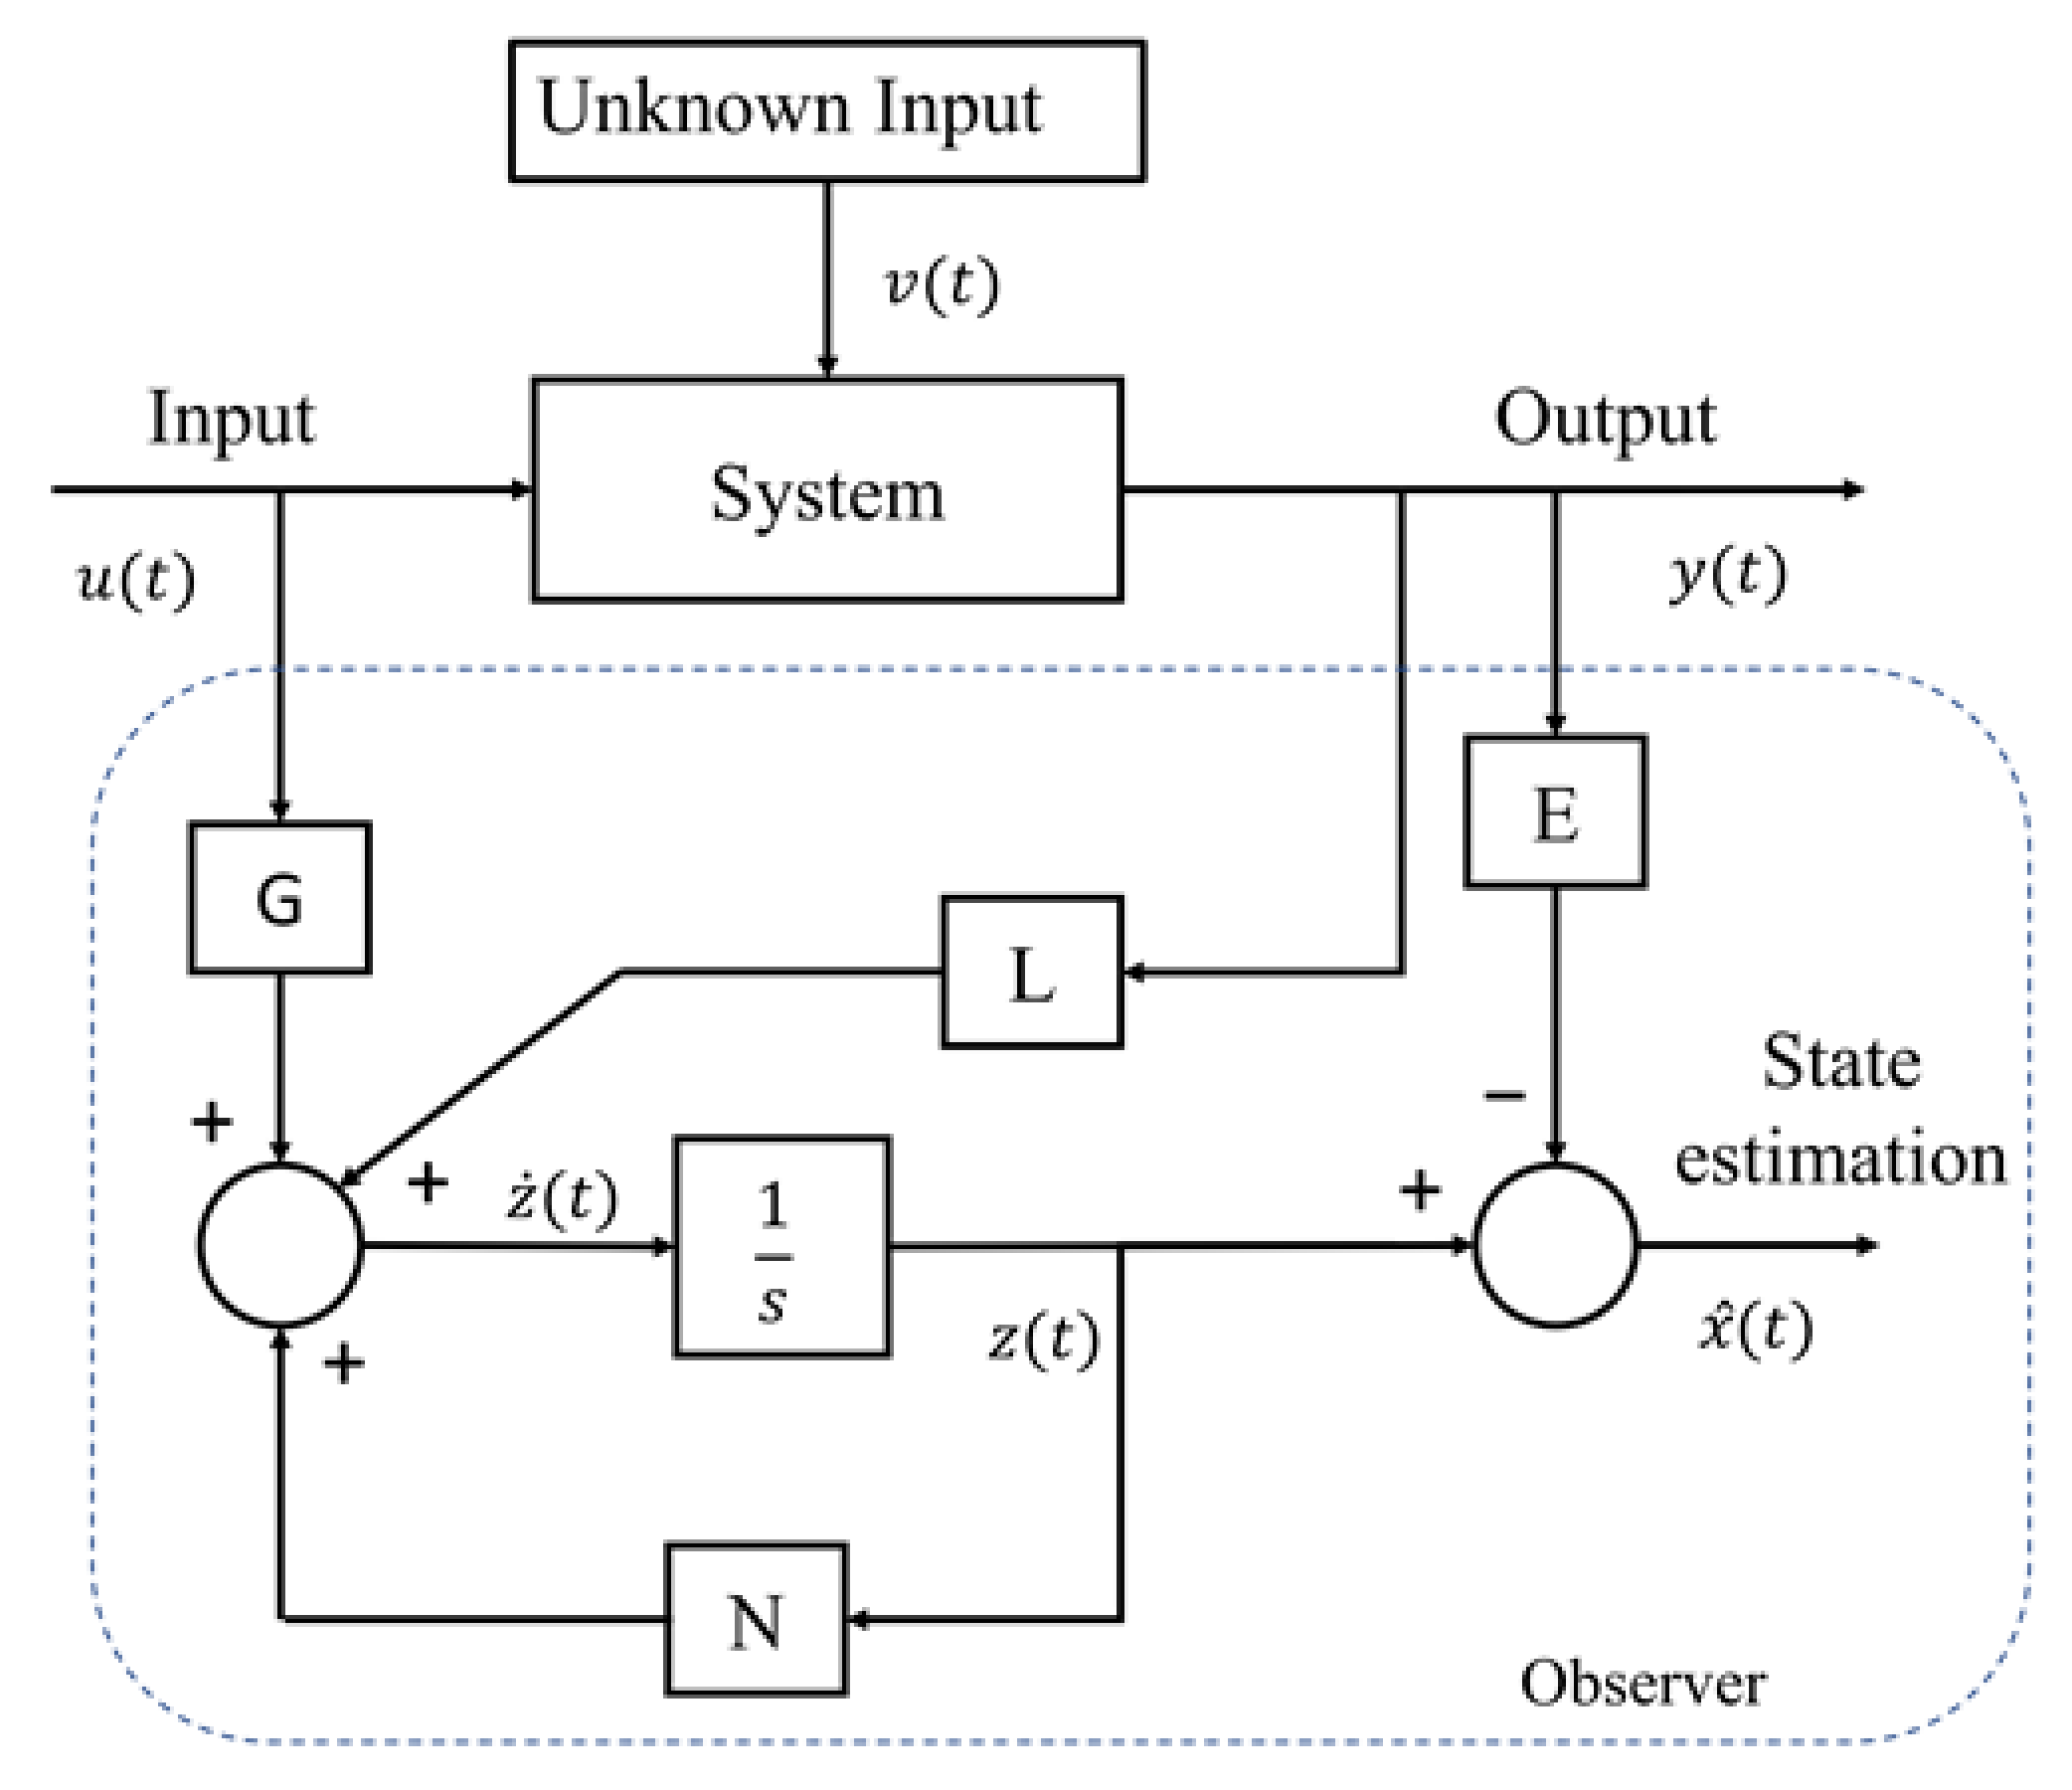
2.2. Observer Design
2.3. Thevenin Equivalent Circuit Model
2.4. Model Parameter Identification
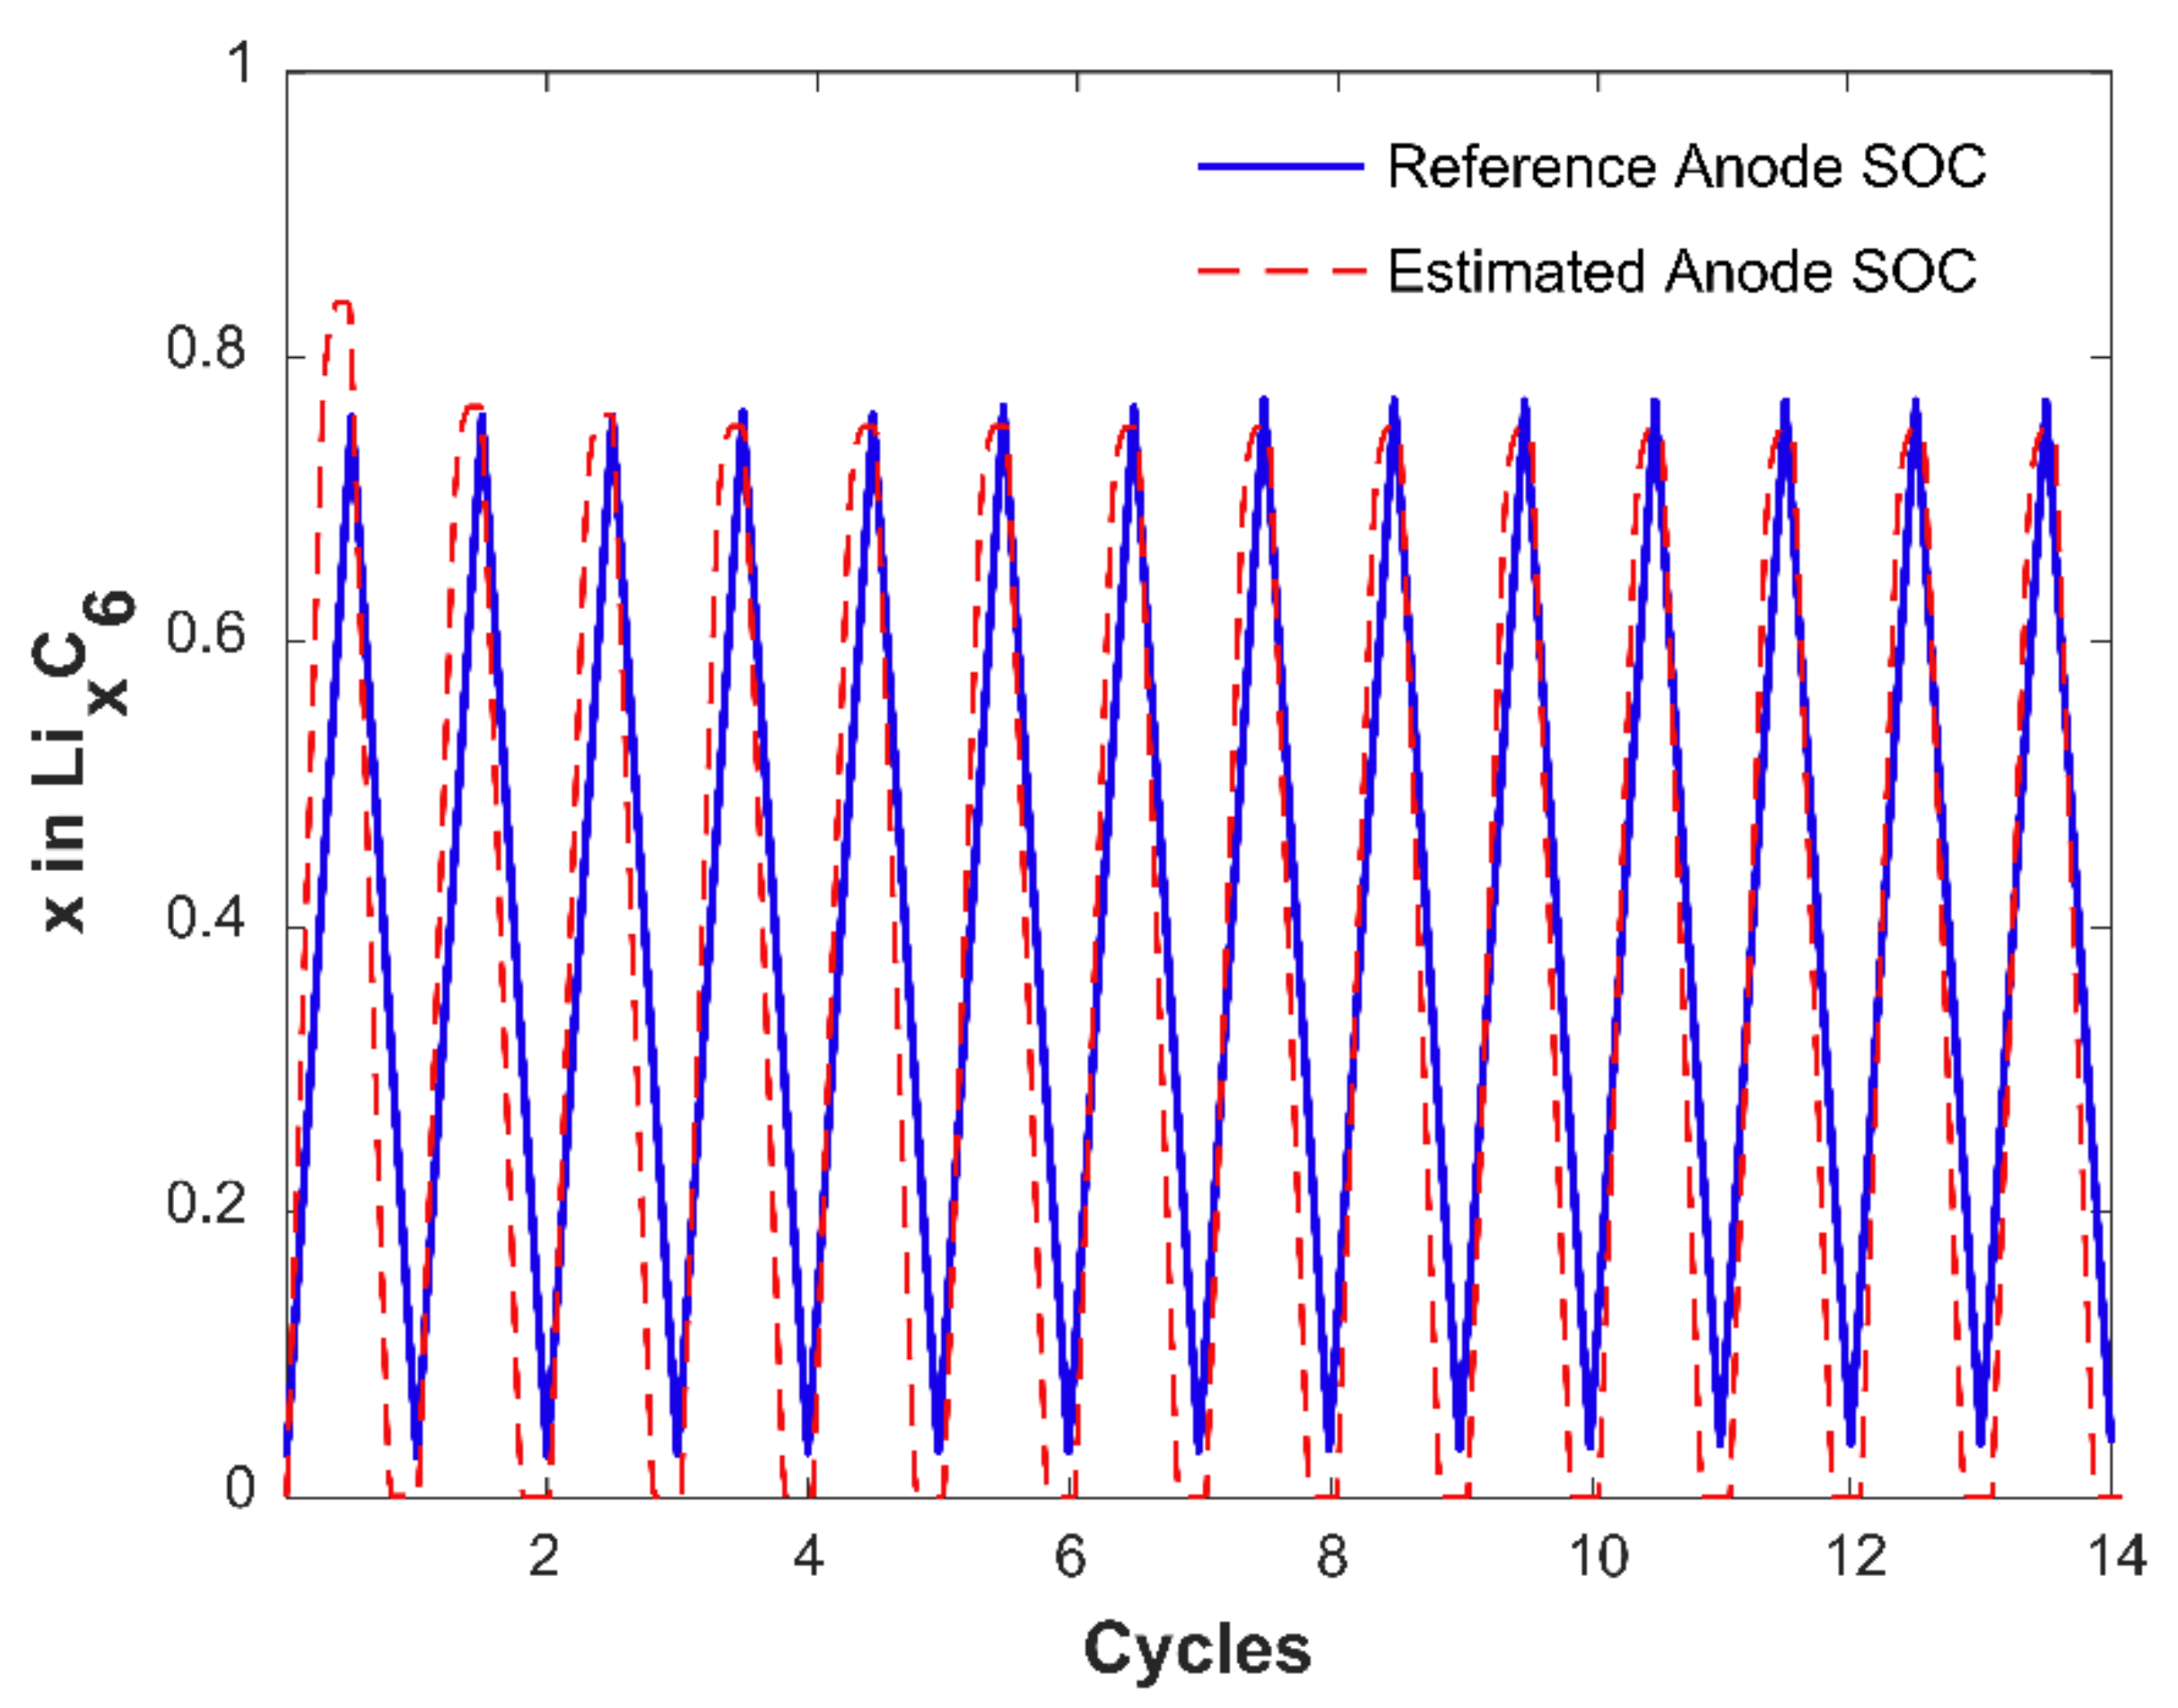
2.5. Anode SOC and Capacity Estimation
| Algorithm 1 SOC Estimation |
|
3. Results and Discussion
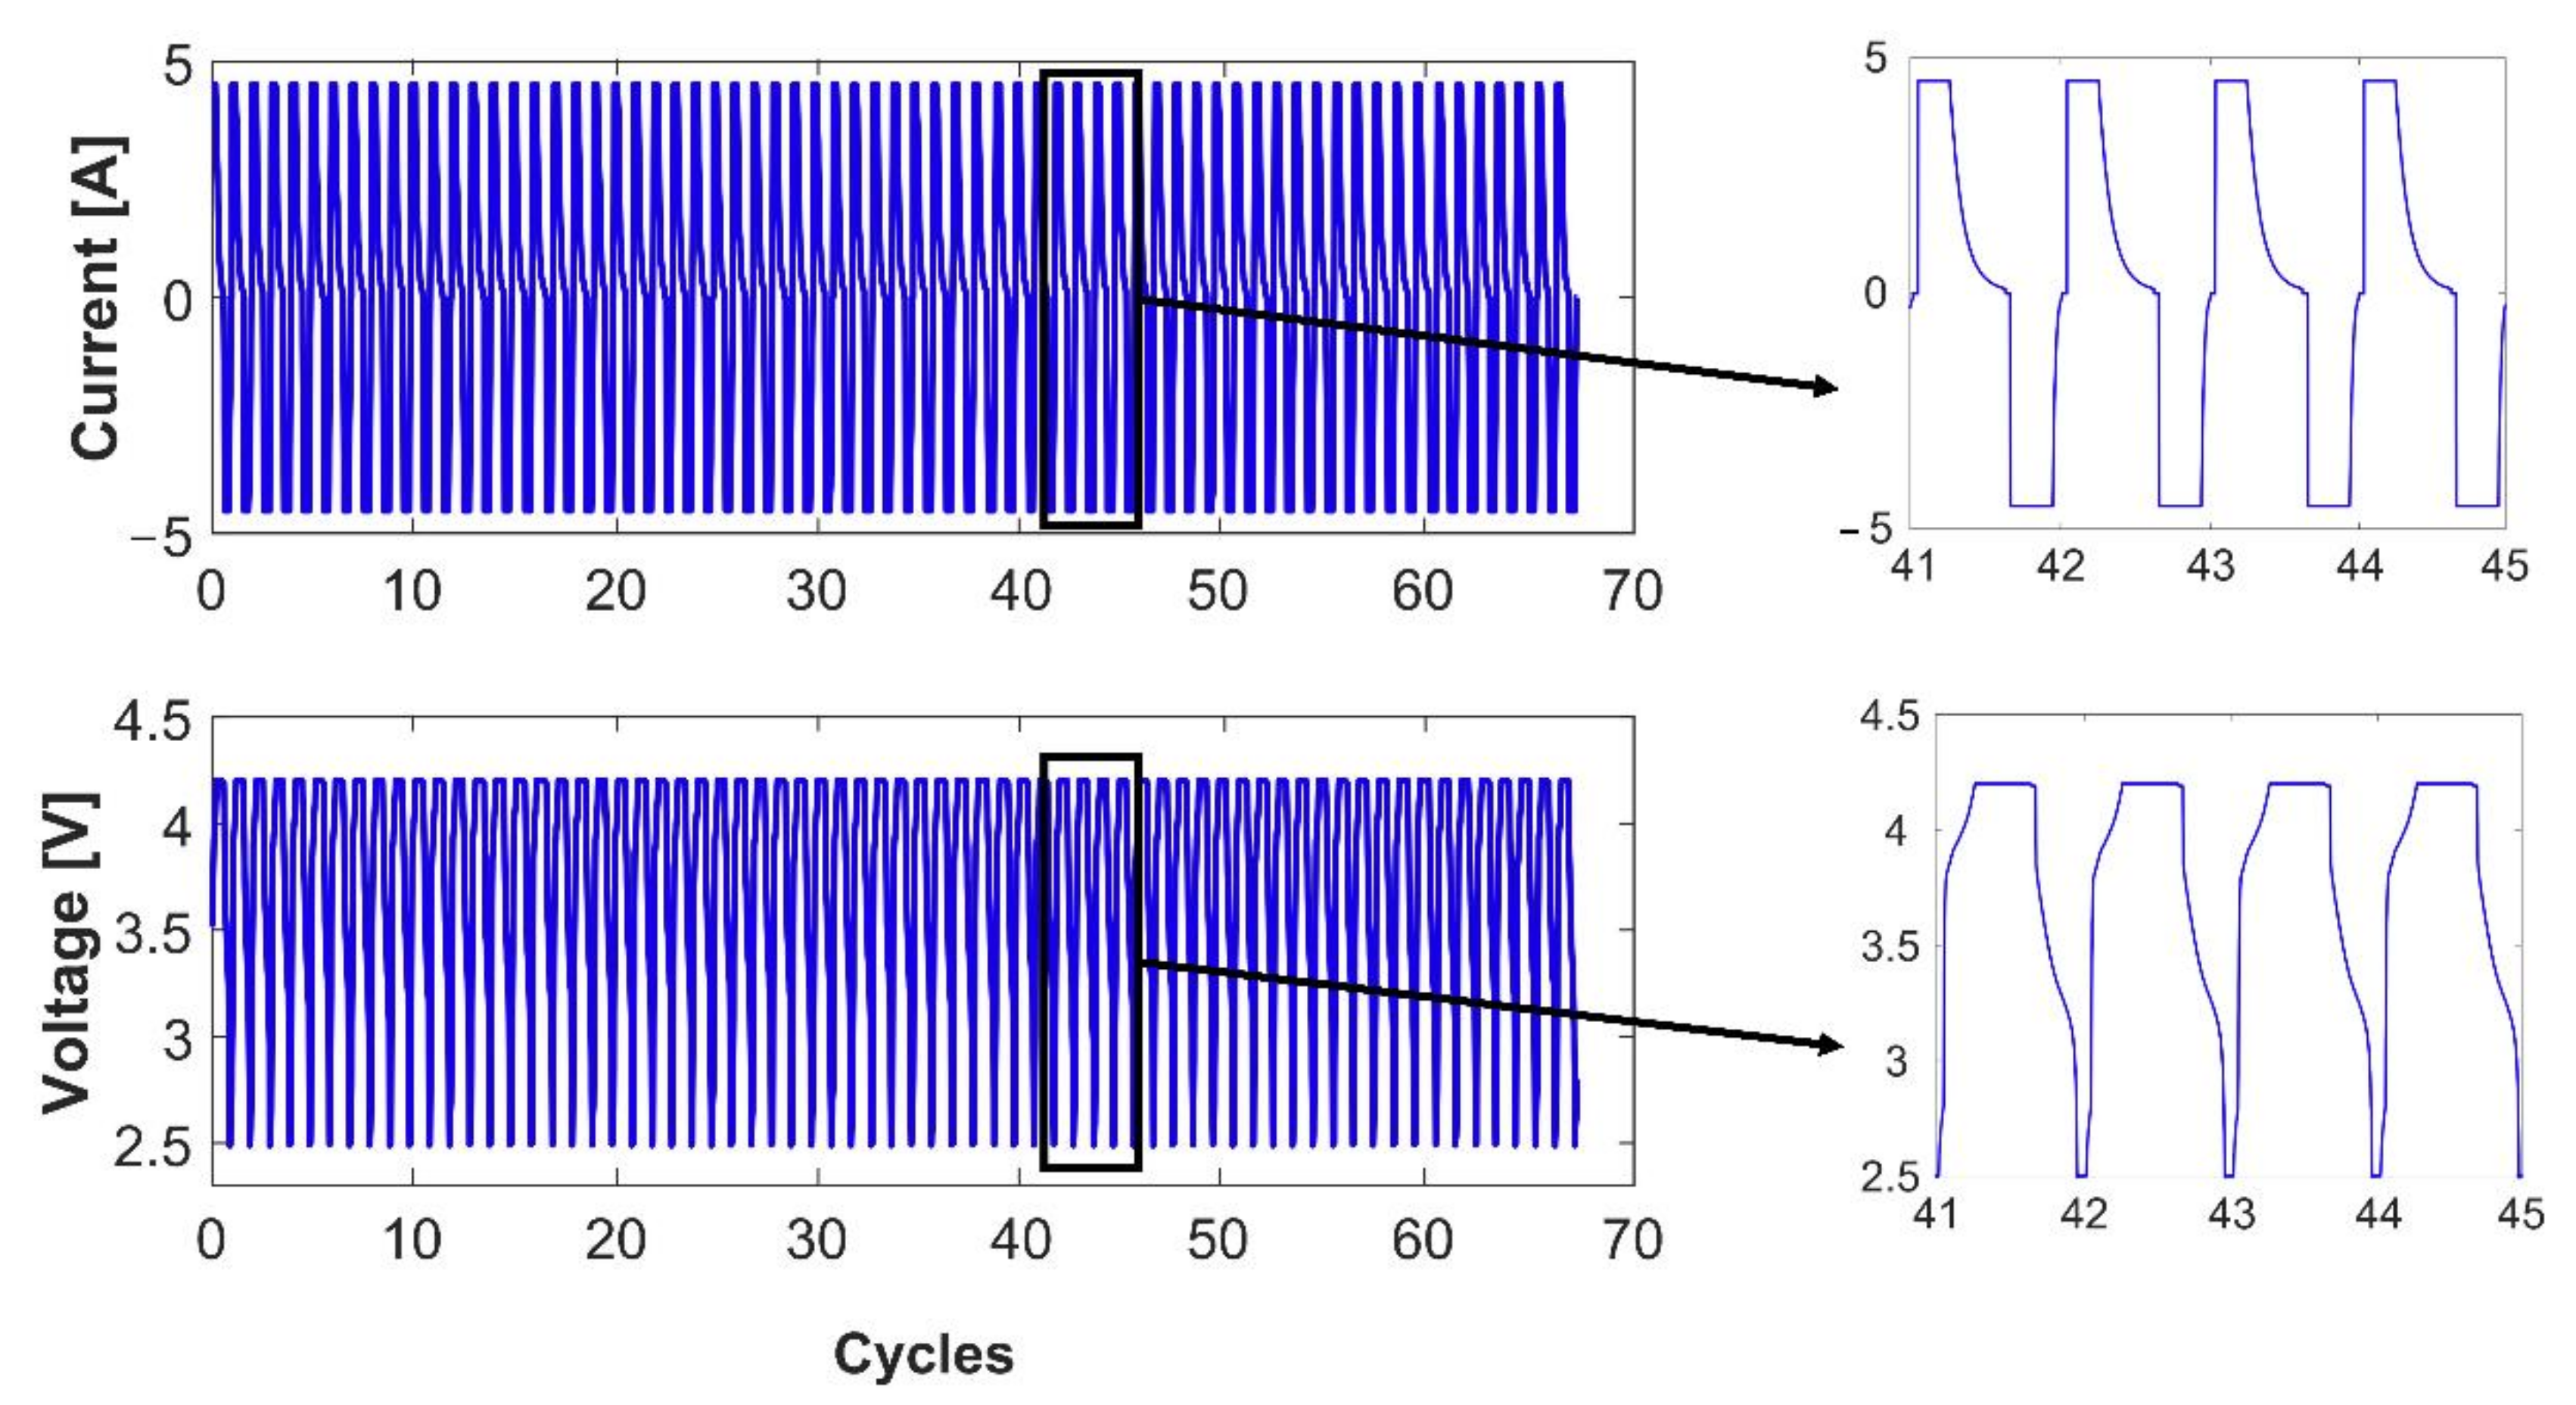
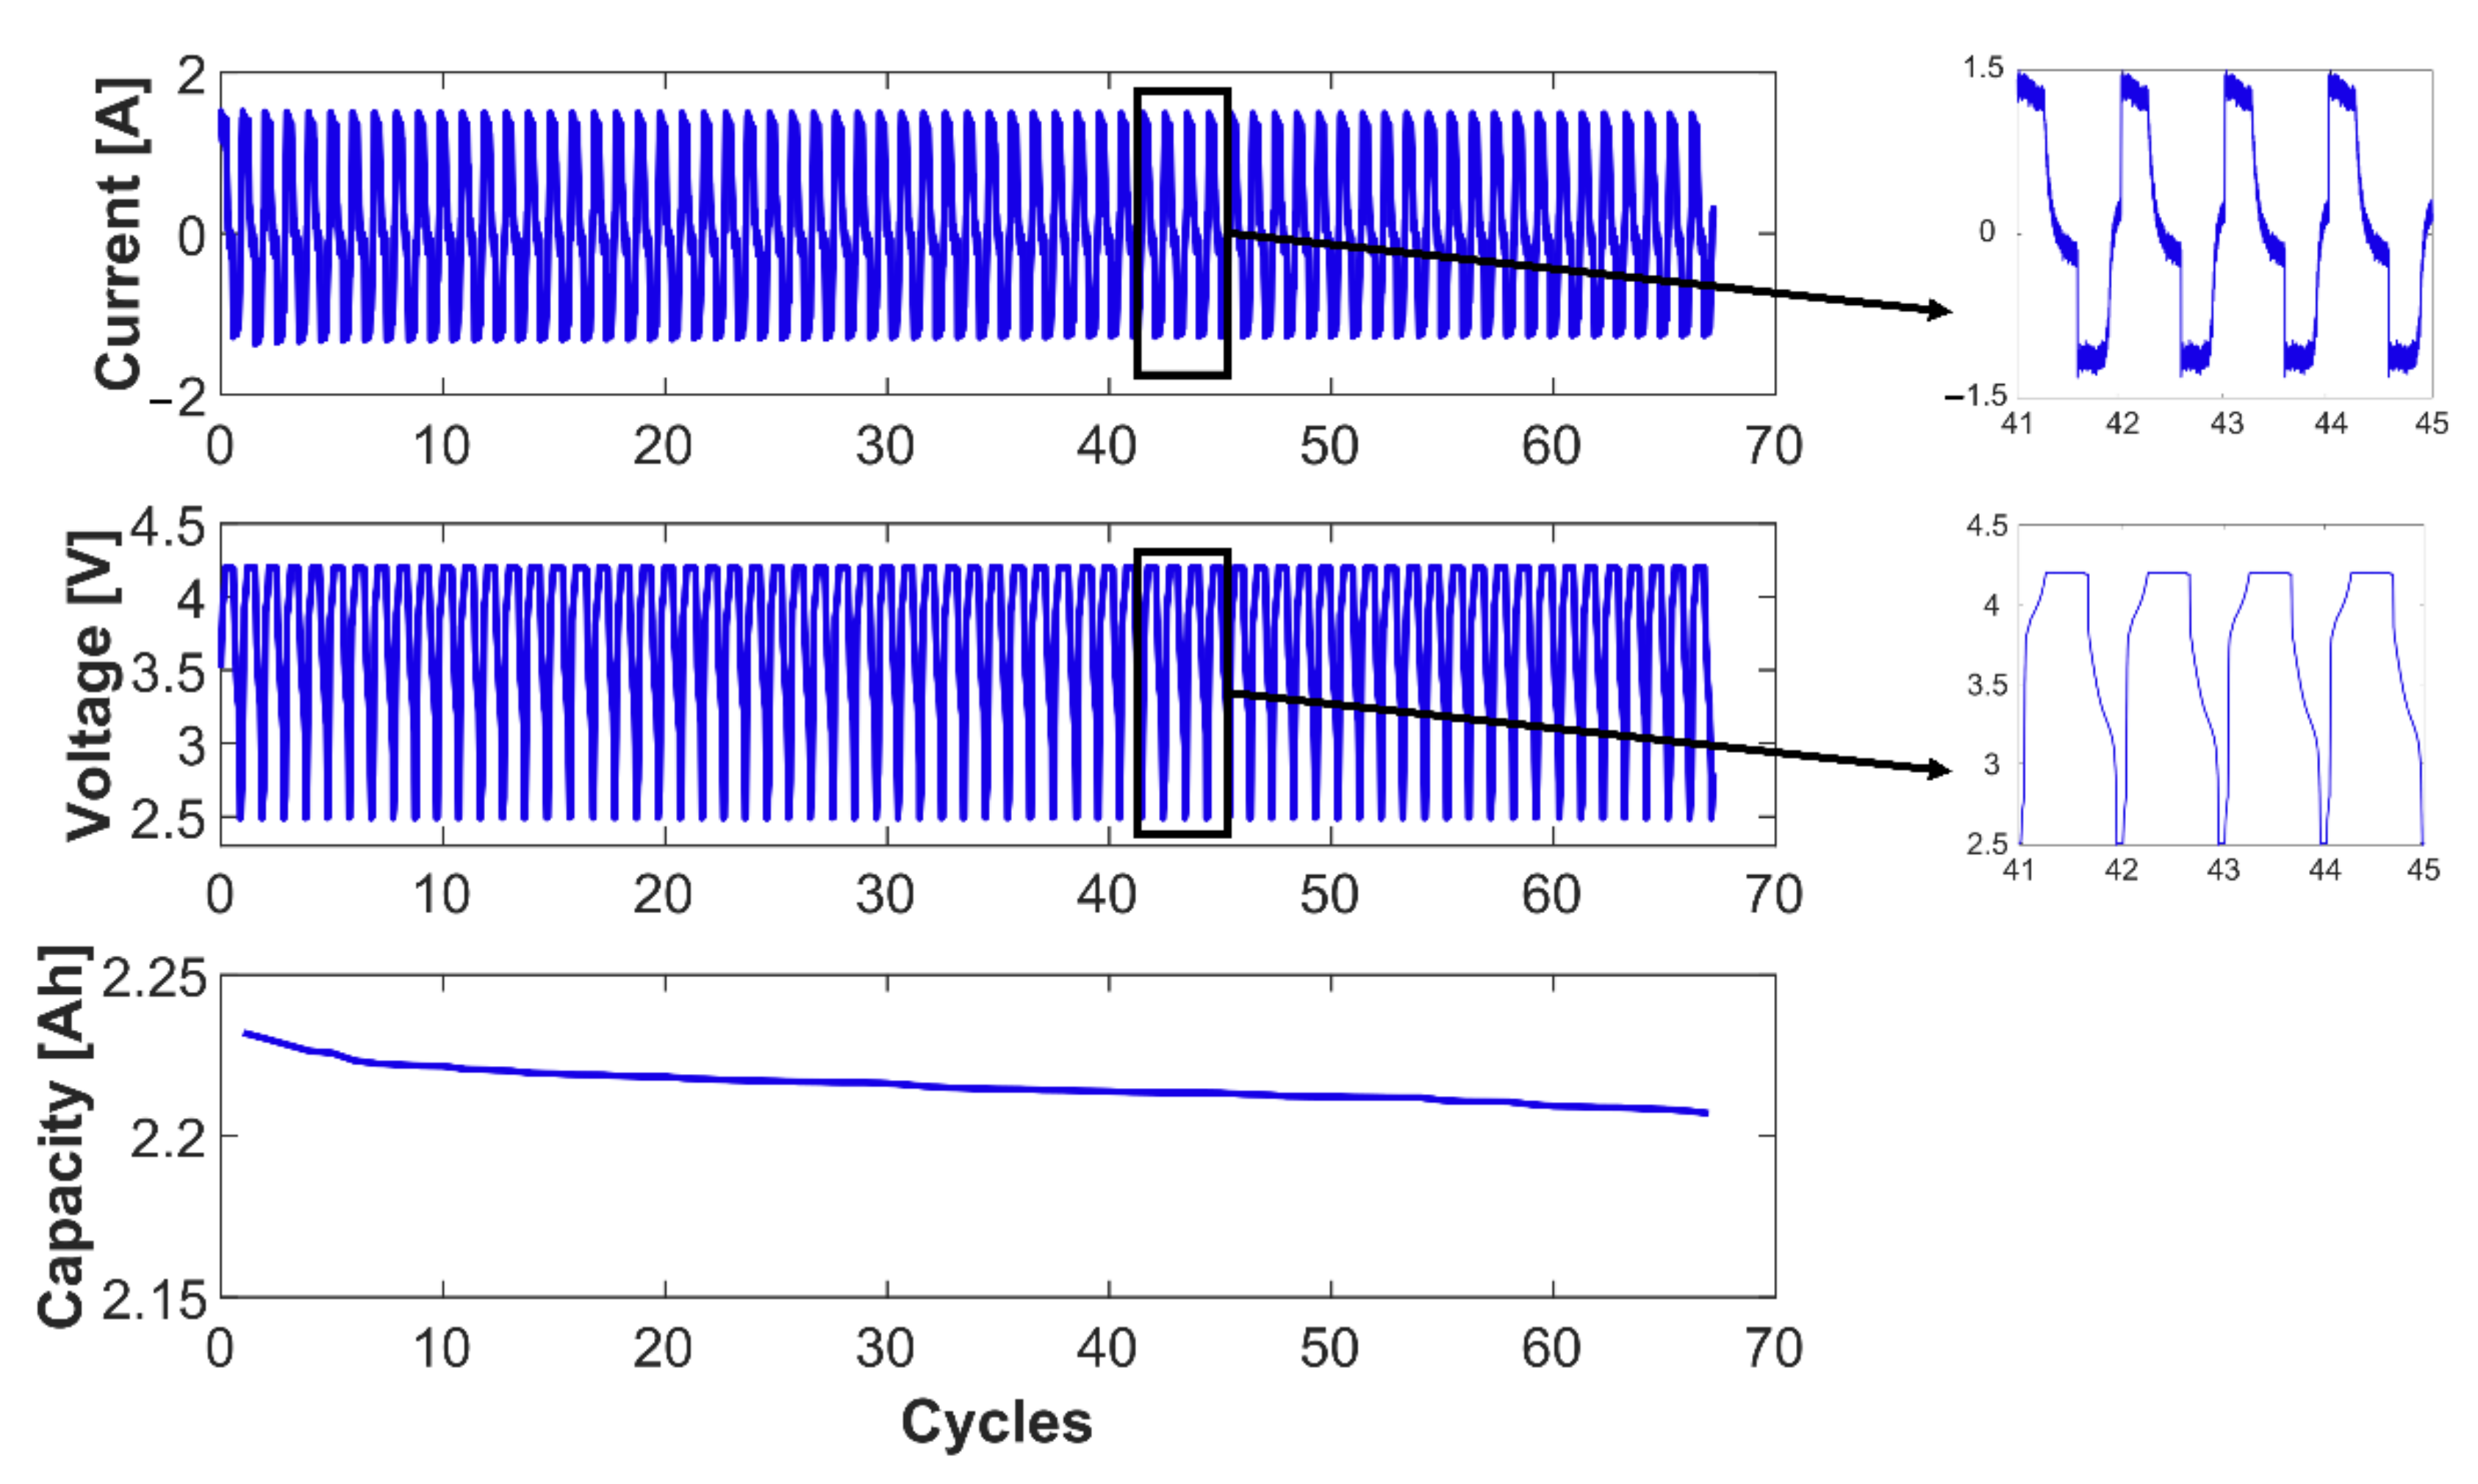
3.1. Cell Capacity Fade
Three-Electrode Cell vs. Fresh Cell Capacity Fade
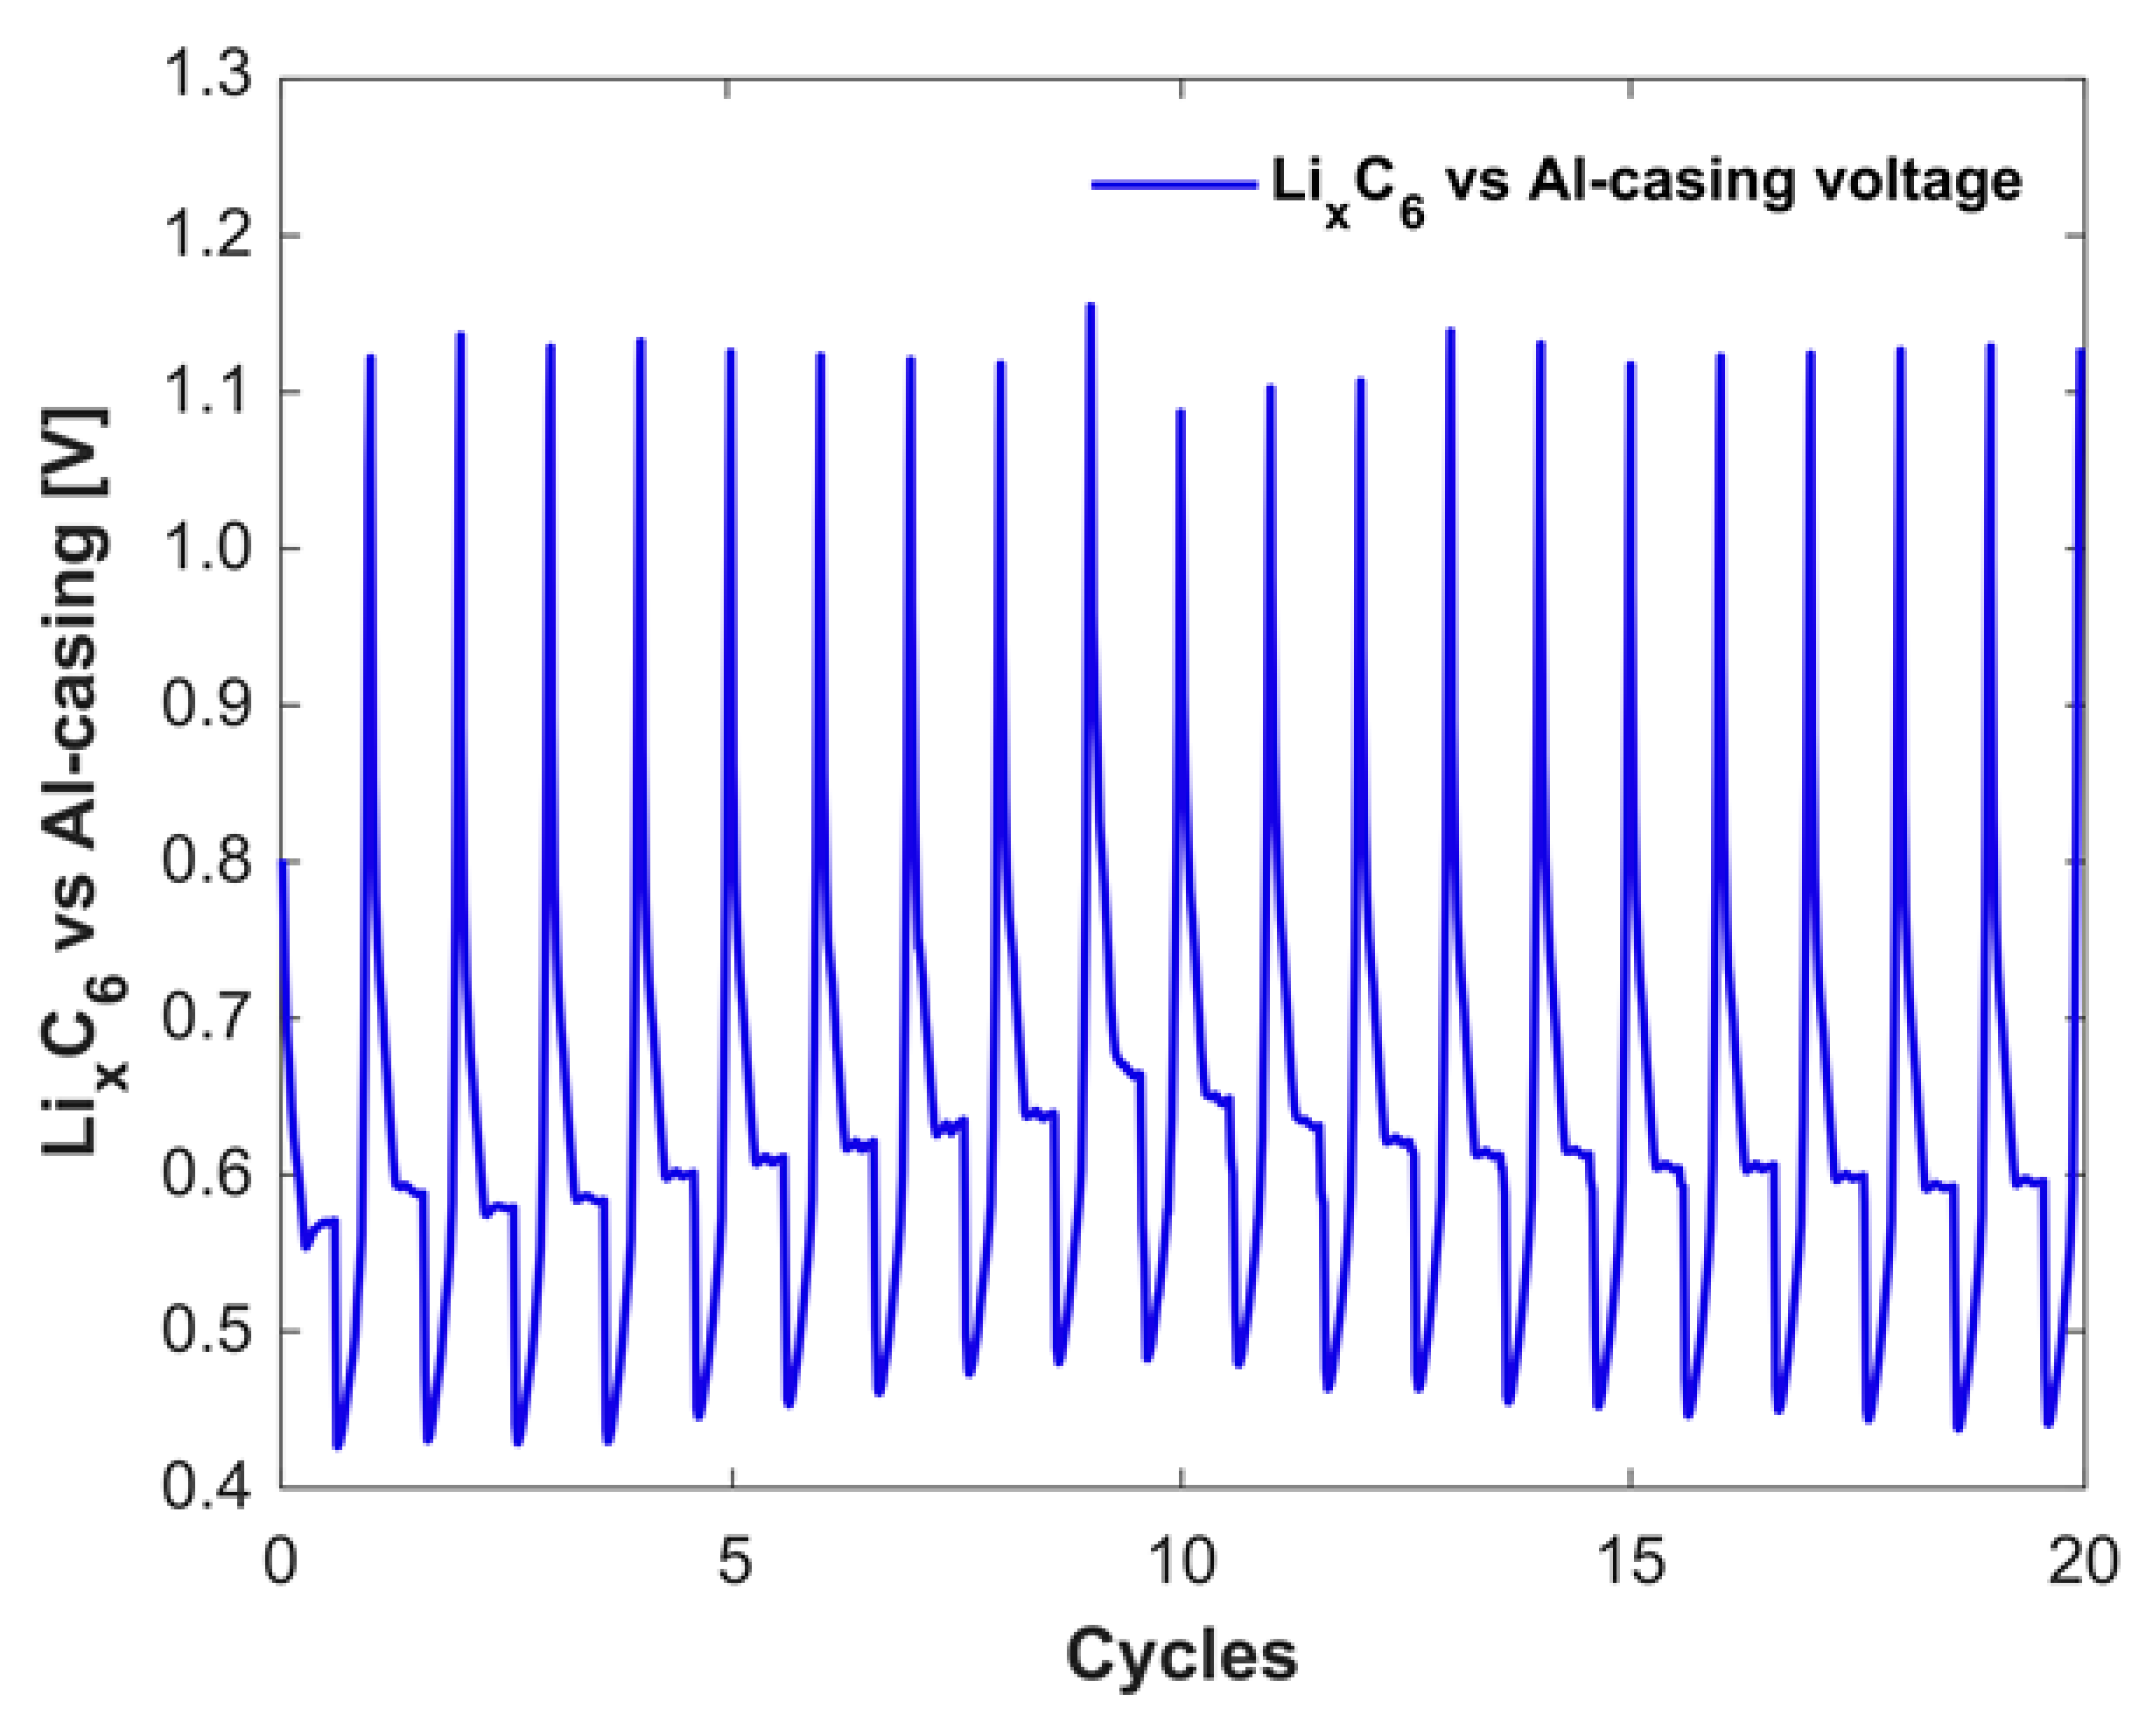
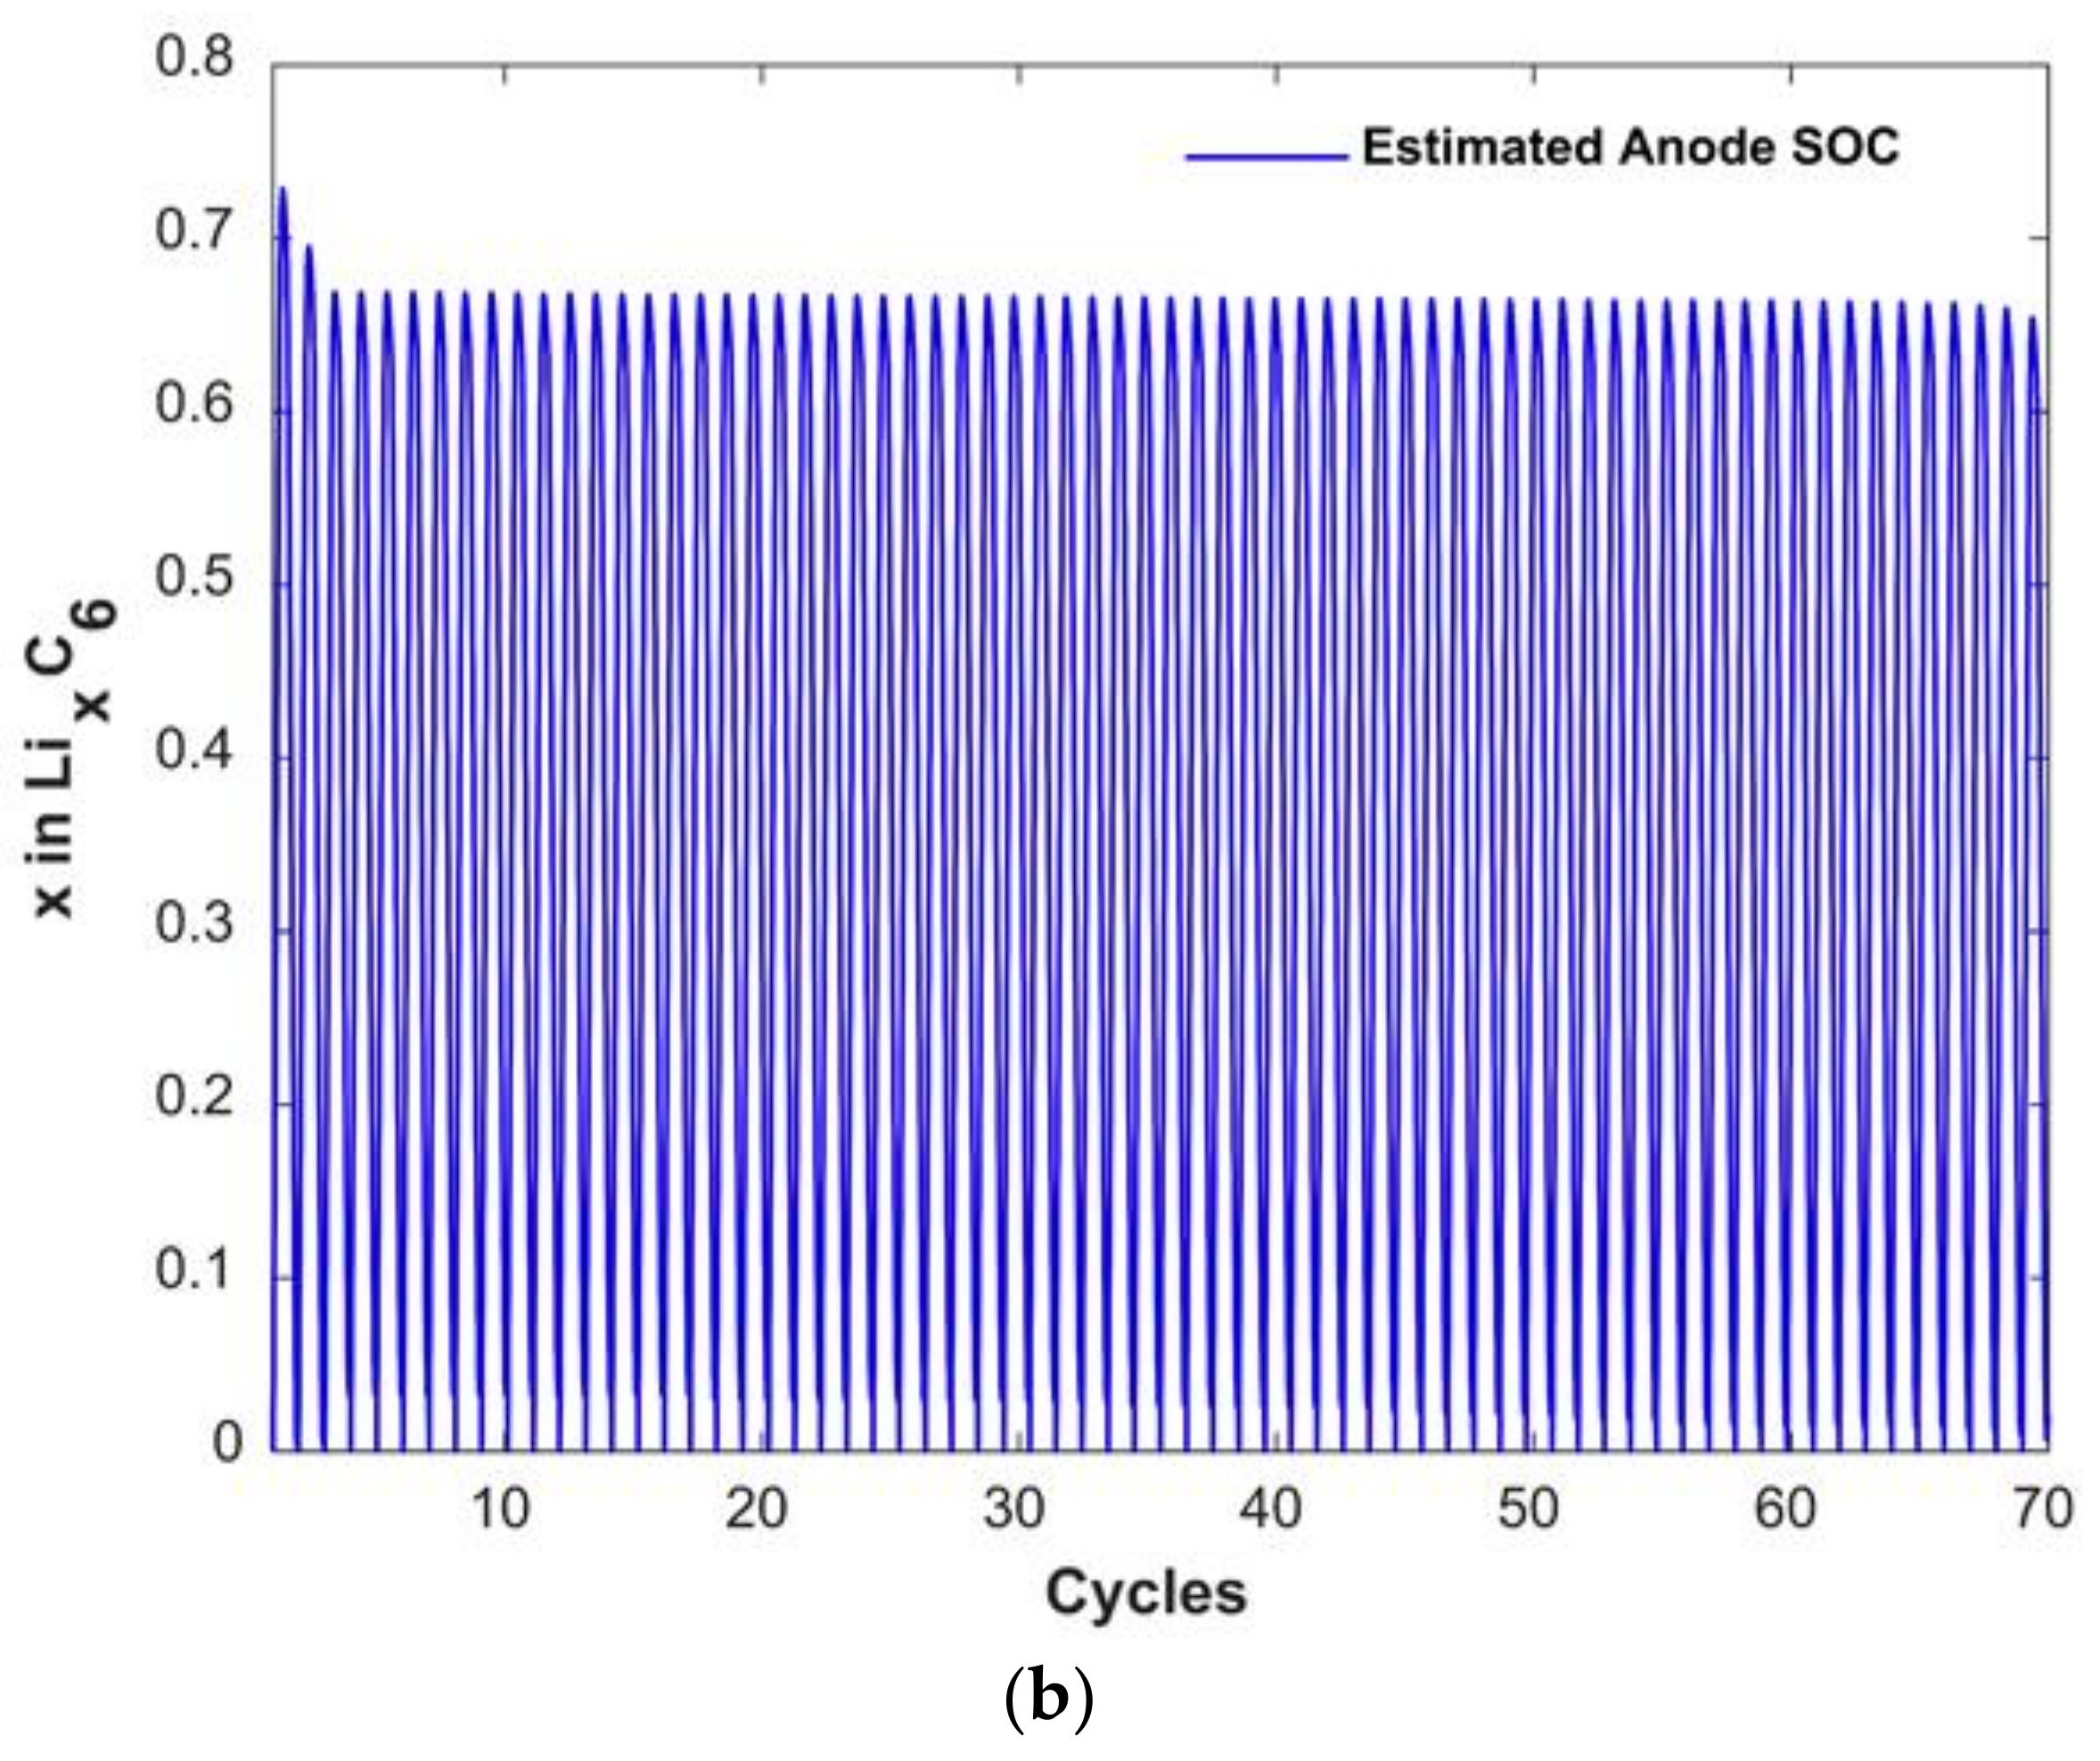
3.2. Anode Capacity Fade and Anode SOC
3.3. Degradation Discussion
3.4. Comparison to the Existing Research
4. Conclusions
Author Contributions
Funding
Conflicts of Interest
References
- Rahman, A.; Lin, X. Li-ion battery individual electrode state of charge and degradation monitoring using battery casing through auto curve matching for standard CCCV charging profile. Appl. Energy 2022, 321, 119367. [Google Scholar] [CrossRef]
- Cuma, M.U.; Koroglu, T. A comprehensive review on estimation strategies used in hybrid and battery electric vehicles. Renew. Sustain. Energy Rev. 2015, 42, 517–531. [Google Scholar] [CrossRef]
- Farmann, A.; Waag, W.; Marongiu, A.; Sauer, D.U. Critical review of on-board capacity estimation techniques for lithium-ion batteries in electric and hybrid electric vehicles. J. Power Source 2015, 281, 114–130. [Google Scholar] [CrossRef]
- Farag, M.; Fleckenstein, M.; Habibi, S.R. Li-Ion Battery SOC Estimation Using Nonlinear Estimation Strategies Based on Equivalent Circuit Models. SAE Int. 2014, 1, 1–11. [Google Scholar] [CrossRef]
- Chang, W.-Y. The State of Charge Estimating Methods for Battery: A Review. ISRN Appl. Math. 2013, 2013, 953792. [Google Scholar] [CrossRef]
- Ng, K.S.; Moo, C.-S.; Chen, Y.-P.; Hsieh, Y.-C. Enhanced coulomb counting method for estimating state-of-charge and state-of-health of lithium-ion batteries. Appl. Energy 2009, 86, 1506–1511. [Google Scholar] [CrossRef]
- Hannan, M.A.; Lipu, M.S.H.; Hussain, A.; Mohamed, A. A review of lithium-ion battery state of charge estimation and management system in electric vehicle applications: Challenges and recommendations. Renew. Sustain. Energy Rev. 2017, 78, 834–854. [Google Scholar] [CrossRef]
- Lai, X.; Zheng, Y.; Sun, T. A comparative study of different equivalent circuit models for estimating state-of-charge of lithium-ion batteries. Electrochim. Acta 2018, 259, 566–577. [Google Scholar] [CrossRef]
- Lee, S.; Kim, J.; Lee, J.; Cho, B.H. State-of-charge and capacity estimation of lithium-ion battery using a new open-circuit voltage versus state-of-charge. J. Power Source 2008, 185, 1367–1373. [Google Scholar] [CrossRef]
- Ma, Y.; Zhou, X.; Li, B.; Chen, H. Fractional modeling and SOC estimation of lithium-ion battery. IEEE/CAA J. Autom. Sin. 2016, 3, 281–287. [Google Scholar] [CrossRef]
- Andre, D.; Appel, C.; Soczka-Guth, T.; Sauer, D.U. Advanced mathematical methods of SOC and SOH estimation for lithium-ion batteries. J. Power Source 2013, 224, 20–27. [Google Scholar] [CrossRef]
- Tang, X.; Liu, B.; Gao, F. State of Charge Estimation of LiFePO 4 Battery Based on a Gain-classifier Observer. Energy Procedia 2017, 105, 2071–2076. [Google Scholar] [CrossRef]
- Hu, X.; Xu, L.; Lin, X.; Pecht, M. Battery Lifetime Prognostics. Joule 2020, 4, 310–346. [Google Scholar] [CrossRef]
- Han, X.; Ouyang, M.; Lu, L.; Li, J.; Zheng, Y.; Li, Z. A comparative study of commercial lithium ion battery cycle life in electrical vehicle: Aging mechanism identification. J. Power Source 2014, 251, 38–54. [Google Scholar] [CrossRef]
- Aurbach, D.; Markovsky, B.; Talyossef, Y.; Salitra, G.; Kim, H.-J.; Choi, S. Studies of cycling behavior, ageing, and interfacial reactions of LiNi0.5Mn1.5O4 and carbon electrodes for lithium-ion 5-V cells. J. Power Source 2006, 162, 780–789. [Google Scholar] [CrossRef]
- Xu, B.; Oudalov, A.; Ulbig, A.; Andersson, G.; Kirschen, D.S. Modeling of Lithium-Ion Battery Degradation for Cell Life Assessment. IEEE Trans. Smart Grid 2018, 9, 1131–1140. [Google Scholar] [CrossRef]
- Li, J.; Adewuyi, K.; Lotfi, N.; Landers, R.G.; Park, J. A single particle model with chemical/mechanical degradation physics for lithium ion battery State of Health (SOH) estimation. Appl. Energy 2018, 212, 1178–1190. [Google Scholar] [CrossRef]
- Shrivastava, P.; Soon, T.K.; Idris, M.Y.I.B.; Mekhilef, S. Overview of model-based online state-of-charge estimation using Kalman filter family for lithium-ion batteries. Renew. Sustain. Energy Rev. 2019, 113, 109233. [Google Scholar] [CrossRef]
- Chen, X.; Chen, X.; Chen, X. A novel framework for lithium-ion battery state of charge estimation based on Kalman filter Gaussian process regression. Int. J. Energy Res. 2021, 45, 13238–13249. [Google Scholar] [CrossRef]
- Lai, X.; Qin, C.; Gao, W.; Zheng, Y.; Yi, W. A State of Charge Estimator Based Extended Kalman Filter Using an Electrochemistry-Based Equivalent Circuit Model for Lithium-Ion Batteries. Appl. Sci. 2018, 8, 1592. [Google Scholar] [CrossRef] [Green Version]
- Dai, H.; Wei, X.; Sun, Z.; Wang, J.; Gu, W. Online cell SOC estimation of Li-ion battery packs using a dual time-scale Kalman filtering for EV applications. Appl. Energy 2012, 95, 227–237. [Google Scholar] [CrossRef]
- Guo, Z.; Qiu, X.; Hou, G.; Liaw, B.Y.; Zhang, C. State of health estimation for lithium ion batteries based on charging curves. J. Power Source 2014, 249, 457–462. [Google Scholar] [CrossRef]
- He, W.; Williard, N.; Chen, C.; Pecht, M. State of charge estimation for Li-ion batteries using neural network modeling and unscented Kalman filter-based error cancellation. Int. J. Electr. Power Energy Syst. 2014, 62, 783–791. [Google Scholar] [CrossRef]
- Wei, M.; Ye, M.; Li, J.B.; Wang, Q.; Xu, X.X. State of charge estimation for lithium-ion batteries using dynamic neural network based on sine cosine algorithm. Proc. Inst. Mech. Eng. Part D J. Automob. Eng. 2022, 236, 241–252. [Google Scholar] [CrossRef]
- Deng, Z.; Hu, X.; Lin, X.; Che, Y.; Xu, L.; Guo, W. Data-driven state of charge estimation for lithium-ion battery packs based on Gaussian process regression. Energy 2020, 205, 118000. [Google Scholar] [CrossRef]
- Tian, J.; Xiong, R.; Shen, W.; Sun, F. Electrode ageing estimation and open circuit voltage reconstruction for lithium ion batteries. Energy Storage Mater. 2021, 37, 283–295. [Google Scholar] [CrossRef]
- Lee, S.; Siegel, J.B.; Stefanopoulou, A.G.; Lee, J.-W.; Lee, T.-K. Electrode State of Health Estimation for Lithium Ion Batteries Considering Half-cell Potential Change Due to Aging. J. Electrochem. Soc. 2020, 167, 090531. [Google Scholar] [CrossRef]
- Ives, D.J.G.; Janz, G.J.; King, C.V. Reference Electrodes: Theory and Practice. J. Electrochem. Soc. 1961, 108, 246Ca. [Google Scholar] [CrossRef]
- McTurk, E.; Birkl, C.R.; Roberts, M.R.; Howey, D.A.; Bruce, P.G. Minimally Invasive Insertion of Reference Electrodes into Commercial Lithium-Ion Pouch Cells. ECS Electrochem. Lett. 2015, 4, A145–A147. [Google Scholar] [CrossRef] [Green Version]
- Somerville, L.; Ferrari, S.; Lain, M.; McGordon, A.; Jennings, P.; Bhagat, R. An In-Situ Reference Electrode Insertion Method for Commercial 18650-Type Cells. Batteries 2018, 4, 18. [Google Scholar] [CrossRef] [Green Version]
- Raccichini, R.; Amores, M.; Hinds, G. Critical review of the use of reference electrodes in li-ion batteries: A diagnostic perspective. Batteries 2019, 5, 12. [Google Scholar] [CrossRef] [Green Version]
- Klett, M.; Gilbert, J.A.; Trask, S.E.; Polzin, B.J.; Jansen, A.N.; Dees, D.W.; Abraham, D.P. Electrode Behavior RE-Visited: Monitoring Potential Windows, Capacity Loss, and Impedance Changes in Li1.03 (Ni0.5 Co0.2 Mn0.3)0.97 O2/Silicon-Graphite Full Cells. J. Electrochem. Soc. 2016, 163, A875–A887. [Google Scholar] [CrossRef]
- Nagasubramanian, G.; Doughty, D.H. 18650 Li-ion cells with reference electrode and in situ characterization of electrodes. J. Power Source 2005, 150, 182–186. [Google Scholar] [CrossRef]
- An, S.J.; Li, J.; Daniel, C.; Kalnaus, S.; Wood, D.L. Design and Demonstration of Three-Electrode Pouch Cells for Lithium-Ion Batteries. J. Electrochem. Soc. 2017, 164, A1755–A1764. [Google Scholar] [CrossRef]
- Belt, J.R.; Bernardi, D.M.; Utgikar, V. Development and Use of a Lithium-Metal Reference Electrode in Aging Studies of Lithium-Ion Batteries. J. Electrochem. Soc. 2014, 161, A1116–A1126. [Google Scholar] [CrossRef]
- Dollé, M.; Orsini, F.; Gozdz, A.S.; Tarascon, J.-M. Development of Reliable Three-Electrode Impedance Measurements in Plastic Li-Ion Batteries. J. Electrochem. Soc. 2001, 148, A851–A857. [Google Scholar] [CrossRef]
- Vidal-Iglesias, F.J.; Solla-Gullón, J.; Rodes, A.; Herrero, E.; Aldaz, A. Understanding the Nernst Equation and Other Electrochemical Concepts: An Easy Experimental Approach for Students. J. Chem. Educ. 2012, 89, 936–939. [Google Scholar] [CrossRef]
- Dewangga, B.R.; Herdjunanto, S.; Cahyadi, A. Unknown Input Observer for Battery Open Circuit Voltage Estimation: An LMI Approach. In Proceedings of the 2018 10th International Conference on Information Technology and Electrical Engineering (ICITEE), Bali, Indonesia, 24–26 July 2018; pp. 471–475. [Google Scholar] [CrossRef]
- Nazari, S. The Unknown Input Observer and its Advantages with Examples. arXiv 2015, arXiv:1504.07300. [Google Scholar] [CrossRef]
- Darouach, M.; Zasadzinski, M.; Xu, S.J. Full-order observers for linear systems with unknown inputs. IEEE Trans. Autom. Control 1994, 39, 606–609. [Google Scholar] [CrossRef] [Green Version]
- Chen, W.; Saif, M. Unknown input observer design for a class of nonlinear systems: An LMI approach. In Proceedings of the 2006 American Control Conference, Minneapolis, MN, USA, 14–16 June 2006; p. 5. [Google Scholar] [CrossRef]
- He, H.; Xiong, R.; Fan, J. Evaluation of Lithium-Ion Battery Equivalent Circuit Models for State of Charge Estimation by an Experimental Approach. Energies 2011, 4, 582–598. [Google Scholar] [CrossRef]
- Chen, J.; Wang, R.; Li, Y.; Xu, M. A Simplified Extension of Physics-Based Single Particle Model for Dynamic Discharge Current. IEEE Access 2019, 7, 186217–186227. [Google Scholar] [CrossRef]


| Specification | Battery |
|---|---|
| Cell type | UR18650AA. Sanyo |
| Electrode material | Li(Ni0.8Co0.1Mn0.1)O2/graphite |
| Nominal capacity (C) | 2.25 Ah |
| Charge cut-off voltage | 4.2 V |
| Discharge cut-off voltage | 2.5 V |
| Charge and discharge cut-off current | 0.02 C |
| Standard charging current | 0.7 C |
| Testing Ttemperature | 25 °C |
| Parameters | Symbol | Value |
|---|---|---|
| Cell capacity | 2.22 Ah | |
| Ohmic resistance | 0.012 Ω | |
| Polarization resistance | 0.031 Ω | |
| Polarization capacitance | 1900 F |
| Initial Capacity | Estimated (Ah) | Calculated (Ah) |
|---|---|---|
| Cell type | UR18650AA. Sanyo | UR18650AA. Sanyo |
| Cell | 2.22 | 2.22 |
| Anode | 2.88 | 3.09 |
Publisher’s Note: MDPI stays neutral with regard to jurisdictional claims in published maps and institutional affiliations. |
© 2022 by the authors. Licensee MDPI, Basel, Switzerland. This article is an open access article distributed under the terms and conditions of the Creative Commons Attribution (CC BY) license (https://creativecommons.org/licenses/by/4.0/).
Share and Cite
Rahman, A.; Lin, X.; Wang, C. Li-Ion Battery Anode State of Charge Estimation and Degradation Monitoring Using Battery Casing via Unknown Input Observer. Energies 2022, 15, 5662. https://doi.org/10.3390/en15155662
Rahman A, Lin X, Wang C. Li-Ion Battery Anode State of Charge Estimation and Degradation Monitoring Using Battery Casing via Unknown Input Observer. Energies. 2022; 15(15):5662. https://doi.org/10.3390/en15155662
Chicago/Turabian StyleRahman, Ashikur, Xianke Lin, and Chongming Wang. 2022. "Li-Ion Battery Anode State of Charge Estimation and Degradation Monitoring Using Battery Casing via Unknown Input Observer" Energies 15, no. 15: 5662. https://doi.org/10.3390/en15155662
APA StyleRahman, A., Lin, X., & Wang, C. (2022). Li-Ion Battery Anode State of Charge Estimation and Degradation Monitoring Using Battery Casing via Unknown Input Observer. Energies, 15(15), 5662. https://doi.org/10.3390/en15155662