Article

Power Supply and Control Unit for Actively Heated Protective Clothing with Photovoltaic Energy Harvesting

by
Bartosz Pękosławski
1,*,
Paweł Marciniak
1,
Łukasz Starzak
1,
Adam Stawiński
1 and
Grażyna Bartkowiak
2
1
Department of Microelectronics and Computer Science, Lodz University of Technology, 93-005 Lodz, Poland
2
Department of Personal Protective Equipment, Central Institute for Labour Protection—National Research Institute, 90-133 Lodz, Poland
*
Author to whom correspondence should be addressed.
Energies 2022, 15(15), 5656; https://doi.org/10.3390/en15155656
Submission received: 14 June 2022 / Revised: 27 July 2022 / Accepted: 1 August 2022 / Published: 4 August 2022

Abstract

:
An active heating system has been developed for application in smart clothing for mountain rescuers. It uses a set of sensors and is aimed at gathering necessary data for the elaboration and testing of an automatic control algorithm. The system is powered by a lithium-ion battery pack, which can be additionally charged from flexible PV modules. The article presents an estimation of this system’s power supply requirements and its energy budget. Since the system’s maximum operation time strongly depends on the efficiency of its main power converter, the design of the latter was based on a model enabling power loss estimation in its particular components. Characteristics ultimately measured on a prototype showed a high agreement with simulations. Furthermore, five different arrangements of PV modules were studied in order to find the most effective one. The system was tested in real conditions for the three most promising PV module configurations.

1. Introduction

Mountain rescuers often work in unfavorable weather conditions, usually for several hours. Apart from low air temperatures, they are exposed to wind gusts, high humidity, and precipitation, which make the feeling of cold even more disturbing. The rescuers need special clothing, which provides them with thermal protection. Traditional clothing is based on multilayer materials to achieve good thermal isolation. This approach is disadvantageous because of the reduction in the user’s mobility and general discomfort. The thermal isolation of clothing can be improved by the application of active heating pads. Such solutions are widely used in a range of commercially available electrically heated jackets [1,2,3,4], vests [1,3,4], shirts [3], top and bottom base layers [4,5], head and neck wears [4], back braces [5], gloves [1,4,5] or insoles [4,5]. This paper concerns a power supply and control module for a heating system intended for integration with protective clothing to be used by mountain rescuers during their operations.
The electric energy needed to power the heating pads must be stored in batteries that add extra weight and may impede the rescuer’s actions. The power consumption of the considered heating system can be optimized by an advanced control method taking into account both environmental conditions and the body’s microclimate. This requires the use of sensors whose types and locations should be chosen carefully so that their output signals can be correctly read and interpreted by the control unit. The control algorithm should optimize the electric energy consumption while adapting to the user’s preferences.
The system presented in this article is wearable and can be treated as an IoT (Internet of Things) solution. The wearable device market has been growing in recent decades. Smart wearables typically include many functionalities such as physiological sensors, processing units, and wireless communication. The number of these functions is constantly rising, resulting in an increase in energy consumption and the need to recharge the battery more often. The system operation time can be increased by using an energy harvester. However, the latter needs to be easily integrated with clothing and cannot deteriorate its ergonomics. PV (photovoltaic) modules are more advantageous in this respect than biomechanical energy transducers [6,7]. Easy integration with clothing as well as the user’s comfort dictates the use of flexible modules. A review of different types of flexible PV solar cells, their structure, and operation principles, together with practical applications including wearable solutions, may be found in [8].
A wearable solar energy harvesting system with a flexible battery and a semi-flexible solar module has been presented in [9], where the supplied device is based on a BLE (Bluetooth Low Energy) microprocessor module. The device was tested during everyday activities to estimate the increase in battery life resulting from the use of photovoltaics. The tests included different light conditions (no sunlight, indirect sunlight, and direct sunlight) as well as four different daily routines and conditions (working days or weekends, winter or spring, sunny or cloudy weather). The greatest increase in operating time (148%) was achieved over three working days in spring.
Most wearable appliances with solar energy harvesting are designed to measure simple vital functions [10,11,12,13,14,15]. The paper [10] presents the design and operation of a wearable health monitoring device with an integrated flexible lithium-ion battery and a flexible amorphous silicon PV module. The current-voltage characteristics of the PV module and the charging characteristics of the battery were collected under both indoor and outdoor lighting. Tests were conducted at different light intensities, but the effect of PV module placement was not investigated.
The IoT system presented in [11] can measure heart rate and body temperature, and it communicates with a mobile phone using BLE. Energy is harvested there using a flexible PV module, but the supply power required is low (approximately 40 mW). The study compares the presented device with similar systems in terms of energy demand and operating time. However, it does not include any analysis of the effect of PV module orientation with respect to the azimuth of the Sun.
A self-powered and wearable IoT cardiac arrhythmia detection system was presented in [13], where a microprocessor system using BLE communication is additionally powered by a single rigid PV module. The latter was mounted on the arm, but the paper does not discuss the selection of this location. Moreover, the estimate of the operating time extension seems to be based on several parameters (PV module efficiency, converter efficiency, and supply current demand) assumed, rather than measured in real use.
A prototype helmet for cyclists equipped with an accident alarm system powered by an array of PV cells was described in [16]. The total current and voltage of the array were measured in a two-stage procedure consisting of laboratory tests and field tests. The field tests included both stationary and dynamic conditions, but they were only conducted in sunny weather, at a single time of the day, and for a single PV cell arrangement.
The development of a prototype solar-powered backpack for camping and hitchhiking was presented in [17]. It was equipped with two PV modules (12 W each) and a 12 V, 7 Ah lead-acid battery. The PV modules were placed on the back of the backpack. The paper lacks any measurement data on the energy harvested. Similar research was described in [18], where PV modules mounted on a backpack were used to charge a mobile phone. The research focused on measuring the current generated by the PV modules and the state of charge of the battery pack. However, the effect of module arrangement on the backpack on the generated power was not investigated.
In [19], a tote bag was presented for charging mobile devices such as phones or portable batteries, with four identical PV panels located on the same outside surface. The aim of this work was to compare different power converter architectures. For this purpose, realistic time profiles of each module irradiance were measured through the respective short-circuit currents. However, measurements were only conducted at a single time of the day, under bright sun. A second set of irradiance profiles was obtained from the original one by manually lowering the irradiance to simulate an almost full shading of a particular module.
TEGs (thermoelectric generators) have also been analyzed as energy harvesters in the context of wearable sensors. They were shown low conversion efficiency and low output power of the order of 10 µW/cm2 [20]. When such a generator is integrated into clothing, there is no direct contact with the skin, leading to an output power as low as 0.5 to 1.25 µW (2.6 to 6.5 nW/cm2) [21]. Thus, these sources are not able to provide sufficient power to serve as the sole power source even for low-power wearable sensor systems, which draw an average of 10 mW [14]. When TEGs are combined with PV modules in one wearable system, such as the one described in [15], they provide a negligible contribution to total generated power.
Due to the growing interest in wearable electronics using PV modules, there is a substantial amount of research focusing on suitable materials. The review [22] provides up-to-date information on PV module integration with clothing or textiles. Out of the many approaches presented, only a few have resulted in prototype products with textile properties.
The efficiency of commercially available products still does not exceed 4% [23,24], which is much lower than for rigid modules. It is therefore important to optimize their layout so as to maximize the energy yield. In this article, several different arrangements suitable for the integration with a jacket or with a backpack are analyzed.
Table 1 presents a comparison of the studies on PV energy harvesting in wearable solutions described in the literature. In their context, the main novelty of the research presented in this paper is the application of the flexible PV modules in electrically heated clothing as well as the analysis of possible arrangements of the modules when placed on different clothing types, with each of the studied configurations having nearly the same active area for comparability. Moreover, this study was performed in a novel, two-step procedure. The first step concerned the PV modules and their configurations, all tested at various times of the day and for six Sun azimuth angles representing different silhouette positions. The second step consisted of tests in real conditions and use scenarios, with the PV modules connected to the system with the target battery and the charging controller to reflect its power losses as well as the battery load currents for the supplying electronic part of the system. These tests were performed in various weather conditions and for representative time periods. The paper also refers to the system design, with a special emphasis on the efficiency of power processing circuits.
To optimize the system, it is necessary to minimize the power loss in its main power converter. This requires a suitable model to be used at the design stage. The approaches usually applied a range from simple ones lacking high accuracy [25], through moderately complex equations referring to basic device characteristics [26], to ones involving detailed analyses of switching processes and many parameters [27]. The validity of methods from the second group can be increased by introducing corrections to compensate for the simplifications applied [28]. In this work, a converter power loss model based on simple formulae was used.

2. System Architecture and Components

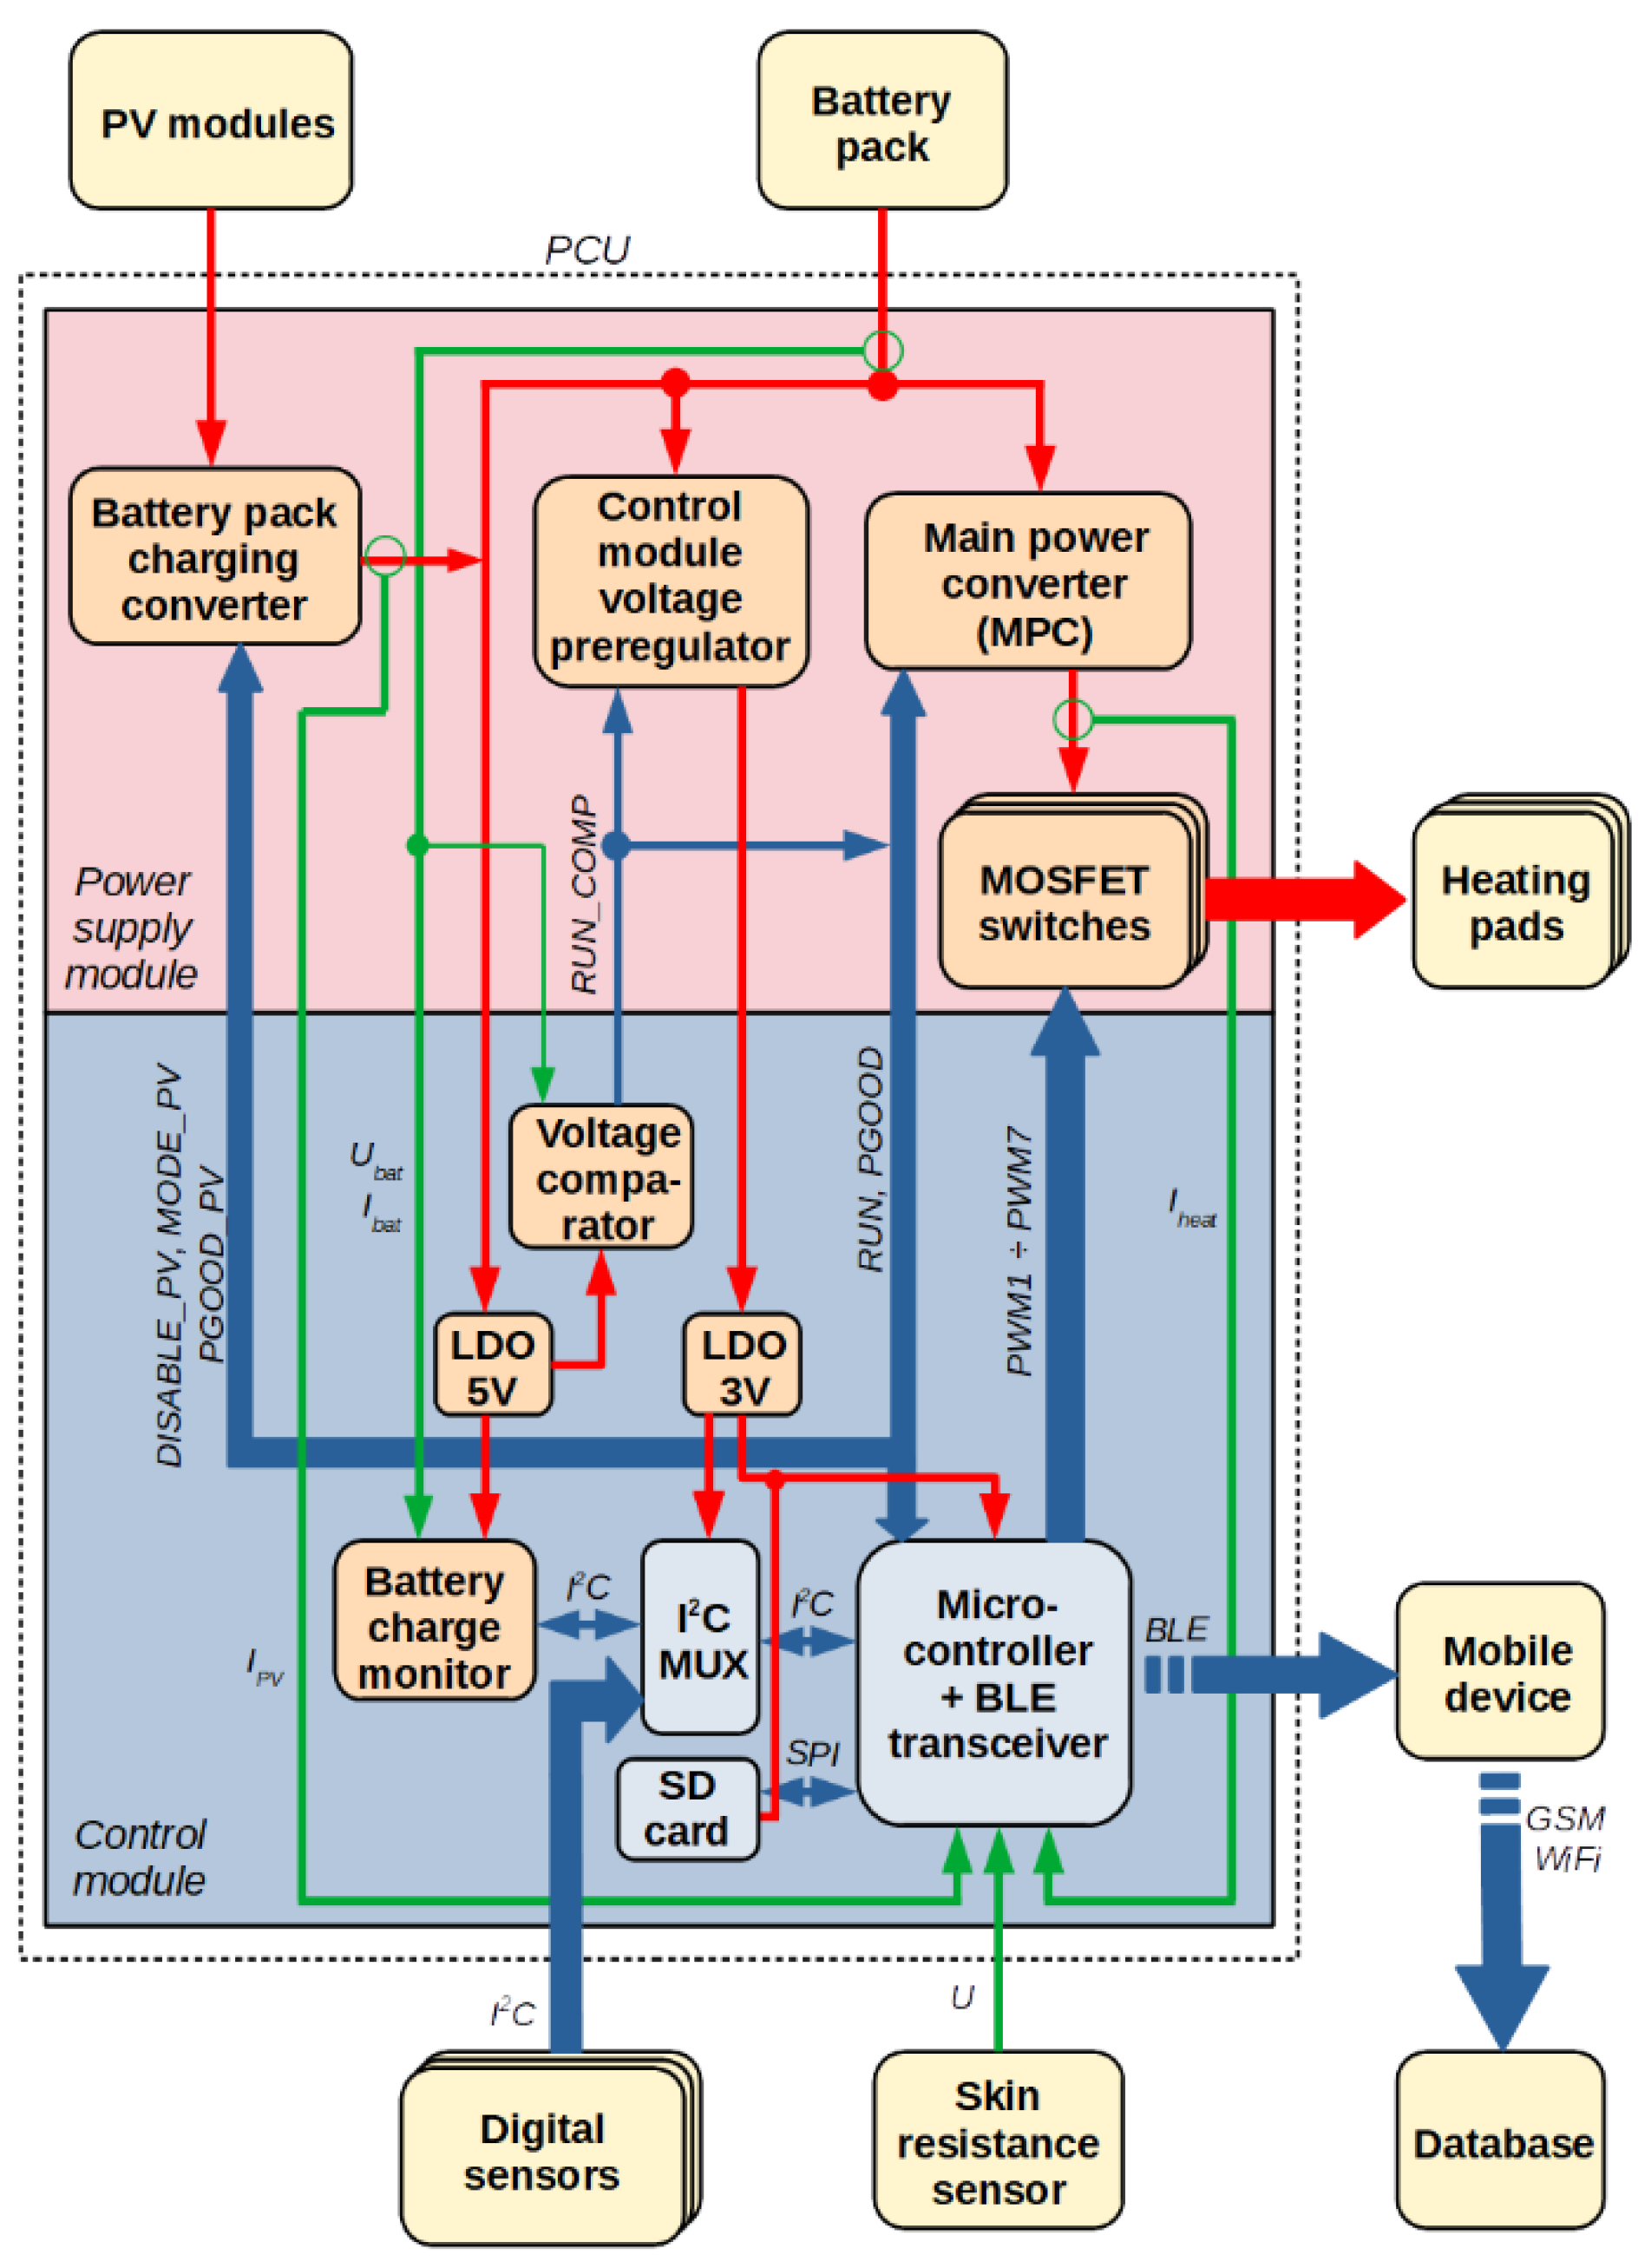
2.1. Complete System Structure

The structure of the designed heating system is shown in Figure 1. Its main components are a control module and a power supply module that together form a PCU (Power Supply and Control Unit). The control module communicates with sensors via an I2C bus and provides a BLE interface for data exchange with a mobile application. It also generates PWM (Pulse Width Modulation) and other control signals for the power supply module. The power supply module processes the electrical energy from a battery pack and supplies it to heating pads and any other electronic subsystems. It is also equipped with a PV module input for battery pack charging.
Outside the PCU, a mobile device with a dedicated application provides a user interface, runs an automatic control algorithm for achieving the thermal comfort of the user, and transmits information to a database. This database, set up on a remote server, stores sensor data and PCU operating parameters. The mobile device is supplied with its own battery, independent of the PCU.

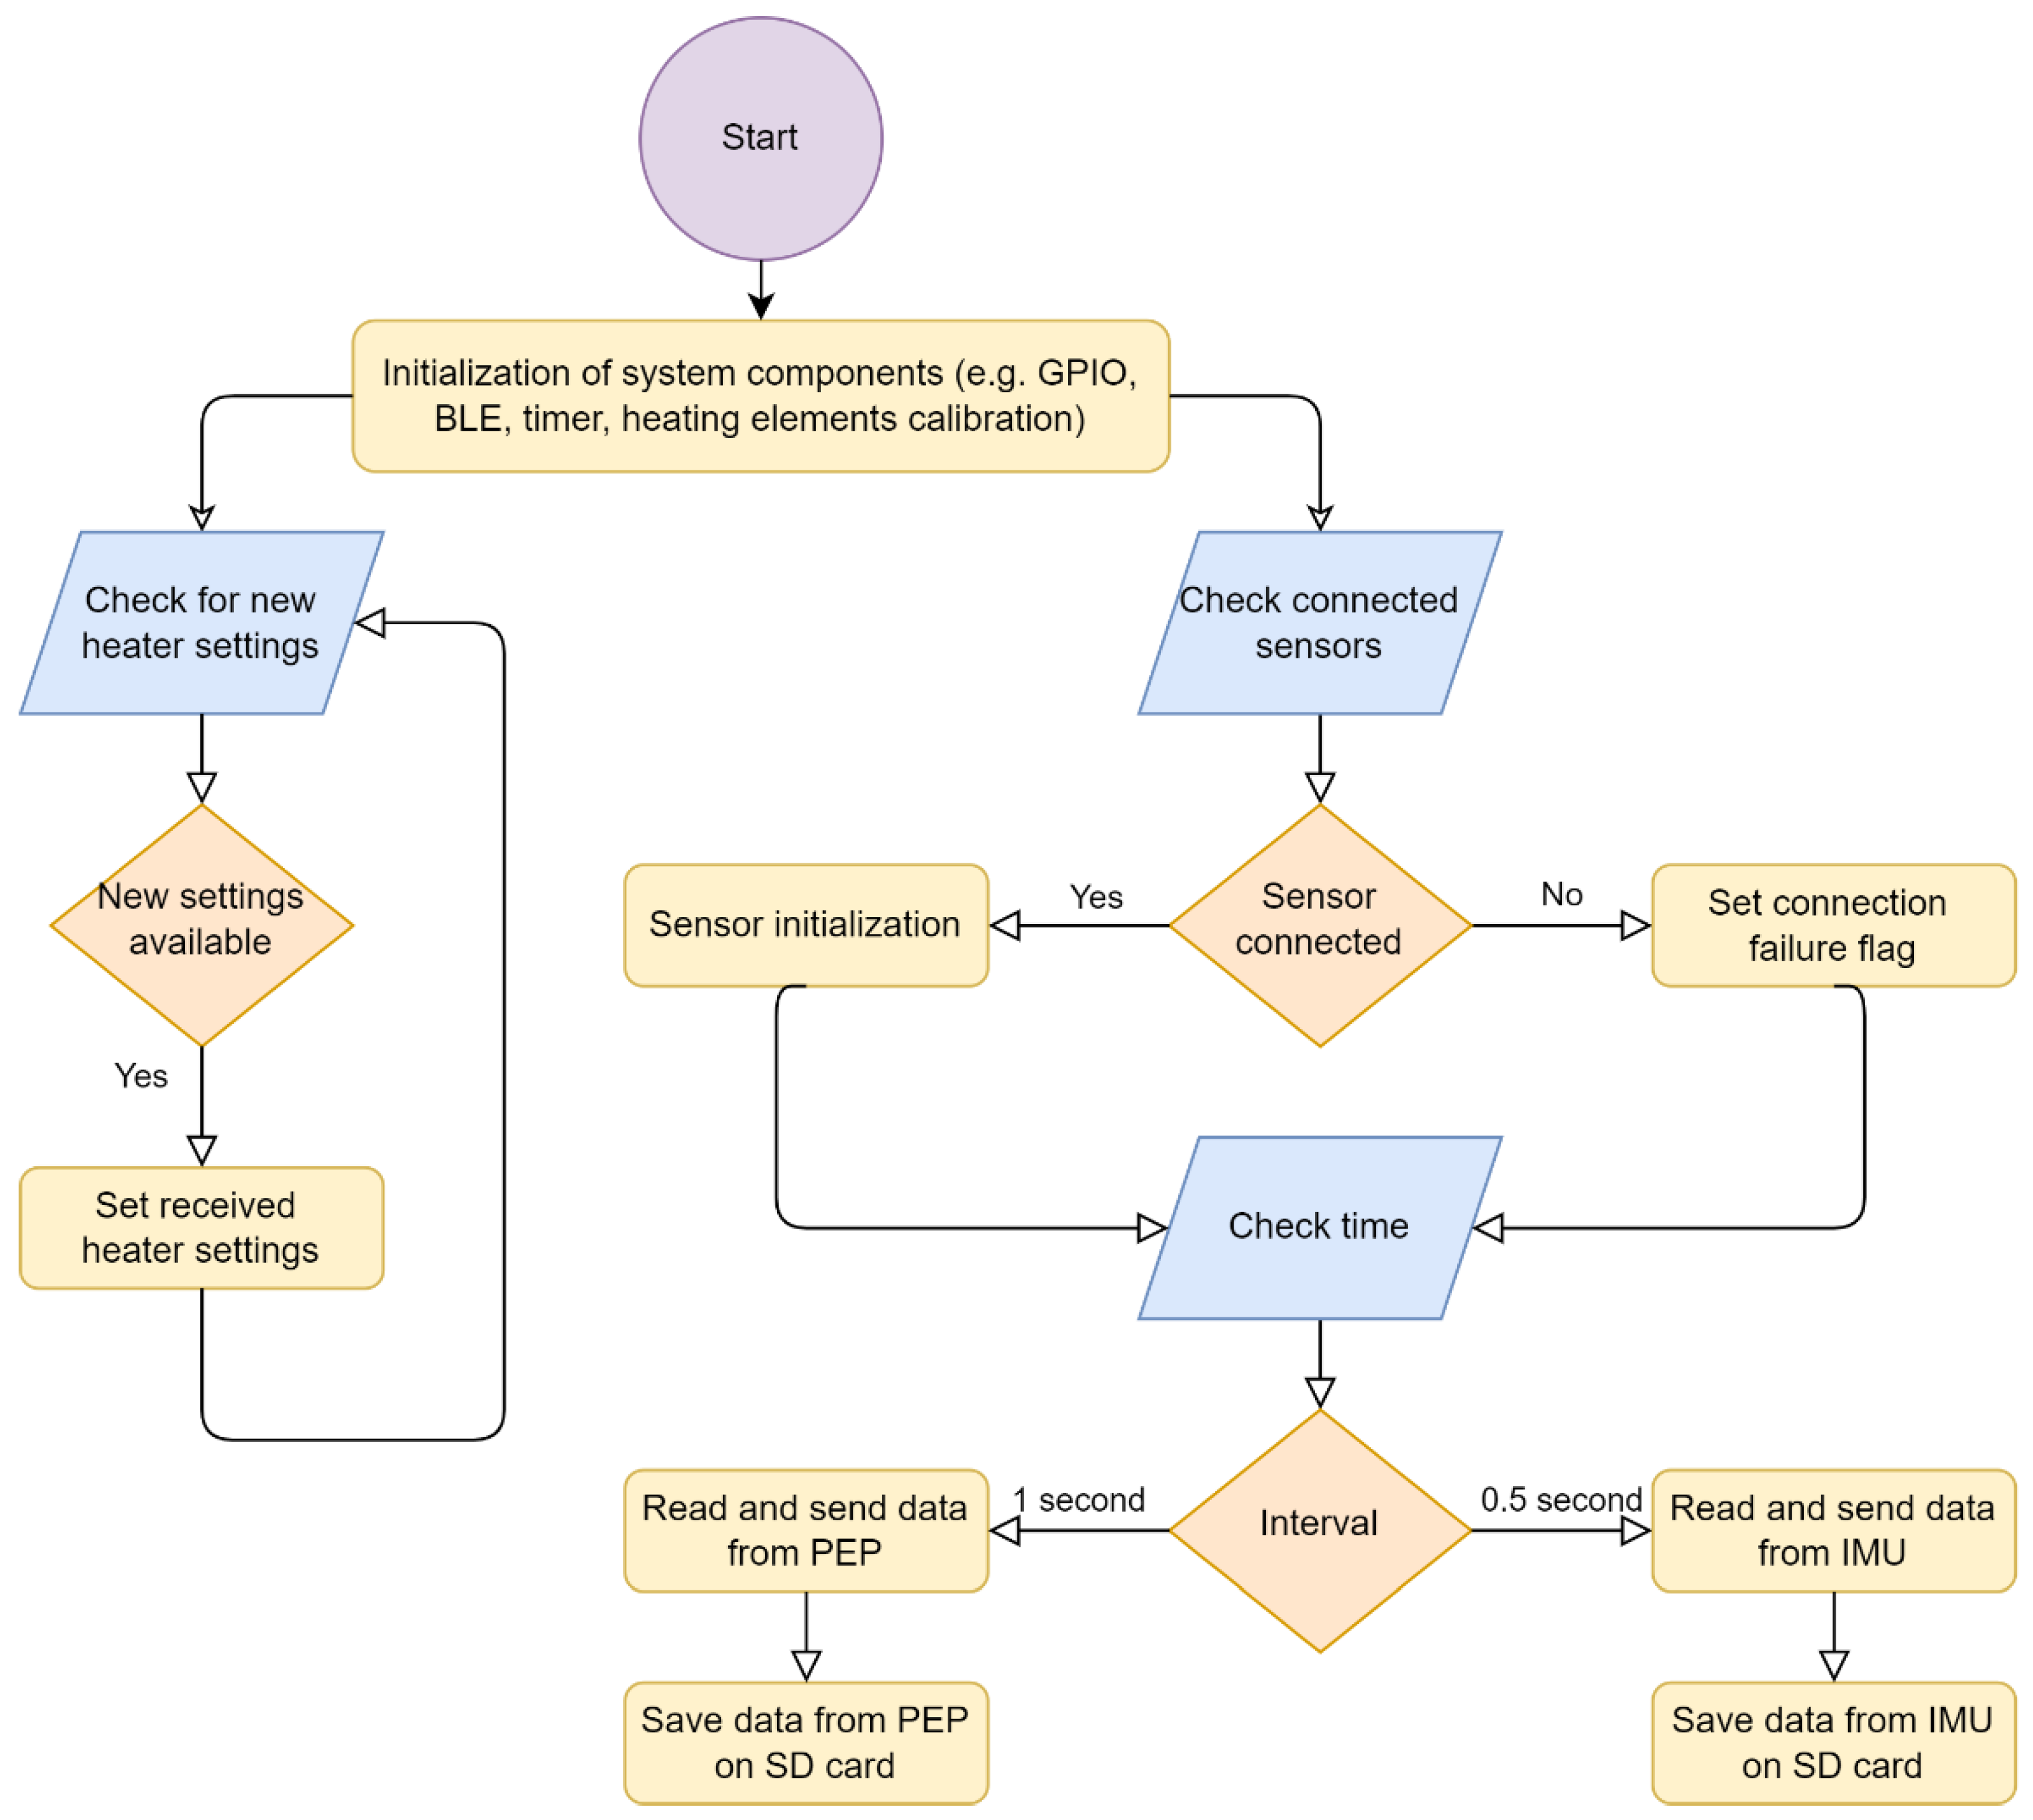
2.2. Control Module with Sensors

The control module is based on an ARM Cortex-M4 microprocessor with an integrated radio transceiver. Most of the applied sensors are digital ones with an I2C interface.
Figure 2 shows the algorithm implemented in the control module, whose principle is as follows.
  • On power-up, the system initializes all the necessary subsystems.
  • After the initialization process, the system checks which sensors have been connected. If a measuring device is detected, the respective connection is initialized and the sensor is calibrated.
  • After the sensors are initialized, the system enters a loop with a period of 0.05 s. The collected data can be divided into two groups related to separate Bluetooth transmission services: PEP (Physiological and Environmental Parameters) Service and IMU (Inertial Measurement Unit) Service. The PEP service collects data and sends them to the mobile device every 20th loop iteration (once per second). The IMU service gathers data every loop iteration (20 times per second) and sends a frame containing 10 measurements every 10th loop iteration (twice per second). Additionally, the collected data can be saved on the SD card.
  • Simultaneously with reading data from sensors, but asynchronously, the system is ready to receive heating pad settings from the mobile device.

2.3. Bluetooth Interface

Wireless communication is used in the system between the PCU and a mobile device (such as a smartphone or a smartwatch) for data collection and control of heating pads. It is based on Bluetooth Low Energy technology, which is frequently used in recent solutions for wearable systems, especially ones where biomedical signals are measured [29,30,31,32] or various environmental data are gathered [33]. This interface enables the connection to a majority of mobile devices while offering low power consumption, sufficient range, and data transmission bandwidth. The wearable solutions for continuous monitoring of fast varying signals such as EEG [29] or ECG [30,31] require data transmission speeds that are high enough for sampling rates from ca. 800 SPS (samples per second) up to 12,500 SPS. Still, these systems can operate for 38 h [29] or even 335 h [30] using a single small-size battery, such as a 3 V coin one [30,31,33]. To extend the operation time, either a larger-capacity battery can be used [32] or various hardware techniques can be applied, including waking the BLE interface for transmission only [29,30] or using a dedicated ultra-low power SoC for data acquisition and processing [29].
The communication with the mobile application is realized through the following services:
  • PEP Service: it is responsible for collecting all the data related to the user’s physiological parameters and environmental parameters.
  • IMU Service: it deals with data from a three-axis position IMU.
  • Heating Service: it is used to set the power of the heating pads.
  • Settings Service: it deals with information provided by the battery charge monitor as well as the total output current, the battery charging current, and the power supply block status.

2.4. Power Supply Module

The power supply module generates the necessary voltages for all the subsystems and provides the output current capability required by the heating pads. Its most important parts are:
  • An MPC (Main Power Converter), which is a synchronous buck converter regulating the heating pad supply voltage at the required level Uout;
  • Seven MOSFET low-side switches with their gate drivers for the low-frequency PWM control of the heating pads;
  • A control module supply voltage pre-regulator (a buck converter);
  • A battery pack charging converter, which is a buck-boost converter with an MPPT (Maximum Power Point Tracking) function intended for PV modules (connected in parallel via a setup of five Schottky diodes).
The MPC is turned on by the control module with the RUN signal. When output voltage regulation is unsuccessful (outside of a ±10% window), the PGOOD line is set low; otherwise, it remains in the high state. The control module supply voltage pre-regulator turns on automatically and provides a 3.3 V input voltage for a 3 V LDO (Low Drop-Out) linear regulator in the control module.
Both the MPC and the control module supply voltage pre-regulator are turned off by a voltage comparator in the control module when the battery pack voltage drops below a minimum threshold (the comparator being able to override the RUN signal with the RUN_COMP signal). Only the 5 V LDO in the control module remains active to preserve the operation of the battery charge monitor, whose supply current is very low (below 100 µA).

3. System Power Requirements and Energy Budget

3.1. Control Module Power Supply Requirements

When the system operates in its active state, all the control module components need to be supplied, continuously or periodically. The digital sensors operate mainly in a periodic manner and their average power consumption depends on both the single measurement duration and the measurement frequency. The analog GSR (Galvanic Skin Resistance) sensor, as well as the output and battery charging current amplifiers, operates in a continuous manner, and their power consumption is constant. The microcontroller requires power for sensor handling, which involves the operation of its I2C and ADC peripherals. Moreover, the microcontroller’s built-in SPI and PWM modules are active and consume power continuously. The process of writing measurement data to the SD card causes short supply current pulses of a high amplitude, which contribute to approximately half of the SD card’s average power consumption.
Relatively low power is required by the voltage comparator as well as for the operation of the voltage pre-regulator and the LDOs. However, the pre-regulator efficiency of approximately 85% and the unfavorable dependence of LDO efficiency on its input voltage and output current must also be taken into account.
The total control module power consumption, including power losses in its power processing circuits, has been estimated at 106 mW. This estimation assumes maximum supply currents of all components in their respective operation modes as configured in the system and a maximum battery pack voltage, for which maximum losses in the LDOs and in the pre-regulator should be observed. Table 2 presents details on the particular components’ shares of the estimated total power. The indicated low power requirement of the Bluetooth interface is justified in Section 3.2.

3.2. Bluetooth Interface Power Supply Requirements

The power consumption by the BLE module is mainly related to data transmission within the four services described in Section 2.3. Two of these services (Heater and Settings) operate in the read mode while the two others (PES and IMU) operate in the transmit mode.
Assuming a BLE transmission speed of 2 Mbit/s, the transmission of one byte of data takes 0.25 µs. Considering that:
  • The transmission occurs twice per second for the IMU Service (whose packet length is 135 bytes), once per second for the PEP Service (62 bytes), and once per second for the Setting Service (35 bytes), with an average current during transmission of 7.5 mA;
  • The asynchronous data reception by the Heater Service (20 bytes) takes place once per 5 s in the worst-case scenario, with an average current of 5.8 mA;
  • The BLE module requires a current of 0.002 mA in its idle state;
  • The supply voltage of the BLE controller is 3.0 V, and the average power consumption by the BLE module is 47 µW.

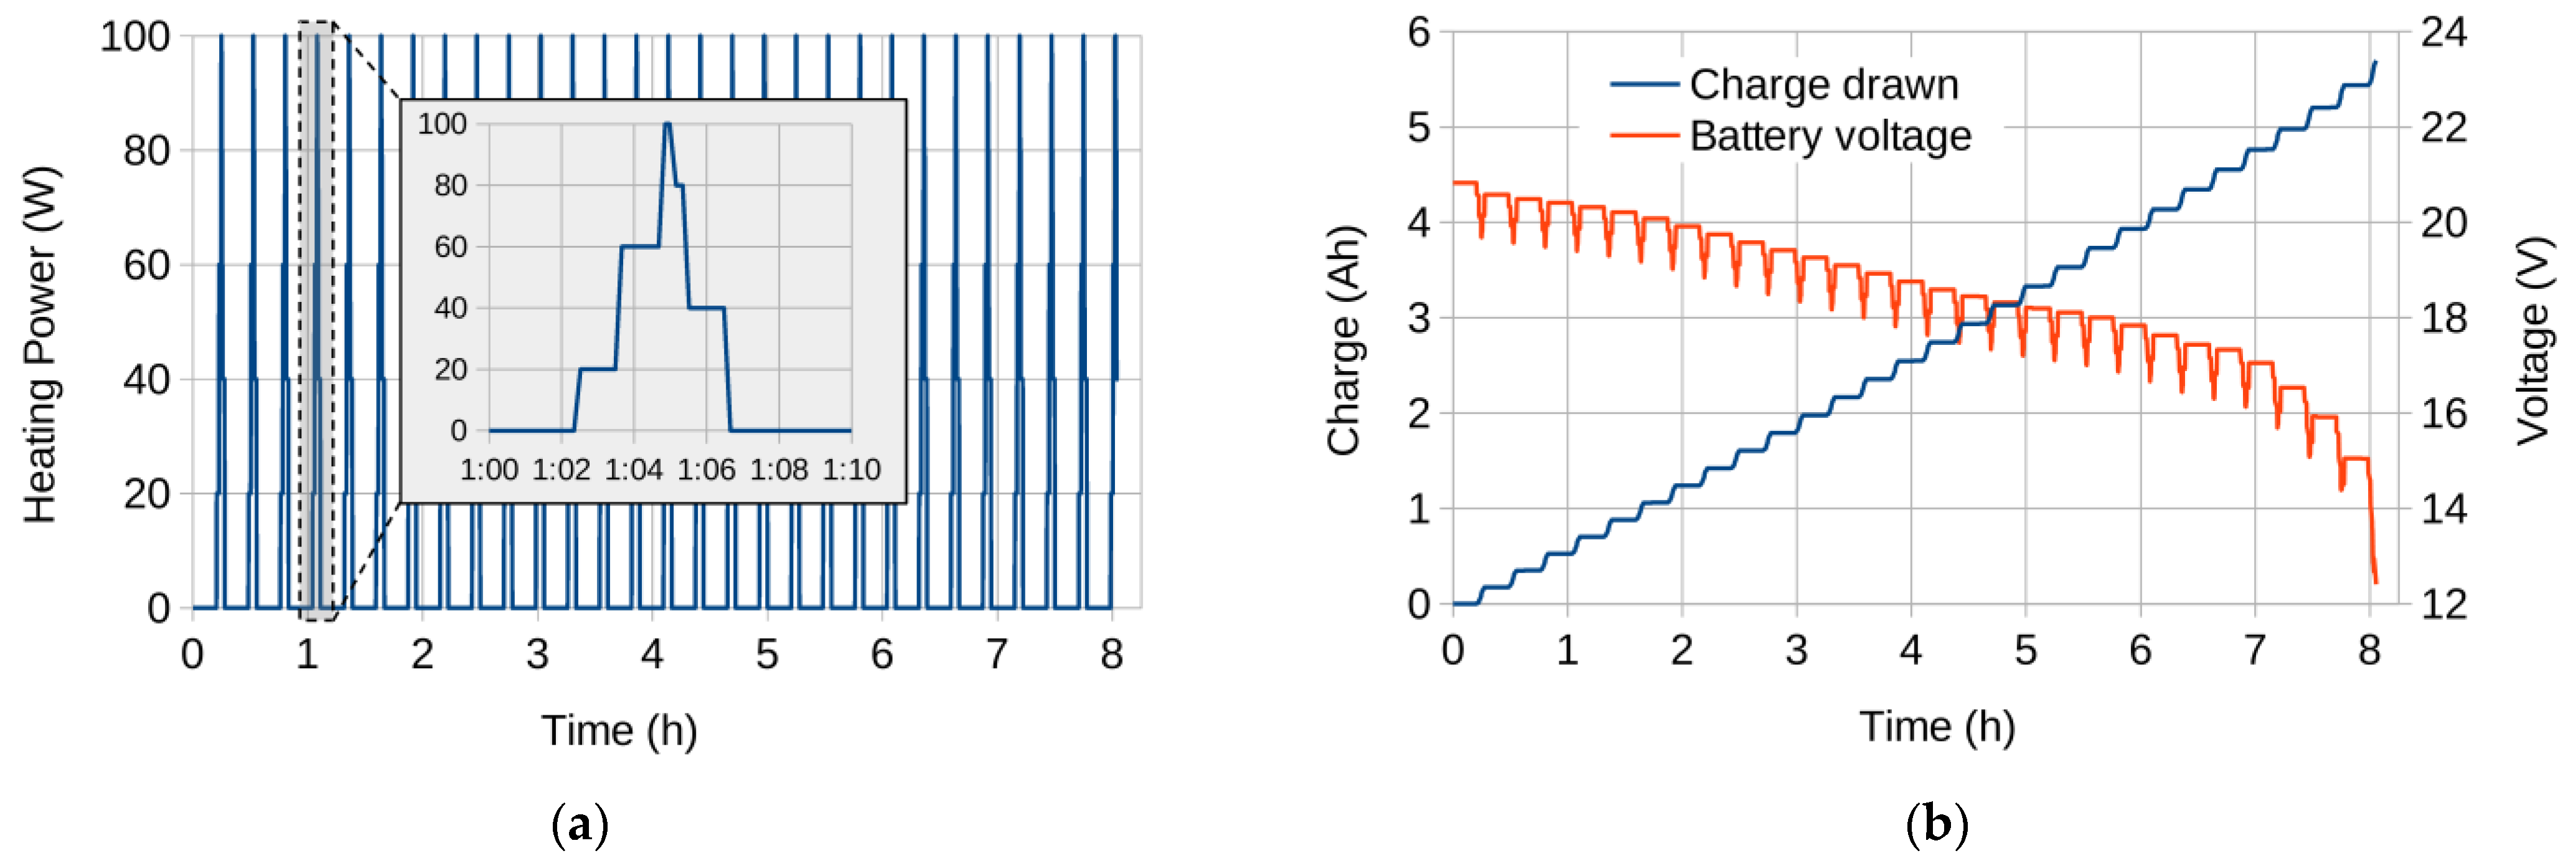
3.3. Heating Power Requirements

The heating system consists of seven pairs of resistive heating pads. The total output power of the first system version was 100 W and it was then reduced to 76 W after laboratory tests with mountain rescuers. The heating pad pair supply voltage Uout in both cases is equal to 11 V. These power values include losses in interconnecting wires, which have been estimated at 3% for the 100 W version and 2% for the 76 W one (assuming 1 m one-way average connection length between the PCU and each heating pad pair, and the use of a 0.15 Ω/m steel wire). The maximum total output current for all PWM channels is therefore 9.1 A (1.3 A per channel on average) and 6.9 A (0.99 A per channel on average) for the 100 W and 76 W versions, respectively. The spread of the measured heating pair resistances is 25% for the 100 W version and under 10% for the 76 W version.
An accurate estimation of the power of a single heating pad pair for a given duty cycle of the PWM control signal requires the resistance vs. power characteristic of each specific pad to be taken into account. These characteristics can be measured by the system and stored in its non-volatile memory in the form of correction coefficients for the duty cycle.

3.4. Overall Energy Budget

When the supply power requirement of the control module Pcm (approximately 0.11 W) is compared to the maximum (rated) heating power Pheat(max), which is 100 W or 76 W, it is clear that most of the electric energy is consumed in the system for heating purposes. Even for the lowest duty cycles of the PWM control signals that can be set by the user in the mobile application, which are equal to 20%, only 5% or 7% of power is consumed by the control blocks of the system. Moreover, the MPC introduces losses that add to the power consumption outside the control modules.
Denoting the main power converter efficiency by ηmpc, the required battery pack capacity Wbat for a demanded system operating time top can be calculated based on:
Wbat = [Uout·Iheat·ηmpc−1(Ubat, Iheat) + Pcmtop
where ηmpc is a function of both the battery pack voltage Ubat and the total heating pads’ current Iheat. To a first approximation, an average value of Ubat may be used. However, a more accurate analysis would require the exact variation in the battery pack voltage, and thus of ηmpc, in the time to be considered.
Equation (1) holds only for a zero battery pack charging current, which is the worst-case scenario. For a non-zero power delivered by the PV module set, the required battery capacity can be lower or the operation time will be longer for a given capacity. In order to determine the value of Wbat or top in this case, the battery charging block efficiency and the average power generated by the PV modules (or, alternatively, the average battery pack charging current and the average battery pack voltage) need to be known. A general formula for the required battery pack capacity W’bat when an average useful power Ppv delivered from the PV modules to the battery pack, is given by:
Wbat = [Uout·Iheat·ηmpc−1(Ubat, Iheat) + Pcm + Ppvtop
where Ppv is the product of the battery charging block efficiency ηbcb and the average PV module set power Ppv(in):
Ppv = ηbcb(Ubat, IpvPpv(in)
where ηbcb is a function of both the battery pack voltage Ubat and the battery pack charging current Ipv. The efficiency ηbcb should take into account not only the efficiency of the battery charging block, but also that of the battery pack itself. However, the last parameter is high for Li-ion batteries, whose coulombic efficiency is close to one, especially when a low charging current is applied. When the battery pack is charged from one of the PV module sets described in Section 5.3, the instantaneous charging current never exceeds 0.6 A, resulting in a maximum power loss of 0.036 W in the internal resistance Ri of the pack. The influence of Ri on the charging process can be therefore neglected in this analysis.

4. Main Power Converter Power Loss Model

4.1. Model Concept and Implementation

Numerical methods must be used to estimate the MPC efficiency due to its complex relationship with the converter’s component parameters and operating conditions. Using transient simulations in standard circuit simulators for this purpose is impractical for several reasons:
(1)
It requires both a short time step to represent semiconductor device switching and a long observation time to reach both an electrical and a thermal steady state;
(2)
Solutions must be obtained for many combinations of the operating parameters (input voltage will vary as 1:1.8 due to battery discharging and the load may vary as 1:0.028 as a result of heater power adjustment);
(3)
The extraction and structuring of output data are troublesome, as these involve multiple quantities that have to be averaged over the switching period.
For these reasons, it was decided to develop a model that links power loss in each component to a related current described by values applicable to the switching period as a whole: average, rms, or ripple factor, as appropriate. For example, the power loss in the high-side MOSFET was expressed with [34,35]:
PQH = D Irms2 RDS(on) + 0.5 fs Ubat [Iheat (1 − ri/2) tr + Iheat (1 + ri/2) tf + Ubat Coss],
where D is the duty cycle, Irms is the rms value of the inductor current, RDS(on) is the transistor’s on-state drain-source resistance, fs is the converter’s switching frequency, ri is the inductor current ripple factor, tr and tf are the transistor’s rise and fall times, respectively, and Coss is its output capacitance. The effect of junction temperature Tj on RDS(on) was approximated with a linear function. The dependences of the rise and fall times on current and voltage, as well as of the capacitance on voltage, were also included (the former through the gate charge QG, the threshold voltage UGS(th), and the transconductance gm.
The formula for the low-side MOSFET was identical except for different operating conditions. For the passive components, only Joule’s losses were taken into account. The total power consumed by the MPC was calculated as the sum of power losses in each power loop component and an estimated control power Pctrl:
Ploss = PQH + PQL + PL + PCi + PCo + Pctrl,
where the subscripts QL, L, Ci, and Co denote the low-side transistor, the inductor, and the input and output capacitors, respectively.
Then, the converter’s efficiency and duty cycle were evaluated as [6]:
ηmpc = Uour Iheat/(Uout Iheat + Ploss),
D = Uout/(Ubat ηmpc).
This new duty cycle was fed back into the appropriate equations such as (4) or those expressing ri and Irms. Additionally, the respective power losses were used to calculate a new steady-state junction temperature for either transistor using [34]:
Tj = Ta + PQ Rth(ja),
where Ta is the ambient temperature, Rth(ja) is the junction-ambient thermal resistance, and PQ is PQH or PQL, as appropriate.
The resulting iterative procedure was repeated in a loop until the total power loss difference between consecutive iterations was reduced below a defined relative threshold.

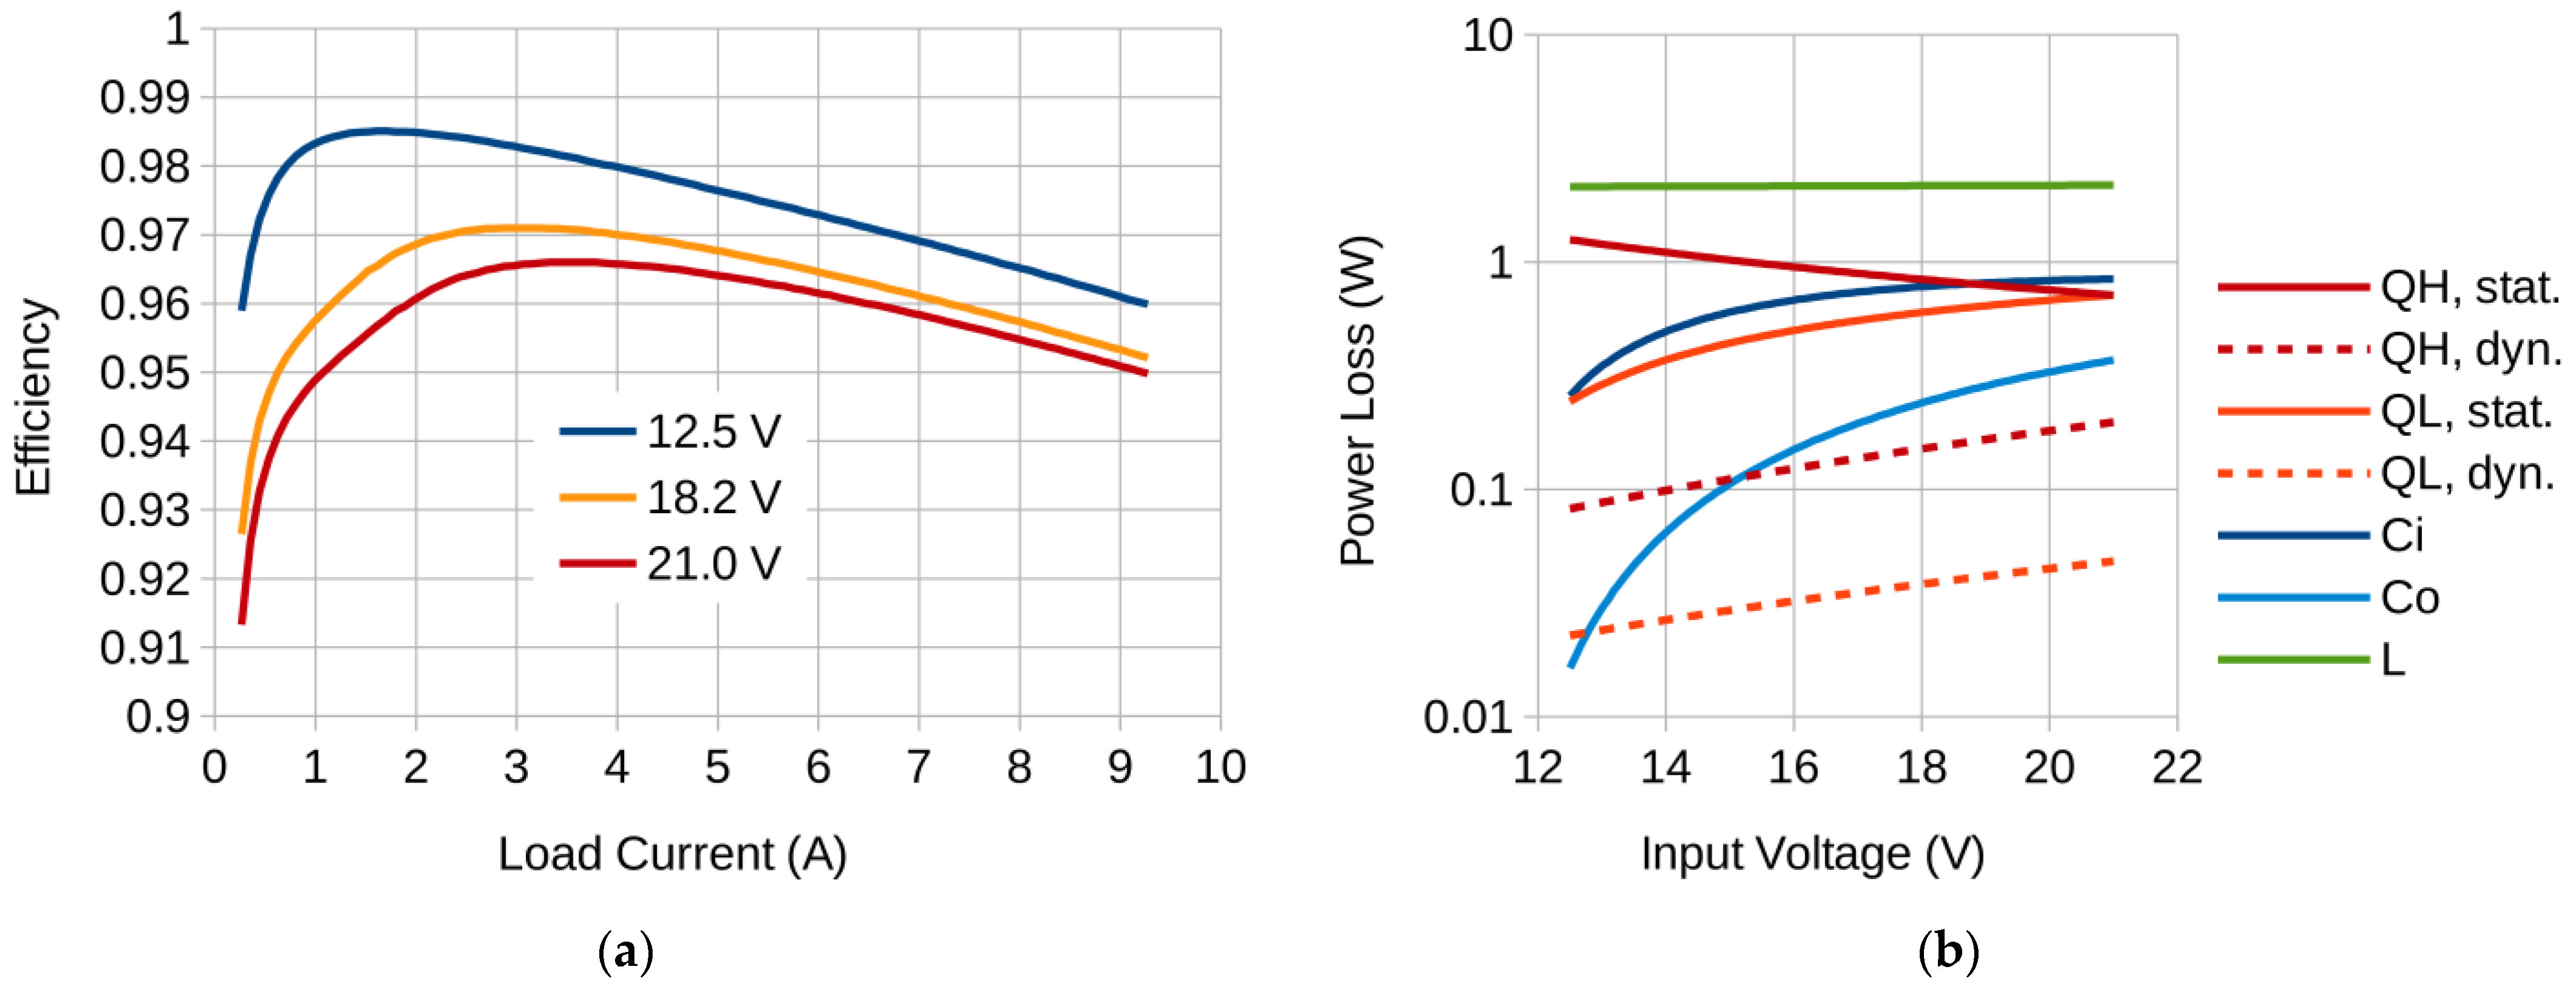
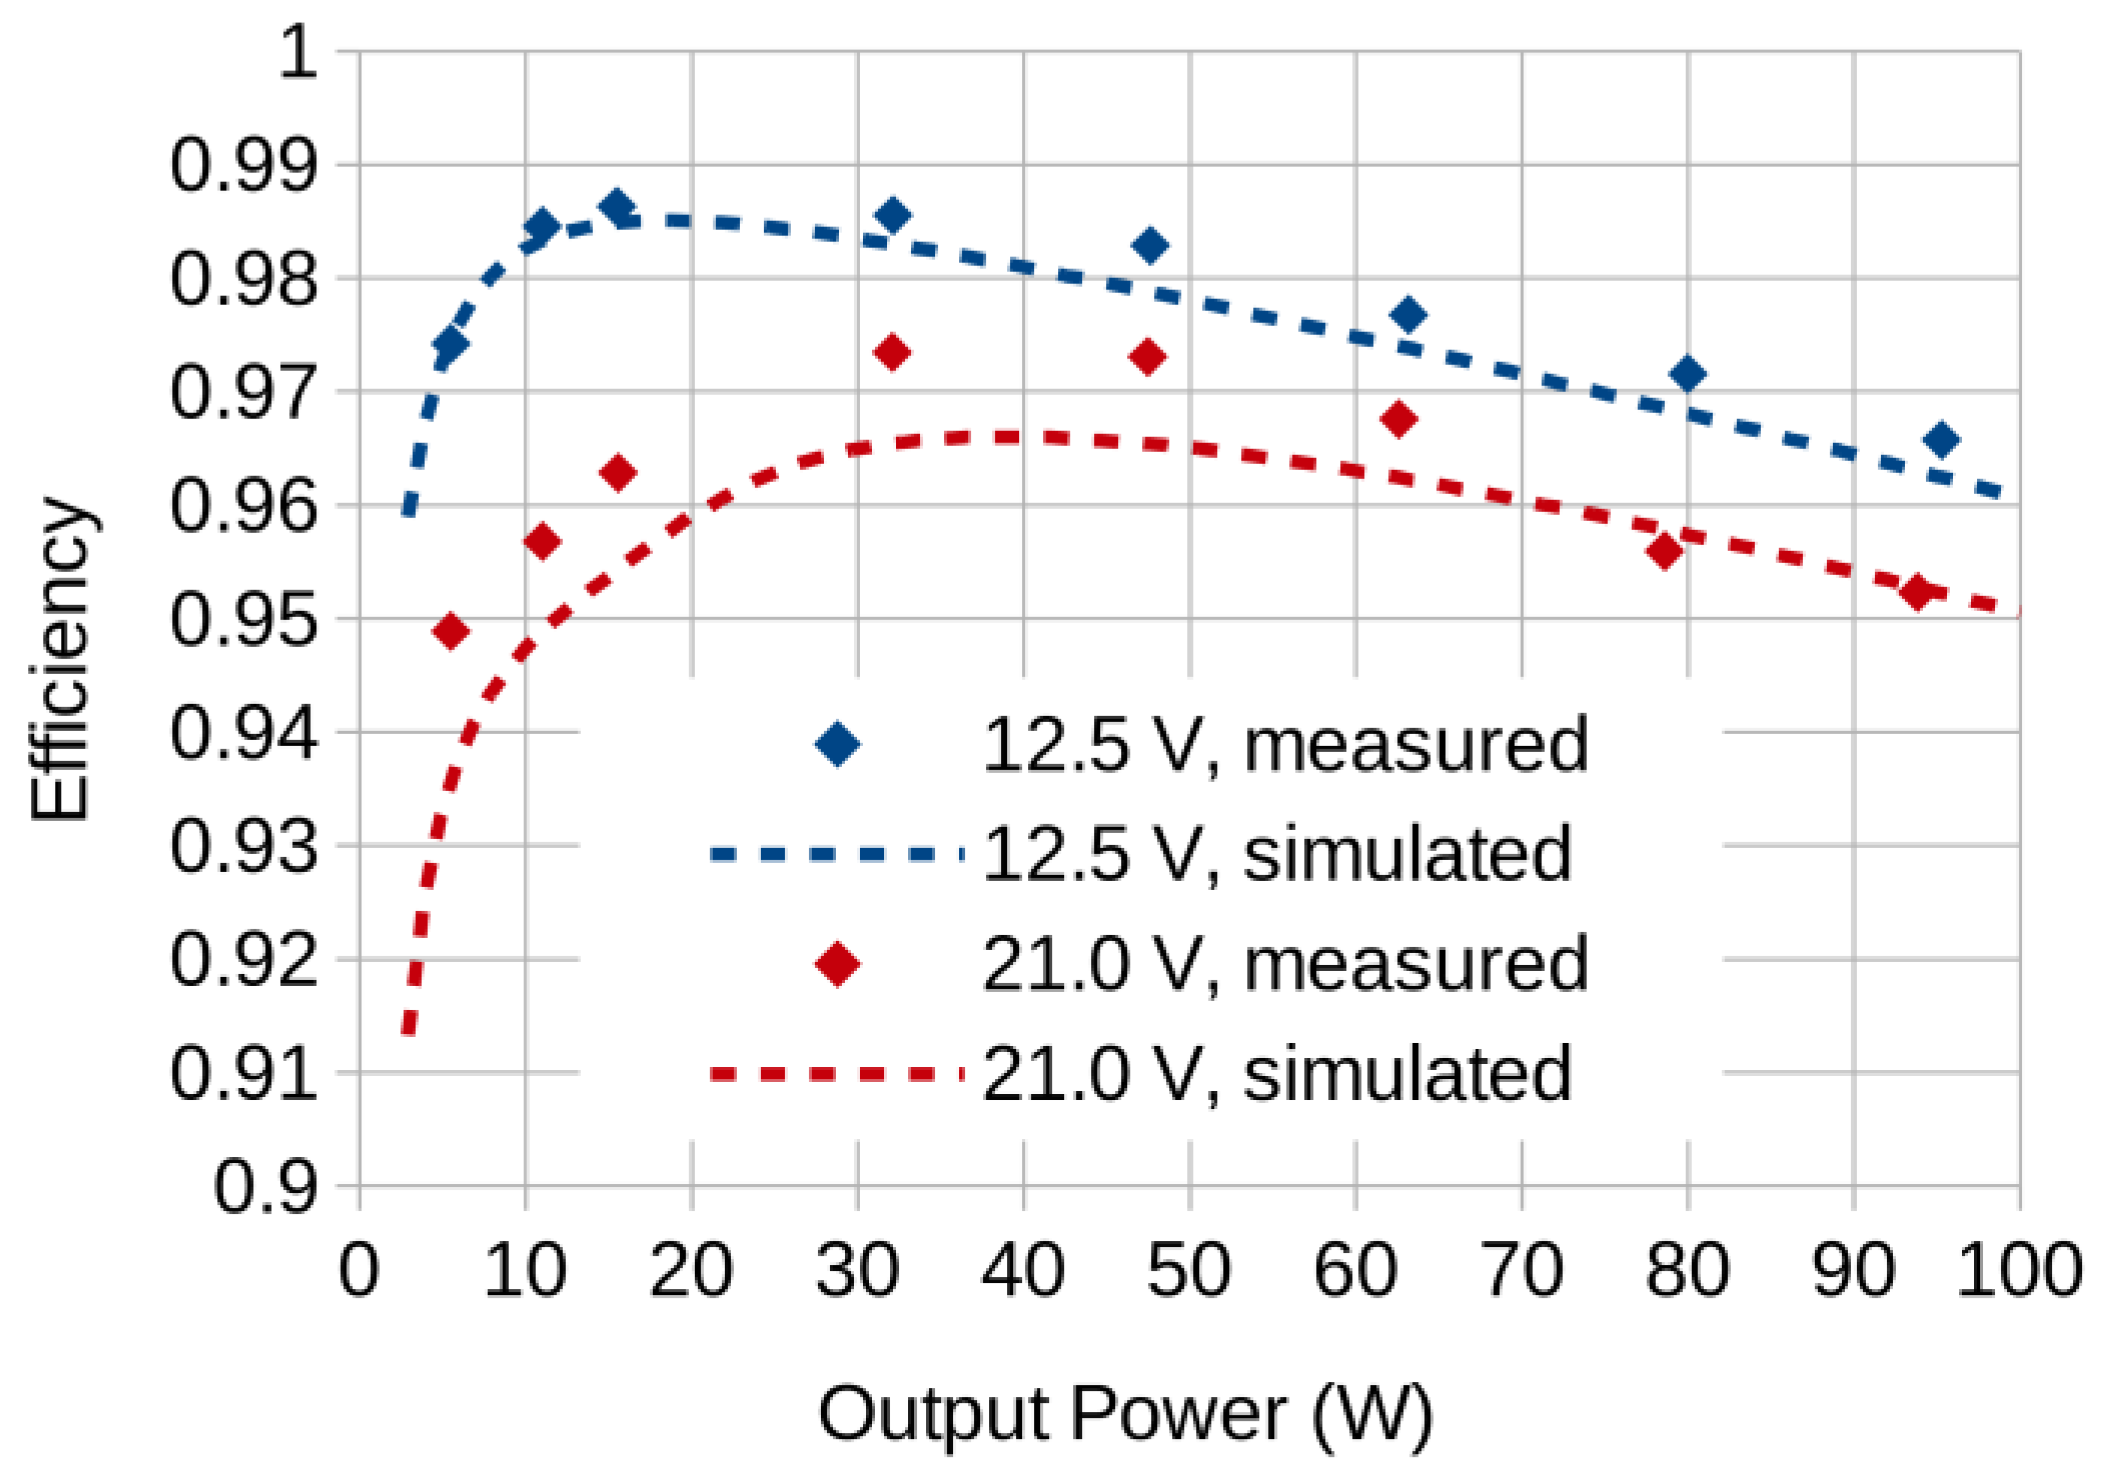
4.2. Simulation Results and Experimental Validation

Simulated efficiency is shown in Figure 3a as a function of the converter’s load current for three different values of its input voltage, corresponding to the battery pack’s discharge cut-off, nominal, and charging voltages. A drop in converter efficiency is observed for both high and low loads. In the former case, it is due to the increase in power losses related to the resistance and to the switching times—in accordance with (4). In the latter case, it is an effect of the control power Pctrl remaining largely constant while Io decreases—according to (5). On the other hand, the efficiency increases as the battery discharges, which is due to the increase in PQH being dominated by a reduction in every remaining power loss, as evidenced in Figure 3b.
After assembling a prototype of the MPC, the model could be validated experimentally. Power processing efficiency was measured in a laboratory setup consisting of:
  • An Itech IT6942A laboratory power supply;
  • A Chroma 63103A programmable electronic DC load;
  • Four Sanwa PC510a multimeters.
The results obtained by measurements on the prototype were compared against simulated ones in Figure 4 for the two extreme values of the battery pack voltage.

5. Power Sources

5.1. Heating Pad Energy Demand

The principal power source for the system is a custom Li-ion battery pack. The lithium-ion technology was chosen mainly because of its greater gravimetric and volumetric energy densities (reaching 250 Wh/kg and 500 Wh/m3, respectively, which cannot be attained with lithium-polymer or lithium-ferrophosphate cells), as well as the higher discharge power for the required capacity. These features enabled the size and weight of the battery pack to be minimized, which was important for ergonomics. On the other hand, due to safety considerations, the system was equipped with a triple short-circuit protection ensured by an integrated BMS (Battery Management System, also offering cell balancing to extend the lifetime), a fuse at the PCU input, and current limiters at each heating channel output. The battery pack was placed in a dedicated pocket, far from the heating pads.
The problem of battery sizing for wearable heating systems is similar to that found in EVs (electric vehicles) [36], in that the goal is to maximize the operating time while minimizing the battery pack weight and dimensions, and the power command varies along the path traveled. Through consultations with mountain rescuers, it was determined that during a typical 8 h operation, the active heating function is mainly used during stops, which typically take from 1 to 2 h in total. Tests performed in a climatic chamber under negative temperatures and wind showed that the heating powers usually applied ranged from 20 to 60 W, depending on heating pad location and individual user features or preferences. Based on these data, a load profile was conceived with an uneven distribution of commanded power in time, as shown in Table 3.

5.2. Battery Pack Selection

Two approaches are normally applied for battery sizing: involving system-level simulators [37] or custom implementations of optimization algorithms [36]. As the load in the considered system is much less complex than an EV drive and the number of suitable cell configurations is limited, a simpler battery pack optimization procedure was preferred. First, the number of series cells to be used was chosen to obtain the demanded voltage. A compromise had to be made between power losses (requiring a high supply voltage to reduce currents) and the user’s safety (requiring a low voltage). Next, the minimum number of parallel cell strings was determined to reach both the required maximum supply power of 100 W and the required total operating time of 8 h.
The operating time was determined by means of simulation using the converter efficiency model described in Section 4 and applying the load profile in Table 3. In an iterative procedure, the battery current was first evaluated according to
Ibat = (Pheat/η + Pctrl)/Ubat
with [37]
Ubat = Ubat(oc)Ibat Rbat,
where Ubat(oc) is the battery open-circuit voltage at a given state of charge and Rbat is the battery equivalent internal resistance for the given Ibat. Next, similar to the method used in [37], the change in battery charge was calculated as
Qbat = Ibatt
where ∆t is the simulation step, set at 10 s. Finally, a new value for Ubat(oc) was determined from a voltage vs. charge characteristic. Battery parameters were obtained from their datasheets or from [38]. The operating time was defined as the time it took for the battery voltage to drop below its cut-off level as set by the cell manufacturer.
Lithium-ion cells were chosen as they offer the highest gravimetric and volumetric energy densities. Their capacity is generally an increasing function of temperature. The battery is to be worn under the first layer of clothing; therefore, it may be safely assumed that its temperature will not be lower than the nominal cell temperature, which is between 20 and 25 °C. On the other hand, battery aging has to be considered [39]: the end-of-life capacity must be sufficient to cover the energy demand for a single rescue operation. This was taken into account by using the capacity drop coefficients provided by cell manufacturers, scaled to the desired lifetime of 271 cycles, which corresponds to the system being used once a day from autumn to spring.
The optimum battery pack found uses 18,650 cells in a 5S2P configuration (five series cells, two parallel strings). Its parameters are listed in Table 4, and the estimated system operating time under the assumed load profile is 8 h 3 min. The corresponding discharge characteristics obtained are shown in Figure 5.

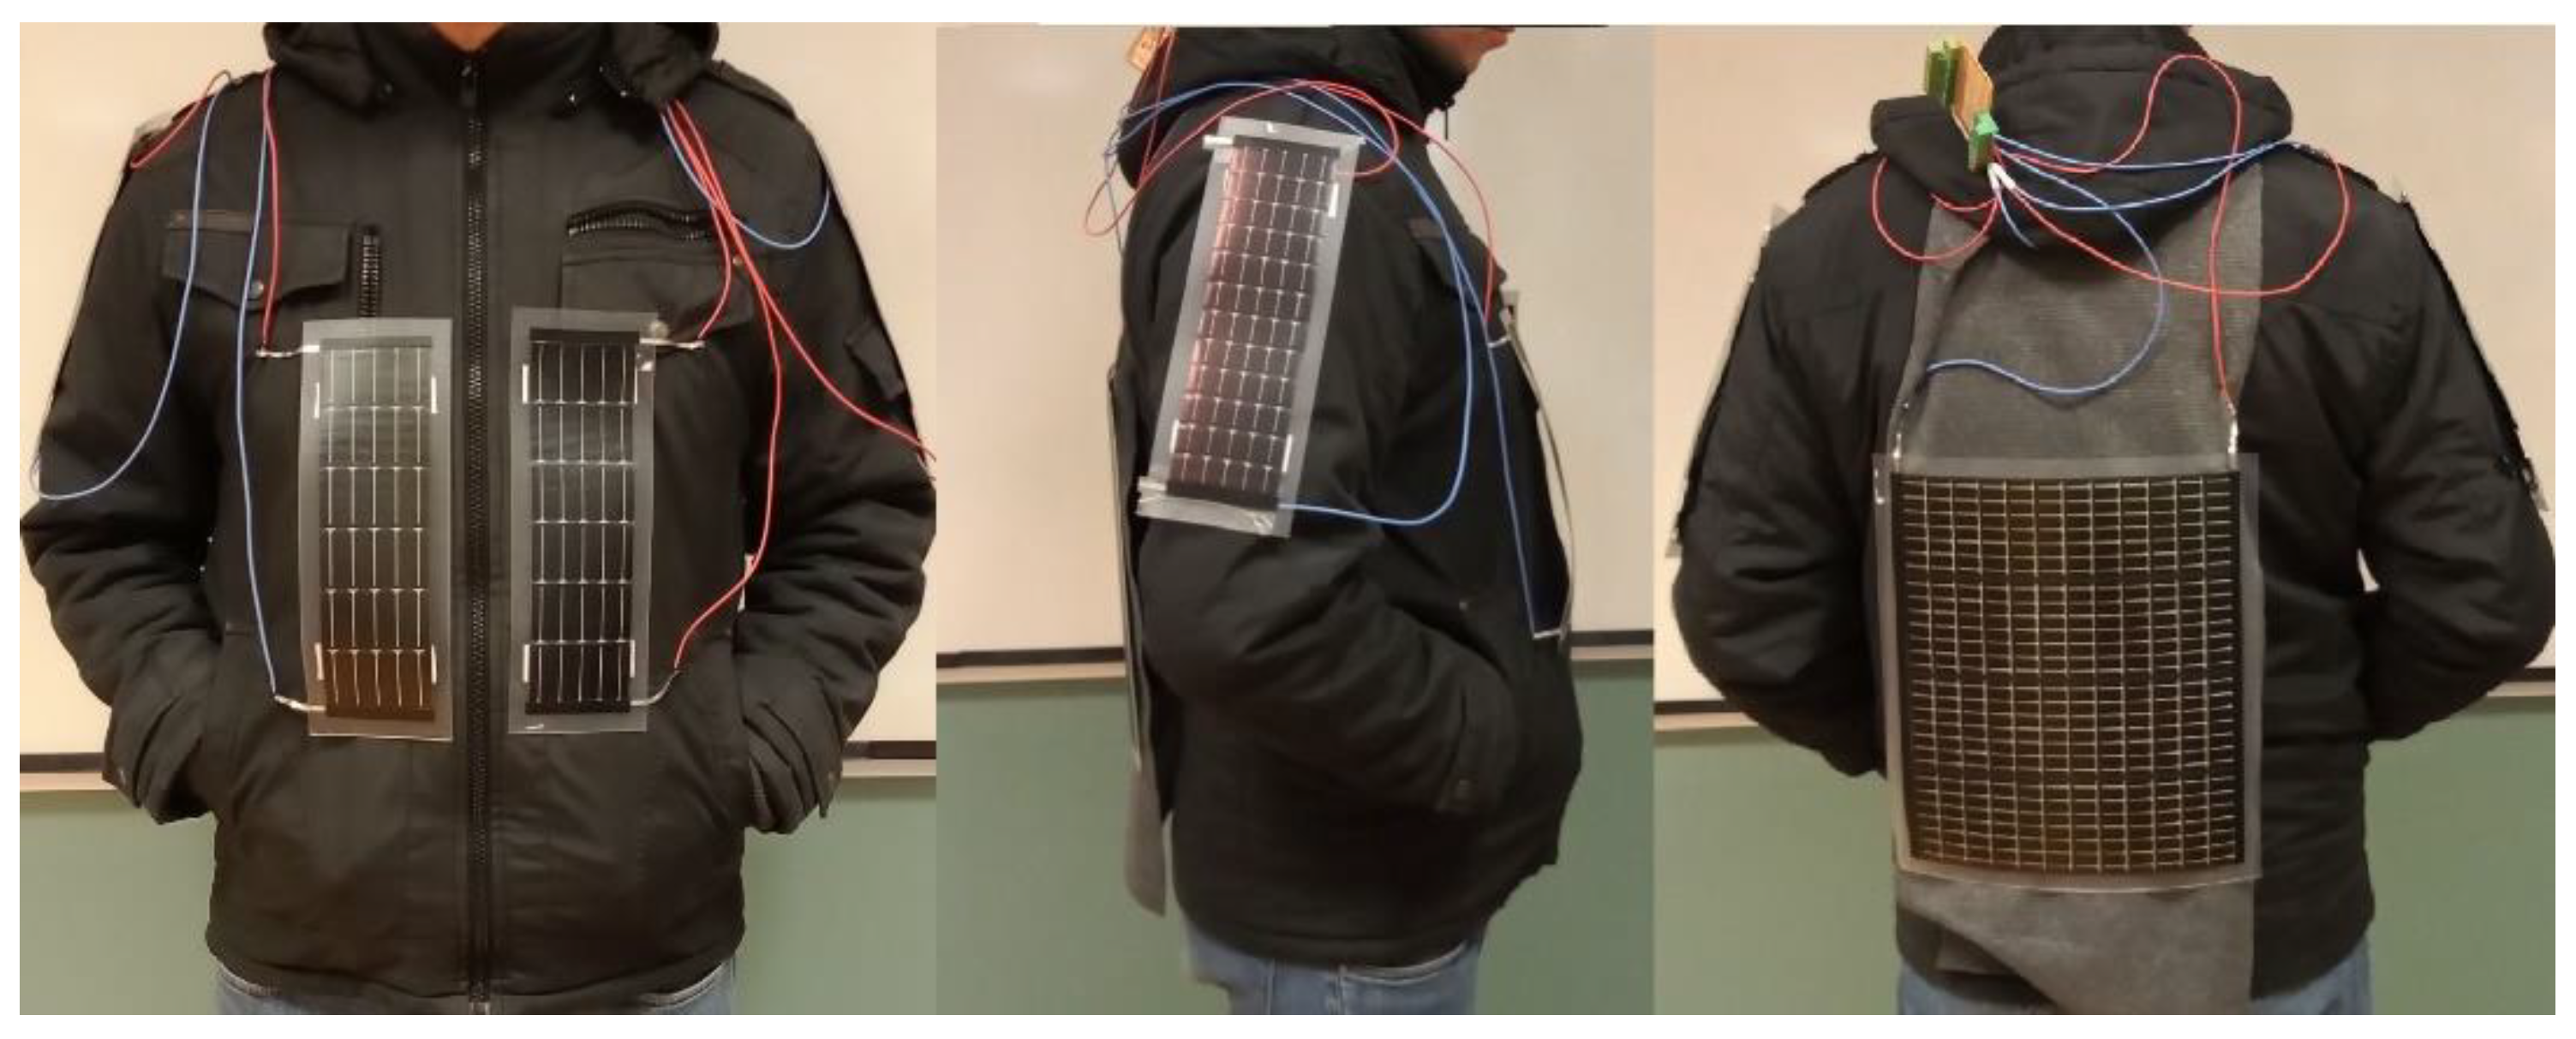
5.3. PV Module Set Configurations

A PV generator is an auxiliary power source in the considered system. Four weatherproof flexible module types from FlexSolar [28] were used whose parameters are listed in Table 5. They were preselected based on tests performed on multiple commercial products, according to the criterion of the highest electric power per area per irradiance.
Five different module sets with similar active areas were assembled as specified in Table 6 and presented in Figure 6, Figure 7 and Figure 8. Due to the lower maximum power point (MPP) voltage of the P7.2-75F modules, they were always connected in pairs in series. Otherwise, modules were connected in parallel not to exceed the voltage of 24 V, as the system is to be worn by humans.
The selection of the optimum solution required data on each configuration performance in different insolation conditions that could only be obtained by measurements in sunlight. This was achieved in two stages as described in Section 6.

6. PV Generator Configuration

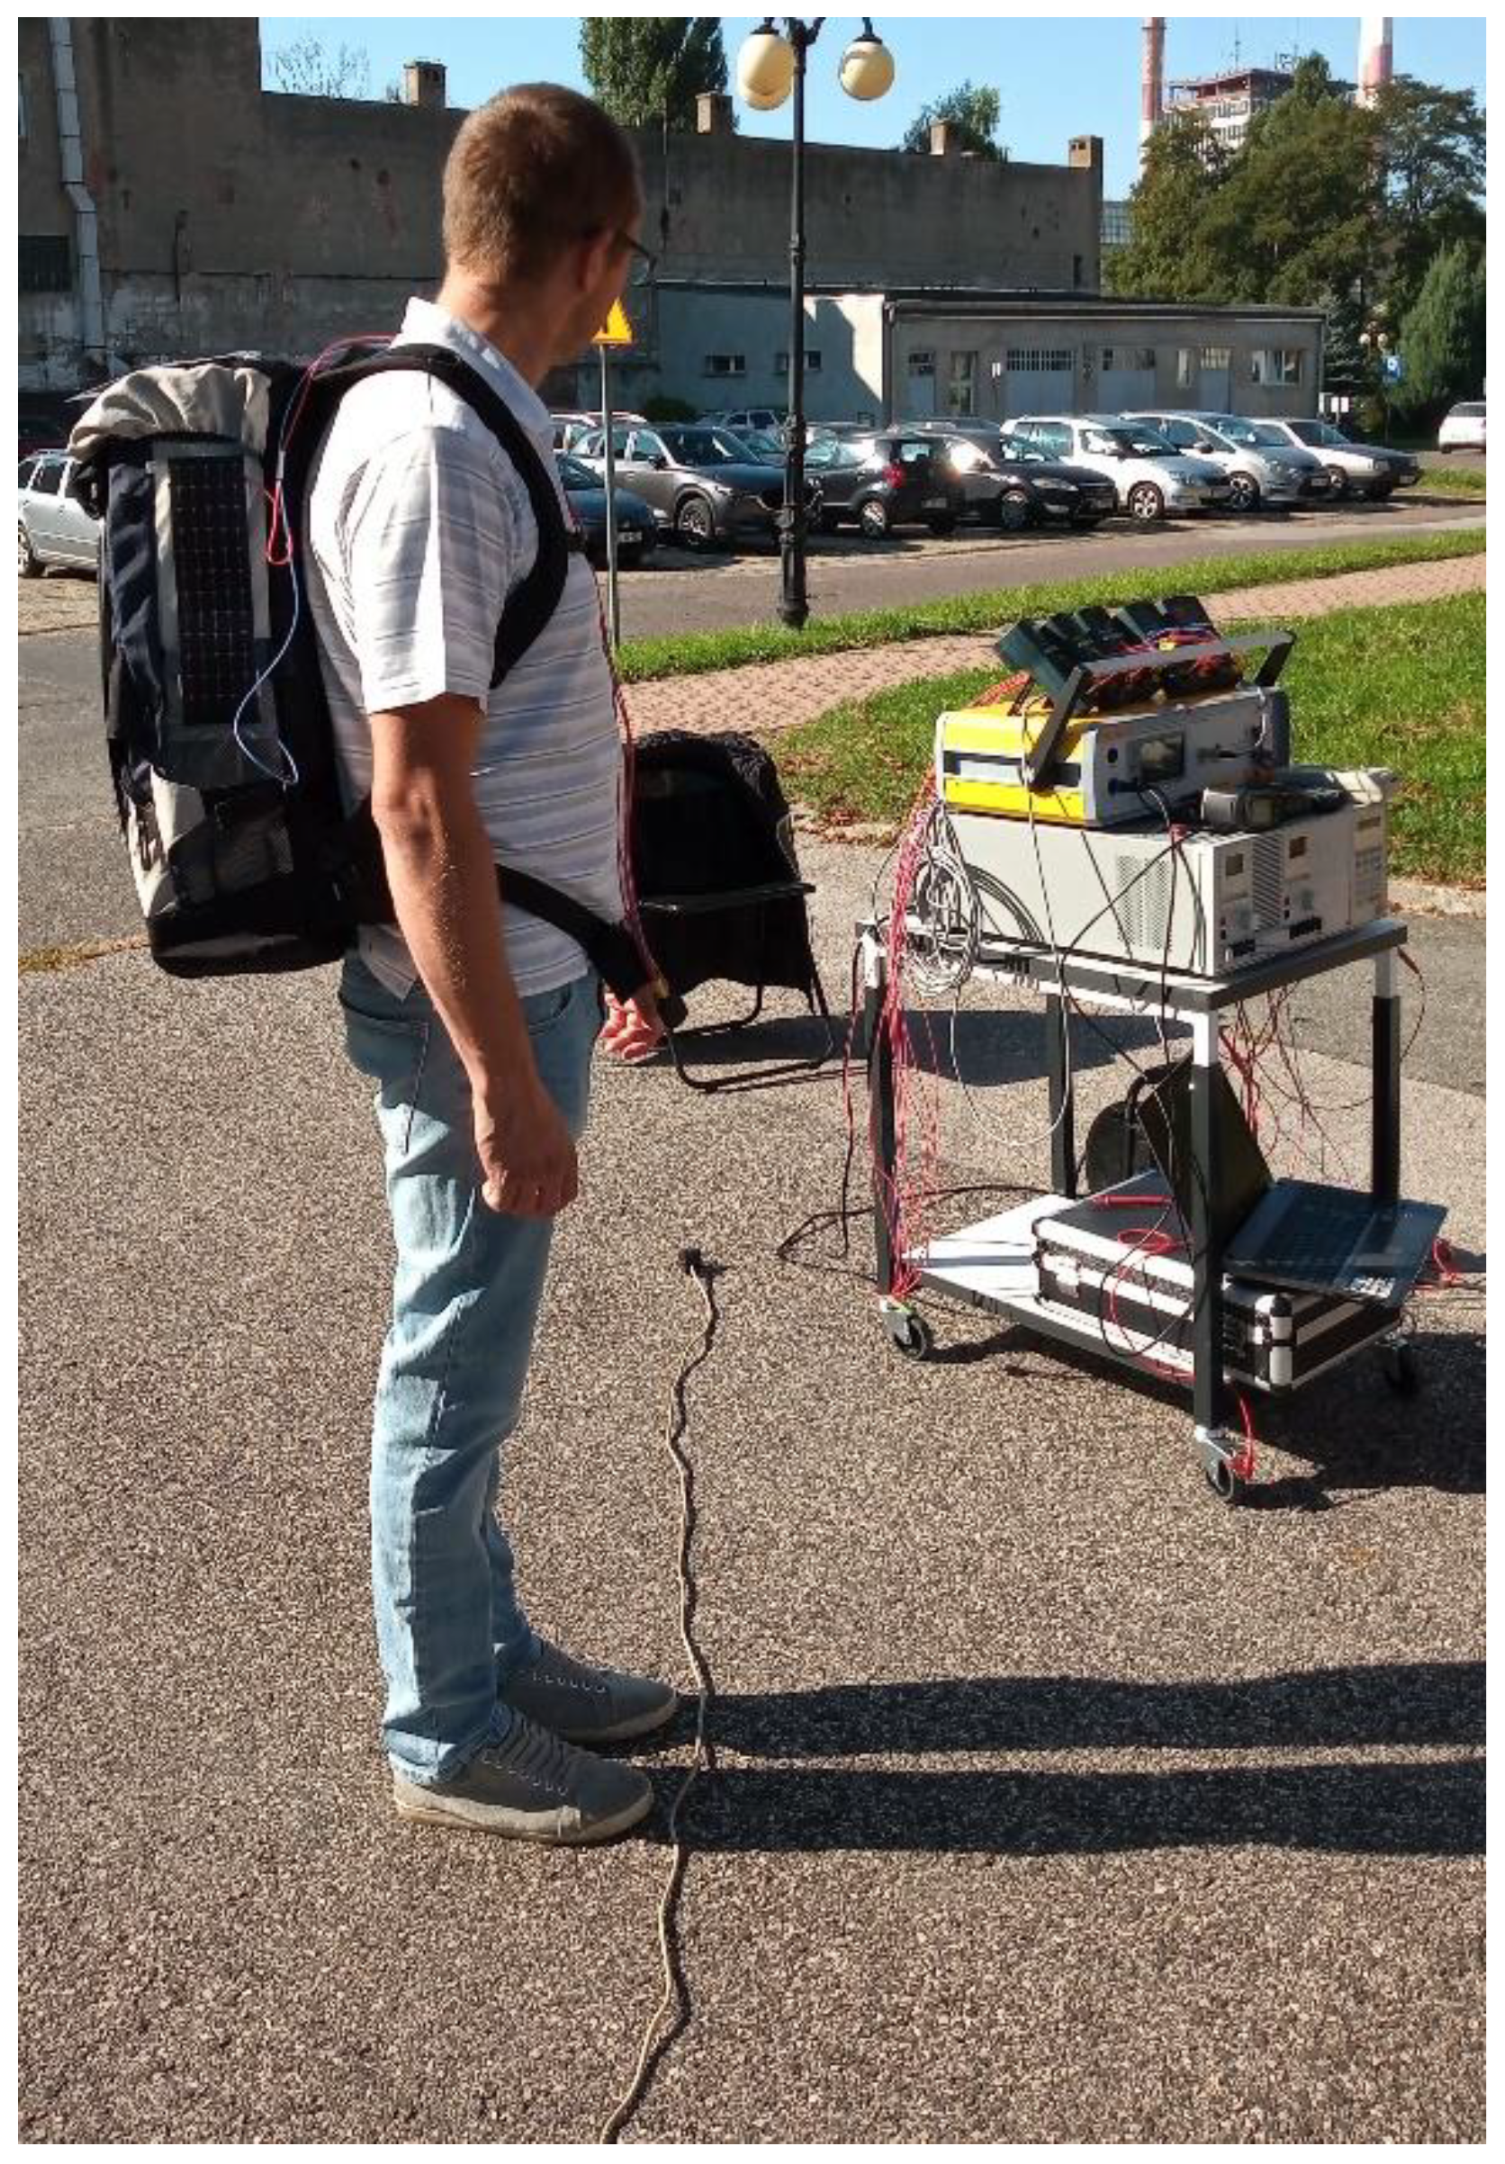
6.1. Static Testing Methodology

In the first stage, measurements of the five proposed configurations were performed outdoors in direct sunlight, at different times of the day. The tester was standing, but his silhouette was rotated to take into account the different possible azimuths of the Sun with respect to the particular PV modules in real use. The tests took place in central Poland (latitude 51°45′N) in September, at different times of the day, as indicated in Table 7. The solar noon time was at 12:40, when the Sun elevation was 43°. The sunrise (Sun elevation of 0°) occurred at 06:07, while the sunset, at 19:11.
Within each experiment, measurements were performed for every PV generator configuration. In each case, the silhouette of the tester was oriented at different azimuthal angles γ with respect to the azimuth of the Sun, ranging from 0° (the back plane perpendicular to the sunlight, oriented towards the Sun) to 180° (the back plane perpendicular to the sunlight, oriented away from the Sun).
The test stand is shown in Figure 9. It consisted of the following equipment:
  • A Photovoltaik Engineering PVPM 1000C PV module curve tracer with an SOZ-03 solar radiation sensor;
  • A Chroma 63103A programmable electronic DC load;
  • Five Sanwa CD772 multimeters (operating in the ammeter or the voltmeter mode);
  • A custom-made PCB with four Schottky diodes of the same type as those found at the input of the battery pack charging converter included in the system, assuring that the electrical operating conditions of the PV module set connected with the electronic load are consistent with those occurring in the actual system.
Each particular measurement (for a given time of the day, PV module configuration, and tester azimuthal angle) consisted of two phases:
(1)
Measuring the current-voltage characteristic of the PV module set as a whole using the curve tracer, and determining the MPP location of the set;
(2)
Loading the PV module set with a constant voltage provided by the electronic load, corresponding to the MPP as determined in phase (1), and measuring the currents supplied by the individual PV modules using multimeters.

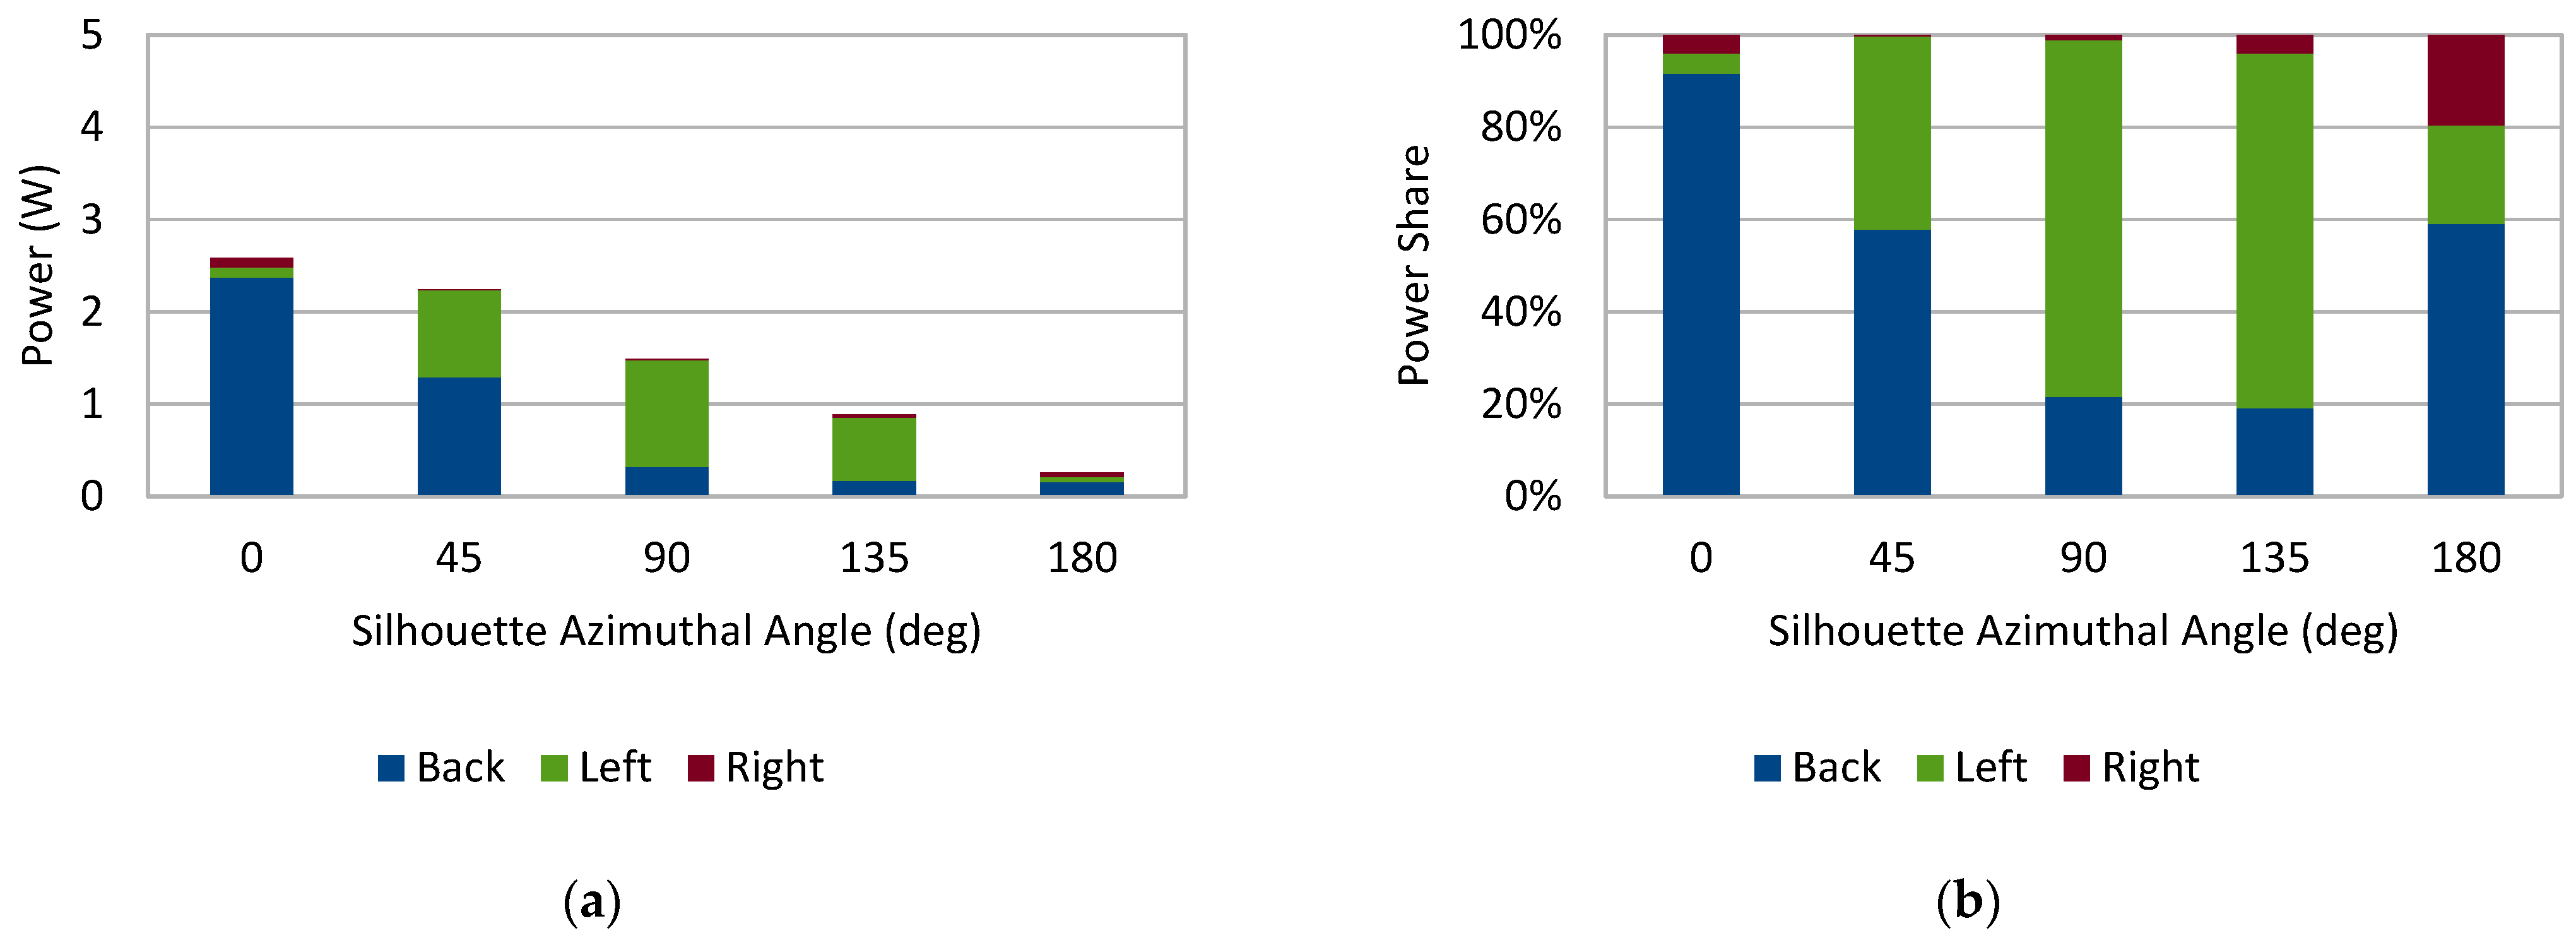
6.2. Static Test Results

Figure 10, Figure 11, Figure 12, Figure 13 and Figure 14 present the measured power of each particular module at the MPP of the entire set, averaged over the five experiments, for different silhouette orientations (azimuthal angles γ). Their analysis leads to the following observations:
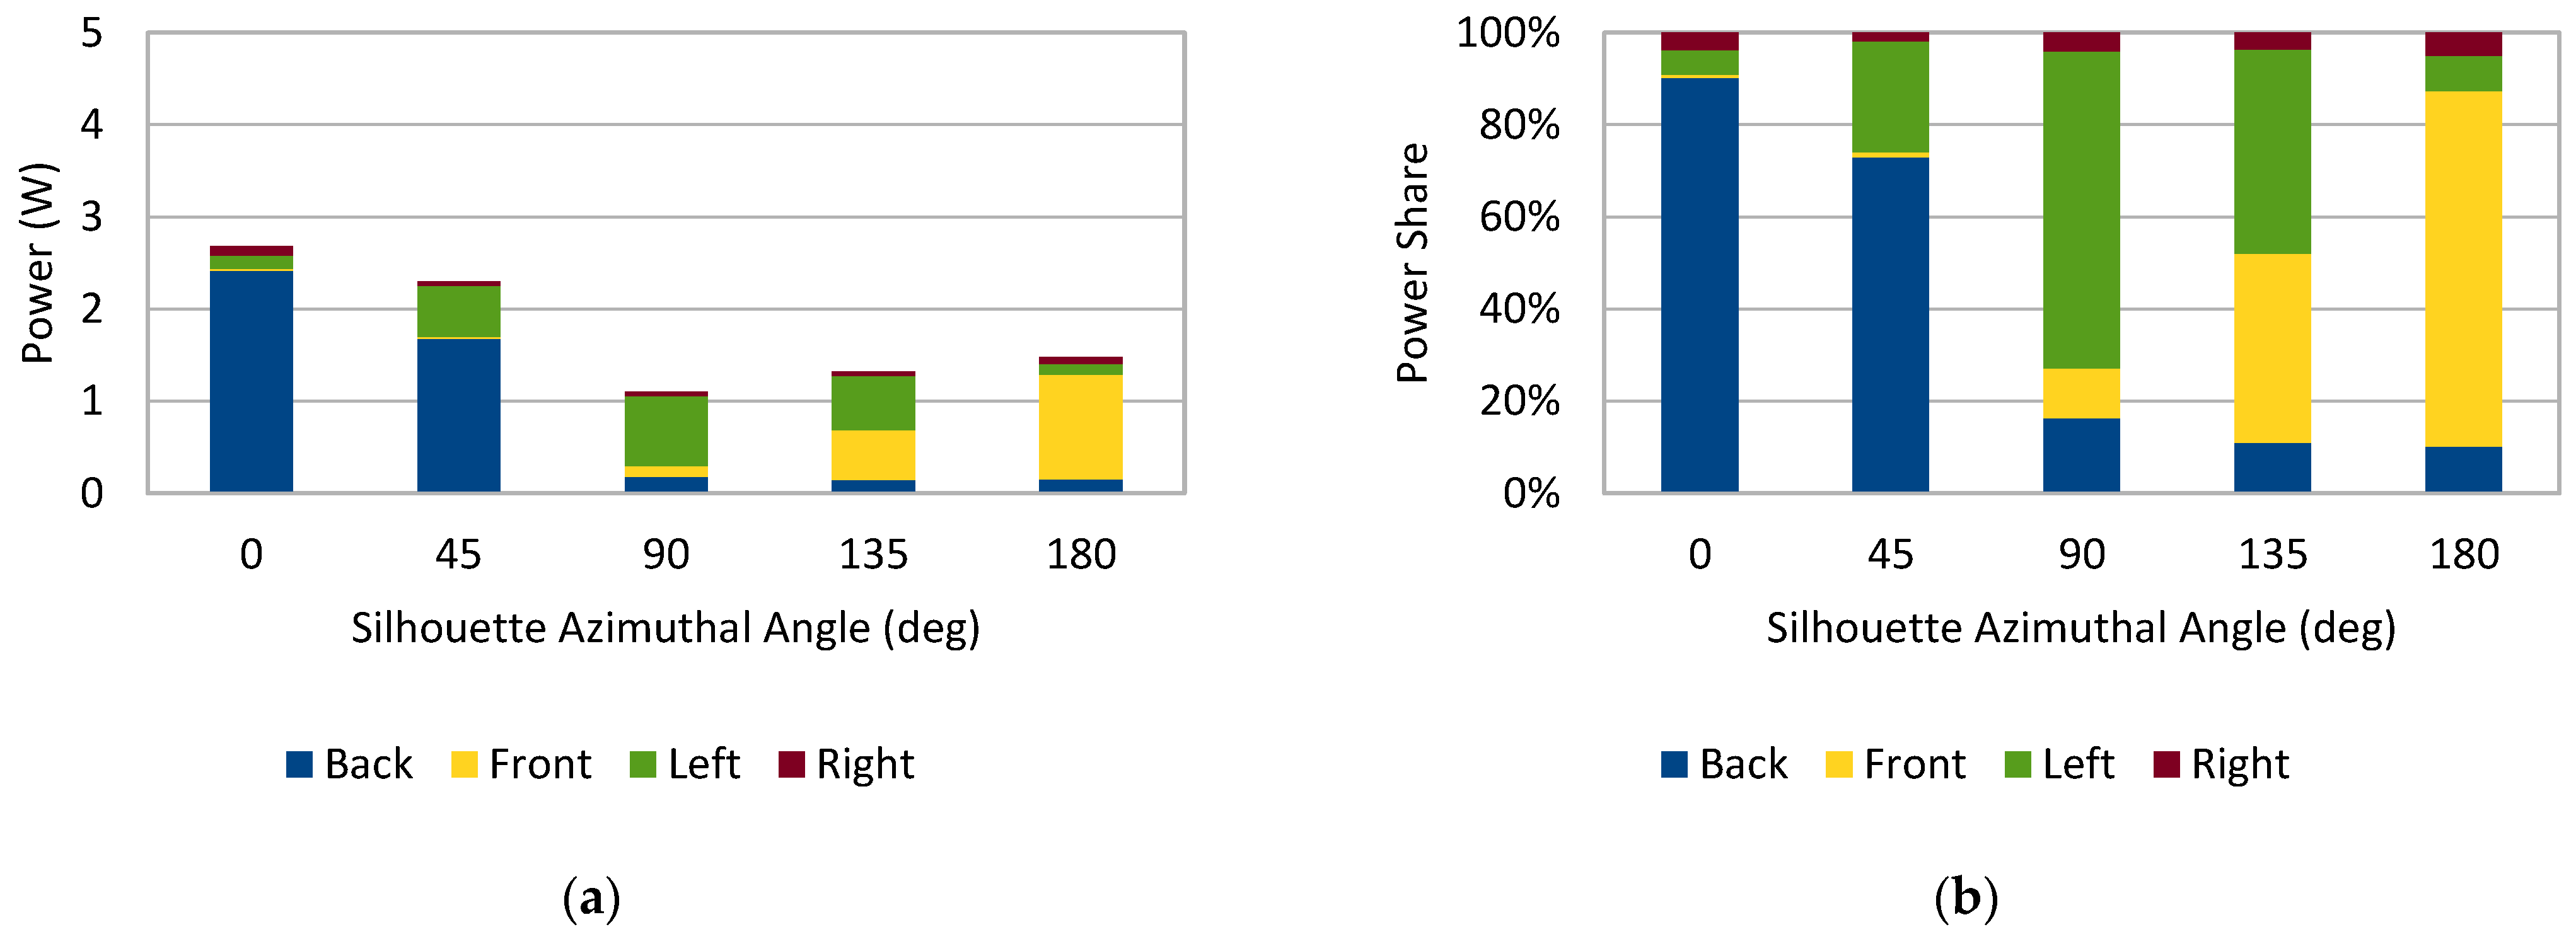
  • In the backpack option 1 configuration (two modules on each side), the modules on the side oriented towards the Sun provided most of the power for the azimuthal angles of 90° and 135°, and a significant part of it for 45°;
  • In the backpack option 2 configuration (one module on each side), the top module provided most of the power for the azimuthal angles of 90° and 135°;
  • In both backpack configurations, for the azimuthal angles of 0°, 45°, and 180° most of the power was provided by the module at the back of the backpack;
  • In the jacket configuration, most of the power was provided by the module on the back for the azimuthal angles of 0° and 45°, the module on the side oriented towards the Sun for 90° and 135°, and the module on the front for 180°;
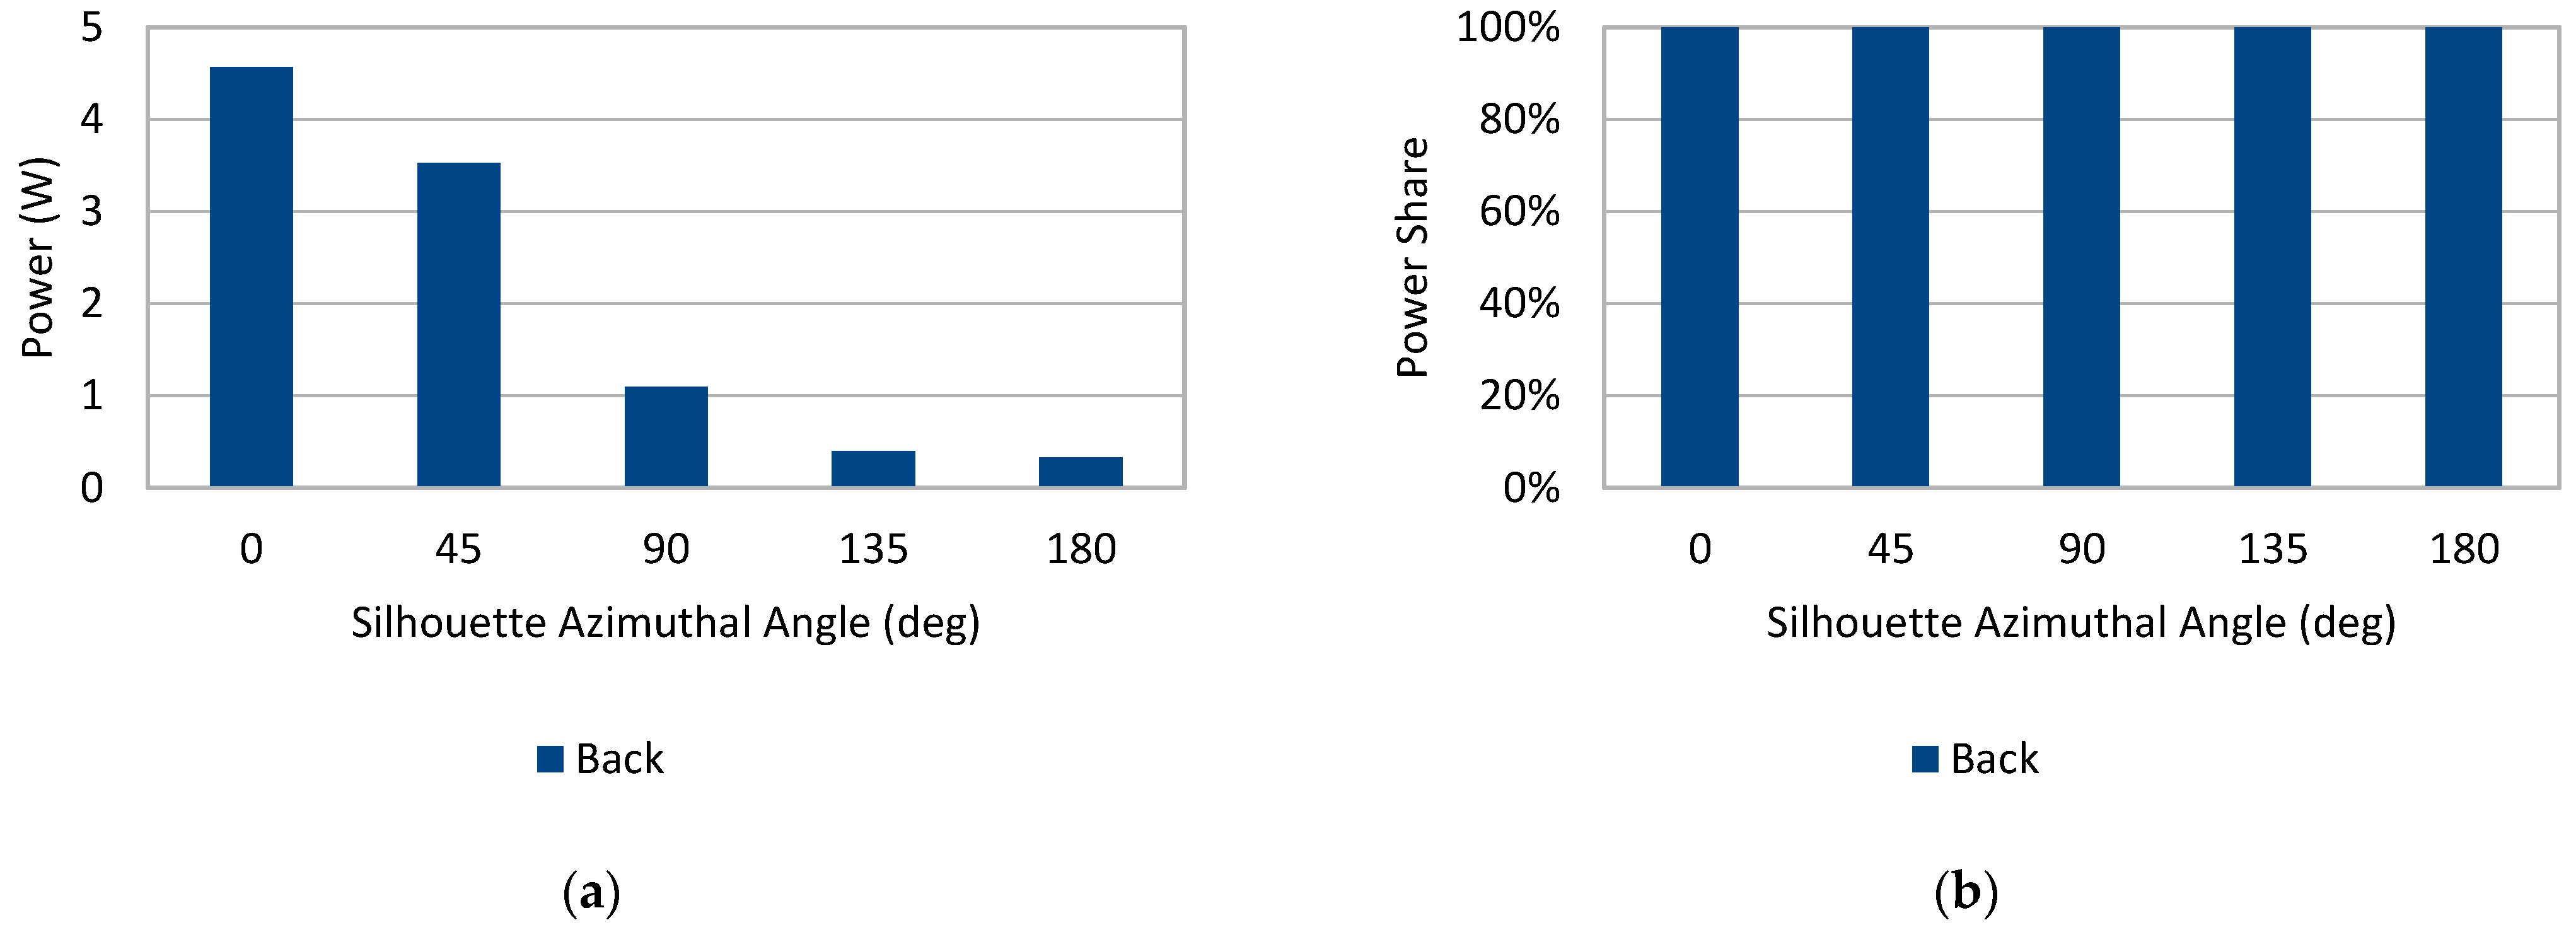
  • In both configurations involving the rollable sheet, the power rapidly decreases with the azimuthal angle increasing, especially above 45°.
For some angles, the total power was the greatest with the jacket configuration thanks to an extra power delivered by the modules installed on the front. In contrast, the low output of the rollable sheet for most angles—even though these were the most effective configurations for low angles—was due to its being located on just one side of the body.
Figure 15 shows the total power delivered by each PV module set averaged over the five experiments. Based on these results, the following can be noted:
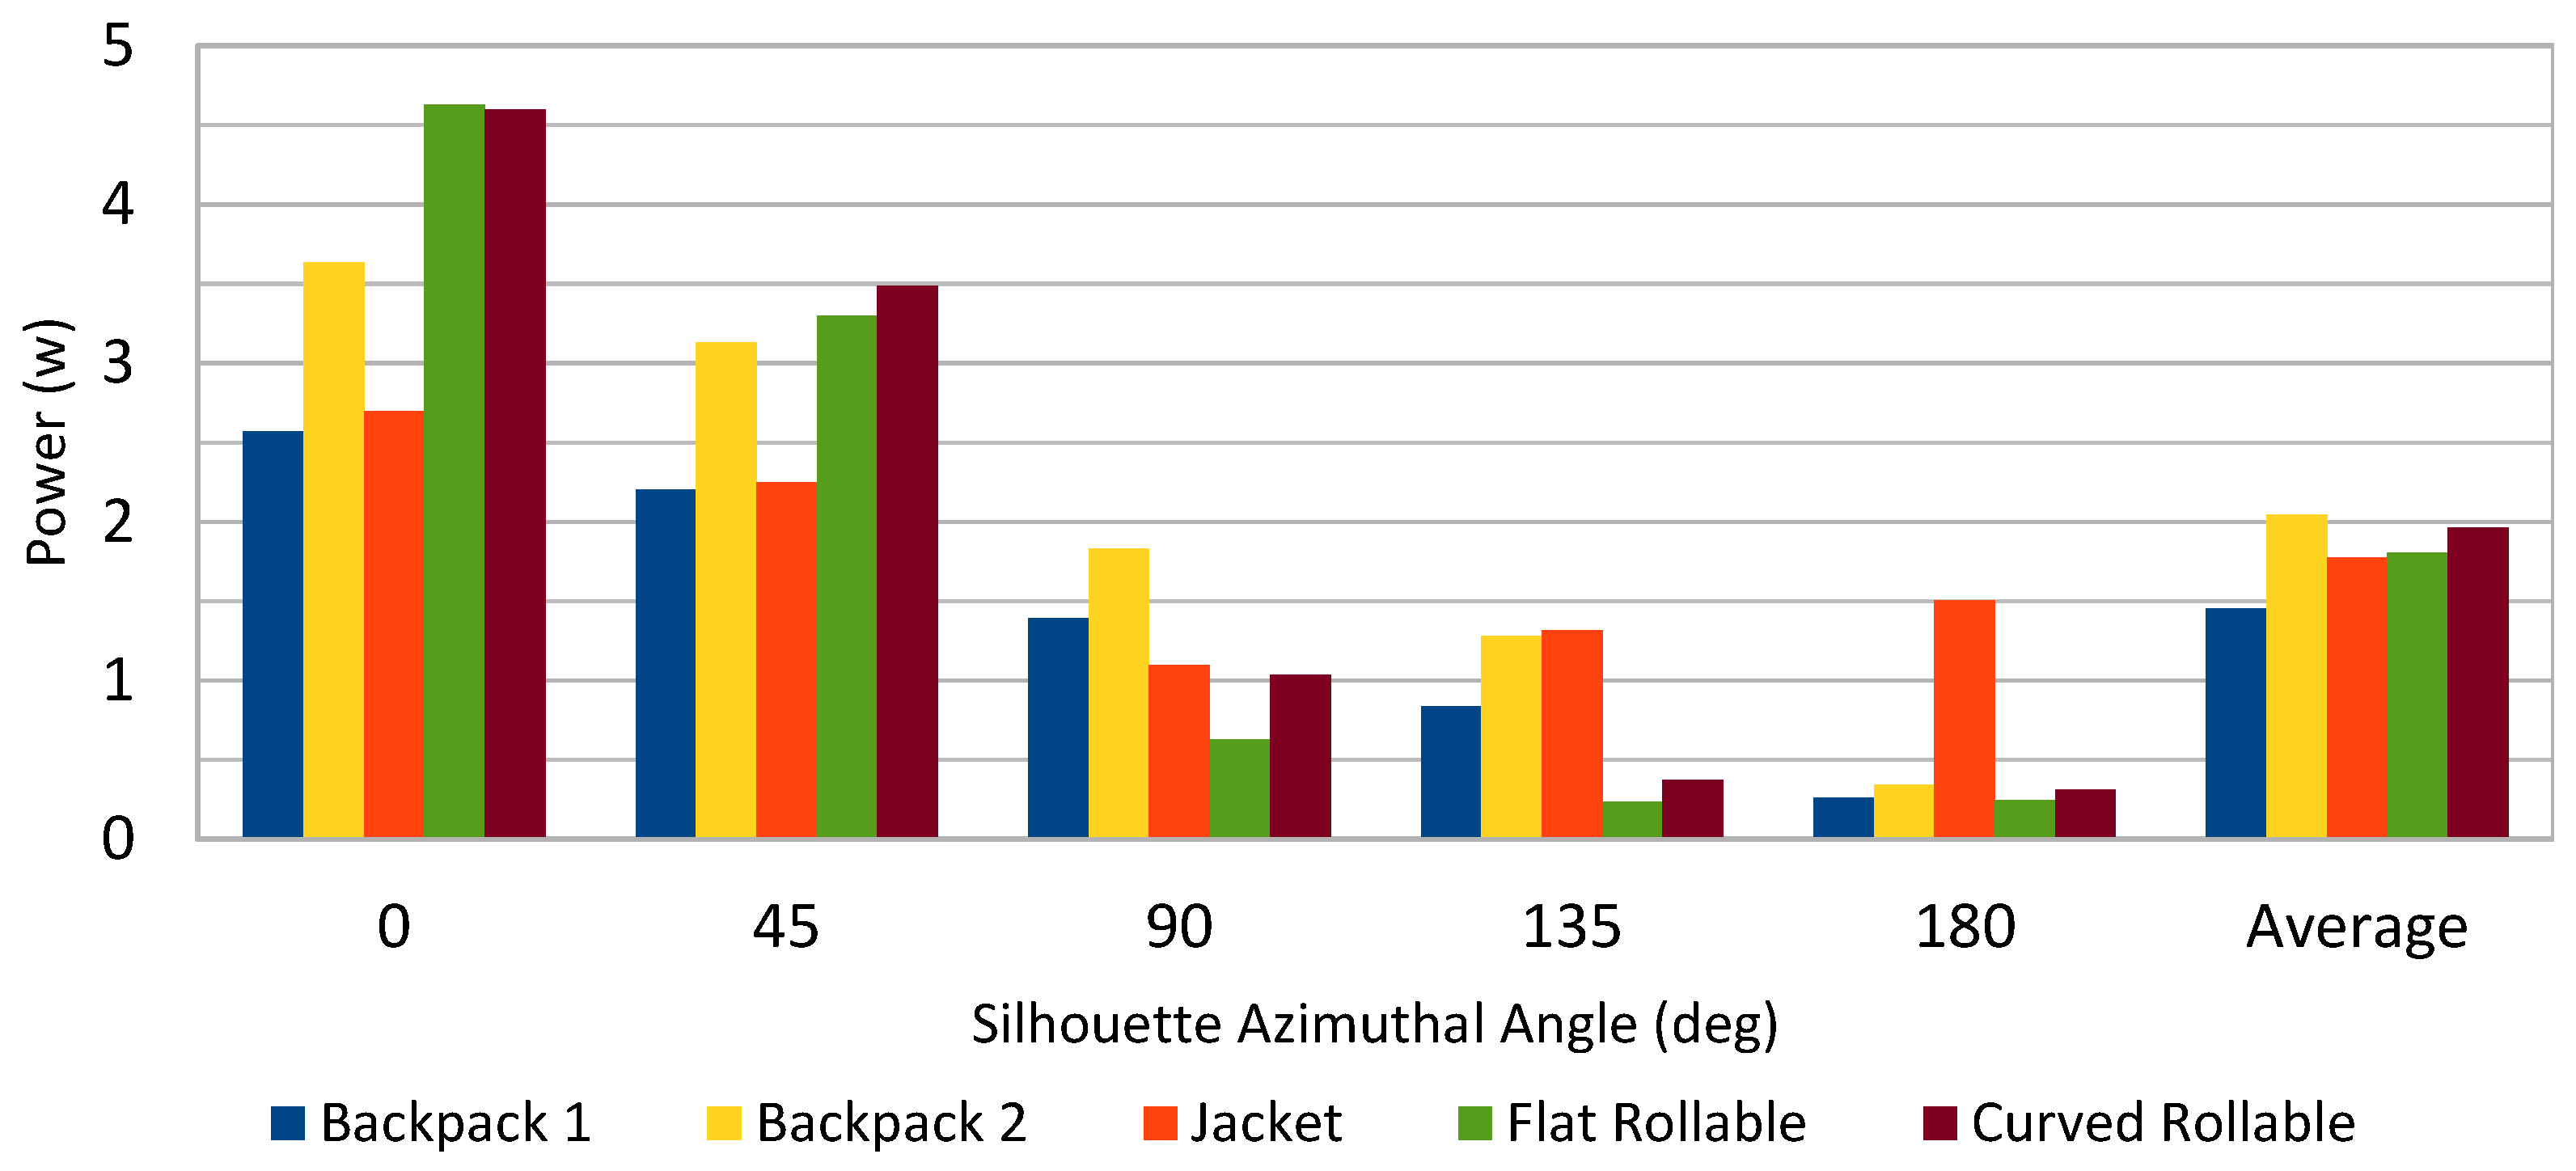
  • The jacket is the most versatile configuration, generating a significant power for any azimuthal angle of the silhouette; when compared to the backpack option 1 configuration, the output of the jacket configuration was similar for the azimuthal angles of 0° and 45°, lower for 90°, and greater for 135° and 180°;
  • The backpack option 2 configuration generated more power than option 1 and usually more than the jacket configuration (excepting for 135° and 180°);
  • Both the flat and curved rollable configurations generated more power than any other configuration for 0° and 45°, but less than those for all the remaining angles;
  • The curved rollable configuration always generated the same or higher amount of power than the flat rollable one, with a difference in average power of 8.6%.
When the average power output over all the azimuthal angles is considered, the backpack option 2 is the best configuration, slightly ahead of the curved rollable one (by 4%). The jacket configuration delivered an average power 13% lower than the backpack option 2 configuration, similar to the flat rollable whose output was 12% lower.

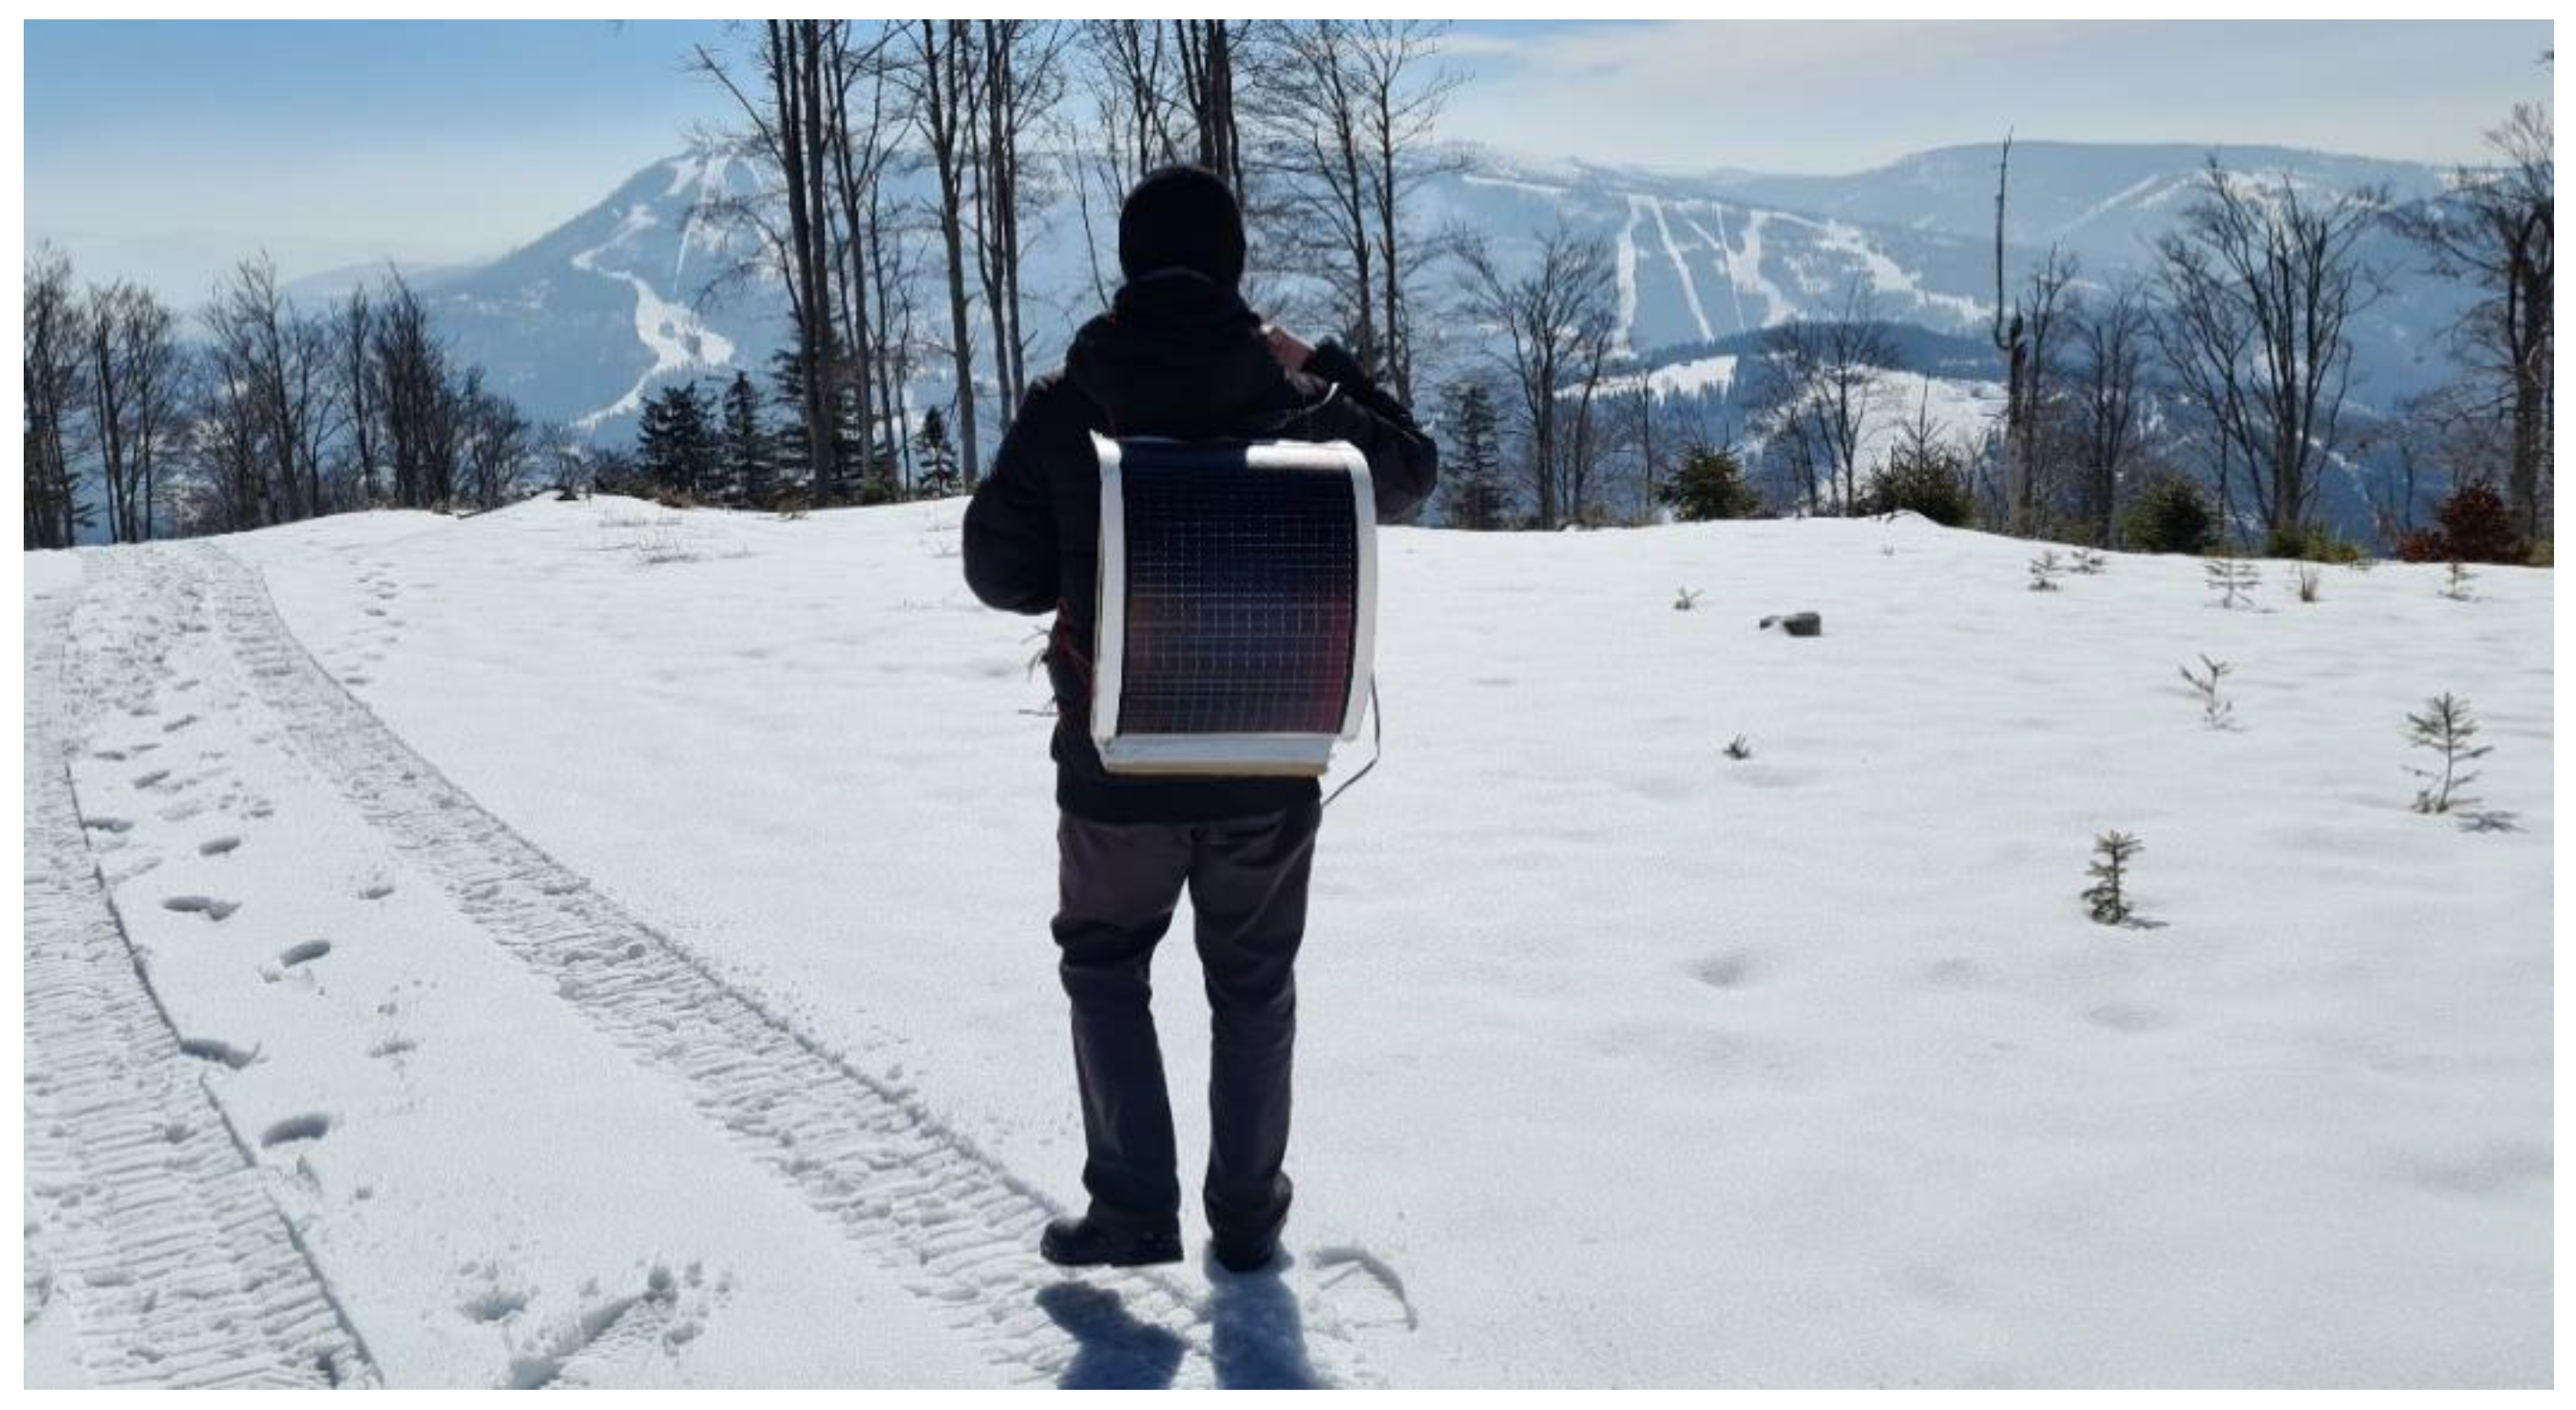
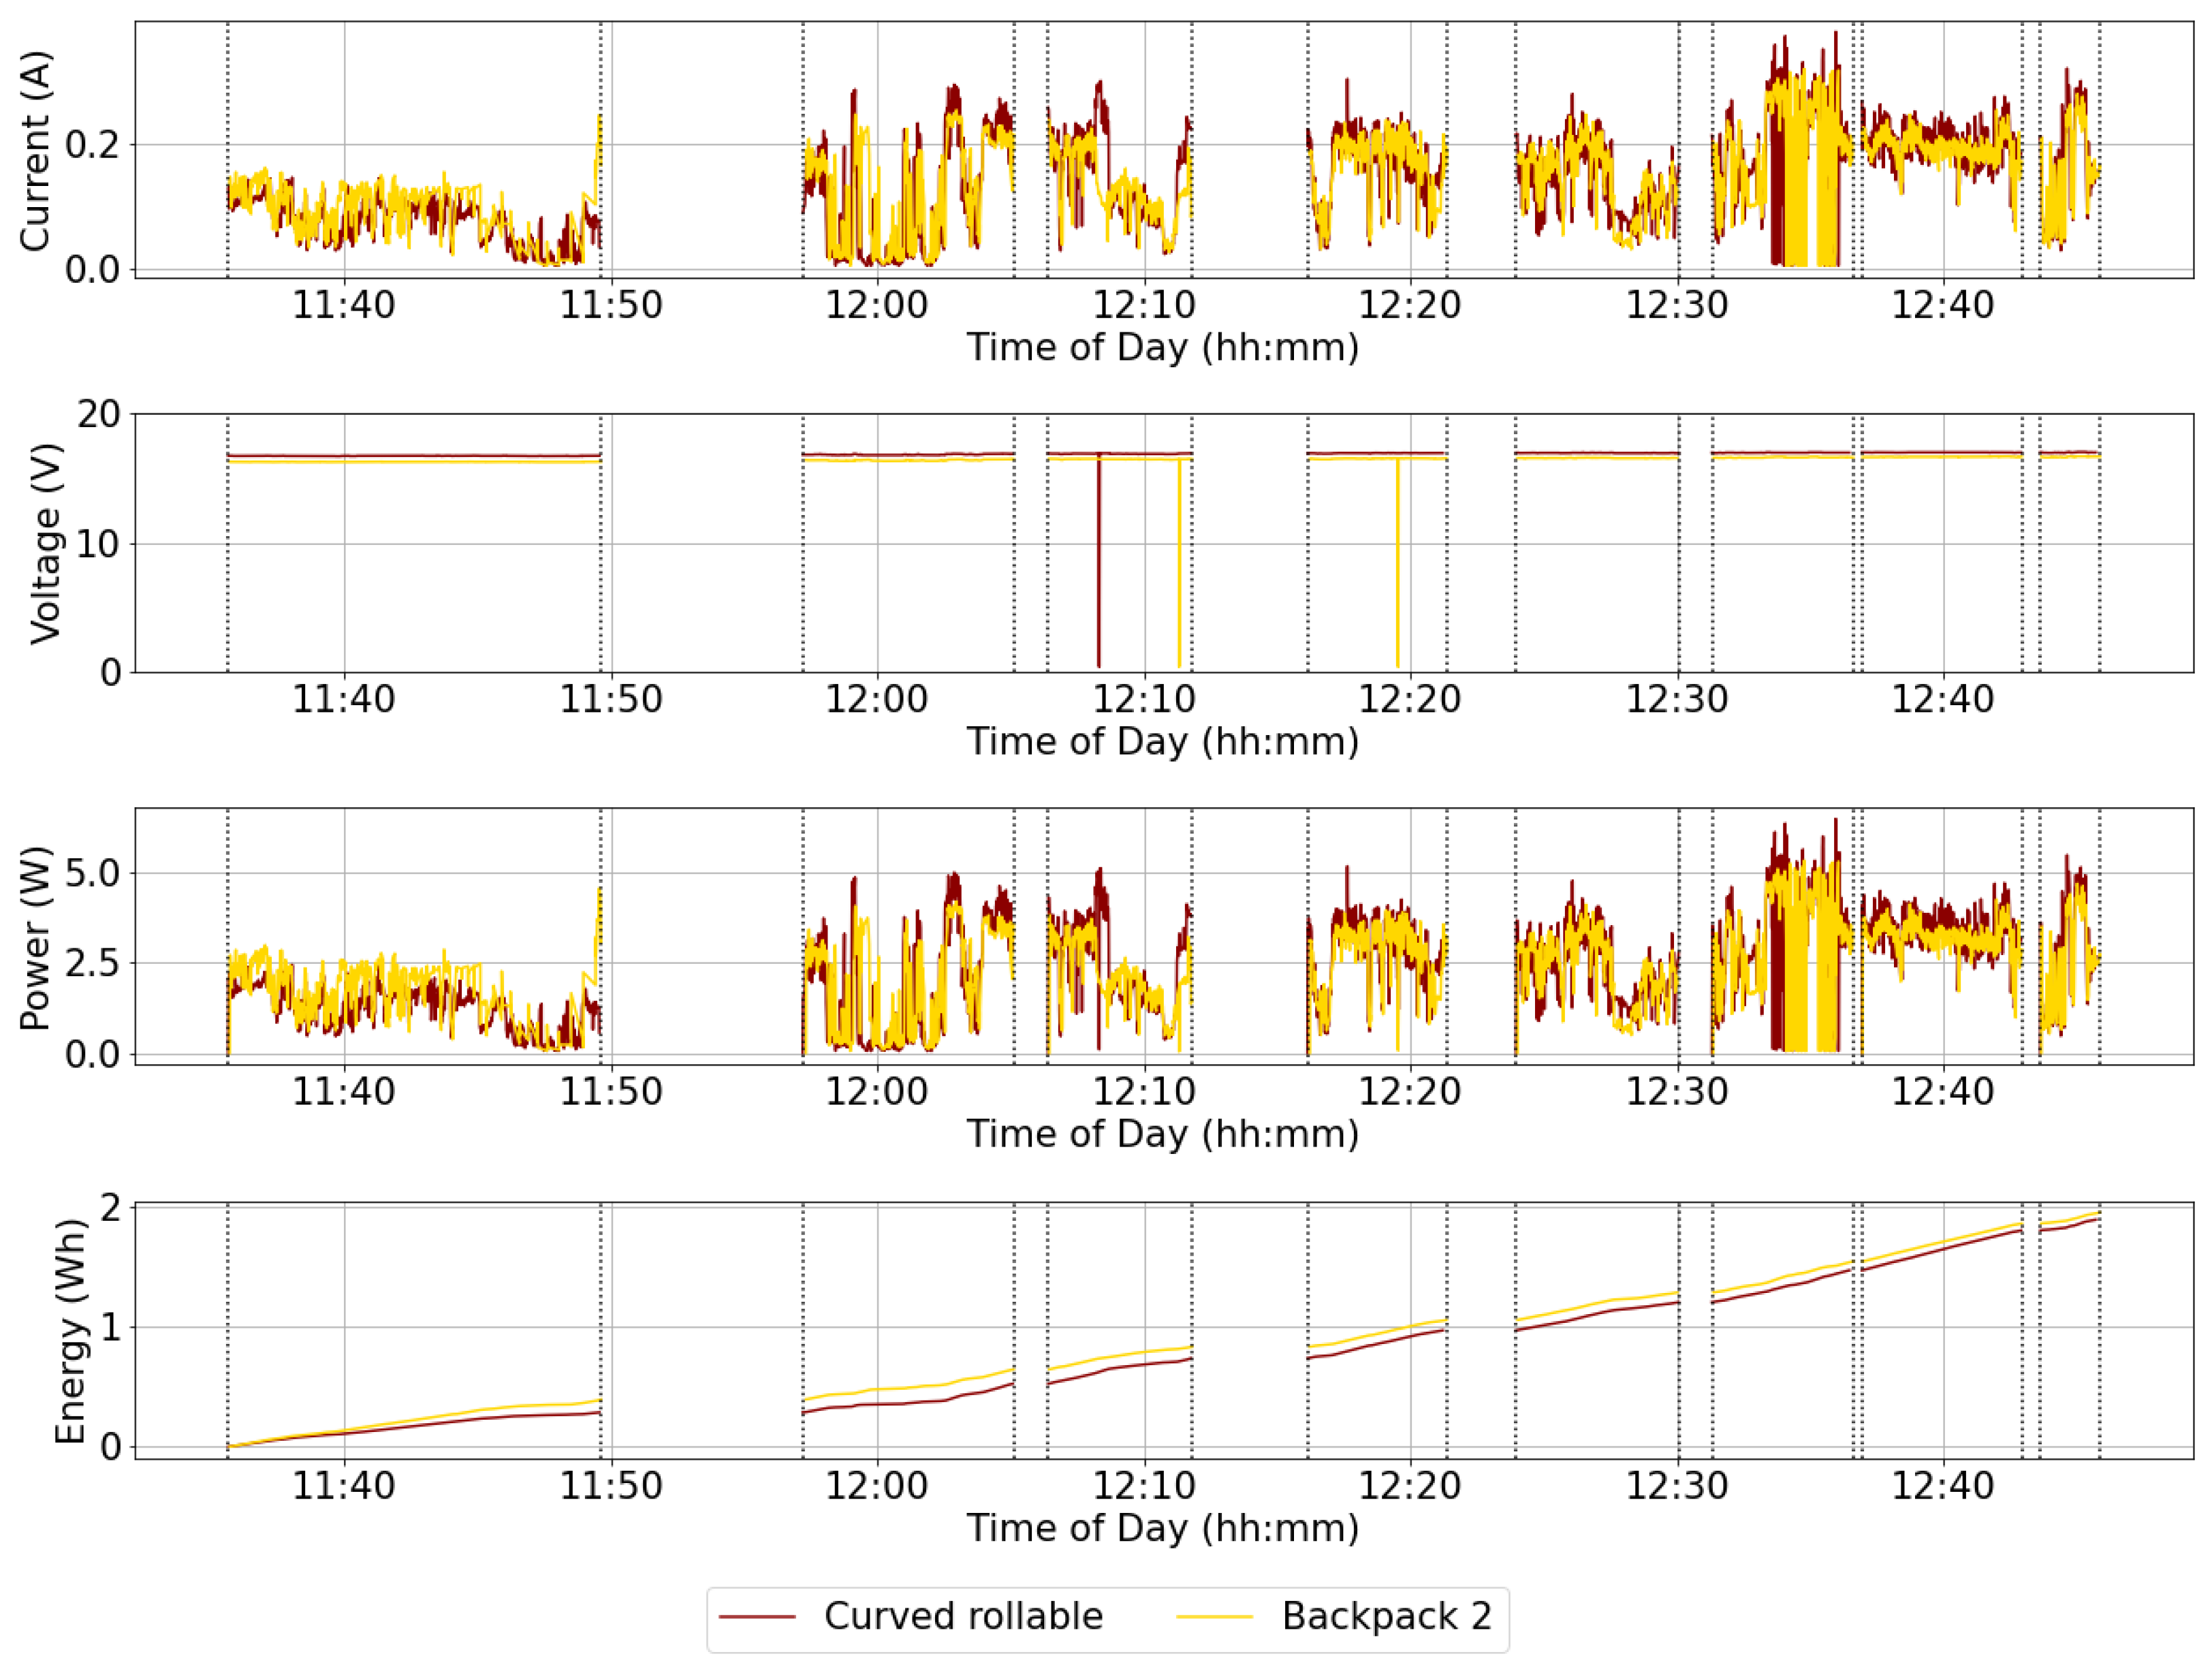
6.3. Tests in Real Use Conditions

In the second stage of the PV configuration selection process, conditions of real use were assured in respect of the location, weather, and tester activity. These measurements were conducted over extended periods of time.
The tests took place during the winter season in a mountainous area in southern Poland (latitude 49°41′ N). They involved two persons equipped with identical PCUs (with the heating turned off) and battery packs discharged to the same state of charge (as determined by measuring their open-circuit voltages) so that to enable charging from PV modules. The participants walked simultaneously along the same route, each of them equipped with a different configuration of PV modules.
The number of options was reduced from five to three based on the criterion of the highest averaged power obtained in static tests as presented in Section 6.2. Twelve experiments were conducted in total, in two series, with the following configurations:
(1)
Backpack option 2 vs. curved rollable under small outcast conditions (Figure 16a and Figure 17);
(2)
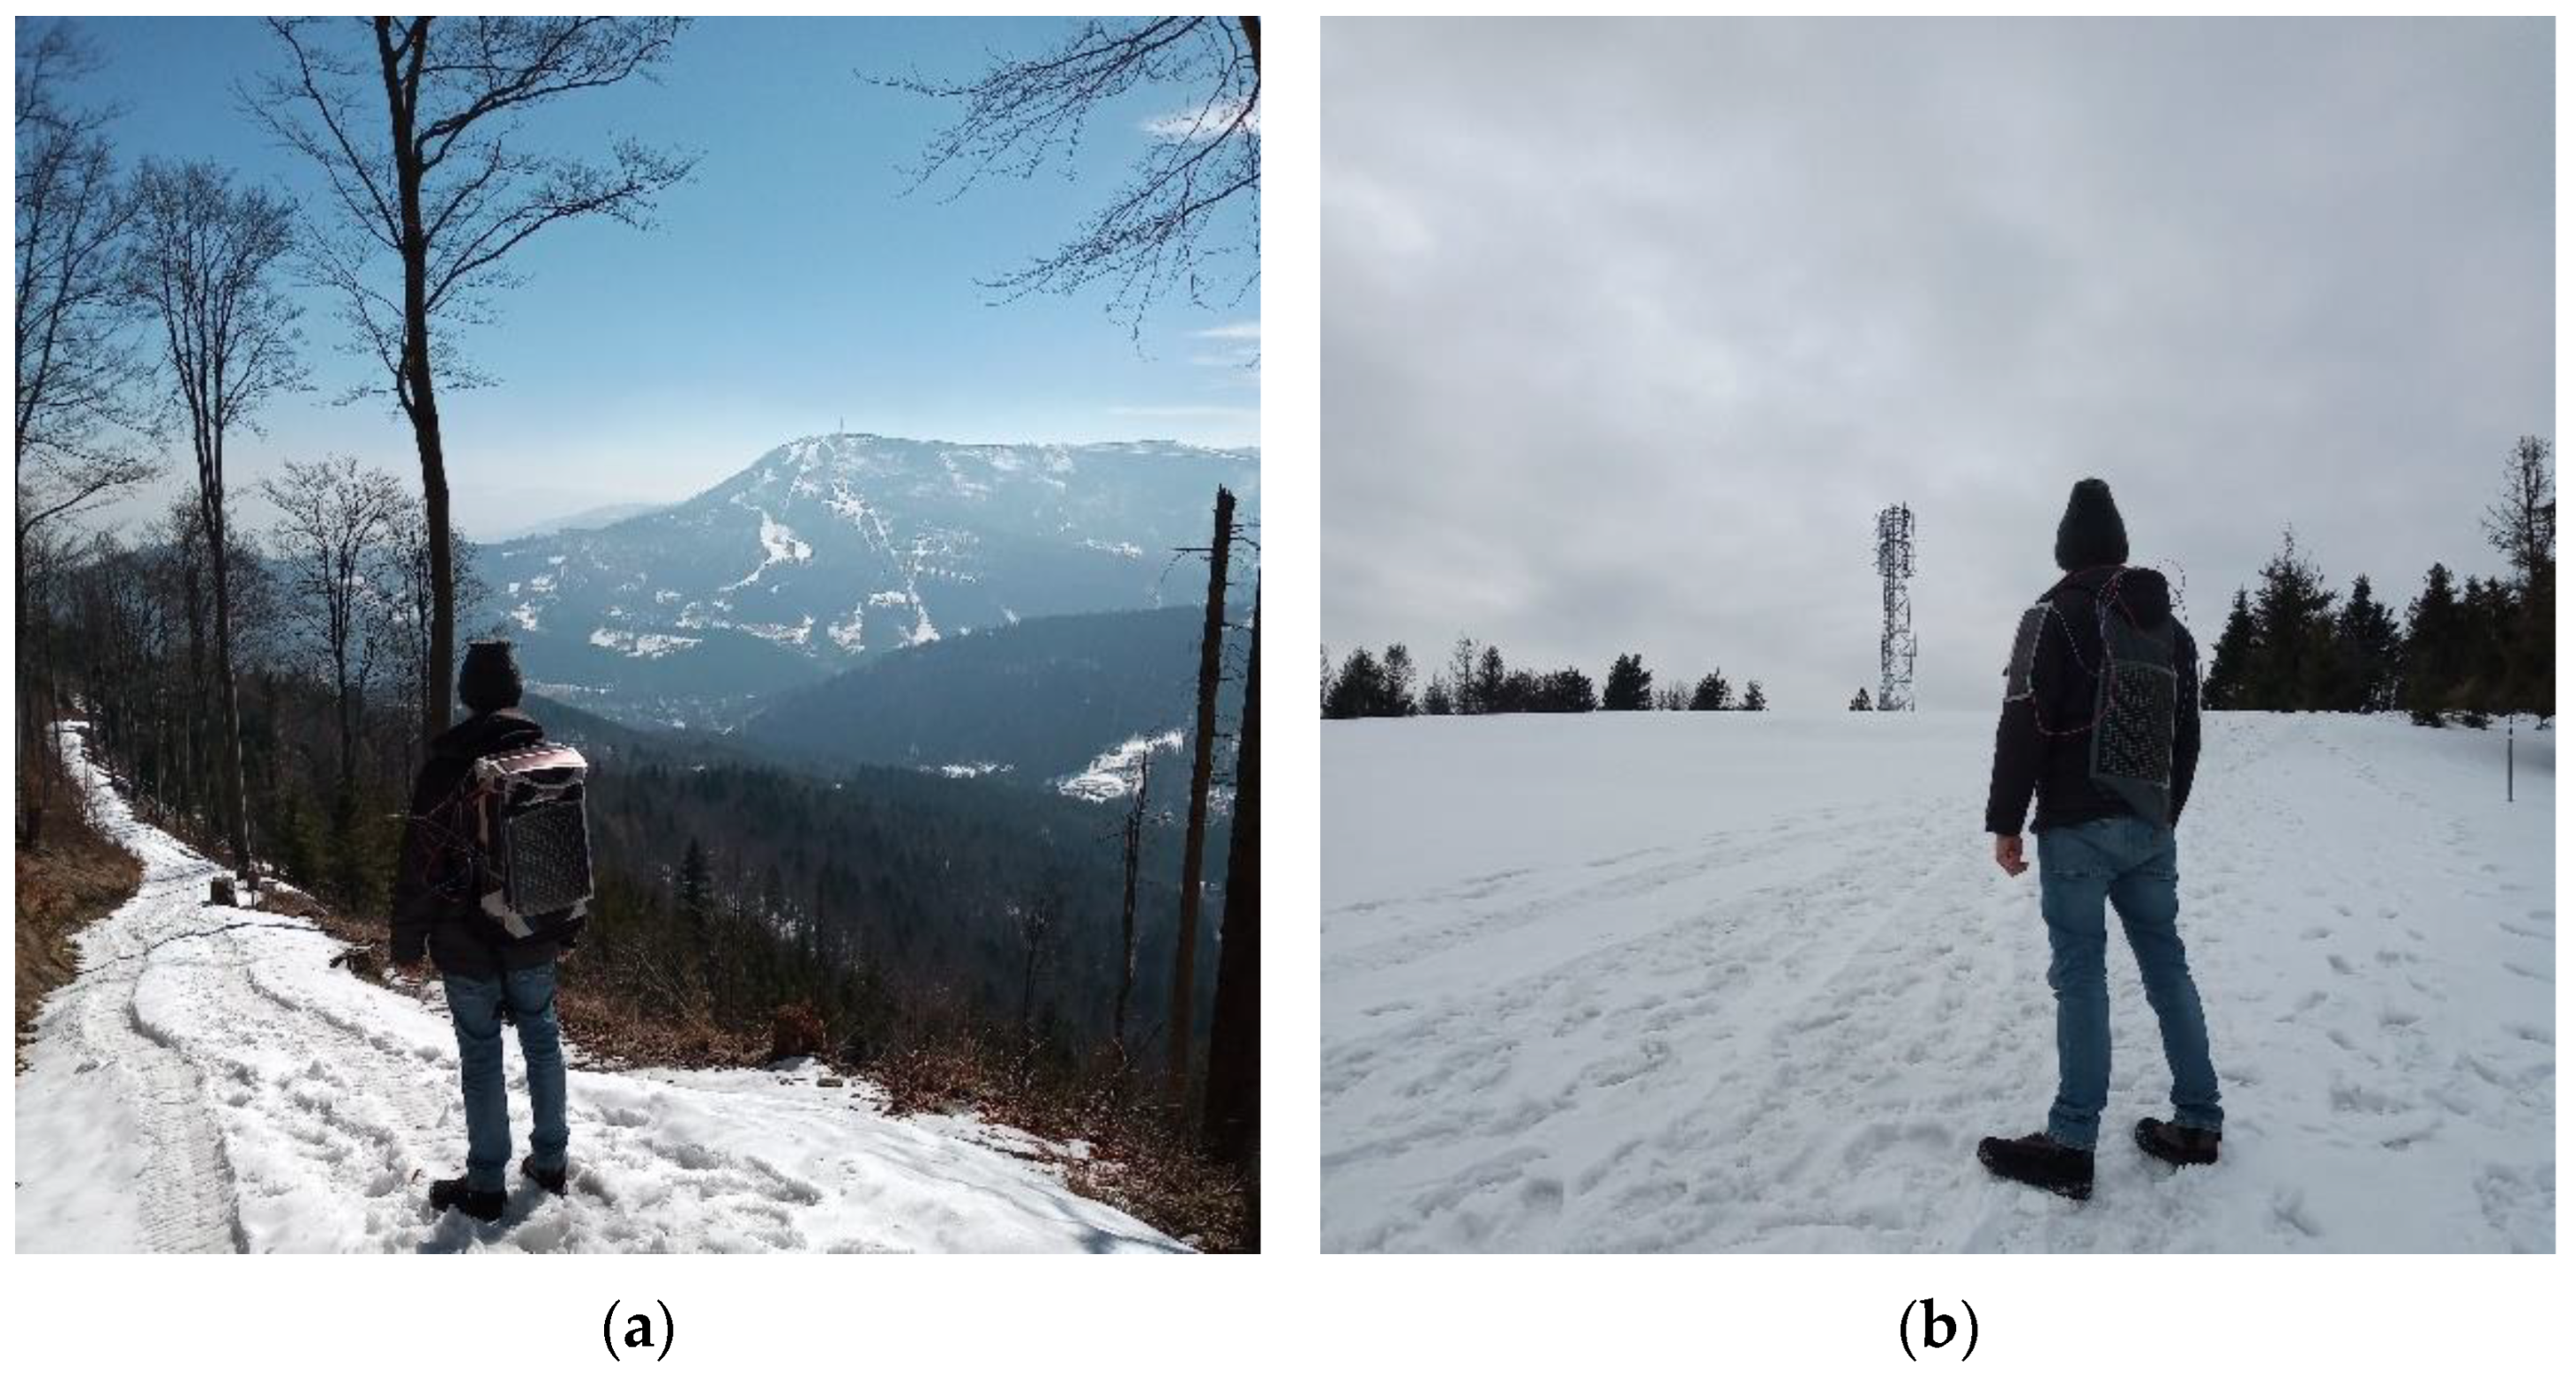
Curved rollable vs. jacket under full overcast conditions (Figure 16b).
To eliminate the influence of the PCU supply current, the battery pack charging current Ipv was considered in the analysis instead of the net battery current Ibat. The time diagrams in Figure 18 and Figure 19 show the following parameters as recorded by the system during the tests at the terminals of the battery pack: the charging current, the voltage, the charging power, and the energy delivered to the pack. The corresponding total energy delivered as well as the average charging power over a complete series of tests is presented in Table 8 and Table 9.

7. Discussion

As shown in Section 3, power is drawn mainly by the heating pads, so it is the MPC efficiency that dictates the battery size and system operating time. Using the MPC loss model described in Section 4.1, a high efficiency of over 0.95 was estimated for a 100 W system under almost any operating condition. Exceptions concern the lowest heating power settings at the highest battery voltages, when one to three heating pads are active, each operating at 20% of its rated power. These cases, however, are not critical, as the power drawn from the battery is then low and the state of charge of the latter is high.
The results of measurements performed on a prototype MPC as presented in Section 4.2 confirmed the above predictions. The agreement between simulations and measurements was high over the full range of heating power and battery voltage, with the average absolute error ranging from 0.0026 for a discharged battery to 0.0071 for a charged battery. This proves the validity and the adequacy of the proposed model. Nevertheless, it tended to underestimate the efficiency. This may be related to the quite conservative consideration of the supply power of the MPC controller whose current was assumed to be constant at its maximum value given in the respective datasheet.
According to Section 5.2, the end-of-life energy capacity of the custom battery pack applied is 101 Wh. According to Equation (1), this ensures a minimum operation time of 57 min for a 100 W system with heating pads operating at their rated power (the measured total efficiency of the power supply then being 95.5%) and 76 min for a 76 W one (under an efficiency of 96.5%), as presented in Table 10. When the minimum duty cycles (20%) of the low-frequency PWM control signals are set continuously, these times become 4 h 53 min and 6 h 26 min, respectively (under an efficiency of 97.0%).
If a realistic use profile is considered as presented in Section 5.1, the operating time predicted by the model is 8 h 3 min, which is sufficient for a typical rescue operation. This result is independent of the rated heating power, as the use profile assumed absolute power values in watts rather than percentages of the system’s rating.
Among the three PV module sets tested in real use conditions as described in Section 5.3 and Section 6.3, in good weather conditions (little cloud cover, high intensity of sunlight), the best results were observed for the backpack option 2 configuration. However, the difference was only 3% with respect to the curved rollable configuration. This is consistent with static tests presented in Section 6.1 and Section 6.2, where this difference was 4%.
In full overcast conditions, measurements showed an even less significant difference (under 0.5%) between the curved rollable and the jacket configurations, which is much less than in static tests (10%). This discrepancy is due to the location of the PV modules being of little importance under diffuse light, as light intensity is then almost identical from all directions. The average power obtained in full overcast conditions is about 40% of the one measured under small overcast ones.
Table 10 also shows how system operating times may be extended by the application of PV modules, as calculated according to Equation (2). Based on the results found in Section 6.3, with the most favorable weather (small outcast) and the most effective configuration (backpack option 2), the average charging power is 2.26 W. For a 100 W heating system operated continuously at its rated power, the extension is only 2 min. However, this increases to 38 min when minimum duty cycles are set. For a 76 W system, the corresponding times are 3 and 67 min.
For the realistic use profile, the gain is 1 h 54 min under small overcast conditions. Even with the sky fully overcast, when the power delivered by the PV modules is reduced to 0.84 W, the operating time is extended by 34 min.

8. Conclusions

In the considered application, the power requirements are dominated by the heating pads, so the efficiency of their main power converter is of great importance. In the prototype system, it achieved high values of 0.95 or more over a wide range of the heating power and the battery state of charge. Lower efficiency was only measured at the lowest heating power setting, when the corresponding absolute power loss is low.
The MPC model developed proved to be accurate enough to predict the efficiency under large variations in operating conditions. The form of this model enabled design times to be reduced considerably with respect to running transient analyses in a circuit simulator. The model was also used to size the battery pack. To achieve an operation time of 8 h under a realistic load profile established in consultation with the potential end users, a 5S2P 16,850 lithium-ion battery pack is optimal, with an end-of-life capacity of 101 Wh and a total weight of about 0.5 kg.
The results of tests of various PV generator configurations, both static ones and those conducted during physical activity in different real-use conditions (direct or diffuse sunlight) show that the most beneficial arrangement is where several modules are placed vertically on three sides of the silhouette as well as horizontally on a top surface. However, the deviations from the average power of the best configuration are below 16% for the other two preselected ones. In practice, it may be more advantageous to use a single PV sheet with a suitable size and properly shaped (a curved panel with its surface oriented in part horizontally and in part vertically).
It should be noted that the above applies to results averaged over different azimuthal angles of the user’s silhouette as well as over different angular altitudes of the Sun. For particular cases, the differences between the various PV module configurations are more prominent. In specific conditions, such as when the user’s path azimuth does not change much and the sunlight is direct, the globally optimal configuration may yield little power.
For a realistic use case and under favorable weather conditions in winter (small overcast), a PV module set with a total area of ca. 1400 cm2 is able to deliver an amount of energy that increases the heating system operating time by 24%. On the other hand, with a complete cloud cover, this extension is reduced to 7%.

Author Contributions

Conceptualization, B.P., P.M., Ł.S. and G.B.; methodology, B.P., P.M. and Ł.S.; software, B.P., P.M., Ł.S. and A.S.; validation, B.P., P.M. and G.B.; formal analysis, Ł.S.; investigation, B.P., P.M. and Ł.S.; resources, B.P., P.M. and Ł.S.; data curation, Ł.S.; writing—original draft preparation, B.P. and P.M.; writing—review and editing, B.P., P.M. and Ł.S.; visualization, Ł.S.; supervision, G.B.; project administration, A.S.; funding acquisition, B.P., P.M., Ł.S., A.S. and G.B. All authors have read and agreed to the published version of the manuscript.

Funding

This work was supported by the Project “Personalized Protective Thermally Active clothiNg” from The National Centre for Research and Development under Grant POIR.04.01.04-00-0070/18.

Informed Consent Statement

Informed consent was obtained from all subjects involved in the study.

Data Availability Statement

Data from the experiments are not publicly available due to foreseen commercial exploitation of the project’s results.

Conflicts of Interest

The authors declare no conflict of interest. The funders had no role in the design of the study; in the collection, analyses, or interpretation of data; in the writing of the manuscript, or in the decision to publish the results.

References

  1. Gerbing Heated Clothing. Available online: https://www.gerbing.com (accessed on 29 May 2022).
  2. Milwaukee® Tool Official Site. Available online: https://www.milwaukeetool.com/tools/cordless-tools/heated-gear/m12-cordless-black-heated-jacket-kit/2345 (accessed on 29 May 2022).
  3. DEWALT® Power Tools Official Site. Available online: https://www.dewalt.com/products/storage-and-gear/safety-and-protective-workwear (accessed on 29 May 2022).
  4. Nordic Heat. Available online: https://nordic-heat.com/ (accessed on 29 May 2022).
  5. Heated Clothing|Coat Heater|Heated Insoles|DIY Heated Jacket. Available online: https://anseris.com/ (accessed on 29 May 2022).
  6. Dąbrowska, A.; Bartkowiak, G.; Pękosławski, B.; Starzak, Ł. Comprehensive evaluation of a photovoltaic energy harvesting system in smart clothing for mountain rescuers. IET Renew. Power Gener. 2020, 14, 3200–3208. [Google Scholar] [CrossRef]
  7. Pękosławski, B.; Starzak, Ł.; Dąbrowska, A.; Bartkowiak, G. Evaluation methodology of a smart clothing biomechanical energy harvesting system for mountain rescuers. Sensors 2021, 21, 905. [Google Scholar] [CrossRef]
  8. Hashemi, S.A.; Ramakrishna, S.; Aberle, A.G. Recent progress in flexible–wearable solar cells for self-powered electronic devices. Energy Environ. Sci. 2020, 13, 685. [Google Scholar] [CrossRef]
  9. Páez-Montoro, A.; García-Valderas, M.; Olías-Ruíz, E.; López-Ongil, C. Solar energy harvesting to improve capabilities of wearable devices. Sensors 2022, 22, 3950. [Google Scholar] [CrossRef] [PubMed]
  10. Ostfeld, A.; Gaikwad, A.; Khan, Y.; Arias, A.C. High-performance flexible energy storage and harvesting system for wearable electronics. Sci. Rep. 2016, 6, 26122. [Google Scholar] [CrossRef] [Green Version]
  11. Mohsen, S.; Zekry, A.; Youssef, K.; Abouelatta, M. An autonomous wearable sensor node for long-term healthcare monitoring powered by a photovoltaic energy harvesting system. Int. J. Electron. Telecommun. 2020, 66, 267–272. [Google Scholar] [CrossRef]
  12. Jokic, P.; Magno, M. Powering smart wearable systems with flexible solar energy harvesting. In Proceedings of the 2017 IEEE International Symposium on Circuits and Systems (ISCAS), Baltimore, MD, USA, 28–31 May 2017; pp. 1–4. [Google Scholar] [CrossRef]
  13. Castillo-Atoche, A.; Caamal-Herrera, K.; Atoche-Enseñat, R.; Estrada-López, J.J.; Vázquez-Castillo, J.; Castillo-Atoche, A.C.; Palma-Marrufo, O.; Espinoza-Ruiz, A. Energy efficient framework for a AIoT cardiac arrhythmia detection system wearable during sport. Appl. Sci. 2022, 12, 2716. [Google Scholar] [CrossRef]
  14. Dionisi, A.; Marioli, D.; Sardini, E.; Serpelloni, M. Autonomous wearable system for vital signs measurement with energy-harvesting module. IEEE Trans. Instrum. Meas. 2016, 65, 1423–1434. [Google Scholar] [CrossRef]
  15. De Fazio, R.; Cafagna, D.; Marcuccio, G.; Minerba, A.; Visconti, P. A multi-source harvesting system applied to sensor-based smart garments for monitoring workers’ bio-physical parameters in harsh environments. Energies 2020, 13, 2161. [Google Scholar] [CrossRef]
  16. Bibbo, D.; Conforto, S.; Laudani, A.; Lozito, G.M. Solar energy harvest on bicycle helmet for smart wearable sensors. In Proceedings of the 2017 IEEE 3rd International Forum on Research and Technologies for Society and Industry (RTSI), Modena, Italy, 11–13 September 2017; pp. 1–6. [Google Scholar] [CrossRef]
  17. Başoğlu, M.E.; Üstek, S.M. Prototype development of a solar-powered backpack for camping applications. Gazi Univ. J. Sci. Part C 2021, 9, 589–596. [Google Scholar] [CrossRef]
  18. Taverne, J.; Muhammad-Sukki, F.; Ayub, A.S.; Sellami, N.; Abu-Bakar, S.H.; Bani, N.A.; Mas’ud, A.A.; Iyi, D. Design of solar powered charging backpack. Int. J. Power Electron. Drive Syst. 2018, 9, 848–858. [Google Scholar] [CrossRef]
  19. Bagci, F.S.; Kim, K.A.; Lin, T.-Y.; Liu, Y.-C. Power profile measurement and system design Analysis for a wearable photovoltaic application. In Proceedings of the 2020 IEEE 9th International Power Electronics and Motion Control Conference (IPEMC2020-ECCE Asia), Nanjing, China, 29 November–2 December 2020; pp. 1469–1474. [Google Scholar] [CrossRef]
  20. Leonov, V.; Torfs, T.; Vullers, R.J.M.; Su, J.; Van Hoof, C. Renewable energy microsystems integrated in maintenance-free wearable and textile-based devices: The capabilities and challenges. In Proceedings of the IEEE International Conference on Industrial Technology, Vina del Mar, Chile, 14–17 March 2010; pp. 967–972. [Google Scholar] [CrossRef]
  21. Brogan, Q.; O’Connor, T.; Ha, D.S. Solar and thermal energy harvesting with a wearable jacket. In Proceedings of the IEEE International Symposium on Circuits and Systems (ISCAS), Melbourne, Australia, 1–5 June 2014; pp. 1412–1415. [Google Scholar] [CrossRef]
  22. Satharasinghe, A.; Hughes-Riley, T.; Dias, T. A review of solar energy harvesting electronic textiles. Sensors 2020, 20, 5938. [Google Scholar] [CrossRef]
  23. infinityPV. Available online: https://infinitypv.com/ (accessed on 29 May 2022).
  24. PowerFilm Solar. Available online: https://www.powerfilmsolar.com/ (accessed on 29 May 2022).
  25. Mitter, C.S. Device considerations for high current, low voltage synchronous buck regulators (SBR). In Proceedings of the WESCON/97 Conference Proceedings, Santa Clara, CA, USA, 6 November 1997; pp. 281–288. [Google Scholar] [CrossRef]
  26. Brown, J. Modeling the switching performance of a MOSFET in the high side of a non-isolated buck converter. IEEE Trans. Power Electron. 2006, 21, 3–10. [Google Scholar] [CrossRef]
  27. Ren, Y.; Xu, M.; Zhou, J.; Lee, F.C. Analytical loss model of power MOSFET. IEEE Trans. Power Electron. 2006, 21, 310–319. [Google Scholar] [CrossRef]
  28. Xiong, Y.; Sun, S.; Jia, H.; Shea, P.; Shen, Z.J. New physical Insights on power MOSFET switching losses. IEEE Trans. Power Electron. 2009, 24, 525–531. [Google Scholar] [CrossRef]
  29. Kartsch, V.; Tagliavini, G.; Guermandi, M.; Benatti, S.; Rossi, D.; Benini, L. BioWolf: A sub-10-mW 8-channel advanced brain–computer interface platform with a nine-core processor and BLE connectivity. IEEE Trans. Biomed. Circuits Syst. 2019, 13, 893–906. [Google Scholar] [CrossRef] [PubMed]
  30. Ozkan, H.; Ozhan, O.; Karadana, Y.; Gulcu, M.; Macit, S.; Husain, F. A portable wearable tele-ECG monitoring system. IEEE Trans. Instrum. Meas. 2020, 69, 173–182. [Google Scholar] [CrossRef]
  31. Wong, D.L.T.; Yu, J.; Li, Y.; Deepu, C.J.; Ngo, D.H.; Zhou, C.; Singh, S.R.; Koh, A.; Hong, R.; Veeravalli, B.; et al. An integrated wearable wireless vital signs biosensor for continuous inpatient monitoring. IEEE Sens. J. 2020, 20, 448–462. [Google Scholar] [CrossRef]
  32. Mahmud, M.S.; Wang, H.; Esfar-E-Alam, A.M.; Fang, H. A wireless health monitoring system using mobile phone accessories. IEEE Internet Things J. 2017, 4, 2009–2018. [Google Scholar] [CrossRef]
  33. McLeod, K.; Spachos, P.; Plataniotis, K.N. Smartphone-based wellness assessment using mobile environmental sensors. IEEE Syst. J. 2021, 15, 1989–1999. [Google Scholar] [CrossRef]
  34. Erickson, R.; Maksimović, D. Fundamentals of Power Electronics, 2nd ed.; Kluwer: New York, NY, USA, 2001. [Google Scholar]
  35. Cavallaro, C.; Musumeci, S.; Pagano, R.; Raciti, A.; Shenai, K. Analysis modeling and simulation of low-voltage MOSFETs in synchronous-rectifier buck-converter applications. In Proceedings of the IECON’03. 29th Annual Conference of the IEEE Industrial Electronics Society, Roanoke, VA, USA, 2–6 November 2003; pp. 1697–1702. [Google Scholar] [CrossRef]
  36. Ostadi, A.; Kazerani, M.; Chen, S. Optimal sizing of the Energy Storage System (ESS) in a battery-electric vehicle. In Proceedings of the 2013 IEEE Transportation Electrification Conference and Expo (ITEC), Detroit, MI, USA, 16–19 June 2013. [Google Scholar] [CrossRef]
  37. Akpolat, A.N.; Yang, Y.; Blaabjerg, F.; Dursun, E.; Kuzucuoğlu, A.E. Li-ion-based battery pack designing and sizing for electric vehicles under different road conditions. In Proceedings of the 2020 International Conference on Smart Energy Systems and Technologies (SEST), Istanbul, Turkey, 7–9 September 2020. [Google Scholar] [CrossRef]
  38. Flashlight Information. Available online: https://lygte-info.dk/info/indexBatteriesAndChargers%20UK.html (accessed on 30 May 2022).
  39. Li, K.; Wei, F.; Tseng, K.J.; Soong, B. A practical lithium-ion battery model for state of energy and voltage responses prediction incorporating temperature and ageing effects. IEEE Trans. Ind. Electron. 2018, 65, 6696–6708. [Google Scholar] [CrossRef]
Figure 1. Heating system block diagram (blue: digital signals, green: analog signals, red: power flow).
Energies 15 05656 g001
Figure 2. Block diagram of the algorithm of the control module.
Energies 15 05656 g002
Figure 3. Simulated MPC characteristics: (a) Efficiency as a function of the load current for different input voltages; (b) Component power losses as functions of the input voltage for the maximum load current.
Energies 15 05656 g003
Figure 4. Simulated and measured MPC efficiencies as functions of its output power, for minimum and maximum input voltages (battery pack fully discharged or fully charged).
Energies 15 05656 g004
Figure 5. Battery pack operating characteristics as obtained with the developed model in the assumed real use case: (a) Heating power profile; (b) Charge drawn from the battery pack and battery pack voltage.
Energies 15 05656 g005
Figure 6. PV module configurations for a backpack: (a) Option 1; (b) Option 2.
Energies 15 05656 g006
Figure 7. Rollable PV sheet: (a) Flat; (b) Curved.
Energies 15 05656 g007
Figure 8. PV module configuration for a jacket.
Energies 15 05656 g008
Figure 9. Measurement setup for static tests of PV module sets.
Energies 15 05656 g009
Figure 10. Measurement results for the backpack option 1 as functions of the azimuthal angle of the silhouette: (a) Power delivered by each PV module; (b) Power share of each PV module.
Energies 15 05656 g010
Figure 11. Measurement results for the backpack option 2 as functions of the azimuthal angle of the silhouette: (a) Power delivered by each PV module; (b) Power share of each PV module.
Energies 15 05656 g011
Figure 12. Measurements results for the jacket as functions of the azimuthal angle of the silhouette: (a) Power delivered by each PV module; (b) Power share of each PV module.
Energies 15 05656 g012
Figure 13. Measurement results for the flat rollable PV sheet as functions of the azimuthal angle of the silhouette: (a) Power delivered by each PV module; (b) Power share of each PV module.
Energies 15 05656 g013
Figure 14. Measurement results for the curved rollable PV sheet as functions of the azimuthal angle of the silhouette: (a) Power delivered by each PV module; (b) Power share of each PV module.
Energies 15 05656 g014
Figure 15. Power output of different PV module configurations averaged over five experiments as a function of the silhouette azimuthal angle.
Energies 15 05656 g015
Figure 16. PV generator tests in real use conditions: (a) Backpack option 2 configuration tested under a lightly cloudy sky; (b) Jacket configuration tested under an overcast sky.
Energies 15 05656 g016
Figure 17. The flat rollable PV sheet during tests in real use conditions.
Energies 15 05656 g017
Figure 18. Electrical quantities at the terminals of the battery pack during PV generator tests in real use, small overcast conditions.
Energies 15 05656 g018
Figure 19. Electrical quantities at the terminals of the battery pack during PV generator tests in real use, full overcast conditions.
Energies 15 05656 g019
Table 1. State-of-the-art comparison table.
Application and Supply PowerAnalyzed
Parameters
Study Conditions
Páez-Montoro et al. [9]Vital function monitor (VFM), bracelet
5.5 mW
Current
Operating time
State of charge
Different lighting conditions and test scenarios
Ostfeld
et al. [10]
VFM, bracelet
10 mW
Current, Voltage
Capacity
Operating time
Different lighting conditions
Mohsen
et al. [11]
VFM, bracelet
64.68 mW
Voltage
Operating time
Single case
Jokic
et al. [12]
VFM, bracelet
below 1 mW
Voltage
Power
Different lighting conditions
Castillo-Atoche et al. [13]IoT cardiac arrhythmia detectorOperating time (calculated theoretical)Single case
Dionisiet
et al. [14]
VFM, t-shirt
17 mW
Current
Power
Different weather conditions
Two panel orientations
Different Sun azimuth angles
De Fazio
et al. [15]
VFM, jacket
17 mW
Current
Power
Various harvesters
Outdoor (different weather conditions) and indoor
Bibbo
et al. [16]
Accident Detection System, bicycle helmetVoltage
Current
Outdoor (sunny weather) and indoor
Başoğl
et al. [17]
Camping application, backpackPowerOutdoor and indoor
Taverne
et al. [18]
Mobile phone charger, backpack Current
Capacity
Different weather conditions
Bagci et al. [19]Mobile phone charger, bagIrradiance
Current
Power
Different lighting conditions
Three different PV system architectures
Brogan
et al. [21]
Mobile phone charger, jacketPowerTEGs and PV cells
Four Sun azimuth angles
Four panel orientations
Different weather conditions
This workElectrically heated clothing, jacket, backpack, rollable PV sheetCurrent
Voltage
Power
Energy
(also including power losses)
Different weather conditions and test scenarios
Six Sun azimuth angles
Five different PV system architectures with equal active areas
Table 2. Shares in estimated control module power consumption.
ComponentOperating StateAverage
Power
Consumed
(mW)
Share in
Total Power
Consumption
(%)
µC with peripherals
(I2C, ADC, SPI, PWM)
Active18.0517.01
BLE peripheral of µCPeriodic transmission0.050.04
SD cardPeriodic writing5.535.21
Battery charge monitor with measurement amplifier and bufferContinuous acquisition6.165.81
I2C multiplexerActive0.060.05
Temperature and air humidity sensors (7 pieces)Periodic measurement0.290.27
Temperature and air pressure sensorPeriodic measurement0.080.08
Accelerometer and gyroscopeContinuous acquisition3.993.76
Light intensity sensorPeriodic measurement0.090.09
Pulse oximeterPeriodic measurement37.6635.48
Skin resistance sensorContinuous operation25.2023.74
Current sensing amplifiers (2 pieces)Continuous operation2.021.90
LDO regulators (2 pieces)Continuous operation2.872.70
Voltage pre-regulatorContinuous operation2.522.37
Battery voltage comparatorContinuous operation1.581.48
Table 3. Assumed realistic load profile.
Heating Power (W)Operating Time Share (%)
1002
802
607
407
207
075
Table 4. Battery pack parameters.
ParameterValue
Nominal voltage18.175 V
Maximum charge voltage21.0 V
Cut-off voltage12.5 V
Maximum discharge current8.0 A
Maximum discharge power100 W
End-of-life energy capacity101 Wh
Internal resistance100 mΩ
Weight530 g
Table 5. PV module parameters.
SymbolActive Area
(cm2)
Maximum Power Point Voltage
(V)
Maximum Power Point Current
(mA)
Maximum Power
(W)
P7.2-75F172.17.21200.86
PT15-75172.115.4500.77
PT15-300739.515.42003.08
R71416.015.44506.93
Table 6. PV module set configurations investigated.
ConfigurationModule LocationActive Area
(cm2)
Figure
BackTopLeftRight Front
Backpack, Option 1PT15-300×2 × P7.2-75F2 × P7.2-75F ×1428Figure 6a
Backpack, Option 2PT15-3002 × P7.2-75FPT15-75PT15-75×1428Figure 6b
Rollable, FlatR7××××1416Figure 7a
Rollable, CurvedR7×××1416Figure 7b
JacketPT15-300×PT15-75PT15-752 × P7.2-75F 1428Figure 8
Table 7. Static test times.
Experiment No.Start TimeEnd Time
110:0010:31
211:5412:14
313:4814:11
415:2815:46
517:0917:29
Table 8. Results of PV generator tests in real use, small overcast conditions.
ConfigurationTotal Test Duration (min:s)Energy Change (Wh)Average Power (W)
Backpack 251:401.9502.264
Curved rollable51:351.8912.199
Table 9. Results of PV generator tests in real use, full overcast conditions.
ConfigurationTotal Test Duration (min:s)Energy Change (Wh)Average Power (W)
Jacket27:250.3840.840
Curved rollable27:350.3880.844
Table 10. System operating times without and with PV modules in their backpack option 2 configuration, for a realistic use case of the heating system.
Weather
Conditions
Rated Heating PowerOperating Time (h:min)
Continuous Heating,
100% Rated Power
Continuous Heating,
20% Rated Power
Heating Power Profile
Without PVWith PVWithout PVWith PVWithout PVWith PV
Small overcast100 W0:570:59 (+2.3%)4:535:31 (+13%)8:039:57 (+24%)
76 W1:161:19 (+3.1%)6:267:34 (+17%)
Full overcast100 W0:570:58 (+0.8%)4:535:06 (+4%)8:038:37 (+7%)
76 W1:161:17 (+1.1%)6:266:49 (+6%)
Publisher’s Note: MDPI stays neutral with regard to jurisdictional claims in published maps and institutional affiliations.

