1. Introduction
Energy and environmental European targets, based on the 2015 Paris Agreement on Climate Change and the Union 2030 energy and climate framework, need to be achieved with the contribution of each country by means of different actions [
1]. To achieve these goals, during the last three decades, several ambitious actions have been implemented, such as the Kyoto protocol, the European Union climate and energy package, and the 2015 Paris Agreement, just to cite a few. The latest of these that involves European countries is the Clean energy for all Europeans package, which, through the EU 2018/2001—RED II [
1] and EU 2019/944—IEM Directives [
2], set forth the key role of citizens in the decarbonization and clean energy transition process. Indeed, these directives allow, for the first time, citizens to cooperate in community-shared energy projects, which enable the possibility to build together new renewable power generators and share both energy and benefits deriving from their operation.
In this sense, the RED II Directive introduces two aggregation levels, namely the Joint-Acting Renewable Self-Consumers (JARSCs) and the Renewable Energy Communities (RECs). Similarly, the IEM Directive introduces the Active Customers (ACs) and the Citizens Energy Communities (CECs). Even though these entities share some common traits, they aim at quite different objectives. JARCSs are a group of at least two jointly acting renewable self-consumers, which are in the same building or a multi-apartment block. ACs are single or aggregated users that can sell self-generated electricity and participate in flexibility and energy efficiency schemes, among other things [
3]. RECs and CECs are more complex schemes; RECs are legal entities that are based on open and voluntary participation, are autonomous and effectively controlled by shareholders or members that are located close to the renewable energy projects, and whose primary purpose is to provide environmental, economic, or social community benefits, rather than financial profits [
1]. CECs are legal entities that are based on open and voluntary participation and whose aim is to facilitate access to the electricity generation, aggregate services provision, and electricity market participation.
At the national level, the 2030 Italian Energy and Climate Plan (PNIEC) [
4] aims at reaching a share of energy from Renewable Energy Sources (RESs) for final consumption of energy up to 30%, a reduction in primary energy consumption compared to the PRIMES 2007 scenario up to 43%, and a reduction in Greenhouse Gas (GHG) emissions with respect to 2005 for all non-Emissions Trading Scheme (ETS) sectors up to 33% [
5]. In this case also, RECs have been recognized as a key instrument for reaching these ambitious targets. Indeed, the possibilities enabled by this new scheme can significantly contribute to the construction of new renewable generation systems [
6]. Moreover, these shared projects produce social, environmental, and economic benefits for the members and have the potential advantage of reducing the perturbations on the high-voltage transmission and distribution grids. For these reasons, the diffusion of initiatives based on these new schemes is promoted and facilitated also through the allocation of financial resources from the COVID-21 recovery plans (PNRR) for EUR 2 billion [
7].
In 2019, the Italian government started the implementation of the aforementioned directives, through the implementation of a temporary regulatory framework. The Italian Decree-Law n. 162, namely Milleproroghe 2019 [
8], introduced for the first time the possibility for users to directly and jointly promote renewable energy projects, whose aim is to provide environmental, economic, and social benefits on the territory where they reside. In compliance with the RED II Directive, this law defines an REC as legal entity, whose members or shareholders are natural persons, local authorities, including municipalities, or small enterprises, and whose main objective is the provision of benefits to the members or shareholders rather than financial profit. However, this preliminary regulation framework limits the REC to members that are connected to the same MV/LV substation and limits the size of each generator to 200 kW. More recently, at the end of 2021, the Italian Parliament completed the implementation process of the two directives. The main novelties were (i) the enlargement of the REC perimeter up to the primary substation (AT/MT substation), (ii) the possibility to include new generators up to 1 MW of maximum power, and (iii) the possibility to include existing generators up to 30% of the overall installed power serving the community [
9].
During the last three years, a intense interest in the REC topic has been shown by the scientific and energy policy communities. Different studies have also collected works on this topic, which clarified the differences about the typologies of RECs’ definitions and classifications [
10] and defined the main characteristics of REC projects [
11]. An investigation into energy justice and the community scopes of RECs was conducted in [
12]. Recent studies allow the possibility to define the limits of the energy community analysis by including the real and simulation case studies about sharing energy system configurations worldwide [
13] and also to define the advantage of RECs from a socioeconomic–environmental point of view [
14].
Since the REC entities according to RED II are fairly recent, there are only a few papers on this topic, in particular with applications in the Italian regulation framework. Recent literature presents several methodologies aiming at the optimal design of RECs. A review of the technical aspects of designing various local energy systems is presented in [
15]. Several aspects of RECs’ optimal design were addressed in [
16]. In particular, different REC business models have been compared and a new method for fair revenue distribution for both REC members and REC aggregators and appropriate exit clauses has been proposed. A methodology for supporting the decision process of citizens investing in a new REC with the goal to optimize its production portfolio was proposed in [
17,
18]. Another review paper introduced the concept of smart energy systems and stressed the idea that the smart energy system and the smart grid concepts are separate and that a holistic approach addressing more subsectors and the integration of smart electricity, gas, and thermal grids is required to identify potential synergies. These networks should furthermore be analyzed in combination with storage technologies for achieving an optimal solution for each sector [
19].
As regards the REC case studies, in an Italian study, a simulation analysis was conducted by considering the potential REC in Monticello d’Alba, a small town in Northern Italy. The results highlight the possibility to create several positive economic returns such as new employment due to REC maintenance and management activities [
20]. A study about the demand-side management realizes the optimization of an REC by following both economic and environmental parameters. The replacement of the traditional system in which the end-users are single consumers with REC allows avoiding CO
2 emissions close to 45%, an internal rate of return higher than 11%, and also avoiding energy primary use equal to 14% [
21]. A French work about RECs analyzes the comparison between two different scenarios of seven end-users equipped with a 7 kW PV plant each. The first case defines each end-user as a single self-consumer, while in the second case, the energy production from all PVs can be shared. The results highlight the highest self-consumption for the second scenario [
22]. In [
23], the performance of a small-sized REC in Naples (Southern Italy), composed of two offices, was evaluated by considering both the possibilities of sharing and not sharing of PV energy production. The results show that with the not sharing approach, the self-consumption index is lower than 70% for both offices, while by including the sharing approach, these values can be higher than 80%. Two public buildings located in Italy were simulated by considering an REC approach. The study optimizes the self-consumption and self-sufficiency by including also economic benefit evaluation [
24]. An additional study analyzes the energy sharing for two university Italian buildings equipped with two PV plants of 4 kW and 8 kW, respectively, and with two electric storage systems of 6 kWh and 12 kWh, respectively. The economic savings resulted in being equal to 71.0% as a consequence of a 28.0% increase in energy self-consumption [
25]. Additional studies have been conducted considering RECs’ development in rural areas in order to improve energy self-sufficiency. Okoye et al. [
26] defined a cost–benefit analysis in order to highlight the economic advantage of PV sharing in an REC that includes 300 households of rural communities in Nigeria. A standalone PV-based REC in a remote area of Uganda was investigated by Mandelli et al. by considering the aim of the leveling of the cost of “produced” electricity [
27]. By considering the REC state-of-the-art, the massive use of “not-programmable RES” such as PV and the presence of one typology of RES in the REC case study application define the seasonal dependence and low self-sufficiency the possibility also to improve the energetic self-sufficiency by the use of “programmable” RESs, such as geothermal or biomass [
28]. In a case study on Ischia Island (Southern Italy), the simulation of a geothermal-based REC in a condominium allows avoiding 29.9 t/y of CO
2 emissions [
29]. In a more complex geothermal energy district, the principal scope of the community is the sharing of thermal energy by using a thermal energy district network [
30]. In
Table 1, the main parameters considered in this study are reported to evaluate the novelty of our study with respect to the previously discussed literature. In detail, all of the studies considered non-programmable RES and electricity production, but few of them considered also programmable RESs, more then one RES, thermal production, and economic analysis according to the REC directive.
However, to the best of the authors’ knowledge, the methodologies proposed in the scientific literature consider mainly energy systems characterized by a large penetration of photovoltaic technology and only the electric energy carrier. Moreover, none of the analyzed methods was applied to large real-world case studies in the Italian regulation framework. In light of this, the main contributions of this paper are: (a) the definition of a method to analyze REC profitability; (b) an extensive technical analysis that includes multiple energy carriers; (c) the adoption of a large real case study, which allows assessing the new policy of the Italian regulatory framework.
The rest of the paper is structured as follows:
Section 2 focuses on the data of the energy conversion systems meeting the thermal and electricity loads of Tirano municipality (Northern Italy), as well as the definition of the proposed configurations of the energy community, the corresponding simulation model, and the indices used for the economic analysis.
Section 3 reports the results of the energy and economic analyses on the current energy conversion system configuration and for the proposed renewable energy community scenarios.
2. Materials and Methods
This section is divided into four parts: the first one reports data on energy conversion systems serving the city of Tirano, as well as historical data of a local District Heating Network (DHN); the second one addresses the datasets used in the analyses, while the third part introduces the definition of the proposed configurations of the energy community and describes the model used for its energy simulation; finally, the fourth subsection focuses on the definition of the methodology to evaluate the techno-economic performances of the proposed solutions.
2.1. Energy Conversion Systems Serving the DHN of Tirano
Different energy conversion systems are used to meet the Thermal (TU), Cooling (CU), and Electric (EU) demand of the Tirano end-users.
Figure 1 shows a schematic representation of the main energy systems within the perimeter identified by the Tirano HV/MV primary substation, whose core is composed by a Centralized biomass-based System (CS) serving the local DHN and several Distributed-Renewable Energy Systems (D-RESs). In particular, thermal and electric loads are partly covered by the following energy conversion systems, whose main data are reported in
Table 2:
Solar photovoltaic (PV): part of PV directly covers the electric load of the plant owners (2.59 MW), while the remaining part (1.70 MW) fully feeds electricity into the grid.
Small hydro (HYD), delivering up to 85 kW located along the aqueduct line serving Tirano municipality.
Syngas-fired Internal Combustion Engine (ICE) cogeneration system installed next to an end-user, which injects electric energy directly into the local distribution system. Thermal energy from syngas cooling after a Gasifier (G) and waste heat from internal combustion engines could be potentially exploited, since all equipment (heat exchanger, pumps, etc.) has been installed by the owners of these units [
31]. However, this integration has never been exploited, except for some experimental activities.
CS plant serving the local DHN, as well as covering electricity demand by means of a Combined Heat and Power (CHP) system, working with an Organic Rankine Cycle (ORC), installed in 2003.
Two 6 MW Biomass Boilers (BB1 and BB2) with 85% thermal efficiency. The BBs have a start-up phase of at least 24/48 h and, during the operating mode, a minimum Partial Load Factor (PLF) of 20% each.
An 8 MW Biomass Boiler (BB3) delivers thermal energy to diathermic oil used to activate the ORC unit. Thermal power produced by this unit can be directly injected into the DHN.
A 6 MW Fossil-fuel-Based boiler (FB) with 90% thermal efficiency connected to the DHN and used as a back-up/integration unit within the CS.
Three thermal Heat Storages (HSs) with a total capacity of 390 m3 are installed next to the DHN plant and operate to manage early morning peak load during the winter period, and thermal energy mainly available from the CHP system is used during nightly hours to charge the storage.
The biomass used to activate biomass boilers is obtained from the maintenance of local forest (73.5%), sawmill waste (25.7%), and pruning (0.8%) [
32]. The average Lower Heating Value (LHV) and moisture of the biomass normally used to feed the DHN plants are 9067 kJ/kg and 44.9%, respectively [
33]. The DHN auxiliaries’ demand can be met by RES-based systems (ORC-based CHP, solar PV, etc.) or by the power grid, which also covers the residual electric demand.
Table 2 reports the nominal electric and thermal capacity of all the energy conversion systems referring to 2020.
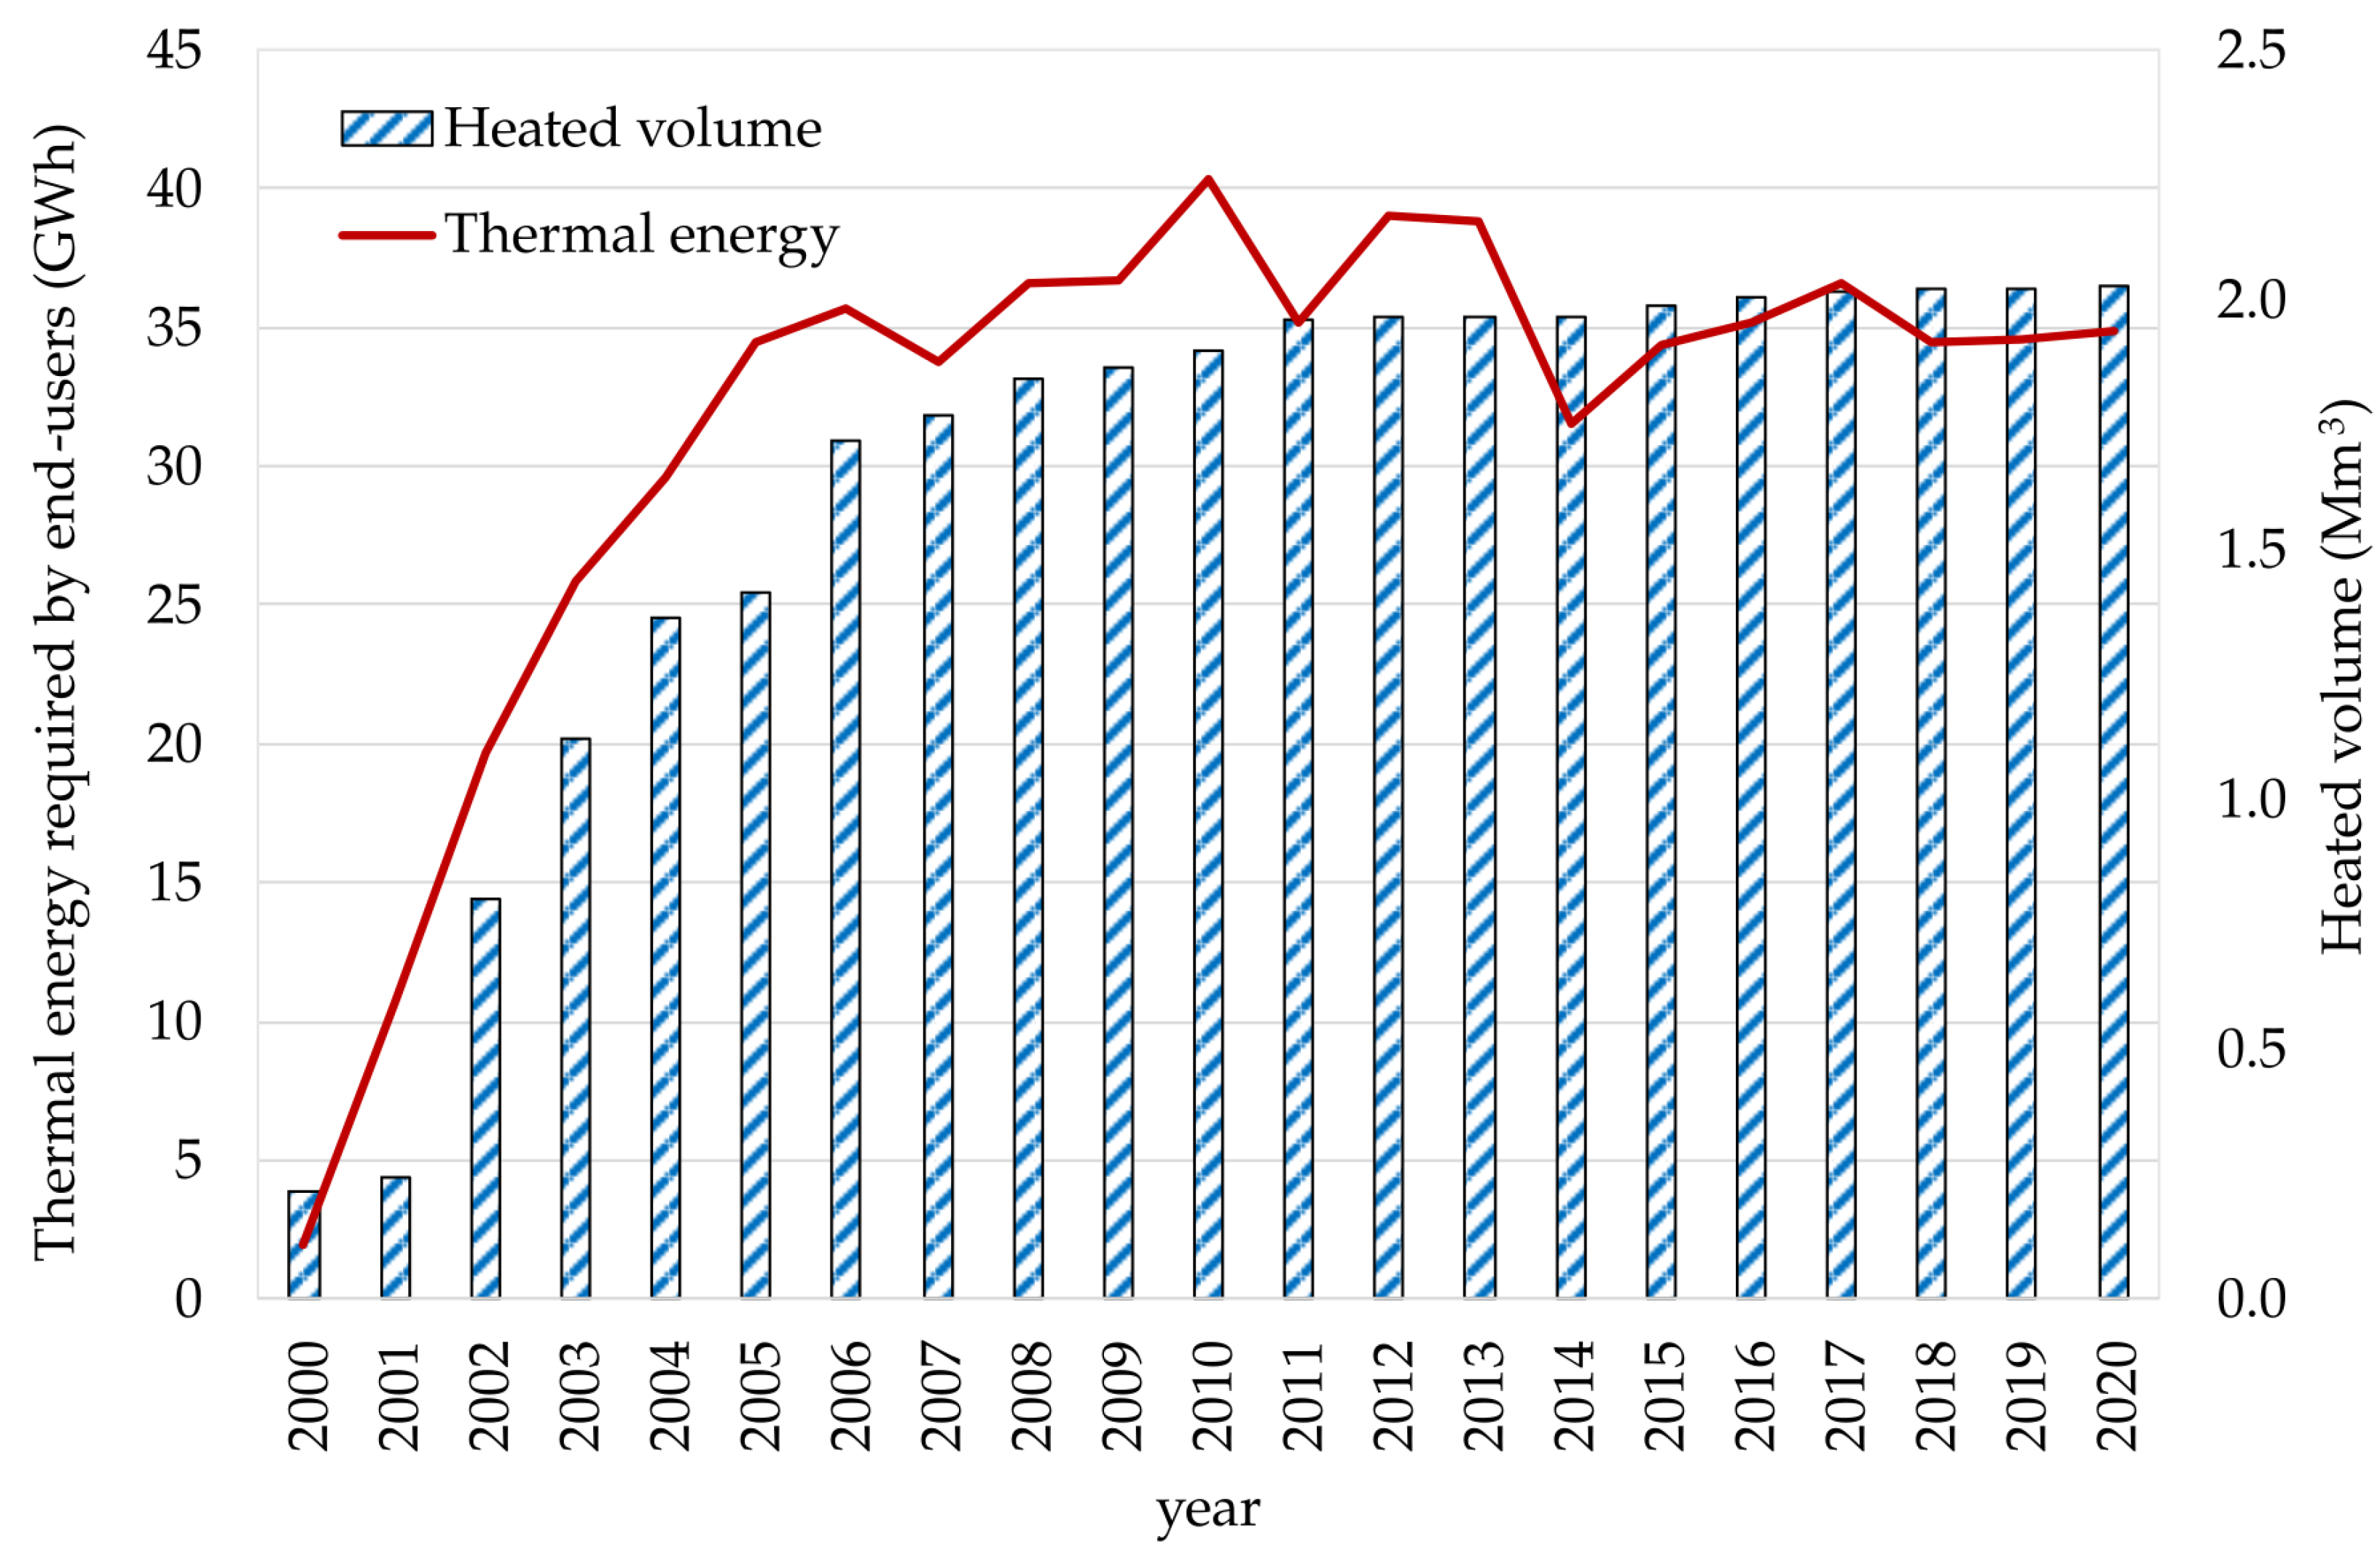
The DHN started operating in 2000; its length is 20.08 km, and it serves about 789 thermal substations with a global heated volume of 2,029,330 m
3 in 2020. The supply water temperature is about 90 °C while the minimum return water temperature is up to 60 °C. These specifications are compliant with those characterizing a 3rd-generation DHN [
34]. The local DHN mainly feeds winter residential, tertiary, and commercial heating and Domestic Hot Water (DHW) demand over the whole year (
). Moreover, a 70 kW Absorption Chiller (ABCH) serving a commercial building (
) is thermally activated during summer (
). Since 2000 up to 2020, the DHN served an increasing number of end-users, covering a thermal demand of 34.8 GWh in 2020; see
Figure 2 [
35]. It is worth noting that there has been a reduction in thermal demand starting from 2014, which is partly due to the introduction of thermostatic radiator valves [
36].
2.2. Dataset Used for the Analyses
Data for the analyses were mainly provided by the operator of the local DHN, TCVVV, and by the local distribution system operator, Reti Valtellina, Valchiavenna (REVV). Hereafter, the main datasets used for the studies described in this paper are briefly described:
Electricity demand of Tirano (), estimated starting with the produced, self-consumed, and exported electricity by each energy conversion system (ORC-based CHP, HYD, PV, and ICE) and the exchanges with the main grid ( and ) with 15 min granularity.
Thermal load () of the end-users connected to the local DHN for 2020 with 1 h granularity.
Thermal energy delivered on a monthly basis by each energy conversion system located in the CS serving the DHN.
A further contribution, made available from annual [
35,
37] or specific reports [
36], allows the evaluation of:
- -
Average thermal losses located next to the CS () due to heat storages, restraints on the management of energy conversion systems such as minimum load allowed, transient time needed to activate the device, and finally, economic evaluation in the presence of incentives for electricity produced by the CHP unit;
- -
Thermal losses due the DHN () that mainly depend on the operating temperature, length of the network, and ambient temperature.
Thermal losses through the DHN pipes, energy conversion systems’ management, thermal storages, and voluntary dissipation of thermal energy surplus derived from the maximization of the electric energy production (there was an economic incentive up to 2019) are in the range between 30% and 45%, as shown in
Figure 3. The main thermal losses are due to the management of plants serving the DHN, whose operation is limited by constraints that do not allow turning off the energy conversion systems.
2.3. Energy Community Scenarios
This subsection includes the definition of the REC scenarios for Tirano Municipality. More precisely, three energy conversion systems were considered: a new biomass-based co-generation unit, a new hydroelectric plant, and new PV systems. The sizing process, as well as the different analyzed operating modes for each technology are discussed as well. The existing ORC-based CHP system, installed in 2003, is experiencing severe performance degeneration and will soon require extraordinary and expensive maintenance. Moreover, during the last decade, thermal loads have slightly decreased, especially in the summer season. This caused a decreased operating time, which jeopardized the profitability of this unit. Based on these observations, the scenarios developed for an REC in Tirano consider the replacement of the existing CHP unit with a smaller biomass-fueled cogenerator, so that the performances are restored and the unit utilization rate is maximized. This new ORC-based CHP system (CHP_NEW) includes a new Biomass Boiler (BB4), whose nominal thermal power is 4.38 MW [
38], an electric nominal power of 587.7 kW, electric efficiency equal to 13.4% in the full load condition, and a thermal efficiency, including the biomass boiler, of 66.3%. The new CHP unit can work at partial load, and the minimum thermal power and electric power are 943.1 kW and 69.3 kW, respectively.
As mentioned before, the size of the new CHP was selected to improve the operating hours per year of the system with respect to the existing unit, which is normally switched off from the middle of June until the middle of October. The CHP size of the new unit was identified on the basis of the thermal load duration curve, evaluated considering the thermal load due to the DHN and reported in
Figure 4. In particular, it is worth noting that the new CHP can work at full load for about 4415 h per year and that its thermal power can supply the DHN, which can be partialized or charge the HS in the residual operating horizon. Only for a limited period, the unit, working at minimum load, is supposed to dissipate energy. Otherwise, the old ORC (in orange dotted line) can operate at full load for 3170 h per year, while in the remaining hours, it can work at partial load, both charging the HS or feeding the DHN. If the old CHP were left running at the minimum load, the dissipation of thermal energy would be excessive, leading to a very low global efficiency of this unit. The operating costs of the old CHP dissipating much thermal energy are too high, justifying its shutdown in the summer period in the actual configuration. This is also the reason why a new CHP system having the same size as the old one should not be considered for the proposed REC.
Finally, looking at plausible future scenarios, two possible conditions could be verified: (i) the reduction of thermal load, due to climate change or building stock renovation, or (ii) the increase of thermal substations served by the DHN thanks to the social, economic, energy, and environmental advantages ensured by the REC. As concerns the first issue, it is worth noting that the new CHP is undersized with respect to the total thermal load. Thus, a reduction of the total thermal requests does not jeopardize the economic sustainability of the new cogeneration plant. With regard to the second point, the potential thermal load increase under the pressure of the REC’s benefits could lead to the maximization of the utilization rate of the new cogenerator plant and of its profitability.
As concerns the existing biomass boilers (BB1, BB2 and BB3) and the FB, they operate to satisfy the thermal energy not met by the new CHP unit. The biomass boiler BB3 (which, in the existing configuration, mainly serves the old CHP unit) is used to directly supply the DHN. In the proposed REC, all thermal energy conversion systems are linked to the three heat storages. Moreover, a new 77 kW hydroelectric plant (HYD_NEW) and new PV systems (PV_NEW), mainly located on public buildings, are considered in the scenarios. Based on the main CHP dispatching logic, two scenarios are considered:
Furthermore, for each scenario, two different configurations are considered, based on the total photovoltaic penetration, namely 500 kW and 1000 kW. The photovoltaic size of the two scenarios was selected by considering the roof area availability on the public buildings of Tirano Municipality. However, in the case of a PV penetration increase, it may be useful to consider the installation of batteries to maximize the photovoltaic electricity self-consumption and the economic advantages due to the sharing of electricity within the REC. Finally, the capacity of the new hydroelectric plant was already identified in previous analyses. The annual electricity production of both systems, and , is estimated considering the real data of existing plants and by using appropriate scaling factors evaluated based on historical data.
2.4. Biomass-Based Energy Community Simulation
Hereinafter, the MATLAB [
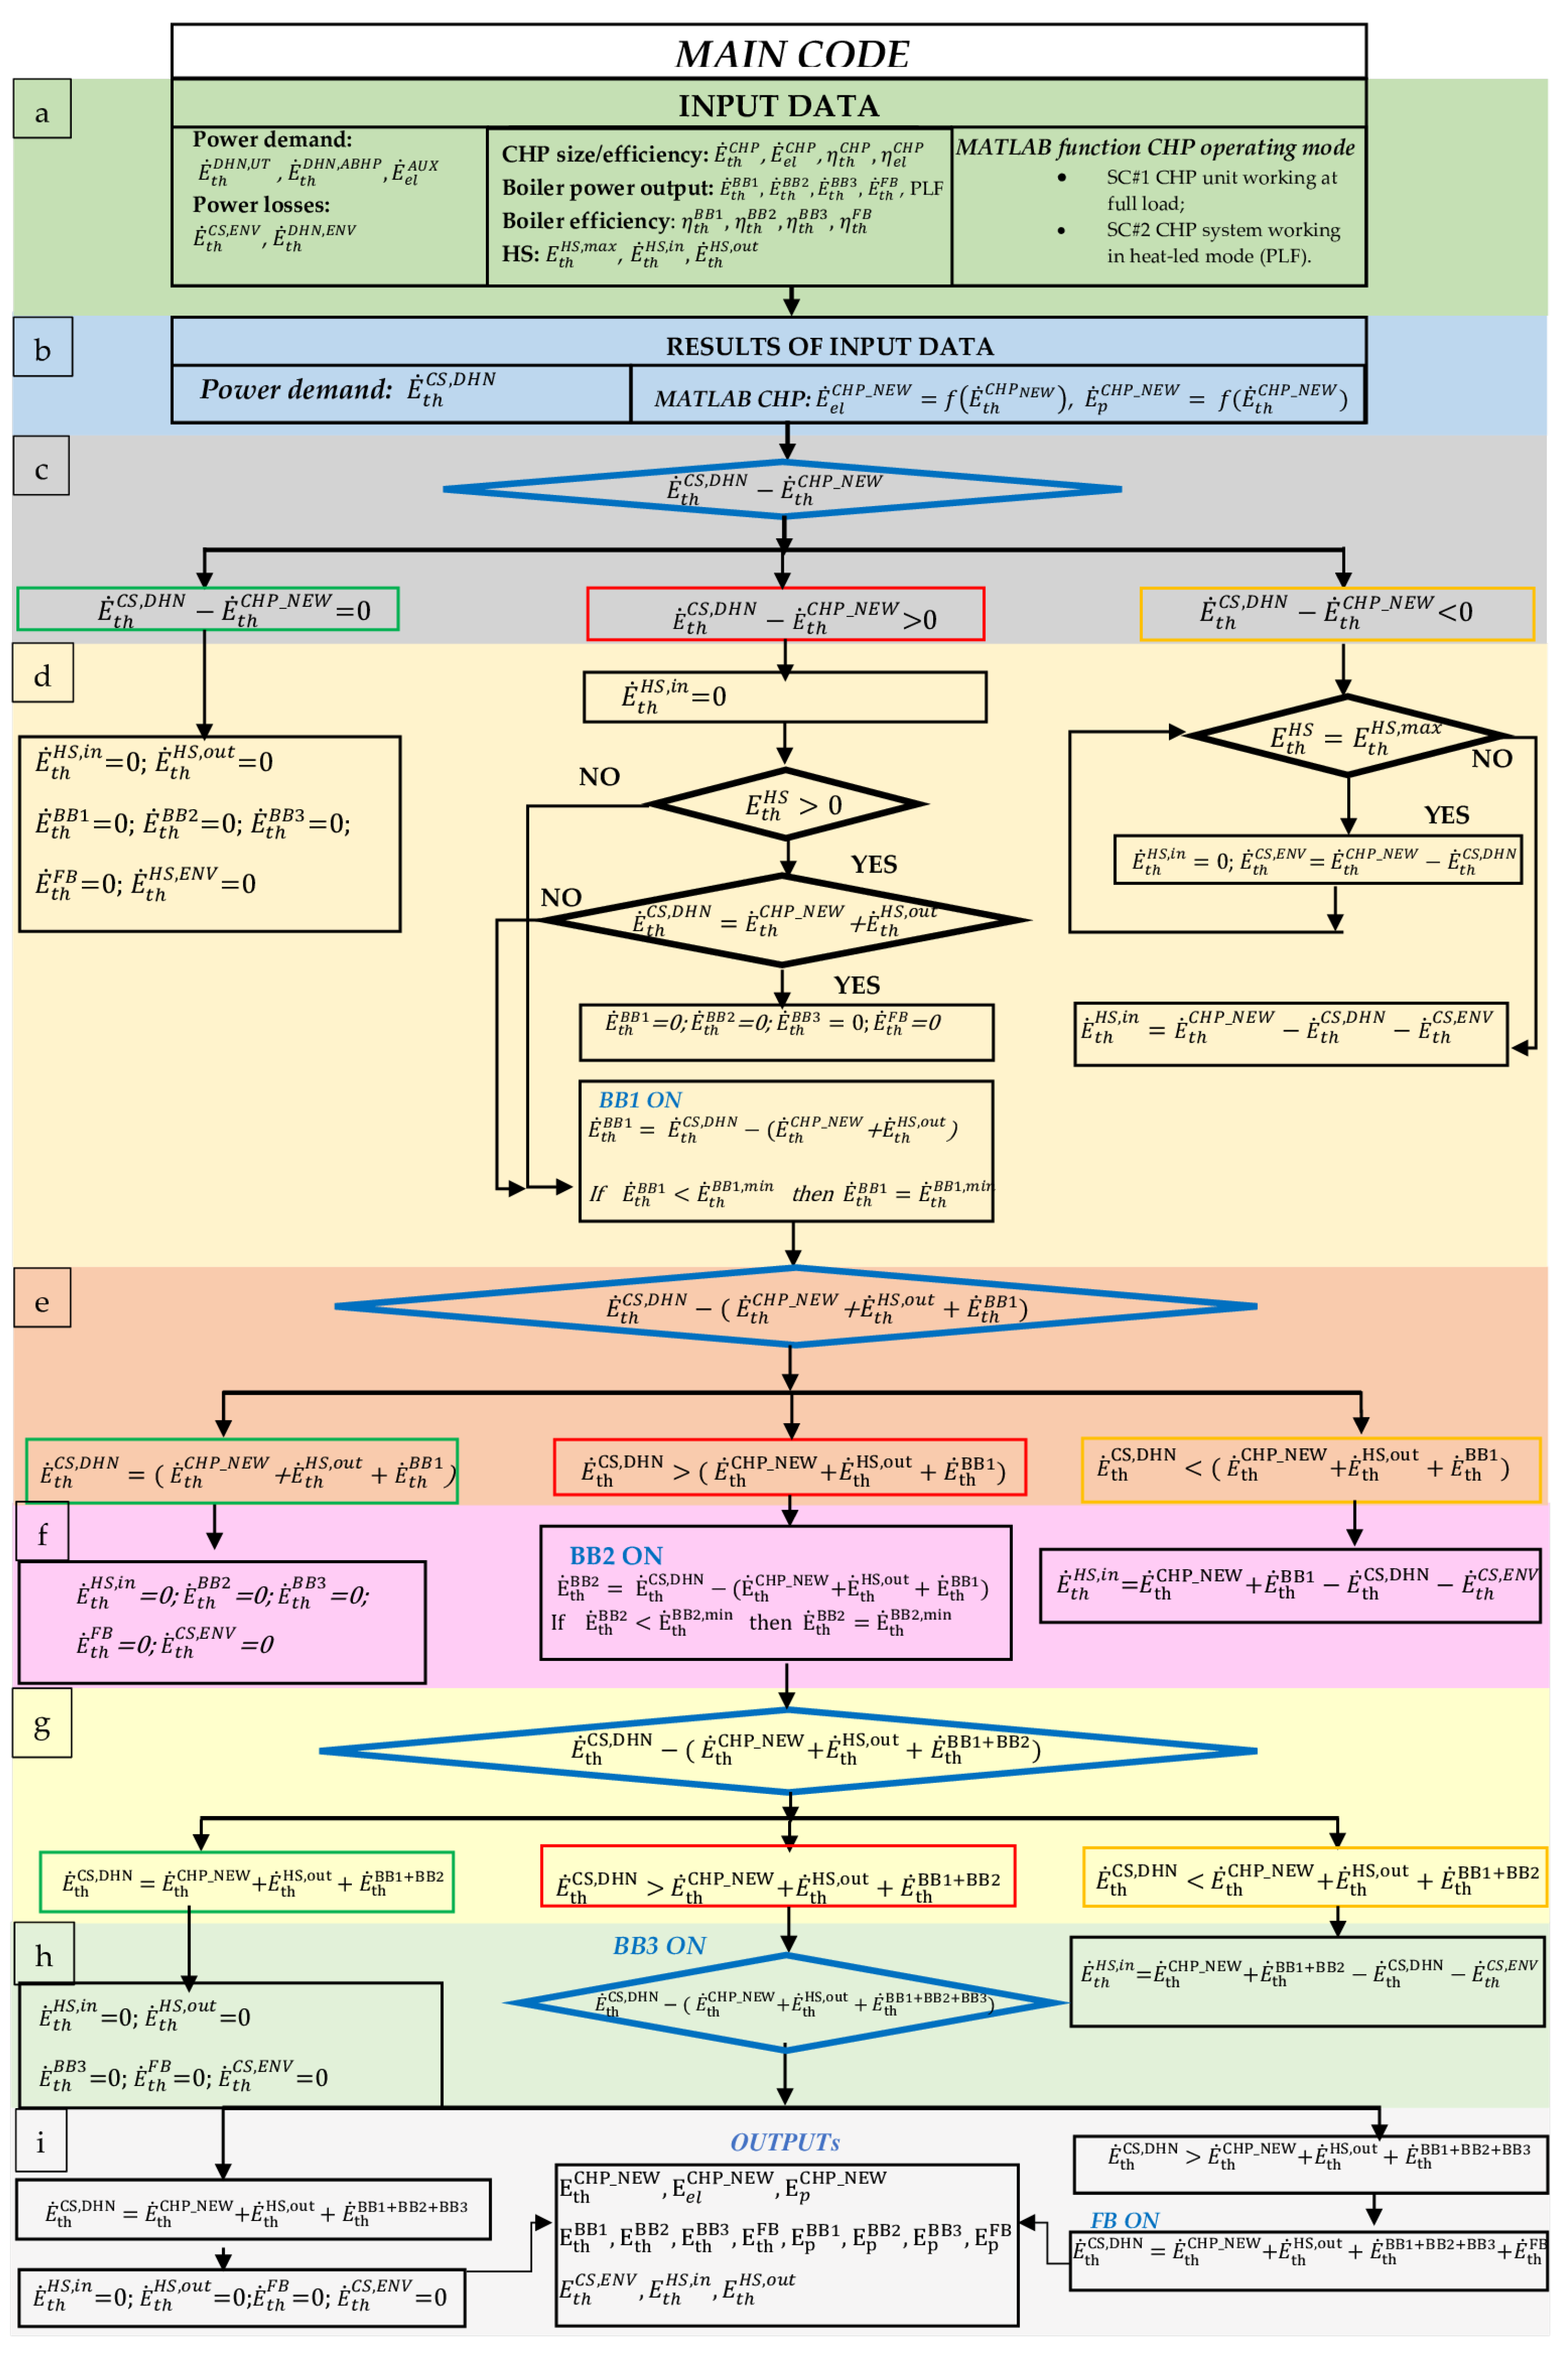
39] code that describes a constructed ad hoc model to simulate the energy behavior of a biomass-based energy community is proposed. The code consists of a control strategy able to predict the activation of different energy conversion devices, namely CHP_NEW, BB1, BB2, BB3, FB, and HS, in each operating scenario described in the previous subsection.
2.4.1. Input Data
The first step of code includes the definition and/or the elaboration of the input parameters, which are also listed in
Table 3. Otherwise, the input data processing is shown in the first rectangle labeled “a” of
Figure 5. The first input of the model is the thermal load of end-users for each hour of the year,
(
i = 1, …, 8760), obtained by elaborating real data, as reported in
Section 2.2.
At the same time, the matrix that takes into account thermal losses evaluated on a monthly basis (i) along the DHN (
) and (ii) next to the CS (
) is computed using historical data about the thermal losses in Tirano. This matrix was used in the second step of the input elaboration to increase the thermal demand
hour by hour by using a factor taking into account the average monthly losses due to the DHN. A further factor, equal to 1.05, is introduced to take into account losses that cannot be avoided inside the CS control volume and are mainly due to heat exchangers thermally connecting the CS devices to the DHN. In this way, the thermal load required by the energy conversion systems included in the CS,
, can be calculated. This parameter is one of the results of the input data reported in the second rectangle of
Figure 5, labeled “b”.
As regards the thermal power associated with each biomass and fuel boiler that supply the DHN,
, they are defined (
,
,
,
) according to real the dataset of the current configuration in Tirano (rectangle “a” of
Figure 5). The biomass boilers present also a minimum operating condition that depends on their construction (
,
,
) imposed by using a PLF range. The PLF, equal to 0.20, was chosen according to the existing systems. Moreover, following the limits imposed by the hot storage tanks of the real Tirano configuration, the HS maximum power input (
), as well as the output (
) are fixed to 4 MW. In addition, the condition in which the storage is fully charged defines a maximum stored energy (
) of 13.5 GWh. However, the HS constant losses equal to 5% are also considered to consider the thermal losses of the storage system.
The last elaboration of the data input analysis includes the definition of a mathematical model for the CHP starting from the manufacturer datasheet. The CHP model allows evaluating the electric and primary power of the CHP unit as a function of its thermal power,
. It consists of 2nd-order equations (Equation (
1) for electric power
and Equation (
2) for primary power
), obtained by using CHP data available from the manufacturer and scientific literature [
38]. The polynomial coefficients of the equations are reported in
Table 4, and these parameters represent the results of the input data also reported in the rectangle “
b” of
Figure 5.
2.4.2. Algorithm
Once the input parameters are elaborated, the energy management algorithm can be defined, whose additional parameters are reported in
Table 5.
The new CHP system can operate at full load in SC#1, assuming fixed thermal and electric efficiencies, or in heat-led mode in SC#2, considering thermal and electric efficiencies variable with the load (as defined in
Section 2.3). For both scenarios, the model returns, for each time step, the thermal (
) and electric (
) power outputs, as well as the power input to the new biomass boiler serving the CHP only (
). A dispatch algorithm defines the activation of each energy conversion device based on the following priority list: CHP_NEW, HS, BB1, BB2, BB3, and FB.
In the following points, each control face is reported:
The first face is drawn in the “c” box of
Figure 5. It defines the first control step (in blue rhombus) that verifies the difference between the thermal power demand due to CS devices (
) and the thermal output of cogenerator (
) in order to control if the CHP unit is able to meet the thermal DHN load as a unique activated energy conversion device. In this face, three conditions can occur, as reported from left to right in the flow chart. They are verified in each time-step equal to one hour:
- –
, meaning that the new CHP unit can meet the thermal demand and all other devices do not contribute during the current hour (reported in the green line rectangle in the figure). This condition is verified when the CHP system operates in SC#2 and the thermal load is lower than the nominal thermal CHP power;
- –
, meaning that the new CHP unit partially supplies the thermal demand and other energy conversion systems are necessary (reported in the red line rectangle in the “c” box). In this condition, both in SC#1 and in SC#2, the CHP system works at full load. A contribution to the DHN load is given by HSs (), not exceeding 4 MW, if thermal energy is available (). If the HSs combined with the CHP () unit can meet , the biomass and fossil boilers are not active. Otherwise, the following devices are activated based on the defined priority list (BB1, BB2, BB3, FB);
- –
, meaning that the CHP system meets the thermal demand (as reported in the orange rectangle in the “c” box). This condition can be verified in SC#1 if is lower than the nominal CHP power or in SC#2, when the latter works at the minimum PLF and the thermal demand is lower than the production. In this case, the thermal surplus could be stored in the HS (), not exceeding 4 MW, if it is not fully charged (). Eventually, the thermal energy that cannot be stored is dissipated ().
The development of these three conditions is graphed in the “d” box in
Figure 5.
The second control step is graphed in the “e” box of
Figure 5. The condition in the blue rhombus verifies the difference between the thermal power demand due to CS devices (
) and the sum of the thermal output of CHP, HS, and BB1 (
) in order to control if the additional activation of BB1 is able to meet the thermal DHN load. In this face, also three conditions can occur, as reported from left to right in the flow chart. They are verified in each time-step equal to one hour:
- –
, meaning that the new CHP unit, HS, and BB1 can meet the thermal demand and all other devices do not contribute during the current hour (reported in the green line rectangle in the figure);
- –
, meaning that the new CHP, HS, and BB1 unit partially supply the thermal demand and other energy conversion systems are necessary (BB2 is activated). In this condition, both in SC#1 and in SC#2, the CHP system works at full load. A contribution to the DHN load is given by HSs (), not exceeding 4 MW, if thermal energy is available (). Furthermore, BB1 works at full load;
- –
, meaning that the CHP, HS, and BB1 system meets the thermal demand (as reported in the orange line rectangle). In this case, the thermal surplus could be stored in the HS (), not exceeding 4 MW, if it is not fully charged ( GWh). Eventually, the thermal energy that cannot be stored is dissipated (). BB1 can work in partial load.
The development of these three conditions is graphed in the “f” box in
Figure 5.
The third control step is graphed in the “g” box of
Figure 5. The condition in the blue rhombus verifies the difference between the thermal power demand due to CS devices (
) and the sum of the thermal output of the CHP, HS, BB1, and BB2 (
) in order to control if the additional activation of BB2 is able to meet the thermal DHN load. In this face, also three conditions can occur, as reported from left to right in the flow chart:
- –
, meaning that the new CHP unit, HS, BB1, and BB2 can meet the thermal demand and the fossil boiler does not contribute during the current hour (reported in the green line rectangle in the figure);
- –
, meaning that the new CHP, HS, BB1, and BB2 unit partially supply the thermal demand and BB3 is necessary to supply the thermal demand. In this condition, the CHP, BB1, and BB2 work at full load, while BB3 in partial or full load;
- –
, meaning that the CHP, HS, BB1, and BB2 system meets the thermal demand (as reported in the orange line rectangle). In this case, the thermal surplus could be stored in the HS or dissipated.
The development of these three conditions is graphed in the “h” box in
Figure 5.
In addition, if the activation of BB1, BB2, and BB3 is not sufficient, the fossil boiler FB works in partial or full load.
This control algorithm works in an iterative way by evaluating the activation and the load of the boilers (BB1, BB2, BB3, FB), as well as the constraints on the minimum PLF for each device. The control of the HS was developed with a special section in the algorithm. The input and output powers due to the HS are computed by considering the thermal energy available from the CHP and BBs and not directly required by the DHN.
shows positive values during the hours in which the BB1, BB2, BB3, and CHP (SC#2) are forced to work at the minimum PLF or the CHP plant works at full load, in SC#1, leading to a surplus of thermal energy. The results of the algorithm and the activation of the FB are reported in the “i” box of the flow chart in
Figure 5 and also in
Table 5.
2.5. Economic Analysis of the Proposed Renewable Energy Community
Economic analysis is performed on the energy community with a particular focus on the renewable contribution due to the newly proposed energy conversion systems. The economic analysis affects only the new energy conversion systems shared by the REC members. This analysis was carried out considering economic indexes such as the Simple Payback Period (SPB) and Net Present Value (NPV). By means of the SPB, the number of years (
N, Equation (
3)) to balance the initial investment cost (IC) and the sum of the annual cash flows (
) can be evaluated:
where the IC of the new renewable-based plants is evaluated as reported in Equation (
4), while the cash flow referring to the k-th year (
) can be defined as expressed in Equation (
5):
where:
is the revenue from energy sold in the k-th year;
is the economic support provided for the electricity produced and shared by the members of the REC in the k-th year;
includes the maintenance, fuel, and management costs of the energy conversion systems shared by the REC members.
where:
is the revenue due to the thermal energy delivered by the CHP unit (
) to the DHN calculated as expressed in Equation (
6) by considering the thermal energy sales tariff (
):
(Equation (
7)) is the revenue obtained by the CHP (
), PV (
), and HYD (
) electricity fed into the grid, and its sale tariff is
;
(Equation (
8)) is the incentive due to the electricity produced by the CHP, PV, and HYD and shared among the members of the Tirano community and depends on the unitary incentive
;
Finally, the maintenance and operating costs for each year, mentioned in Equation (
3), are evaluated as in Equation (
9):
where:
, , and are the annual costs related to the management and maintenance of the CHP, PV, and HYD, respectively;
is the cost due to the biomass feeding the new biomass boiler activating the ORC-based CHP unit;
are the costs due to Administrative Staff (AS) for the management of the REC.
If annual cash flows are constant, the SPB (Equation (
10)) is defined as:
The other economic index, the NPV (Equation (
11)), is evaluated considering the difference between the present value of cash flows and investment cost:
where
a is the discount rate.
4. Conclusions
In the last few years, renewable energy communities have been growing and spreading under the push of the intense policy actions in the European and Italian context. Nevertheless, most scientific activities on this topic examine photovoltaic-based energy conversion systems shard within the community by paying attention only to the electricity energy carrier. Thus, in this study, a biomass-based renewable energy community was analyzed under the Italian regulatory framework. First of all, the investigation on the technical features of energy conversion systems serving the thermal, cooling, and electric users of Tirano Municipality (Northern Italy), as well as the collecting of historical data on the existing local district heating network were conducted. Currently, the district heating network is served by a biomass-activated combined heat and power system based on the organic Rankine cycle with a thermal power of 5.10 MW and two biomass boilers and one biomass boiler with a thermal power of 6 MW each. The electricity needs are balanced by the electric energy available from the combined heat and power system, 4.68 MW photovoltaic systems, and an 85 kW small hydroelectric plant. In this paper, different renewable energy community scenarios for Tirano Municipality were proposed, including the installation of a new, smaller biomass-based combined heat and power system based on the organic Rankine cycle with a thermal power of 2.10 MW working at full load or heat-led mode. Moreover, in the renewable energy community scenarios, different distributed photovoltaic penetration, namely 500 kW and 1000 kW, and a new 77 kW hydroelectric were considered. A model to simulate the energy behavior of the renewable energy community’s scenarios was developed, and an economic analysis was performed by considering the sale tariff for the shared electricity within the community and a variable tariff for the thermal energy delivered to the district heating network. The results show that the increase of photovoltaic peak power in the renewable community scenarios allow the annual renewable electricity production to grow by 10.1% with respect to the case without the community. Moreover, by considering that the thermal energy is sold at EUR 49.2/MWh and the cogenerator works at full power load, the simple payback and net present value amount to 5 years and EUR 13.3 M, respectively, with a penetration of photovoltaic of 1000 kW. This is the best renewable energy configuration from an economic point of view. These findings demonstrate the economic feasibility of wood-biomass-based renewable energy communities under the current Italian regulatory framework, and they can contribute to the development of initiatives aimed at promoting all renewable technologies, also with a higher rate of national component than photovoltaic, to enhance the local resources of each territory.


 ,
, 


