1. Introduction
In the third quarter of 2021, due to tight supply and unabated demand, the price of thermal coal rose sharply. After the National Development and Reform Commission implemented intervention measures in late October, the price of thermal coal declined and operated at a low level. Coal accounts for the highest proportion of primary energy use in China. The ratio of coal consumption to total energy consumption in 2021 was 56%. From 1994 to 2021, coal consumption accounted for 75% at the highest. Coal can be divided into two categories according to its use: thermal coal and coke. The iron and steel industries and the non-ferrous metal-smelting industry mainly use coke, since coke is effective and efficient in metal smelting. The main demand side of thermal coal is power plants. The fluctuation of the thermal coal price will affect the economic benefits of downstream industries such as power plants and steel, etc. Therefore, the stability of thermal coal prices is crucial to the stability of the economic situation. The national planning and intervention measures for the energy market will have an impact on the price of thermal coal. Under the control of demand and supply and other factors, we evaluated the impact of government intervention, coal inventory and other energy prices on the thermal coal market. How much impact will this intervention have on the thermal coal market? How long will it last? These issues will be discussed in this article.
Many previous studies [
1,
2] did not take into account the variable of policy intervention, or did not quantify it, but only carried out the descriptive analysis. In recent years, the government has withdrawn plans to use clean energy and reduce carbon emissions, which is bound to have an impact on the price of thermal coal [
3,
4]. Therefore, it is necessary to consider the impact of policy uncertainty on the thermal coal price. In the process of analyzing the factors affecting thermal coal, some researchers [
5,
6,
7] did not take into account the impact of other energy prices and inventory on the domestic thermal coal price. Some papers [
8] applied multivariate regression to investigate the influence of variables on energy price, but the price time series is mostly unstable. Regression after the differential processing of data will lose economic significance. Especially, many previous studies performed a price analysis of crude oil, copper and natural gas and other energy products [
9,
10,
11,
12,
13]. There is a lack of research on China’s thermal coal market. The specific objective of this study is to analyze how these variables including policy uncertainty affect the thermal coal price. The data for this study were collected using Wind. PolicyUncertainty.com provides economic policy uncertainty. By employing the cointegration test and forecast-error variance decomposition, we attempt to illuminate the impact degree of demand, supply, stock, import, oil price, natural gas price, power generation and economic policy uncertainty on the thermal coal price.
It is hoped that this research will contribute to a deeper understanding of the link between policy uncertainty, stock and other energy prices, and it will help to speculate on the future thermal coal price trend. Due to practical constraints, this paper cannot provide a comprehensive state of variance decomposition of all nine variables, and therefore omitted some variables.
This work has three main parts. Firstly, the previous literature is discussed and summarized. Secondly, the materials, models and methods we applied are introduced. Finally, the results of the statistical analysis are presented and discussed. This study is organized as follows:
Section 2 provides an overview of the literature on thermal coal price analysis.
Section 3 introduces the relationship between eight factors and the thermal coal price, and studies how these factors affect the thermal coal price. In addition, we state the materials and methods we applied.
Section 4 presents the results of the statistical analysis.
Section 5 gives a discussion of the results.
Section 6 concludes this study.
3. Materials and Methods
The domestic thermal coal price is mainly influenced by both the market and policy. National policies focus on the coal supply and import, which will have a certain impact on domestic thermal coal prices in the short term. However, in the long run, the capacity and power plant demand are factors of the thermal coal price. Other energy prices, inventory, economic growth and import affect the coal price through supply and demand, which have a direct impact on the price of thermal coal. In a word, the interfering factors of the thermal coal price could be divided into three aspects: supply and demand, other energy goods, and policy. These could be further divided into eight elements: output, consumption, import quantity, stock, imported crude oil price, domestic natural gas price, economic policy uncertainty (EPU) and generating capacity. The data are from March 2009 to September 2021, including 154 monthly data. The data sources of the thermal coal price, output, consumption, coal mine inventory and imported crude oil price are from Wind. The import is from the General Administration of Customs. The natural gas price and power generation are from the National Bureau of Statistics. PolicyUncertainty.com provides a monthly newspaper-based economic policy uncertainty (EPU) index. (
https://policyuncertainty.com/, accessed on 17 January 2022).
3.1. Thermal Coal Price
There are three types of coal price according to different delivery locations: pit mouth price, car board price and closing price. The pit mouth price refers to the price directly traded at the pit mouth by the collieries and demanders. The car board price refers to the cost of loading the coal onto the train plus the pit price. The closing price refers to the pit price plus the land transportation cost and shipping cost. The pit mouth price is largely affected by the region, and the vehicle price is also different because of the freight. In order to accurately reflect the market price of thermal coal, research institutions often adopt the closing price. Generally, the price of coal is determined by supply and demand. With the improvement of railway coal-transportation capacity, the output of coal mines and the demand of a certain region can no longer reflect the real relationship between coal supply and demand. The demand for coal in coastal areas is large. When the thermal coal price of coastal areas significantly fluctuates, coal resources will flow across regions. Most of Shanxi coal is transported to Qinhuangdao port by the Datong-Qinhuangdao Railway and then transferred to the whole country. In 2020, the coal shipping volume of the key ports was 753 million tons, of which the coal-transportation volume of seven ports in the North accounted for 96.14%. The shipping volume of the Qinhuangdao port accounts for 24.06% of the seven ports in the North. So, it is the core hub port of “north coal South transportation” in China. The Qinhuangdao power coal price reflects the supply and demand of eastern China and the southeast coastal areas to a certain extent. It is the wind vane of the national thermal coal price, which is released earlier and longer than other coal prices. Therefore, we choose the Qinhuangdao Q5500 thermal coal closing price as the explained variable.
3.2. Supply and Demand
From the perspective of demand, thermal coal is mainly supplied to the electric industry, heating industry and building materials industry. The thermal coal consumption of power plants was 2.25 billion tons in 2021, accounting for 62% of the total. The heating industry consumed 0.32 billion tons, accounting for 9% of the total. The building materials industry consumed 0.31 billion tons, accounting for 9% of the total. The proportion of the three industries of thermal coal consumption reached 79%. Moreover, with the dual energy restrictions on high-polluting industries, thermal coal demand in the three industries may fall in the shift to cleaner energy.
The thermal coal price was high and volatile from 2010 to 2012. On the one hand, the drought in the south reduced hydropower, thereby raising demand for thermal power, and the frequent occurrence of accidents in mines resulted in the output being unable to keep up in a short time. On the other hand, foreign coal prices were lower than domestic, and manufactures had cut down domestic demand. Apart from that, due to the European debt crisis in 2012, the worldwide economic situation was in a depression, resulting in investment and exports being decreased, which further led to a reduction in thermal coal. In 2016, the persistent high temperature of the Nino phenomenon led to a significant increase in electricity demand, resulting in a surge in the thermal coal price, which increased by 97%. At present, the price of thermal coal has reached a new high, also due to the surge in demand.
From the perspective of supply, more than 90% of China’s coal consumption comes from domestic production. From 2012 to 2015, coal prices fell all the way due to serious overcapacity and excessive inventory. In 2019, the advanced production capacity of coal mines was released at an accelerated rate. At the same time, the only north–south coal-transportation line in China, the Haolebaoji-Ji’an Railway, was opened, adding coal-transportation capacity, and coal could be transported to the downstream in time. Even in the peak seasons of coal consumption, there is no shortage of coal in the downstream and it always maintains a high inventory state, which curbs the rise in coal prices.
3.3. Inventory
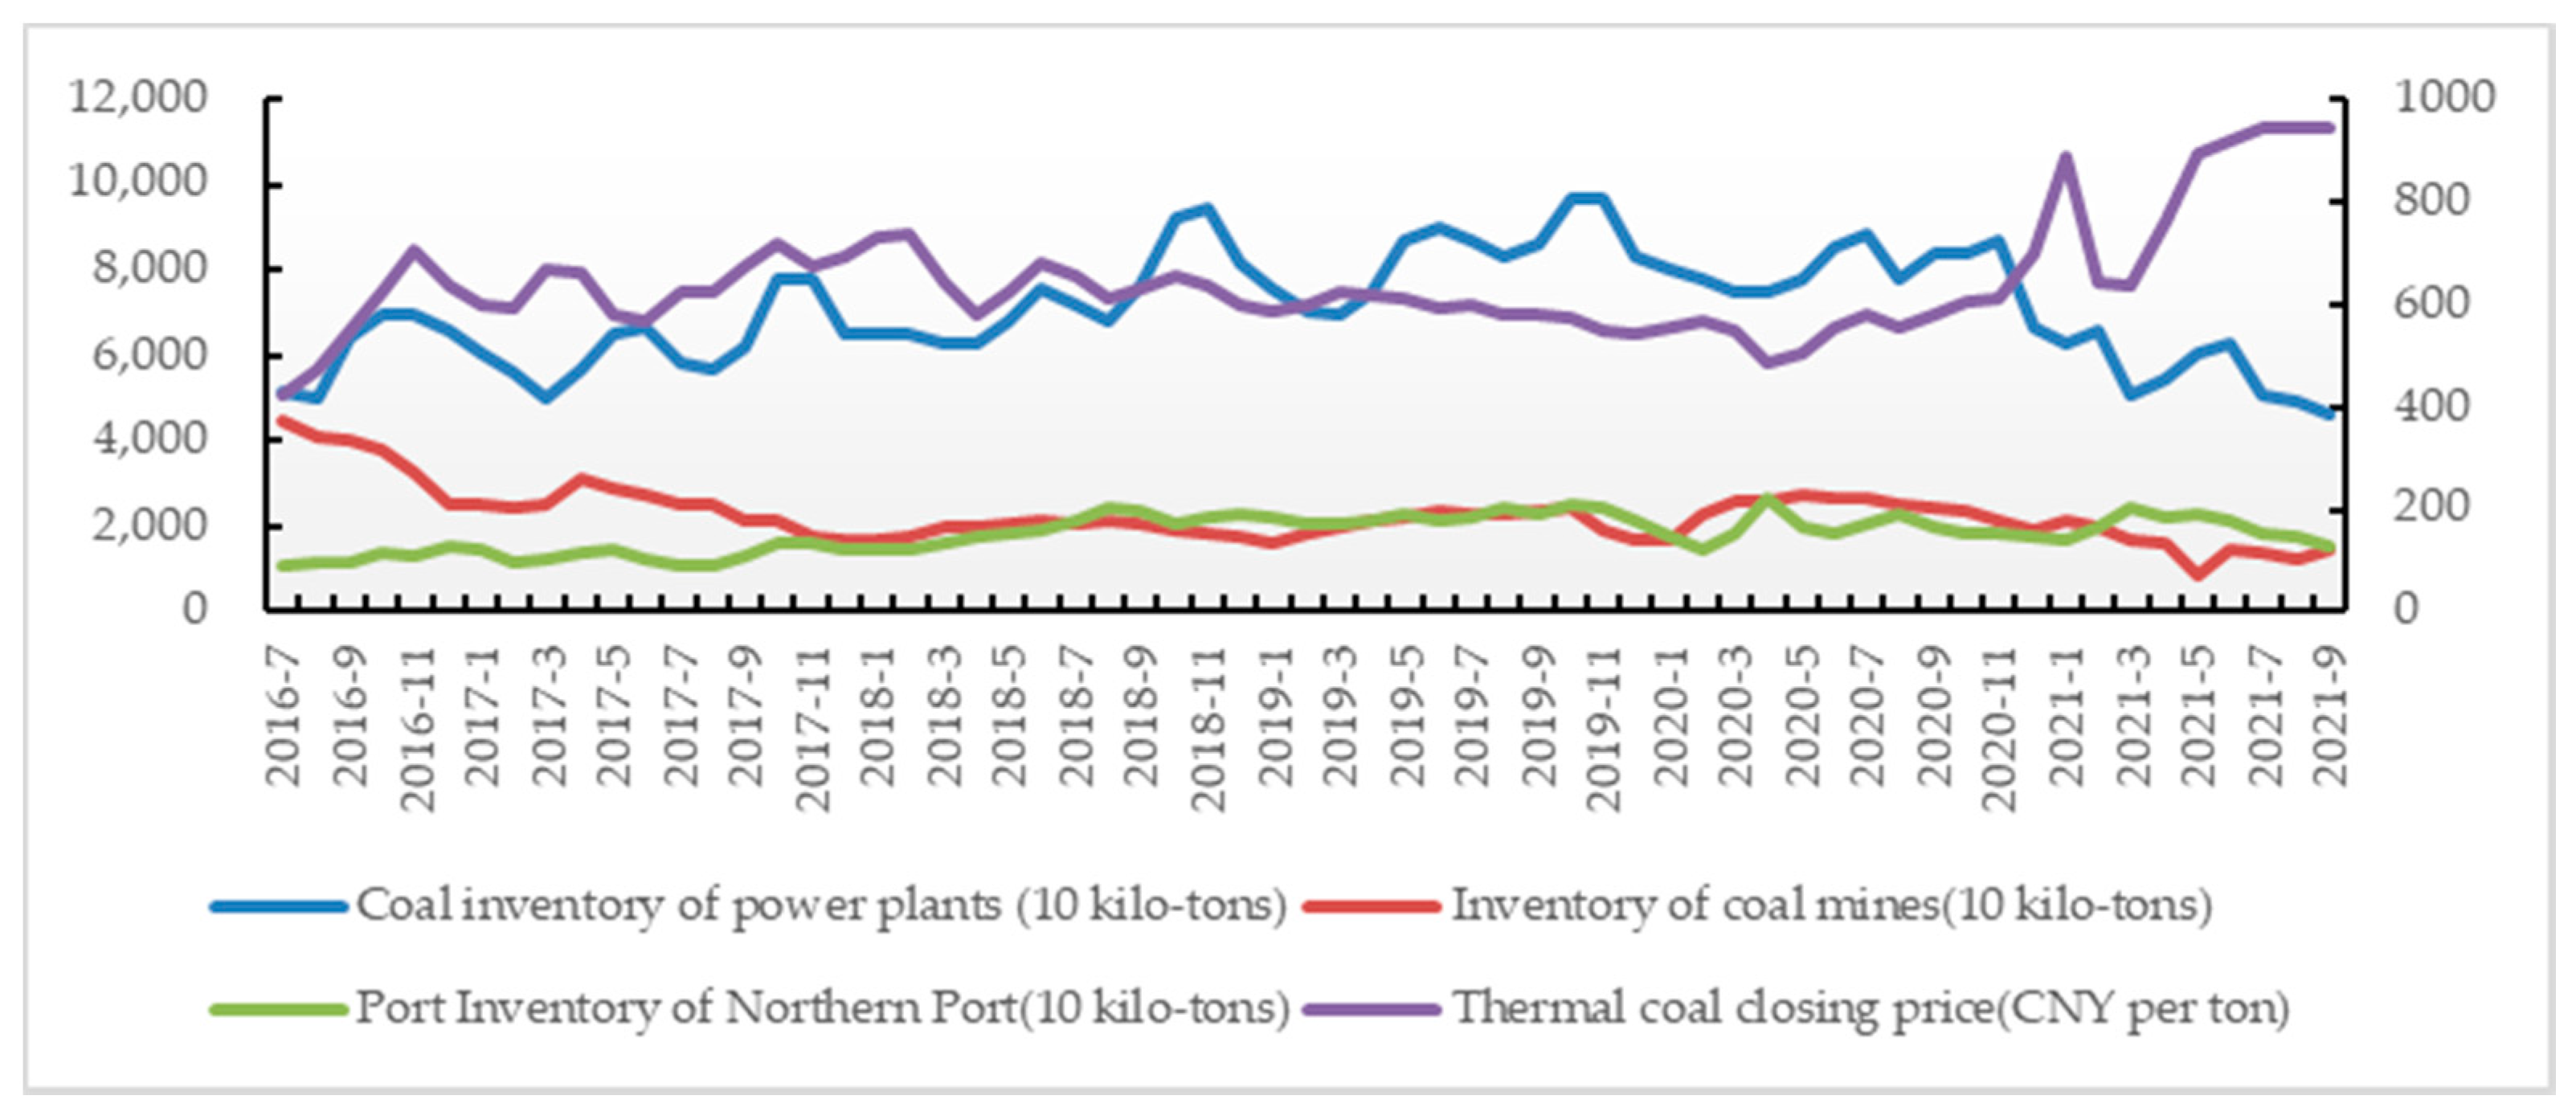
How much thermal coal is supplied each year depends not only on the capacity but also on inventories. The inventory can be divided into three categories according to the transportation stage: mine inventory, port inventory, and power plant inventory. Storing the coal after it is dug out will reduce the quality of the coal, so the inventory is generally not too much. So, the inventory reflects the fluctuation of the thermal coal price.
Figure 1 shows the trend of mine inventory, port inventory, power plant inventory and the Qinhuangdao thermal coal price from July 2016 to September 2021. Observing the historical data, the inventory and thermal coal price are inversely changing. To determine which metric to use for further analysis, we performed a correlation analysis on the four metrics, as presented in the
Table 1. The correlation coefficient between power plant inventory and the thermal coal price is −0.309 and significant. The correlation coefficient between mine inventory and the thermal coal price is −0.58 and significant. The main coal-transportation ports are Qinhuangdao Port, Huanghua Port, Jing Tang Port, etc., so the port inventory index is based on the northern port inventory. The correlation coefficient between northern port inventory and the thermal coal price is −0.07 but it fails the significance test. We found that mine stock index is more representative, because it is a result of the corresponding treatment. Therefore, we selected mine inventory as a variable to examine the impact on the thermal coal price.
3.4. Import and Export
The peak period of thermal coal export was from 1997 to 2004, and the highest point was 74.48 million tons in 2004. After that, the amount of thermal coal export began to gradually shrink. In 2021, 0.98 billion tons were exported, which was only 0.01 percent of the output. The dominant exporting countries are South Korea and Japan, which account for 98% of the total export. In a word, the export has little effect on the thermal coal price, so we did not select export as an influencing factor.
From the perspective of import, the price of foreign thermal coal is cheaper than domestic because of low cost and high production capacity. According to the data of the General Administration of Customs, over 60% of coal is imported from Australia and Indonesia. In 2021, imported coal totaled 74.51 million tons, accounting for 2.3% of the total consumption. Import was reduced by 0.15% compared to last year, owing to restrictions on Australia’s coal import, and the amount of import vastly augmented since 2008, reaching a peak in 2013. The domestic thermal coal price halved during this time, suffering a setback. When the domestic thermal coal price showed signs of rising in May 2016, the number of imports began to increase and the maximum amplitude was 40%. During the Spring Festival in 2020, the raging epidemic caused a delay in the resumption of work and production in coal mines, pushing up the domestic thermal coal price. Consequently, enterprises enhanced the quantity of import, and the largest range of monthly increases reached 246.86%. Briefly, imports and the domestic thermal coal price interact.
3.5. The Other Energy Prices
In 2020, China’s energy consumption was 4.98 billion tons of standard coal, of which coal, oil and natural gas accounted for 84.1%. It can be seen that coal, oil and natural gas are the primarily consumed energies in China and the government encourages the utilization of clean energy [
39,
40,
41], of which microgrid technology [
42] is the key technology to applying clean energy. Although the proportion of coal in the total energy consumption dropped from 69.2% in 2020 to 56.8%, the energy structure is still dominated by coal. The proportion of oil fluctuated from 18% to 22%. The proportion of natural gas moderately increased from 4% in 2020 to 8.4%.
Natural gas is mainly supplied to industries such as the mining industry and daily consumption. Natural gas has a certain substitution for coal, so a raised demand for natural gas would reduce the demand for coal. Because burning coal causes serious pollution, authorities have carried out dual energy control to achieve green and sustainable development. As clean energy, the carbon emission of natural gas is far lower than thermal coal. Natural gas will continue to replace coal in various aspects in the future [
43]. However, the power generation of thermal coal is higher than natural gas, and other power-generation methods such as photovoltaic power generation are not mature, which is why the consumption of thermal coal will reduce but not completely disappear. According to the Wind database, China’s natural gas self-sufficiency rate is as high as 56.29%. Therefore, this paper mainly examines the impact of the domestic natural gas price on the thermal coal price.
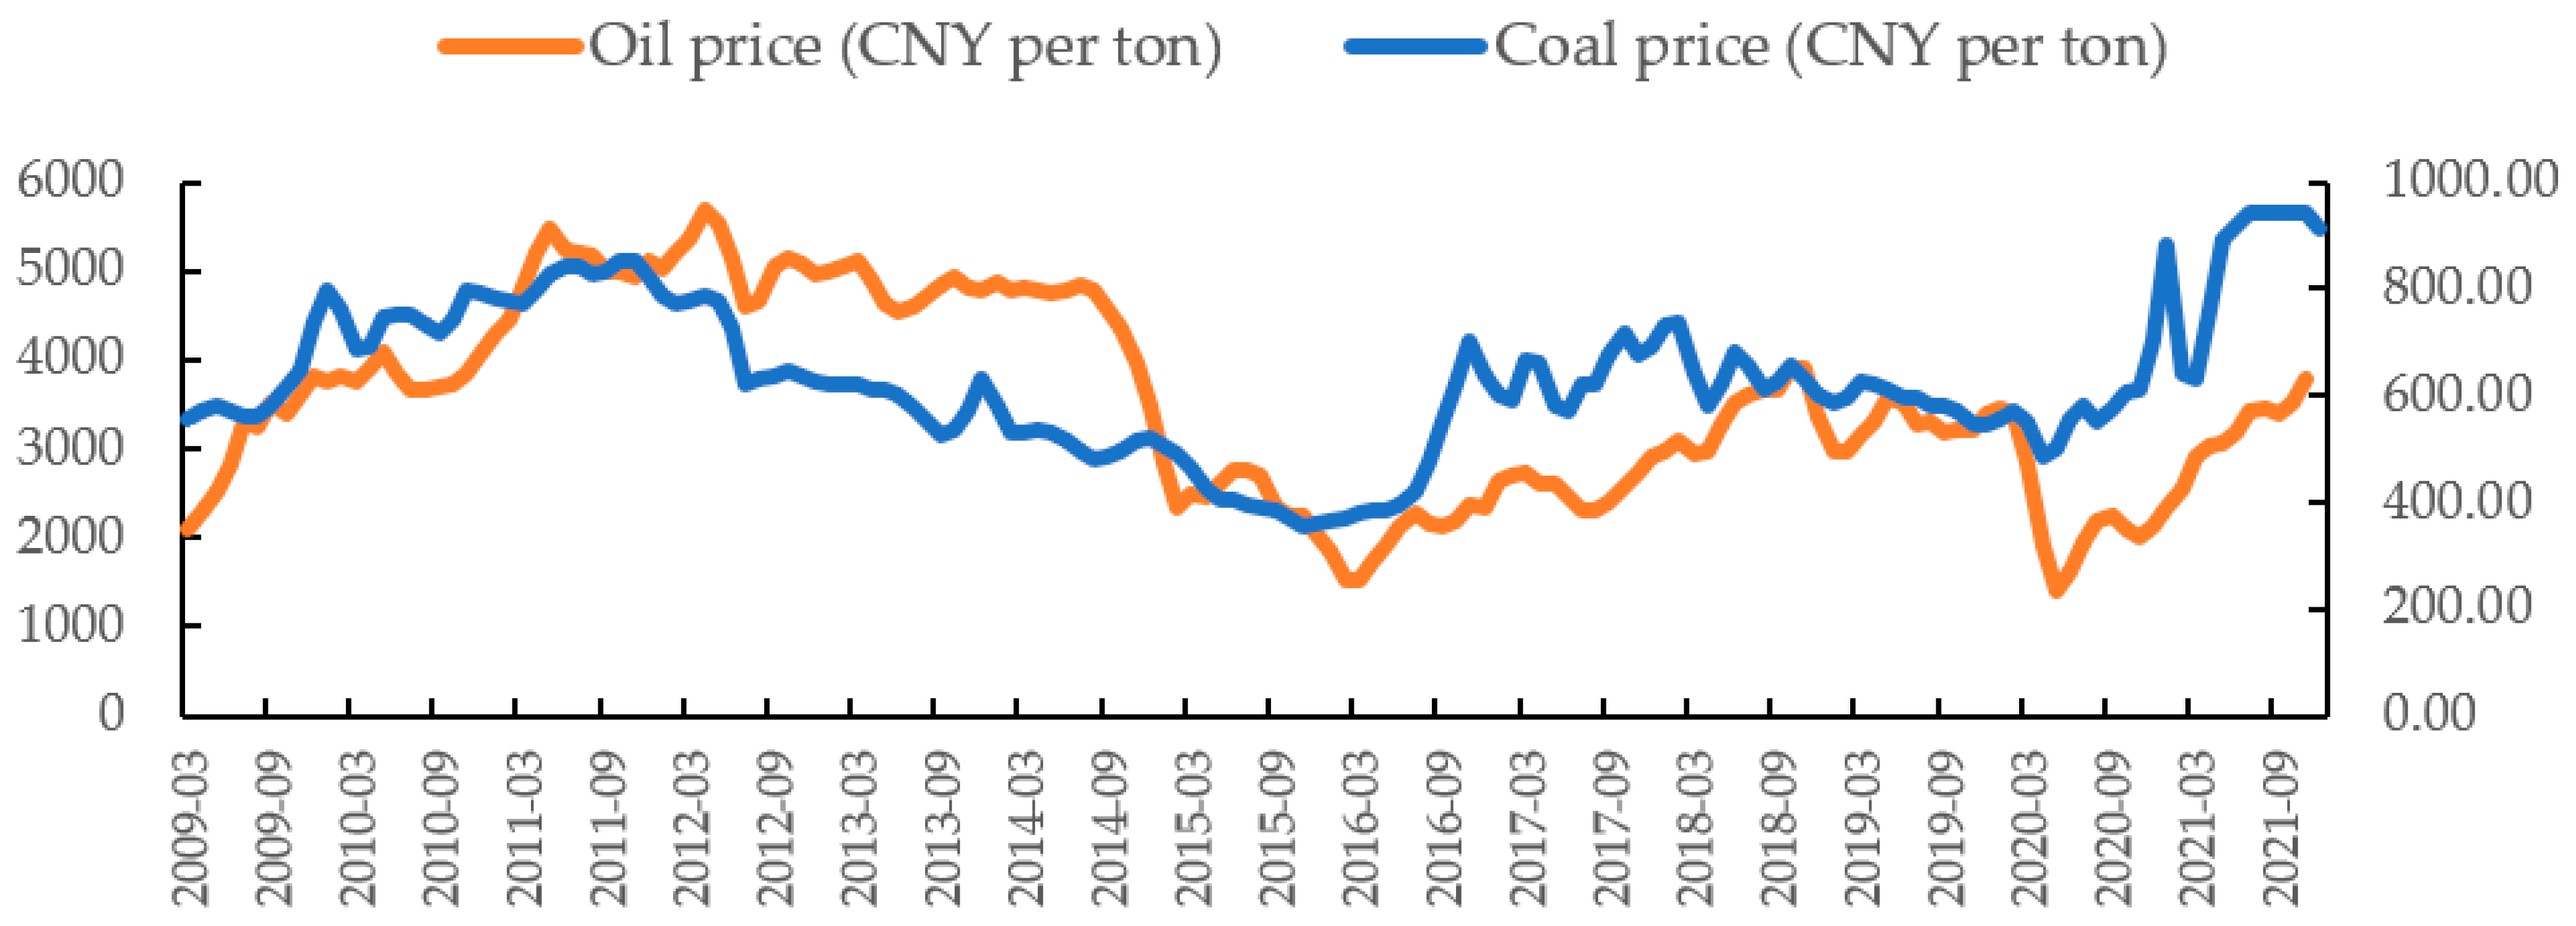
Oil is mainly supplied to the extraction industry, manufacturing industry, processing industry, and chemical product-manufacturing industry. The use of crude as an alternative to coal is weak. However, as an important energy source in the world, the oil will have an impact on the economy of various countries and other energy prices [
44,
45,
46,
47]. As an indispensable raw material for industry, when the price of oil rises, increasing the production cost, enterprises will raise the price of the product. Inflation from a higher product price acts on the equipment required for coal mining, which increases the cost and further pushes up the thermal coal price. Observing previous data, we can see that there is a strong correlation between crude and thermal coal in
Figure 2. Affected by the European subprime mortgage crisis in 2009, both oil and thermal coal prices were at low levels. During the economic recovery, the oil price rebounded first, followed by thermal coal. The Oil price fell off a cliff in the second half of 2014, and the thermal coal price also began to fall by 2% per month. In 2016, the coal price and oil price were at a trough. After a slight increase in oil price, the thermal coal price also reversed the decline and rose sharply. The volatility trends of crude and thermal coal were almost same in 2020, yet oil seems to react ahead of thermal coal, suggesting the predictive role of oil.
3.6. Economic Policy Uncertainty
In the long run, coal still occupies a dominant position in China’s energy structure concerning the national economy and people’s livelihoods. So, it is greatly regulated by the government. In the early days of the founding of the People’s Republic of China, China was a planned economy and the energy price was uniformly set by the state. Although the unified pricing lessened the cost of downstream enterprises, the exceedingly low price has hindered collieries’ expansion and suppressed enthusiasm. The state began to loosen the management of the coal price, allowing coal enterprises to increase output after ensuring that the coal required by the downstream industry could be sold at a price higher than planned, in order to boost the profits. Especially after the announcement of the 14th National Congress of the Communist Party of China in 1992 that China’s economic system changed from a planned economy to a market economy, the regulation of the coal price by the state was moderately weakened and the coal price became fully market-oriented in 2013–2015. In 2016, the state issued the “Opinions of the State Council on Dissolving Overcapacity in the Coal Industry and Realizing Development from Difficulties”, which proposed the goal of supply-side structural reform of the coal industry. The excessive capacity to cut production led to a continuous rise in the coal price and serious losses in the power industry. The National Development and Reform Commission (NDRC) decided to moderately expand output and sign long-term coal contracts to slow down volatility. Henceforth, the coal industry began to implement a new dual-track price mechanism, that is, the long-term agreement contract price and the market price are in parallel.
The documents issued by the government and relevant policies will have an impact on the market price of thermal coal. As shown in
Figure 3, the thermal coal price rose steadily in December 2009, owing to the increase in demand and the reduction in transportation because of the maintenance of the Datong-Qinhuangdao Railway. The NDRC issued the “Guidance on Improving the Connection between Coal Production and Transportation”, requiring the signing of long-term contracts for power coal to be increased. The price of thermal coal began to fall after a slight rise. From 2010 to 2011, coal prices fluctuated because of the reduction in hydropower, foreign political turmoil and other factors. Before the peak of coal consumption in the winter of 2011, the coal storage of power enterprises was carried out as anticipated. Yet, the production shortage resulted in power coal showing an upward trend due to the frequent occurrence of mining accidents in collieries, and they were closed for rectification. In order to alleviate the lack of power supply in central and southern China, the NDRC issued the “Announcement on Implementing Temporary Price Intervention and Strengthening Price Regulation of Power Coal” in November to set a ceiling on the price of power coal, requiring that the increasing range of the contract power coal price should not exceed 5% on the basis of 2010. After that, the gap between the market price and the contract price of power coal narrowed significantly. In 2012, the State Council issued the “Guiding Opinions on Deepening the Reform of Thermal Coal Marketization”, canceling key power coal contracts. Then, the price of thermal coal was completely determined by the market. During the global economic downturn from 2012 to 2013, domestic high-energy-consuming enterprises reduced their demand for coal. At the same time, imported coal continued to pour in as foreign coal prices were lower. The domestic thermal coal price continued to decline, so local governments introduced measures to ensure the operation of coal enterprises. For example, the local government came forward to promote seven coal enterprises in the province to conclude long-term agreements with five central power plants and some local power plants, and restrict the entry of coal from other provinces. With the outbreak of COVID-19 in 2020, the demand for electricity and heating surged, causing a rise in the price of thermal coal. In February, the National Energy Administration issued the “Notice on Ensuring Coal Supply During the Epidemic Prevention” and the “Notice on Further Accelerating the Resumption of Work and Production of Collieries” to stabilize the supply and price. In the winter of 2021, the demand for coal soared, leading to the price rising rapidly. So as to avoid driving up the price, the NDRC issued the “Notice on the Work Related to the Full Coverage of Railway Transport Capacity Guarantee under Long-Term Coal contracts of Power Plant and Heating Enterprises”, which required enhancing the performance rate of long-term contracts. Then, the market price dropped somewhat, but the dominant factors affecting coal price over a long period are supply and demand.
Economic policy uncertainty (EPU) was first proposed by Baker et al. [
48], which measures the impact of political events on the economy by counting the number of newspaper articles that contain specific terms. Using this newspaper-based method, the EPUs of different countries are constructed, including the EU, Russia and so on.
There are three versions of the China EPU, but all of them use the text-based method to quantify economic uncertainty. The EPU produced by BBD, which begins in 1995, relied on the South China Morning Post (SCMP). The EPU constructed by Huang et al. [
49], which is from 2000, was based on 10 Chinese newspapers. The EPU established by Davis et al. [
50], which begins in 1945, relied on Renmin Daily and Guangming Daily. EPU_BBD uses artificial criteria to calculate the number of articles containing specific words, which tends to reflect foreign interests and concerns. EPU_ HL has some missing values due to the difference between the electronic version and the paper version of the selected articles, resulting in political events not being reflected in their indicators in time. EPU_ DLS uses language processing to formulate a standard to calculate the number of articles, which more reflects that domestic policy dictates uncertainty, avoids the lack of articles through carefully checking the articles in the printed version of two mainland China newspapers and filling in the missing values using various sources. Hence, we adopted EPU_DLS to do the next analysis.
3.7. Power Generation
The price of thermal coal is directly proportional to the degree of economic prosperity, which is greatly affected by China’s macroeconomy. The financial crisis in the United States in 2008 led to a poor economic environment in China, and thermal coal price slumped. In 2009, the Chinese government invested 4 trillion yuan in infrastructure construction, resulting in the price recovery of thermal coal. In October 2010, the European debt crisis caused a decrease in domestic investment and exports, and the price of thermal coal did not pick up for 5 years. However, the imbalance between supply and demand in the market in 2016 and 2020 resulted in a significant rise in the price of thermal coal. Previous studies selected the purchasing manager index and the industrial added value to represent the impact of macroeconomic operation on coal price. The above indicators directly reflect the prosperity of the manufacturing industry, and industry in general, and these industries mainly consume coking coal. However, most thermal coal is used for power plants, so we selected power generation as the indicator to measure the impact of China’s macroeconomy on the thermal coal price.
3.8. Statistical Analysis
First, we used the Augmented Dickey–Fuller (ADF) unit root test and the Phillips–Perron (PP) unit root test to examine the stationarity of these variables. If there is a unit root in the time series, then it is a nonstationary series. It will invalidate the traditional t-test and cause pseudo regression. The principle of the ADF unit root test is to assume that the time series is generated by a p-order autoregressive process AR(p), and then to establish an estimated model for the ADF unit root test. The null hypothesis is that there is a unit root in the time series. However, the principle of the PP unit root test is to adopt an ordinary least-square (OLS) regression to obtain parameter estimators and error terms. Then, calculate , j = 1, 2… which is the j-th autocovariance of and is the long-run variance of , where . The statistics under the null hypothesis are , where is the OLS estimator of the variance of the error term; , and are the OLS estimators of the parameters and their standard deviations. The PP test statistics have the same asymptotic distribution as the ADF test.
Through the results of the ADF test and the PP test, we found that there may be a covariate relationship between these variables. A covariate relationship refers to the existence of an equilibrium between multiple unit root variables due to a certain economic force. Engel and Granger (1987) proposed the EG–ADF test to examine whether there is a covariate relationship between variables. The principle of this method is to use the ordinary linear regression model (OLS) to estimate the cointegration coefficient, and then carry out the ADF test on the residual sequence to determine whether it is stable. If the residual is stable, then the null assumption that there is a cointegration relationship between variables is accepted. However, the defect of the EG–ADF test is that it cannot deal with the situation that there are multiple cointegration relationships at the same time. The most commonly used method to examine whether there is a long-term covariate relationship between variables is the maximum likelihood estimate (MLE) proposed by Johansen (1998). The basic idea of the MLE is that if multiple time series variables are nonstationary but some kind of linear combination of them exhibits stationarity, then there is a covariance relationship between these variables. The basic idea of this method is to trace the vectors and determine that there are several cointegration relationships. The null assumption is that the rank is zero, that is, there is no cointegration relationship. Conversely, it continues to test whether there are multiple cointegration relationships;
: rank (
) = 1 and
: rank (
) > 1. The trace test will not stop until the null hypothesis is accepted and the cointegration rank is determined. After determining the cointegration rank, the conditional MLS was used to estimate the cointegration coefficient. In this paper, we adopted the Johansen cointegration test to estimate the long-term equilibrium relationship between the thermal coal price and the eight explained indicators. The conceptual model of our statistical analysis was established as follows:
where
is the constant,
to
are the coefficients of these variables, and
is the residual.
Then, in order to ascertain the causal relationship between the eight independent variables and the thermal coal price, we adopted the Granger causality test to estimate. The Granger causality model is
where
is the constant,
,
,
and
are the coefficients of these variables, and
is the residual. The null assumption is that
(or
) is not a Granger cause for
(or
). Granger causality shows the interaction between variables. We conducted the Granger causality test on the price of thermal coal and each factor separately.
Finally, we performed forecast-error variance decomposition, through which we could observe the proportion of changes caused by the impact of “itself” and the impact of other variables. All of the analysis results are shown in
Section 4.
4. Results
Table 2 shows the results of the ADF and PP tests. If the time series is unstable, then the time series is made a first-order difference and again checked for serial stationarity until the event series plateaus.
Table 2 shows that the ADF values of the thermal coal price, stock, oil price, gas price and power are −1.428, −2.126, −1.571, −1.798 and −1.196, respectively, which are greater than the critical values at the 5% level, accepting the null assumption and indicating that the thermal coal price, stock, other energy prices and power were nonstationary sequences during the research period. After the first-order difference, the ADF values of the five variable time series are less than the critical values at 5%, rejecting the null hypothesis and indicating that the five variable series are first-order single-integer time series. The ADF values of demand, output, import and EPU are −5.403, −5.433, −5.108 and −4.165, respectively, which are less than the critical values at the 5% level, rejecting the null hypothesis and indicating that the four variable series are zero-order single-integer time series. They may have a cointegration relationship. The PP test statistics have the same asymptotic distribution as the ADF test, so the critical value is the same. The results of the PP test are consistent with those of the ADF test.
In order to further confirm the causal relationship between them, the Granger causality test was separately conducted for the thermal coal price and the eight variables. The results are shown in
Table 3. When the
p-value is less than 0.05, it means that the null hypothesis is rejected, indicating that there is a Granger relationship between the variables.
Then, we conducted the Johansen cointegration theory. The results are shown in
Table 4. The trace statistic and maximum statistic show that the null hypothesis with the cointegration rank of 0 can be rejected at the level of 5%, but the null hypothesis with the cointegration rank of 5 cannot be rejected. It suggests that there are five linearly independent cointegration vectors (marked with an asterisk in
Table 4).
After determining the cointegration rank and lag order, we estimated the long-term cointegration coefficients of the eight variables and the thermal coal price using the MLE method. At the significance level of 1%, the cointegration equation of the eight indicators and the thermal coal price is as follows:
where the coefficient of import is zero. We performed residual autocorrelation tests and stability tests on this vector-error-correction model (VECM). The results demonstrated that the model was stable and that the residuals had no autocorrelation.
Through variance decomposition, we can further study the impact of the changes in the eight variables on the price fluctuation of thermal coal [
51,
52,
53]. In
Table 5, forecast-error variance decompositions are given. We performed a 20-month forecast for the thermal coal price.
5. Discussion
To ascertain the casual relationships between the eight variables and the thermal coal price, we performed the Granger causality test. It can be seen from
Table 3 that import is a Granger cause of the thermal coal price; however, the thermal coal price is not a Granger cause of import. That means that imports unilaterally affect the thermal coal price.
From the ADF test results in
Table 2, it can be seen that there are five variable series that are first-order single-integer time series. Through the Johansen cointegration test, it is demonstrated that there is a long-term cointegration relationship between the thermal coal price and the eight variables at the significance level of 1%. According to Equation (3), we found that when other conditions remain unchanged, the demand elasticity of the thermal coal price is negative and the value is very small, that is, the price elasticity of demand is great and the demand is sensitive to price changes. It is unexpected that the supply elasticity of the thermal coal price is negative, which is contrary to the expectation of economic theory. The stock elasticity of the thermal coal price is positive and the value is similarly small, that is, the price elasticity of stock is great and stock is sensitive to price changes. The cointegration coefficient of import and the thermal coal price is zero, indicating that in the long run, the change in imported coal volume has a slight impact on the price fluctuation of domestic thermal coal. When other conditions remain unchanged, the thermal coal price rises by 1% for every 9.8% increase in oil price. When other conditions remain unchanged, the thermal coal price rises by 1% for every 2.5% increase in natural gas price. It suggests that commodity energy prices affect each other and the change trend is same. The national economic situation can be directly displayed through the variable of power generation. Equation (3) shows that the thermal coal price rises by 1% for every 5.8% increase in power generation when other conditions remain unchanged. It indicates that a booming overall macroeconomic performance will promote the thermal coal price. When other conditions remain unchanged, the thermal coal price rises by 1% for every 21.6% increase in EPU. It is surprising that the rising uncertainty of economic policy will boost the increase in thermal coal price, but the thermal coal price is sluggish to EPU changes.
To research the contributions of the eight variable shocks to the impact on the thermal coal price over 20 periods, we conducted forecast-error variance decomposition and the results are in
Table 5.
Table 5 shows that the price fluctuation of thermal coal has the greatest explanation for itself, declining from 100.00% in the first period, and stabilizing at 86.5% in period 20. The contribution rate of the power coal demand to the price changes is in a gentle downward trend, from 0.31% in the second phase to 0.06%, and the contribution rate of supply to the price changes is in a slight upward trend, from 0.23% in the second period to 2.29% in the 20th period. Similarly, the stock explanation for the price changes increases from 0.58% in the second period to 3.56%. The contribution rate of import to the price changes is weak, from 0.12% to 0.25%. The contribution rate of the oil price to the thermal coal price changes rises from 0.12% to 4.22%. The contribution rate of the natural gas price to thermal coal price changes is not very much, from 1.14% to 2.67%. Power generation and EPU account for little in terms of thermal coal price changes, from 0.10% and 0.04% to 0.12% and 0.28%, respectively.
6. Conclusions
This study investigates how demand, supply, policy and other factors affect the thermal coal price and the degree of their influence. In this study, we found an index that can measure the impact of policy, which was proposed by BBD. We applied the economic policy uncertainty modified by Davis et al., on the basis of BBD. According to
Section 5, we found that there is a cointegrating relationship between demand, output, stock, import, other energy prices, power generation and economic policy uncertainty and the thermal coal price, and the main factors influencing the fluctuation of the thermal coal price are stock and other energy prices. Inventory changes will cause the thermal coal price to change in the same direction. Similarly, oil and gas prices fluctuate in the same direction as the thermal coal price. Apart from that, we know that except for the impact of demand on the coal price decreasing progressively in the long term, other variables all gradually become stronger, even if the impacts of economic policy uncertainty and power generation are weak. Surprisingly, the increase in policy uncertainty also pushes up the price of thermal coal.
Our research results signify that if the government wants to effectively control the thermal coal price, then it can start from the coal supply side, and the effect will continue to strengthen. Besides, it can be seen from Equation (3) that the price fluctuation trend of the bulk energy commodities is roughly the same, and the explanation of the oil price changing the thermal coal price is stronger than that of natural gas. Therefore, we could predict the future trend of the thermal coal price by observing the oil price.


