Article

Optimization of Operating Hydrogen Storage System for Coal–Wind–Solar Power Generation

School of Economics and Management, University of Science & Technology Beijing, Beijing 100089, China
*
Author to whom correspondence should be addressed.
Energies 2022, 15(14), 5015; https://doi.org/10.3390/en15145015
Submission received: 7 May 2022 / Revised: 22 June 2022 / Accepted: 27 June 2022 / Published: 8 July 2022
(This article belongs to the Special Issue New Insights into Energy Economics and Sustainable Development)

Abstract

:
To address the severity of the wind and light abandonment problem and the economics of hydrogen energy production and operation, this paper explores the problem of multi-cycle resource allocation optimization of hydrogen storage systems for coal–wind–solar power generation. In view of the seriousness of the problem of abandoning wind and photovoltaic power and the economy of hydrogen production and operation, the node selection and scale setting issues for hydrogen production and storage, as well as decision-making problems such as the capacity of new transmission lines and new pipelines and route planning, are studied. This research takes the satisfaction of energy supply as the basic constraint and constructs a multi-cycle resource allocation optimization model for an integrated energy system, aiming to achieve the maximum benefit of the whole system. Using data from Inner Mongolia, where wind abandonment and power limitation are severe, and Beijing and Shanxi provinces, where hydrogen demand is high, this paper analyzes the benefits of the hydrogen storage system for coal–wind–solar power generation, and explores the impact of national subsidy policies and technological advances on system economics.

1. Introduction

In recent years, global climate change has caused a variety of environmental problems, which attracts the attention of various countries to develop clean energy to replace the fossil energy. Under the global energy transition and sustainable development, in September 2020, the Chinese government announced that China will strive to achieve peak carbon dioxide emissions by 2030 and carbon neutrality by 2060, demonstrating its great responsibility and commitment to building a community of shared future for mankind and its determination to address climate change [1].
Using clean energy to generate electricity, such as wind and solar power, is an important way to drive energy reformation in China. However, with the increase in fan installed capacity and photovoltaic installed capacity year by year, the phenomenon of abandoning wind and photovoltaic power has become an urgent problem to be solved, which directly affects the profits of wind and photovoltaic power plants, and wastes energy [2]. In 2015, China’s installed capacity for wind and photovoltaic power ranked first in the world. Meanwhile, the data on abandoning wind and photovoltaic power also hit a record high. Since 2015, the amount of abandoned wind and photovoltaic power in China has increased year by year. The situation did not ease until 2018, but the annual amount of abandoned wind and photovoltaic power was 27.7 billion kWh and 5.5 billion kWh, respectively. Hydrogen storage is the preferred solution to solve the problem of a large amount of centralized wind and solar combined with the grid [3,4]. Compared with hydraulic storage, compressed air storage, wind turbine storage, electrochemical storage, superconducting magnetic storage, etc., hydrogen storage has various advantages. The energy density of hydrogen is 140 MJ/kg, which is more than twice that of a typical solid fuel. Hydrogen is burned to produce water with no pollution gas produced during the production process. Furthermore, hydrogen has a large capacity and is easy to store for it can be stored as gas, liquid and solid [5]. The remaining hydrogen after combining with the grid can also be used as fuel for hydrogen vehicles without pollution. Therefore, the widespread use of hydrogen energy not only solves the problems of environmental pollution and abandoning wind and photovoltaic power, but also promotes the energy transition and mitigates climate change risks, creates work opportunities and enhances economic development, which in turn can contribute to the progress of the whole society [6].
The main obstacle to the large-scale application of hydrogen energy is the high cost of hydrogen production, storage and transport. The cost of hydrogen production accounts for about 70% of the total cost of hydrogen. A large number of domestic and foreign research institutions and related enterprises find that wind–hydrogen coupling and wind–solar–hydrogen coupling are two effective ways to reduce the cost of hydrogen [7]. Moreover, since coal provides a stable and continuous supply of electricity, wind–solar power, hydrogen storage and coal can complement each other and together improve the stability of the system. On this basis, in view of the seriousness of the problem of abandoning wind and photovoltaic power and the economy of hydrogen production and operation, this paper constructs a hydrogen storage system for wind–solar power generation, studies its economy and provides theoretical guidance for the large-scale adoption of hydrogen storage.
The rest of this paper is organized as follows: the second part is a review of related literature; the third part is the construction of a multi-cycle resource allocation optimization model for the wind–solar–hydrogen integrated system; the fourth part is a case study on the construction of the hydrogen storage system for wind–solar power generation in Inner Mongolia, where the amount of abandoned wind and photovoltaic power is the largest in China, and in Beijing and Shanxi, where the demand for hydrogen is large; the last part is the conclusion of this paper and future research directions.

2. Literature Review

The hydrogen storage system for wind–solar power generation uses wind and photovoltaic energy, instead of the fossil fuel, to generate power. To be specific, that system transmits the power that cannot be absorbed by the grid to the electrolyzer, and then generates hydrogen through the electrolysis of water, which transforms power into gas. When power is in short supply, the fuel cell can be used to convert it into power or export the hydrogen to the industrial or other consumer end. This paper explores the hydrogen storage of wind and photovoltaic power generation, the production, storage and transportation of hydrogen and the optimization of coal–wind–solar–hydrogen operation.

2.1. Research on Hydrogen Storage of Wind–Solar Power Generation

Wind power generation is a commonly used method to generate power at present, but its instability affects the quality of wind power. Additionally, photovoltaic power generation was developed recently. However, it is more stable than wind power for it is affected by solar intensity. In 1981, Busch and Kallenbach proposed the concept of wind–solar power generation in view of the instability of wind and photovoltaic power supply, which is the first theoretical research on wind–solar coupled power generation. Subsequently, the system for wind–solar power generation was investigated by many scholars, such as Aspliden, Russell, Aksarni, Rajesh and Karki. The research on wind–solar coupled power generation in China began in 1982. Yu Huayang and others studied the energy conversion device of solar and wind power generators, which marked that the research on wind–solar power generation systems entered the stage of practical application. To solve the structural defects of the conventional wind–solar hybrid power generation system, Wei et al. [8] proposed a compact spherical wind–solar hybrid power generation system (CSWS-HPS) and achieved a considerable power generation efficiency. To improve the reliability and energy utilization of renewable energy generation systems, Liu et al. [9] investigated the optimal control method of wind–solar hybrid devices designed using the power prediction method and proposed an MPPT optimal control strategy. Wind and solar power generation has good temporal and spatial complementarity, which can ensure the stability and sustainability of electrical energy output, and thus achieve efficient utilization of resources and improve economic efficiency [10].
At present, many countries such as the United States, Germany and Spain have supported and planned to combine renewable energy with fuel cells to generate power in off-grid or grid systems. The U.S. Department of Energy NREL and Xcel Energy launched the Wind H2 plan, and the European Commission proposed the Fifth Framework Programme for Research, which aim to explore technologies which use renewable energy to produce and store hydrogen. As clean energy, hydrogen has high energy density, large capacity, long life and easy storage and transmission. In recent years, many scholars have verified the feasibility and necessity of hydrogen storage of wind–solar power generation through examples [11,12]. In addition, with the development of computer technology, more and more scholars have verified the effectiveness and reliability of hydrogen storage systems in wind–solar power generation through modeling and simulation [13,14,15,16,17,18,19]. Other scholars have designed the scheme on hydrogen storage of wind–solar power generation to optimize the system [20,21,22,23,24]. Hydrogen storage can provide frequency regulation and rotation reserve to effectively maintain the balance of grid generation and load [25].

2.2. Production, Storage and Transportation of Hydrogen Energy

At present, the main methods to produce hydrogen include thermochemical methods, natural gas reforming methods, coal gasification, steam methane reforming and water electrolysis [26], so there are more and more studies on hydrogen production systems [27,28,29]. In the Wind H2 plan which is proposed by the National Renewable Energy Laboratory (NREL) of the United States, the wind–hydrogen coupled system adopts electrolysis of water to produce hydrogen which is also adopted by other countries in hydrogen storage systems for the wind–solar power generation. That is because hydrogen production by water electrolysis has the advantages of simple operation, high hydrogen production efficiency and little environmental pollution. In recent years, it has been a useful way for hydrogen storage and hydrogen energy development to use hydrogen as secondary energy or fuel for industrial applications which is produced by abandoning water, wind and solar power.
Hydrogen is extremely inconvenient to transport for it is gaseous at normal temperature and atmospheric pressure. Therefore, the hydrogen produced by electrolysis in the electrolyzer is generally stored in large storage tanks, compressed or cooled to liquefy and then transported to various hydrogen refueling stations by pipelines, trailers or tankers. Physical storage as compressed gas, physical storage as cryogenic liquid hydrogen and materials-based storage or solid-state storage are three typical methods of hydrogen storage, and the first two methods are the most mature and widely used methods. The main advantage of physical storage as compressed gas is the simplicity of the process and fast filling–releasing rate. Physical storage as cryogenic liquid hydrogen is expensive compared to compressed hydrogen storage, but provides a higher energy density. Materials-based storage or solid-state storage, on the other hand, can store a large amount of hydrogen in a relatively small volume [30]. In this process, how to minimize the cost of hydrogen storage has become a hot research topic [31].
According to the different states and storage methods of hydrogen, the transport methods of hydrogen can be divided into gas hydrogen transport, liquid hydrogen transport and metal hydride-form transport, of which the first two are the main methods. For transporting large quantities of hydrogen over long distances, using pipeline transport may be a preferable method. Liquid hydrogen is generally transported over long distances by road or sea, while low-pressure hydrogen stored in metal hydrides can only be transported in small quantities over short distances [32]. Transport by pipelines is divided into pipelines which have been built recently only for hydrogen and pipelines of natural gas which mix natural gas with hydrogen in order to transport. Sebastian and Timmerberg [33] demonstrated that the cost of using existing natural gas pipelines to transport hydrogen (10% mixing ratio) is lower than the cost of converting hydrogen into methane, diesel and gasoline. Deymi et al. [34] found that mixing hydrogen and natural gas increases the turbine compressor energy at the natural gas booster station, resulting in less fossil fuel consumption.
However, the storage and transportation of hydrogen still present many technical challenges today. Even though the cost of transporting large quantities of gaseous hydrogen may be low, the construction of new pipelines incurs larger costs and there are associated safety issues, such as hydrogen embrittlement and leakage [35]. These technical challenges have been hindering the scaling up of the hydrogen supply chain, and optimizing operational strategies has become a key driver for it.

2.3. Optimization of Coal–Wind–Solar–Hydrogen Operation

The optimization of a wind–solar–hydrogen operation mainly includes production, operation, evaluation and improvement of the system. Among them, the design and operation angle of the wind–solar–hydrogen system is reflected in the construction of the coupled system. It is an inevitable trend to design an operating model of the wind–solar–hydrogen system that maximizes profits [36]. Fan et al. [37] established a multi-energy hybrid coupled system including several systems such as a wind–energy hybrid system, power distribution system, hydrogen storage system and coal chemical system based on wind and solar resources in the Hami region, and studied the economic performance of the system. For the high volatility of wind power, Liang et al. [38] proposed a robust optimal dispatch model for integrated energy systems considering wind–hydrogen coupling and solved it by the column constraint generation method (C&CG). Zhao and Li [39] studied the influence of the capacity of wind turbines and photovoltaic arrays on the hydrogen production efficiency of the system under the analysis of the system dynamic model, conducted sensitivity and cost analysis to evaluate the cost of hydrogen production and found that wind turbines and photovoltaic arrays are the most important variable. The cost provides a reference for the capacity matching of various components of the hydrogen refueling station. Based on the model predictive control algorithm, Trifkovic et al. [40] realized the optimal operation of each sub-module of the hybrid system composed of fans, fuel cells, electrolyzers and hydrogen storage tanks under the condition of coordinating the balance of power generation. Yang et al. [41] proposed a generic optimal design method for planning and scheduling a multi-echelon HSCN based on an off-grid wind–hydrogen coupled system that accounts for uncertainty in wind and hydrogen demand, and the model involves both planning and operational issues.
In the evaluation and improvement of the wind–solar–hydrogen system, the evaluation of the system cost has become a research hotspot [42,43]. When evaluating the dispatch of system energy, it is found that the model predictive control strategy is the most efficient [44]. In addition, Khalid et al. [45] proposed an integrated hydrogen storage system for wind and photovoltaic power which is applied in residence, in which wind and photovoltaic energy are used as power, and hydrogen is used as the stored energy, and evaluates the energy and exergy benefits of the system. In addition, based on the levelized cost and the net present value cost of power which have been determined, the integrated energy storage system of wind, solar and hydrogen is optimized. Won et al. [46] proposed the application of an integer linear programming model to optimize the capacity of wind power, photovoltaic and alkaline electrolyzers.
At this stage, the research on the system of hydrogen production by wind and photovoltaic power mainly evaluates the reliability and economy of the hydrogen storage system for wind–solar power generation from the perspectives of model simulation, example verification and algorithm optimization. At present, there are few studies on the operation of the hydrogen storage system for wind–solar power generation and on the multi-cycle hydrogen storage system for wind–solar power generation. Therefore, based on previous research, this paper intends to introduce an optimization model of operating the multi-cycle hydrogen storage system for coal–wind–solar power generation, and then determines the optimal model of the hydrogen storage system for wind–solar power generation. Considering that coal generation is more stable and controllable, the electricity demand in this paper is the total social demand minus the coal generation.

3. Optimization of Operating the Hydrogen Storage System for Wind–Solar Power Generation and Construction of Dispatching Model

As shown in Figure 1 below, the hydrogen storage system for wind power generation studied in this paper is a system for wind and photovoltaic power generation which combines with the grid, including a system for wind and photovoltaic power generation, a system for hydrogen production, a system for hydrogen storage, a system for hydrogen transport and a system for hydrogen operation (hydrogen refueling station). This paper mainly shows that the plant which generates power by wind and photovoltaic power is used to optimize the coupled system for power generation and the production, storage, transportation and operation of hydrogen. In the scenario where wind and photovoltaic power generation guarantees power demand and using abandoned wind and photovoltaic power to produce hydrogen and then transport it outside the system through trucks or pipelines, this paper explores the choice nodes of hydrogen production and storage, scale settings, the capacity of a new transmission line and new pipelines and their route planning so as to meet the energy supply and achieve the maximum profits of the whole system.

3.1. Model Assumptions

Considering the actual situation of production operation and the convenience of building the model, the assumptions of this model are given as follows:
(1)
When generating wind and photovoltaic power, wind power is mainly produced by wind turbines, while photovoltaic power is generated by solar panels, instead of solar thermal power generation.
(2)
The wind speed and solar radiation intensity in all decision-making cycles are known and remain unchanged in each decision-making cycle.
(3)
Within the sustainability of nature, all the equipment for wind and photovoltaic power generation is turned on, and all the remaining electricity is used for hydrogen production.
(4)
Without considering the power transport from the main transformer station to customers, the main transformer station is the end user of electricity; without considering the gas transport from the natural gas gate station to customers, the natural gas gate station is the end user of hydrogen energy.
(5)
The transmission lines between every two nodes have different degrees of loss which is only related to the transport amount of power. The gas pipeline between each two nodes has different degrees of loss which is only related to the amount of gas flow.
(6)
In each decision-making cycle, wind turbines, photovoltaic power generation equipment and hydrogen production electrolyzers only maintain the same state (start or stop), and all generators in the same station of wind power generation are synchronized.
(7)
The startup time of all devices is ignored.
(8)
Considering economy and convenience of operation, trucks only travel on fixed routes.
(9)
The maintenance cost per unit of the truck is unchanged which is only related to the distance.
(10)
The construction of new pipelines only depends on the construction of transformer stations and hydrogen demand stations.
(11)
The construction of new transmission lines only depends on stations of power generation, transformer stations and stations of hydrogen production.
(12)
The stations of hydrogen production and storage only depend on transformer stations, stations of hydrogen production, stations of hydrogen storage, natural gas stations and hydrogen demand stations.
(13)
During the period of electrolysis equipment, truck depreciation expenses are not considered.
(14)
Pipelines used in this system only transport hydrogen without storage.

3.2. Parameter Symbols and Their Descriptions

In this section, this paper will present the parameter symbols and their descriptions in Table 1, Table 2, Table 3, Table 4 and Table 5.

3.3. Objective Function

This paper establishes a linear programming equation with multi-decision variables during multiple periods based on the costs and proceeds during the full life cycle of hydrogen. Total profit = hydrogen sale proceeds + new energy subsidies − (cost of power generation + cost of hydrogen production + cost of hydrogen storage + cost of power transport + cost of hydrogen transport by pipelines + cost of hydrogen transport by trucks),
max G P = T I S + T I A ( T C G + T C H + T C S + T C E + T C L G + T C T G ) .
(1)
Proceeds
The total proceeds studied in this paper include hydrogen sale proceeds TIS and new energy subsidies TIA.
Hydrogen   sale   proceeds   T I S = t T k V H D 1 ( 1 + r ) t p s t g k t
New   energy   subsidies   T I A = t T k V H D 1 ( 1 + r ) t p b t g k t
(2)
Costs of power generation and transport
Since the wind and photovoltaic power plants are already in operation, there is no need to consider the costs of startup and construction of power plants. In addition, even if the hydrogen energy system is not introduced, the wind and photovoltaic power plants still need to complete the routine tasks of power generation which means it also needs to carry out routine maintenance. On this basis, there is no need to consider the maintenance cost of the wind and photovoltaic power generation equipment. Therefore, the cost of power generation in this model mainly refers to the cost per unit of power which is consumed by power generation equipment to produce hydrogen, including costs of wind power generation and photovoltaic power generation.
Cos t   of   power   generation   T C G = t T 1 ( 1 + r ) t ( i V P W C P W i t x i t + j V P P C P P j t y j t )
where i V P W C P W i x i t represents the cost of power generation in the wind power plant in one year, and j V P P C P P j y j t the cost of power generation in the photovoltaic power plant in one year.
The cost of power transport means all the costs involved in the power transport in this system, including costs of power transmission lines from power generation plants to transformer plants and from transformer plants to hydrogen production plants. Based on the cost analysis of power transport and the consideration for modeling, the cost of power transport in this model includes costs of constructing and maintaining power transmission lines and the cost of power transport loss.
Costs of power transport:
T C E = t T l V l V 1 ( 1 + r ) t d e l l ( B E l l t C C E l l t + B E l l t C M E l l t + L E l l w l l t e t )
where B E l l t C C E l l t represents the cost of constructing power transmission lines per unit length in one year, and B E l l t C M E l l t the loss cost of power transmission lines.
(3)
Costs of hydrogen production and storage
The cost of hydrogen production in the model includes the cost of hydrogen production by electrolysis of water, the cost of starting the hydrogen production station in the early stage, the cost of constructing the hydrogen production station and the cost of maintaining the hydrogen production station during the period.
Cost of hydrogen production:
T C H = t T l V 1 ( 1 + r ) t ( C P S l t B P l t + C P U l t Q P M l t + C G M U l t Q P M l t + C G U l t u l t )
where C P S l t B P l t represents the startup cost of the hydrogen production station, C P U l t Q P M l t the construction cost of the hydrogen production station, C G M U l t Q P M l t the maintenance cost of the hydrogen production station, and C G U l t u l t the cost of hydrogen production.
The cost of hydrogen storage includes the cost of hydrogen storage, the startup cost of the hydrogen storage station, the construction cost of the hydrogen storage station and the maintenance cost of the hydrogen storage station during the period.
Cost of hydrogen storage:
T C S = t T l V 1 ( 1 + r ) t ( C R S l t B S l t + C R U l t Q S M l t + C S M U l t Q S M l t + C S U l t v l t )
where C R S l t B S l t represents the startup cost of the hydrogen storage station, C R U l t Q S M l t the construction cost of the hydrogen storage station, C S M U l t Q S M l t the maintenance cost of the hydrogen storage station and C S U l t v l t the cost of hydrogen storage.
(4)
Cost of hydrogen transport
The cost of hydrogen transport is the cost from the hydrogen production station to the hydrogen demand station, which can be transported by pipelines and trucks.
The cost of hydrogen transport by pipelines includes the construction cost of new pipelines and the reconstruction cost of using existing natural gas pipelines. The cost of the new pipelines includes the construction and maintenance cost of the new pipelines and the cost of hydrogen loss when transporting by new pipelines. The reconstruction cost of using existing natural gas pipelines includes the cost of upgrading pipelines, the cost of hydrogen loss when transporting by existing pipelines, the cost of mixing gases and the cost of separating the gases.
Cost of the new pipelines:
t T l V l V 1 ( 1 + r ) t d g l l ( B G l l t C C G l l t + B G l l t C M G l l t + p s t L G l l z l l l t )
where B G l l t C C G l l t represents the construction cost per unit length of new pipelines, B G l l t C M G l l t the maintenance cost per unit length of new pipelines, p s t L G l l z l l l t the cost per unit length of hydrogen loss when transporting by new pipelines.
Cost of using existing natural gas pipelines:
t T n V N G n V N G 1 ( 1 + r ) t d g n n ( B U n n t C U G n n t + ( p s t p n t ) R G n n L G n n z l n n t )
where B U n n t C U G n n t represents the cost of upgrading pipelines, ( p s t p n t ) R G n n L G n n z l n n t the cost of hydrogen loss when transporting by existing pipelines.
Cost of mixing and separating the gases:
t T n V N G n V N G 1 ( 1 + r ) t ( C S M n t z l n n t + C S E n t z l n n t )
where C S M n t z l n n t represents the cost of mixing hydrogen with natural gas, and C S E n t z l n n t the cost of separating hydrogen from natural gas.
The cost of transport by trucks includes the cost of buying trucks, the cost of repairing trucks, the cost of transport by trucks, the cost of hydrogen loss when transporting by trucks and the cost of compressing hydrogen.
Cost of buying and repairing trucks:
T C T G = t T 1 ( 1 + r ) t ( C T P t q t + l V l V C T M t d t l l f l l t ) .
Cost of transport by trucks and hydrogen loss when transporting by trucks:
T C T G = t T 1 ( 1 + r ) t ( l V l V C T D l l t d t l l z t l l t + l V l V L T l l p s t d t l l z t l l t ) .
Cost of compressing hydrogen:
l V l V C T C l t z t l l t .

3.4. Constraint Conditions

(1)
Constraints on power generation and transport
During the cycle t , the amount of power output from the station i of wind power generation does not exceed that of abandoning wind power in that station:
l V w i l t G E W i g w i t , i V P W , t T .
During the cycle t , the amount of power output from the station j of photovoltaic power generation does not exceed that of abandoning photovoltaic power in that station:
l V w j l t G E P j g p j t , j V P P , t T .
During the cycle t , the amount of power transport between node l and node l does not exceed the maximum amount of power transport:
w l l t G T E l l t , l , l V , t T .
If there are no transmission lines between two nodes, the amount of power transport between those two nodes is 0:
w l l t M B E l l t , l , l V , t V .
(2)
Constraints on hydrogen production and storage
During the cycle t , the amount of hydrogen production at node l does not exceed the amount of hydrogen production of power which is transported:
u l t G G H l t w l t , l , l V , t T .
During the cycle t , the amount of hydrogen production at node l does not exceed the maximum amount of hydrogen production:
u l t Q P M l t , l V , t T .
During the cycle t , the amount of hydrogen storage at node l does not exceed the amount of hydrogen production at that node:
v l t u l t , l V , t T .
During the cycle t , the amount of hydrogen storage at node l does not exceed the maximum amount of hydrogen storage:
v l t Q S M l t , l V , t T .
If a node is not selected as the station of hydrogen production, the amount of hydrogen production at that node is 0:
Q P M l t M B P l t , l V , t V .
If a node is not selected as the station of hydrogen storage, the amount of hydrogen storage at that node is 0:
Q S M l t M B S l t , l V , t V .
(3)
Constraints on hydrogen transport
The hydrogen constraints for balance at each node:
l V ( z l l l t + z t l l t ) + u l t + v l t 1 l V ( z l l l t + z t l l t ) + v l t , l V , t T , v l 0 = 0 .
During the cycle t , the amount of hydrogen for node k is not less than the minimum demand amount of hydrogen:
l V ( z l l k t + z t l k t ) S m i n k t , k V H D , t T .
During the cycle t, the amount of hydrogen for node k does not exceed the maximum demand amount of hydrogen:
l V ( z l l k t + z t l k t ) S m a x k t , k V H D , t T .
During the cycle t , the amount of hydrogen transport by pipelines between node l and node l does not exceed the maximum amount of hydrogen transport by pipelines between those two nodes:
z l l l t G T G l l t , l , l V , t T .
During the cycle t , the amount of hydrogen transport by trucks between node l and node l does not exceed the maximum amount of hydrogen transport by trucks between those two nodes:
z t l l t G T T f l l t , l , l V , t T .
During the cycle t , the total frequency of operating trucks among all the nodes does not exceed the maximum frequencies of operating trucks:
l V l V f l l t O F g t , t T .
If there is no new pipelines or ungraded pipelines between two nodes, the amount of the pipeline between two nodes is 0:
z l l l t M ( B G l l t + B U n n t ) , l , l V , n , n V , t V .
If there are no trucks between two nodes, the amount of hydrogen transport by trucks is 0:
z t l l t M f l l t , l , l V , t V .
During the cycle t , the number of available trucks is equal to the cumulative number of new purchased trucks minus the cumulative number of scrapped trucks:
g t = τ = 0 t ( q τ h τ ) , t T .
The maximum working life of trucks is T Y , so:
h τ = 0 , 0 τ < T Y , τ T ,
h τ = q τ T Y , τ T Y , τ T .
(4)
Constraints on variables’ range
The constraints on the value range of binary variables, integer variables and continuous variables are as follows:
B P l t , B S l t , B E l l t , B G l l t , B U n n t { 0 , 1 } ,
q t , g t , f l l t N ,
Q P M l t , Q S M l t , u l t , v l t , w l l t , z l l l t , z t l l t R + .

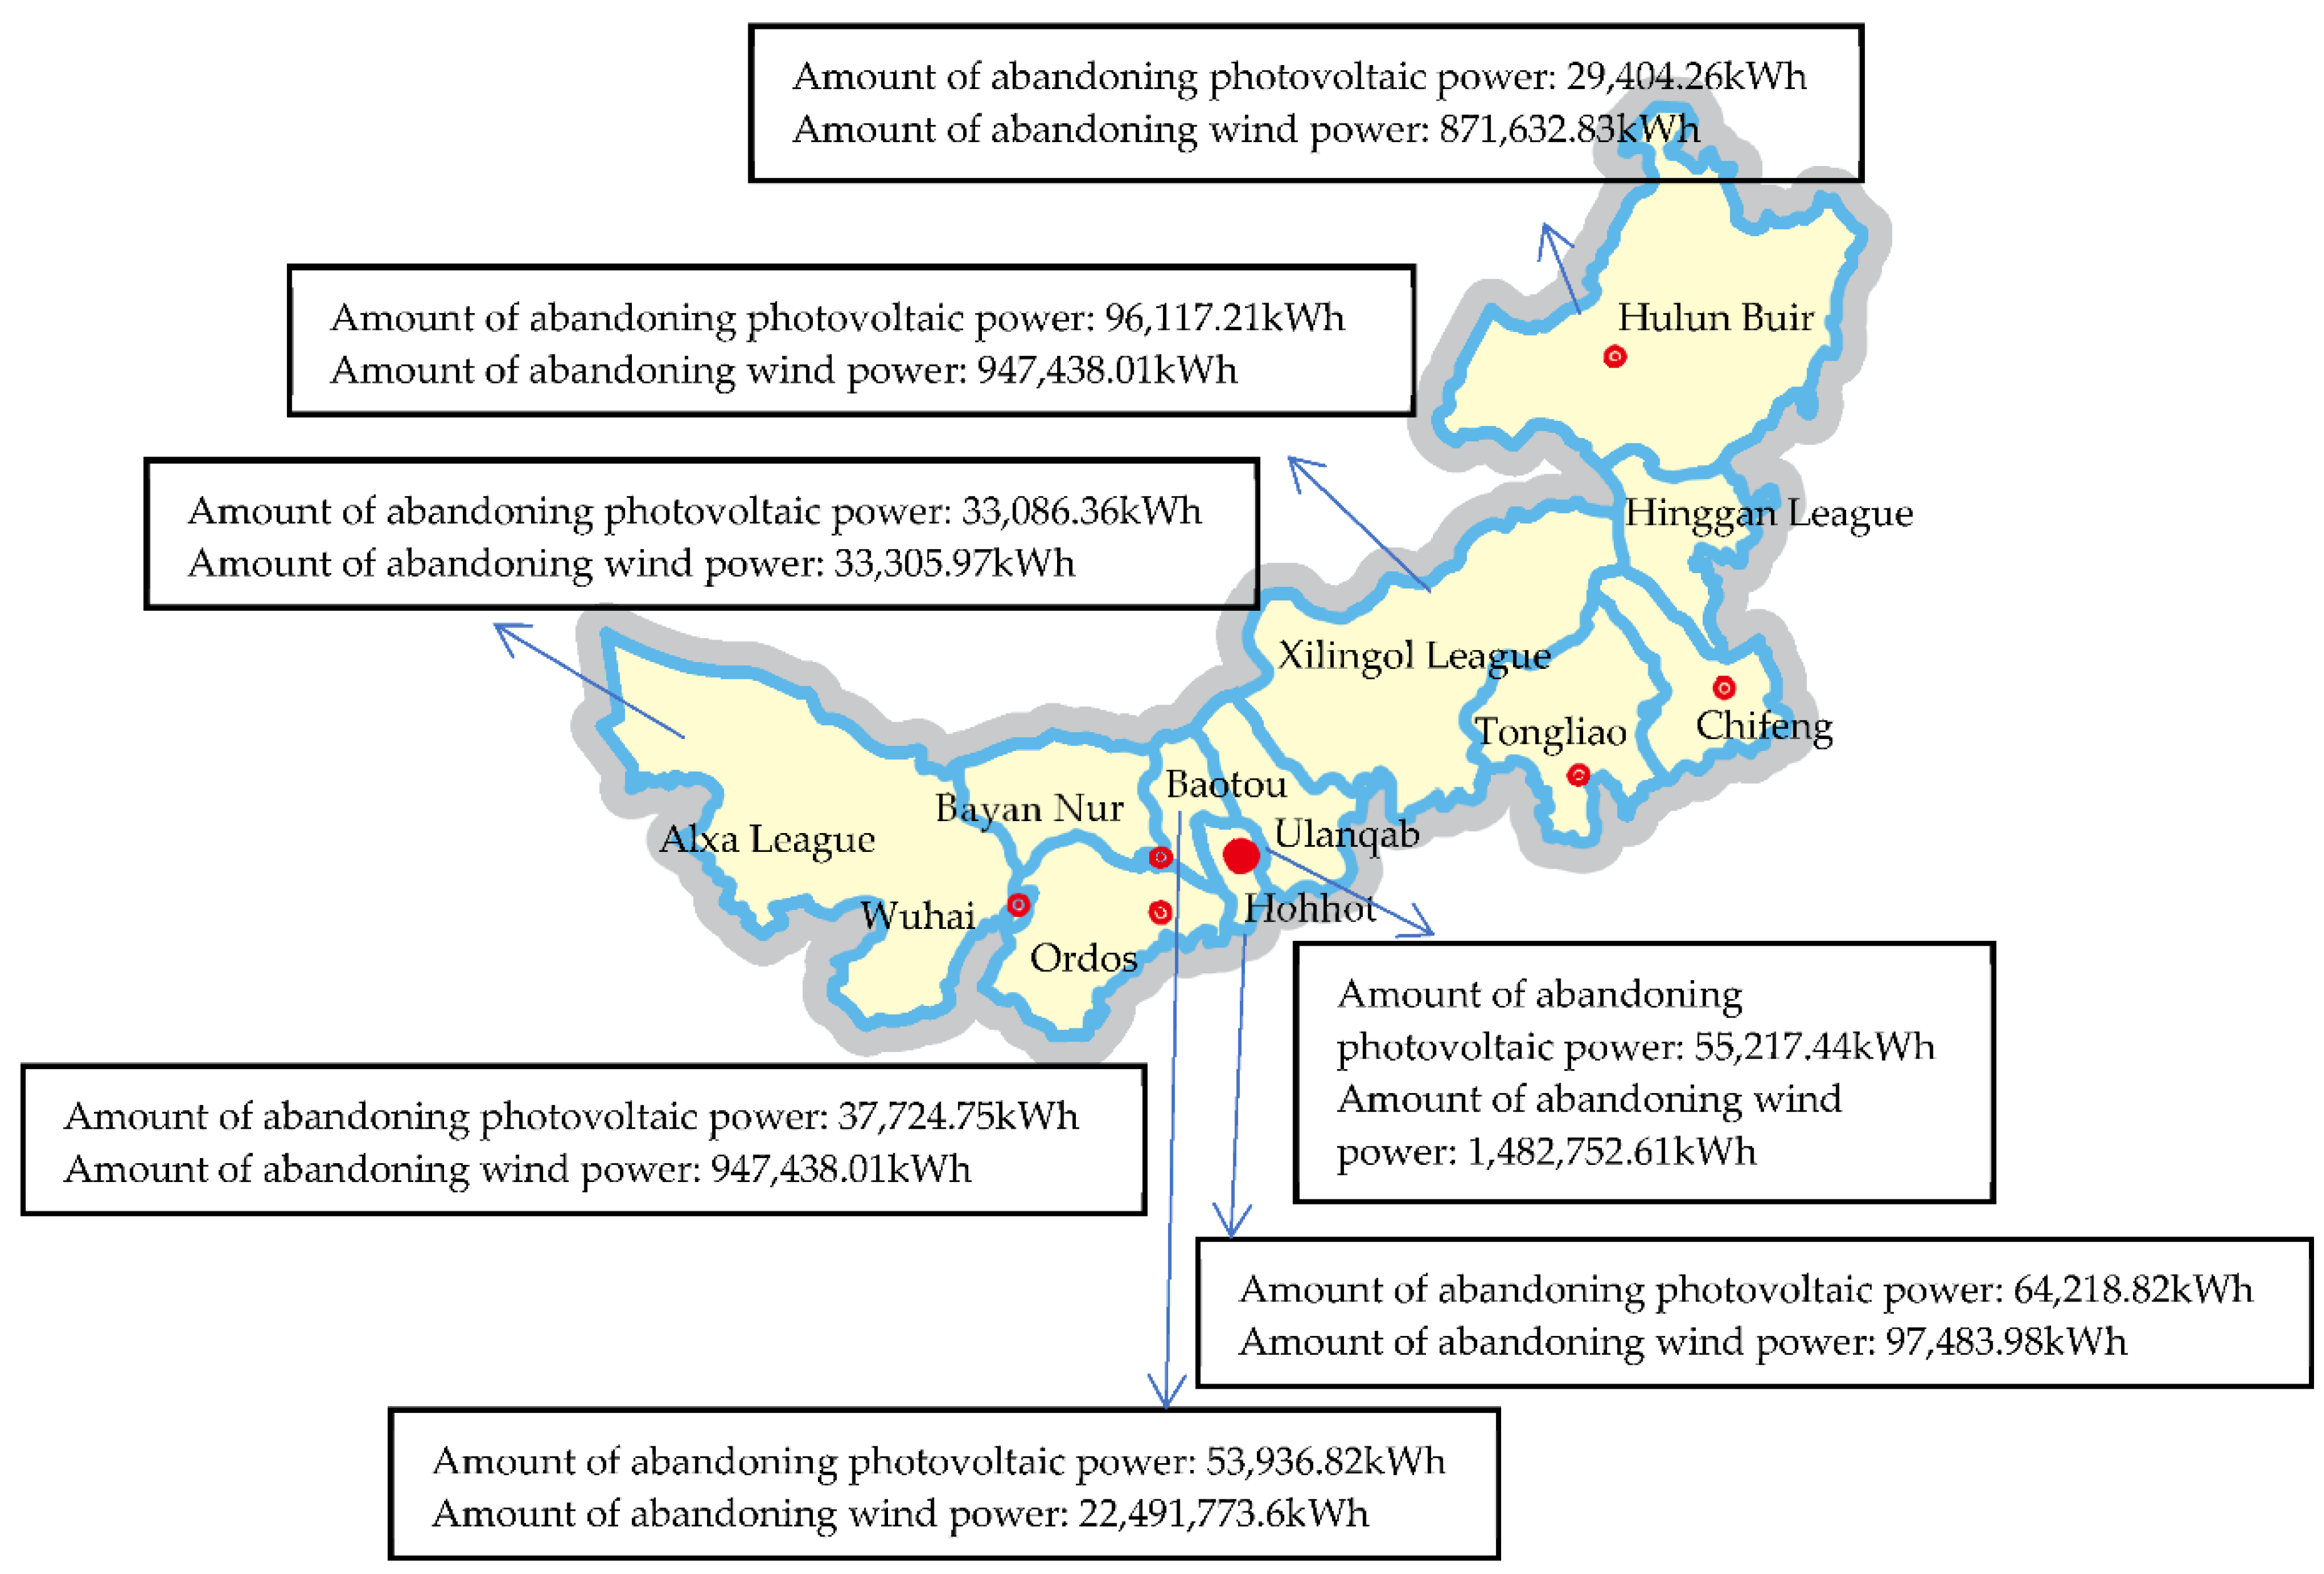
4. A Case Study on Optimization of Operating the Consumption of Abandoned Power in Inner Mongolia

4.1. Problem Description

Inner Mongolia is rich in wind and photovoltaic energy, and the installed capacity of wind turbines and photovoltaics in Inner Mongolia ranks among the highest in China. However, there is an urgent phenomenon of abandoned wind and photovoltaic power in Inner Mongolia. To be specific, the abandoned wind power accounts for 10% of the total power generation. Figure 2 shows the amount of abandoned wind power in stations of wind and photovoltaic power generation in Inner Mongolia in 2017.
In recent years, with the large-scale use of fuel cell vehicles, the demand for hydrogen energy has gradually increased. However, hydrogen at hydrogen refueling stations is expensive which is a key factor restricting the development of fuel cell vehicles. According to the previous research on hydrogen prices, it is concluded that costs of hydrogen production and transport account for 70% of the total cost and the power used to produce hydrogen costs the most. Therefore, it is necessary to optimize the operation of hydrogen production and transport so as to reduce the cost of hydrogen. Based on the previous analysis, this paper uses the abandoned wind and photovoltaic power in Bayan Nur, Baotou, and Ulanqab, Inner Mongolia autonomous region to produce hydrogen which will be transported to Beijing and Shanxi province with a large demand for hydrogen.
This paper selects Beijing and Shanxi as hydrogen demand stations for Beijing has a large amount of hydrogen energy vehicles, but has insufficient hydrogen energy and Shanxi is adjacent to Inner Mongolia which is more practical to do this case study.
Among many stations of wind power generation and photovoltaic power generation in Bayan Nur, Baotou, and Ulanqab, Inner Mongolia, this paper selects three wind power plants in Bayan Nur with a large amount of abandoned power, which are Huaneng Habutagai Wind Power Plant (the amount of abandoned wind power is 110.51 million kWh), CGN Hongyan Wind Power Plant (the amount of abandoned wind power is 108.43 million kWh), Guohua Chuanjing Wind Power Plant (the amount of abandoned wind power is 180.37 million kWh), and two photovoltaic power plants in Bayan Nur with a large amount of abandoned power, which are Guodian Hong Galu Photovoltaic Power Plant (the amount of abandoned photovoltaic power is 7.39 million kWh), Zhongli Taenghui Photovoltaic Power Plant (the amount of abandoned photovoltaic power is 8.13 million kWh); three wind power plants in Baotou with a large amount of abandoned power, which are Jinfeng Damao Wind Power Plant (the amount of abandoned wind power is 219.75 million kWh), Tianrunxing Shunxi Wind Power Plant (the amount of abandoned wind power is 122.49 million kWh), Zhongke Shiratu Wind Power Plant (the amount of abandoned wind power is 118.04 million kWh), and two photovoltaic power plants in Baotou with a large amount of abandoned power, which are Mingao Huadu Photovoltaic Power Plant (the amount of abandoned photovoltaic power is 7.12 million kWh) and Chaer Lake Photovoltaic Power Plant (the amount of abandoned photovoltaic power is 7.39 million kWh); and three wind power plants in Ulanqab with a large amount of abandoned power, which are Sanxia Xingfu Wind Power Plant (the amount of abandoned wind power is 304.12 million kWh), Huarun Ruifeng Wind Power Plant (the amount of abandoned wind power is 106.64 million kWh) and Sanxia Changshun Wind Power Plant (the amount of abandoned wind power is 143.32 million kWh). It is assumed that those three cities each have a power plant and there is a natural gas pipeline from Baotou to Beijing that can be transformed into one mixing natural gas with hydrogen. The details are shown in Figure 3 below.
The research objectives of this paper are to explore the optimal stations of hydrogen production and storage in Beijing and Shanxi when transporting the abandoned wind and photovoltaic power from Inner Mongolia corresponding to the different demands of hydrogen in Beijing and Shanxi and investigate the cost of transporting power.

4.2. Case Analysis

Since the model involves 21 nodes of hydrogen production stations and hydrogen storage stations, the following assumptions are proposed on the basis of the existing assumptions in the model to prevent unrealistic situations:
(1)
The specific locations of hydrogen production stations and hydrogen storage stations are selected from transformer stations, natural gas stations and hydrogen demand stations.
(2)
The newly built pipelines generally transport directly to the hydrogen demand stations when the transformer station is the hydrogen production station.
(3)
Considering the economy of this model, if the existing natural gas pipelines are used for hydrogen transport, all existing natural gas pipelines will be upgraded to pipelines of mixing natural gas with hydrogen, and trucks will be used for transport from Beijing natural gas stations to Shanxi demand stations.
(4)
Coupling of hydrogen production stations and hydrogen storage stations.
The values of the different variables are given in Table 6.

4.2.1. Results Analysis of This Model
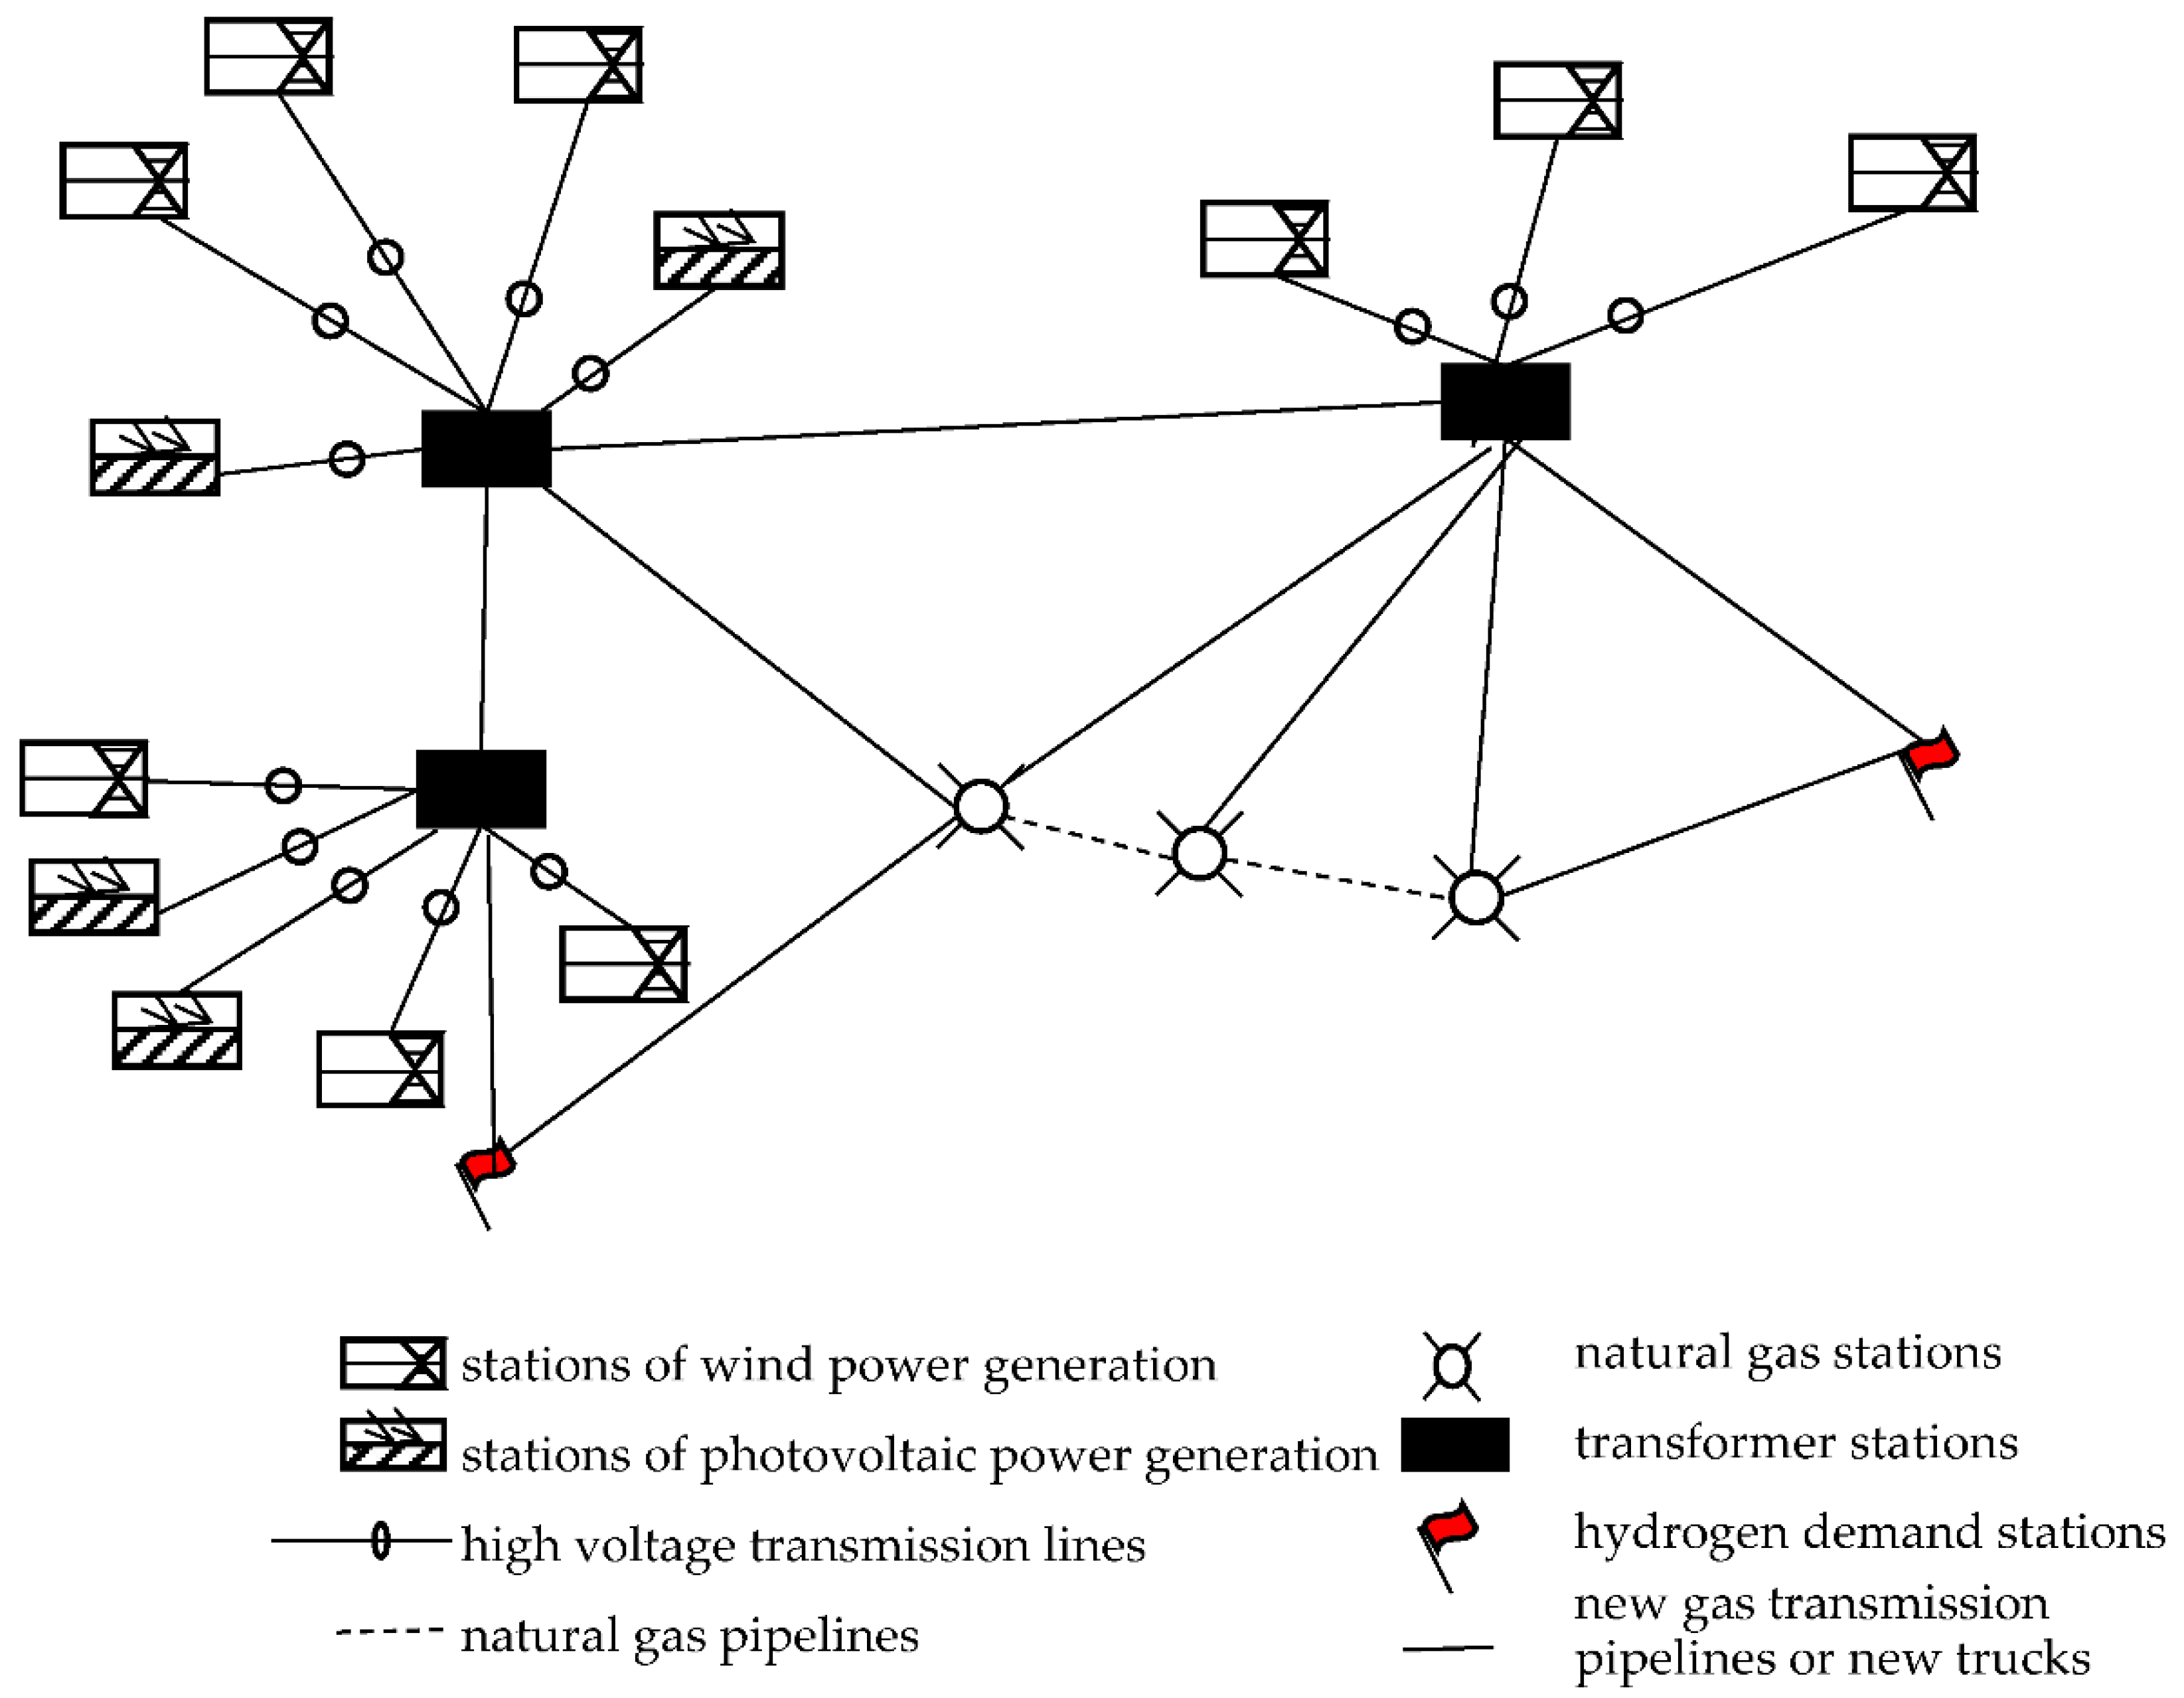
According to the above data, the optimal solution for the multi-cycle operation of hydrogen storage for wind–solar power generation is calculated by Lingo11 software (Lindo System Inc., Chicago, IL, USA), as shown in Table 7.
In the system of transporting abandoned power from Inner Mongolia to Beijing and Shanxi within the consideration of labor cost changes in 30 years, hydrogen subsidies and technological progress, the total profit in the next 30 years will reach CNY 1.4 × 10¹⁰. Compared with the new wind–solar–hydrogen coupling system, the profit has increased by about 20% [47].
The above data are calculated under the assumption that China will continue to increase hydrogen subsidies in the future, technological progress will make the rated amount of power transport continue to increase and the purchase cost of trucks will continue to decrease, which is more accurate and reliable when compared with only considering the operation results of one year. As new hydrogen pipelines are expensive, it is not economical to use existing natural gas pipelines to transform hydrogen for short-distance transport.
Table 8 shows the changes in the location of hydrogen production stations, the frequency of transport by trucks and the total cost which are all under different hydrogen demand stations.
As can be seen from Table 8, the locations of hydrogen production stations and hydrogen storage stations change corresponding to different amounts of hydrogen demand, and the position of hydrogen production stations will be closer to the hydrogen demand end. The results of the model are consistent with the conclusions of the existing literature on the hydrogen transport: the system of the direct power transport is superior to the system of transporting hydrogen produced by wind–solar power plants.
The reasons are:
(1)
A hydrogen production station is established on the hydrogen demand end. If using the direct transport by wind and photovoltaic power, the cost of power transport is only taken into consideration. In this way, the cost of power transport is low. The loss of power transport is low when using a 500 kv ultra-high voltage circuit. Assuming power produced by wind and photovoltaic power plants is collected into the transformer stations, the power is more stable than that directly transported from the power field.
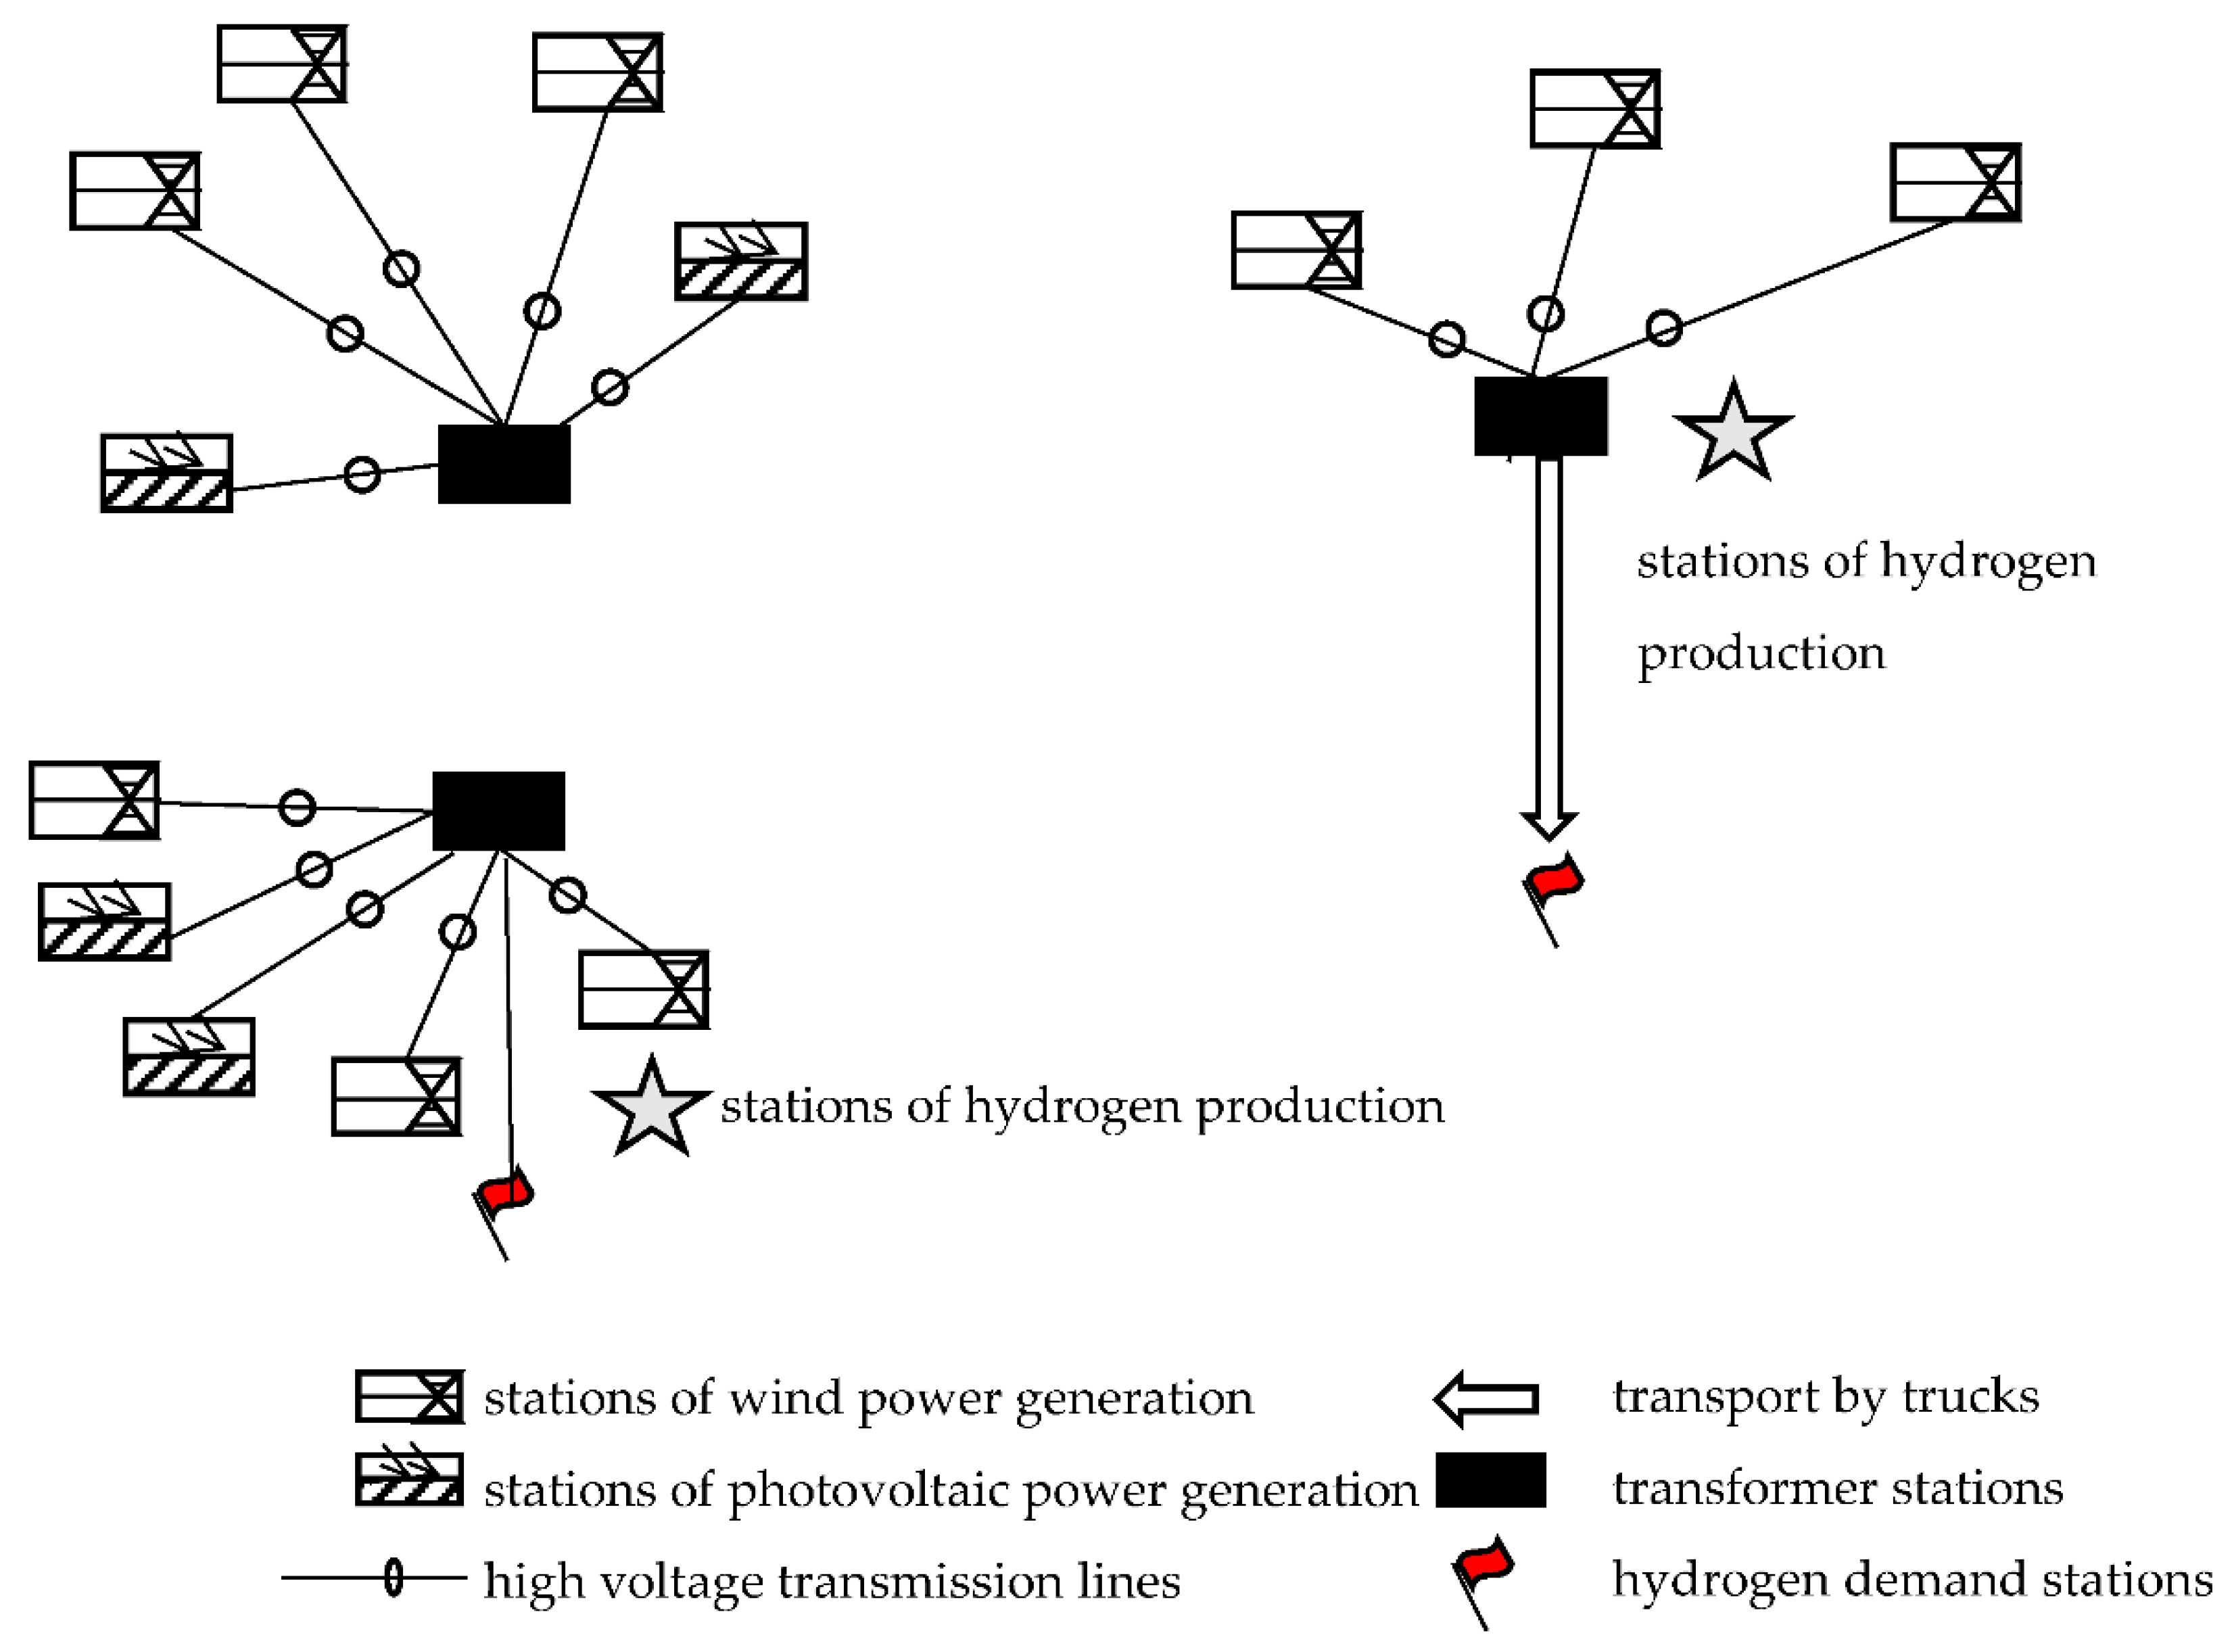
(2)
Stations of hydrogen production and hydrogen storage, modular structures, are more simple than normal structures. The startup cost of those stations is influenced by the environment, while the cost of construction, operation and maintenance is seldom influenced by location. Therefore, stations of hydrogen production and hydrogen storage located at the demand end better meet demand. Many of the existing hydrogen refueling stations produce hydrogen on-site, which reduces the cost of hydrogen storage and loss.
Figure 4 is a combination diagram of stations of hydrogen production and storage and transmission lines in Beijing and Shanxi when the amount of hydrogen demand is 500 m3/day from 2020 to 2025.
From 2020 to 2025, when the maximum demand amount of hydrogen in Beijing and Shanxi is 0.5 t/day, the hydrogen demand station in Beijing is located at the transformer stations in Ulanqab, which is relatively close to the hydrogen demand station, and the hydrogen production station in Shanxi is located at the hydrogen demand end. That result verifies the conclusion proposed by other scholars that the system of the direct power transport from the wind–hydrogen system is superior to the system that transports power from other places. However, in this paper, Beijing as a station of hydrogen demand does not build a hydrogen production station. That is because the startup cost of hydrogen production in Beijing is high because of its scarcity of land resources and high price level. However, when the demand amount of hydrogen in Beijing is 1 t/day, a station of hydrogen production will be built in Beijing.
From 2025 to 2050, taking the increase in the amount of hydrogen demand and the limitation of the effective capacity to hydrogen production, two stations of hydrogen production (the transformer station and the station of hydrogen demand in Ulanqab) are selected to transport hydrogen to Beijing. With the increase in demand in Shanxi, hydrogen production and storage stations are established at the hydrogen demand station and the transformer station in Baotou. The details are shown in Figure 5.
Based on the previous analysis, the hydrogen storage system for wind and photovoltaic power generation is useful and economical for places with a large amount of abandoned wind power and demand for hydrogen. In addition, the location of stations of hydrogen production and hydrogen storage will affect the cost of hydrogen. With the changes in hydrogen demand and the effective capacity of hydrogen production, priority will be given to the station of hydrogen production located at the transformer station which is close to the hydrogen demand station. When the amount of hydrogen demand is 1500 m3/day, Bayan Nur is not selected as a hydrogen production station for it is far away from other stations. Therefore, it only transmits power to transformer stations. Due to the high construction cost of new pipelines, there is little advantage to the hydrogen storage system for wind and photovoltaic power generation from Inner Mongolia to Beijing and Shanxi. This is a research topic for a future study on the economy of hydrogen transport by new pipelines in the hydrogen storage system for wind and photovoltaic power generation throughout the country.

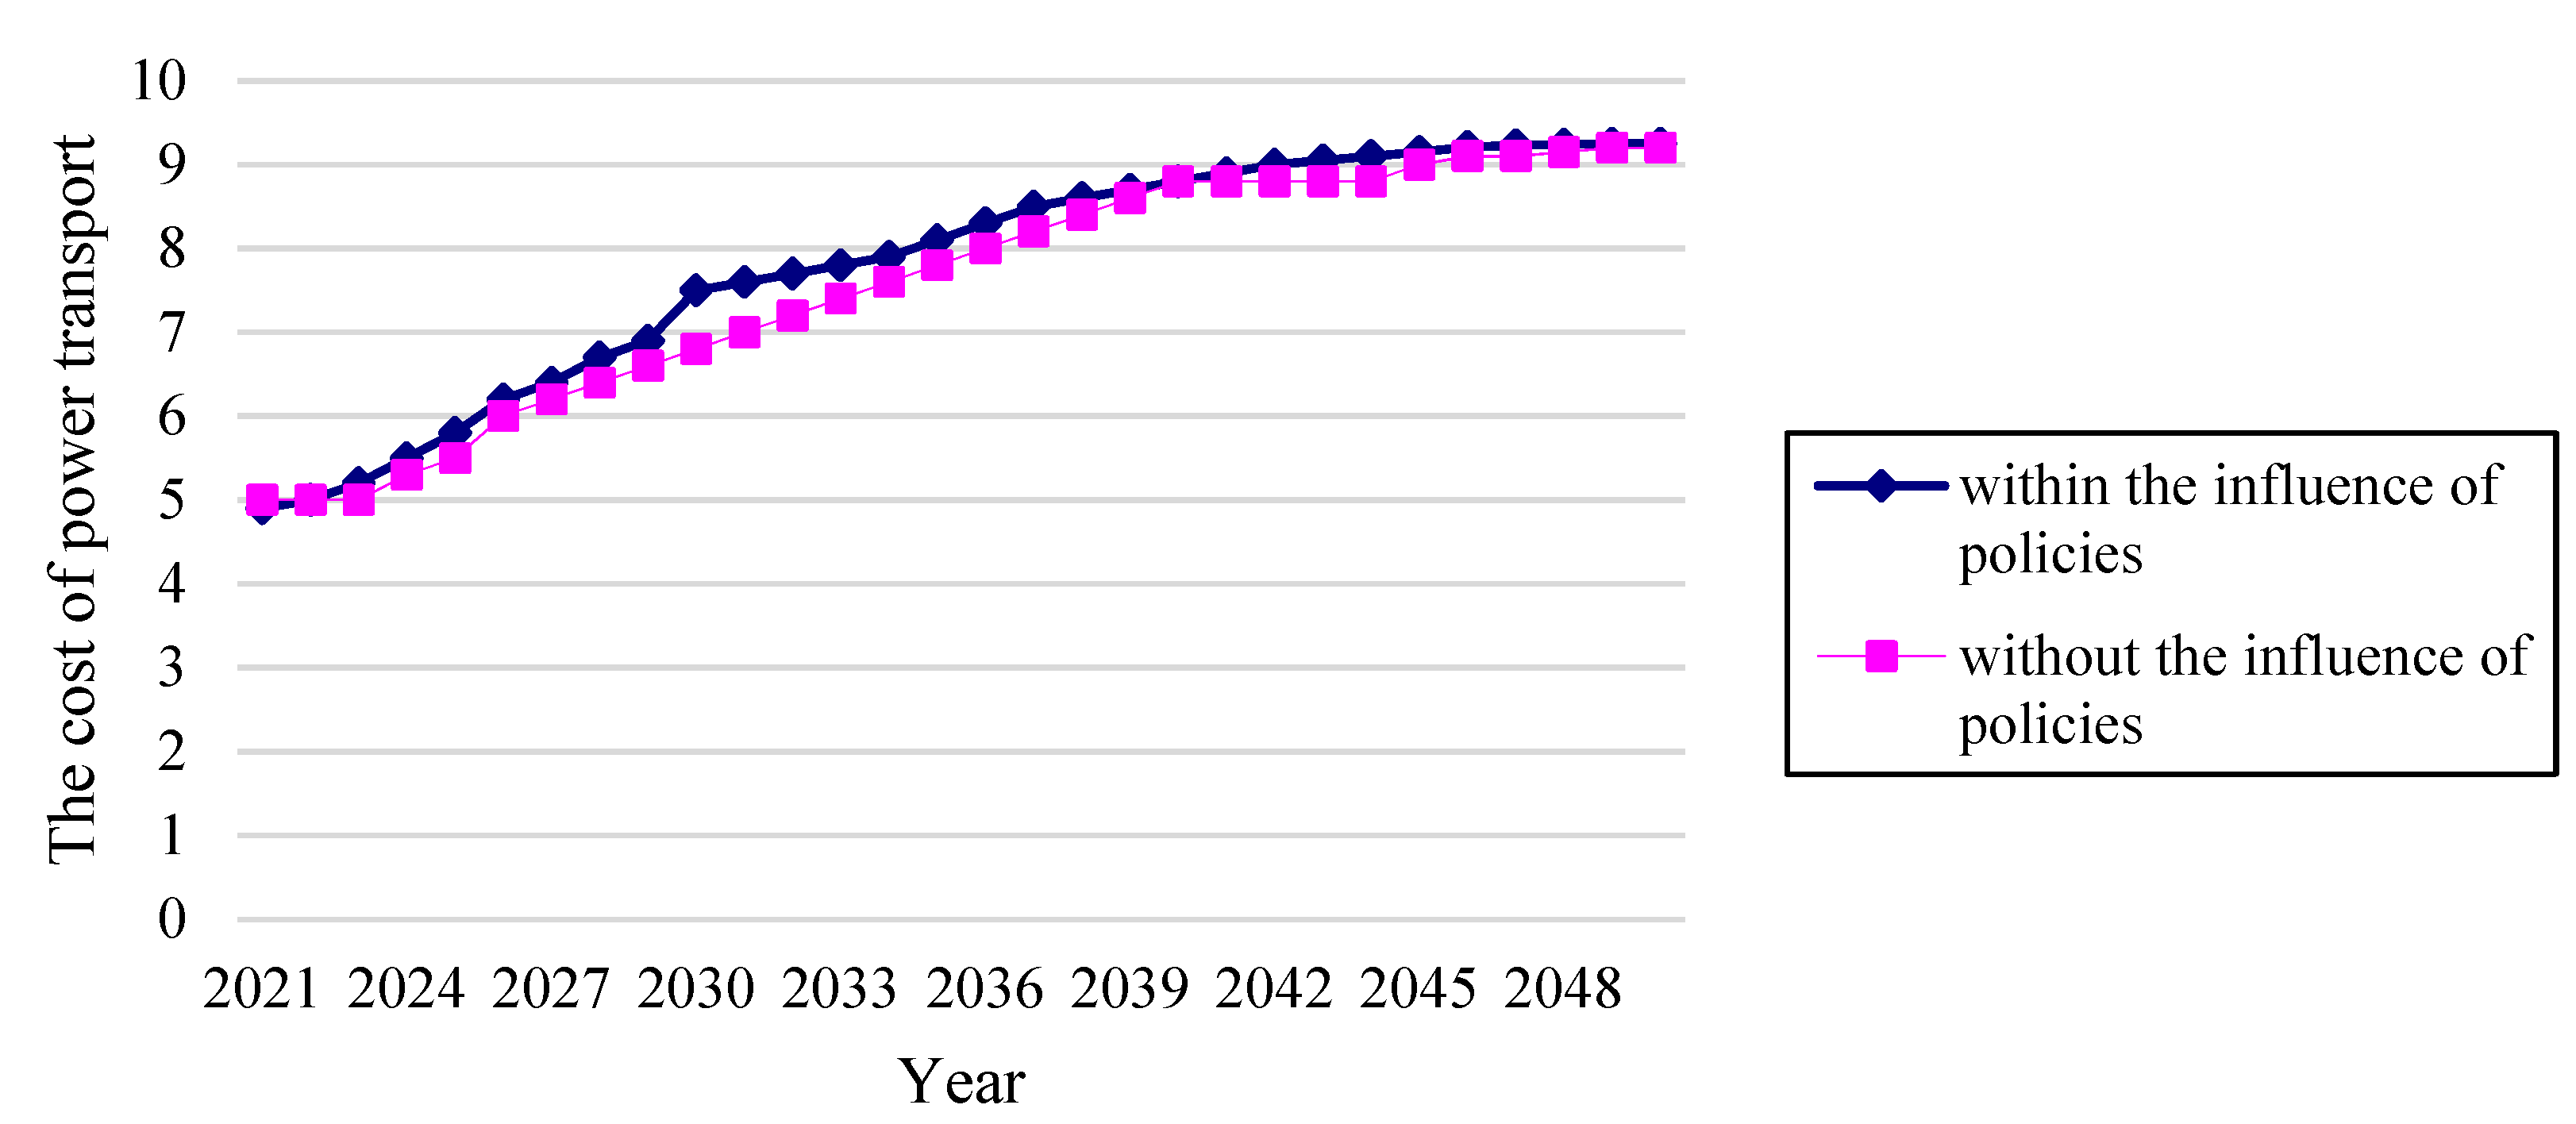
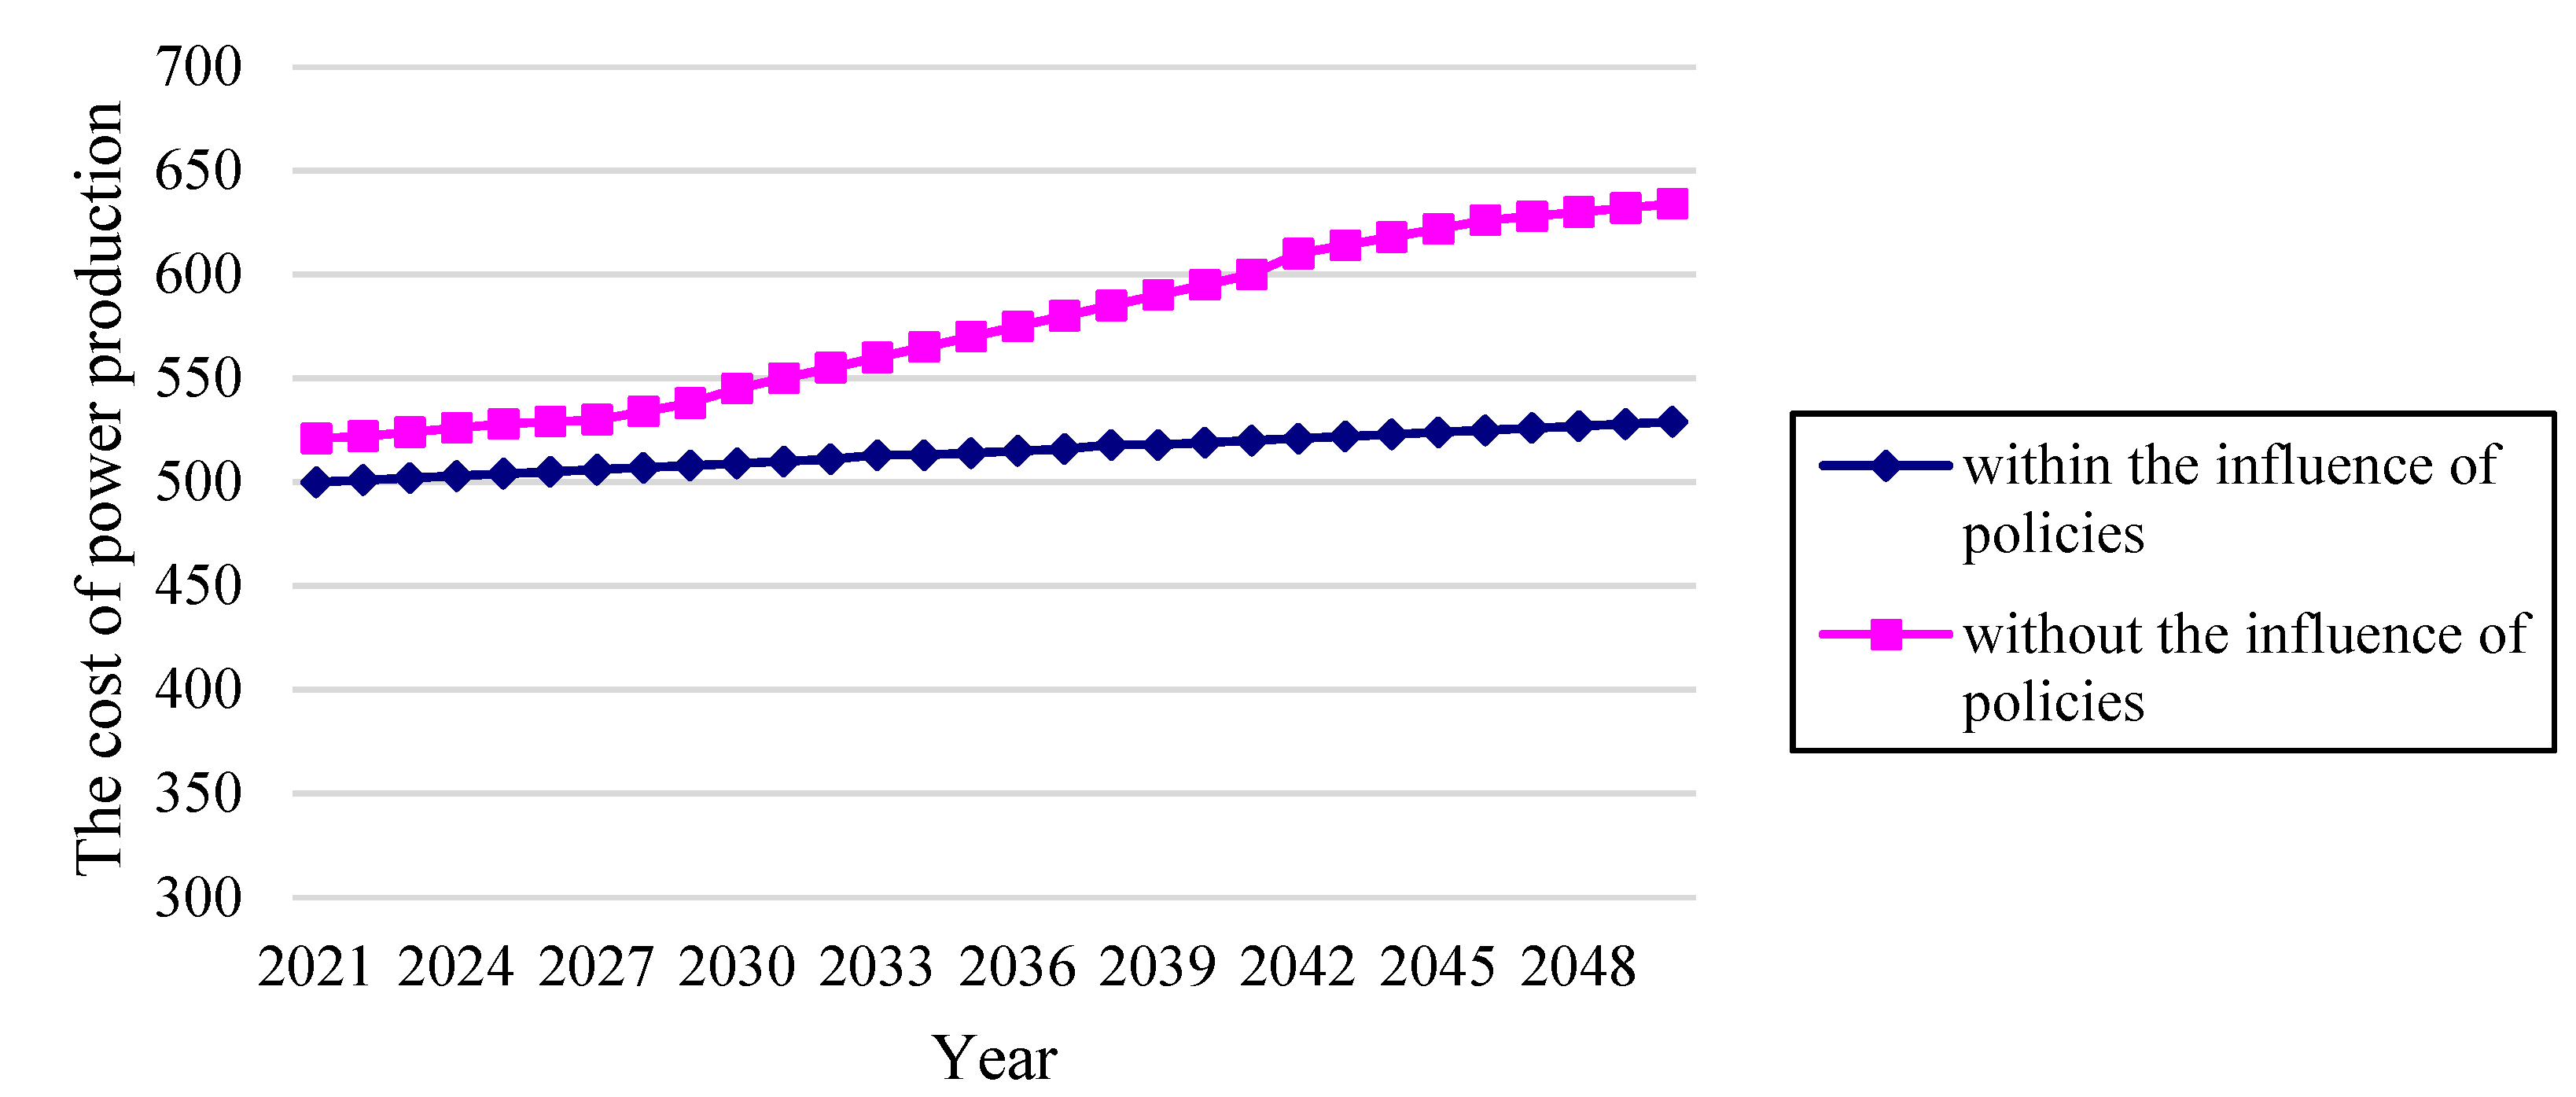
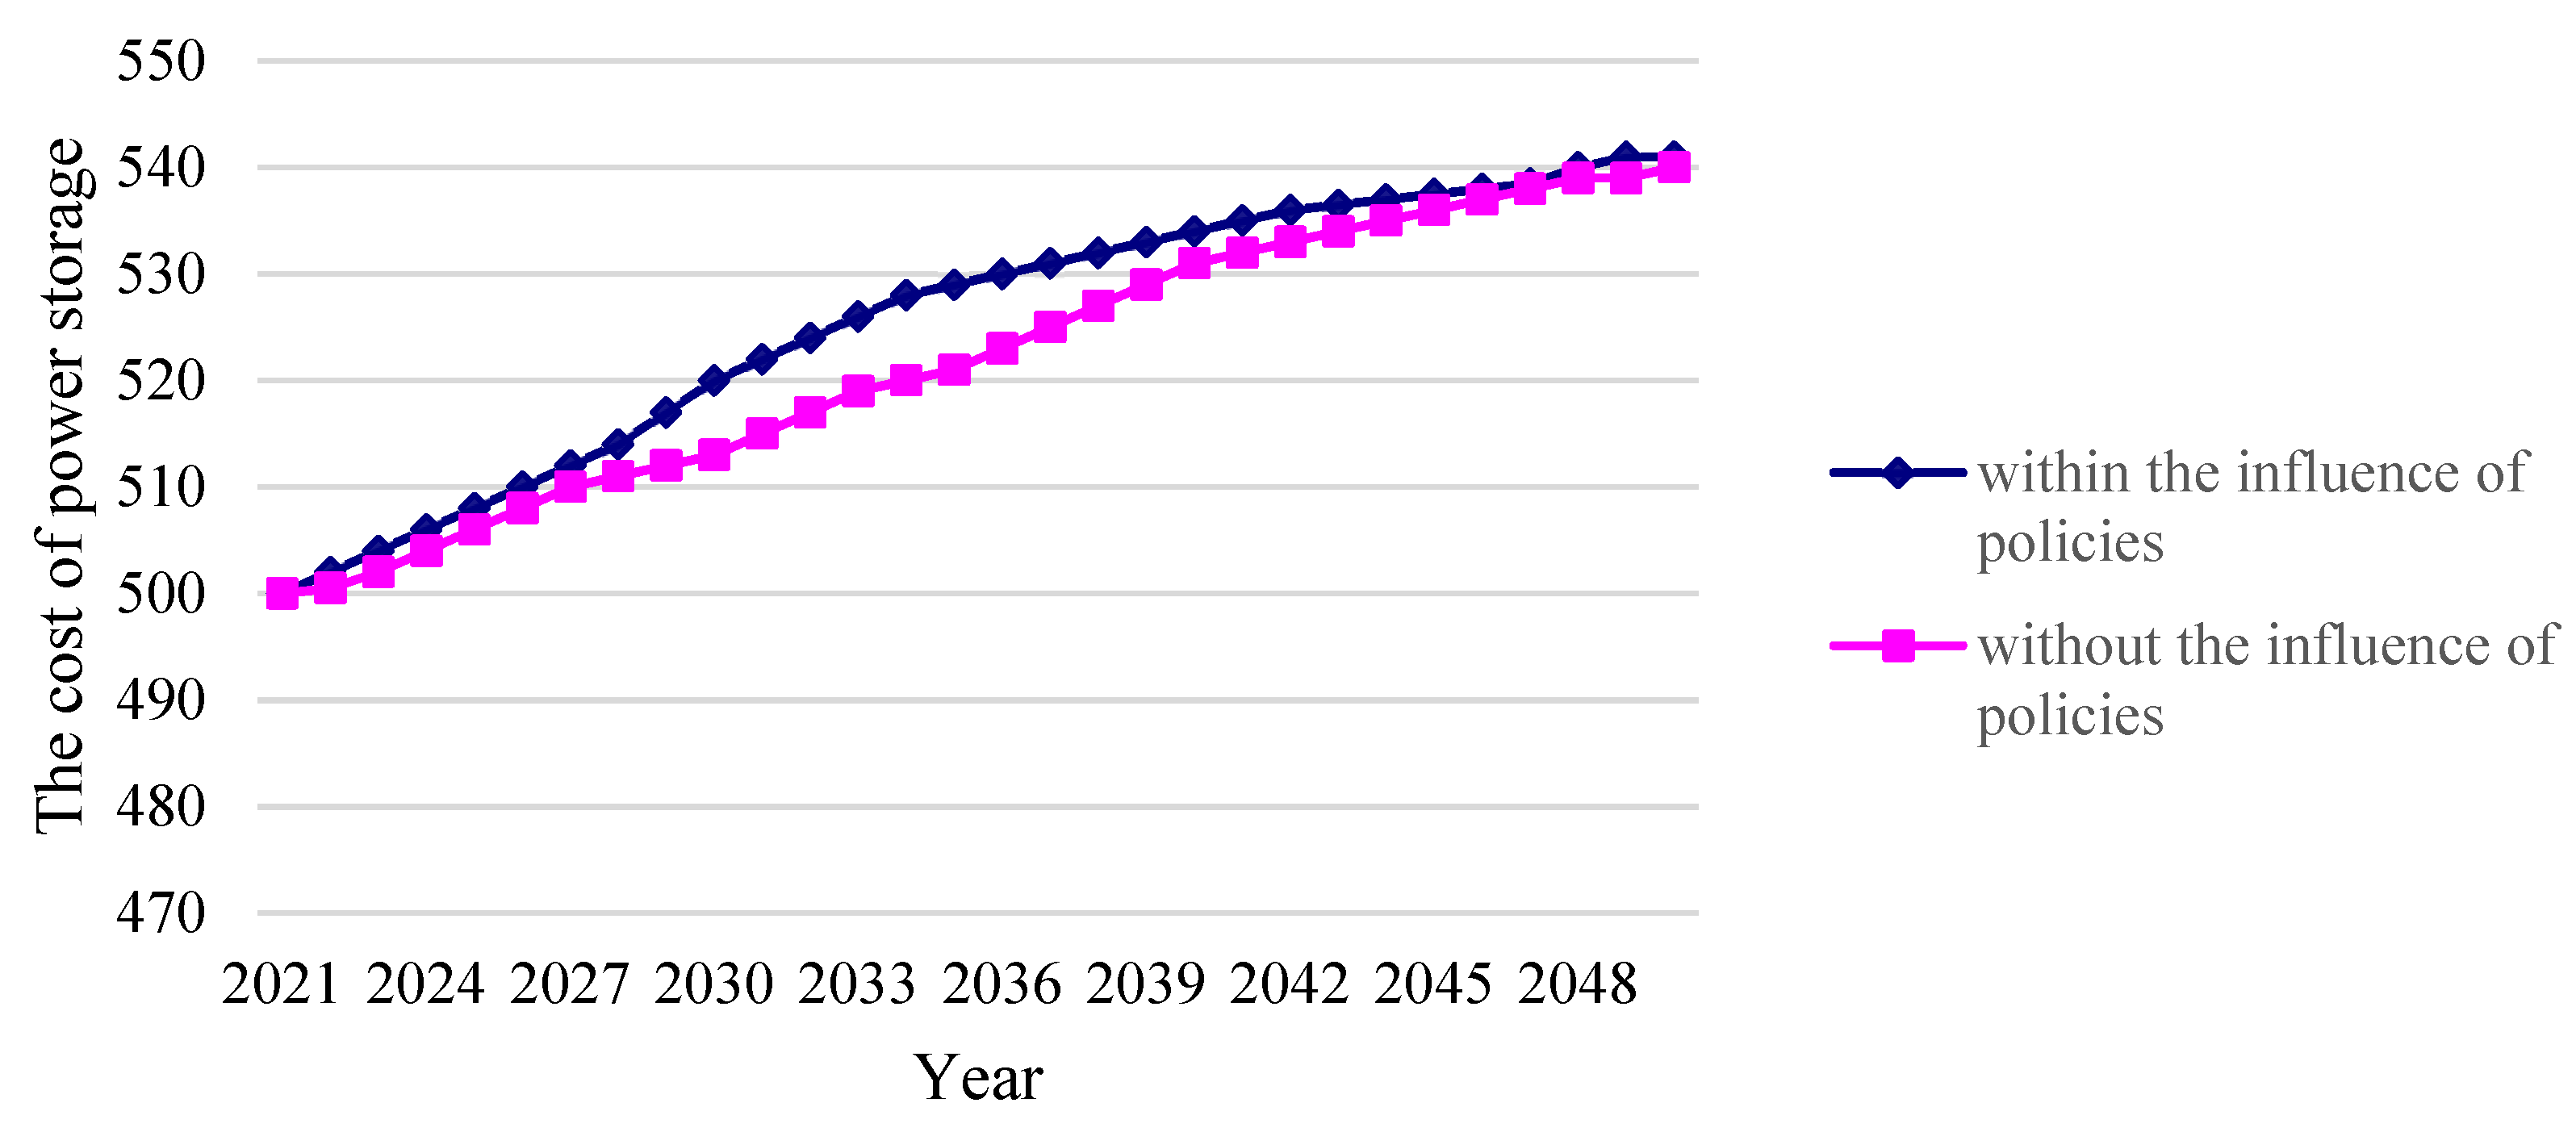
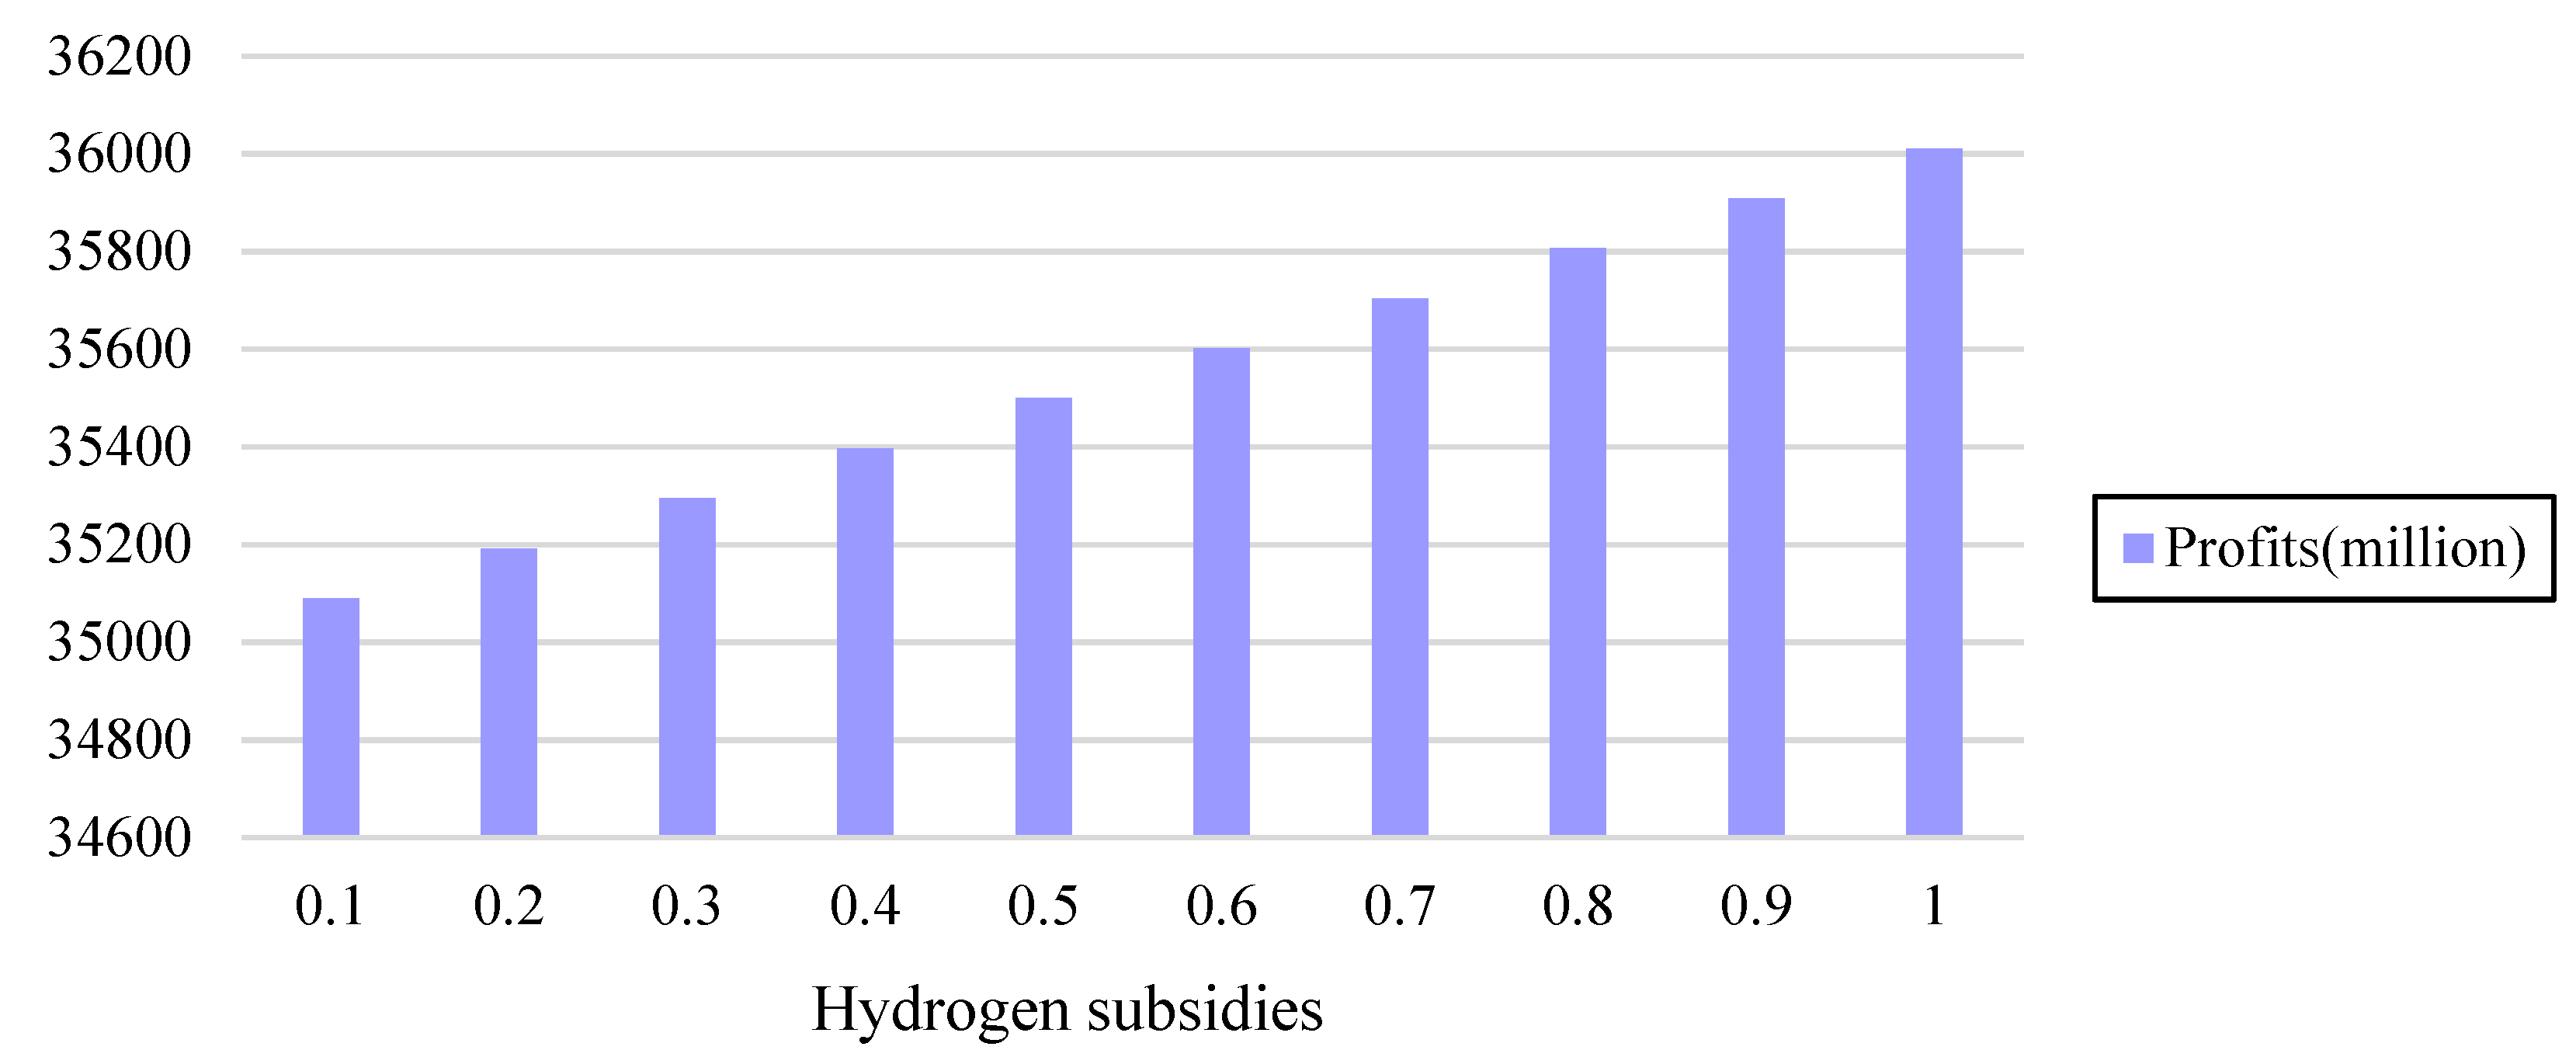
4.2.2. Analysis of Policy Influencing the Economy of the System

The hydrogen storage system for wind and photovoltaic power is environmentally friendly, which realizes the efficient use of clean energy. According to the prospect of new energy in various countries, China will vigorously develop hydrogen production from clean energy such as wind power and photovoltaic power in the future. The cost of the system within 30 years is compared with consideration of policy changes and without consideration of policy changes, thereby providing support for the implementation of policies.
In the cost of power generation, the unit cost of power generation and the amount of power generation (mainly affected by the amount of hydrogen demand) are greatly affected by the policy. The amount of demand is generally determined by market supply and demand, while the unit cost of power generation depends on the government’s subsidies. Figure 6 below shows the influence of policies on the unit cost of power generation by wind and photovoltaic power plants. Since 2019, China has decreased subsidies for wind and photovoltaic power plants. Due to the stability of power generation by photovoltaic power plants, places with rich wind and solar energy are encouraged to build photovoltaic power plants. Based on the previous analysis, the amount of photovoltaic power plants will increase from 2021 to 2030. Affected by the scale effect, the cost of power generation by wind and photovoltaic power plants will decrease and will stabilize after 2030.
The cost of power transport is not significantly affected by the policy. The cost of power transport by transformer stations and hydrogen production stations is affected by the amount of hydrogen demand which is affected by market supply and demand. Based on the Figure 7, it can be seen that the changes of policies do not affect the cost of power transport directly.
The cost of hydrogen production is greatly affected by national policies. In 2019, subsidies for hydrogen energy vehicles were canceled, while subsidies for hydrogen infrastructure were provided. Therefore, the hydrogen subsidies should be considered when setting the cost of hydrogen production. Figure 8 shows the little influence of the hydrogen production subsidy policy on the cost of hydrogen production in the early stage. However, the influence of subsidies on hydrogen production in the later period is prominent. It can be seen that the influence of subsidies on hydrogen energy infrastructure shows a certain lag. However, in the long run, the subsidies for hydrogen energy infrastructure will significantly reduce system costs.
The cost of hydrogen storage is influenced by the policy as shown in Figure 9. Hydrogen is explosive so no subsidies are offered for hydrogen storage. On this basis, the cost of hydrogen storage is higher. The cost of hydrogen storage in 2030–2040 is high due to the large amount of hydrogen production. In order to effectively allocate hydrogen, the number of hydrogen storage stations increases, the amount of hydrogen storage increases and the cost of hydrogen storage is high in 2030–2040.
Based on the above analysis, it can be concluded that costs of power generation and hydrogen production are mainly influenced by the degree of national support for hydrogen storage systems for wind and photovoltaic power generation. Therefore, for the cost of hydrogen production, the ratio of the abandoned power to hydrogen production should be increased, so as to reduce the cost of power generation. In addition, for hydrogen production, the degree of national support for hydrogen-related infrastructure should be increased, which is represented directly by the subsidies for hydrogen refueling stations. That is because the hydrogen subsidies for hydrogen influence the economy of the system.
Figure 10 explores the changes in profits in the system corresponding to the degree of national support for hydrogen subsidies. This paper takes the influence of different hydrogen subsidies (0.1–1 yuan/m3) on the economy of hydrogen storage systems for wind and photovoltaic power generation into consideration. Figure 10 shows that the different hydrogen subsidies change profits in the system. Therefore, when applying the hydrogen storage system for wind and photovoltaic power generation throughout the world in the future, the hydrogen subsidies should be increased. Nowadays, hydrogen refueling stations at the hydrogen demand end are always subsidized by China. Therefore, in future, more hydrogen subsidies should be offered to stations of hydrogen production and storage, which will make the system more economical.

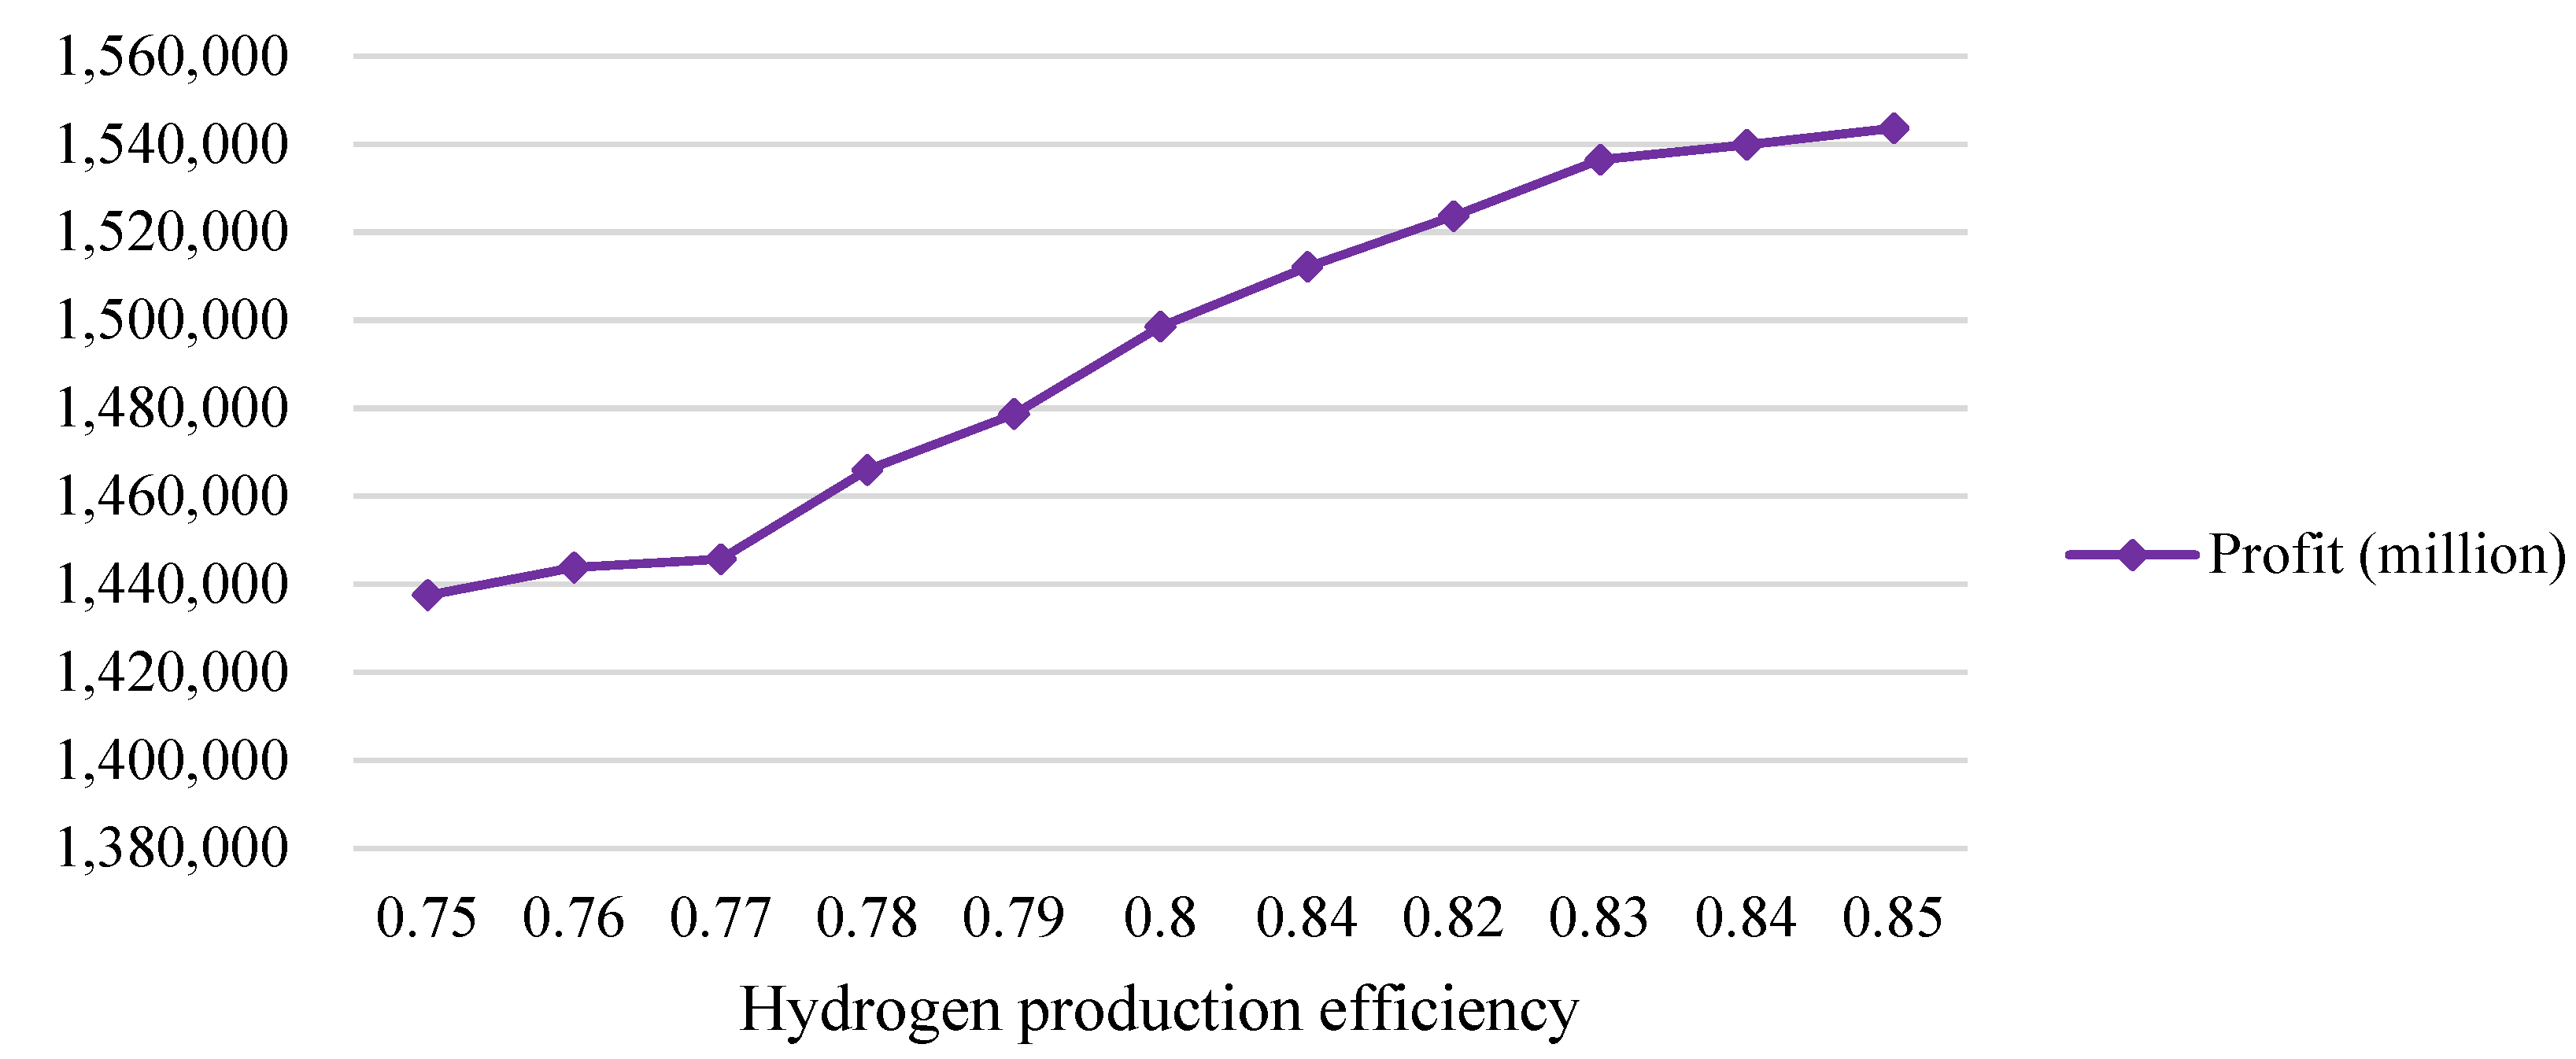
4.2.3. The Influence of Technological Progress on the Economy of the System

The progress of system technology is represented by replacing old technology with advanced technology, and producing products with higher efficiency and better output. Technological progress mainly affects technical parameters in the model, including hydrogen production efficiency of hydrogen production equipment, rated gas weight of trucks, rated power amount of transmission lines and loss of power transport. Technological progress will improve the efficiency of hydrogen production by using hydrogen storage systems for wind and photovoltaic power generation. Figure 11 below shows the influence of different hydrogen production efficiencies on profits.
The objective function of this paper is to maximize the profit which means the sale proceeds will be more or the cost will be less. The sale proceeds are influenced by the amount of hydrogen sold, which is constrained by the hydrogen market and output, and the price of hydrogen. The research on the amount of hydrogen demand should connect with the important nodes in the energy industry. In 2025, energy consumption in China will reach its peak; in 2030, carbon dioxide emissions in China will peak; and in 2050, the proportion of hydrogen production from renewable energy will account for 70%, which all show a vast market for hydrogen. Therefore, it is meaningful to study hydrogen.
It can be seen from Figure 11 that electrolysis efficiency between 78% and 84% significantly improves the economy of the system. Therefore, increasing the research and development efforts on the efficiency of hydrogen production will make the system more economical. In this regard, factor analysis of hydrogen production by electrolyzers should be carried out by relevant institutions and colleges; electrolyzers should be innovated and upgraded by electrolyzer manufacturers; and electrolyzer manufacturers should be encouraged to cooperate with others and supported by the government so as to improve the hydrogen production efficiency and effective production capacity.

5. Conclusions

In this paper, a multi-cycle model of optimizing the operation of hydrogen storage systems for wind and photovoltaic power generation is shown. Based on that model, a case study is given on Inner Mongolia with abandoned wind and photovoltaic power and Beijing and Shanxi province with high hydrogen demand to explore the influence of subsidy policy and technological progress on the economy of the system. Then, the following conclusions are drawn:
(1)
It is economical to build a hydrogen storage system for wind and photovoltaic power generation by using abandoned power, which not only solves the serious problem of power abandonment in wind and photovoltaic power plants, but also avoids the high cost of electrolysis of water. The profit by using a hydrogen storage system for wind and photovoltaic power generation is CNY 1.4 × 10¹⁰ in the next 30 years.
(2)
The amount of hydrogen demand affects the location of hydrogen production stations. The most economical solution is to build stations of hydrogen production on the hydrogen demand end. Under the constraints of hydrogen production capacity, the stations of hydrogen production will be located close to the hydrogen demand stations. It can be seen that the system of direct power transport is prior to the system of hydrogen transport from the transformer stations where hydrogen is produced.
(3)
The results of optimizing the multi-cycle operation are more reliable than that of single-cycle operation. The influence of policy and technological progress on costs and proceeds is considered in a multiple-cycle system. To be specific, policy mainly affects the costs of power generation, hydrogen production and hydrogen subsidies. In addition, in terms of technological progress, the efficiency of electrolyzers has an impact on the economy of the system.
Therefore, when the hydrogen storage system for wind and photovoltaic power generation is adopted commonly in the future, high-tech enterprises should update the electrolysis equipment and increase innovation subsidies. The government should also provide policy, and increase subsidies for the cost of power generation, hydrogen production and hydrogen sales.
However, this paper still has shortcomings. First of all, this paper does not consider the instability of the abandoned power from wind and photovoltaic power plants. Second, in the case study, only the energy dispatched from Inner Mongolia to the surrounding cities is studied, without consideration of optimization of operating the hydrogen storage system for wind and photovoltaic power generation throughout the country. Third, only sale proceeds and subsidies are involved to calculate the profit in 30 years without consideration of the influence of inflation. In the long term, the proceeds of depreciation, carbon emission reduction and reducing the startup of wind turbines all have an important impact on the economy of the system which should be considered in follow-up studies.

Author Contributions

Methodology, Supervision, Writing, Review and Editing, R.Y.; Investigation, Data Curation, Modeling and Experiment, Y.C.; Investigation and Supervision, X.Z. All authors have read and agreed to the published version of the manuscript.

Funding

This research was funded by the National Natural Science Foundation of China, grant number 71802021.

Institutional Review Board Statement

Not applicable.

Informed Consent Statement

Not applicable.

Data Availability Statement

Not applicable.

Conflicts of Interest

The authors declare no conflict of interest.

References

  1. Zheng, B.; Wang, S.; Xu, J. A Review on the CO2 Emission Reduction Scheme and Countermeasures in China’s Energy and Power Industry under the Background of Carbon Peak. Sustainability 2022, 14, 879. [Google Scholar] [CrossRef]
  2. Yasuda, Y.; Bird, L.; Carlini, E.M.; Eriksen, P.B.; Estanqueiro, A.; Flynn, D.; Fraile, D.; Lázaro, E.G.; Martín-Martínez, S.; Hayashi, D.; et al. C-E (curtailment—Energy share) map: An objective and quantitative measure to evaluate wind and solar curtailment. Renew. Sustain. Energy Rev. 2022, 160, 112212. [Google Scholar] [CrossRef]
  3. Moriarty, P.; Honnery, D. Intermittent renewable energy: The only future source of hydrogen? Int. J. Hydrogen Energy 2007, 32, 1616–1624. [Google Scholar] [CrossRef]
  4. Beccali, M.; Brunone, S.; Finocchiaro, P.; Galletto, J.M. Method for size optimisation of large wind–hydrogen systems with high penetration on power grids. Appl. Energy 2013, 102, 534–544. [Google Scholar] [CrossRef] [Green Version]
  5. Chi, J.; Yu, H. Water electrolysis based on renewable energy for hydrogen production. Chin. J. Catal. 2018, 39, 390–394. [Google Scholar] [CrossRef]
  6. Lebrouhi, B.E.; Djoupo, J.J.; Lamrani, B.; Benabdelaziz, K.; Kousksou, T. Global hydrogen development—A technological and geopolitical overview. Int. J. Hydrogen Energy 2022, 47, 7016–7048. [Google Scholar] [CrossRef]
  7. Zhou, Y.; Li, R.; Lv, Z.; Liu, J.; Zhou, H.; Xu, C. Green hydrogen: A promising way to the carbon-free society. Chin. J. Chem. Eng. 2022, 43, 2–13. [Google Scholar] [CrossRef]
  8. Wei, H.; Pan, T.; Zhu, M.; Tao, J. Structural Optimization of Compact Spherical Wind-Solar Hybrid Power System. J. Electr. Eng. Technol. 2021, 16, 2433–2446. [Google Scholar] [CrossRef]
  9. Liu, S.; You, H.; Liu, Y.; Feng, W.; Fu, S. Research on Optimal Control Strategy of Wind-Solar Hybrid System Based on Power Prediction. ISA Trans. 2022, 123, 179–187. [Google Scholar] [CrossRef]
  10. Li, J.; Chen, S.; Wu, Y.; Wang, Q.; Liu, X.; Qi, L.; Lu, X.; Gao, L. How to make better use of intermittent and variable energy? A review of wind and photovoltaic power consumption in China. Renew. Sustain. Energy Rev. 2020, 137, 110626. [Google Scholar] [CrossRef]
  11. Wenli, L. Research on Energy Storage and Hydrogen Production System of Offshore Wind-solar Hybrid Power Generation Based on 3D Finite Element Method. J. Phys. Conf. Ser. 2021, 2005, 012151. [Google Scholar] [CrossRef]
  12. Gao, D.; Jiang, D.; Liu, P.; Li, Z.; Hu, S.; Xu, H. An integrated energy storage system based on hydrogen storage: Process configuration and case studies with wind power. Energy 2014, 66, 332–341. [Google Scholar] [CrossRef]
  13. Sperstad, I.B.; Korpås, M. Energy Storage Scheduling in Distribution Systems Considering Wind and Photovoltaic Generation Uncertainties. Energies 2019, 12, 1231. [Google Scholar] [CrossRef] [Green Version]
  14. De, R.K.; Ganguly, A. Modeling and analysis of a solar thermal-photovoltaic-hydrogen-based hybrid power system for running a standalone cold storage. J. Clean. Prod. 2021, 293, 126202. [Google Scholar] [CrossRef]
  15. Zhou, J.; Wu, Y.; Zhong, Z.; Xu, C.; Ke, Y.; Gao, J. Modeling and configuration optimization of the natural gas-wind-photovoltaic-hydrogen integrated energy system: A novel deviation satisfaction strategy. Energy Convers. Manag. 2021, 243, 114340. [Google Scholar] [CrossRef]
  16. Allouhi, A. A novel grid-connected solar PV-thermal/wind integrated system for simultaneous electricity and heat generation in single family buildings. J. Clean. Prod. 2021, 320, 128518. [Google Scholar] [CrossRef]
  17. Macedo, S.F.; Peyerl, D. Prospects and economic feasibility analysis of wind and solar photovoltaic hybrid systems for hydrogen production and storage: A case study of the Brazilian electric power sector. Int. J. Hydrogen Energy 2022, 47, 10460–10473. [Google Scholar] [CrossRef]
  18. Fukaume, S.; Nagasaki, Y.; Tsuda, M. Stable power supply of an independent power source for a remote island using a Hybrid Energy Storage System composed of electric and hydrogen energy storage systems. Int. J. Hydrogen Energy 2022, 47, 13887–13899. [Google Scholar] [CrossRef]
  19. Simoes, J.P.; Simões, J.P.; Coelho, M.C.; Pires, V.F.; Martins, J.F. MATLAB/SIMULINK Based Teaching System for a Stand-Alone Energy System Supported by Totally Renewable Hydrogen Production. In Proceedings of the 2009 3rd IEEE International Conference on E-Learning in Industrial Electronics (ICELIE), Porto, Portugal, 3–5 November 2009; IEEE: Piscataway, NJ, USA, 2009; pp. 86–91. [Google Scholar]
  20. Sorgulu, F.; Dincer, I. A renewable source based hydrogen energy system for residential applications. Int. J. Hydrogen Energy 2018, 43, 5842–5851. [Google Scholar] [CrossRef]
  21. Ozcan, H.; Dincer, I. Energy and exergy analyses of a solar based hydrogen production and compression system. Int. J. Hydrogen Energy 2017, 42, 21414–21428. [Google Scholar] [CrossRef]
  22. Khosravi, A.; Koury, R.N.N.; Machado, L.; Pabon, J.J.G. Energy, exergy and economic analysis of a hybrid renewable energy with hydrogen storage system. Energy 2018, 148, 1087–1102. [Google Scholar] [CrossRef]
  23. Rahil, A.; Gammon, R.; Brown, N. Techno-economic assessment of dispatchable hydrogen production by multiple electrolysers in Libya. J. Energy Storage 2018, 16, 46–60. [Google Scholar] [CrossRef]
  24. Dursun, E.; Acarkan, B.; Kilic, O. Modeling of hydrogen production with a stand-alone renewable hybrid power system. Int. J. Hydrogen Energy 2012, 37, 3098–3107. [Google Scholar] [CrossRef]
  25. Wu, D.; Wang, D.; Ramachandran, T.; Holladay, J. A techno-economic assessment framework for hydrogen energy storage toward multiple energy delivery pathways and grid services. Energy 2022, 249, 123638. [Google Scholar] [CrossRef]
  26. Norouzi, N. Hydrogen production in the light of sustainability: A comparative study on the hydrogen production technologies using the sustainability index assessment method. Nucl. Eng. Technol. 2022, 54, 1288–1294. [Google Scholar] [CrossRef]
  27. Khalilnejad, A.; Riahy, G.H. A hybrid wind-PV system performance investigation for the purpose of maximum hydrogen production and storage using advanced alkaline electrolyzer. Energy Convers. Manag. 2014, 80, 398–406. [Google Scholar] [CrossRef]
  28. Yang, Q.; Chu, G.; Zhang, L.; Zhang, D.; Yu, J. Pathways toward carbon-neutral coal to ethylene glycol processes by integrating with different renewable energy-based hydrogen production technologies. Energy Convers. Manag. 2022, 258, 115529. [Google Scholar] [CrossRef]
  29. Jang, D.; Kim, J.; Kim, D.; Han, W.-B.; Kang, S. Techno-economic analysis and Monte Carlo simulation of green hydrogen production technology through various water electrolysis technologies. Energy Convers. Manag. 2022, 258, 115499. [Google Scholar] [CrossRef]
  30. Zhang, F.; Zhao, P.; Niu, M.; Maddy, J. The survey of key technologies in hydrogen energy storage. Int. J. Hydrogen Energy 2016, 41, 14535–14552. [Google Scholar] [CrossRef]
  31. Yang, C.; Ogden, J.M. Determining the lowest-cost hydrogen delivery mode. Int. J. Hydrogen Energy 2007, 32, 268–286. [Google Scholar] [CrossRef] [Green Version]
  32. Nazir, H.; Muthuswamy, N.; Louis, C.; Jose, S.; Prakash, J.; Buan, M.E.; Flox, C.; Chavan, S.; Shi, X.; Kauranen, P.; et al. Is the H2 economy realizable in the foreseeable future? Part II: H2 storage, transportation, and distribution. Int. J. Hydrogen Energy 2020, 45, 20693–20708. [Google Scholar] [CrossRef]
  33. Timmerberg, S.; Kaltschmitt, M. Hydrogen from renewables: Supply from North Africa to Central Europe as blend in existing pipelines—Potentials and costs. Appl. Energy 2019, 237, 795–809. [Google Scholar] [CrossRef]
  34. Deymi-Dashtebayaz, M.; Ebrahimi-Moghadam, A.; Pishbin, S.I.; Pourramezan, M. Investigating the effect of hydrogen injection on natural gas thermo-physical properties with various compositions. Energy 2018, 167, 235–245. [Google Scholar] [CrossRef]
  35. Ratnakar, R.R.; Gupta, N.; Zhang, K.; van Doorne, C.; Balakotaiah, V. Hydrogen supply chain and challenges in large-scale LH2 storage and transportation. Int. J. Hydrogen Energy 2021, 46, 24149–24168. [Google Scholar] [CrossRef]
  36. HassanzadehFard, H.; Tooryan, F.; Collins, E.R.; Jin, S.; Ramezani, B. Design and optimum energy management of a hybrid renewable energy system based on efficient various hydrogen production. Int. J. Hydrogen Energy 2020, 45, 30113–30128. [Google Scholar] [CrossRef]
  37. Fan, X.-C.; Wang, W.-Q.; Shi, R.-J.; Cheng, Z.-J. Hybrid pluripotent coupling system with wind and photovoltaic-hydrogen energy storage and the coal chemical industry in Hami, Xinjiang. Renew. Sustain. Energy Rev. 2017, 72, 950–960. [Google Scholar] [CrossRef]
  38. Ding, L.; Gao, J.; Shi, G.; Ni, Z. Robust optimal dispatch of integrated energy system considering with coupled wind and hydrogen system. J. Phys. Conf. Ser. 2022, 2215, 012001. [Google Scholar] [CrossRef]
  39. Zhao, L.; Brouwer, J. Dynamic operation and feasibility study of a self-sustainable hydrogen fueling station using renewable energy sources. Int. J. Hydrogen Energy 2015, 40, 3822–3837. [Google Scholar] [CrossRef] [Green Version]
  40. Trifkovic, M.; Sheikhzadeh, M.; Nigim, K.; Daoutidis, P. Modeling and Control of a Renewable Hybrid Energy System with Hydrogen Storage. IEEE Trans. Control Syst. Technol. 2014, 22, 169–179. [Google Scholar] [CrossRef]
  41. Yang, G.; Jiang, Y.; You, S. Planning and operation of a hydrogen supply chain network based on the off-grid wind-hydrogen coupling system. Int. J. Hydrogen Energy 2020, 45, 20721–20739. [Google Scholar] [CrossRef]
  42. Lahnaoui, A.; Wulf, C.; Heinrichs, H.; Dalmazzone, D. Optimizing hydrogen transportation system for mobility by minimizing the cost of transportation via compressed gas truck in North Rhine-Westphalia. Appl. Energy 2018, 223, 317–328. [Google Scholar] [CrossRef]
  43. McPherson, M.; Johnson, N.; Strubegger, M. The role of electricity storage and hydrogen technologies in enabling global low-carbon energy transitions. Appl. Energy 2018, 216, 649–661. [Google Scholar] [CrossRef]
  44. Torreglosa, J.P.; García, P.; Fernández, L.M.; Jurado, F. Energy dispatching based on predictive controller of an off-grid wind turbine/photovoltaic/hydrogen/battery hybrid system. Renew. Energy 2015, 74, 326–336. [Google Scholar] [CrossRef]
  45. Khalid, F.; Dincer, I.; Rosen, M.A. Analysis and assessment of an integrated hydrogen energy system. Int. J. Hydrogen Energy 2016, 41, 7960–7967. [Google Scholar] [CrossRef]
  46. Won, W.; Kwon, H.; Han, J.-H.; Kim, J. Design and operation of renewable energy sources based hydrogen supply system: Technology integration and optimization. Renew. Energy 2017, 103, 226–238. [Google Scholar] [CrossRef]
  47. Shi, J.-L.; Gao, H.; Wang, H.-F. Economic Analysis of Hydrogen Production from Wind Power. J. Clean Energy Technol. 2015, 37, 11–14. [Google Scholar] [CrossRef]
Figure 1. Diagram of hydrogen storage of wind and photovoltaic power generation.
Energies 15 05015 g001
Figure 2. Amount of abandoning wind and photovoltaic power in various regions of Inner Mongolia in 2017.
Energies 15 05015 g002
Figure 3. The hydrogen storage system for wind–solar power generation in Inner Mongolia.
Energies 15 05015 g003
Figure 4. A combination diagram of stations of hydrogen production and storage and transmission lines in Beijing and Shanxi when the amount of hydrogen demand is 500 m3/day.
Energies 15 05015 g004
Figure 5. A combination diagram of stations of hydrogen production and storage when the amount of hydrogen demand is 1500 m3/day.
Energies 15 05015 g005
Figure 6. Influence of policies on the cost of power generation (CNY 10,000).
Energies 15 05015 g006
Figure 7. Influence of policies on the cost of power transport (CNY 10,000).
Energies 15 05015 g007
Figure 8. Influence of policies on the cost of power production (CNY 10,000).
Energies 15 05015 g008
Figure 9. Influence of policies on the cost of power storage (CNY 10,000).
Energies 15 05015 g009
Figure 10. Influence of hydrogen subsidies on profits.
Energies 15 05015 g010
Figure 11. Influence of electrolysis efficiency on system economy.
Energies 15 05015 g011
Table 1. Subscript parameter symbols and descriptions used in the model.
SymbolsDescriptions
m Symbols of transformer stations
n Symbols of natural gas stations
i Symbols of stations of wind power generation
j Symbols of stations of photovoltaic power generation
k Symbols of hydrogen demand stations
l Symbols of all the nodes
t Symbols of decision-making cycles
Table 2. A collection of symbols and descriptions used in the model.
SymbolsDescriptions
V I m A collection of symbols which represents stations of wind power generation to transformer station m
V J m A collection of symbols which represents stations of photovoltaic power generation to transformer station m
V T S A collection of symbols which represents transformer stations
V N G A collection of symbols which represents natural gas stations
V P W A collection of symbols which represents stations of wind power generation
V P P A collection of symbols which represents stations of photovoltaic power generation
V H D A collection of symbols which represents hydrogen demand stations
V A collection of symbols which represents all the nodes, V = V T S V N G V W P V P P V H D
T A collection of symbols which represents all the decision-making cycles
Table 3. Symbols and descriptions of technical parameters used in the model.
SymbolsDescriptions
g w i t During the cycle t , the amount of abandoned wind power in the station i of wind power generation, i V P W , t T
g p j t During the cycle t, the amount of abandoned solar power in the station j of photovoltaic power generation, j V P P , t T
G E W i Power generating efficiency of the station i of wind power generation, iVPW
G E P j Power generating efficiency of the station j of photovoltaic power generation, j V P P
G H P l l t During the cycle t , the rated power amount of transmission lines from node l to node l , l , l V , t T
G T E l l t During the cycle t , the rated gas number of pipelines from node to node l , l , l V , t T
G T T The rated weight of trucks to transport gas
d e l l The distance of transmission lines from node l to node l , l , l V
d g l l The distance of pipelines from node l to node l , l , l V
d g n n The original distance of pipelines from node l to node l , n , n V N G
d t l l The original distance of pipelines from node l to node l , l , l V
L E l l The loss rate per unit of transmission lines from node l to node l , l , l V
L G l l The loss rate per unit of pipelines from node l to node l , l , l V
L T l l The loss rate per unit of trucks from node l to node l , l , l V
G T E l l The maximum amount of transmission lines from node l to node l , l , l V
G T G l l The maximum number of pipelines from node l to node, l , l V
R G l l The ratio interval of hydrogen to natural gas in the pipeline from node l to node l , l , l V
G G H l t During the cycle t , the efficiency of hydrogen production at node l which is the hydrogen production station, l V , t T
S m i n k t During the cycle t , the minimum demand amount of hydrogen demand station k , k V H D , t T
S m a x k t During the cycle t , the maximum demand amount of hydrogen demand station k , k V H D , t T
S L The mandatory scrap life of trucks
T Y The maximum working life of trucks
Table 4. Symbols and descriptions of cost parameter used in the model.
SymbolsDescriptions
C P W i The cost per unit of power generation in the station i of wind power generation, i V P W
C P P j The cost per unit of power generation in the station j of photovoltaic power generation, j V P P
C P S l t During the cycle t , the startup cost of the node l which is the hydrogen production station, l V , t T
C R S l t During the cycle t , the startup cost of the node which is the hydrogen storage station, l V , t T
C P U l t During the cycle t , the construction cost of the unit output by the node l which is the hydrogen production station, l V , t T
C R U l t During the cycle t , the construction cost of the unit output by the node l which is the hydrogen storage station, l V , t T
C G U l t During the cycle t , the unit cost of hydrogen production by the node l which is the hydrogen production station, l V , t T
C S U l t During the cycle t , the unit cost of hydrogen storage by the node l which is the hydrogen storage station, l V , t T
C G M U l t During the cycle t , the unit maintenance cost of the node l which is the hydrogen production station, l V , t T
C S M U l t During the cycle t , the unit maintenance cost of the node l as the hydrogen storage station, l V , t T
C C E l l t During the cycle t , the construction cost per unit length of transmission lines from node l to node l , l , l V , t T
C C G l l t During the cycle t , the construction cost per unit length of pipelines from node l to node l , l , l V , t T
C M E l l t During the cycle t , the maintenance cost per unit length of transmission lines from node l to node l , l , l V , t T
C M G l l t During the cycle t , the maintenance cost per unit length of pipelines from node l to node l , l , l V , t T
C L U l l t During the cycle t , the cost per unit length of upgrading pipelines from node l to node l , l , l V , t T
C S M n t During the cycle t , the unit cost of mixing hydrogen with natural gas at natural gas station n , nVNG, t T
C S E n t During the cycle t , the unit cost of separating hydrogen from natural gas at natural gas station n , n V N G , t T
C T C l t During the cycle t , the cost of compressing hydrogen at node l , l V , t T
C T P t During the cycle t , the unit cost of buying trucks, t T
C T M t During the cycle t , the maintenance cost per unit distance of trucks, t T
C T D l l t During the cycle t , the unit cost of transport by trucks, l , l V , t T
C U G n n t During the cycle t , the unit cost of upgrading original pipelines from node l to node l , n , n V N G , t T
p s t During the cycle t , the exit price of hydrogen, t T
p b t During the cycle t , the subsidized price of hydrogen, t T
p w t During the cycle t , the subsidized price of wind power generation, t T
p p t During the cycle t , the subsidized price of photovoltaic power generation, t T
p n t During the cycle t , the exit price of natural gas, t T
r Discount rate
e t The power price
Table 5. Symbols and descriptions of decision variables used in the model.
SymbolsDescriptions
B P l t During the cycle t , whether to select node l as the hydrogen production station, l V , t T
B S l t During the cycle t , whether to select node l as the hydrogen storage station, l V , t T
B E l l t During the cycle t , constructing the transmission lines from node l to node l , l , l V , t T
B G l l t During the cycle t , constructing the pipelines from node l to node l , l , l V , t T
B U n n t During the cycle t , upgrading original pipelines from node l to node l , n , n V N G , t T
x i t During the cycle t , the amount of power which is generated for hydrogen production in the station i of wind power generation, i V P W , t T
y j t During the cycle t , the amount of power which is generated for hydrogen production in the station j of photovoltaic power generation, j V P P , t T
Q P M l t During the cycle t , the effective capacity of hydrogen production equipment at node l , nVNG, t T
Q S M l t During the cycle t , the effective capacity of hydrogen storage equipment at node l , l V , t T
u l t During the cycle t , the amount of hydrogen production at node l , l V , t T
v l t During the cycle t , the amount of hydrogen storage at node l , l V , t T
g k t During the cycle t , the amount of hydrogen consumption at node k, k V H D , t T
w l l t During the cycle t , the amount of power transport from node l to node l , l , l V , t T
z l l l t During the cycle t , the hydrogen amount transported by pipelines from node l to node l , l , l V , t T
z l n n t During the cycle t , the hydrogen amount transported by upgraded pipelines from node l to node l , n , n V N G , t T
z t l l t During the cycle t , the hydrogen amount transported by trucks from node l to node l , l , l V , t T
q t During the cycle t , the amount of buying new trucks, t T
f u t During the cycle t , the frequency of operating trucks from node l to node l , l , l V , t T
h τ The number of scrapped trucks
l Symbols of all the nodes
tSymbols of decision-making cycles
Table 6. The values of symbols of the model.
SymbolsValuesSymbolsValues
C C E l l t 155 (yuan/km) G E P j 0.6
C L U l l t 5000 (yuan) L T l l 0.0015
C S E n t 0.3 (yuan) L G l l 0.05
C S M n t 0.2 (yuan) L E l l 0.025
C T C l t 0.65 (yuan/kg) r 0.1
C T D l l t 3000 (yuan/km) p n t 1.66 (yuan)
G T T 400 (kg) R G l l 0.1
G T E l l t 313,390,000 (kg) S m i n k t 450 (kg)
G T G l l 400 (kg) S m a x k t 15,000 (kg)
G G H l t 0.75 S L 10 (year)
G E W i 0.75 T Y 8 (year)
Table 7. Proceeds and costs of this model (yuan).
Sale ProceedsSubsidizesCost of Power GenerationCost of Power Transport
1,747,34218,811,940,0004,347,079,00011,455,000
Cost of Hydrogen ProductionCost of Hydrogen StorageCost of Transport by PipelinesCost of Transport by Trucks
10,695,53032,307,1301,922,03535,353,970
Table 8. Cost changes under different hydrogen demands.
The Demand Amount of Hydrogen (m3/day)Demand StationThe Location of the Hydrogen Production StationThe Cost of Transport by Trucks (Million)The Cost of Hydrogen Transport (Million)The Total Cost (Million)
500K1M3176.50347
K2K20111.3226
1000K1M3, K1346.890.65589
K2K20129.64308
1500K1M2, M3, K1478.660.65641
K2M1, M2, K2362.384.64538
Publisher’s Note: MDPI stays neutral with regard to jurisdictional claims in published maps and institutional affiliations.

