Article

Design of Container Ship Main Engine Waste Heat Recovery Supercritical CO2 Cycles, Optimum Cycle Selection through Thermo-Economic Optimization with Genetic Algorithm and Its Exergo-Economic and Exergo-Environmental Analysis

by
Athanasios G. Vallis
1,
Theodoros C. Zannis
2,*,
Evangelos V. Hristoforou
3,
Elias A. Yfantis
4,
Efthimios G. Pariotis
2,
Dimitrios T. Hountalas
5 and
John S. Katsanis
2
1
Hellenic Navy Fleet, Hellenic Navy, Salamis Naval Base, 18900 Salamis, Greece
2
Naval Architecture and Marine Engineering Section, Hellenic Naval Academy, End of Hatzikiriakou Ave., 18539 Piraeus, Greece
3
Laboratory of Electronic Sensors, School of Electrical and Computer Engineering, National Technical University of Athens, 15780 Athens, Greece
4
Marine and Offshore Science, Technology, and Engineering Centre, Cyprus Marine and Maritime Institute, P.O. Box 40930, Larnaca 6023, Cyprus
5
Internal Combustion Engines Laboratory, School of Mechanical Engineering, Thermal Engineering Section, National Technical University of Athens, 15780 Athens, Greece
*
Author to whom correspondence should be addressed.
Energies 2022, 15(15), 5398; https://doi.org/10.3390/en15155398
Submission received: 29 April 2022 / Revised: 15 July 2022 / Accepted: 20 July 2022 / Published: 26 July 2022
(This article belongs to the Special Issue Energy-Saving and Carbon-Neutral Technologies for Maritime Transport)

Abstract

:
In the present study, energy and exergy analyses of a simple supercritical, a split supercritical and a cascade supercritical CO2 cycle are conducted. The bottoming cycles are coupled with the main two-stroke diesel engine of a 6800 TEU container ship. An economic analysis is carried out to calculate the total capital cost of these installations. The functional parameters of these cycles are optimized to minimize the electricity production cost (EPC) using a genetic algorithm. Exergo-economic and exergo-environmental analyses are conducted to calculate the cost of the exergetic streams and various exergo-environmental parameters. A parametric analysis is performed for the optimum bottoming cycle to investigate the impact of ambient conditions on the energetic, exergetic, exergo-economic and exergo-environmental key performance indicators. The theoretical results of the integrated analysis showed that the installation and operation of a waste heat recovery optimized split supercritical CO2 cycle in a 6800 TEU container ship can generate almost 2 MW of additional electric power with a thermal efficiency of 14%, leading to high fuel and CO2 emission savings from auxiliary diesel generators and contributing to economically viable shipping decarbonization.

1. Introduction

Maritime transport is the leader of international trade because around 80% (by volume) of global trade takes place by sea [1]. International shipping is also responsible for around 796 million tons of CO2 emissions, i.e., 2.2% of total greenhouse gas emissions, according to the 3rd International Maritime Organization (IMO) Greenhouse Gases (GHG) Study [2]. Based on the same study, growing energy demands and general economic development all over the world will lead to an enormous increase in CO2 emissions, i.e., from 50% to 250% by 2050. This would then constitute 12% to 18% of the total allowable CO2 emissions. In 2011, the IMO decided to adopt, at the 62nd Meeting of the Marine Environment Protection Committee (MEPC), new mandatory measures to make ships more energy efficient. These measures were the Energy Efficiency Design Index (EEDI) for all new ships and the Ship Energy Efficiency Management Plan (SEEMP) for all ships in operation. These regulations have been effective since the 1st of January 2013 for ships weighing 400 GT and over [3]. In 2018 at MEPC 72, the IMO set a new strategy with the intention of achieving a 40% reduction in greenhouse gases (GHG) by 2040 and at least 50% by 2050, compared to 2008 levels. To achieve these targets, the IMO introduced new mandatory measures, i.e., the Attained Energy Efficiency Existing Ship Index (EEXI) and the annual Carbon Intensity Indicator (CII). The EEXI is calculated for ships of 400 GT and over and indicates a ship’s efficiency compared to a baseline. Every ship is obliged to meet a minimum required EEXI. The CII specifies the annual reduction factor needed to provide continuous enhancement of each ship’s operational carbon intensity in comparison to a specific rating level.
Clearly, regulations for CO2 emissions reductions are becoming more and more strict. Shipping companies are searching for new technologies to implement in ships to achieve the new IMO targets. An existing and very efficient approach is the use of waste heat recovery systems, which harness waste heat from the main engine and convert it to useful electric power. These systems can utilize different thermodynamic cycles and various working mediums which depend on the type of the bottoming installation. Furthermore, these systems can be comprised of different components to recover waste heat such as regenerators, evaporators, and recuperators [4].
A wide range of technologies have been suggested in the literature for the utilization of waste heat from marine diesel engines. Liu et al. [5] investigated the potential of CO2 thermodynamic cycles to recover waste heat. In this study, we analyzed the applications which are more suitable for transcritical and supercritical CO2 cycles. It was found that transcritical cycles are more suitable to low temperature heat sources and simple systems, while supercritical cycles are more efficient for absorbing waste heat in high temperature heat sources and in more complex systems.
Another interesting study referred to the utilization of a transcritical Rankine cycle for multiple waste heat recovery using CO2 and hydrocarbons [6]. The optimal turbine inlet pressure was adjusted in this study to maximize the efficiency of the cycle and minimize the cost of the produced electricity. For the optimal turbine inlet pressure, several organic fluids were examined, and it was concluded that even though CO2 does not produce the most power in comparison to other fluids, it absorbs more heat from the regenerator and the engine coolant than other fluids and requires a smaller turbine to produce electricity.
Wang et al. [7] proposed a transcritical CO2 cycle to harness heat from a supercritical CO2 Brayton cycle in order to produce power. A parametric analysis was conducted to demonstrate the influence of the key variables of the cycle. The exergo-economic indicators of the combined system were optimized, and it was found that the combined system showed better exergo-economic performance than a simple supercritical cycle. Another significant point of that study was that the increase in the reactor’s outlet temperature decreased the total cost rate of the system.
In another study [8], a dual turbine-alternator-compressor supercritical CO2 Brayton cycle was proposed as a means to recover heat from the exhaust gas of the main engine of a 9000 TEU container ship. The functional parameters of the installation were optimized to determine the optimal operation of the system in order to maximize the cycle efficiency and minimize the generated power cost. The study illustrated that all the key performance indicators of this system were significantly better than those of the supercritical CO2 Brayton cycle.
Another study examined the application of a supercritical CO2 (S-CO2) cycle combined with a transcritical CO2 (T-CO2) cycle for the recovery of waste heat from an LNG engine [9]. Engine exhaust gas heat was transferred both to the S-CO2 cycle and the T-CO2 cycle. A parametric analysis was performed to identify the effect of various operating parameters. Moreover, the optimal operating conditions of the combined system were examined, taking into consideration both thermodynamic and economic aspects in the developed software. The results showed that the proposed bottoming installation contributed significantly to increasing the energy and exergy efficiency of the combined system.
Xia et al. [10] proposed the utilization of a simple CO2 Rankine cycle, where the CO2 is condensated by a ‘cold’ LNG stream and is heated by ambient air. The effects of varying the ambient temperature and CO2 mass flow rate were investigated. It was shown that the decrease of these two parameters decreased most of the performance indicators. An off-design analysis was also performed, which was then compared with the designed condition.
Kim et al. [11] investigated the application of three different supercritical cycles for harnessing waste heat from a gas turbine. These three cycles were the simple cycle, the split cycle, where the CO2 stream was divided into streams after the compressor, and the cascade cycle, where the exhaust gas transferred heat in two cycles, i.e., the high and the low temperature cycle. According to the theoretical results, the split cycle was more energy and exergy efficient than the other two cycles under a wide range of operating conditions.
Exergo-economic analyses have been conducted at various thermodynamic cycles, as evidenced from an examination of the literature. Belman-Flores et al. [12] investigated the exergo-economic performance of four different transcritical CO2 cycles. Marques et al. [13] calculated the exergo-economic indicators of an electricity-cooling cogeneration system. Valencia Ochoa et al. [14] performed an advanced exergo-economic analysis of a Rankine waste heat recovery system which harnessed exhaust gas heat from an internal combustion engine. All of these studies investigated variations of the exergy stream cost rates to define the inefficiencies of the examined thermodynamic cycles and to find the components with the worst exergetic performance. In another study Nami et al. [15], exergo-economic and exergo-environmental assessments of a waste heat bottoming system comprising a supercritical CO2 Brayton cycle and an organic Rankine cycle (ORC) were performed. A parametric analysis of various decision parameters was carried out, showing how they affected the exergo-economic performance of the bottoming installation. Moreover, these parameters were optimized to minimize the capital investment cost, the exergy destruction cost, and the environmental impact cost. The results of that study [15] showed that the cost of the generated power of the bottoming system decreased significantly under optimized conditions.
The present study demonstrates the following innovative features, which are complementary to the information presented in the previously mentioned studies:
  • The design and implementation of three novel supercritical cycles (a simple cycle, a split cycle, and a cascade cycle) are conducted in order to harness waste heat from a container ship main two-stroke diesel engine.
  • An integrated thermodynamic, heat transfer, and economic analysis for all the newly designed cycles is performed.
  • An optimization procedure is adopted using a genetic algorithm to select the optimal bottoming cycle from the three possible designs in terms of the minimum EPC.
  • Exergo-economic and exergo-environmental analyses are carried out for the optimum cycle in order to assess its exergy cost rates and its key exergo-environmental indicators. These combined analyses were performed for the first time for a specially designed, optimized marine energy system.

2. Description of the Examined Container Ship Main Diesel Engine

In the present study, a two-stroke marine diesel engine, used as the main engine for a 6800 TEU container ship, is considered. The maximum continuous rating (MCR) of this engine is 68,640 kW at 84 rpm, it has three parallel turbochargers, and it is compliant with the Tier II NOx emissions limits [16]. Moreover, the specific fuel consumption of the examined engine at MCR is 165 g/kWh [16,17]. Figure 1 shows the variation of the brake specific fuel consumption (BSFC) (Figure 1a), exhaust gas mass flow rate (Figure 1b), exhaust gas temperature after T/C (Figure 1c), scavenge mass flow rate (Figure 1d), and scavenge air temperature before the intercooler (Figure 1e) with engine load. As evidenced from Figure 1a, BSFC varies from 160.1 g/kWh at 65% of MCR to 172 gr/kWh at 25% of MCR. According to Figure 1b, the exhaust gas amount increases almost linearly from 55.9 kg/s to 151.9 kg/s as the engine load increases. The exhaust gas temperature increases from 221 °C to 261 °C until 35% of MCR, before decreasing to 220 °C at 75% of MCR and finally again increasing to 100% of MCR, as evidenced from Figure 1c. The scavenge air amount increases almost linearly from 55 kg/s to 148.9 kg/s as the engine load increases, as shown in Figure 1d. As indicated in Figure 1e, the scavenge air temperature increases almost linearly from 76 °C to 214 °C with the increase of engine load.
Hence, having in mind the variation of exhaust gas temperature and the corresponding variation of exhaust gas mass flow rate with engine load, there is a considerable available exhaust gas energy which can be harnessed with waste heat recovery bottoming cycles. Also, as shown in Figure 1d,e, which illustrate the variation of scavenge air temperature and mass flow rate, significant amounts of waste heat can be harnessed from scavenge intake air at the intercooler, leading, in conjunction with exhaust gas heat harnessing, to an enhancement of the bottoming cycle generated electric power.

3. Brief Description of the Properties of CO2 as Working Medium

The selection of the working medium in a waste heat recovery system is significant. The use of a supercritical CO2 cycle in waste heat recovery systems is gaining increasing attention for several reasons. Supercritical CO2 cycles operate in wide range of temperatures. Furthermore, CO2 is a nontoxic refrigerant, and its environmental footprint is smaller in comparison with other organic fluids. Supercritical CO2 cycles offer higher efficiencies and, as a result, exploit the heat source to a higher degree. In addition, CO2 cycles utilize heat exchangers with lower capacities due to their lower working fluid steam volume, therefore leading to system downsizing and decreases in the capital cost of components [18]. In Table 1 are shown the critical properties of CO2.

4. Description of Supercritical CO2 Cycles

In this study, waste heat is harnessed from intake air after it exits the turbocharger, and from the exhaust gas of the engine. The heat exchanger of the intake air works in the same way as the intercooler of the engine, but it does not reduce the temperature of the air to the same degree as the intercooler, since the supercritical carbon dioxide cycles cannot recover heat at very low temperatures. As far as the recovered heat from the exhaust gas is concerned, in the split and cascade cycle, two heat exchangers are utilized to harness waste heat. The main advantage of supercritical CO2 cycles is that they indicate high expansion ratios, and thus, their operation can lead to high expansion work outputs for the same amount of supplied thermal energy. Hence, one of the key advantages of supercritical CO2 cycles is their high thermal efficiency, which is higher compared to other bottoming cycle installations coupled to main two-stroke diesel engines. On the other hand, the main disadvantage of supercritical CO2 cycles is the energy requirements of their compressing systems, which are required to keep the pressure levels of all points of the supercritical CO2 thermodynamic cycles higher that the critical pressure. These high-pressure levels create problems with the operation of heat exchangers, which are obliged to operate under significantly high pressures, creating a risk for excessive CO2 leakage and the loss of generated electric power at the expander of the supercritical cycle. Another disadvantage of supercritical CO2 cycles is that CO2 leakages will contribute the greenhouse effect, since CO2 is a key greenhouse gas.

4.1. Description of a Simple Supercritical CO2 Cycle

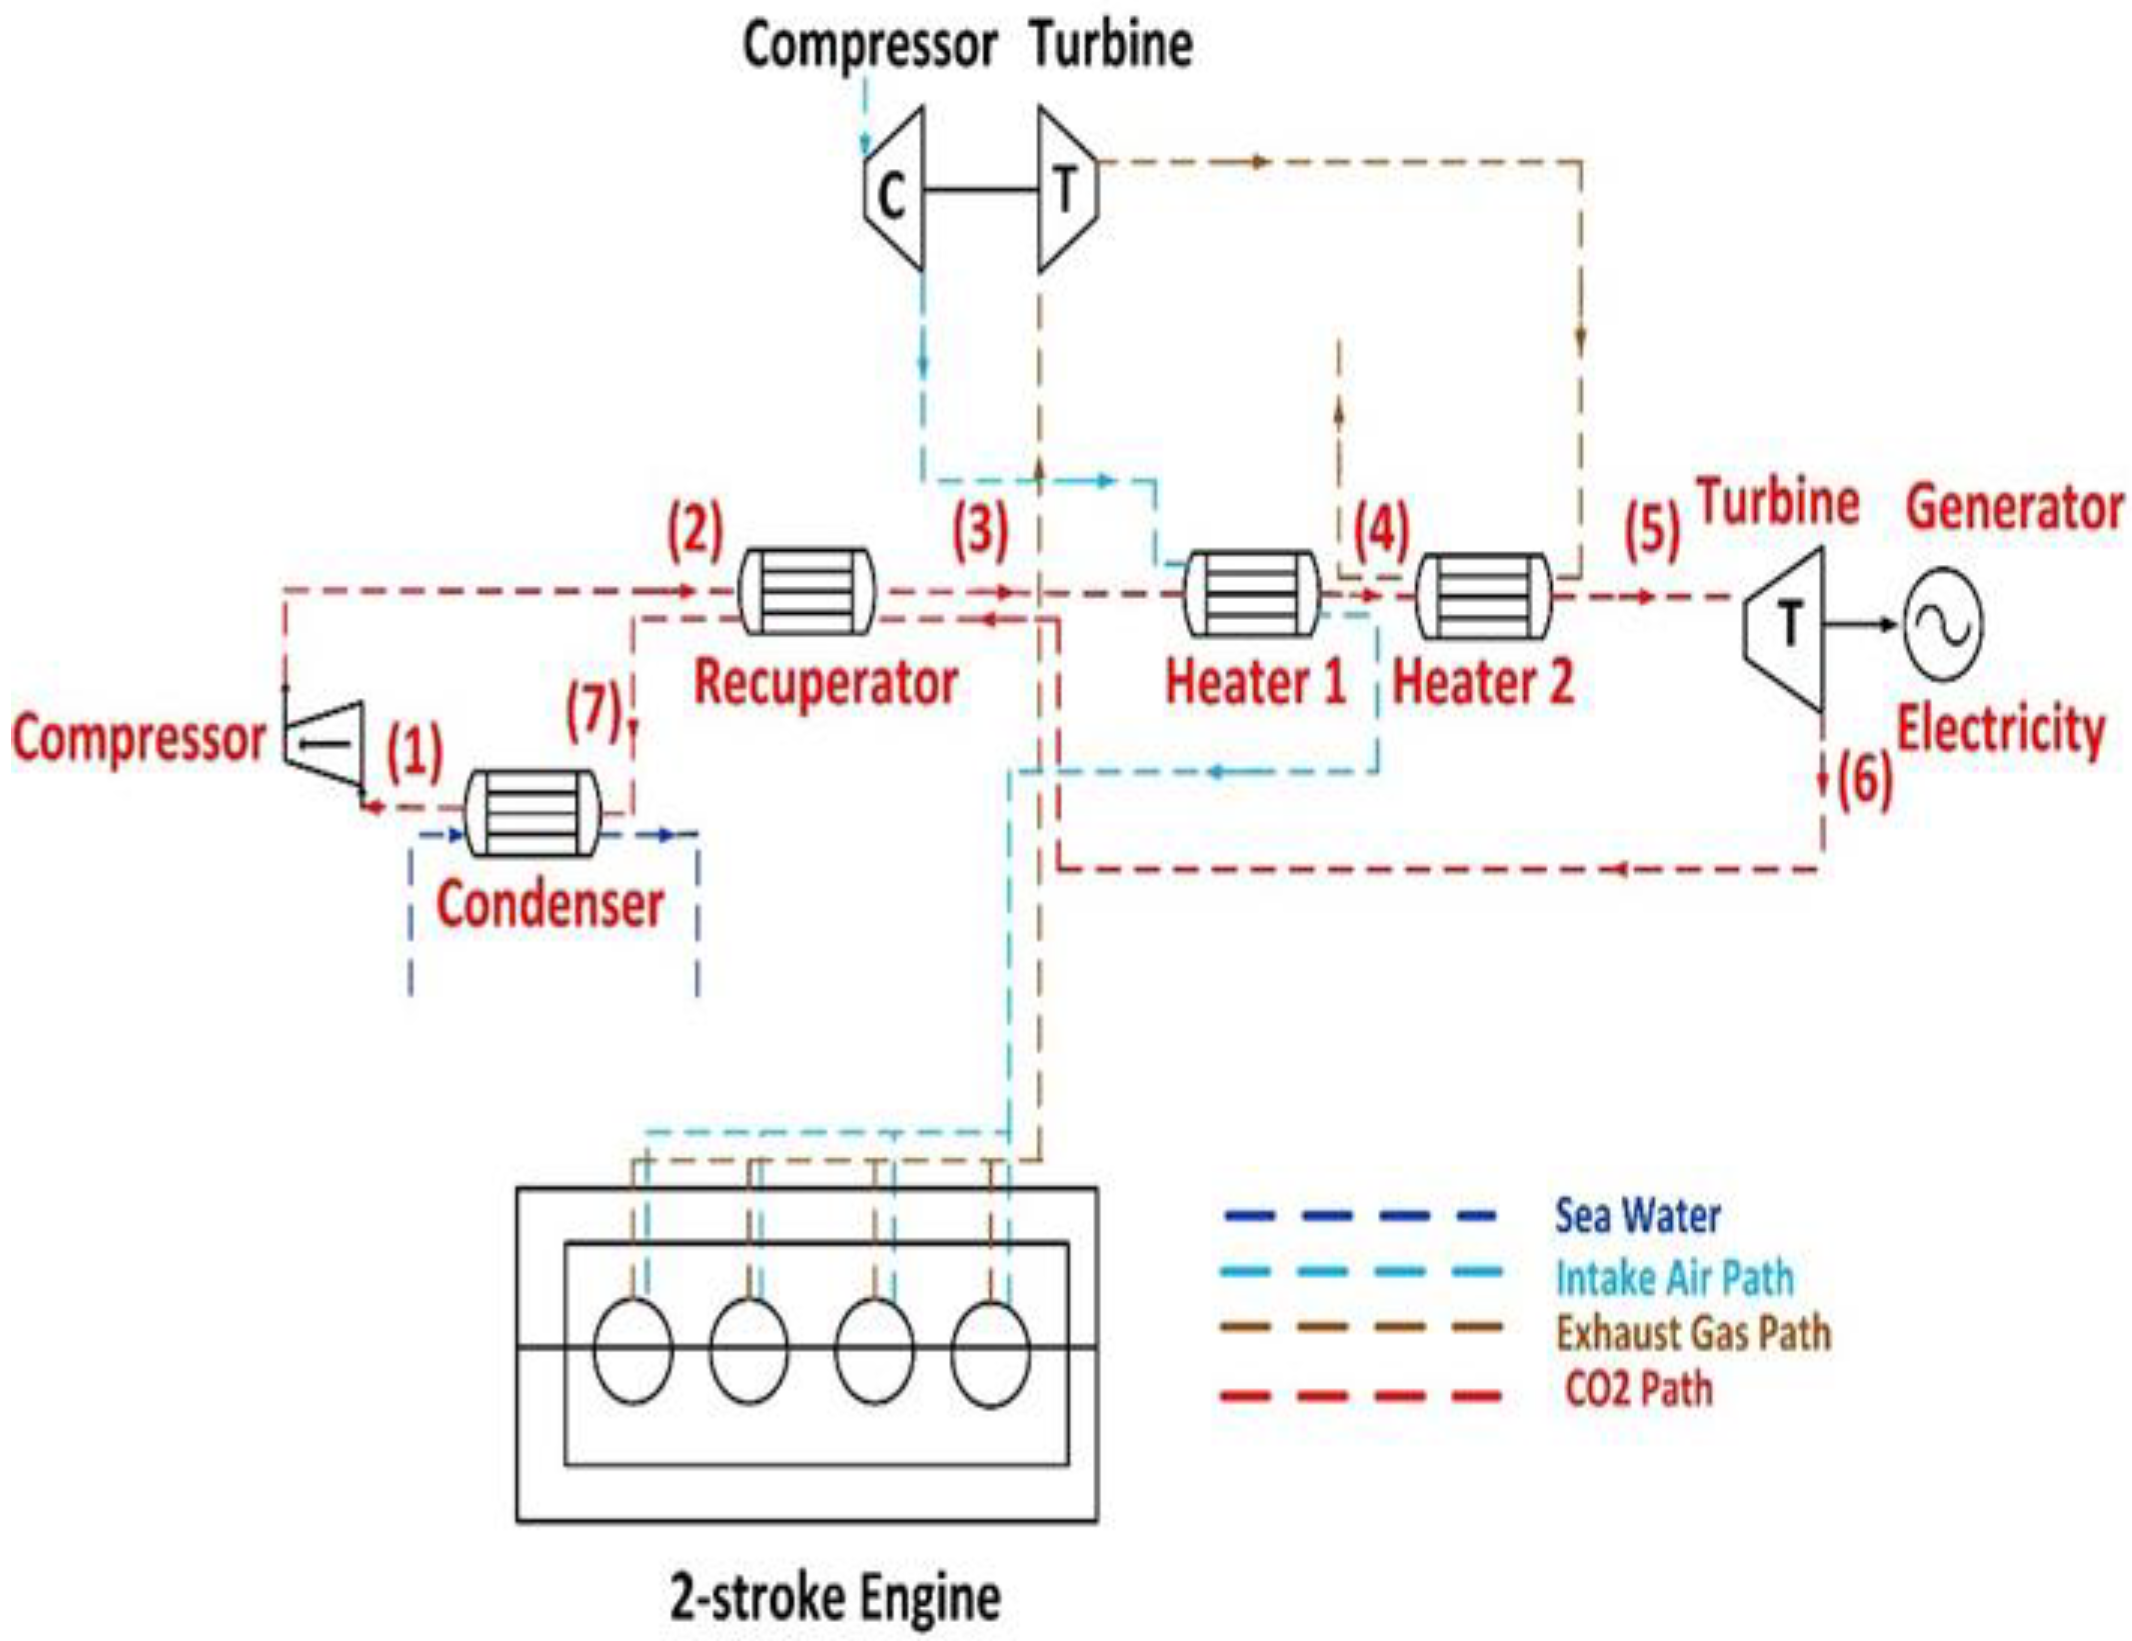
Figure 2 shows a schematic view of a simple supercritical CO2 cycle, and Figure 3 presents a temperature–entropy (T-s) diagram of this cycle. In this cycle, waste heat is harnessed from the exhaust gas of the main diesel engine and from the compressed intake air before it enters the engine’s intercooler. The installation consists of a compressor, where the supercritical CO2 stream is compressed, a recuperator, where the cold fluid stream is heated by the expanded hot fluid stream, two heaters, where the fluid receives heat from the intake air and the exhaust gas, an expander, where the heated CO2 stream is expanded, and a condenser, where heat is dissipated using sea water to repeat the thermodynamic cycle. To enhance the thermal efficiency of the cycle, the inlet temperature of the turbine should be raised as much as possible. However, a higher turbine inlet temperature leads to lower heat recovery efficiency of the rejected heat. For this reason, the working medium is preheated by the recuperator [19]. The CO2 stream at State 1 enters the compressor, where it is compressed. Subsequently, at State 2, it enters the recuperator and receives heat from the ‘hot’ CO2 stream, which exits the turbine at State 6. At State 3, the supercritical stream enters Heater 1, where it receives heat from the compressed scavenge air of the engine. Afterwards, at State 4, it exits Heater 1 and enters Heater 2, where heat is transferred from the exhaust gas of the engine to the supercritical CO2 stream. The stream at State 5 is expanded at the turbine. At State 7, the CO2 stream rejects heat at the condenser to repeat the thermodynamic cycle.

4.2. Description of the Split Supercritical CO2 Cycle

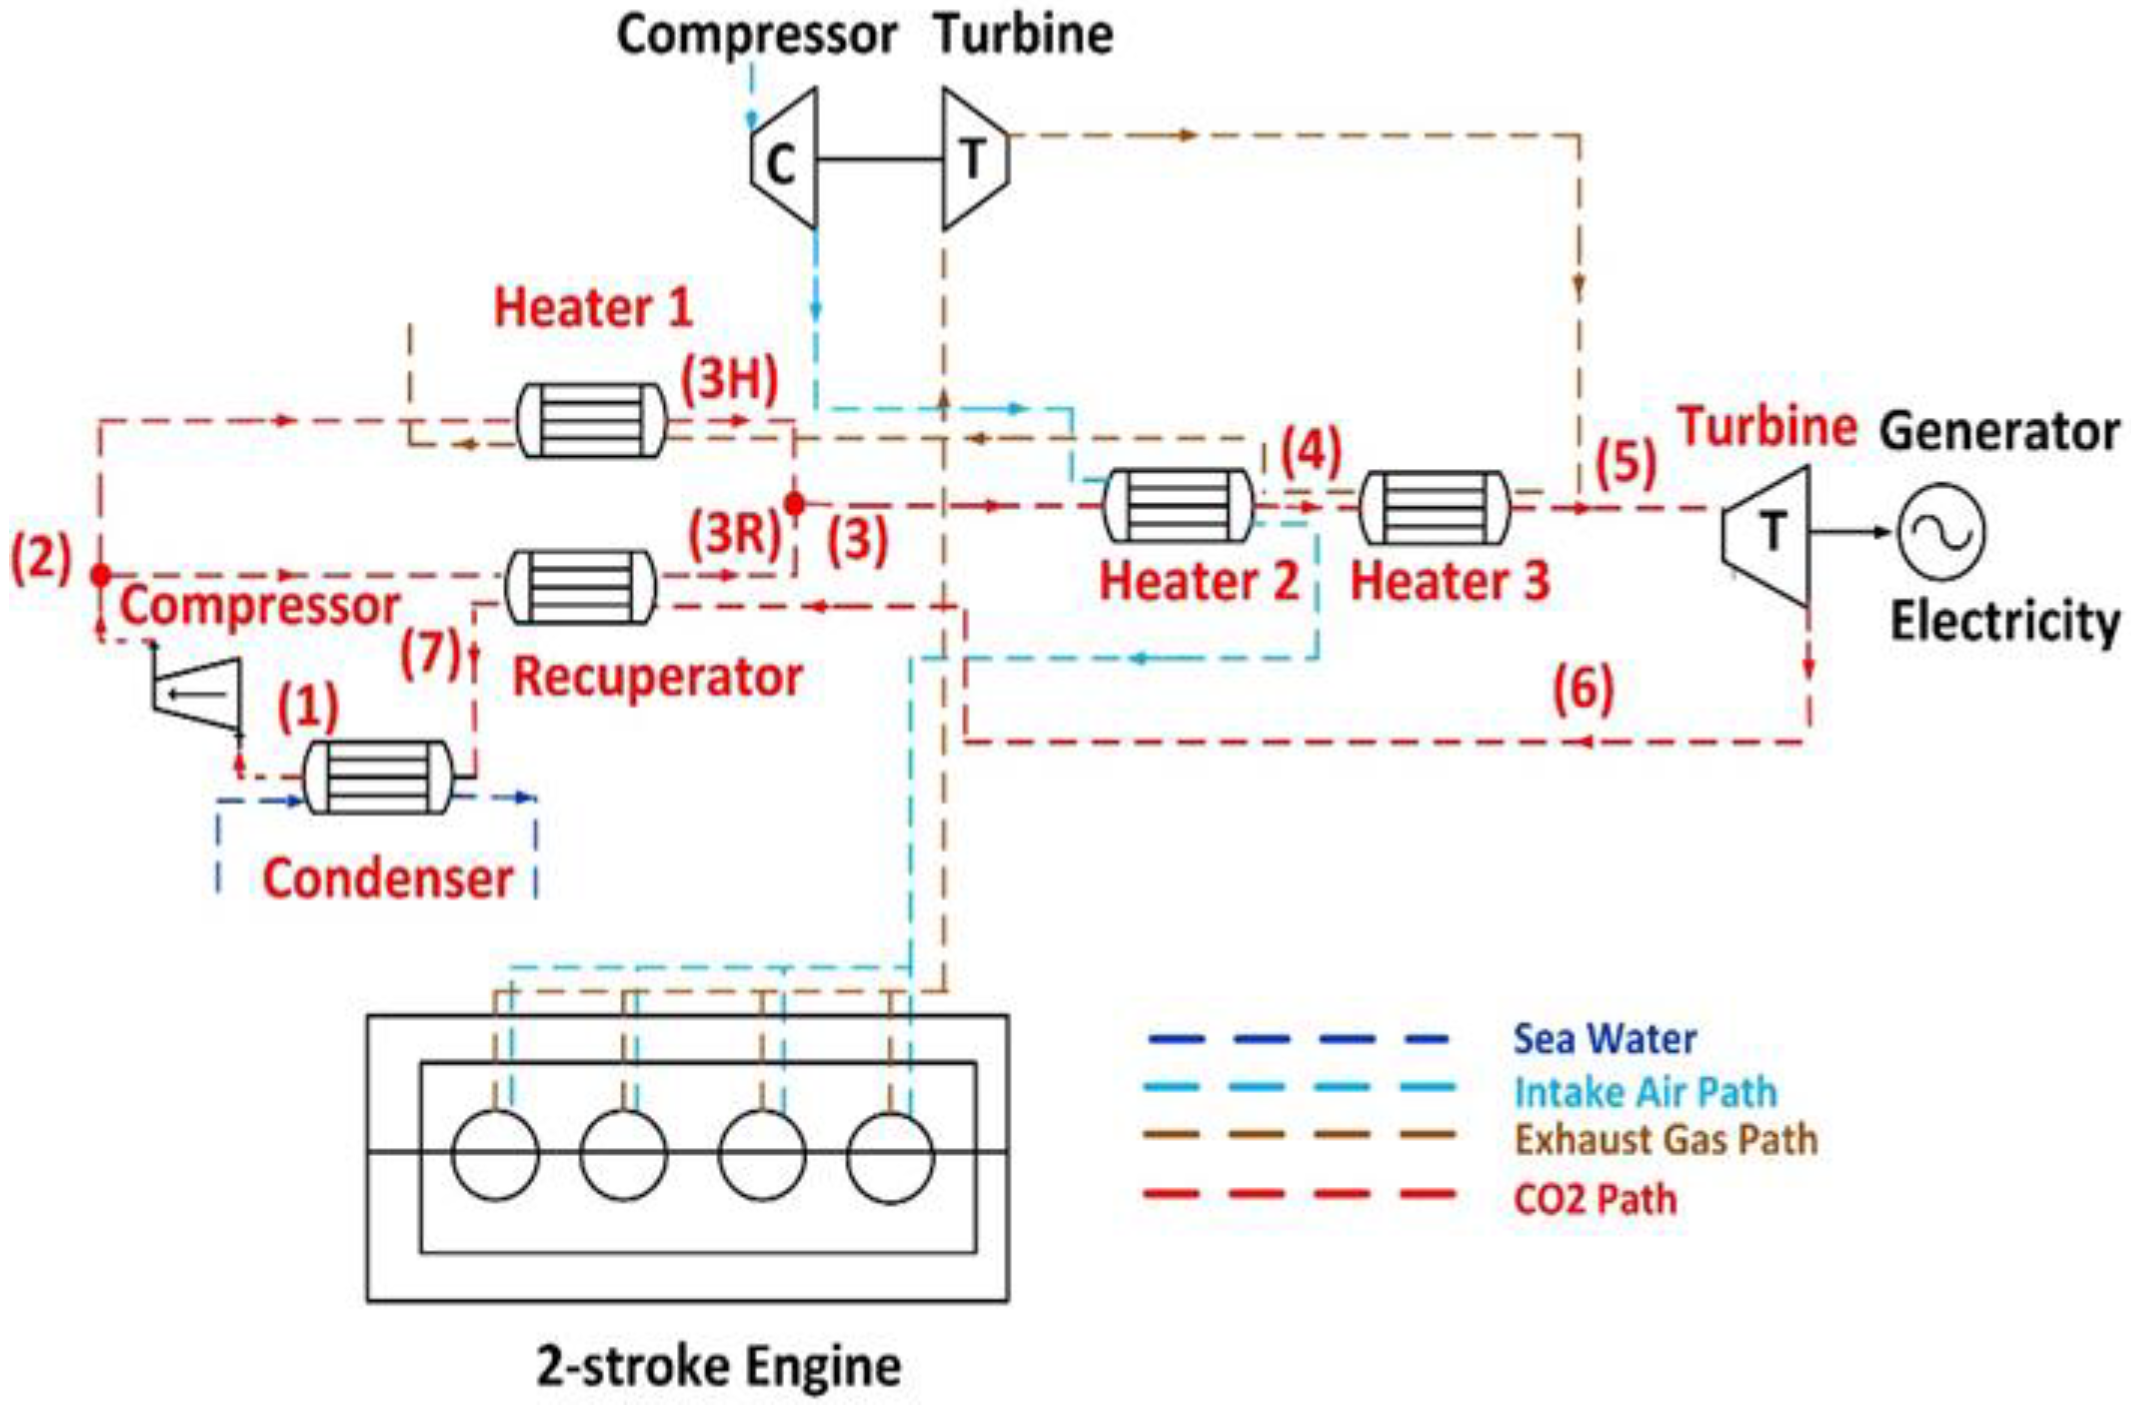
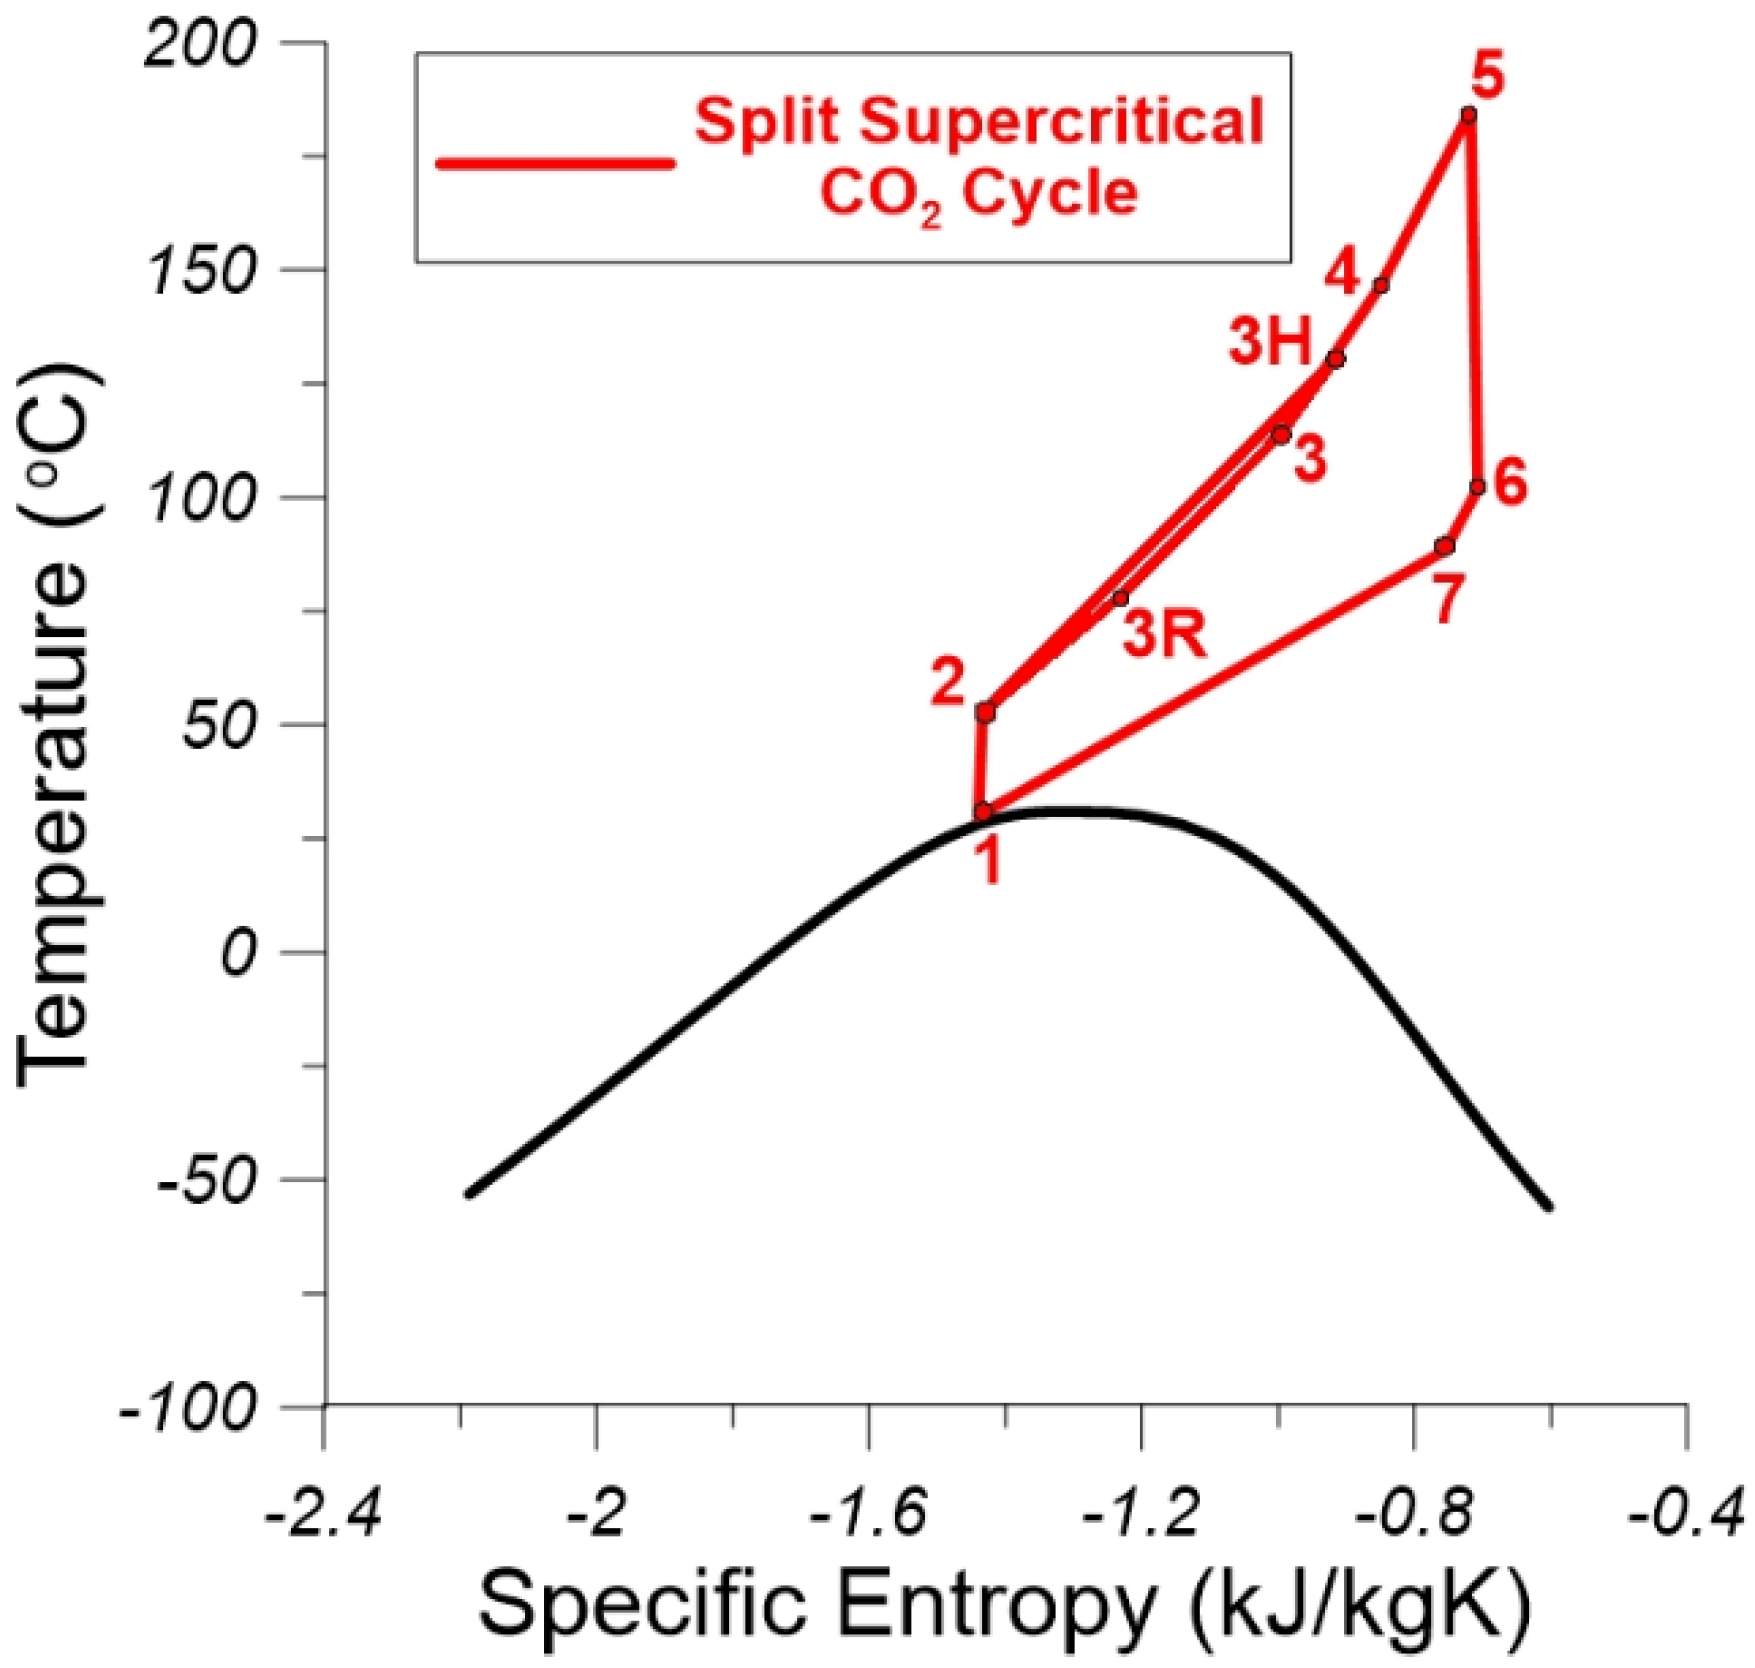
Figure 4 shows a schematic view of a split supercritical CO2 cycle, and Figure 5 presents a diagram of this cycle at temperature–entropy (T-s). This installation consists of a compressor, where the supercritical CO2 stream is compressed, a recuperator, where a part of the ‘cold’ CO2 stream is heated by the expanded hot CO2 stream, three heaters, where the stream receives heat from the intake air and the exhaust gas, an expander, where the heated CO2 stream is expanded, and a condenser, where CO2 rejects heat into sea water. The supercritical CO2 stream is compressed at State 1 in the compressor. At State 2, the stream is divided into two parts. The first stream enters Heater 1, where it recovers heat form the exhaust gas, which exits the heater at an intermediate temperature. The second stream enters the recuperator, where it recovers heat from the ‘hot’ expanded CO2 stream. Both streams are mixed again at State 3 and enter Heater 2 before the CO2 stream enters Heater 3 at State 4, where it receives rejected heat from the intake air and the exhaust gas. The heated CO2 stream at State 5 is expanded at the turbine. Then, at State 6, it enters the recuperator, and finally, at State 7, is condensed at the condenser, where heat is dissipated into sea water. After the condenser, the thermodynamic cycle is repeated.

4.3. Description of the Cascade Supercritical CO2 Cycle

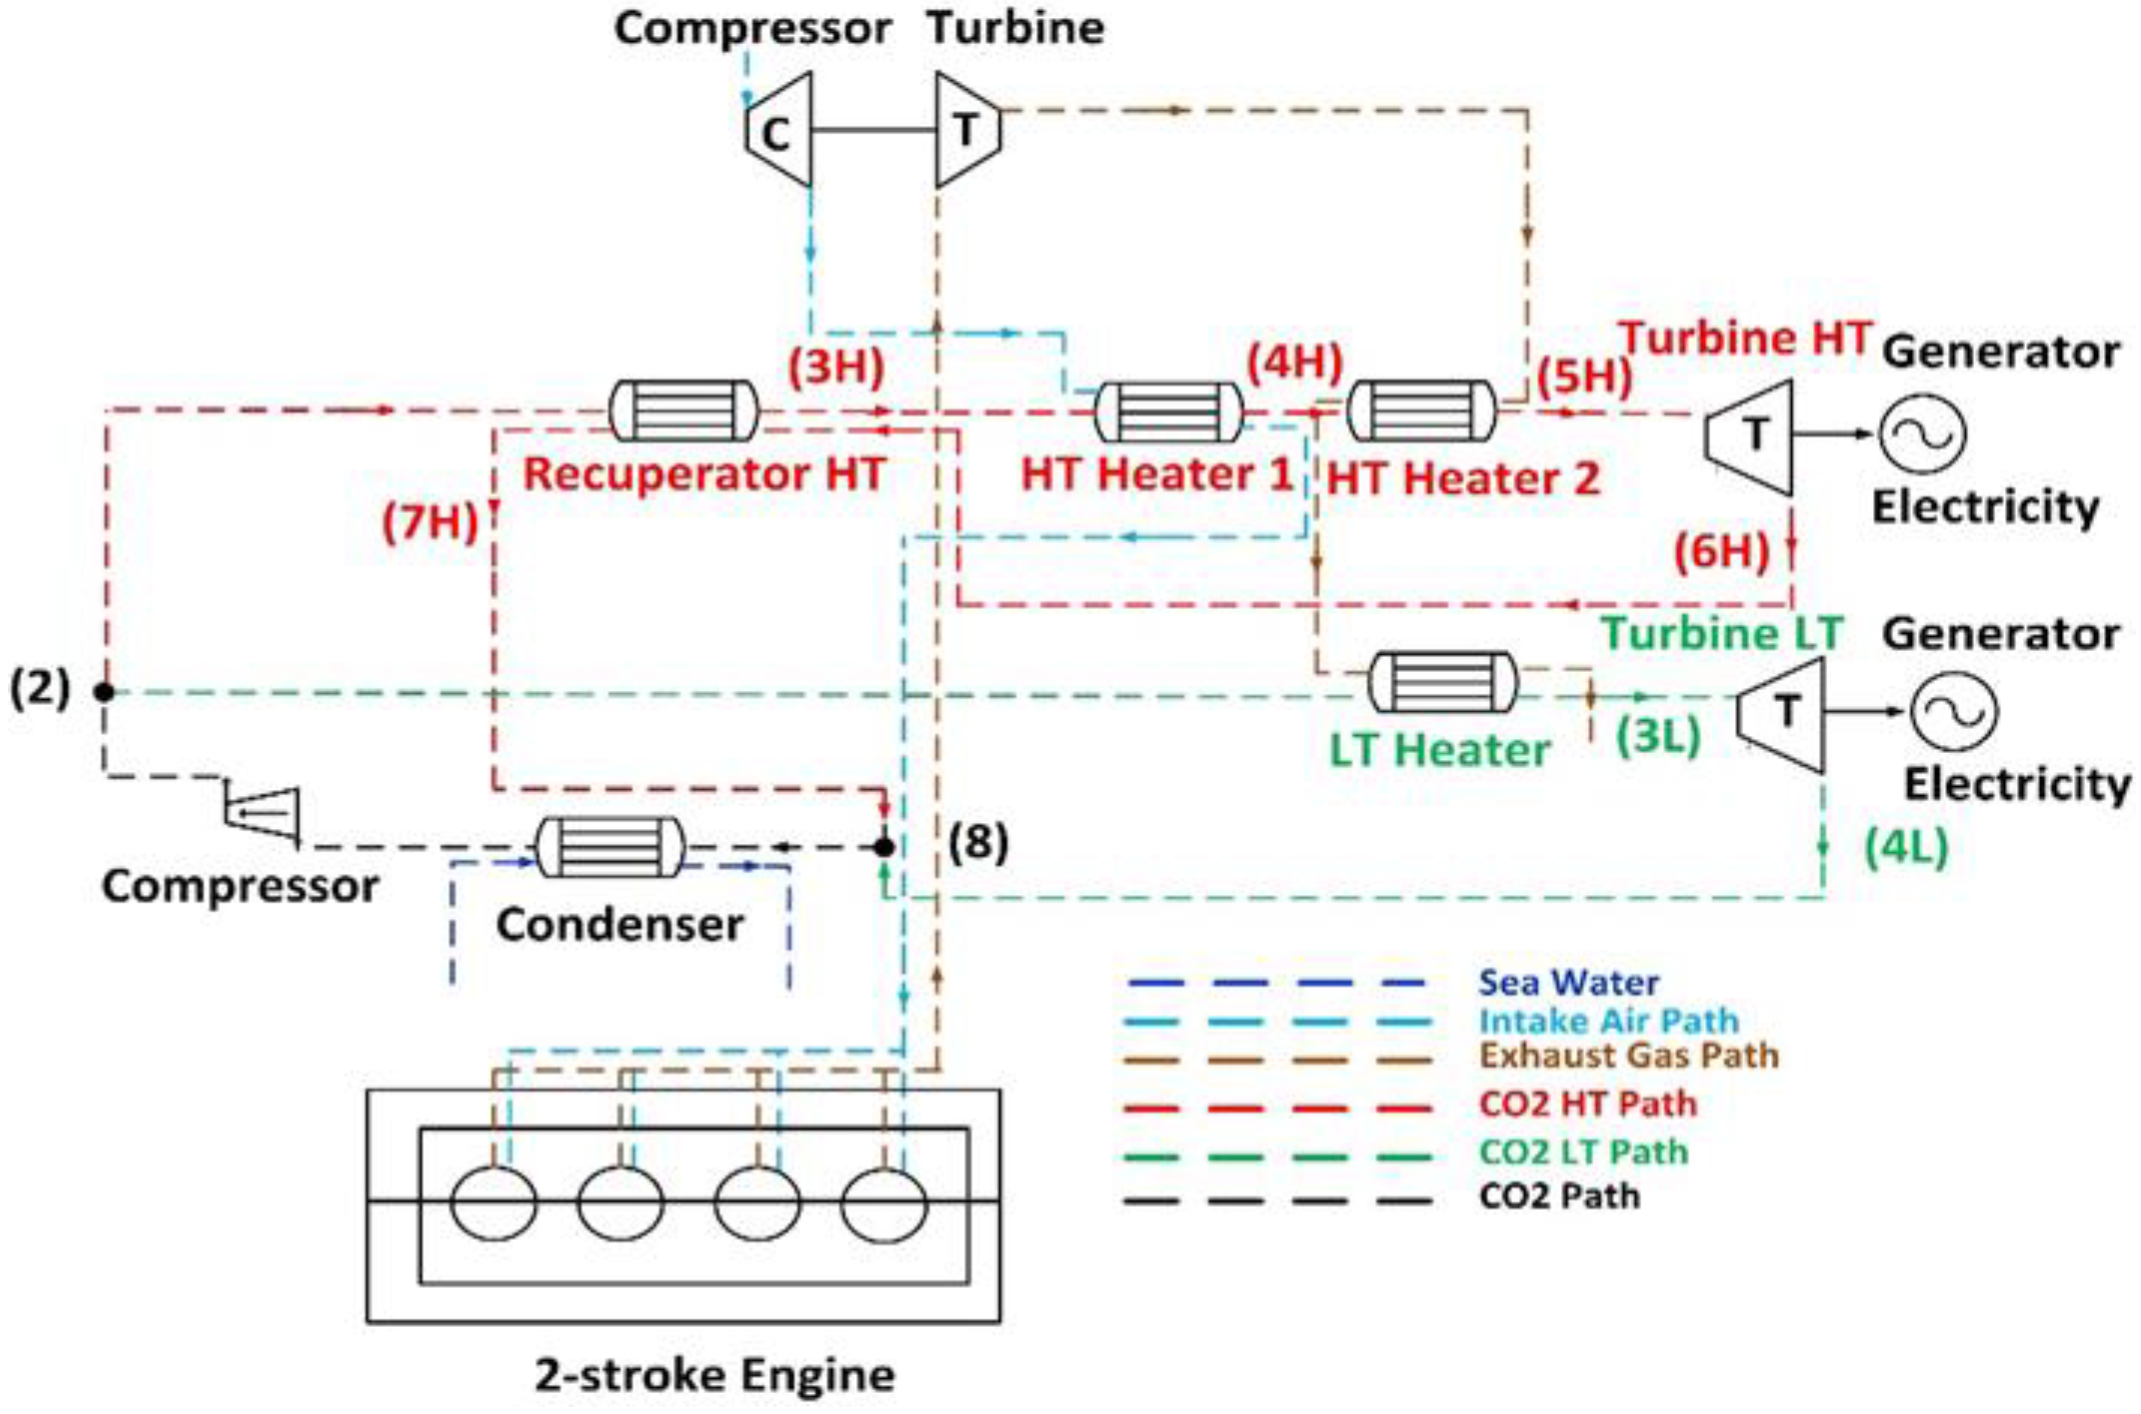
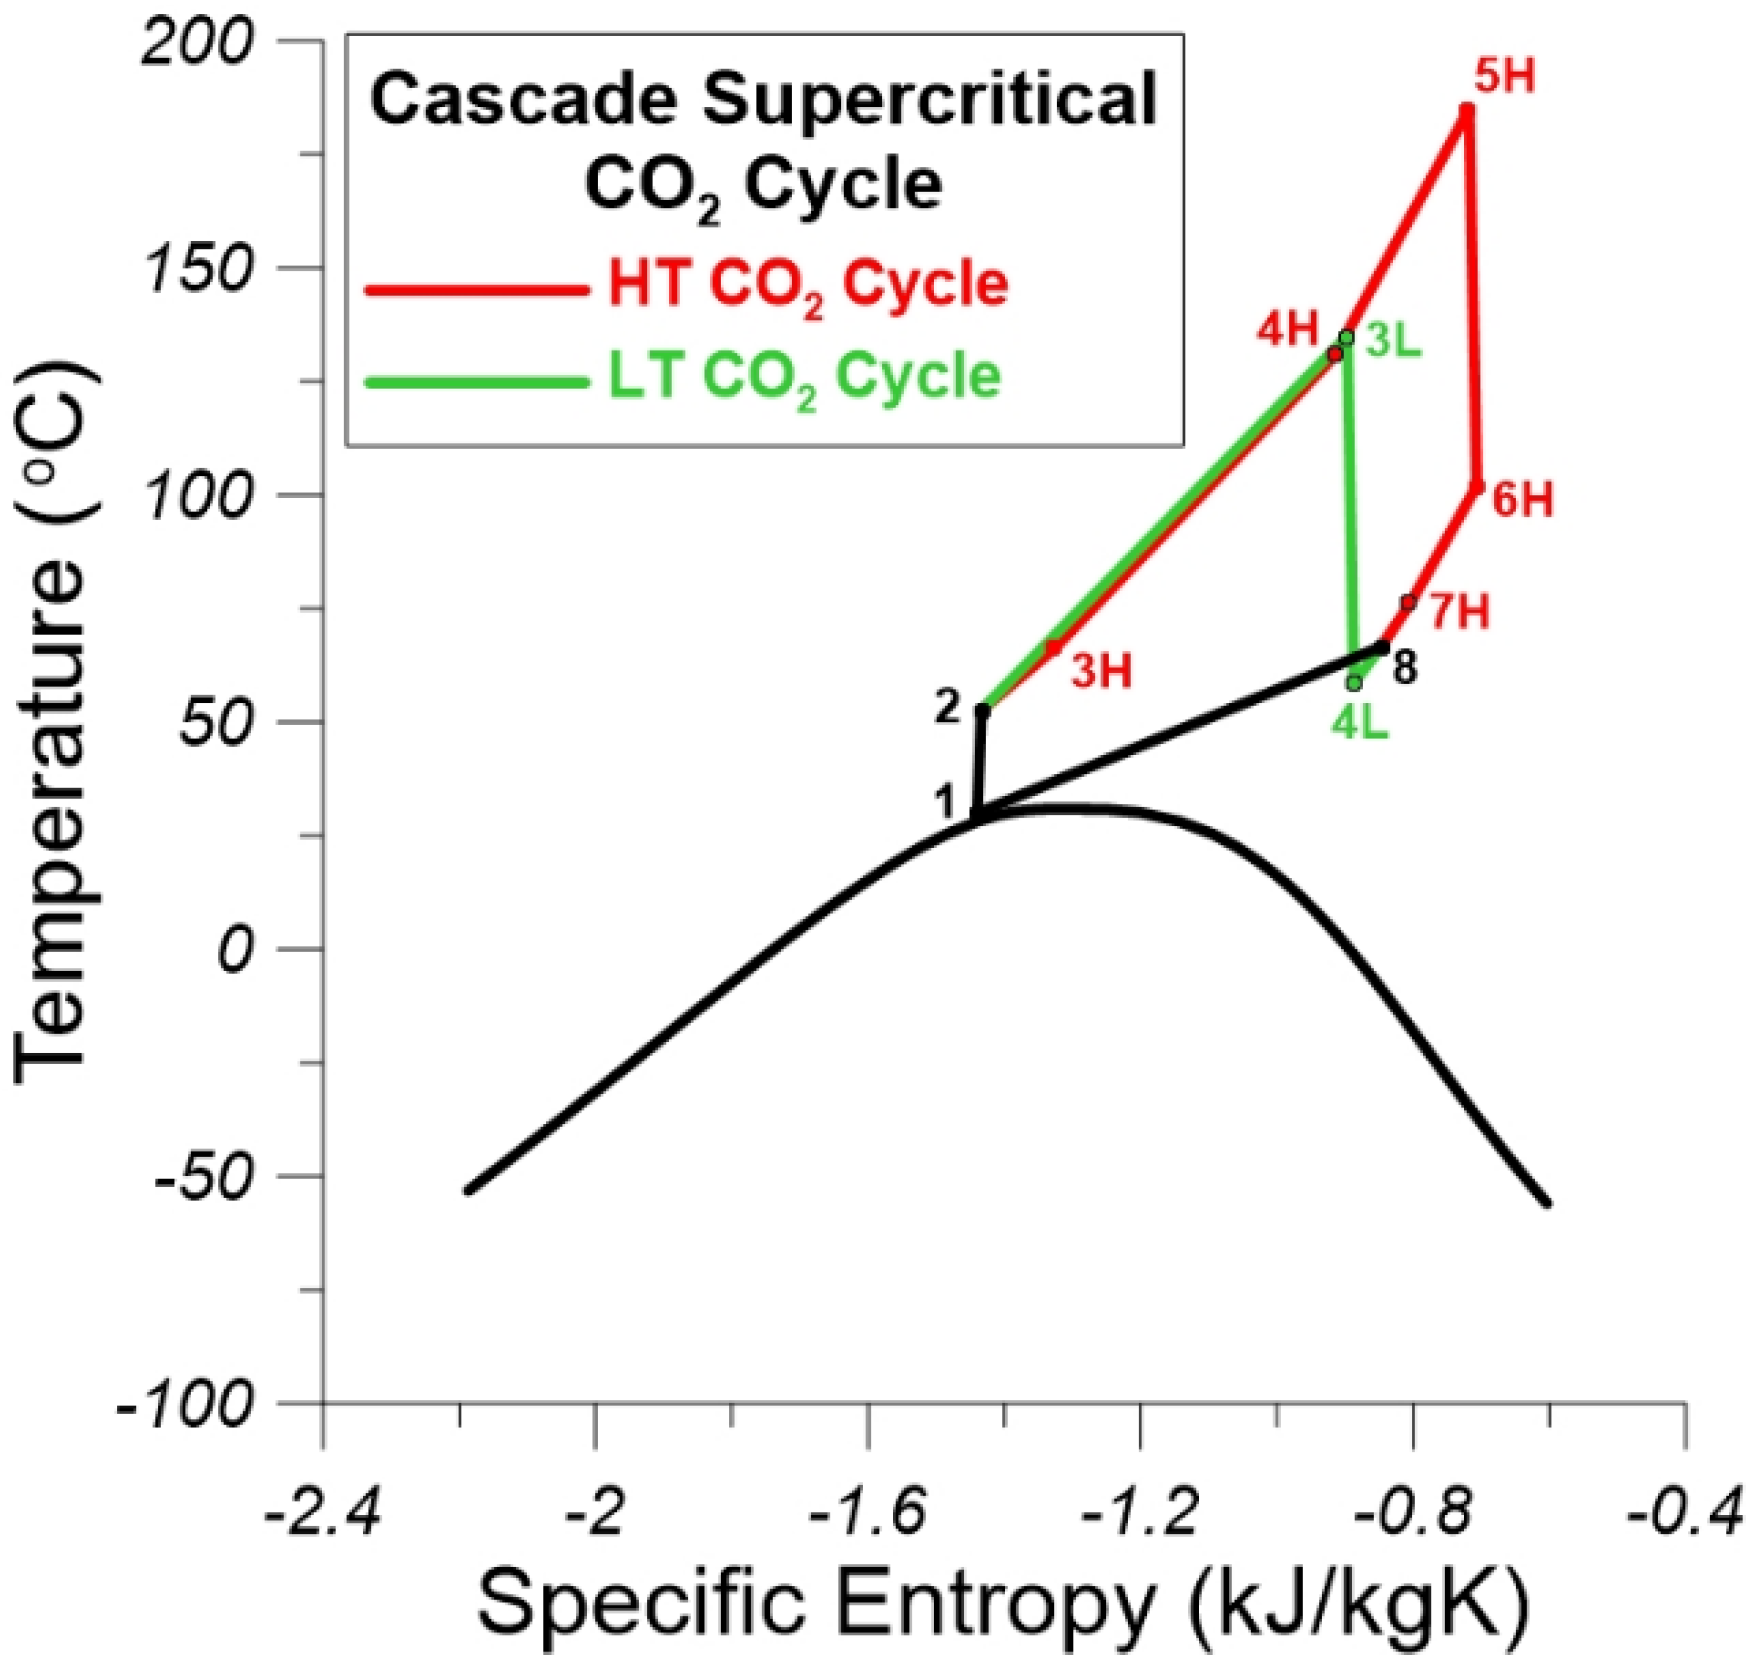
Figure 6 and Figure 7 show a schematic view of the cascade supercritical CO2 cycle and the T-s diagram of this cycle, respectively. This installation is comprised of a compressor, where the supercritical CO2 stream is compressed, a recuperator, where the High Temperature (HT) ‘cold’ CO2 stream is heated by the expanded hot HT CO2 stream, three heaters, where the stream receives heat from the intake air and the exhaust gas, two expanders, where the HT and LT CO2 streams are expanded, and a condenser, where both streams reject heat at sea water. At State 1, the CO2 stream is compressed in the compressor, and at State 2, is divided into two different cycles, i.e., the High Temperature (HT) and the Low Temperature (LT). In the HT cycle, the supercritical stream recovers heat consecutively from the recuperator, i.e., the HT Heater 1 at State 3H, where the rejected heat comes from the intake air before it enters the engine’s intercooler and the HT Heater 2 at State 4H, where the exhaust gas loses part of its heat. The HT stream expands in the HT turbine at State 5H and subsequently enters the recuperator at State 6H, where it is mixed before entering the condenser with the LT stream. In the LT cycle, the stream recovers heat from the LT heater. Then, at State 3L, it is expanded in the LT Turbine, and afterwards, is mixed with the HT stream. The mixed stream is condensated at State 8 in the condenser, rejecting heat into sea water.

5. Energy and Exergy Analysis of the Three Examined Supercritical CO2 Cycles

5.1. Thermodynamic Processes of the Simple Supercritical CO2 Cycle

The following processes describe the simple supercritical cycle, according to the Figure 3 and Figure 4:
  • Processes 1 and 2: The isentropic efficiency of the compressor and the mechanical power consumption are calculated as follows:
    n C = h 2 , S h 1 h 2 h 1
    W ˙ C = m ˙ C O 2 ( h 2 h 1 )
  • Processes 2, 3, 6, and 7: The transferred specific heat in the recuperator from the ‘hot’ CO2 stream to the ‘cold’ CO2 stream may be calculated using the following equation:
    q r e c u p = ε r e c u p ( h 6 h 7 ) = h 3 h 2
  • Processes 3 and 4: The transferred heat rate from the intake air after the turbocharger to the CO2 stream in Heater 1 may be calculated using the following equation:
    Q ˙ h e a t e r 1 = ε h e a t e r 1 m ˙ a i r c p a i r ( T a i r , i n T a i r , o u t ) = m ˙ C O 2 ( h 4 h 3 )
  • Processes 4 and 5: The transferred heat rate from the exhaust gas to the CO2 stream in Heater 2 may be calculated using the following equation:
    Q ˙ h e a t e r 2 = ε h e a t e r 2 m ˙ g a s c p g a s ( T g a s , i n T g a s , o u t ) = m ˙ C O 2 ( h 5 h 4 )
  • Processes 5 and 6: The isentropic efficiency of the turbine and the calculation of the produced power are depicted as follows:
    n T = h 5 h 6 h 5 , i s h 6
    W ˙ T = m ˙ C O 2 ( h 5 h 6 )
  • Processes 7 and 1: The rejected heat rate from the ‘hot’ CO2 stream to the sea water in the condenser may be calculated using the following equation:
    Q ˙ c o n d = ε c o n d m ˙ C O 2 ( h 7 h 1 ) = m ˙ w a t e r c p w a t e r ( T w a t e r , o u t T w a t e r , i n )

5.2. Thermodynamic Processes of the Split Supercritical Cycle

The following processes describe the Split Supercritical Cycle, according to Figure 5 and Figure 6:
  • Processes 1 and 2: The isentropic efficiency of the compressor and the mechanical power consumption may be calculated in the same way as in the simple cycle.
  • State 2: At this state, the stream is divided in two streams:
    m ˙ C O 2 R = x m ˙ C O 2
    m C O 2 H = ( 1 x ) m C O 2
  • Processes 2, 3R, 6, and 7: The transferred heat in the recuperator from the ‘hot’ CO2 stream to the ‘cold’ CO2 stream may be calculated using the following equation:
    Q r e c u p = ε r e c u p m C O 2 ( h 6 h 7 ) = m C O 2 R ( h 3 R h 2 )
  • Processes 2 and 3H: A part of the heat from the exhaust gas is recovered in Heater 1; this may be calculated using the following equation:
    Q ˙ h e a t e r 1 = ε h e a t e r 1 m ˙ g a s c p g a s ( T g a s , m i d T g a s , o u t ) = m ˙ C O 2 H ( h 3 H h 2 )
  • State 3: Both streams are mixed at this state as follows:
    m C O 2 h 3 = m C O 2 R h 3 R + m C O 2 H h 3 H
  • Processes 3 and 4: The transferred heat from the intake air after the turbocharger to the CO2 stream in Heater 2 may be calculated using the following equation:
    Q ˙ h e a t e r 2 = ε h e a t e r 2 m ˙ a i r c p a i r ( T a i r , i n T a i r , o u t ) = m ˙ C O 2 ( h 4 h 3 )
  • Processes 4 and 5: The remaining heat from the exhaust gas is recovered in the heater 3 and may be calculated as follows:
    Q ˙ h e a t e r 3 = ε h e a t e r 3 m ˙ g a s c p g a s ( T g a s , i n T g a s , m i d ) = m ˙ C O 2 ( h 5 h 4 )
  • Processes 5 and 6: The isentropic efficiency of the turbine and the produced power may be calculated in the same way as in the simple cycle.
  • Processes 7 and 1: The rejected heat from the ‘hot’ CO2 stream to the sea water in the condenser may be calculated in the same way as in the simple cycle.

5.3. Thermodynamic Processes of the Cascade Supercritical Cycle

The following processes describe the Cascade Supercritical Cycle, according to the Figure 7.
  • Processes 1 and 2: The isentropic efficiency of the compressor and the mechanical power consumption are calculated in the same way as in the Split and the Cascade cycle.
  • State 2: At this state, the main cycle is divided into two cycles, i.e., the High Temperature (HT) with mass flow:
    m ˙ C O 2 H = x m ˙ C O 2
    and the Low Temperature (LT) with mass flow:
    m ˙ C O 2 L = ( 1 x ) m ˙ C O 2
  • High Temperature Stream:
    Processes 2, 3H, 6H, and 7H: The transferred heat in the recuperator from the ‘hot’ HT CO2 stream to the ‘cold’ HT CO2 stream may be calculated using the following equation:
    q r e c u p , H T = ε r e c u p , H T ( h 6 H h 7 H ) = h 3 H h 2 H
    Processes 3H and 4H: The transferred heat from the intake air after the turbocharger to the HT CO2 stream in HT Heater 1 may be calculated using the following equation:
    Q ˙ h e a t e r 1 , H T = ε h e a t e r 1 , H T m ˙ a i r c p a i r ( T a i r , i n T a i r , o u t ) = m ˙ C O 2 H ( h 4 H h 3 H )
    Processes 4H and 5H: A part of the heat from the exhaust gas is recovered in HT Heater 2, as may be calculated using the following equation:
    Q ˙ h e a t e r 2 , H T = ε h e a t e r 2 , H T m ˙ g a s c p g a s ( T g a s , i n T g a s , m i d ) = m ˙ C O 2 ( h 5 H h 4 H )
    Processes 5H and 6H: The isentropic efficiency of the HT turbine and the produced power in the HT cycle are depicted as follows:
    n T , H T = h 5 H h 6 H h 5 H , i s h 6 H
    W ˙ T , H T = m ˙ C O 2 H ( h 5 H h 6 H )
  • Low Temperature Stream:
    Processes 2 and 3L: The remaining heat from the exhaust gas is recovered in the LT Heater and may be calculated as follows:
    Q ˙ h e a t e r , L T = ε h e a t e r , L T m ˙ g a s c p g a s ( T g a s , m i d T g a s , o u t ) = m ˙ C O 2 L ( h 3 L h 2 )
    Processes 3L and 4L: The isentropic efficiency of the LT turbine and the produced power in the LT cycle are depicted as follows:
    n T , L T = h 3 L h 4 L h 3 L , i s h 4 L
    W ˙ T , L T = m ˙ C O 2 L ( h 3 L h 4 L )
  • State 8: At this state, the HT and LT streams are mixed as follows:
    m ˙ C O 2 h 8 = m ˙ C O 2 H h 7 H + m ˙ C O 2 L h 4 L
  • Processes 8 and 1: The rejected heat from the ‘hot’ CO2 stream to the sea water in the condenser may be calculated using the following relation:
    Q ˙ c o n d = ε c o n d m ˙ C O 2 ( h 8 h 1 ) = m ˙ w a t e r c p w a t e r ( T w a t e r , o u t T w a t e r , i n )
The net generated power of each cycle is the difference between the power generated by the turbines and the power consumed by the compressors of each installation:
W ˙ n e t = W ˙ T , i W ˙ P , i
The thermal efficiency of each cycle is described by the relation below:
n t h = W ˙ n e t Q ˙ h e a t e r , i

5.4. Exergy Analysis

The total exergy of the stream at every point of the cycle comprises four components: physical, chemical, kinetic, and potential [12]. The physical exergy can be assessed as follows:
E ˙ p h = m ˙ [ ( h i h 0 ) T 0 ( s i s 0 ) ]
where T 0 , s 0 , and h 0 refer to the temperature, entropy, and enthalpy at the dead state.
In this study, it is assumed that the chemical exergy does not change from one state to another [20], and for that reason, it has not been taken into consideration. Furthermore, kinetic and chemical exergy are neglected because it is assumed that there are no velocity or level changes in the system [12].
The exergy efficiency of the system is calculated by:
n e x = W ˙ n e t E ˙ i n

5.5. Model Assumptions

The main assumptions are the following:
  • Each of the proposed installations operates under steady state conditions.
  • Pressure drops in the pipelines are negligible.
  • The isentropic efficiency of each compressor and turbine is assumed to be 0.9.
  • The effectiveness (ε) of each heat exchanger has been assumed to be 0.9.
  • At dead state, T 0 and P 0 are set at 27 °C and 1 bar.
  • The lowest limit of the outlet temperature of the exhaust gas is 150 °C, i.e., 30 °C higher than the dew point of the exhaust gas [21].

6. Heat Transfer Analysis and Dimensioning of Heat Exchangers

In the present study, a plate heat exchanger is selected. The main benefits of these exchangers are their simple construction and compact size. The main drawback of plate heat exchangers is that the material which connects the plates limits their working temperature. Furthermore, the operating pressure is restricted due to the small distance of the plates. However, there are studies in the literature which indicate that plate heat exchangers have been successfully used with high pressure working fluids. To define the dimensions of each heat exchanger, the required heat transfer area, and the total heat transfer coefficient, a heat transfer analysis was conducted, as described below. The selected method for this analysis was the logarithmic mean temperature difference (LMTD). Based on this method, the heat transfer rate may be calculated as follows:
Q ˙ = U × A × Δ Τ L M T D
Δ Τ L M T D = Δ Τ m a x Δ Τ m i n l n ( Δ Τ m a x Δ Τ m i n )
The overall heat transfer coefficient can be calculated using the following equation:
1 U p l a t e = 1 h i n + r i n + δ λ + r o u t + 1 h o u t
The fouling resistance for the different fluids was set as follows:
  • The fouling resistance of internal CO2 stream rin in all plate heat exchangers is set at 0.0002, as proposed by Cao [22].
  • The fouling resistance of external intake air flow rout is set at 0.0002 [22].
  • The fouling resistance of the external exhaust gas flow rout is set at 0.002 [22].
  • The fouling resistance of the external seawater flow rout is set at 0.00009 [22].
The convection heat transfer coefficient for the internal and external fluid is expressed by the following relation [22]:
h i = k N u D h
The Nusselt number for the single-phase working fluid can be calculated from the relation above [23,24]:
N u = 0.724 ( 6 β π ) 0.646 R e 0.583 P r 1 / 3
Reynolds number is obtained from the following relation [23]:
R e = G D h μ
The mass flux can be expressed as follows [23]:
G = m N × w × b
The hydraulic diameter of the flow channel can be calculated as follows [23]:
D h = 4 w b 2 ( w + b )

7. Economic Analysis

In this study, an economic analysis was made to calculate the direct and overhead costs for each component of each installation. The Module Costing Technique (MCT) is a method which calculates the bare module cost of chemical plants [25]. According to the MCT, the capital cost of the heat exchanger can be calculated as follows:
C H X = C E P C I 2020 C E P C I 2001 F S C 0 H X ( B 1 , H X + B 2 , H X F M , H X F P , H X )
where the Chemical Engineering Plant Cost Index (CEPCI) is employed to adjust the precise costs for various components of the bottoming installation, CEPCI2020 and CEPCI2001 are the Chemical Engineering Plant Cost Indexes for years 2020 and 2001, respectively, CHX0 is the bare module cost of the heat exchanger, FS is the construction overhead cost factor, B1,HX and B2,HX are constants based on the heat exchanger type, and FM,HX and FP,HX are the material and pressure factors, respectively. The values of CEPCI2020 and CEPCI2001 are 607.5 [26] and 397, respectively [27].
The bare module cost of the heat exchanger is calculated as follows:
l o g C H X 0 = K 1 , H X + K 2 , H X l o g A H X + K 3 , H X ( l o g A H X ) 2
where K1,HX, K2,HX, and K3,HX are constants that depend on the heat exchanger type, and AHX is the heat exchanger area. The values of constants for estimating the capital cost of the heat exchanger are provided in Table 2.
The pressure factor of the heat exchanger is [25]:
l o g F P , H X = C 1 , H X + C 2 , H X l o g P H X + C 3 , H X ( l o g P H X ) 2
where C1,HX, C2,HX, and C3,HX are constants that depend on the type of heat exchanger, and PHX is the design pressure of the heat exchanger.
The capital cost of the utilized compressors may be estimated as follows [25]:
C C = C E P C I 2020 C E P C I 2001 F S C 0 C F B M F P , C
where C 0 C is the bare module cost of the compressor and F B M is the bare module factor.
The bare module cost of the compressor is [25]:
l o g C C 0 = K 1 , C + K 2 , C l o g W C + K 3 , C ( l o g W C ) 2
where K1,C, K2,C, and K3,C are constants that depend on the type of circulation compressor and W C is the power consumption thereof. The values of constants for estimating the capital cost of the compressor are given in Table 3.
The pressure factor of the compressor can be calculated as follows:
l o g F P , C = C 1 , C + C 2 , C l o g P C + C 3 , C ( l o g P C ) 2
where C1,C, C2,C, and C3,C are constants that depend on the type of circulation compressor and PC is the design pressure thereof.
The cost of the expander can be expressed as follows:
C E X P = C E P C I 2020 C E P C I 2001 F S C E X P 0 F M P
where C E X P 0 is the bare module cost of the expander and FMP is the additional expander factor.
The bare module cost of the expander is [25]:
l o g C E X P 0 = K 1 , E X P + K 2 , E X P l o g W E X P + K 3 , E X P ( l o g W T ) 2
where K1,EXP, K2,EXP, and K3,EXP are constants that depend on the type of the expander, and W T is the power output thereof. In Table 4 are provided the values of constants that are used for calculating the capital cost of expander.
The total investment cost (TIC) of the system is the sum of the capital cost of each component of the installation:
C t o t = C H X + C C + C E X P
The Capital Recovery Factor (CRF) is [29]:
C R F = i ( 1 + i ) L T p l ( 1 + i ) L T p l 1
where i is the interest rate and LTpl is the plant lifetime. The value of interest rate i is 12% [30] and that of LTpl is 15.
The Electricity Production Cost (EPC) is:
E P C = C t o t C R F + f k ( W T W C ) h f u l l _ l o a d
where fk is the maintenance and insurance cost factor, equal to 0.06 [31], and hfull_load are the full load operation hours, which are 7200.

8. Optimization of the Supercritical Cycles with a Genetic Algorithm

Genetic Algorithms are used to optimize processes; they are gaining increasing attention for use in multi-objective problems. This method has existed since the 1960s, and was developed by John Holland and collaborators [32]. It is a probabilistic, rather than a minimalistic method, based on the genetic structure and behavior of chromosomes. In this study, a genetic algorithm was utilized as an internal optimization method of the engineering software EES.
A genetic algorithm was utilized to set the prices of the functional parameters of the cycles to minimize the cost of the produced electricity (EPC) and make the investment of these installations more feasible. The load of the engine was set at 80% of the MCR and the external conditions were considered ISO (Air Temperature = 25 °C, Water Temperature = 25 °C). It is necessary to clarify that the minimization of the EPC does not mean the maximization of the produced power, because the EPC is dependent on the total investment cost, the generated power, and the operating hours. The maximization of the produced power would lead to a significant increase in the total investment cost. To conclude, the EPC was optimized to achieve a balance between the produced power and the installation cost. The parameters inserted into the genetic algorithm of every cycle are the following:
  • the pressure ratio in the compressor (phigh/plow).
  • the pinch point temperature difference (PPTD) in the heat exchanger of the intake air
  • the pinch point temperature difference (PPTD) in the heat exchanger of the exhaust gas, where it exits at an intermediate temperature (only in the split and cascade cycles)
  • the pinch point temperature difference (PPTD) in the heat exchanger of the exhaust gas, where it exits at its final temperature
  • the pinch point temperature difference (PPTD) in the recuperator
  • the intermediate temperature of the exhaust gas (only in the split and cascade cycles)
  • the final temperature of the exhaust gas
The starting pressure and temperature of the stream were set at 75 bar and 30 °C, and the PPTD in the condenser was set at 5 °C.

9. Exergo-Economic Analysis

Introduced by Lazzaretto and Tsatsaronis [33], exergo-economic analysis attributes cost to exergy streams in every component of a thermodynamic system based on existing energy, exergy, and economic analyses. In order to undertake this analysis, a cost balance equation for each component of the system has to be applied. The cost balance equation is the following [34,35]:
C ˙ e x e r g y , o u t + C ˙ w = C ˙ e x e r g y , i n + Q ˙ t h + C ˙ c a p i t a l , c o m p o n e n t
where C ˙ e x e r g y , o u t is the cost rate of the exergy stream that exits each component, C ˙ w is the cost rate of the produced power in each component, C ˙ e x e r g y , i n is the cost rate of the exergy stream that enters each component, and C ˙ c a p i t a l , c o m p o n e n t is the capital cost rate of each component. The previous equation can be expressed differently, as follows [36]:
( c e x e r g y , o u t E ˙ e x e r g y , o u t ) + ( c w , p r o d u c e d W ˙ p r o d u c e d ) = ( c e x e r g y , i n E ˙ e x e r g y , i n ) + ( c q , t h e r m a l E ˙ q , t h e r m a l ) + C ˙ c a p i t a l , c o m p o n e n t
where c i are the costs per exergy unit. The capital cost rate C ˙ c a p i t a l , c o m p o n e n t of each component may be calculated using the following equation [20,37]:
C ˙ c a p i t a l , c o m p o n e n t = ( C R F h f u l l _ l o a d + f k h f u l l _ l o a d ) C c o m p o n e n t
which sums the annual investment cost and the annual maintenance and operating costs. The values of CRF, fk, and hfull_load are depicted in the economic analysis. It should be noted at this point that the exergetic cost rate balance equations were used to calculate the energy costs of the components of the bottoming installation. In these equations, the exergetic mass flow rates that enter and exit each component of the installation have been introduced, and the capital cost rate of each component of the waste heat recovery installation has been derived. Hence, the inlet and outlet exergetic mass flow rates of each component of the bottoming installation, in conjunction with the capital cost rate of each component, constituted a system of equations, which was solved, providing the cost rate of all inlet and outlet exergy streams. Table 5 illustrates a system of equations which includes the cost balance equations and additional equations for each component. The solution of this system contains the cost rate for all the entering and exiting exergy streams and the cost per exergy unit for the produced and consumed power in each component at 80% of MCR. C · W A T E R , I N , C · W A T E R , O U T are set at zero due to the fact that the cooling water is sea water, which is free in the environment, and consequently, its cost is negligible [37]. Furthermore, C · G A S , I N , C · A I R , I N are set at zero [34], because the heat is harnessed from the exhaust gases of the engine before they exit the engine, and from the compressed air before it enters the intercooler; consequently, these are non-cost sources of heat.

10. Exergo-Environmental Analysis

Exergo-environmental analyses contains measurements about the exergetic efficiency of a system [38,39,40]. To perform this analysis, it is necessary to calculate the exergy destruction rate for each component of the supercritical cycle utilizing the relations depicted in Table 6.
The exergo-environmental factor is described as the total exergy destruction rate divided into the rate of inlet exergy, as follows:
f e i = E ˙ D E ˙ i n
The environmental damage effectiveness factor is described as the exergo-environmental factor divided into the exergy efficiency of the cycle, as follows:
J e i = f e i × C e i
where:
C e i = 1 n e x
is a coefficient of exergo-environmental impact.
The exergy stability factor is expressed as the total exergy destruction rate divided into the summation of total output exergy rate and total exergy destruction rate, as follows:
f e s = E ˙ D E ˙ x t o t , o u t + E ˙ D + 1
The previous parameters are preferred to reach their lowest possible value in order to exploit the maximum amount of exergy in the installation [40].
It should be clarified that the computational platform that was used to perform all calculations reported in the present study was the Engineering Equation Solver (EES) [41].

11. Results and Discussion

11.1. Multi-Optimization in the Simple Cycle

In the simple cycle, five parameters were inserted in the genetic algorithm with the following limits:
  • Pressure Ratio (phigh/plow): 1.5–3.5
  • PPTD in the heat exchanger of the intake air: 10–30 °C
  • PPTD in the heat exchanger of the exhaust gas: 10–30 °C
  • PPTD in the recuperator: 10–30 °C
  • Outlet temperature of the exhaust gas:160–190 °C
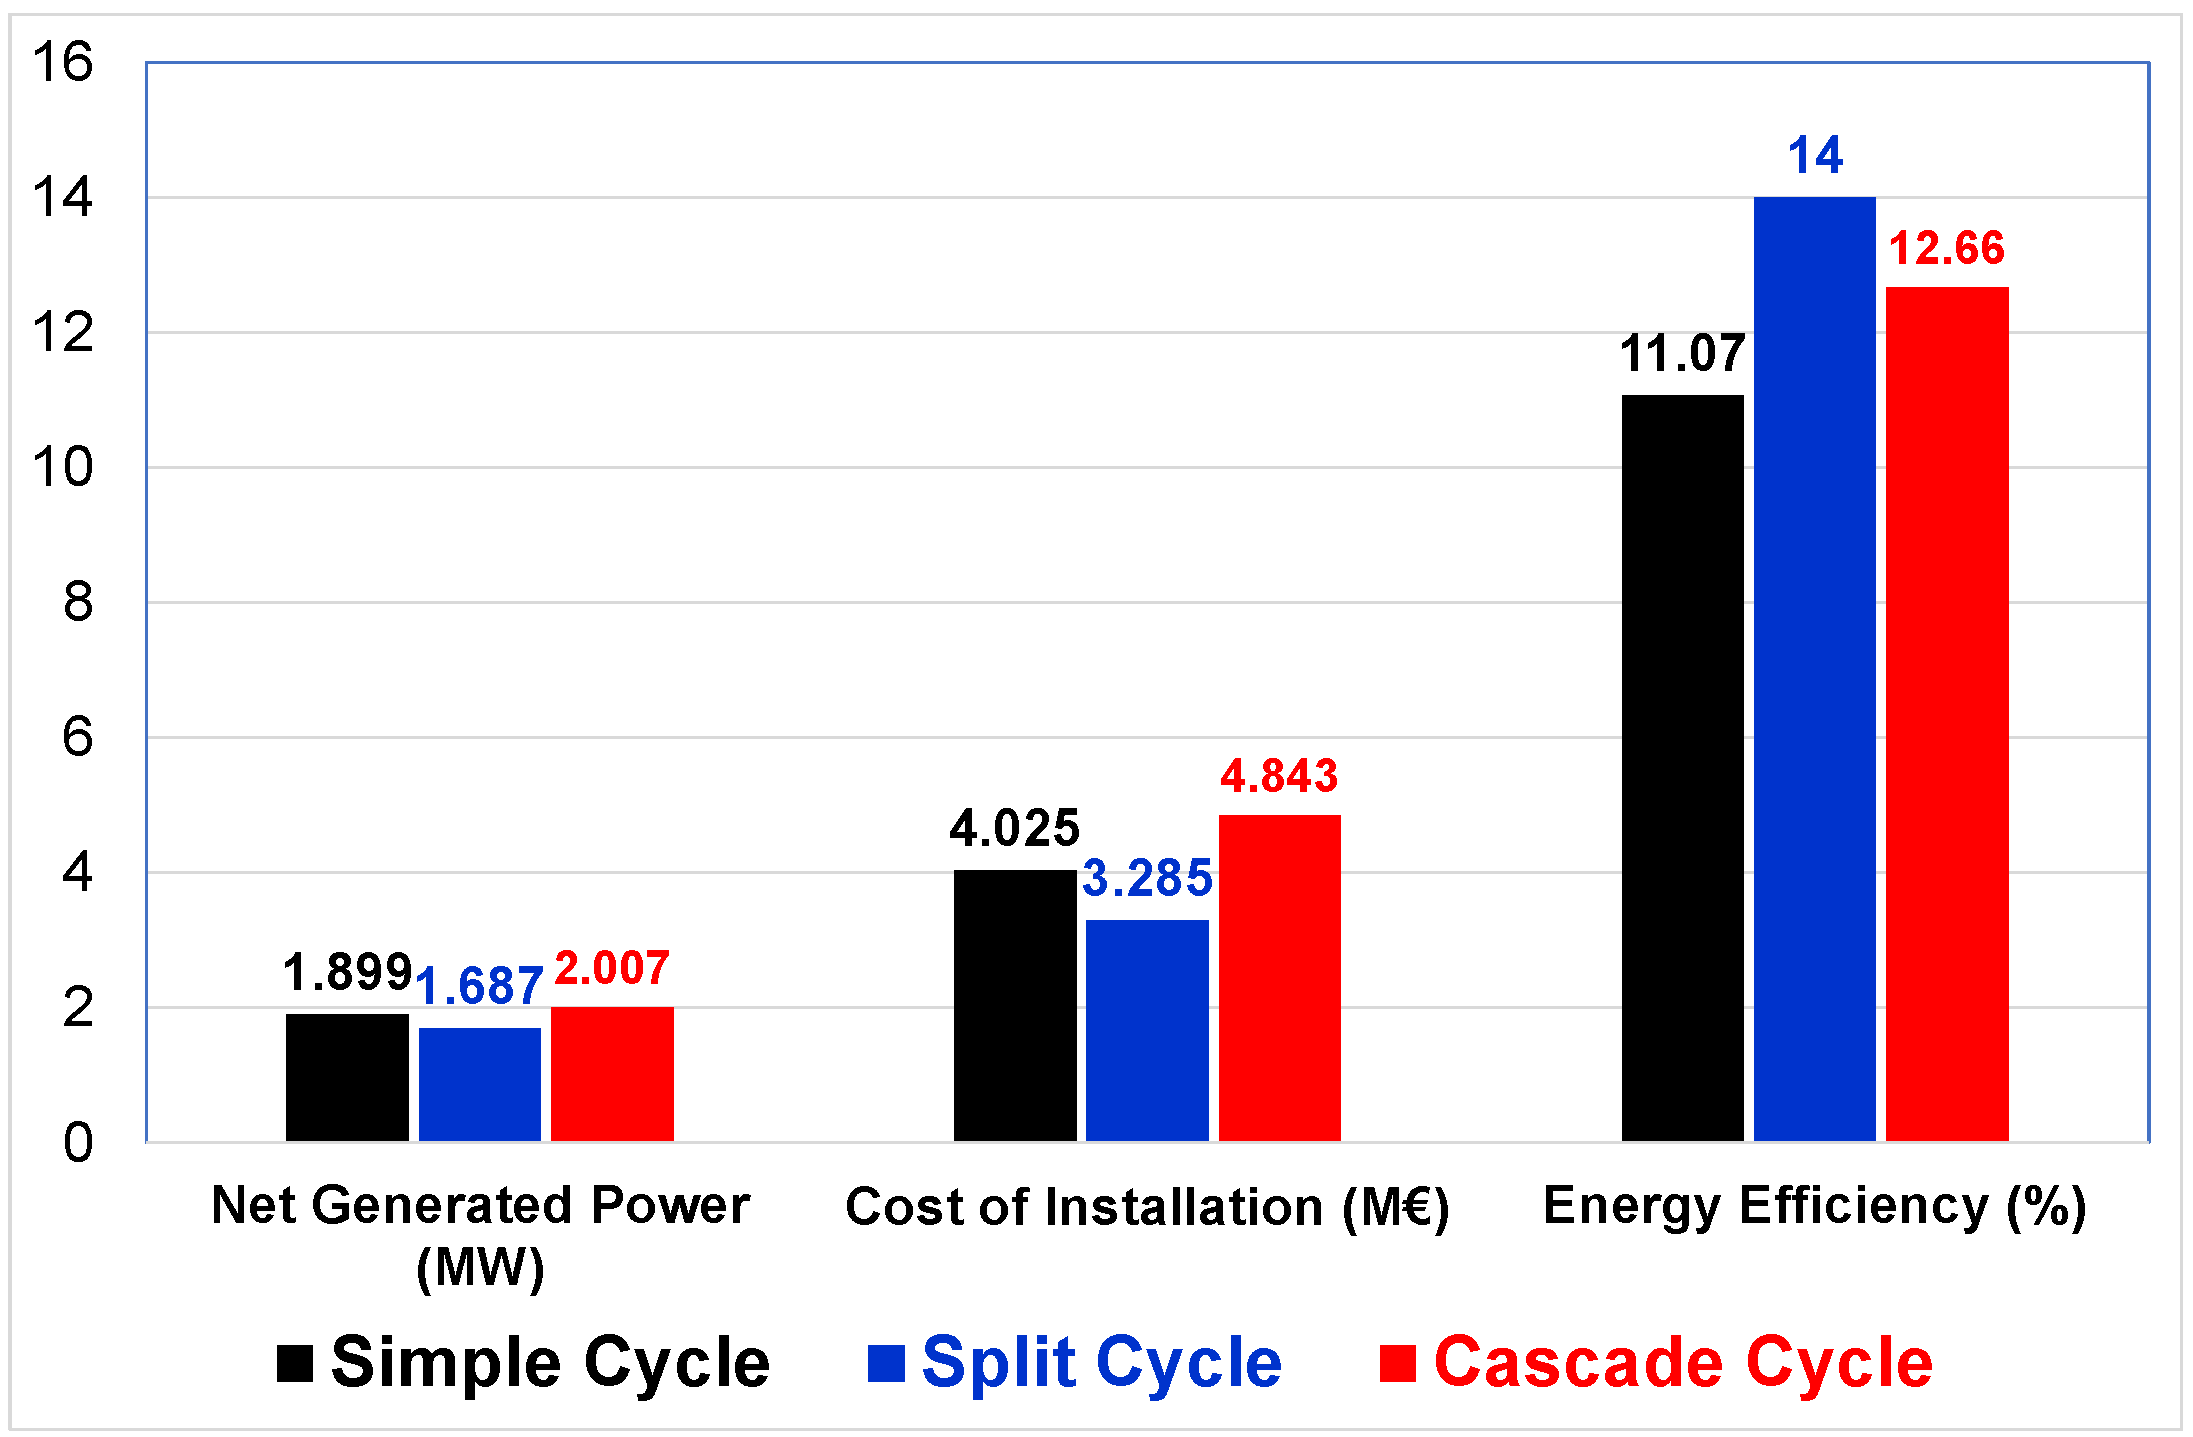
The results from the multi-optimization in the simple cycle are depicted in Table 7. As shown, the PPTD in the heat exchangers received the value of their lowest limits, except for the PPTD of the Heater 1. Moreover, the outlet temperature of the exhaust gas takes an intermediate value between the lowest and the upper limit, even though it could be set at its lowest rate to recover the maximum waste heat. This can be explained because to minimize the EPC, it is necessary to maintain a balance between the cost of the installation and the produced power. The thermal efficiency of the supercritical cycle is 11.07%, which is an average rate. As far as the cost of the components of the installation is concerned, the most expensive component is the compressor, followed by the turbine, with the overall cost reaching 4 million Euros. As far as the cost of the produced electricity is concerned, it is 0.05637 €/kWh.

11.2. Multi-Optimization in the Split Cycle

In the split cycle, seven parameters were inserted in the genetic algorithm with the following limits:
  • Pressure Ratio (phigh/plow): 2–4
  • PPTD in the heat exchanger of the intake air: 10–30 °C
  • PPTD in the intermediate heat exchanger of the exhaust gas: 10–30 °C
  • PPTD in the recuperator: 10–30 °C
  • PPTD in the final heat exchanger of the exhaust gas: 10–30 °C
  • Intermediate temperature of the exhaust gas: 190–205 °C
  • Outlet temperature of the exhaust gas: 150–180 °C
Table 8 demonstrates the results from the multi-optimization of the split cycle. The value of PPTDs in the heat exchangers are relatively low. The intermediate temperature of the exhaust gas almost reaches its upper limit, and consequently, Heater 3 harnesses most of the heat from the exhaust gas. The thermal efficiency of the supercritical cycle is 14%, which is relatively high. Despite the higher efficiency of the split cycle, the produced power in this cycle is less than in the simple cycle. As far as the cost of the installation is concerned, the most expensive component is the compressor; the overall cost reaches 3.3 million Euros. Finally, the cost of the produced electricity is 0.0518 €/kWh.

11.3. Multi-Optimization in the Cascade Cycle

In the cascade cycle, eight parameters were inserted in the genetic algorithm with the following limits:
  • Pressure Ratio (phigh/plow): 1.5–3
  • PPTD in the heat exchanger of the intake air: 10–30 °C
  • PPTD in the intermediate heat exchanger of the exhaust gas: 10–30 °C
  • PPTD in the final heat exchanger of the exhaust gas: 10–30 °C
  • Intermediate temperature of the exhaust gas: 190–210 °C
  • Outlet temperature of the exhaust gas: 150–180 °C
In Table 9, the results from the optimization of the cascade cycle are illustrated. The final temperature of the exhaust gas is the lowest limit, and subsequently, this cycle harnesses the maximum heat. The pressure ratio receives an intermediate value. The net produced power is 2.007 kW, which is the highest value among the supercritical cycles, and the thermal efficiency is 12.66%. The component with the highest installation cost is the condenser; the overall cost is 4.843 million Euros. The cost of the produced electricity is 0.0642 €/kWh, which is higher than in the other cycles due to the high cost of the installation.

11.4. Comparative Results from the Multi-Optimization of the Supercritical Cycles

Multi-optimization of the supercritical cycles with the genetic algorithm was carried out to find out which cycle had the lowest cost for the produced electricity. All cycles kept this cost low, but the split cycle showed the lowest value, as shown in Figure 8. Furthermore, Figure 9 depicts that the split cycle illustrated the highest energy efficiency and the lowest cost of installation but produced the least power. The simple cycle was in second place regarding the cost of the produced electricity, produced power, energy efficiency, and the cost of the installation. The cascade cycle produced the most power but had the highest electricity cost, the lower energy efficiency, and the highest installation cost.

11.5. Results from the Exergo-Economic Analysis

The system in Table 5 utilizing the EES software provided the results shown in Table 10. The objective of this table is to depict the cost of exergy streams in each component of the system in order to find out which streams have the highest cost. As observed, the streams entering and exiting Heater 3 are the costliest, at 527.4 €/h and 564.1 €/h, respectively. In these points, the exergy of the CO2 stream is maximized. On the other hand, the streams exiting the recuperator and Heater 1 are the least costly streams, i.e., 179.2 €/h and 338.3 €/h, respectively. In these states, the exergy of the CO2 stream is minimized. To conclude, the cost of the exergy stream seems to be proportionate to the amount of exergy it contains at each state.

11.6. Parametric Analysis of the Split Supercritical Cycle

A parametric analysis was carried out to depict the variation of various operating indicators in the split cycle with an engine load ranging from 55% to 100% of MCR in three different environmental conditions. These conditions are:
  • the ISO condition, where the air and seawater temperature are both 25 °C
  • the specified condition, where the air and seawater temperature are both 10 °C
  • the tropical condition, where the air temperature is 45 °C and the seawater temperature is 36 °C
Figure 10a illustrates the variation of the brake specific fuel consumption (bsfc) improvement with engine load in different environmental conditions. As observed, the bsfc was enhanced more in tropical conditions as the engine load increased; its highest value was almost 5%. The bsfc improvement in ISO conditions followed, it reaching its highest value, 4.24%, as the engine load increased. The lowest bsfc improvement was noticed in specified conditions, which the highest value was 2.6%. Figure 10b demonstrates the produced power in the split cycle in different conditions. In all conditions, the generated power increased as the engine load increased. In tropical conditions, the most generated power was 3542 kW, while in ISO conditions, this value is 3040 kW, and in specified conditions, 1800 kW. Figure 10c illustrates the thermal efficiency of the split cycle. As depicted, the efficiency changed slightly as the engine load increased. The efficiency of this cycle ranged from 13.7% to 14.5% in ISO conditions, from 12.4% to 13.5% in tropical conditions, and from 10.6% to 11.9% in specified conditions. Figure 10d shows the variation of the overall efficiency of the two-stroke engine combined with the split cycle. The overall efficiency of this installation ranged from 52.4% to 55.5% in ISO conditions, from 50.7% to 55.2% in tropical conditions, and from 52.89% to 54.4% in specified conditions. Based on Figure 10, it can be concluded that in tropical conditions, the bsfc is mostly improved and it generates the most power, whereas in ISO conditions, the efficiency of the cycle is higher.
Figure 11a demonstrates the variation of exergetic efficiency of the split cycle in different conditions. In ISO and tropical conditions remained almost stable as the engine load changed. The highest exergetic efficiency was observed in ISO conditions, where it ranged from 15.6% to 16.5%. In tropical conditions, the efficiency varied from 13.9% to 15.1%, and in specified conditions from 12.3% to 13.7%. Figure 10b illustrates the variation of total exergy destruction rate, which increased as the engine load increased. The lowest destruction was observed in specified conditions, in which the lowest value was 3560 kW and the highest was 11,370 kW. In ISO conditions, the total exergy destruction rate ranged from 5630 kW to 15,200 kW. In tropical conditions, the total exergy destruction rate ranged from 6948 kW to 19,487 kW.
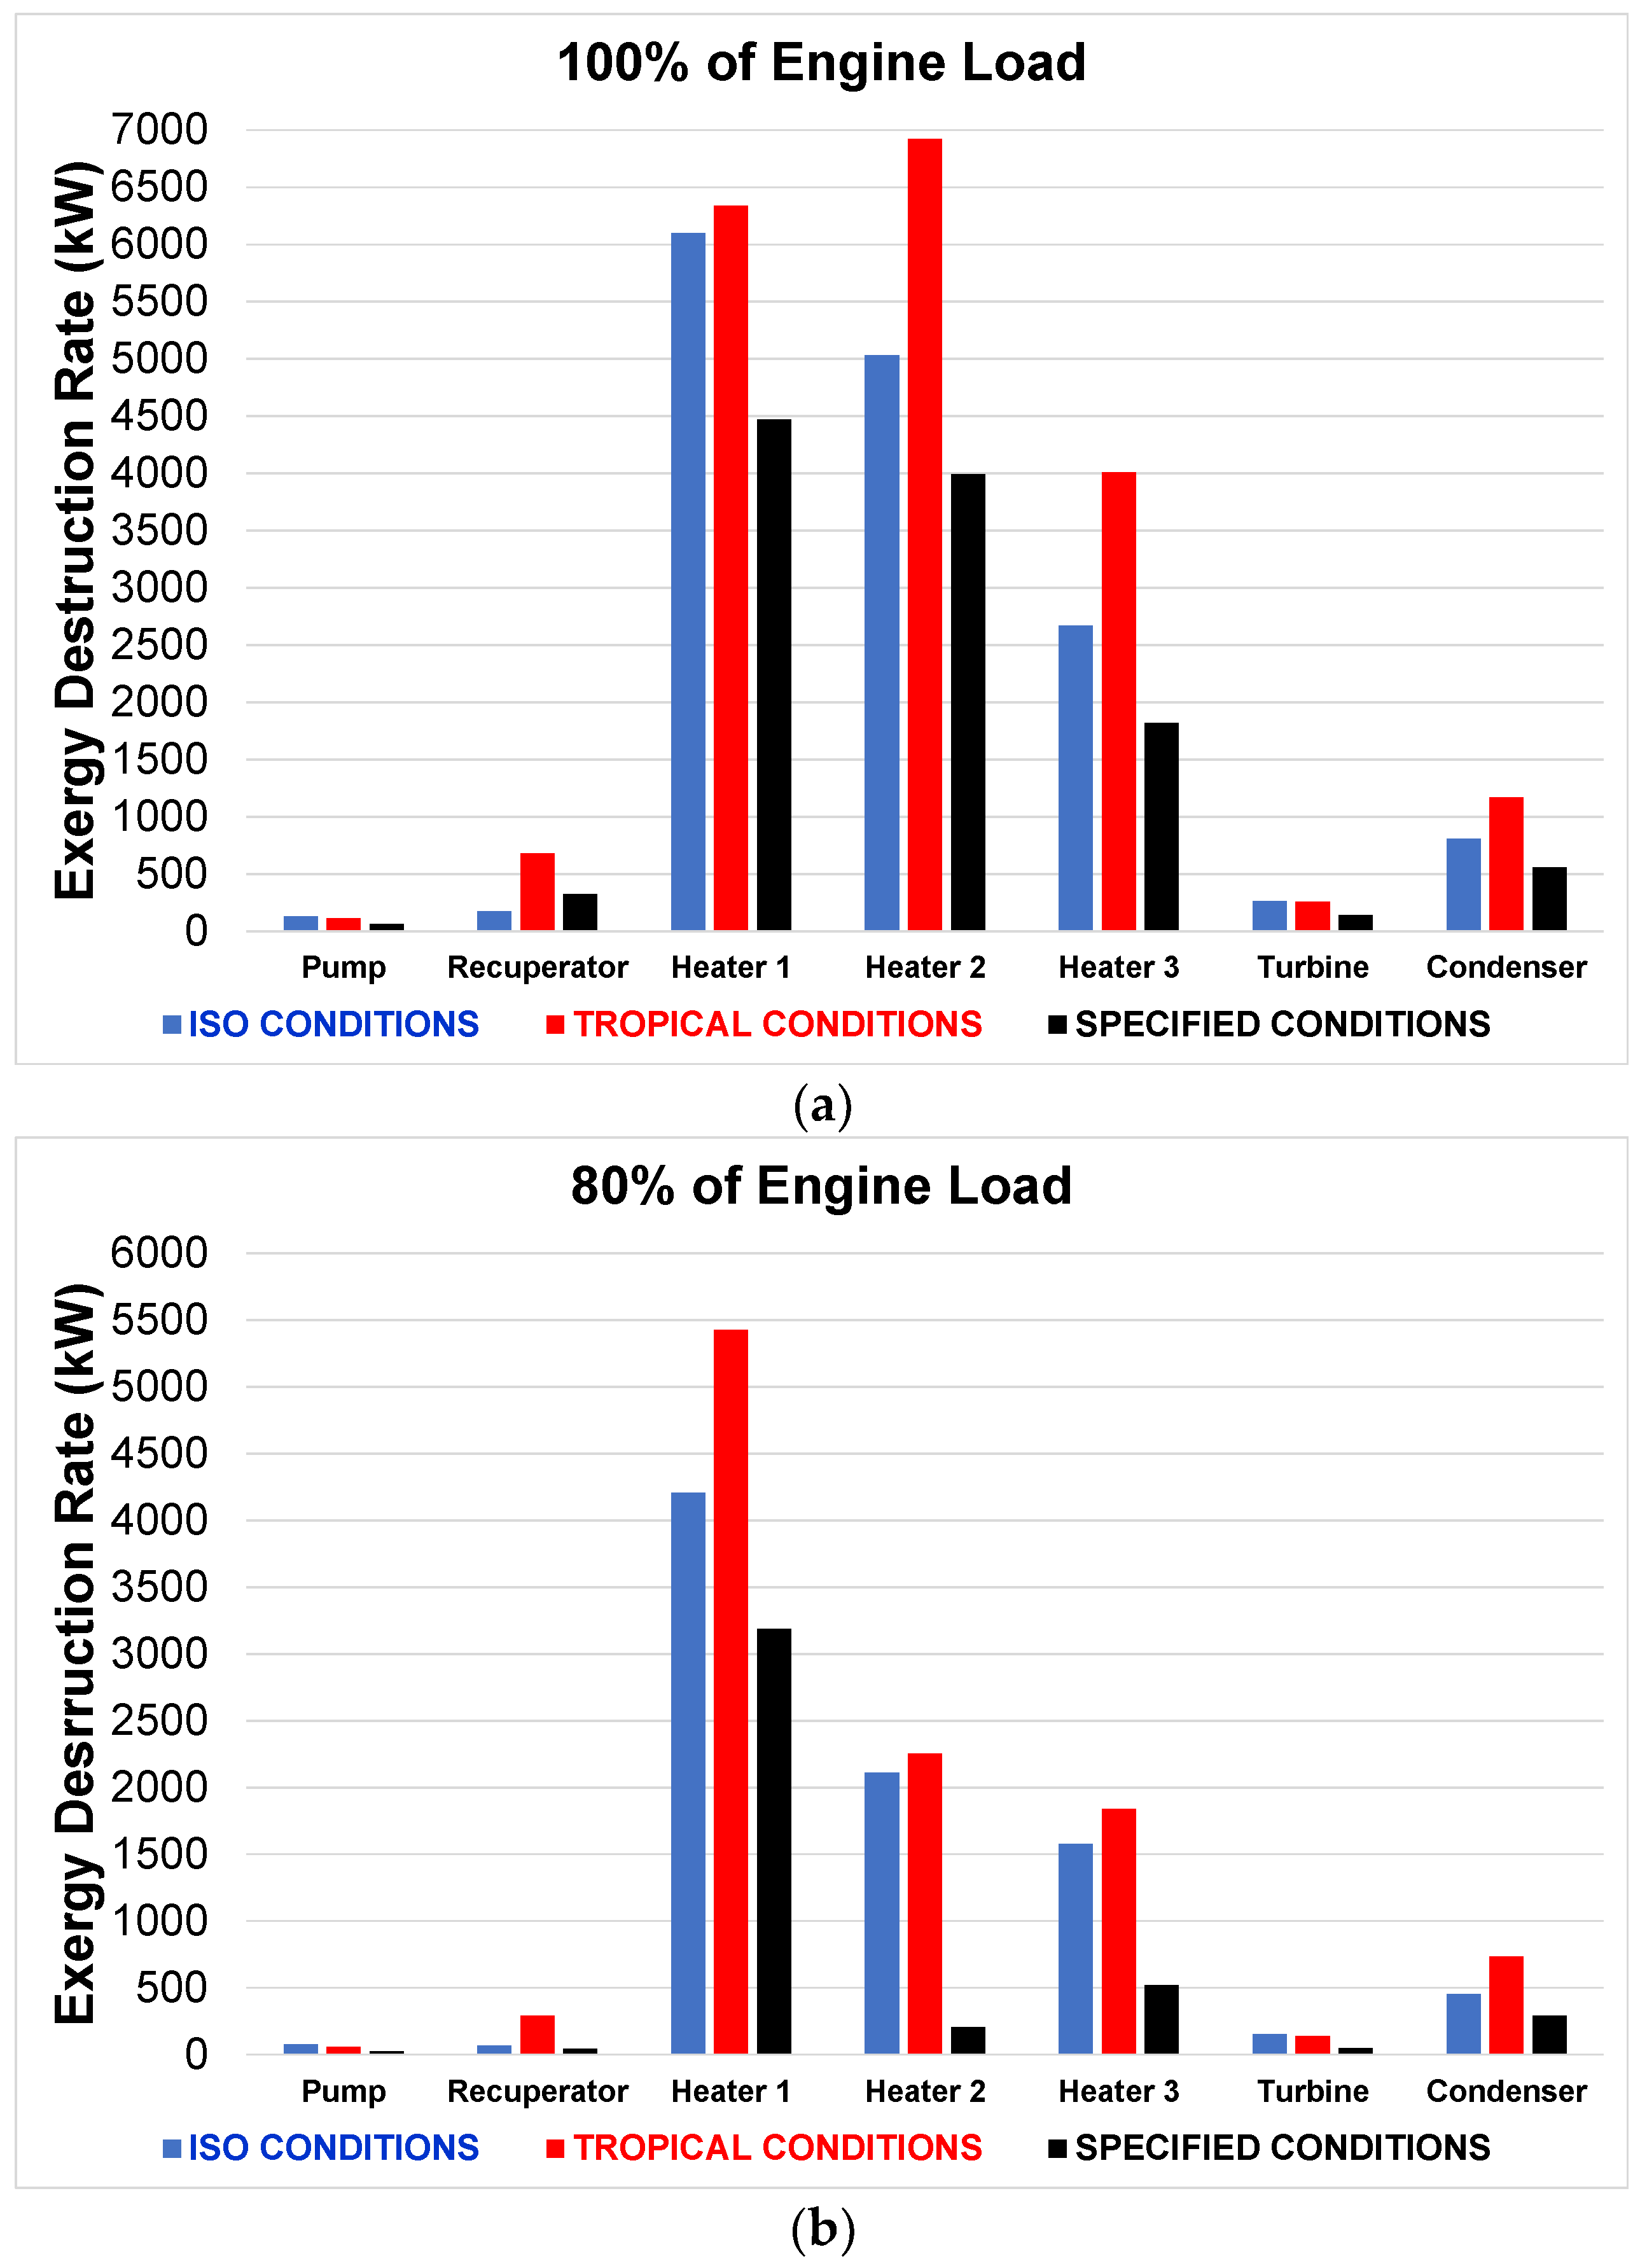
Figure 12a,b demonstrate the exergy destruction rate of each component in full load and in 80% of MCR. As indicated, the destruction rates in the compressor, the recuperator, the turbine, and the condenser were low and did not highly differ in full and partial loads. On the other hand, Heaters 1,2, and 3 were mainly responsible for the total exergy destruction rate. All the components had the maximum exergy destruction rate in tropical conditions, which was expected, given the data presented in Figure 11. In full load, Heater 2 presented the highest destruction rate, i.e., almost 7000 kW; Heater 1 was in second place with almost 6500 kW, and Heater 3 was in third place, with 4000 kW. At 80% MCR (partial load), Heater 1 presented the highest destruction rate, i.e., almost 5500 kW; Heater 2 was in second place with 2250 kW, and Heater 3 was in third place with 1800 kW. The exergy destruction rate of Heater 1 did not highly differ since the intermediate and outlet temperature of the exhaust gas did not change with different loads. In contrast, the exergy destruction rate of Heaters 2 and 3 differed significantly because the inlet temperature of exhaust gas changed considerably.
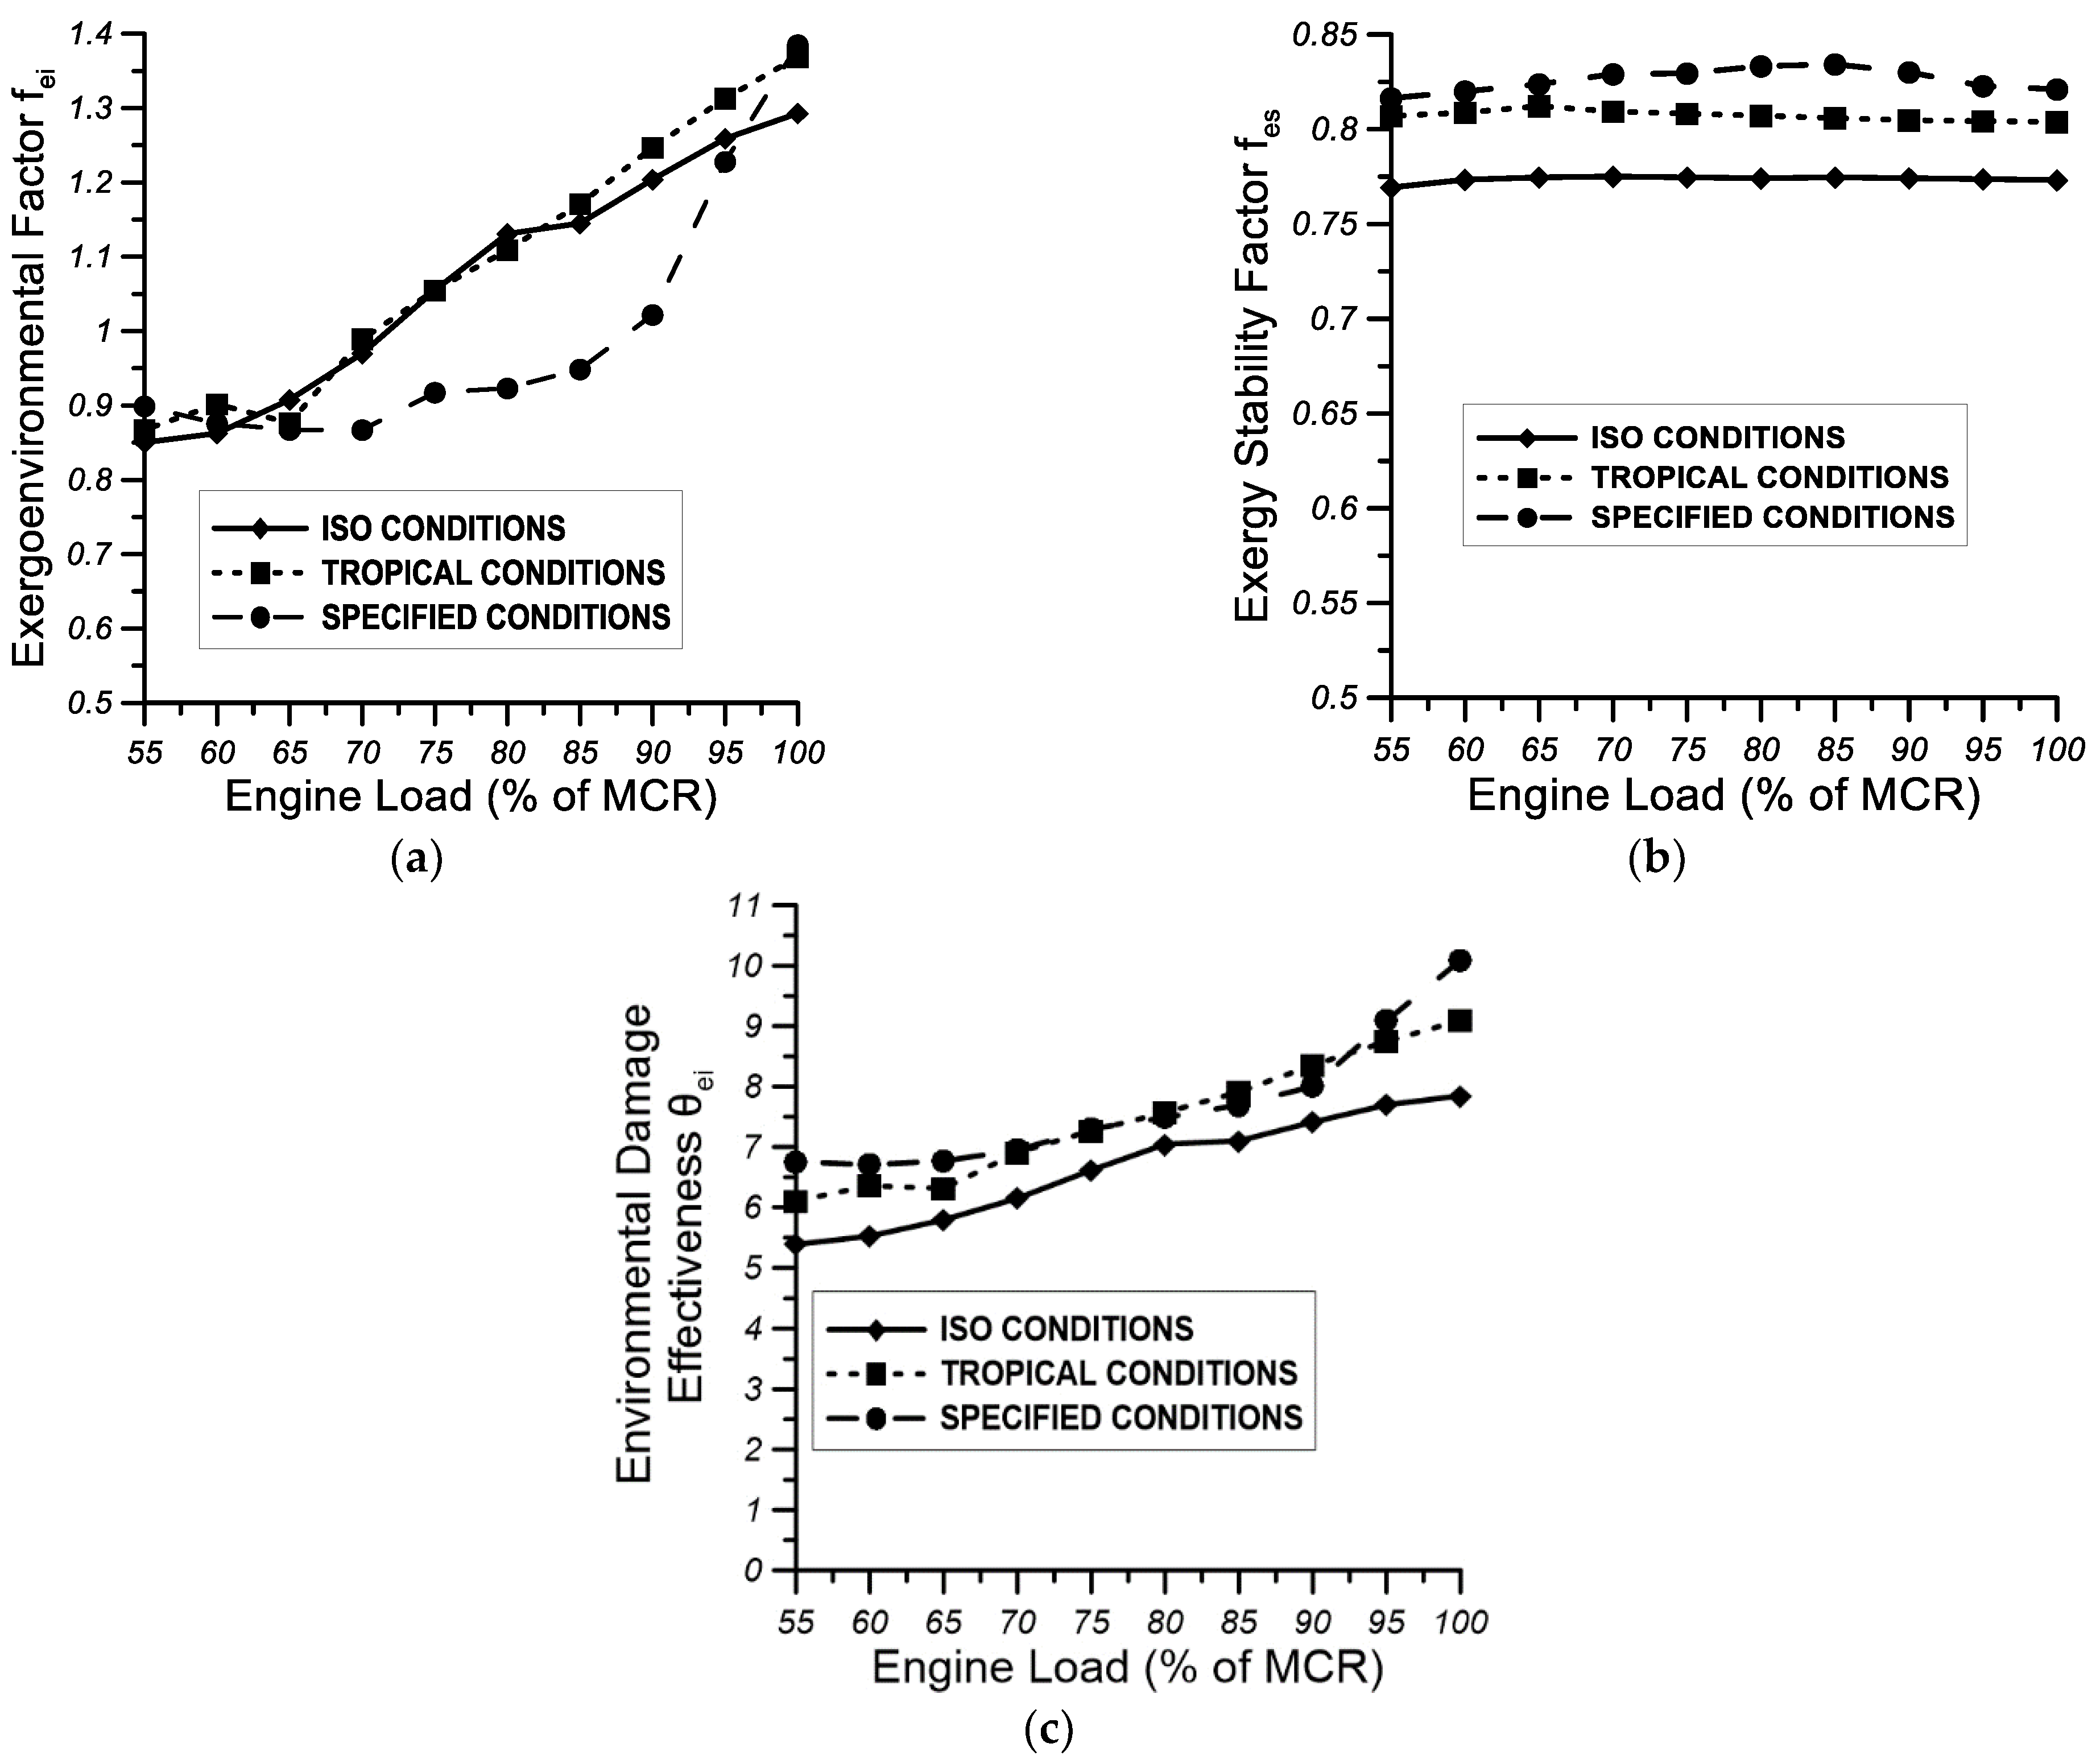
Figure 13a illustrates the variation of exergo-environmental factors in different conditions. The exergo-environmental factor increased as the engine load reached higher values. In ISO conditions, the exergo-environmental factor ranged from 0.85 to 1.29, in tropical conditions from 0.87 to 1.37, and in specified conditions from 0.87 to 1.39. Figure 13b demonstrates the variation of the exergy stability factor in different conditions. This factor remained almost stable as the engine load increased. In ISO conditions, the exergy stability factor ranged from 0.77 to 0.78, in tropical conditions from 0.80 to 0.81, and in specified conditions from 0.81 to 0.83. Figure 13c depicts the variation of environmental damage effectiveness. In ISO conditions, the environmental damage effectiveness ranged from 5.4 to 7.85, in tropical conditions from 6.1 to 9.1, and in specified conditions from 6.7 to 10.1. These factors were the basis of the exergo-environmental analysis in this study; it was desirable for them to be as low as possible. Of course, in ISO conditions, these factors reached the lowest values.
Figure 14 illustrates the cost rate of exergy streams at each state of the split cycle with full and partial loads in different conditions. The lowest cost rates were observed at State 3R in partial load and State 3H in full load. The highest cost rate was found at State 5 in both loads. The conditions did not significantly change the cost rate at most states, although in partial load and in ISO conditions, the cost rate was slightly higher than the other conditions in almost every state. Furthermore, it was noticed that in full load, every state had a higher cost rate, with the exception of State 3R.
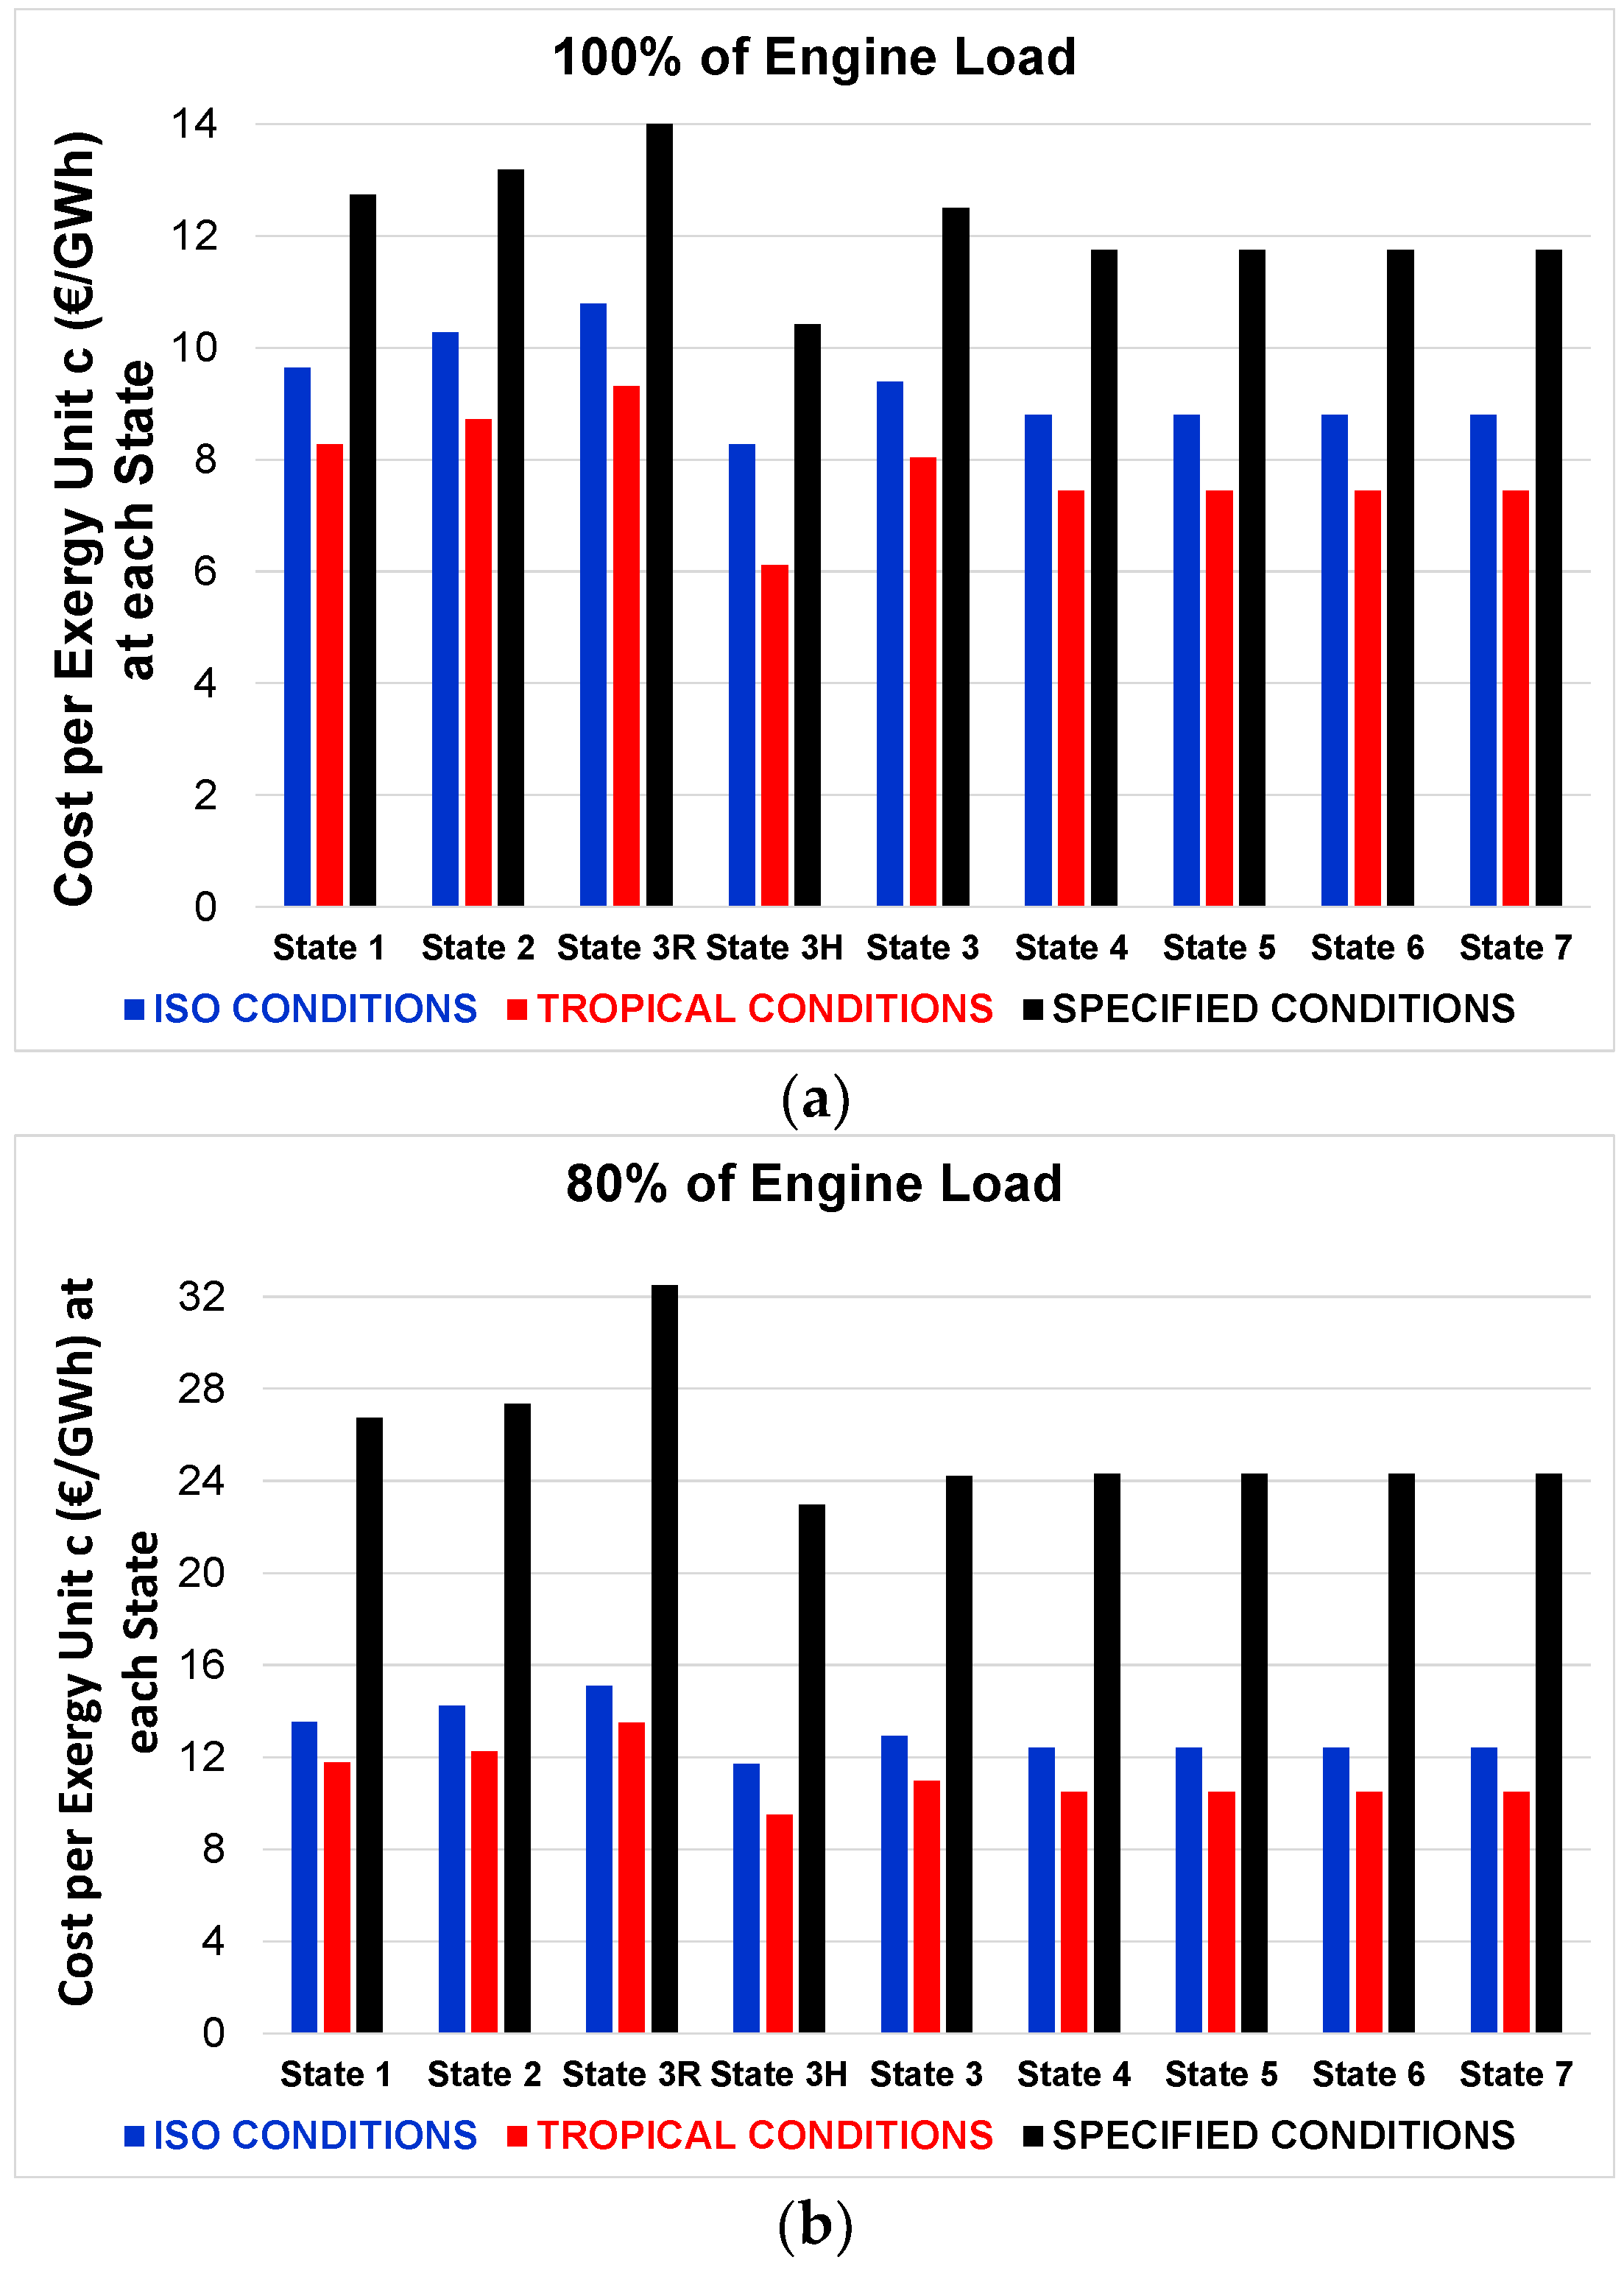
Figure 15 demonstrates the cost per exergy unit at each state of the split cycle at partial and full loads. Of course, in specified conditions, every state has higher exergy unit costs in both loads. This can be explained by the fact that the physical exergy in these conditions is less than in the other conditions. The lowest values occurred in tropical conditions. As for the split cycle states, the highest exergy unit cost occurred at State 3R and the lowest exergy unit cost at State 3H in both loads.
At this point, it would be useful to present a discussion about the relationship between the analysis and the results of the present study compared to the corresponding analyses and results presented in other studies. The concept for the design and analysis of the three supercritical CO2 cycles was based on a similar study by Kim et al. [11], which modeled a simple, a split, and a cascade supercritical CO2 cycle to harness waste heat from a gas turbine in a shore installation. However, the three supercritical CO2 cycles presented and analyzed in the present study were not the same as the ones presented and modelled in that study [11], because they were modified to be coupled optimally with the temperature levels of waste heat streams of the main two-stroke marine diesel engine of the examined 6800 TEU container ship. As such, they were quite different from the ones harnessing waste heat from a gas turbine, as discussed in [11]. In addition, the theoretical results of the present thermo-economic, exergo-economic, exergo-environmental, and optimization study can be compared with the results of the thermodynamic analyses of Kim et al. [11] only on a qualitative basis, as they are not directly related is a quantitative sense. Furthermore, the exergo-economic and exergo-environmental analyses presented in the literature [12,13,14,15] are related to shore installations and to the utilization of waste heat from energy sources other than two-stroke main marine diesel engines. Hence, a comparison of the present exergo-economic and exergo-environmental results with pertinent results from the literature [12,13,14,15] can only be made on a qualitative basis. It can be concluded that since there is not a direct match between the integrated theoretical analysis and results of the present study with pertinent analyses and results presented in other studies, the present study is innovative in nature.

Author Contributions

Conceptualization, T.C.Z. and A.G.V.; software, A.G.V.; data curation, A.G.V., E.V.H., E.A.Y. and E.G.P.; methodology, A.G.V., T.C.Z. and E.G.P.; supervision, E.A.Y., D.T.H., E.V.H. and J.S.K.; writing—original draft preparation, T.C.Z. and A.G.V.; writing—review and editing, T.C.Z., J.S.K. and A.G.V. All authors have read and agreed to the published version of the manuscript.

Funding

Part of this research has been co-financed by the European Union and Greek national funds through the Operational Program Competitiveness, Entrepreneurship, and Innovation, under the call RESEARCH—CREATE—INNOVATE (project code: T2EDK-03241).

Conflicts of Interest

The authors declare no conflict of interest.

Nomenclature

AArea (m2)
AHXHeat exchanger area (m2)
B1,HXConstant that is based on the heat exchanger type
B2,HXConstant that is based on the heat exchanger type
bchannel spacing (m)
C1,HXConstant that depend on the type of heat exchanger
CHX0Bare module cost of the heat exchanger
C1,CConstant that is based on the compressor
C2,HXConstant that depend on the type of heat exchanger
C2,CConstant that is based on the compressor
C3,HXConstant that depend on the type of heat exchanger
C3,CConstant that is based on the compressor
CEXPCapital cost of the expander
CEXP0Bare module cost of the expander
CHXCapital cost of the heat exchanger
CCCapital cost of the compressor
CC0Bare module cost of the compressor
cpheat capacity (J/kgK)
C ˙ cost balance rate
ccost per exergy unit
DhHydraulic port diameter (m)
feiexergoenvironmental factor
fkMaintenance and insurance cost factor
FM,HXMaterial factor of heat exchanger
FBMMaterial factor of the compressor
FMPAdditional expander factor
FP,HXPressure factor of heat exchanger
FP,CPressure factor of the compressor
FSConstruction overhead cost factor
hConvective heat transfer coefficient (W/m2 K)
hSpecific enthalpy (J/kg)
hfull_loadFull load operation hours
hinConvective heat transfer coefficient of the heat exchanger internal flow (W/m2 K)
iInterest rate
Eexergy
K1,EXPConstant that is based on the type of the expander
K1,HXConstant that is based on the heat exchanger type
K1,CConstant that is based on the compressor
K2,EXPConstant that is based on the type of the expander
K2,HXConstant that is based on the heat exchanger type
K2,CConstant that is based on the compressor
K3,EXPConstant that is based on the type of the expander
K3,HXConstant that is based on the heat exchanger type
K3,CConstant that is based on the compressor
kThermal conductivity (W/m K)
lLength (m)
LTplPlant lifetime
mMass (kg)
m ˙ Mass flow rate (kg/s)
nEfficiency
NNumber
pPressure (MPa)
phighhigh pressure of the cycle
plowlow pressure of the cycle
W ˙ T Power output of turbine
W ˙ C Power consumption of compressor
W ˙ n e t Net power produced
qSpecific heat (J/kg)
QHeat (J)
Q ˙ Heat transfer rate (W)
rinFouling resistance of the heat exchanger internal flow (m2 K/W)
routFouling resistance of the heat exchanger external flow (m2 K/W)
sSpecific entropy (J/kgK)
TTemperature (°C)
T0Reference temperature of exergy destruction rate (K)
Uheat transfer coefficient (W/m2Κ)
wChannel width (m)
xpercentage of mass flow rate
Greek
βRib effect coefficient or chevron angle
δFin height (m)
ΔTtemperature difference (K)
εConvection factor or effectiveness of the heat exchanger
εHeat exchanger effectiveness
λThermal conductivity (W/m K)
μDynamic viscosity ()
θeienvironmental damage effectiveness factor
Subscripts
0Reference
isisentropic
recuprecuperator
heater1heat exchanger of exhaust gas
heater2heat exchanger of scavenge air
heater3heat exchanger of exhaust gas
airscavenge air
gasexhaust gas
gas,inexhaust gas inlet
gas,outexhaust gas outlet
air,inscavenge air inlet
air,outscavenge air outlet
condcondenser
exexergetic
watersea water
water,insea water inlet
water,outsea water outlet
gas,midexhaust gas intermediate outlet
Tturbine
Ccompressor
Ddestruction
condcondenser
Hhigh
Llow
Rrecuperator
ththermal
ininput
phphysical
maxmaximum
minminimum
plateplate heat exchanger
tottotal
exergy,inexergy input
exergy,outexergy output
wproduced power
Dimensionless numbers
NuNusselt number
PrPrandtl number
ReReynolds number
Abbreviations
bsfcBrake specific fuel consumption
CEPCIChemical engineering plant cost index
CO2Carbon dioxide
CRFCapital recovery factor
EPCElectricity production cost
HTHigh temperature
HXHeat exchanger
LNGLiquefied natural gas
LTLow Temperature
MCTModule cost technique
TICTotal investment cost
TEUtwenty-foot equivalent unit
MCRmaximum continuous rating
LMTDLogarithmic mean temperature difference

References

  1. UNCTAD. Review of Maritime Transport 2021; United Nations: New York, NY, USA, 2022. [Google Scholar]
  2. Smith, T.W.P.; Jalkanen, J.P.; Anderson, B.A.; Corbett, J.J.; Faber, J.; Hanayama, S.; O’Keeffe, E.; Parker, S.; Johansson, L.; Aldous, L.; et al. Third IMO Greenhouse Gas Study 2014; The International Maritime Organization: London, UK, 2015. [Google Scholar]
  3. Joung, T.-H.; Kang, S.-G.; Lee, J.-K.; Ahn, J. The IMO initial strategy for reducing greenhouse gas (GHG) emissions, and its follow-up actions towards 2050. J. Int. Marit. Saf. Environ. Aff. Shipp. 2020, 4, 1–7. [Google Scholar] [CrossRef] [Green Version]
  4. Jouhara, H.; Khordehgah, N.; Almahmoud, S.; Delpech, B.; Chauhan, A.; Tassou, S.A. Waste heat recovery technologies and applications. Therm. Sci. Eng. Prog. 2018, 6, 268–289. [Google Scholar] [CrossRef]
  5. Liu, L.; Yang, Q.; Cui, G. Supercritical Carbon Dioxide(s-CO2) power cycle for waste heat recovery: A review from thermodynamic perspective. Processes 2020, 8, 1461. [Google Scholar] [CrossRef]
  6. Liu, P.; Shu, G.; Tian, H. Carbon dioxide as working fluids in transcritical Rankine cycle for diesel engine multiple waste heat recovery in comparison to hydrocarbons. J. Therm. Sci. 2019, 28, 494–504. [Google Scholar] [CrossRef]
  7. Wang, X.; Yang, Y.; Zheng, Y.; Dai, Y. Exergy and exergoeconomic analyses of a supercritical CO2 cycle for a cogeneration application. Energy 2017, 119, 971–982. [Google Scholar] [CrossRef]
  8. Pan, P.; Yuan, C.; Sun, Y.; Yan, X.; Lu, M.; Bucknall, R. Thermo-economic analysis and multi-objective optimization of S-CO2 Brayton cycle waste heat recovery system for an ocean-going 9000 TEU container ship. Energy Convers. Manag. 2020, 221, 113077. [Google Scholar] [CrossRef]
  9. Su, R.; Yu, Z.; Xia, L.; Sun, J. Performance analysis and multi-objective optimization of an integrated gas turbine/supercritical CO2 recompression/transcritical CO2 cogeneration system using liquefied natural gas cold energy. Energy Convers. Manag. 2020, 220, 113136. [Google Scholar] [CrossRef]
  10. Xia, W.; Huo, Y.; Song, Y.; Han, J.; Dai, Y. Off-design analysis of a CO2 Rankine cycle for the recovery of LNG cold energy with ambient air as heat source. Energy Convers. Manag. 2019, 183, 116–125. [Google Scholar] [CrossRef]
  11. Kim, Y.M.; Sohn, J.L.; Yoon, E.S. Supercritical CO2 Rankine cycles for waste heat recovery from gas turbine. Energy 2017, 118, 893–905. [Google Scholar] [CrossRef]
  12. Belman-Flores, J.M.; Rangel-Hernández, V.H.; Pérez-García, V.; Zaleta-Aguilar, A.; Fang, Q.; Méndez-Méndez, D. An advanced exergoeconomic comparison of CO2-based transcritical refrigeration cycles. Energies 2020, 13, 6454. [Google Scholar] [CrossRef]
  13. Marques, A.D.S.; Carvalho, M.; Ochoa, Á.A.V.; Souza, R.J.; dos Santos, C.A.C. Exergoeconomic assessment of a compact electricity-cooling cogeneration unit. Energies 2020, 13, 5417. [Google Scholar] [CrossRef]
  14. Valencia Ochoa, G.; Piero Rojas, J.; Duarte Forero, J. Advance exergo-economic analysis of a waste heat recovery system using ORC for a bottoming natural gas engine. Energies 2020, 13, 267. [Google Scholar] [CrossRef] [Green Version]
  15. Nami, H.; Mahmoudi, S.M.S.; Nemati, A. Exergy, economic and environmental impact assessment and optimization of a novel cogeneration system including a gas turbine, a supercritical CO2 and an Organic Rankine Cycle (GT-HRSG/SCO2). Appl. Therm. Eng. 2017, 110, 1315–1330. [Google Scholar] [CrossRef]
  16. CEAS Engine Calculations–MAN Energy Solutions. Available online: https://marine.man-es.com/two-stroke/ceas (accessed on 10 December 2021).
  17. Choi, B.C.; Kim, Y.M. Thermodynamic analysis of a dual loop heat recovery system with trilateral cycle applied to exhaust gases of internal combustion engine for propulsion of the 6800 TEU container ship. Energy 2013, 58, 404–416. [Google Scholar] [CrossRef]
  18. Hossain, M.J.; Chowdhury, J.I.; Balta-Ozkan, N.; Asfand, F.; Saadon, S.; Imran, M. Design optimization of supercritical carbon dioxide (s-CO2) cycles for waste heat recovery from marine engines. J. Energy Resour. Technol. 2021, 143, 120901. [Google Scholar] [CrossRef]
  19. Zahedi, E.; Woerz, C.; Reichardt, G.; Umlauf, G.; Liewald, M.; Barz, J.; Weber, R.; Graf, T. Lubricant-free deep drawing using CO2 and N2 as volatile media injected through laser-drilled microholes. MATEC Web Conf. 2018, 190, 14007. [Google Scholar] [CrossRef]
  20. Wang, X.; Dai, Y. Exergoeconomic analysis of utilizing the transcritical CO2 cycle and the ORC for a recompression supercritical CO2 cycle waste heat recovery: A Comparative study. Appl. Energy 2016, 170, 193–207. [Google Scholar] [CrossRef]
  21. Liu, P.; Shu, G.; Tian, H. How to approach optimal practical organic Rankine cycle (OP-ORC) by configuration modification for diesel engine waste heat recovery. Energy 2019, 174, 543–552. [Google Scholar] [CrossRef]
  22. Cao, E. Heat Transfer in Process Engineering; McGraw-Hill: New York, NY, USA, 2010. [Google Scholar]
  23. Yang, F.; Cho, H.; Zhang, H.; Zhang, J. Thermoeconomic Multi-objective optimization of a dual loop organic Rankine cycle (ORC) for CNG engine waste heat recovery. Appl. Energy 2017, 205, 1100–1118. [Google Scholar] [CrossRef]
  24. García-Cascales, J.R.; Vera-García, F.; Corberán-Salvador, J.M.; Gonzálvez-Maciá, J. Assessment of boiling and condensation heat transfer correlations in the modelling of plate heat exchangers. Int. J. Refrig. 2007, 30, 1029–1041. [Google Scholar] [CrossRef]
  25. Turton, R. Analysis, Synthesis, and Design of Chemical Processes, 5th ed.; Prentice Hall: Boston, MA, USA, 2018. [Google Scholar]
  26. Lee, S.H.; Lim, D.-H.; Park, K. Optimization and economic analysis for small-scale movable LNG liquefaction process with leakage considerations. Appl. Sci. 2020, 10, 5391. [Google Scholar] [CrossRef]
  27. Yang, M.-H.; Yeh, R.-H. Thermodynamic and economic performances optimization of an organic Rankine cycle system utilizing exhaust gas of a large marine diesel engine. Appl. Energy 2015, 149, 1–12. [Google Scholar] [CrossRef]
  28. Yan, Y.-Y.; Lin, T.-F. Evaporation heat transfer and pressure drop of refrigerant R-134a in a plate heat exchanger. J. Heat Transfer 1999, 121, 118–127. [Google Scholar] [CrossRef]
  29. Nafey, A.S.; Sharaf, M.A. Combined solar organic Rankine cycle with reverse osmosis desalination process: Energy, exergy, and cost evaluations. Renew. Energy 2010, 35, 2571–2580. [Google Scholar] [CrossRef]
  30. Thanganadar, D.; Asfand, F.; Patchigolla, K. Thermal performance and economic analysis of supercritical carbon dioxide cycles in combined cycle power plant. Appl. Energy 2019, 255, 113836. [Google Scholar] [CrossRef]
  31. Ghaebi, H.; Parikhani, T.; Rostamzadeh, H.; Farhang, B. Thermodynamic and thermoeconomic analysis and optimization of a novel combined cooling and power (CCP) cycle by integrating of ejector refrigeration and Kalina cycles. Energy 2017, 139, 262–276. [Google Scholar] [CrossRef]
  32. Yang, X.-S. Nature-Inspired Optimization Algorithms, 1st ed.; Elsevier Inc.: San Diego, CA, USA, 2020. [Google Scholar]
  33. Bejan, A.; Tsatsaronis, G.; Moran, M.J. Thermal Design and Optimization; Wiley: New York, NY, USA, 1996. [Google Scholar]
  34. Mohammed, R.H.; Ibrahim, M.M.; Abu-Heiba, A. Exergoeconomic and multi-objective optimization analyses of an organic Rankine cycle integrated with multi-effect desalination for electricity, cooling, heating power, and freshwater production. Energy Convers. Manag. 2021, 231, 113826. [Google Scholar] [CrossRef]
  35. Shamoushaki, M.; Aliehyaei, M.; Taghizadeh-Hesary, F. Energy, exergy, exergoeconomic, and exergoenvironmental assessment of flash-binary geothermal combined cooling, heating, and power cycle. Energies 2021, 14, 4464. [Google Scholar] [CrossRef]
  36. Yilmaz, C.; Kanoglu, M.; Abusoglu, A. Exergetic cost evaluation of hydrogen production powered by combined flash-binary geothermal power plant. Int. J. Hydrogen Energy 2015, 40, 14021–14030. [Google Scholar] [CrossRef]
  37. Zare, V.; Mahmoudi, S.M.S.; Yari, M. On the exergoeconomic assessment of employing Kalina cycle for GT-MHR waste heat utilization. Energy Convers. Manag. 2015, 90, 364–374. [Google Scholar] [CrossRef]
  38. Ratlamwala, T.A.H.; Dincer, I.; Reddy, B.V. Exergetic and environmental impact assessment of an integrated system for utilization of excess power from thermal power plant. In Causes, Impacts and Solutions to Global Warming; Dincer, I., Colpan, C.O., Kadioglu, F., Eds.; Springer: New York, NY, USA, 2013; pp. 803–824. [Google Scholar] [CrossRef]
  39. Midilli, A.; Dincer, I. Development of some exergetic parameters for PEM fuel cells for measuring environmental impact and sustainability. Int. J. Hydrogen Energy 2009, 34, 3858–3872. [Google Scholar] [CrossRef]
  40. Abbaspour, H.; Ehyaei, M.A.; Ahmadi, A.; Panahi, M.; Abdalisousan, A.; Mirzohosseini, A. Energy, exergy, economic, exergoenvironmental and environmental (5e) analyses of the cogeneration plant to produce electrical power and urea. Energy Convers. Manag. 2021, 235, 113951. [Google Scholar] [CrossRef]
  41. Engineering Equation Solver (EES). F-Chart Software; F-Chart Software: Madison, WI, USA, 2022; Available online: https://www.fchartsoftware.com/ees/ (accessed on 1 June 2022).
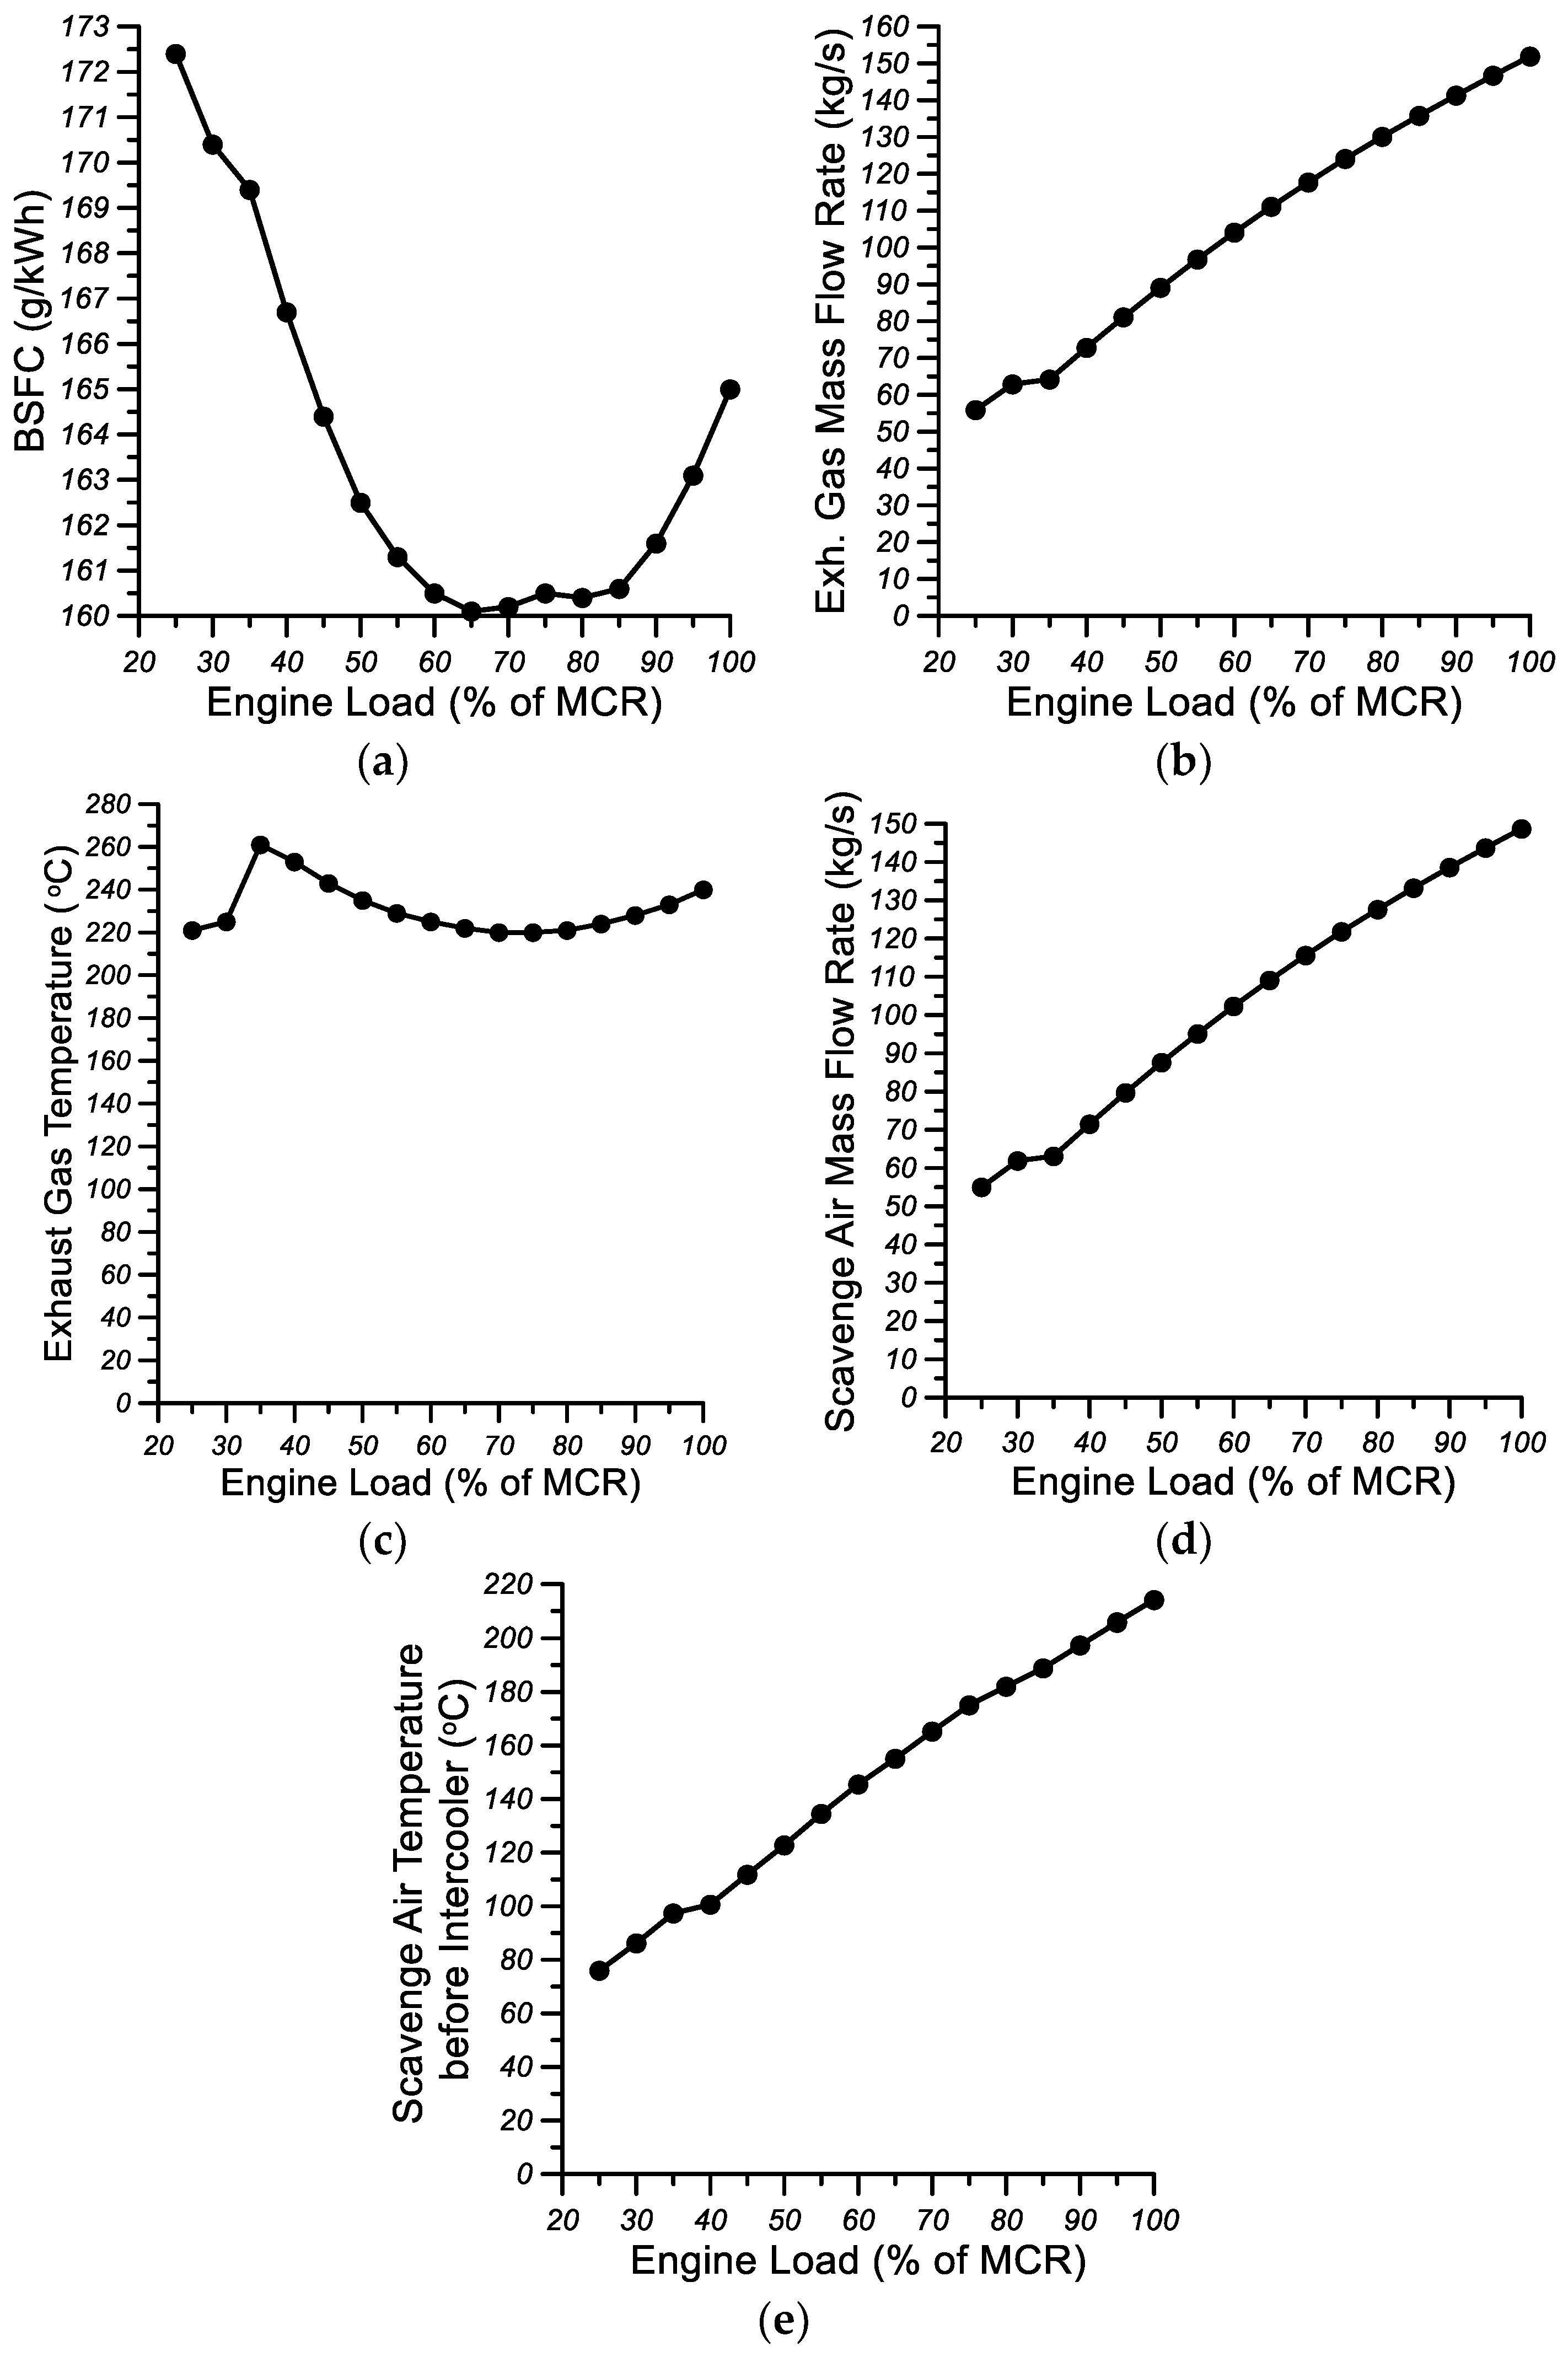
Figure 1. Variation of (a) BSFC, (b) exhaust gas mass flow rate, (c) exhaust gas temperature, (d) scavenge air mass flow rate, and (e) scavenge air temperature before the intercooler with engine load. Experimental results are given for a two-stroke main marine diesel engine using data adopted from Ref. [16].
Energies 15 05398 g001
Figure 2. Schematic of a simple supercritical CO2 bottoming cycle.
Energies 15 05398 g002
Figure 3. Representation of a simple supercritical CO2 cycle at temperature–entropy (T-s).
Energies 15 05398 g003
Figure 4. Schematic view of the split supercritical CO2 cycle.
Energies 15 05398 g004
Figure 5. Representation of the split supercritical CO2 cycle at temperature–entropy (T-s).
Energies 15 05398 g005
Figure 6. Schematic view of the cascade supercritical CO2 cycle.
Energies 15 05398 g006
Figure 7. Representation of the cascade supercritical CO2 cycle at T–s.
Energies 15 05398 g007
Figure 8. Theoretical results for the Electricity Production Cost (EPC) of the simple supercritical CO2 cycle, the split supercritical CO2 cycle, and the cascade supercritical CO2 cycle.
Energies 15 05398 g008
Figure 9. Theoretical results for the net generated power, the installation cost, and the thermal efficiency of the simple supercritical CO2 cycle, the split supercritical CO2 cycle, and the cascade supercritical CO2 cycle.
Energies 15 05398 g009
Figure 10. Variation of (a) BSFC improvement, (b) generated power, (c) efficiency of the split supercritical cycle, (d) overall efficiency of the engine combined with the split cycle with engine load for ISO, tropical, and specified conditions.
Energies 15 05398 g010
Figure 11. Variation of (a) exergy efficiency of the split supercritical cycle, (b) total exergy destruction rate of the split supercritical cycle for ISO, tropical, and specified conditions.
Energies 15 05398 g011
Figure 12. Variation of (a) the exergy destruction rate of each component at full engine load and (b) the exergy destruction rate of each component at 80% of full load for ISO, tropical, and specified conditions.
Energies 15 05398 g012
Figure 13. Variation of (a) exergo-environmental factor, (b) exergy stability factor, and (c) environmental damage effectiveness with engine load for ISO, tropical, and specified conditions.
Energies 15 05398 g013
Figure 14. Variation of cost rate of exergy streams at each state at (a) full engine load and (b) 80% of full load for ISO, tropical, and specified conditions.
Energies 15 05398 g014aEnergies 15 05398 g014b
Figure 15. Variation of cost per exergy unit at each state at (a) full engine load and (b) 80% of full engine load for ISO, tropical, and specified conditions.
Energies 15 05398 g015
Table 1. Critical point properties of CO2.
PropertiesCO2
Critical Temperature (K)304.13
Critical Pressure (MPa)7.37
Critical Density (kg/m3)467.6
Table 2. Values of constants for estimating the capital cost of the heat exchanger [28].
ConstantValue
F S 1.70
B1,HX0.96
B2,HX1.21
FM,HX2.40
K1,HX4.66
K2,HX−0.1557
K3,HX0.1547
C1,HX0
C2,HX0
C2,HX0
Table 3. Values of constants for estimating the capital cost of the compressor [28].
ConstantValue
F S 1.70
FBM1.20
K1,C2.2897
K2,C1.3604
K3,C−0.1027
C1,C0
C2,C0
C3,C0
Table 4. Values of constants for estimating the capital cost of expander [28].
ConstantValue
F M P 3.5
F S 1.70
K1,EXP2.2659
K2,EXP1.4398
K3,EXP−0.1776
Table 5. Exergetic cost rate balance equations of an optimum split cycle [37].
ComponentExergetic Cost Rate Balance EquationAdditional Equation
Compressor C ˙ 2 = C ˙ 1 + C ˙ W C + C ˙ C C ˙ W C W C = C ˙ W T W T
Recuperator C ˙ 7 + C ˙ 3 R = C ˙ 6 + C ˙ 2 R + C ˙ r e c u p C ˙ 6 E 6 = C ˙ 7 E 7 ,   C ˙ 2 R = x C ˙ 2
Heater 1 C ˙ 3 H = C ˙ 2 H + C ˙ g a s , m i d + C ˙ h e a t e r 1 C ˙ 2 H = ( 1 x ) C ˙ 2
Heater 2 C ˙ 4 = C ˙ 3 + C ˙ a i r , i n + C ˙ h e a t e r 2 C ˙ 3 = C ˙ 3 H + C ˙ 3 R ,   C ˙ a i r , i n = 0
Heater 3 C ˙ 5 + C ˙ g a s , m i d = C ˙ 4 + C ˙ g a s , i n + C ˙ h e a t e r 3 C ˙ g a s , i n = 0 ,   C ˙ 5 E 5 = C ˙ 4 E 4
Turbine C ˙ 6 + C ˙ W T = C ˙ 5 + C ˙ T C ˙ 6 E ˙ 6 = C ˙ 5 E ˙ 5
Condenser C ˙ 1 + C ˙ w a t e r , o u t = C ˙ 7 + C ˙ w a t e r , i n + C ˙ c o n d C ˙ w a t e r , i n = 0 , C ˙ w a t e r , o u t = 0
Table 6. Exergy destruction rate for each component of the optimal split cycle [38,39,40].
ComponentExergy Destruction Rate
Compressor ( E ˙ 1 E ˙ 2 ) + W p
Recuperator ( E ˙ 2 R E ˙ 3 R ) + ( E ˙ 6 E ˙ 7 )
Heater 1 ( E ˙ 2 H E ˙ 3 H ) + ( E ˙ g a s , m i d E ˙ g a s , o u t )
Heater 2 ( E ˙ 3 E ˙ 4 ) + ( E ˙ a i r , i n E ˙ a i r , o u t )
Heater 3 ( E ˙ 4 E ˙ 5 ) + ( E ˙ g a s , i n E ˙ g a s , m i d )
Turbine ( E ˙ 5 E ˙ 6 ) W T
Condenser ( Ε ˙ 7 Ε ˙ 1 ) + ( Ε ˙ w a t e r , i n E ˙ w a t e r , o u t )
Table 7. Results from the optimization of the simple cycle with the genetic algorithm.
ParametersSimple Cycle
Phigh/plow2.184
P P T D Re c u p ( ° C )11.6
P P T D H e a t e r 1 ( ° C )16
P P T D H e a t e r 2 ( ° C )10
P P T D C o n d ( ° C )5
T G A S , O U T ( ° C )164.5
m ˙ C O 2 (kg/s)71.02
W ˙ n e t (kW)1.899
Q ˙ Re c u p (kW)1.688
Q ˙ H e a t e r 1 (kW)8.850
Q ˙ H e a t e r 2 (kW)8.305
n t h (%)11.07
C Re c u p (€)497,802
C H e a t e r 1 (€)569,981
C H e a t e r 2 (€)575,062
C C o n d (€)1,119,000
C P (€)844,054
C E X P (€)419,924
C T O T A L (€)4,025,823
EPC (€/kWh)0.05637
Table 8. Results from the optimization of the split cycle with the genetic algorithm.
ParametersSimple Cycle
phigh/plow2.679
P P T D H e a t e r 1 ( ° C )15.95
P P T D Re c u p ( ° C )10
P P T D H e a t e r 2 ( ° C )10
P P T D H e a t e r 3 ( ° C )13.16
P P T D C o n d ( ° C )5
T G A S , I N T E R M E D ( ° C )202
T G A S , O U T ( ° C )156.5
m ˙ C O 2 (kg/s)42.88
x0.346
W ˙ n e t (kW)1.687
Q ˙ Re c u p (kW)759.8
Q ˙ H e a t e r 1 (kW)6.284
Q ˙ H e a t e r 2 (kW)2.925
Q ˙ H e a t e r 3 (kW)2.843
n t h (%)14
C Re c u p (€)335,098
C H e a t e r 1 (€)391,797
C H e a t e r 2 (€)388,694
C H e a t e r 3 (€)380,298
C C o n d (€)662,022
C P (€)714,459
C E X P (€)413,017
C T O T A L (€)3,285,385
EPC (€/kWh)0.0518
Table 9. Results from the optimization of the cascade cycle with the genetic algorithm.
ParametersSimple Cycle
phigh/plow2.486
P P T D Re c u p , H T ( ° C )10
P P T D H e a t e r 1 , H T ( ° C )10
P P T D H e a t e r 2 , H T ( ° C )10
P P T D H e a t e r , L T ( ° C )15.04
P P T D C o n d ( ° C )5
T G A S , I N T E R M E D ( ° C )199.9
T G A S , O U T ( ° C )150
m ˙ C O 2 (kg/s)64.57
m ˙ C O 2 H (kg/s)31.64
m ˙ C O 2 L (kg/s)32.93
W ˙ n e t (kW)2.007
Q ˙ Re c u p , H T (kW)1.059
Q ˙ H e a t e r 1 , H T (kW)5.383
Q ˙ H e a t e r 2 , H T (kW)2.709
Q ˙ H e a t e r , L T (kW)6.716
n t h (%)12.66
C Re c u p , H T (€)443,939
C H e a t e r 1 , H T (€)517,033
C H e a t e r 2 , H T (€)559,643
C H e a t e r , L T (€)530,759
C C o n d (€)1,081,000
C P (€)950,281
C E X P , H T (€)388,610
C E X P , L T (€)372,182
C T O T A L (€)4,843,447
EPC (€/kWh)0.06417
Table 10. Cost of Exergy Streams of Split Cycle.
StateFluidPressure
(Bar)
T (°C)Enthalpy
(kJ/kg)
Entropy
(kJ/kg K)
Exergy
(MW)
Costs
C ˙ ( / h ) c ˙ ( / G J )
1 CO 2 7530−215.1−1.449.342455.413.54
2 CO 2 200.9354.64−195.7−1.43410.100517.714.24
3R CO 2 200.9374.82−144.5−1.2823.587195.115.12
3H CO 2 200.93144.16.079−0.88467.637322.111.72
3 CO 2 200.93116−46.13−1.01411.119517.212.92
4 CO 2 200.93149.615.39−0.862511.804527.512.41
5 CO 2 200.93188.875.02−0.727412.624564.212.41
6 CO 2 7599.5116.25−0.71559.949444.712.41
7 CO 2 7584.82−3.465−0.76949.798437.912.41
Publisher’s Note: MDPI stays neutral with regard to jurisdictional claims in published maps and institutional affiliations.