Article

Evaluation of Gas-Based EOR Methods in Gas-Invaded Zones of Fractured Carbonate Reservoir

1
Department Petroleum Engineering, Montanuniversität Leoben, 8700 Leoben, Austria
2
Computer Modeling Group Ltd., Calgary, AB T2L 2M1, Canada
*
Author to whom correspondence should be addressed.
Energies 2022, 15(13), 4921; https://doi.org/10.3390/en15134921
Submission received: 1 June 2022 / Revised: 22 June 2022 / Accepted: 30 June 2022 / Published: 5 July 2022

Abstract

:
More than half of all recoverable oil reserves are found in carbonate rocks. Most of these fields are highly fractured and develop different zonations during primary and secondary recovery stages; therefore, they require a different developmental approach than conventional reservoirs. Experimental results for water-alternating gas injection [WAG] and foam-assisted water-alternating gas [FAWAG] injection under secondary and tertiary recovery conditions were used to investigate these enhanced oil recovery [EOR] methods in gas-invaded reservoirs. The relative permeability curves of the cores and the fitting foam parameters were derived from these experiments through history matching. These findings were then used in a quarter five-spot, cross-sectional, and a sector model of a carbonate reservoir where a double five-spot setup was implemented. The fracture and matrix properties’ impact on the recovery was illustrated through the cross-sectional model. The gas mobility reduction effect of the FAWAG was more noticeable than that of WAG. The apparent viscosity of the gas was increased due to the foam presence, which caused a diversion of the gas from the fractures into the matrix blocks. This greatly enhanced the sweep efficiency and led to higher oil recovery. The gas front was much sharper, and gravity overrides by the gas were much less of a concern. The properties of the fracture network also had a significant effect on the recovery. Oil recovery was found to be most sensitive to fracture permeability. At the same time, sweep efficiency increased substantially, improving the recovery rate in the early injection stages, and differed slightly at the ultimate recovery. However, a lower fracture permeability facilitated gas entry into the matrix blocks. The results of the reservoir sector model were similar to the core and pilot. However, the WAG injection recovered more of the uppermost layers, whereas significant portions of the lowest layer were not effectively recovered. In contrast, FAWAG was more effective in the lowest layer of the reservoir. The FAWAG was a beneficial aid in the recovery of gas-invaded fractured reservoirs, increasing the oil recovery factor with respect to WAG.

1. Introduction

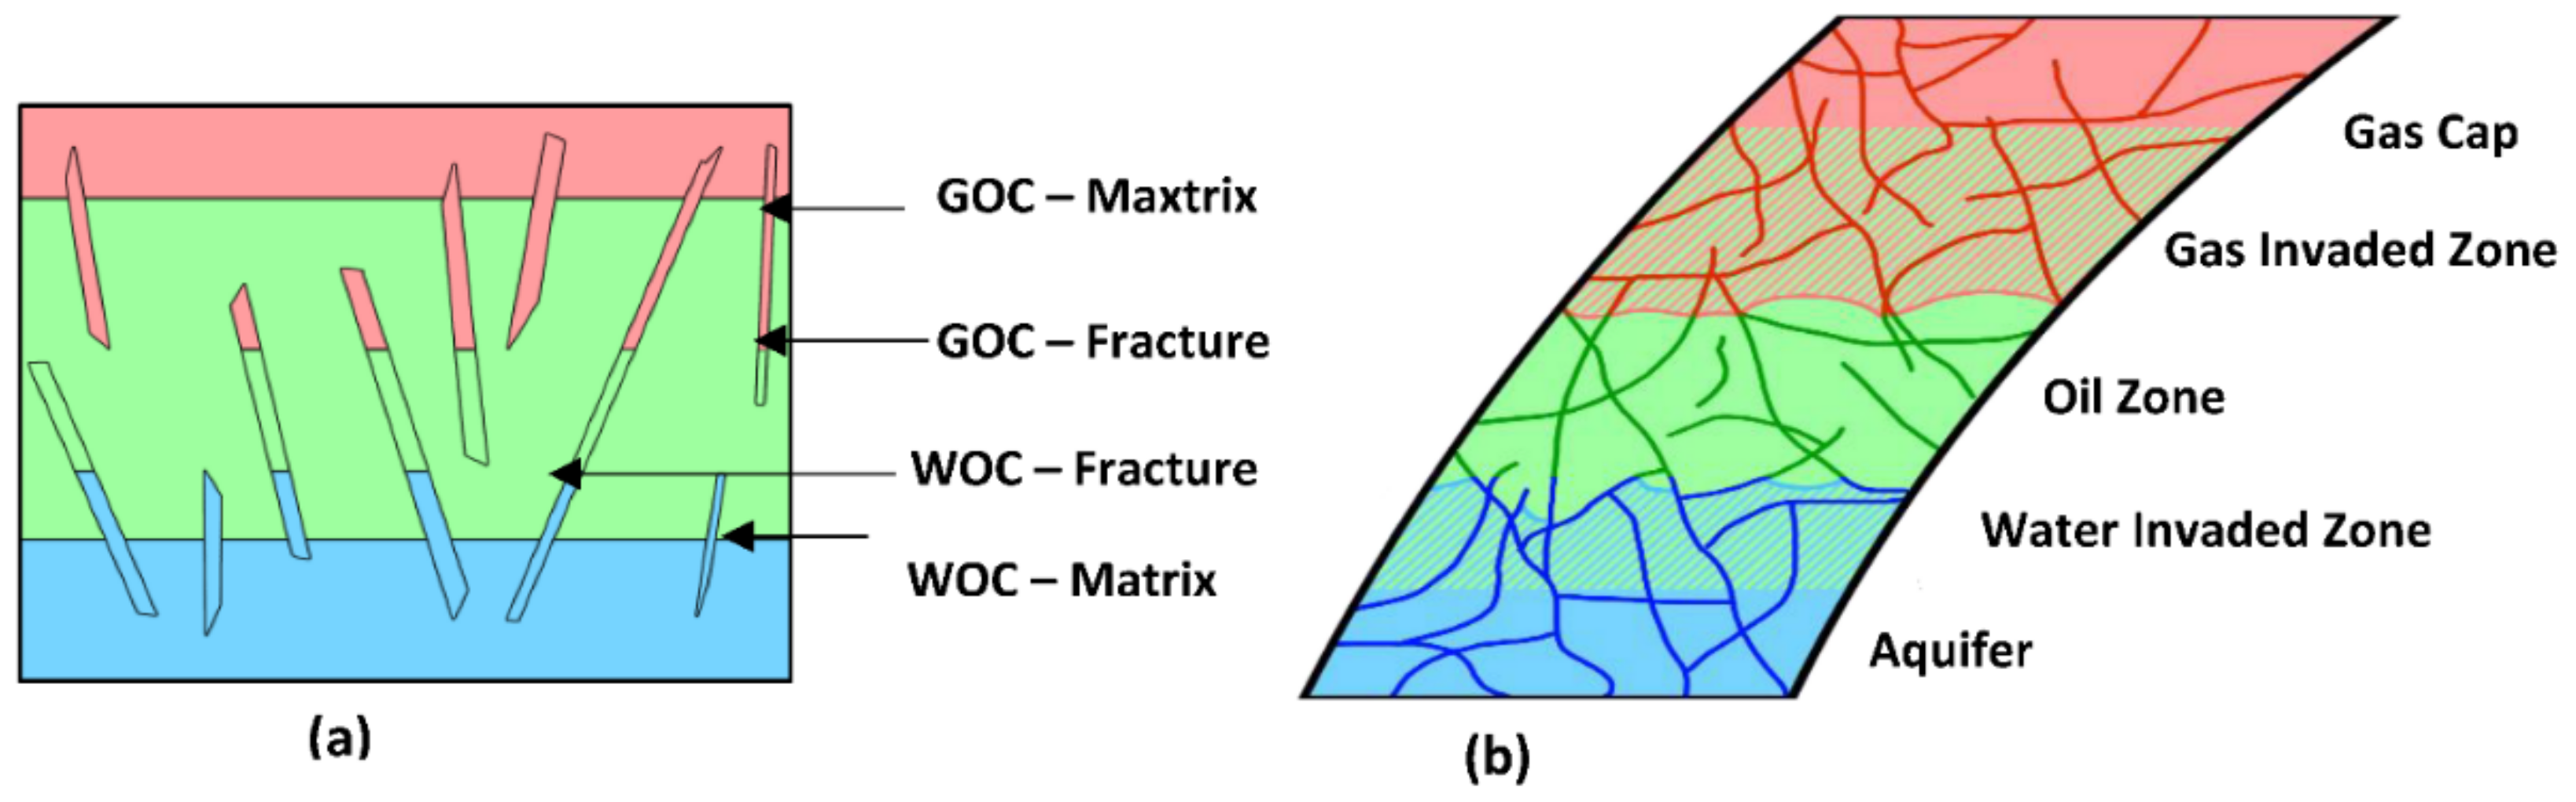
Naturally fractured reservoirs contribute considerably to the world’s hydrocarbon reserves; however, they usually have a lower oil primary recovery. This is related to different wetting conditions in reservoirs. Conventional reservoirs and fractured reservoirs are very different in nature. The distribution of the fluids is not the same for both. In a conventional reservoir, the two-phase contacts of water–oil and gas–oil are smooth, and the transition zone may be significant in static conditions and, thus, will remain so in dynamic conditions. During production, gas-invaded zones and water-invaded zones may form as a result of oil production. On the contrary, the transition zone in a fractured reservoir is sharp and abrupt; hence, the transition zone is horizontal in static and dynamic conditions (Figure 1). Given that the transmissivity in a fracture network is high due to its large permeability, any change in level is rapidly re-equilibrated [1]. These fractures are then occupied mainly by only one phase. Several Middle Eastern fields, such as the Fahud, Gachsaran, and Hafkel [2,3,4], reported large water- and gas-invaded zones during the primary production. For example, the Hafkel field, with more than eighty years of production, has resulted in a gas-invaded zone of around 1000 feet [4]. Nowadays, with many of these brown fields being produced for decades, the enhancement of oil with different enhanced oil recovery methods is of interest.
One of the main mechanisms for gas injection in naturally fractured reservoirs [NFR] is Gas-Assisted Gravity Drainage [GAGD]. Gas-filled fractures surround the oil-filled matrix blocks, and the gas can go into the matrix (gravity-driven), displacing the oil. It was found that fracture permeability is a key property for high oil recovery when gas is injected in NFRs. Even higher recovery can be achieved when the vertical fracture permeability is higher than the horizontal [5]. Interestingly, the fracture conductivity is less important than the fracture spacing if the gas is injected in a “huff and puff” regime. During a cyclic gas injection, lower fracture spacings result in higher recoveries [6].
Waterflooding is generally not an effective recovery method in naturally fractured carbonate reservoirs, especially in oil-wet/mixed-wet reservoirs, in addition to the negative effects of scaling [7] and early water breakthrough [8]. The WAG method in NFR might be feasible because gas prefers to flow in the high permeability fractures, resulting in gravity drainage. On the other hand, the water imbibes the matrix blocks and further increases oil displacement efficiency. For the WAG process, high-permeability fractures and low-permeability matrices are important for a successful application [9]. Recently, the effect of driving forces on oil recovery for gas injection, foam injection, water-alternating gas injection, and foam-assisted water-alternating gas injection was analyzed for fractured reservoirs using dimensionless numbers and a surface response model [8]. The foam and FAWAG injection methods were more sensitive to permeability contrast, density, and matrix block highs than WAG injection.
Fractures also introduce new effects in chemical EOR methods. In the case of a surfactant injection, the surfactant causes more favorable relative permeabilities and capillary pressures by wettability alteration from oil-wet/medium-wet [OW/MW] to more water-wet [WW] rock and also by lowering residual oil saturation via decreasing interfacial tension [10]. Under more WW conditions, the water is more likely to imbibe the matrix blocks, displacing the oil from the matrix into the fracture [11]. Another effect introduced by surfactants is that surfactants may lower the interfacial surface tension [IFT] between water and oil, thus lowering the capillary pressure and forcing the system to be more gravity dominated. This results in more efficient oil recovery and lower residual oil saturation. Similar to already discussed effects, if the fractures are more permeable than the matrix, a breakthrough [BT] may occur faster, and oil recovery decreases. However, polymers are known to mitigate channeling effects due to Kfracture >> Kmatrix. Further, decreased fracture spacing and fractures oriented parallel to the intended fluid flow are considered beneficial [12]. A very well-studied area of chemical EOR already at the stage of a field application utilizes foams in NFRs. Surfactant-alternating gas (SAG) combined with foams dispersed in gas injections leads to an increased treatment depth than SAG alone, and the foams block high-permeability fractures. This process increases the potential of inaccessible fractures until then [13,14,15]. Hence, implementing a proper process requires extensive laboratory work and simulation studies to be effective.
Two thirds of all recoverable oil reserves and a third of all recoverable gas reserves are found in carbonate rocks. Most of these fields are highly fractured and develop different zonations during primary and secondary recovery stages; therefore, they require a different development approach than conventional reservoirs. In particular, the creation of gas-invaded zones during production poses a major problem. This simulation study investigated the benefits of introducing gas-based EOR methods, such as WAG and foam-assisted WAG, to a fractured reservoir to overcome these obstacles. It may yield benefits for future recovery strategies.

2. Methodology

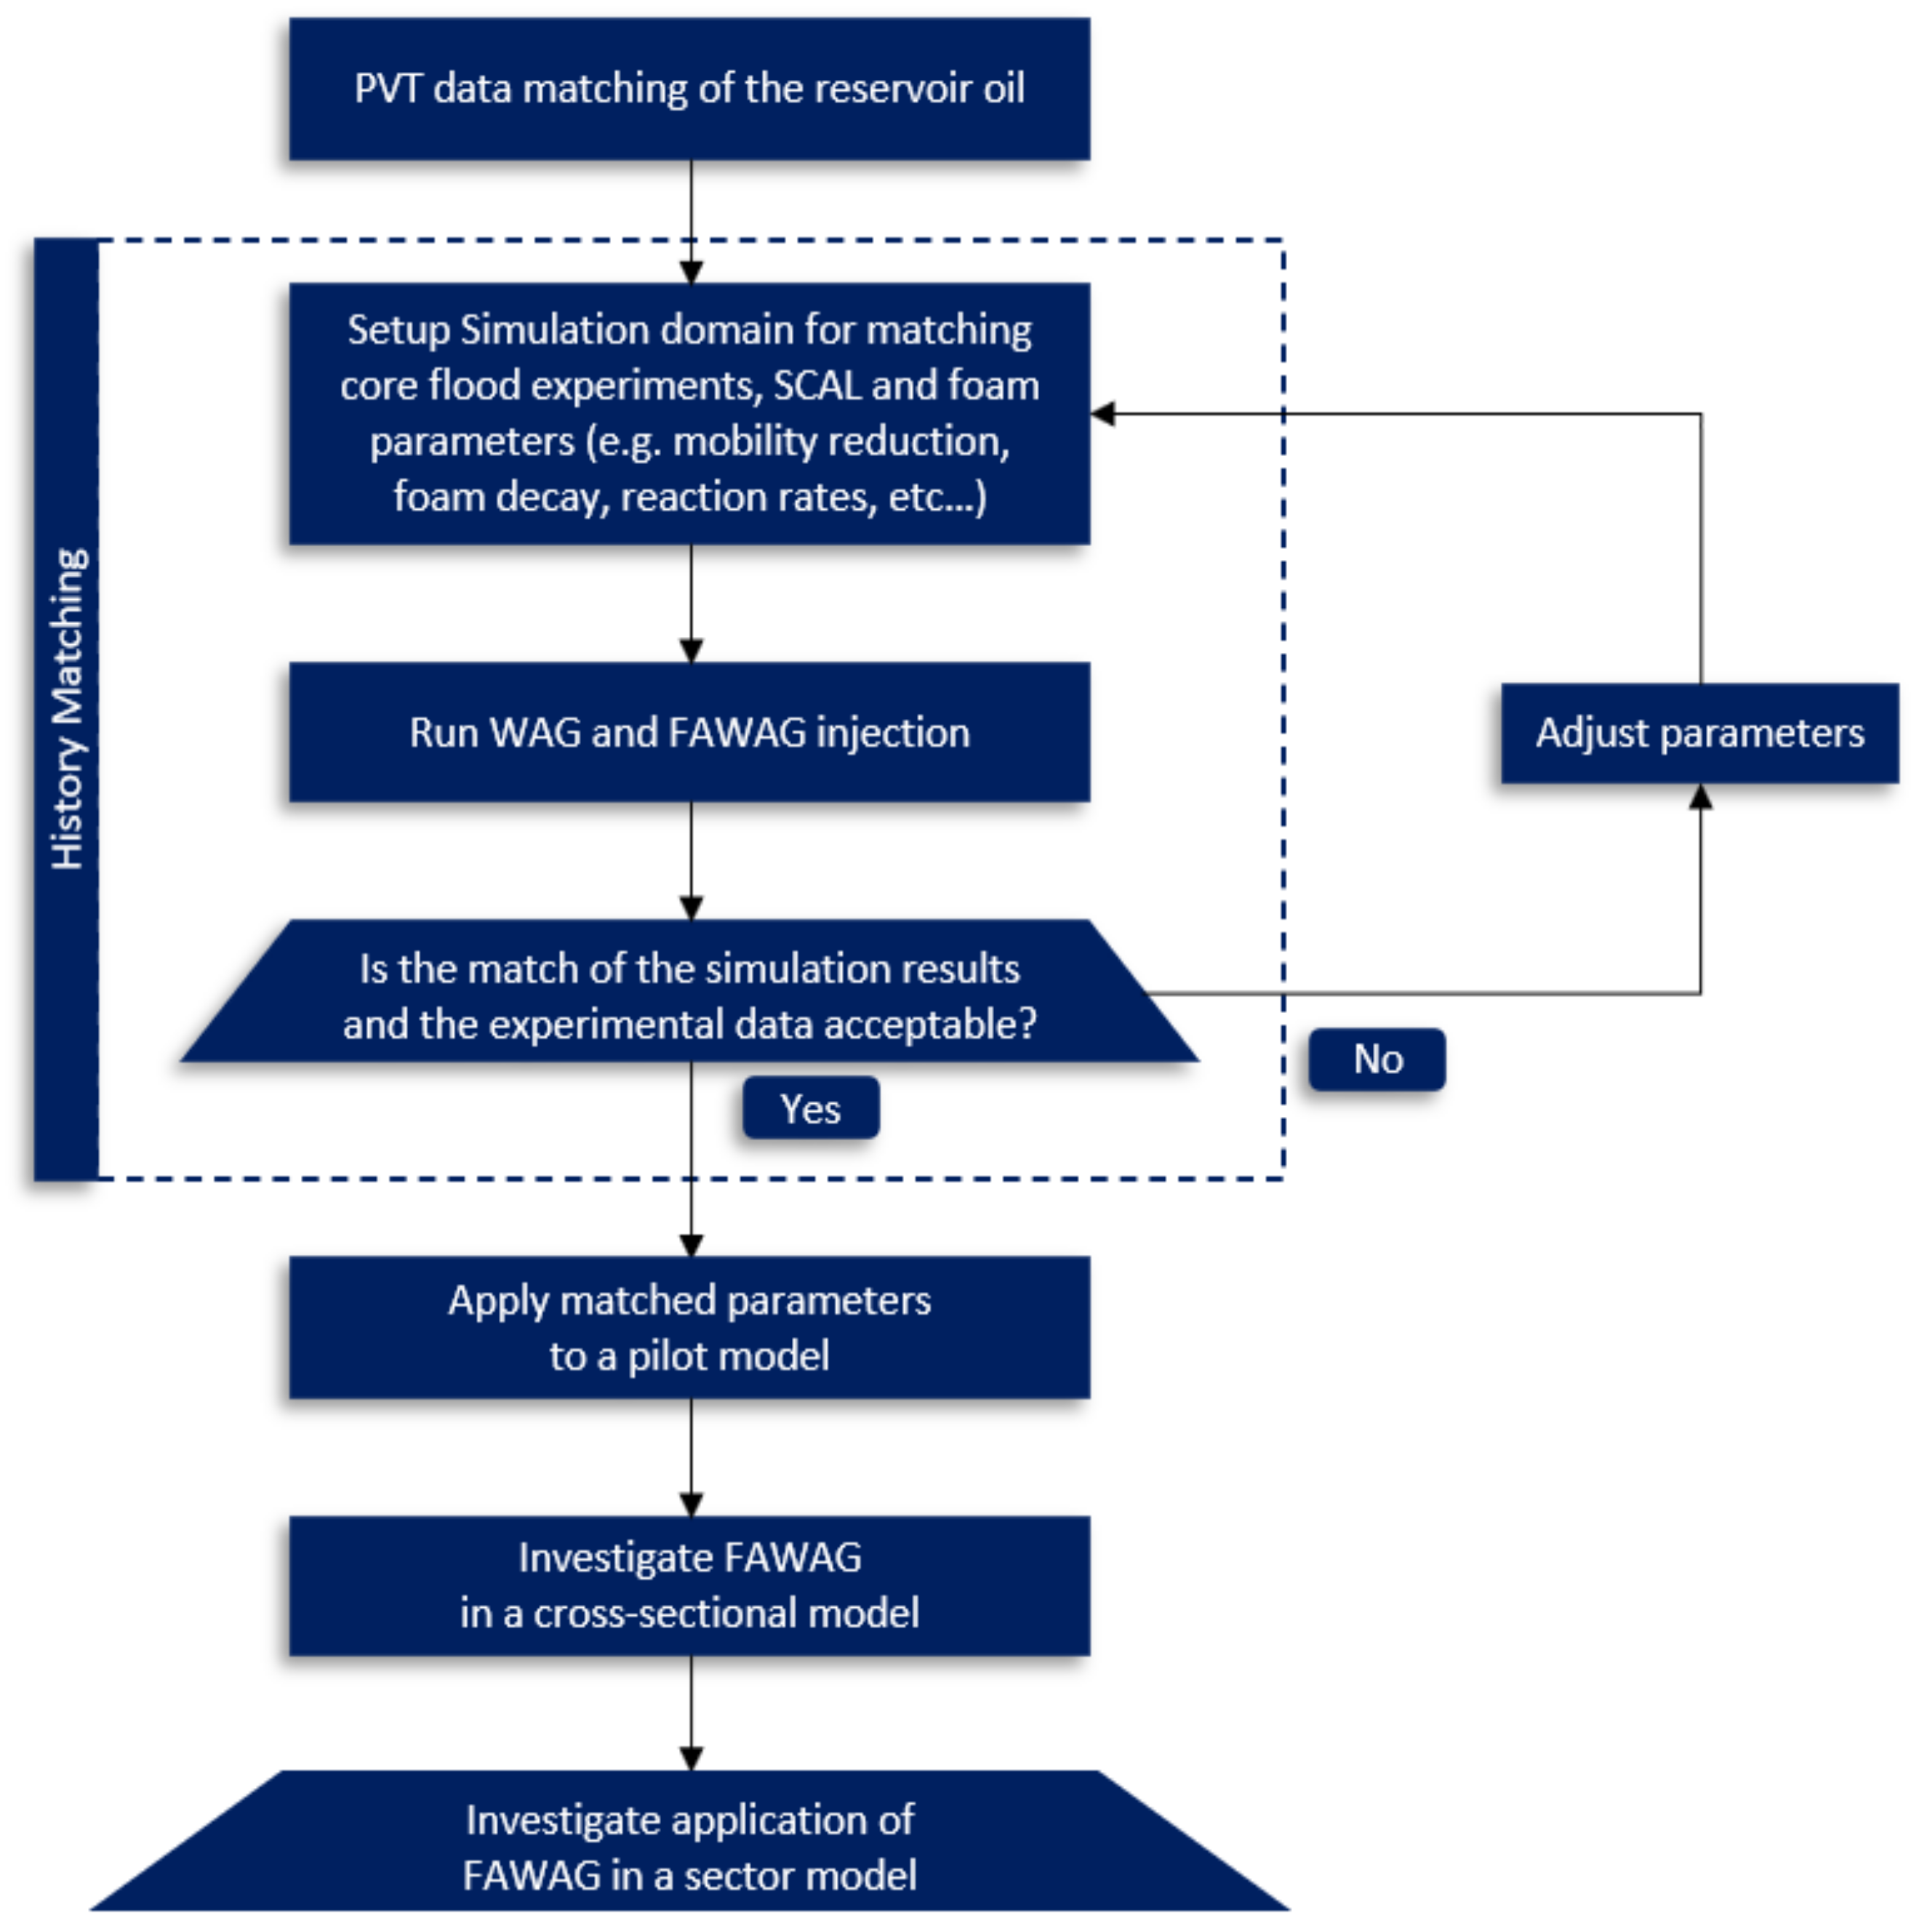
This work has been conducted on core flooding experiential data to validate the generated models using history matching. The simulations in this work underlie a straightforward workflow of a small-scale model (core scale) to a large-scale model (sector or field-scale) while still obtaining reasonable data in the large-scale model. This workflow is charted in Figure 2. Initially, a compositional model had to be created by matching the experimental data of the oil used in the experimental core floods. The numerical model for matching experimental core flood experiments includes the experimental PVT data. Rock properties deduced from the experiments have then been defined in the model. Both gas and water relative permeability curves were matched simultaneously for WAG and FAWAG. The only difference was that a few foam parameters were included in the FAWAG case [16]. The matched data were then used in a heterogeneous quarter-pilot model. The quarter-pilot gives a clearer picture of how the recovery methods behave in an idealized and coarse three-dimensional model. Then, a two-dimensional cross-sectional model is created to further investigate fluid movement between injector and producer. In this investigation, three basic fracture properties were studied in a sensitivity analysis on how they affect oil recovery and fluid flow in a gas-invaded zone. These include fracture permeability, fracture spacing (horizontal spacing between vertical fractures), and fracture block height (vertical spacing between horizontal fractures). Lastly, the FAWAG properties have been applied to a real-life sector model that gives a view on how FAWAG could improve oil recovery in real scenarios.
The PVT data were then used in the setup of the core. Core parameters deduced from the experiments have then been defined in the model. Here, both gas and water relative permeability curves were matched simultaneously. Only a few foam parameters were changed to achieve a good match. This match was then applied to the large-scale pilot and sector models. Upon building the models, a sensitivity analysis study was conducted for the fracture and matrix property effect on the recovery of the FAWAG process in the gas-invaded zone.

3. Overview of Utilized Experimental Data

This study was based on the experimental work conducted by Kharrat and his team [17,18,19,20,21], wherein they studied the effects of carbon dioxide injection, WAG, and FAWAG injection into cores from the matrix of the naturally fractured carbonate reservoir as a secondary and tertiary recovery method. The experiments were conducted using live oil, brine with 5000 ppm of salts (4000 ppm NaCl, 500 ppm CaCl2 and MgCl2), and sodium lauryl sulfate as the anionic surfactant and foaming agent. These cores were initially saturated with the same live oil and brine at laboratory conditions (46.11 °C). However, the pressure changed from experiment to experiment and ranged between 1600 and 2300 psi. For the experiments, the cores were flooded with about two pore volumes of each method. All properties, values, and parameters for the experiments can be found in Table 1, which resemble the conditions of an oil field with a carbonate oil-bearing formation located in the northern part of the Zagros folding.

4. PVT Data Matching

The oil compositions used in the experiments can be found in Table 2. PVT data at laboratory conditions, such as constant composition expansion [CCE] and differential liberation [DL] tests, were used to create representative fluid models. The Peng–Robinson equation of state was chosen based on the PVT data. Compositional reservoir simulation studies often require high computing power. Therefore, the plus fraction, which is C6+, is heavily lumped to reduce the pseudo-components in the model and reduce computation time [22].

5. History Matching

The core models need to be set up with the acquired PVT data. The runs are based on the experiments conducted by [17,18]. Roughly 1.6 pore volumes were injected into the core. Because our model will solely be flooded at a concentration of 2000 ppm, this value is the most influential as increases in recovery cease to appear with higher concentrations [19].
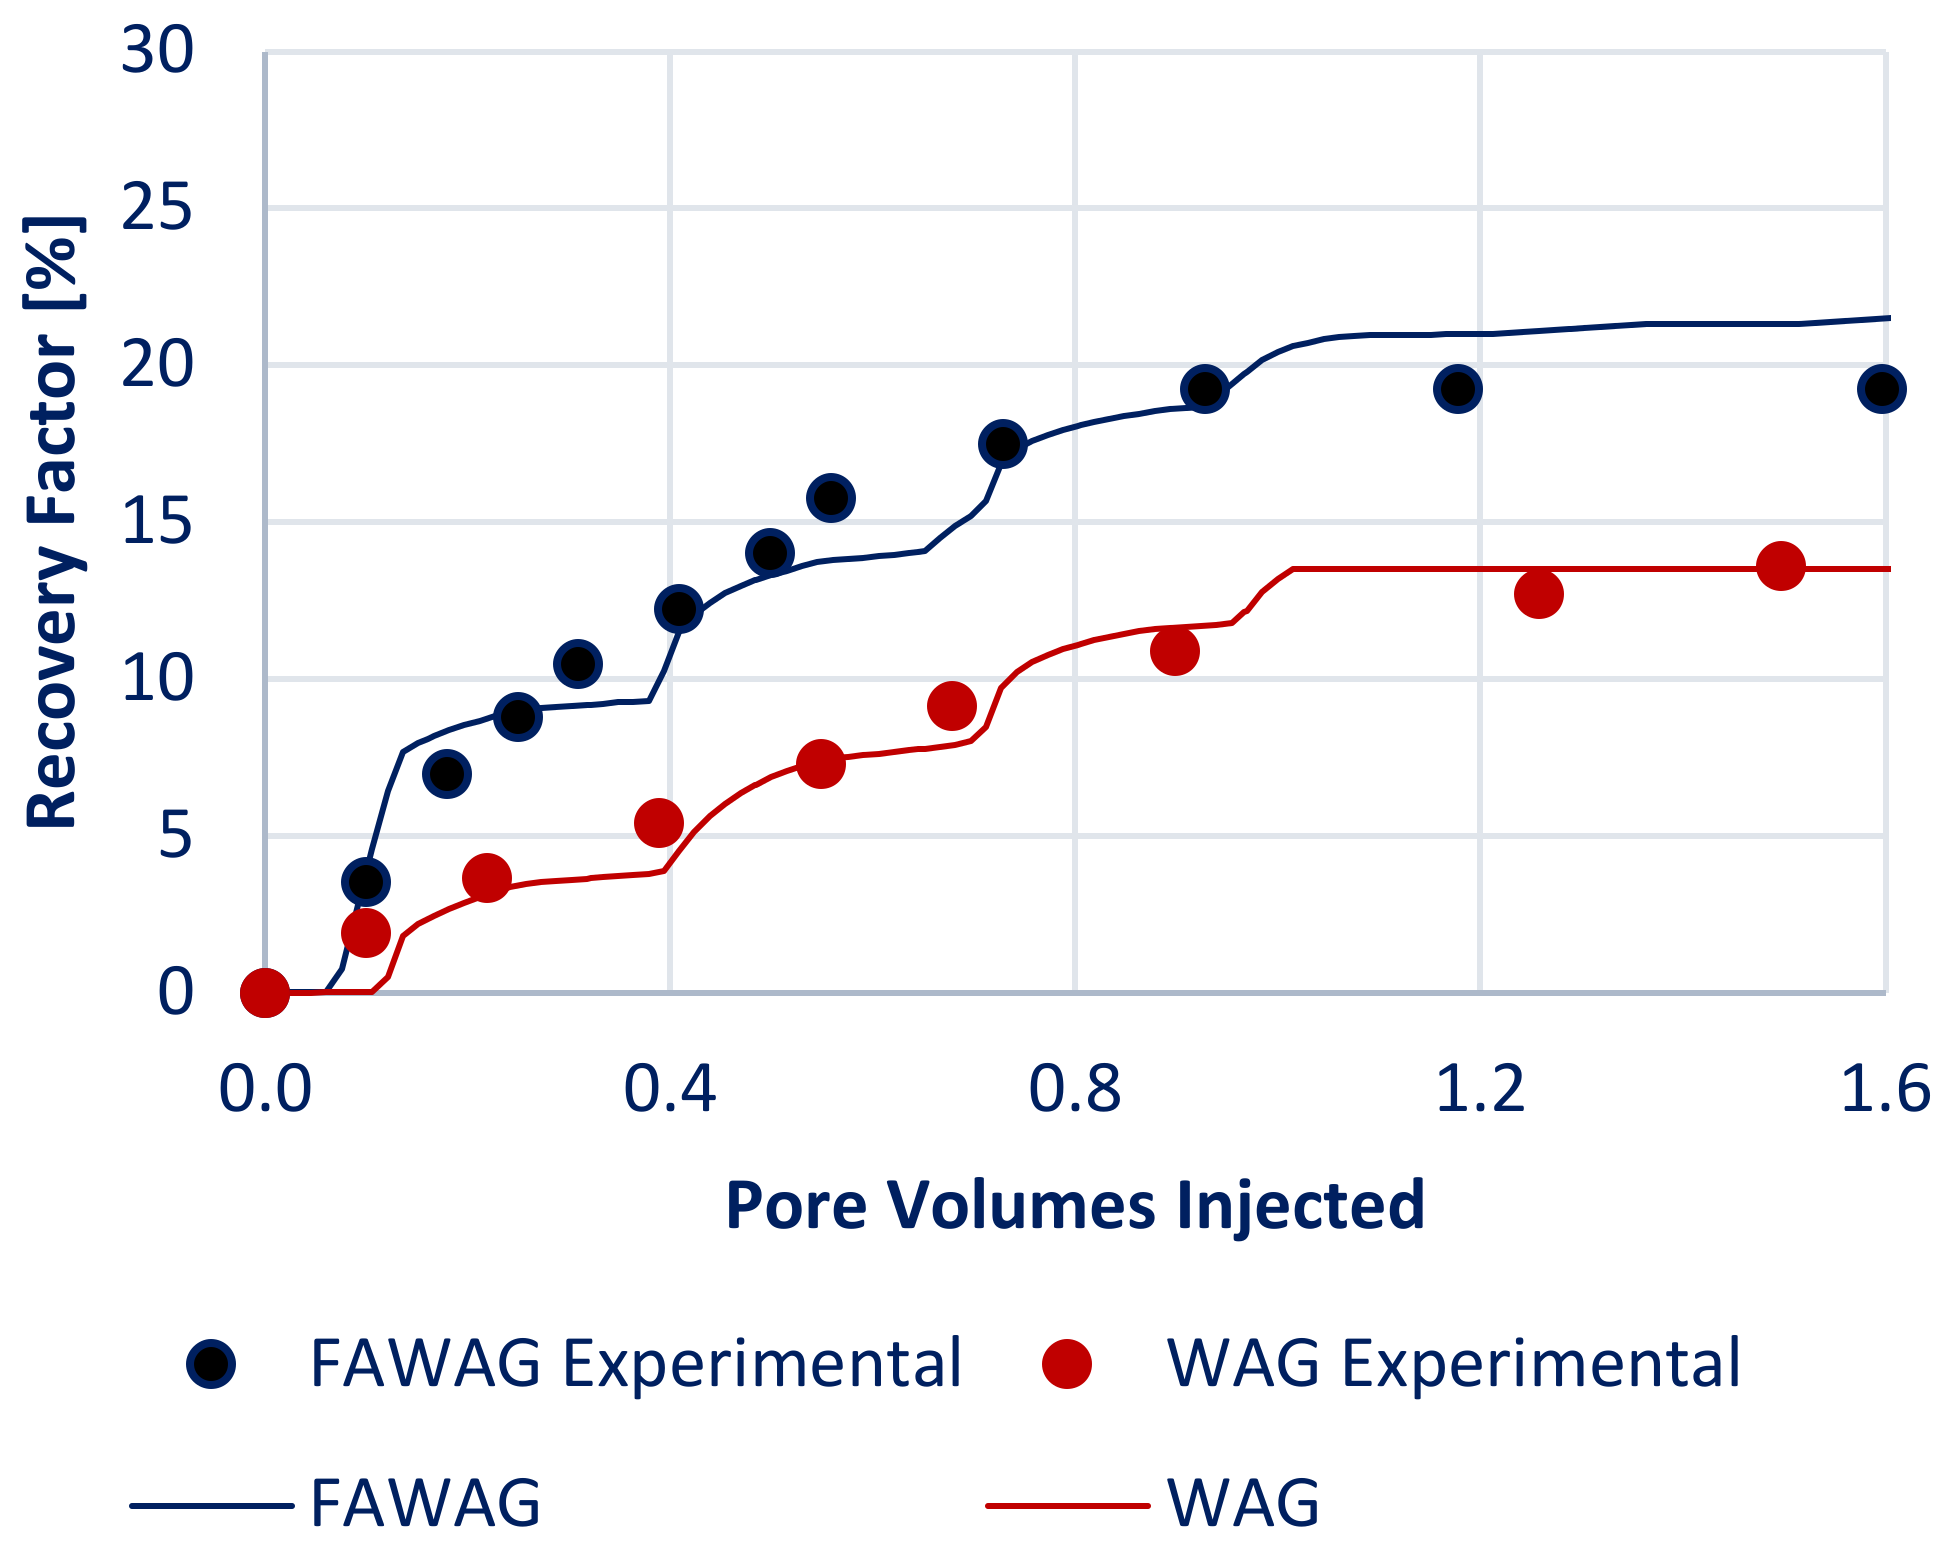
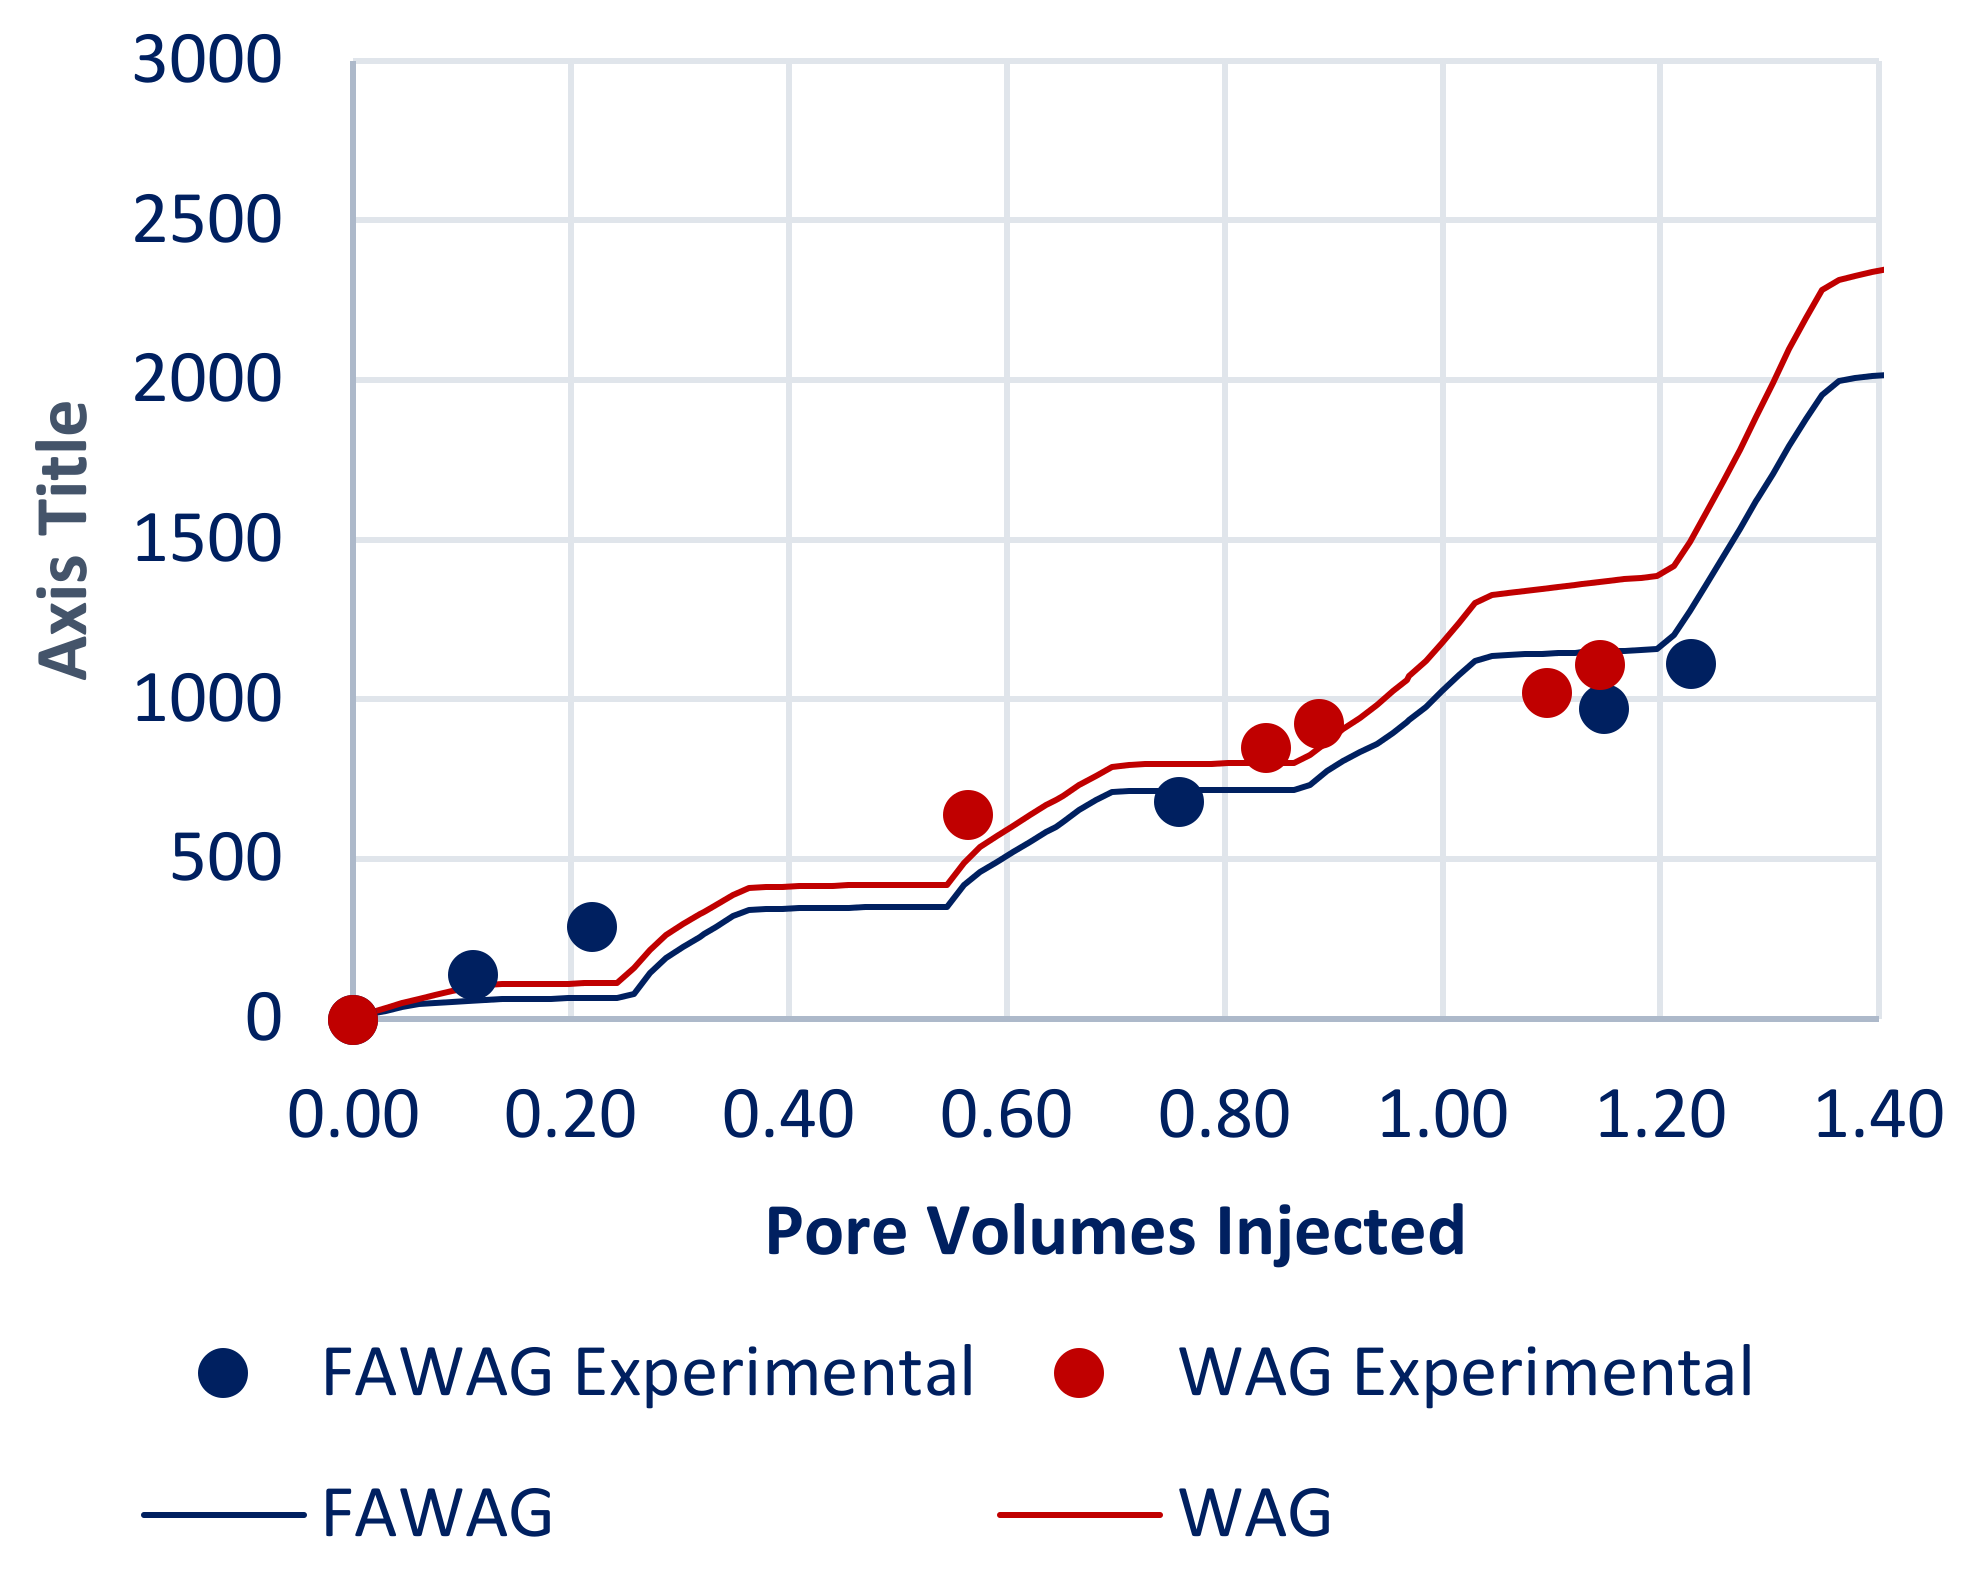
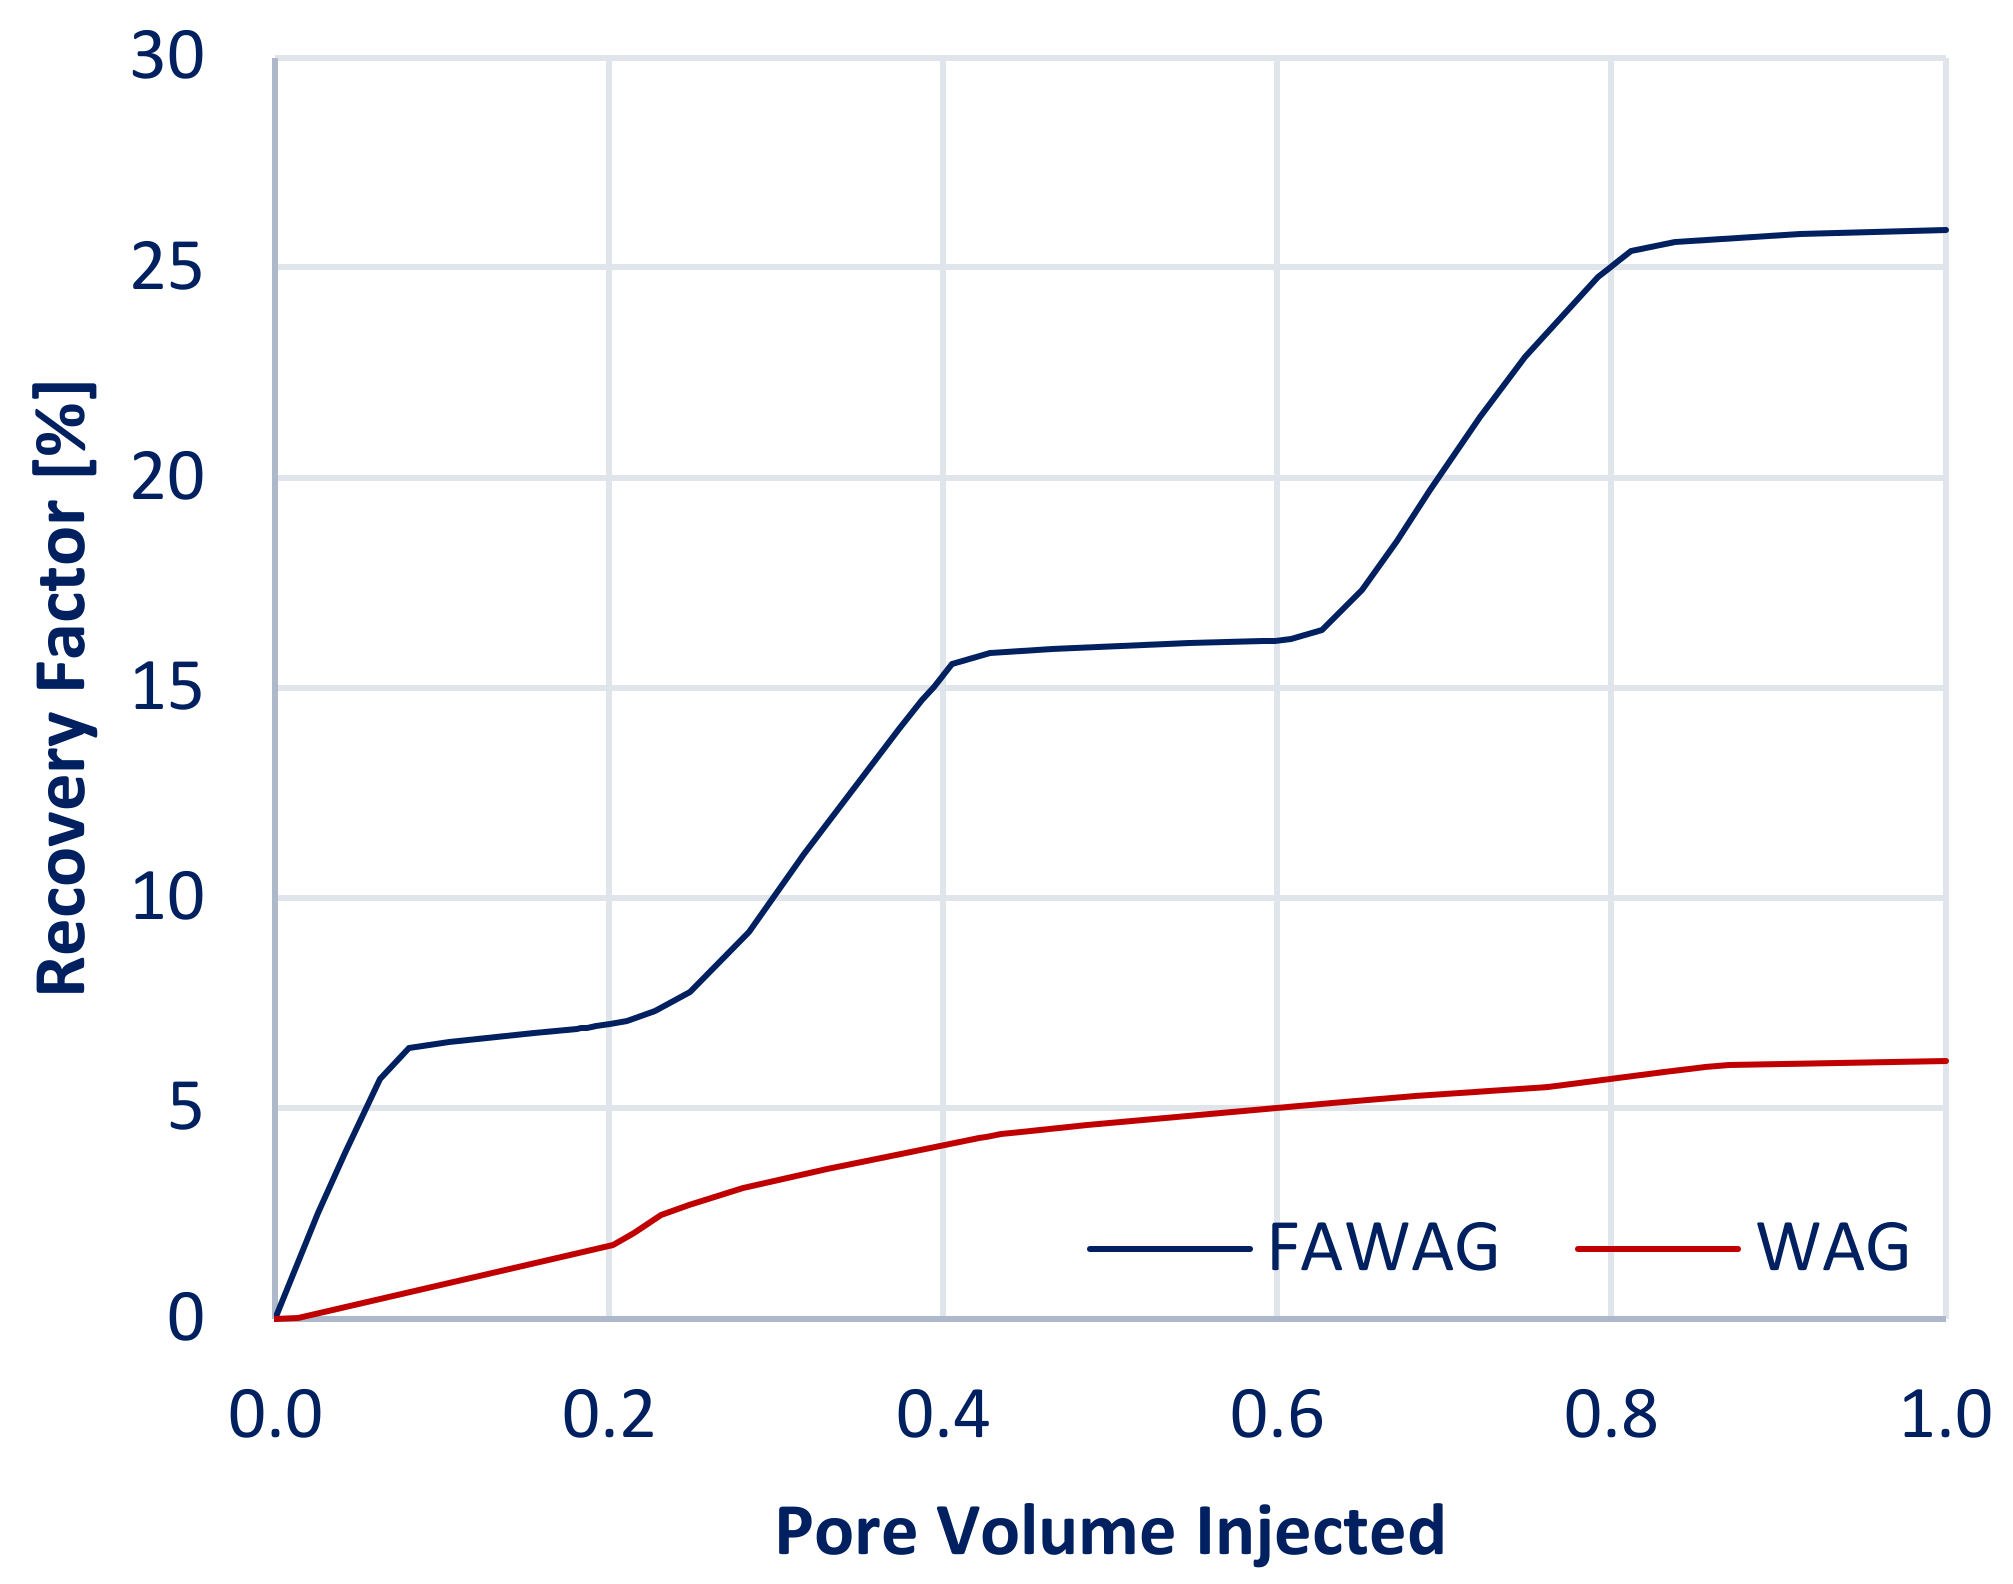
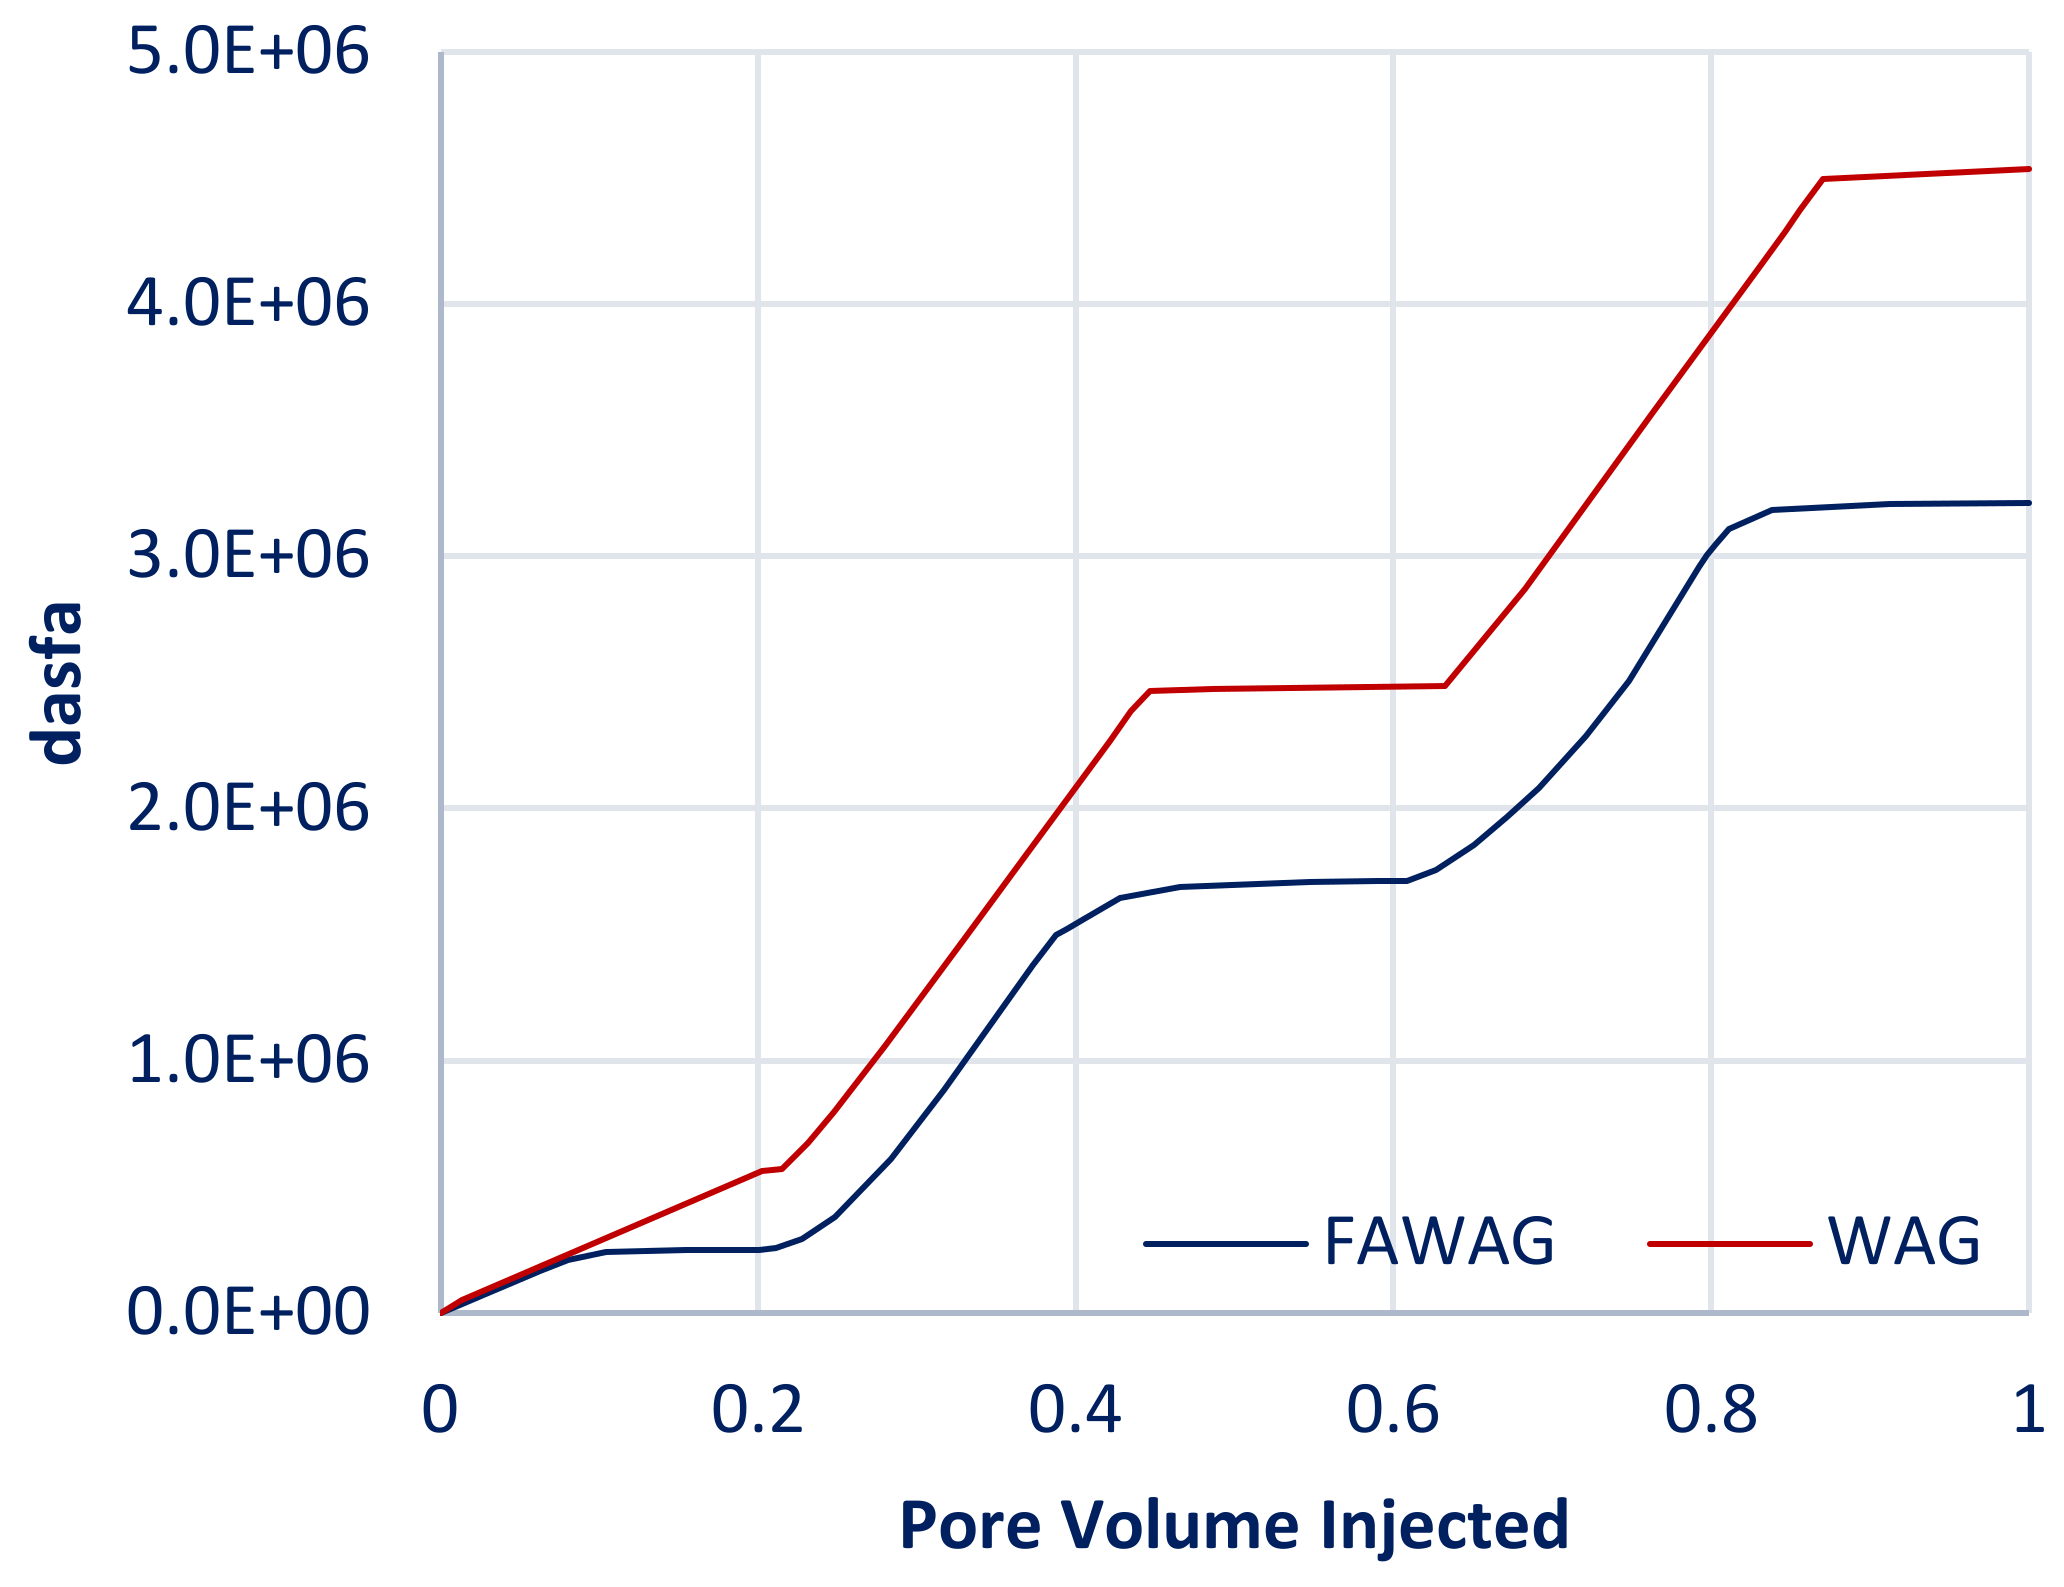
Permeability curves were derived for both sets using the Corey–Brooks “power–law” relationship, while the foam-assisted injection required foam parameters to be included in the history match. These ones implanted were the foam mobility and the critical surfactant concentration. Other foam-altering qualities, like oil saturation dependency, the influence of the capillary number, and foam dry-out, were left out to simplify the model and reduce computing time. The results suggest that the FAWAG does indeed reduce gas mobility. This is indicated by the stepwise oil recovery and gas production in Figure 3 and Figure 4. The reduced gas mobility allows for a greater sweep efficiency, wherein more oil is produced in the gas cycles than pure WAG injection. The CO2 injection in WAG is significantly less effective as it bypasses the oil and ends up being produced faster than the mobility-reduced gas of the FAWAG method [23]. According to Lake, the gas mobility reduction caused by the foam can be viewed as either an increase in the effective viscosity of a single-phase flow or a decrease in the gas-phase permeability. Two different mechanisms are the main reason for low mobilities: 1. The formation of/increase in trapped residual gas-phase saturation. 2. A blocking of pore throats due to gas films [24]. The results also display a stepwise production history ascribed to the alternating water and gas injection. Both have different properties and oil-recovery-enhancing abilities, leading to such a stepwise function. Here, gas is the more potent oil mobilizer. This can be explained by the oil properties, which are sensitive to the injected CO2. The CO2 can swell the oil, increasing its apparent saturation and, thus, displacing oil more efficiently.

6. Results and Discussion

6.1. Pilot Scale Model

The final step was to create a pilot model that would be used to simulate reservoir conditions. This pilot model imitates a quarter of a five-spot pattern (Figure 5). This pattern is important to study the effect of heterogeneity because it is also used in the upcoming sector model. In addition, in the heterogeneous reservoirs, foam generation will first occur in the high-permeability zones, diverting the fluid flow into low-permeability zones [25]. The grid was 15 × 15 × 8 in x, y, and z, with an overall length of 150 m × 150 m × 6 m. The porosity was normally distributed from 0.05 to 32%. The permeability was modelled as a function of porosity. The correlation for the permeability characterization of carbonate rocks used was:
k   =   1014 FZI 2 Φ 3 ( 1 Φ ) 2
FZI is the flow zone indicator in regression models and Φ the porosity. For FZI, the value of 0.861 was the most suitable for our type of carbonate rock [26]. The number 1014 was derived from FZI’s conversion number. The pilot model was flooded with 0.8 pore volumes injected [PVI] with CO2, WAG (0.4 PVI each), and FAWAG (0.4 PVI each) at a cycle of 0.2 PVI. Injection of more did not yield more oil recovery on any method and only increased computing time for such a demanding model.
The reservoir conditions were chosen to be 115 °F and 1960 psi. This pilot model was set up to be a dual-porosity model, meaning that fractures were implemented. The fracture porosity was 5%, and the fracture permeability was 1000 mD. The fracture spacing was 0.4 m, 0.4 m, and 0.2 m in x, y, and z, respectively. Lastly, the relative permeability curves were set to be straight lines.
In this scenario, the quarter five-spot model was firstly flooded with gas until a gas saturation of 40% was reached, and then CO2, WAG, and FAWAG were introduced to the injection strategy. FAWAG enhances the oil recovery by a remarkable 20% on a simple WAG strategy (Figure 6). The high gas saturation in the model increases the gas mobility and, thus, enhances effects like gravity override and fingering, leading to an early breakthrough. FAWAG recovery increases stepwise. This can be explained by the low mobility of the gas that allows it to contact more of the reservoir and is indicated by the lower gas production for FAWAG (Figure 7). The low gas mobility hinders the gas from acting as a “highway” for the injected gas. The foam acts as a mobility control agent. This means that the foam increases the apparent viscosity of the gas to such a degree that flow via fractures is impaired, and other injected gas can be diverted into the matrix blocks, thus enabling a much more enhanced sweep efficiency of the matrix blocks. The surfactant used to create the in situ foam has a positive effect on the early recovery of the oil since it alters the surface tension between the oil and the water, rendering its displacement more effective. This can be seen in the early stages of Figure 7.

6.2. Cross-Sectional Model

To further investigate foam-dependent gas mobility reduction and gas movement in a reservoir and their effect on oil recovery, a fine two-dimensional cross-section-like model was set up and then injected with both a WAG and a FAWAG displacement process. It consisted of 10,000 grid blocks (100 × 1 × 100) to visualize and describe fluid movement from the injector to the producer.
A dual-porosity—dual-permeability model was chosen to account for flow between fractures and the matrix and vice versa. The properties of this homogeneous model are given in Table 3 with 0.5 m, 1 m, and 0.20 m in the x, y, and z-direction, respectively:
To illustrate the mobility-controlling effect of the foam, a continuously fractured case was created (Figure 8). This model was first flooded with 0.2 PVI of water for each case and another 0.2 PVI of CO2. The gas-mobility-reduction effect of the foam is significant. The FAWAG method displays a sharper front, leading to a much more efficient invasion of the matrix blocks by the gas. The high mobility of the gas in the WAG process does not allow the gas to form a sharp front as it moves along the fractures at high speed. Furthermore, there is a gravity override effect taking place in the WAG process, meaning that the gas bypasses the oil by flowing to the top due to stark density differences. These two effects show that the sweep efficiency is greatly enhanced when using FAWAG, leading to higher oil recovery.

7. Sensitivity Analysis

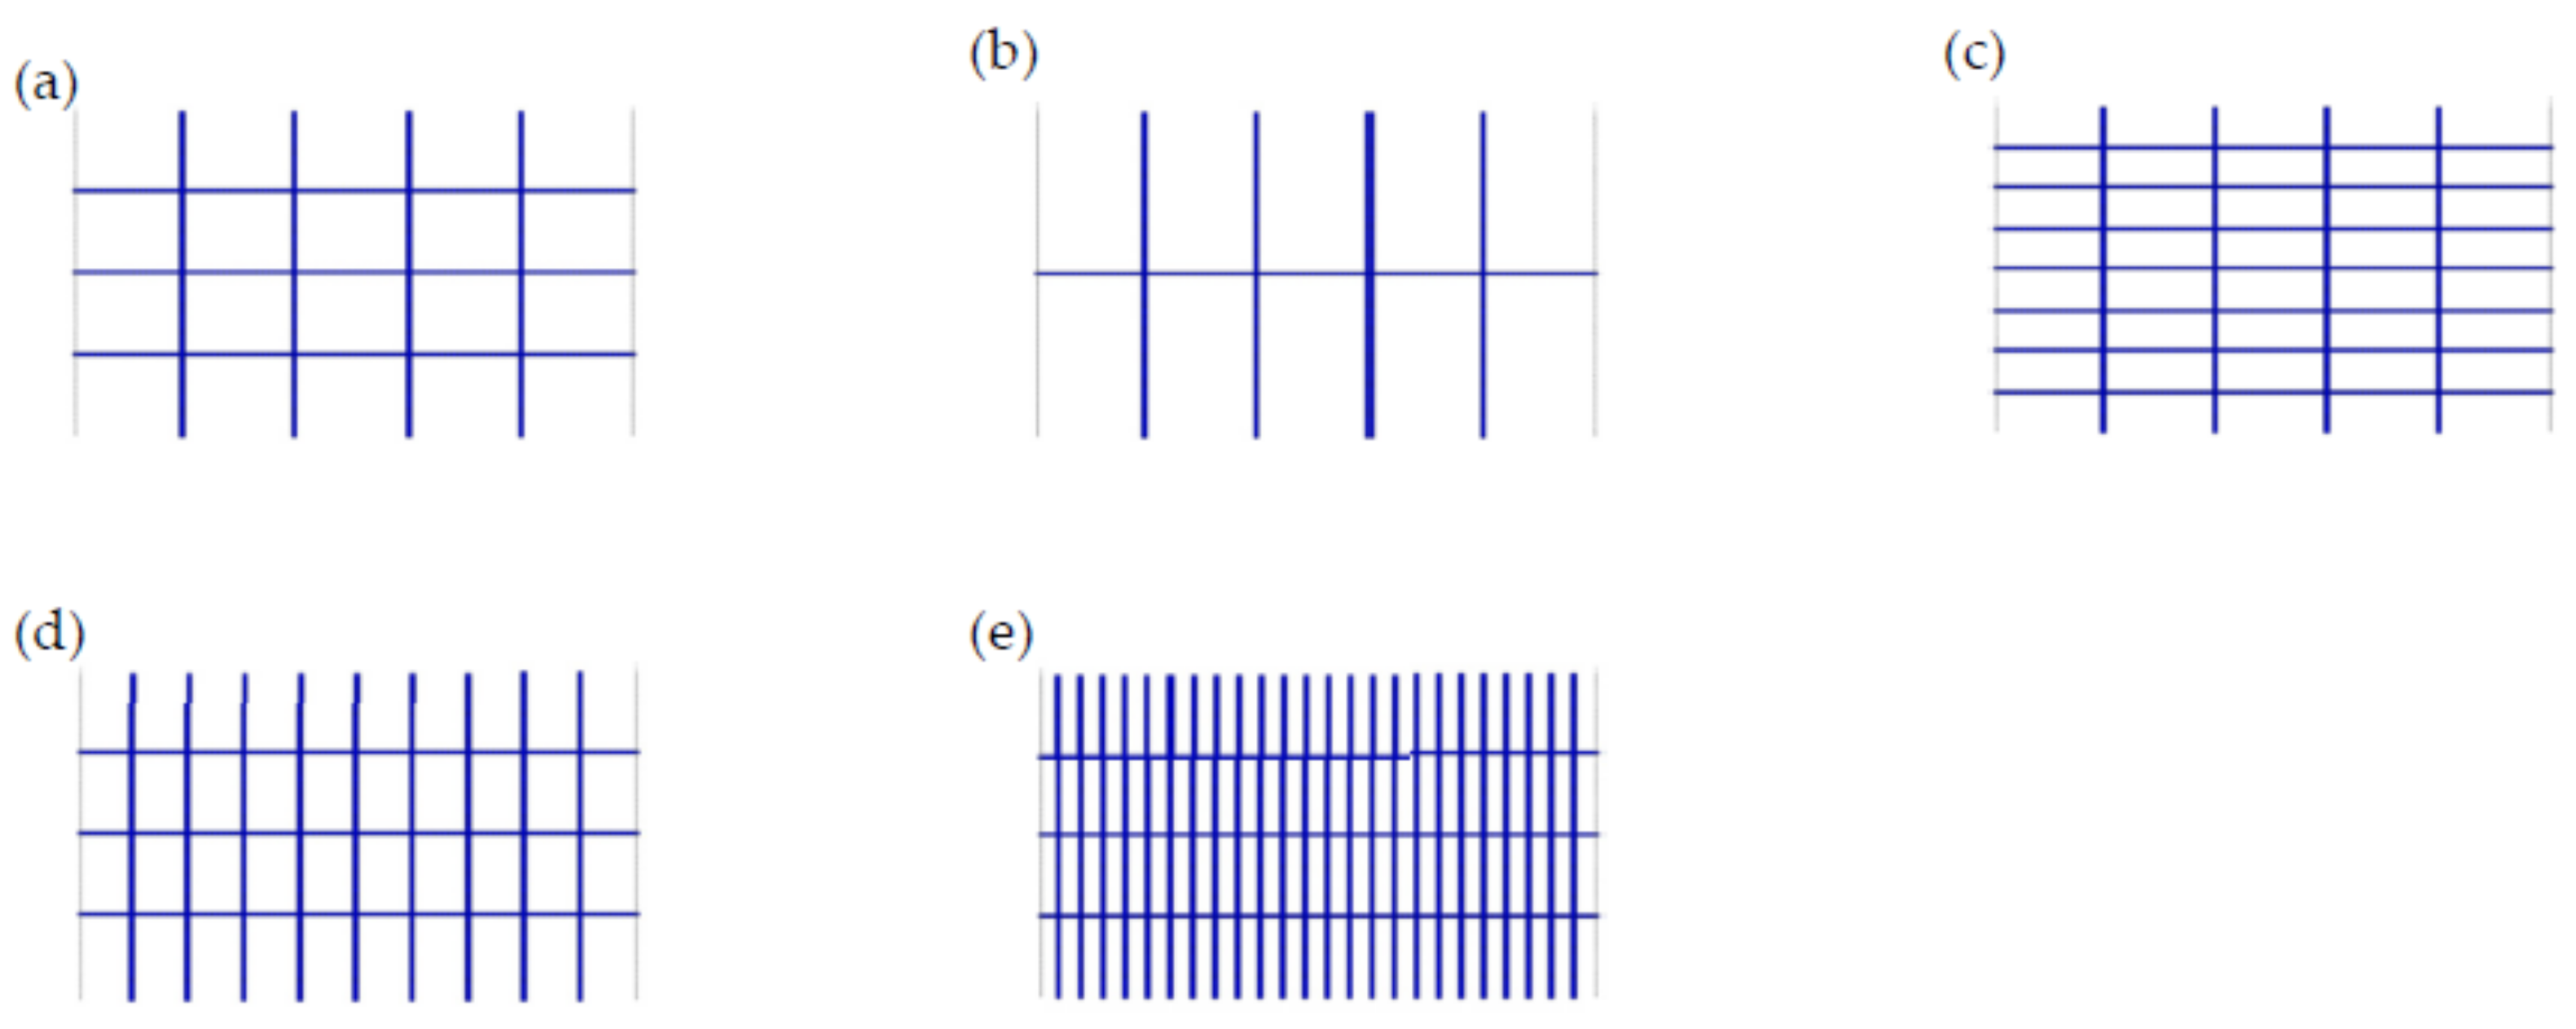
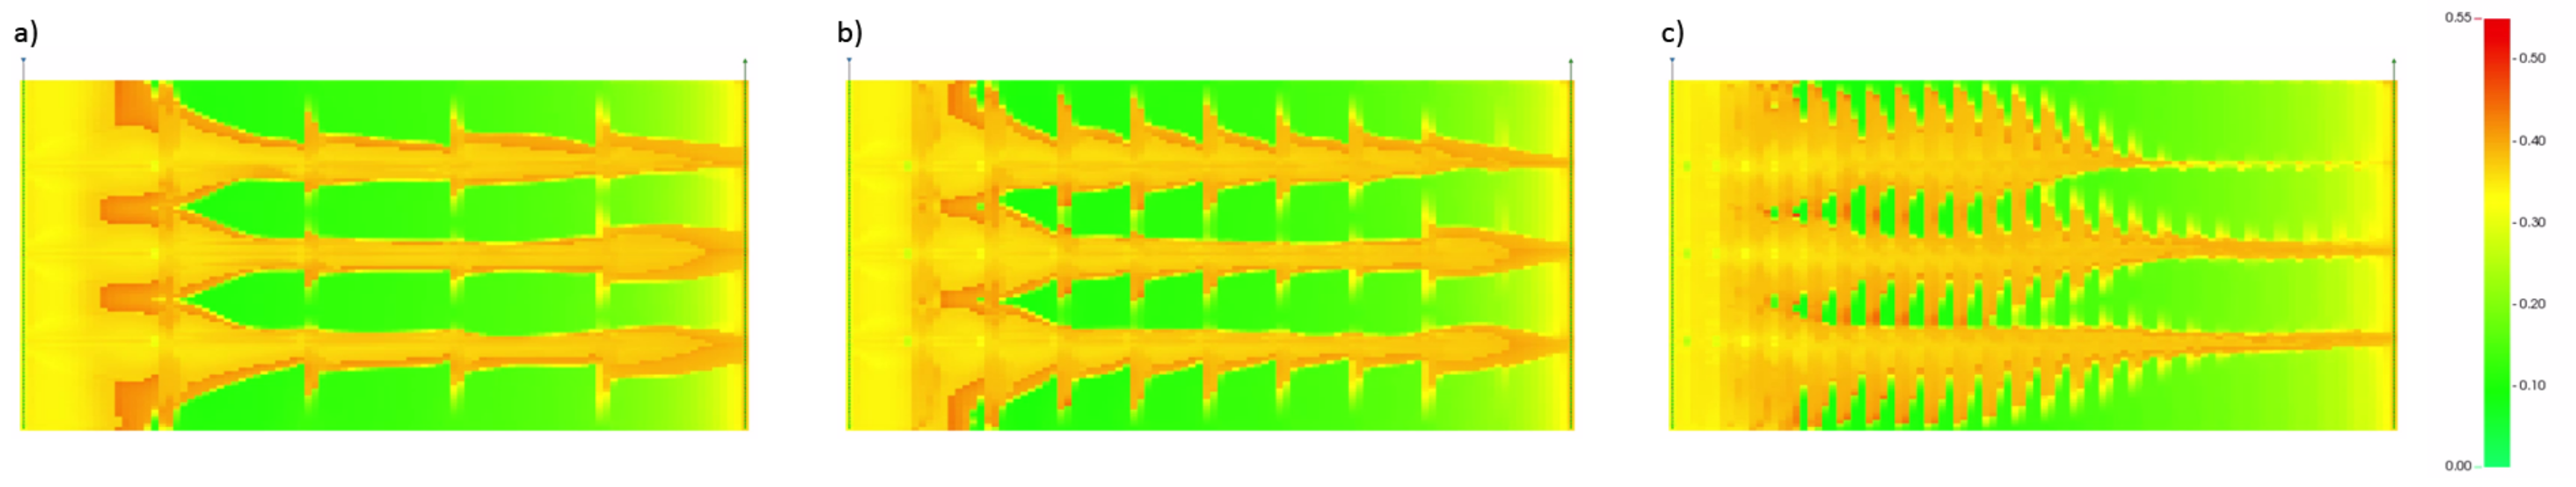
Three main variables were investigated regarding their effect on the oil recovery. These were the fracture block height (height of the vertical fracture blocks; increased height lowers horizontal fracture count), fracture permeability, and fracture spacing (spacing between vertical fractures, increased spacing lowers vertical fracture count). Figure 9 shows the different fracture networks used in the cross-sectional model where “a” is the base case. The base case in this study assumed a fracture permeability of 500 mD, a block height of 5 m, and a fracture spacing of 10 m. For each parameter, two additional cases were created (fracture permeability: 100 mD and 1000 mD; fracture block height: 2.5 m and 10 m; fracture spacing: 2 m & 10 m).
A base case was created by imposing a fracture network onto the cross-sectional model representing a fracture block height of 5 m and a fracture spacing of 10 m to have a more realistic approach than the former continuously fractured cross-sectional model, as fractured reservoirs are typically characterized by consisting of big matrix blocks that are separated by fractures. This model was then used to display the recovery-enhancing effects of FAWAG in comparison to regular WAG displacement in a gas-invaded environment of 40%. 
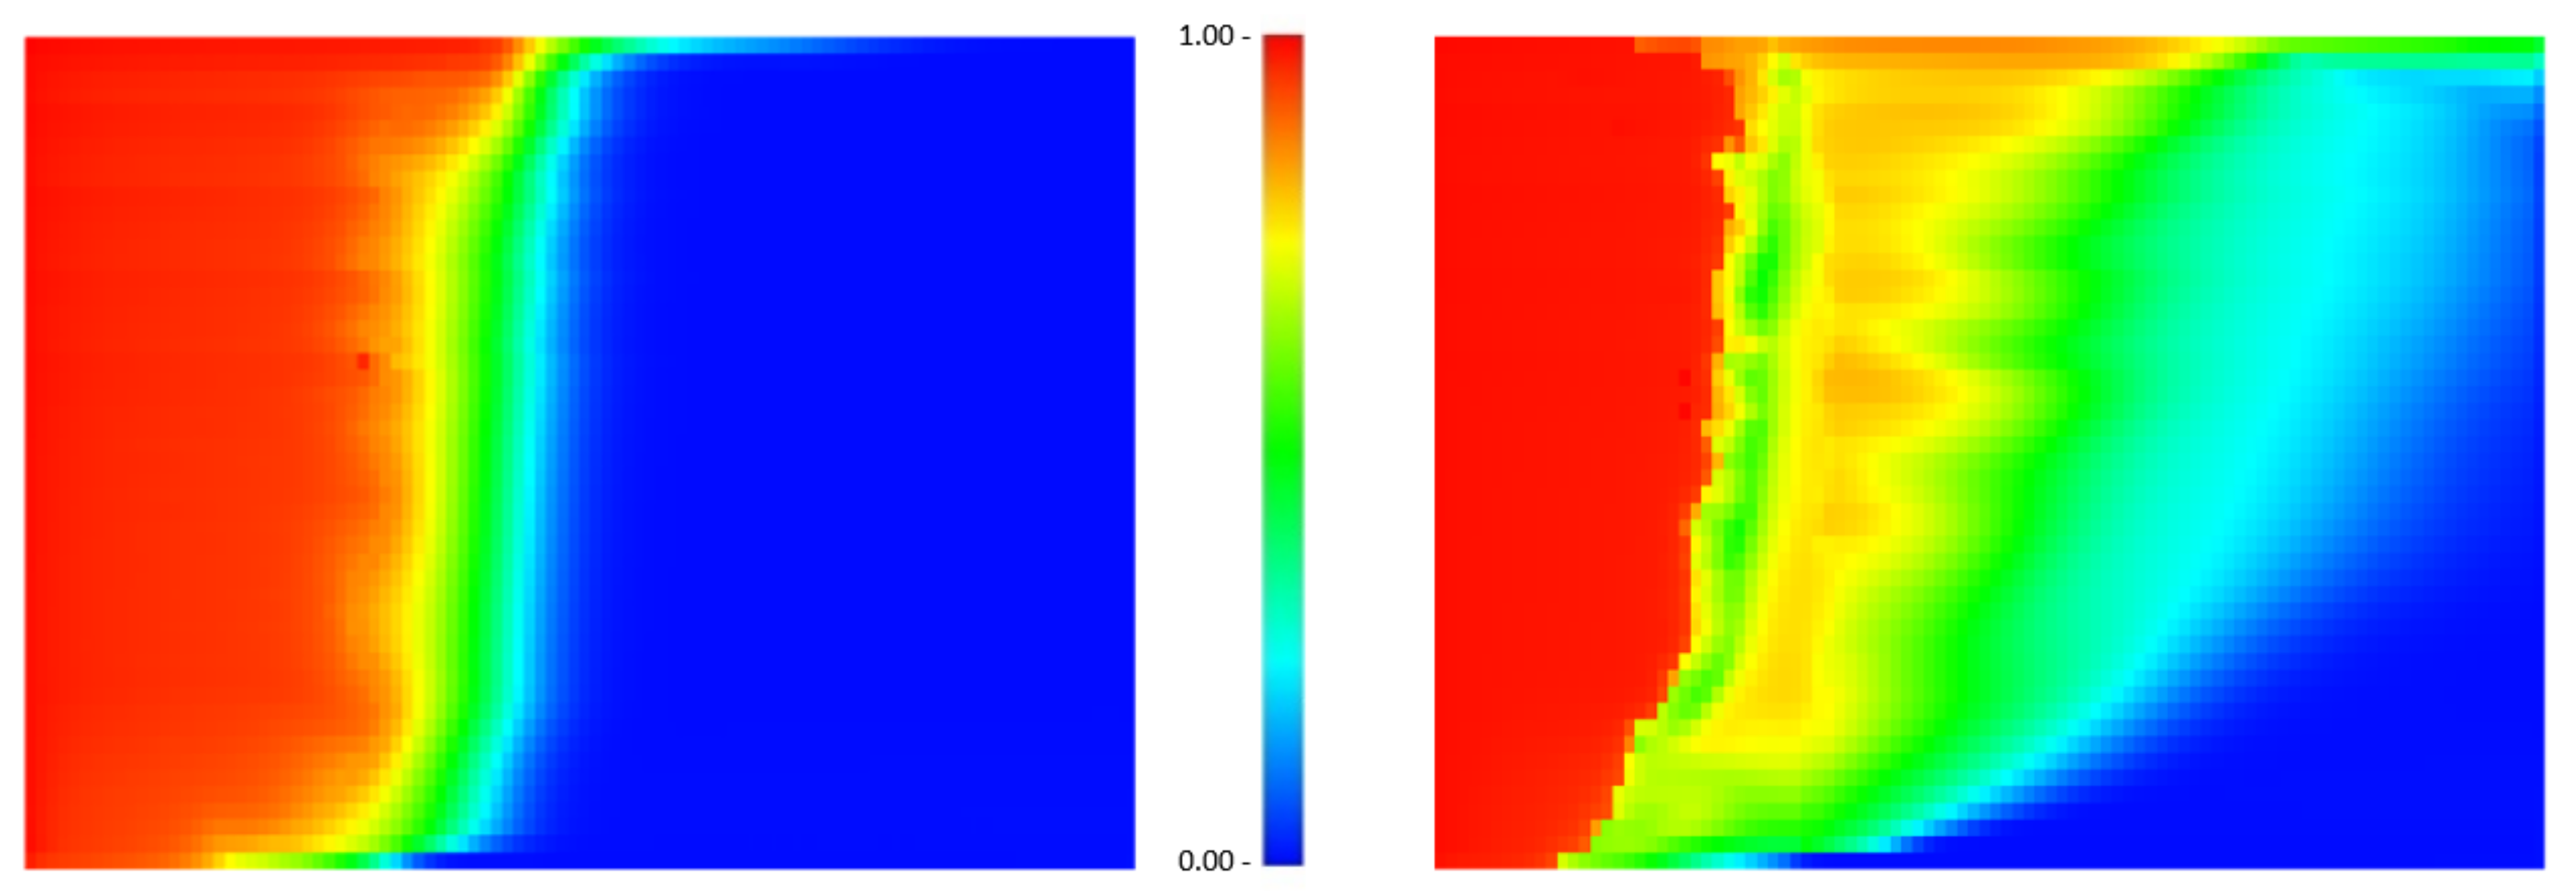
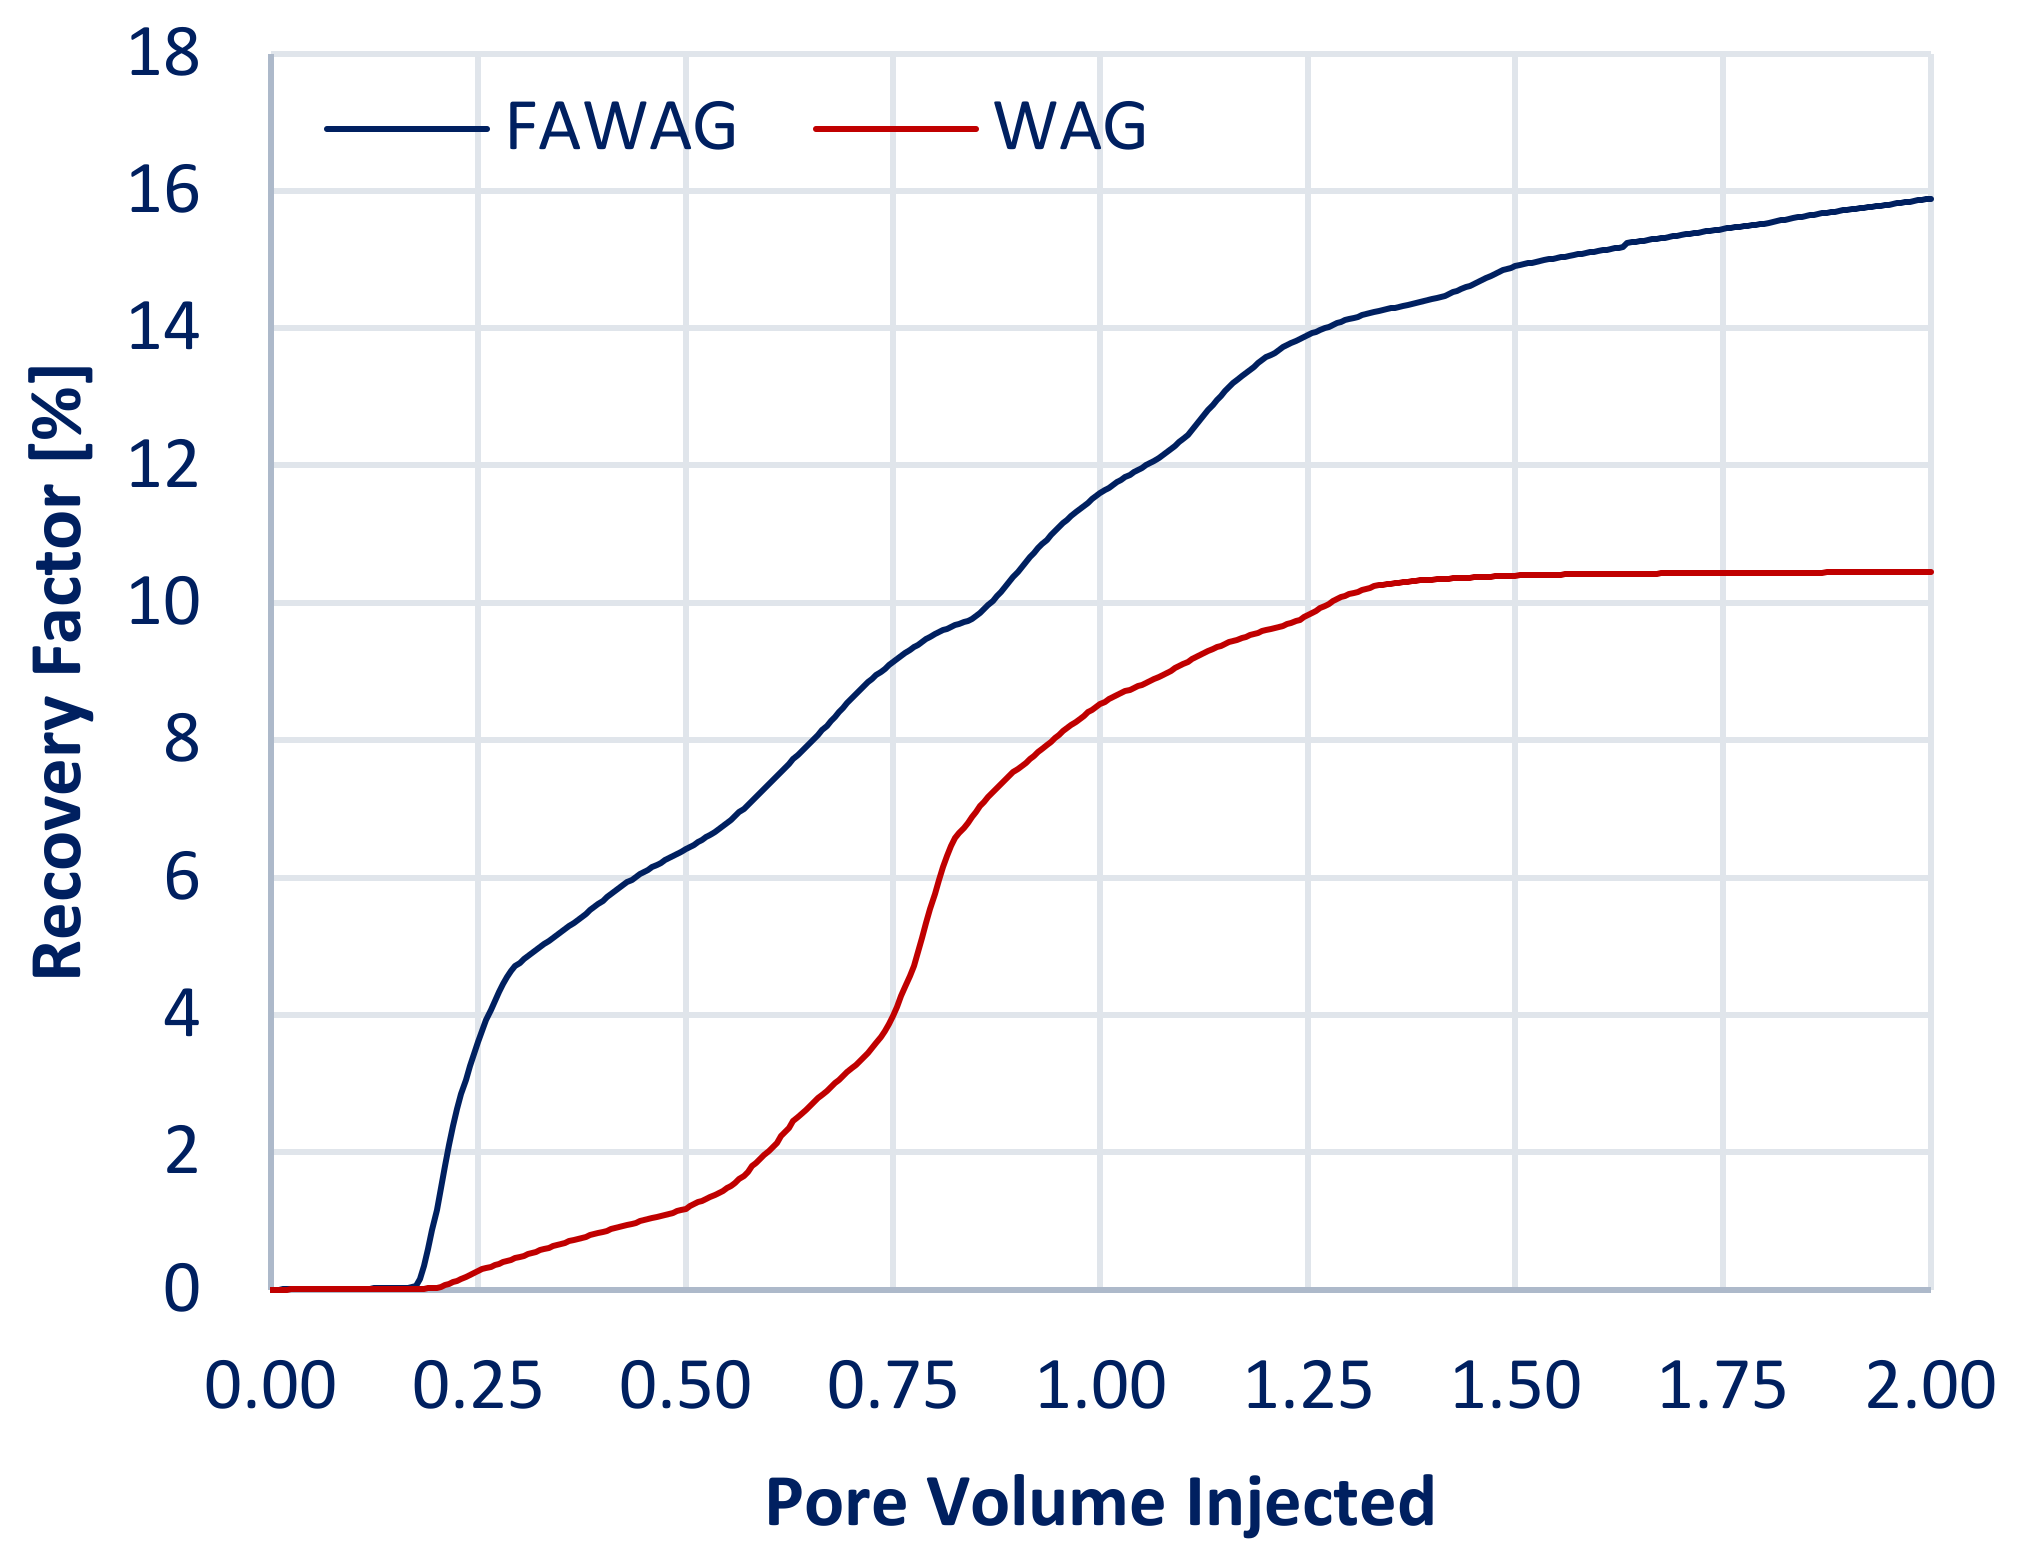
Figure 8 shows that the sweep efficiency is enhanced by using foam for displacing the oil. The CO2 gas front is significantly sharper for FAWAG than regular WAG injection. Lower gas mobility impedes the gas’ ability to bypass the oil; thus, the gas can better displace the oil. The recovery is close to 6% higher than the WAG displacement (Figure 10). The sharp increase in the first 0.5 PVI can combine the surfactant’s IFT-changing and gas-mobility-controlling abilities.
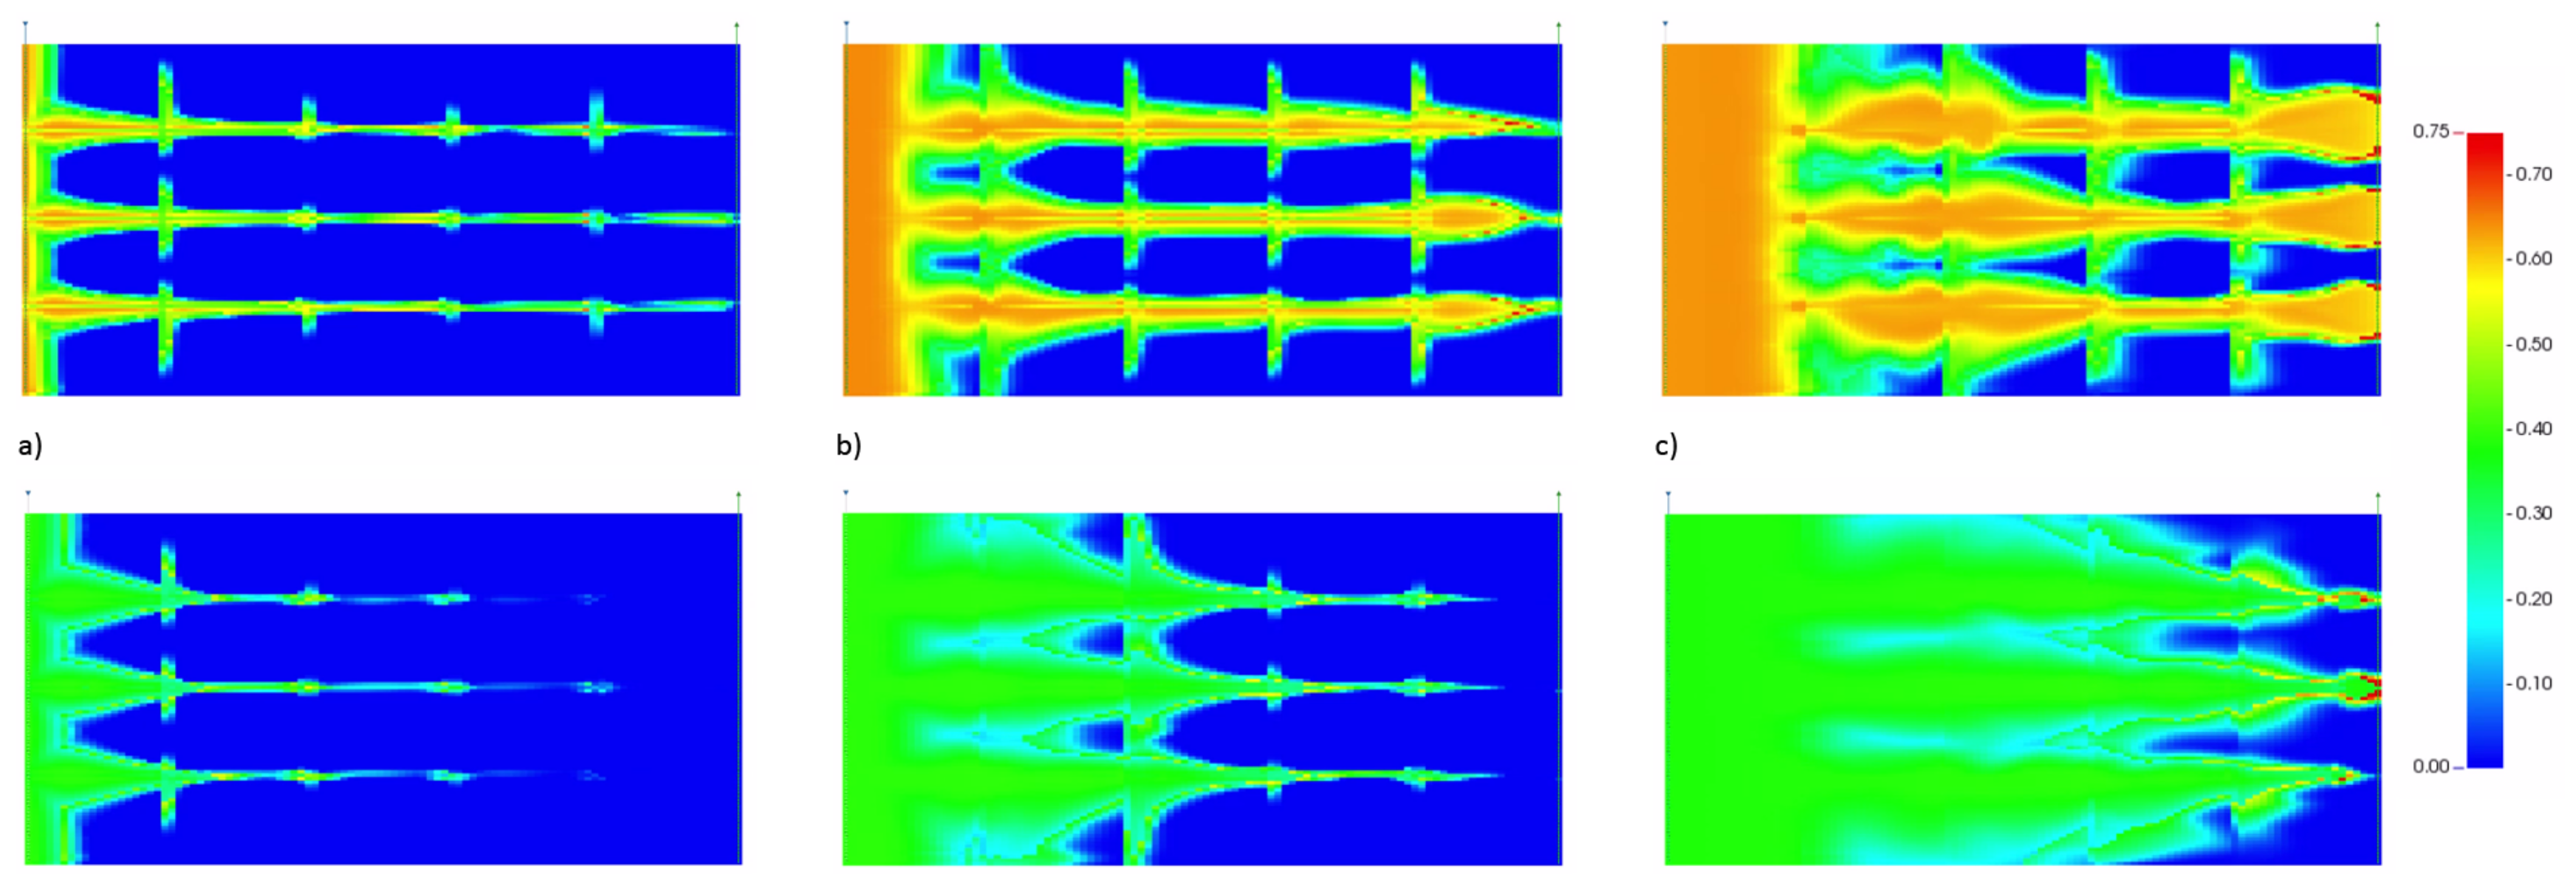
Figure 11 compares the gas movement through the cross-section between the FAWAG and WAG displacement methods. The mobility reduction of foam is clearly visible in these different stages of CO2 injection. The foam actively slows down the injected gas, impairing its movement through the matrix blocks. Due to the reduced mobility, a more highly saturated gas front moves through the cross-section, displacing the oil more efficiently. By just using WAG, the gas is moving through the matrix unhindered and at a much faster pace and is, thus, also bypassing more of the oil. Furthermore, because of the gas’ high mobility, the ultimate recovery is reached much faster, which is substantially lower than what can be reached by introducing foam to the displacement method.
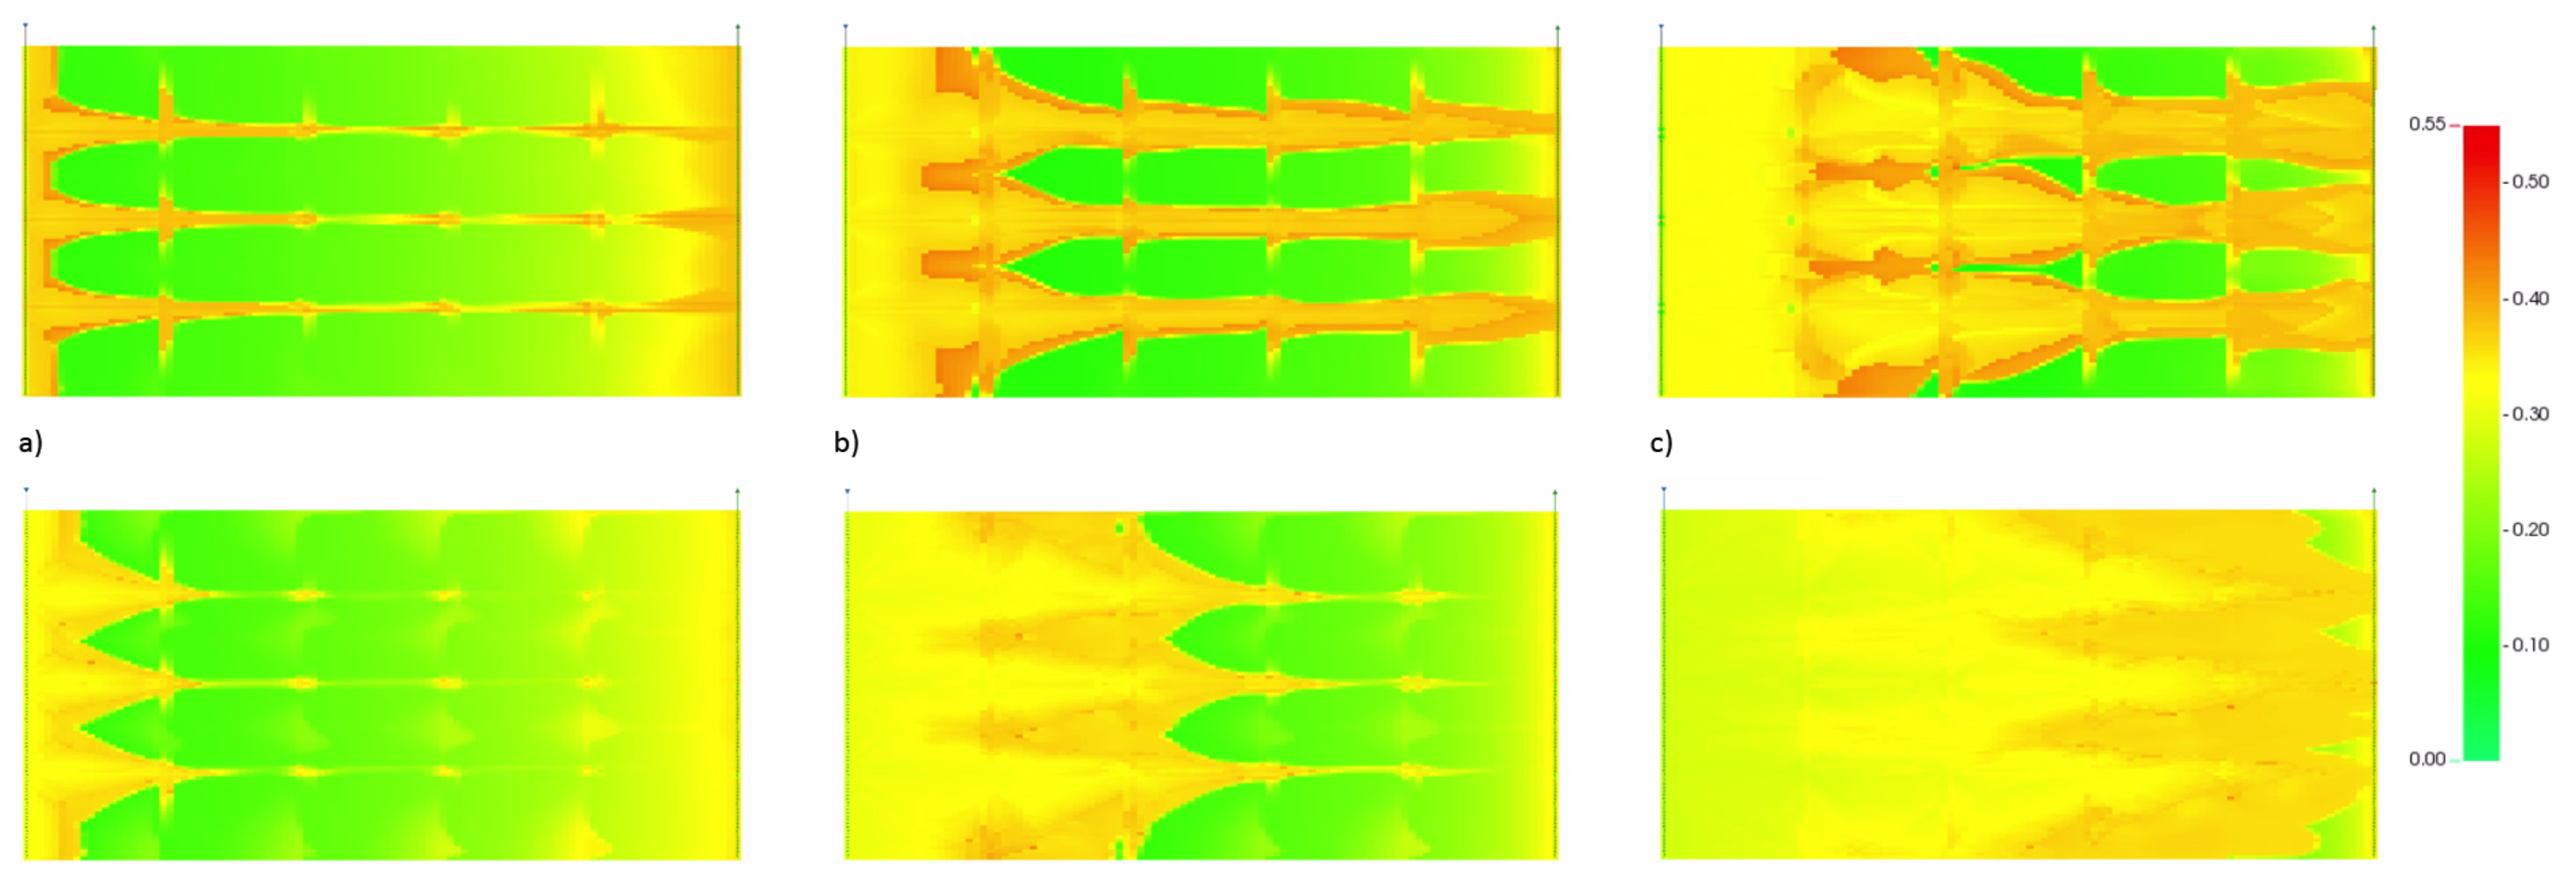
This quality becomes evident when examining the CO2 mole fraction in the gas (Figure 12). In the case of the WAG, the CO2 has a uniform distribution throughout the contacted areas. In contrast, in the FAWAG case, it is highly concentrated around the fractures due to the gas being encapsulated by foam bubbles. Given that foam reduces gas mobility, the foam found in the fractures serves the purpose of diverting gas from the fractures into the matrix blocks by creating a pressure gradient from the fractures to the matrix.
Varying the fracture permeability significantly impacts the recovery in the early stages of the FAWAG injection. Figure 13 illustrates the flow behaviour of the injected gas at different fracture permeabilities. At lower fracture permeabilities, the injected fluids tend to invade the matrix blocks more readily, and gas breakthrough is delayed. A higher fracture permeability facilitates the bypassing of the fracture blocks. However, the ultimate recovery after two injected pore volumes stays almost unaltered. This suggests that FAWAG can be used for high-permeability fracture networks and diverts enough gas into the oil matrix blocks to produce significant oil over time. Figure 14 shows that a reduced fracture permeability substantially increased the recovery up until the first injected pore volume. A lower fracture permeability facilitates the diversion of gas from the fractures into the matrix blocks and, thus, enhances the sweep efficiency of the matrix blocks.
A larger block height exhibits a similar behaviour on the oil recovery as a lower fracture permeability (Figure 14). More injected fluid can enter the matrix blocks and sweep the in situ oil with less horizontal fractures. In contrast, a smaller block height allows more fluid to be conducted horizontally to the producer via fractures bypassing most matrix blocks. As a result, the sweep of the matrix blocks is less efficient. Figure 15 illustrates the enhanced sweep efficiency of the model with a 10 m block height. Starting from 0.5 PVI, a higher recovery. There is no significant difference between 5 m and 2.5 m until 1.1 PVI. Figure 16 illustrates how strongly a higher fracture block height can affect oil recovery. After two pore volumes were injected, the block height of 10 m has a 2.5% recovery lead over the 2.5 m block height. Production from a fractured reservoir with few horizontal fractures profits greatly from foam diverting gas into the matrix blocks.
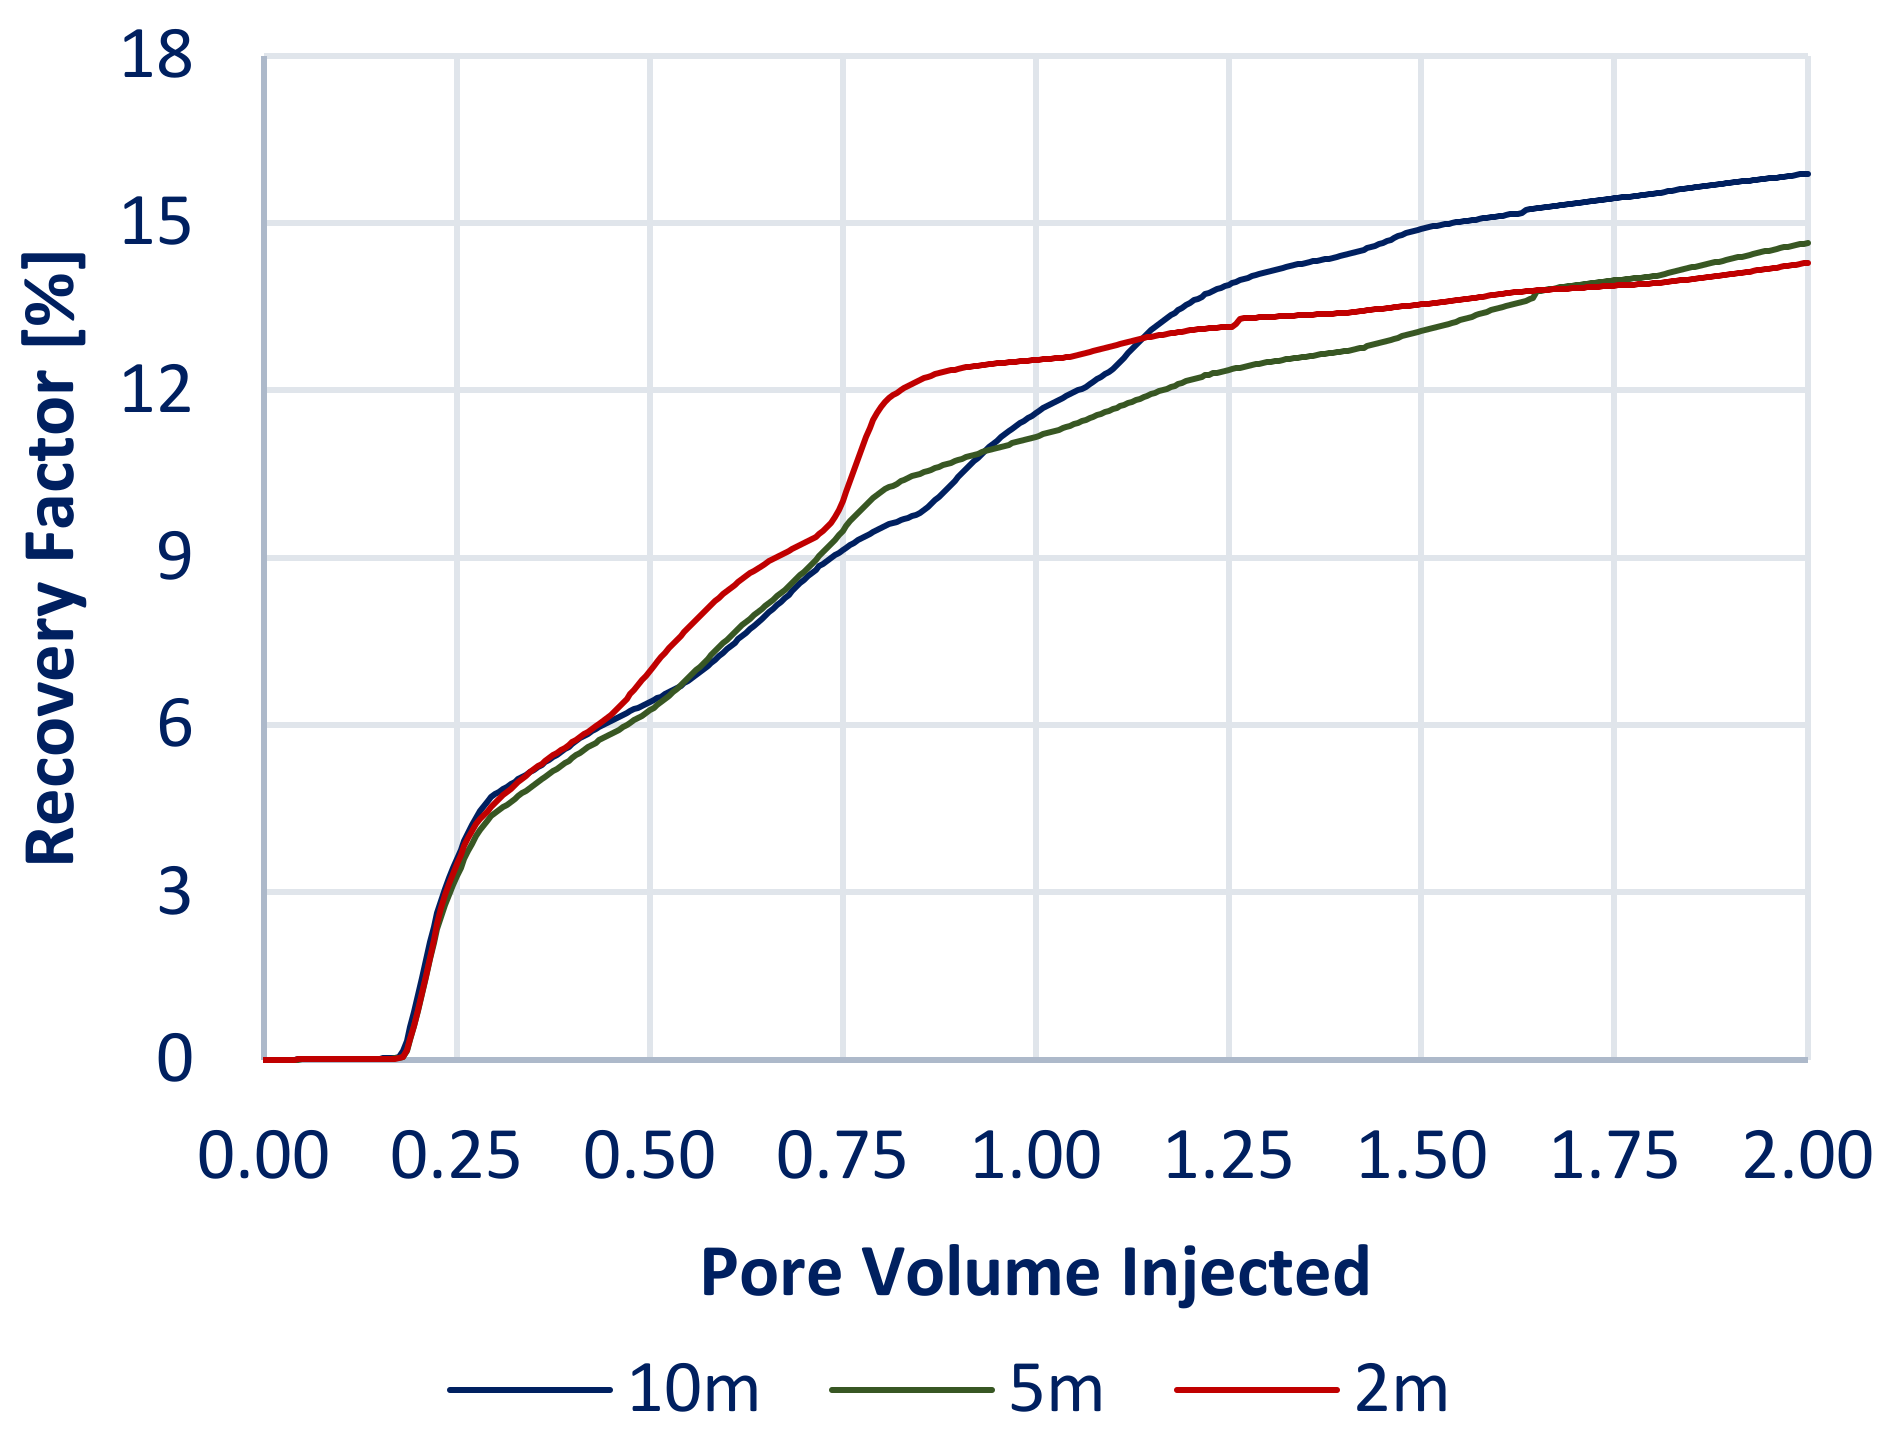
Figure 17 shows how efficiently the gas occupies the vertical fractured. When the saturation in the vertical fractures reaches high percentages, the invasion of the matrix blocks is impaired, and lower oil recovery results. Reservoir rock with many vertical fractures might initially boast a higher recovery but will reach ultimate recovery sooner than other reservoirs. The fracture spacing influences oil recovery and allows for more gravity drainage and better sweep in the early injection stages (Figure 18) by introducing a tighter spacing. Although there is an increase in oil recovery, the ultimate recovery is reduced with reduced fracture spacing, suggesting that the effect of gravity drainage eventually stops, and the matrix blocks are no longer invaded efficiently.

8. Reservoir Sector Model [Gas Invaded Zone]

The studied reservoir formation consists of seven layers of carbonate dolomitic rock with oil field fissures and fractures, which are fairly distributed, and these fracture networks contribute to oil production [
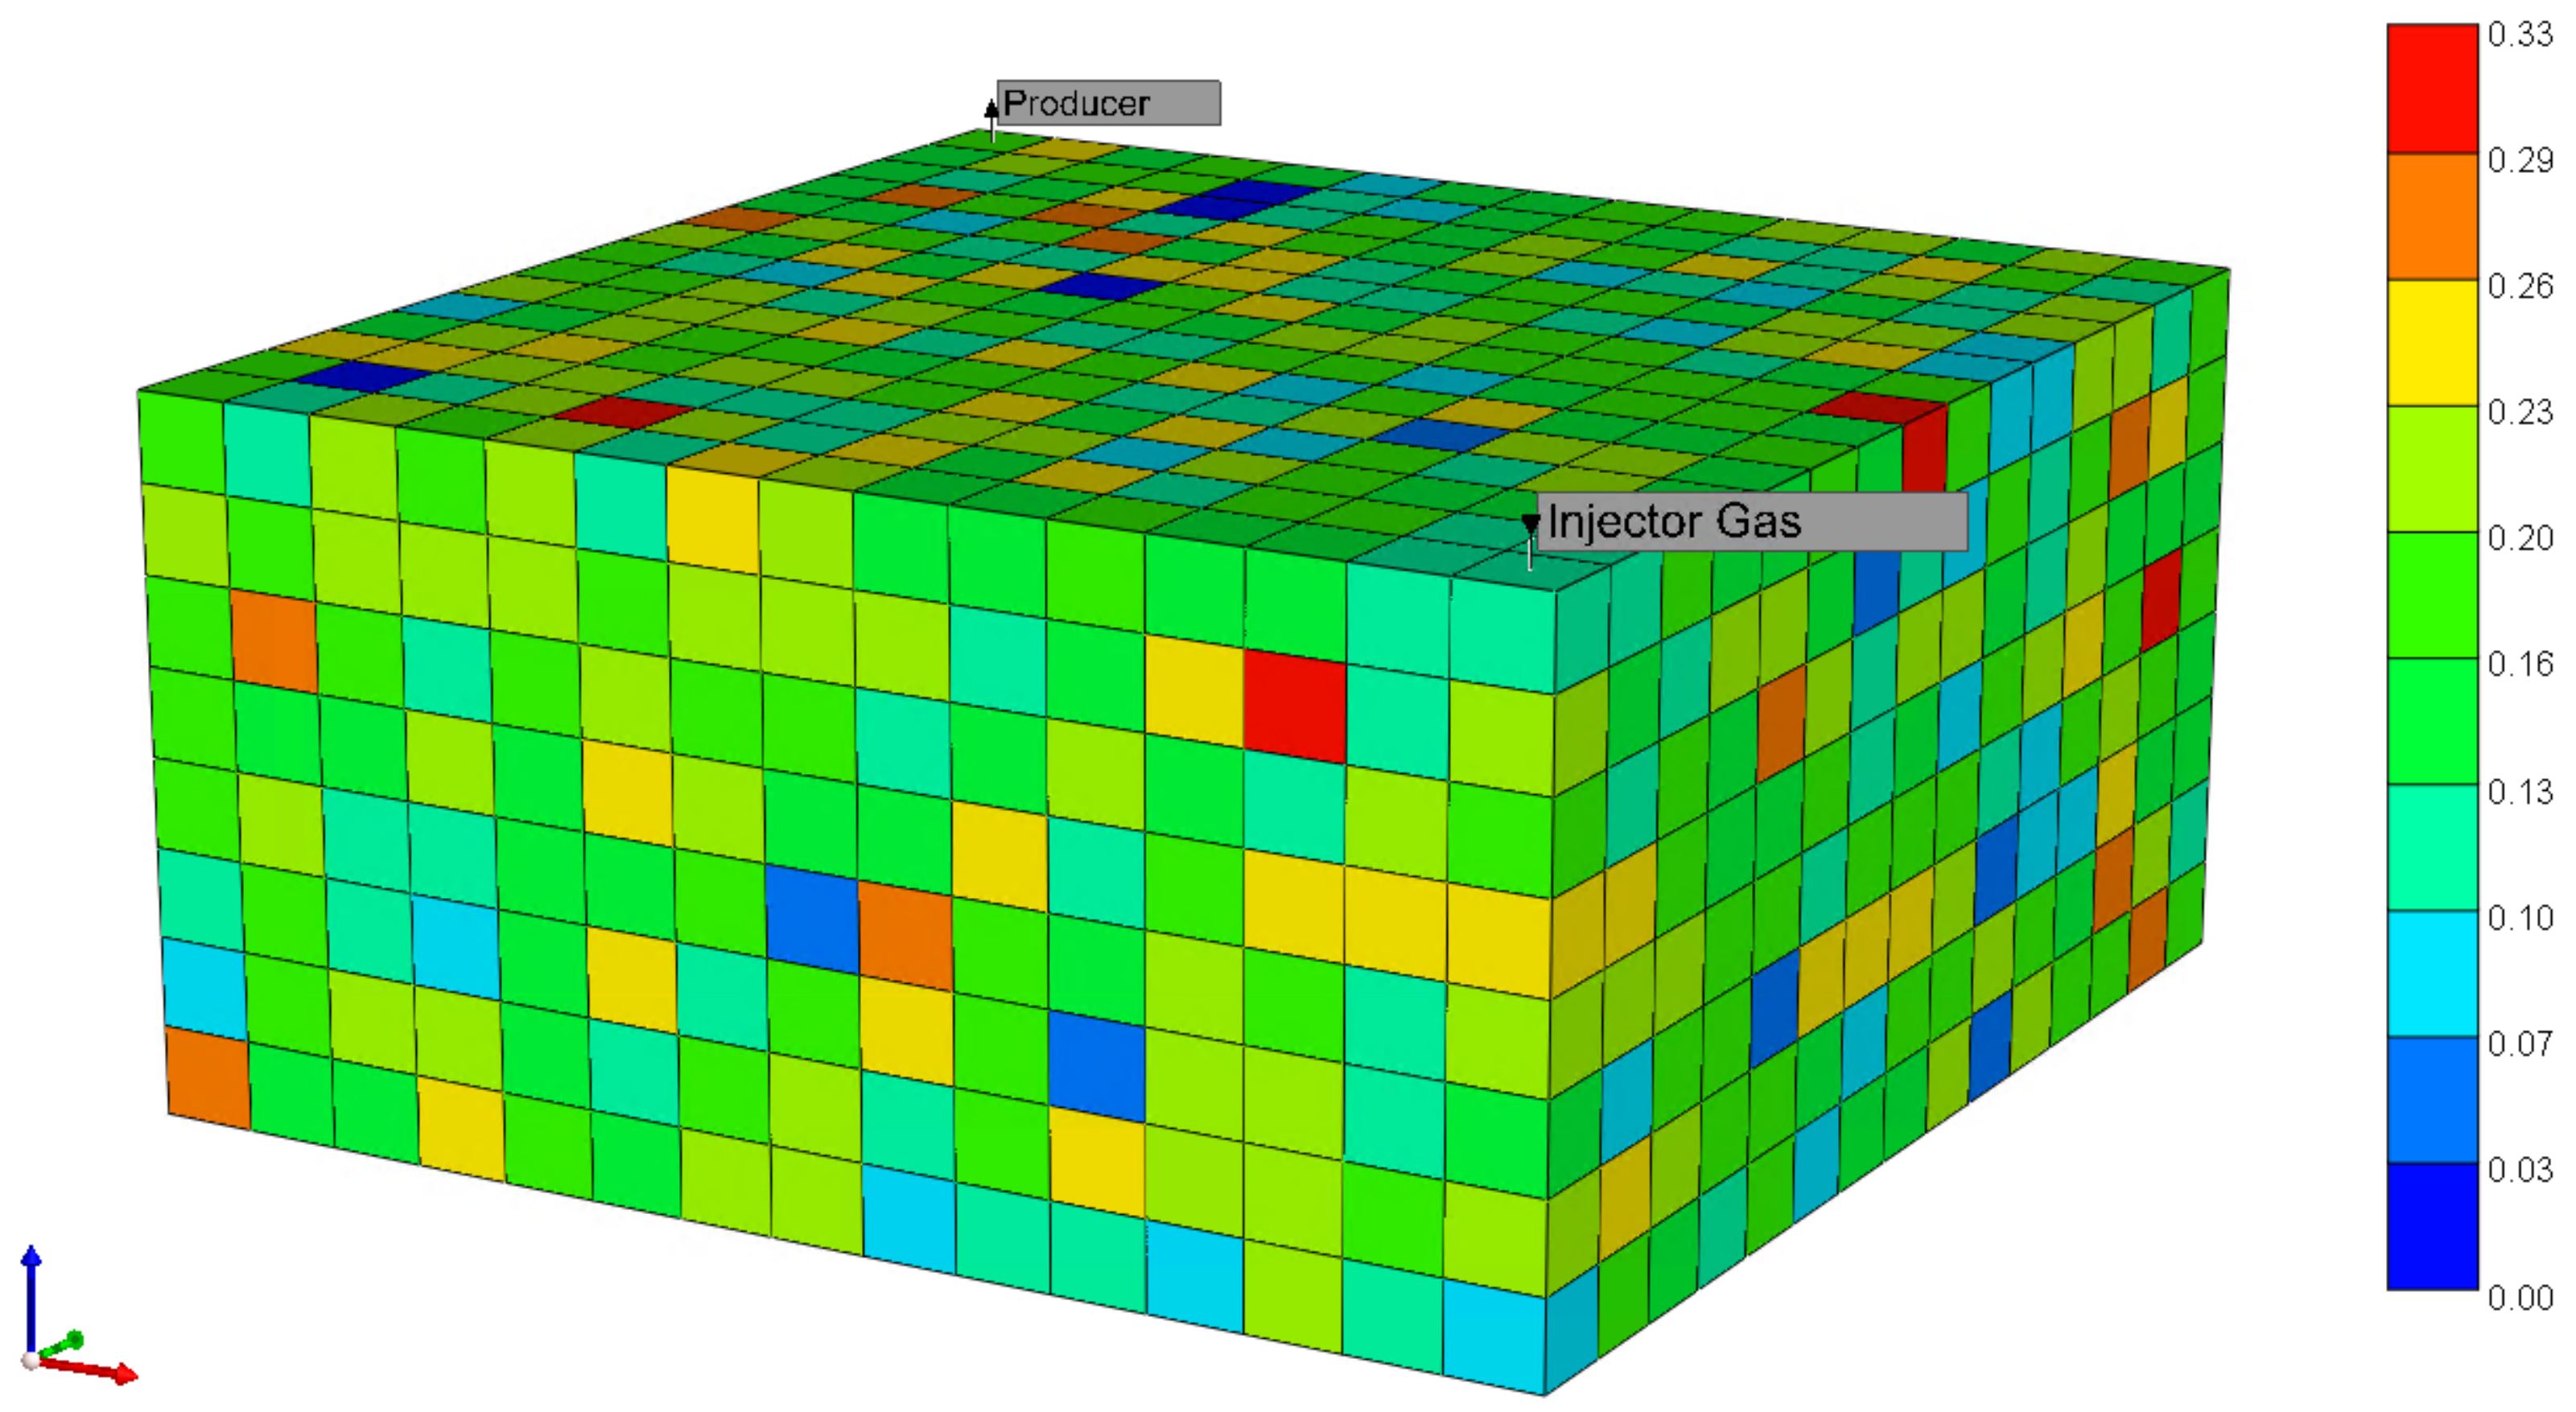
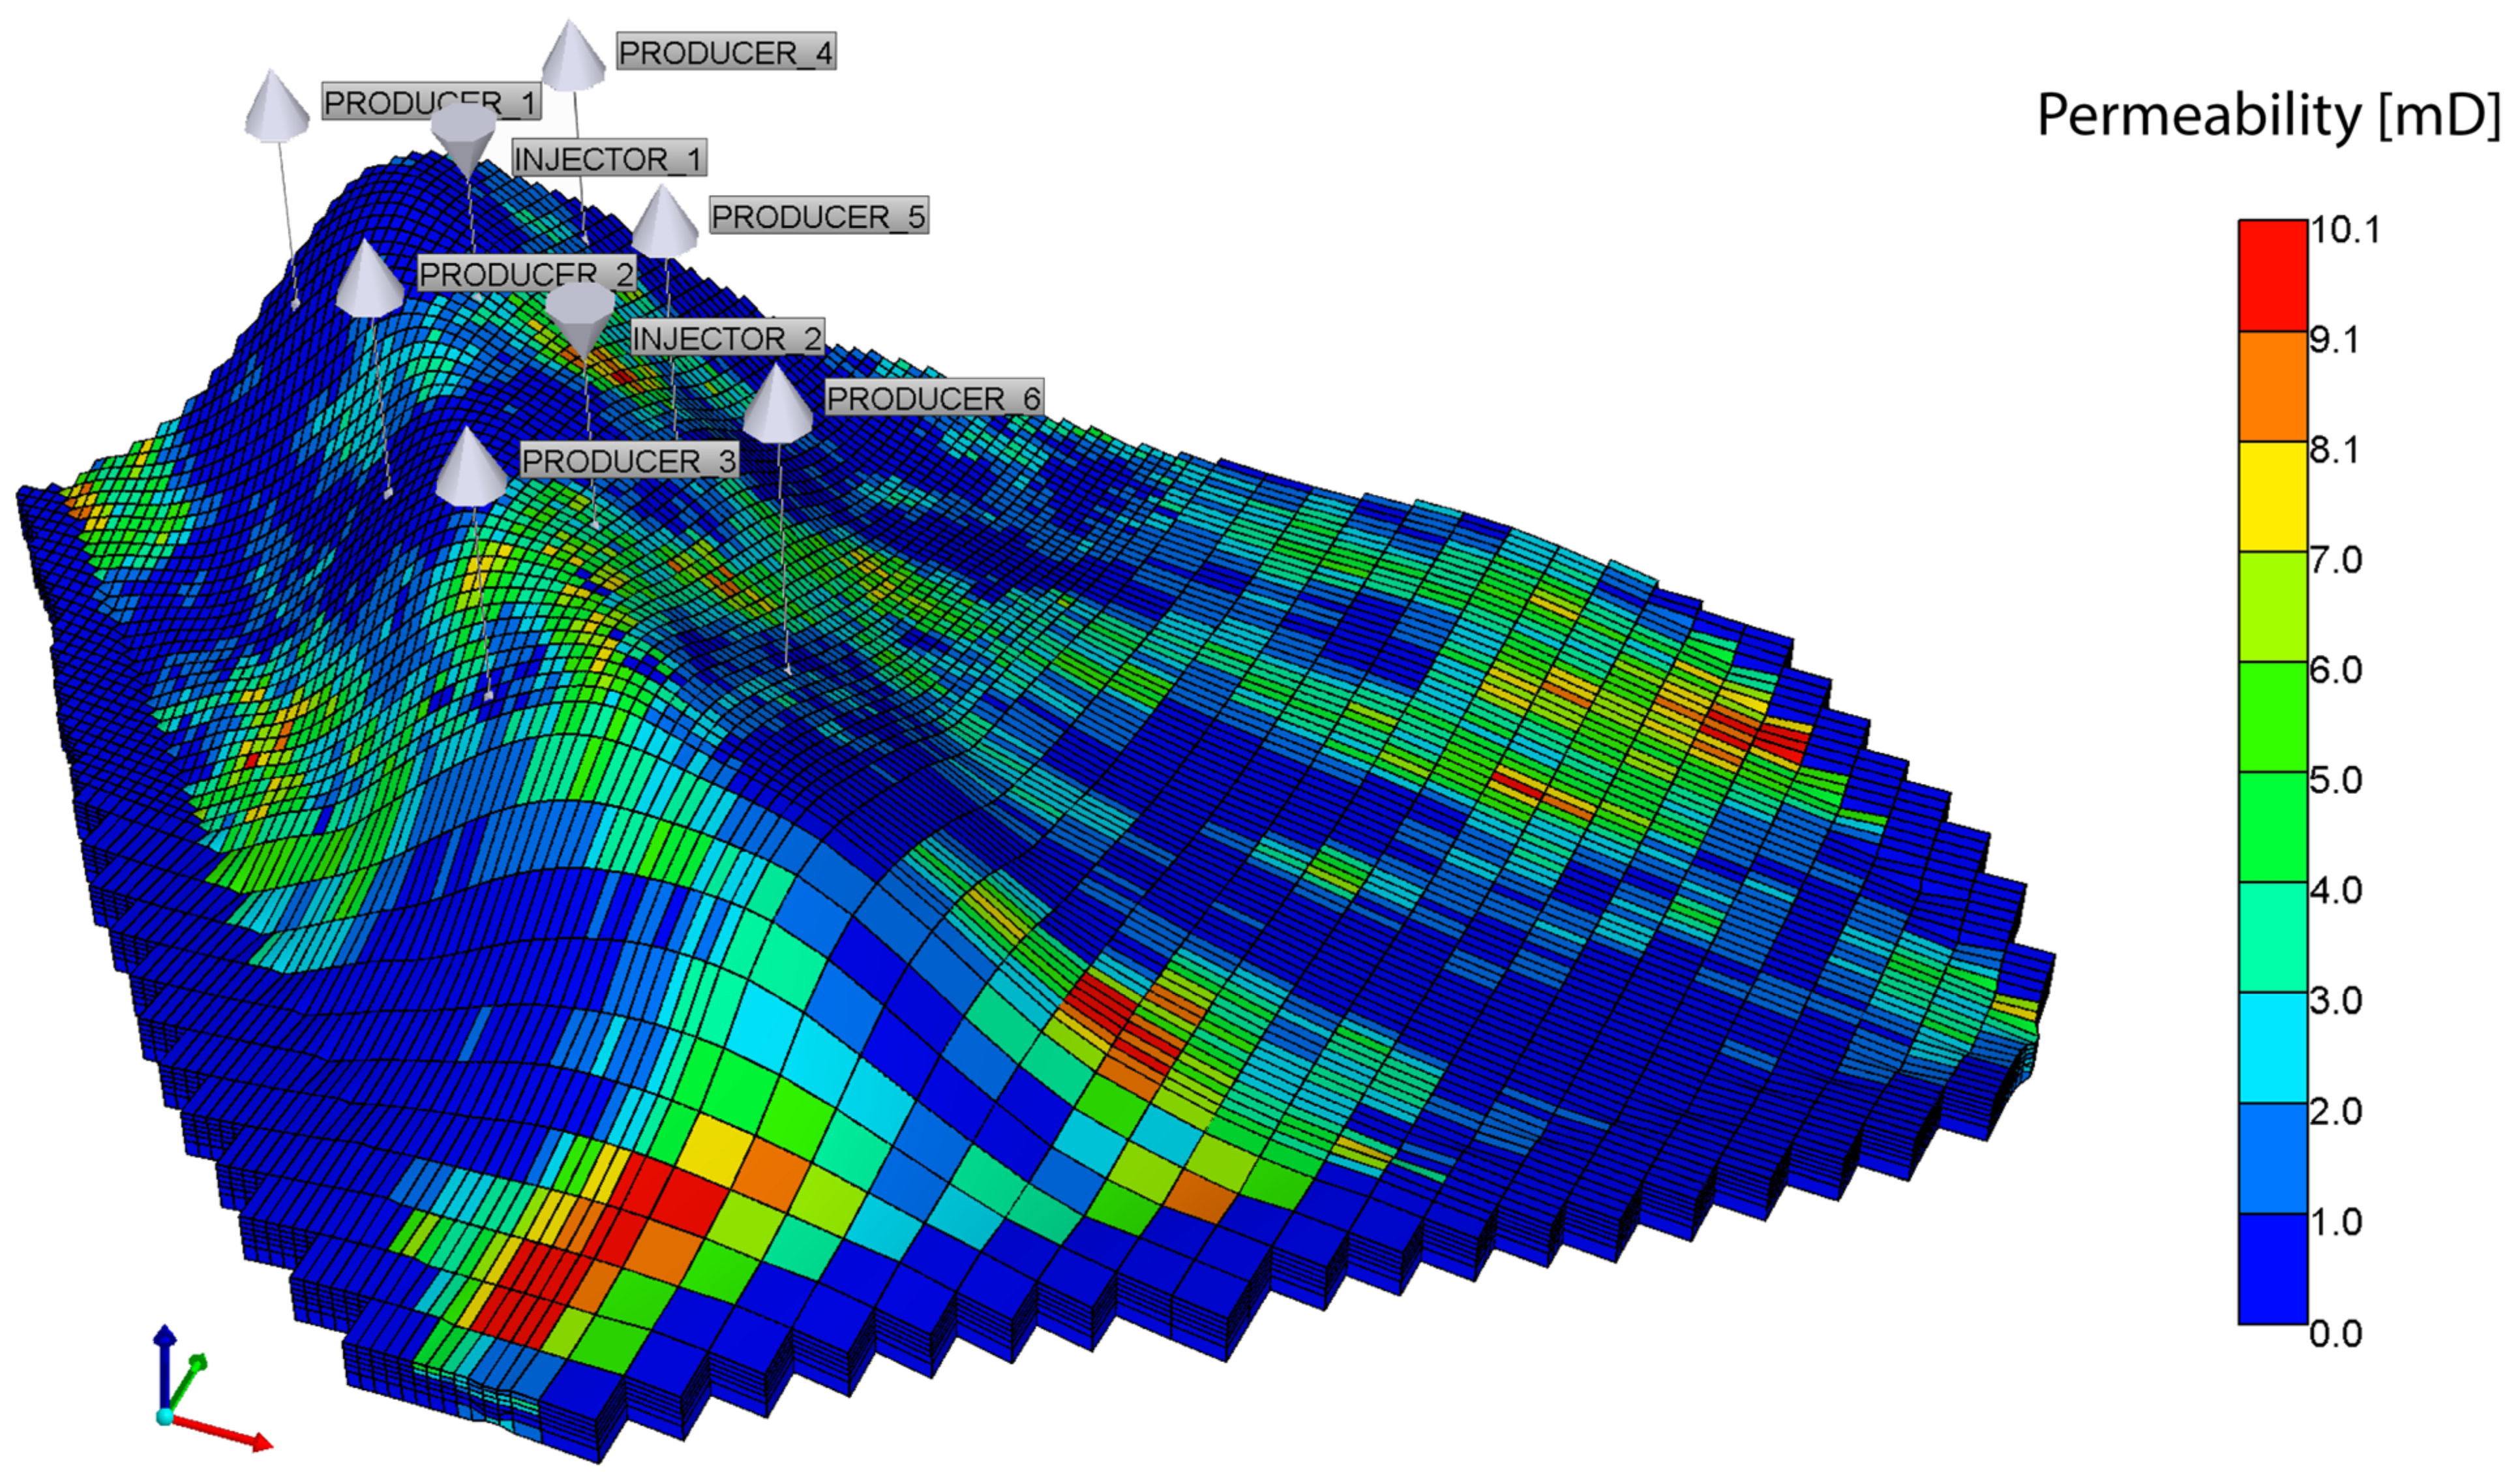
27]. Initially, the reservoir was undersaturated, and the initial reservoir pressure was equal to 2500 psia with an average temperature of 50 °C. Oil production causes a reduction in pressure. After reaching the saturation pressure, the gas cap starts to form gradually. The selected sector model has a very low permeability, ranging between 0.01 mD and 10.1 mD and an average permeability of about 14%, representing the cores used in the history match (Figure 19). This model investigates the potential benefits of applying WAG and FAWAG and compares their effectivity. It can give crucial insight into how the two EOR methods might influence the oil recovery of a reservoir and how they behave in a large-scale production simulation.
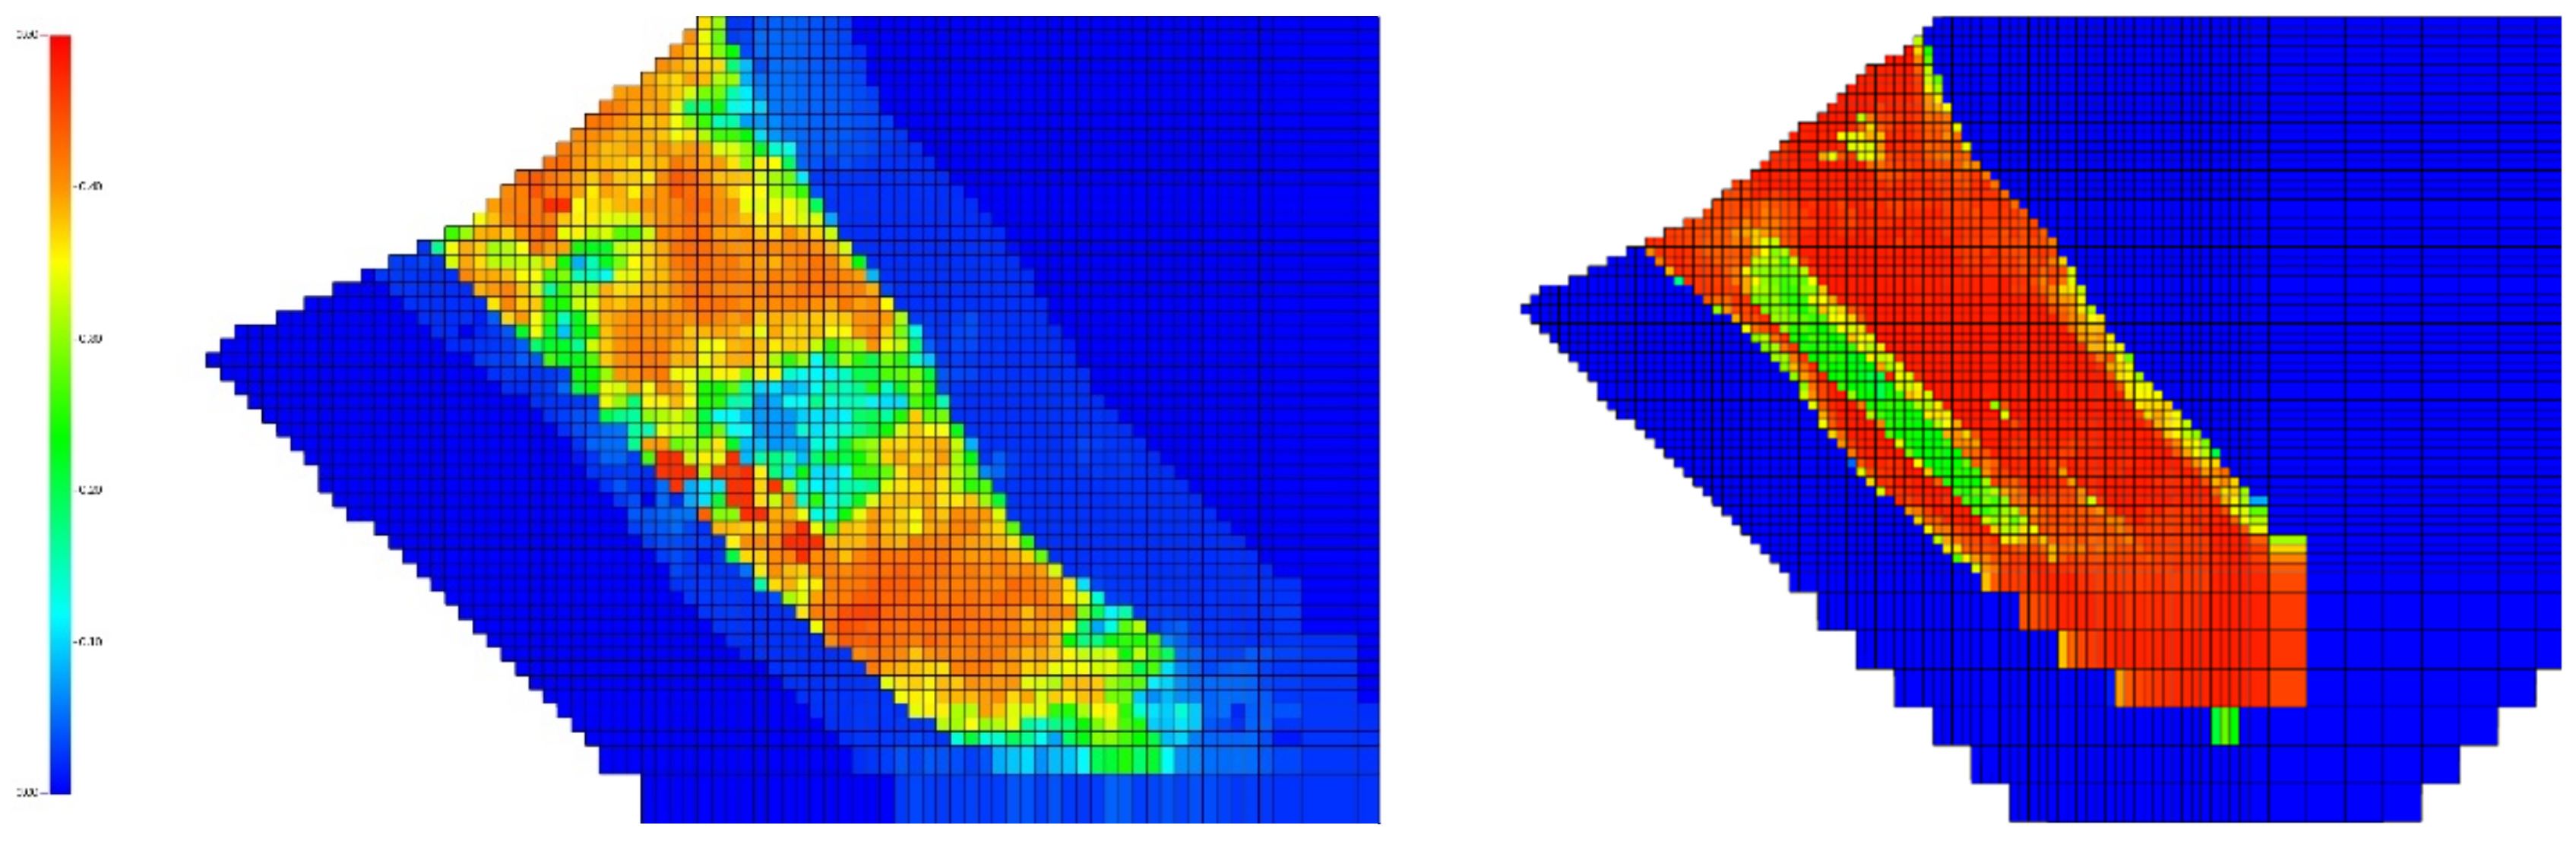
To prepare the model, methane was injected to create a suitable gas-invaded zone with approximately 40% gas saturation in the uppermost layers. As shown in Figure 19, a dual-five-spot well pattern was installed to test WAG and FAWAG displacement recovery efficiency. WAG and FAWAG were injected at alternating 0.2 PVI until one pore volume was reached, e.g., three cycles of water and two cycles of gas. The gas and oil saturation of the invaded gas zone is illustrated in Figure 20 and Figure 21, respectively. The gas saturation levels range from 0 to 0.5, and oil saturation from 0 to 1.
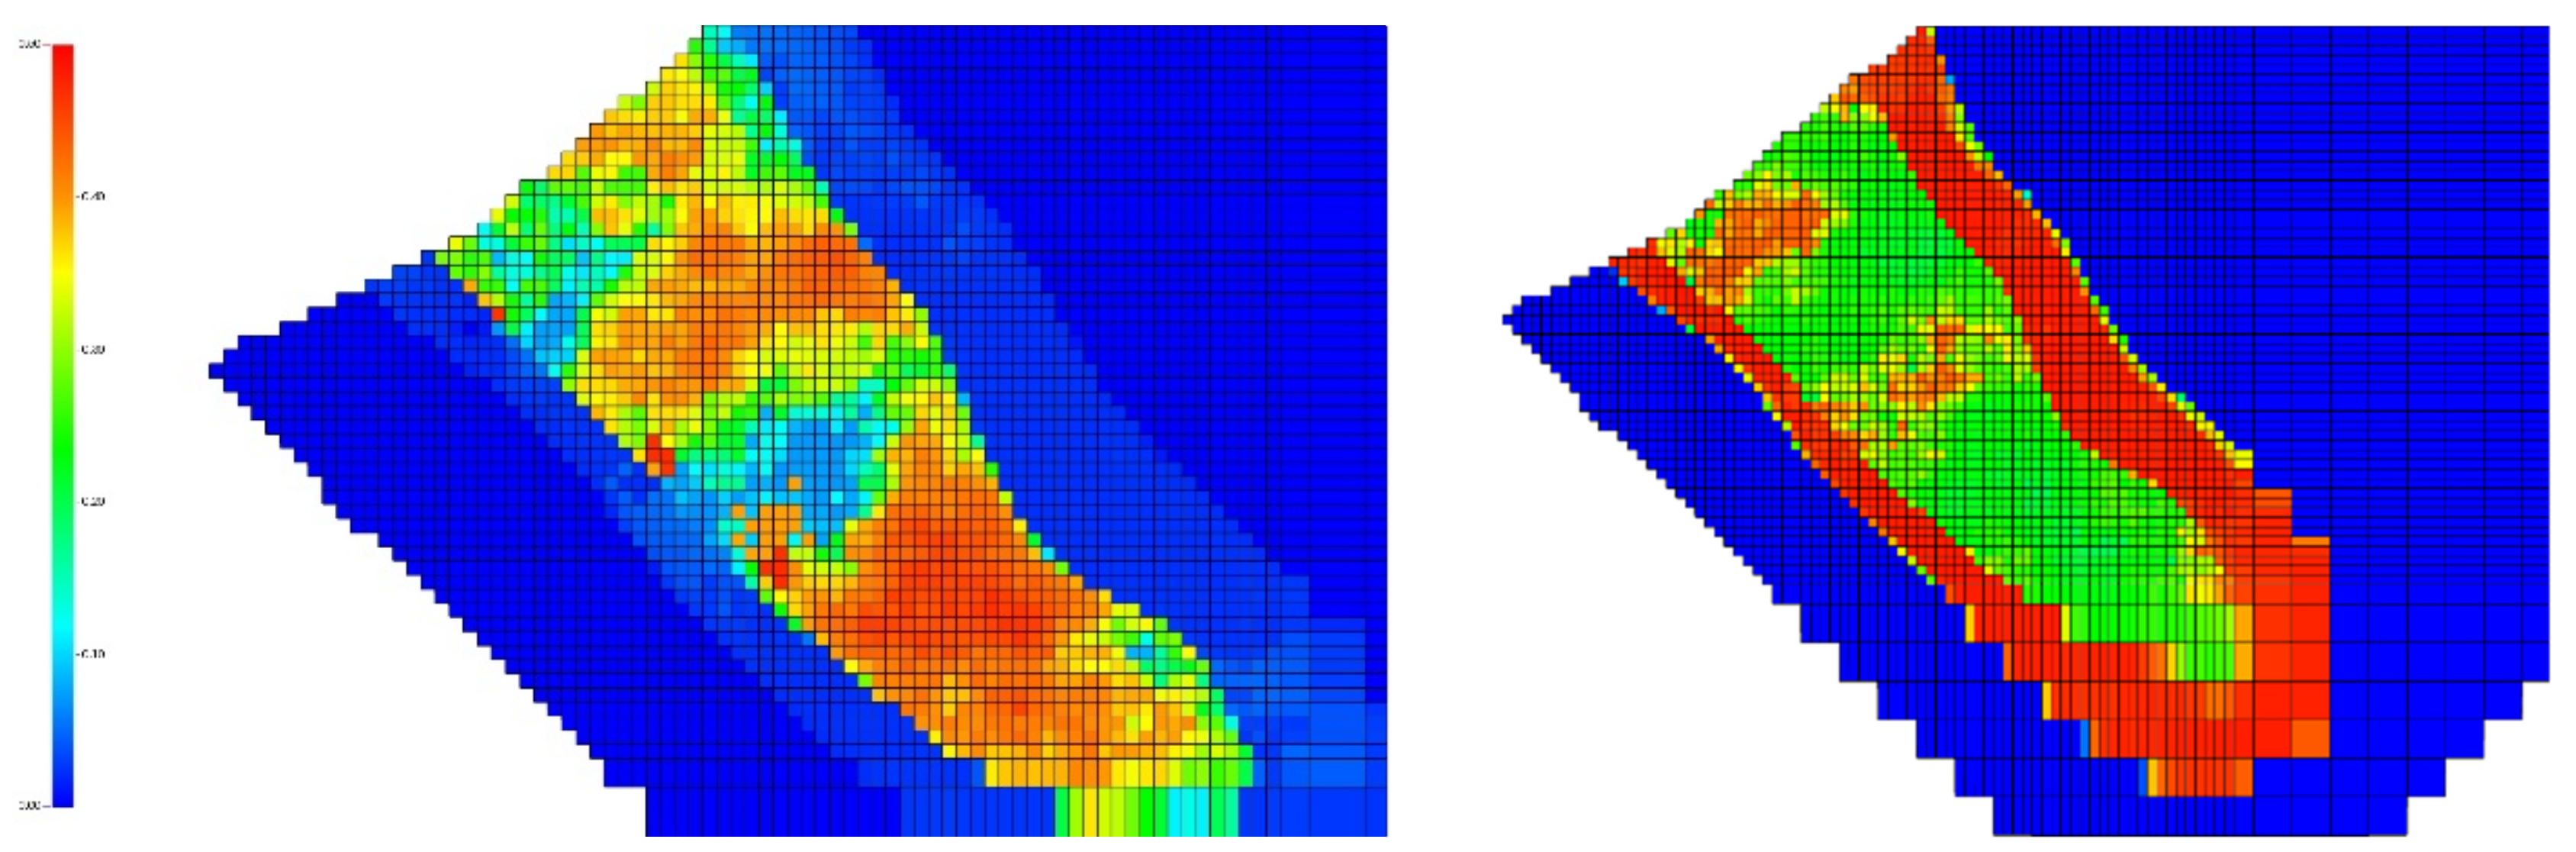
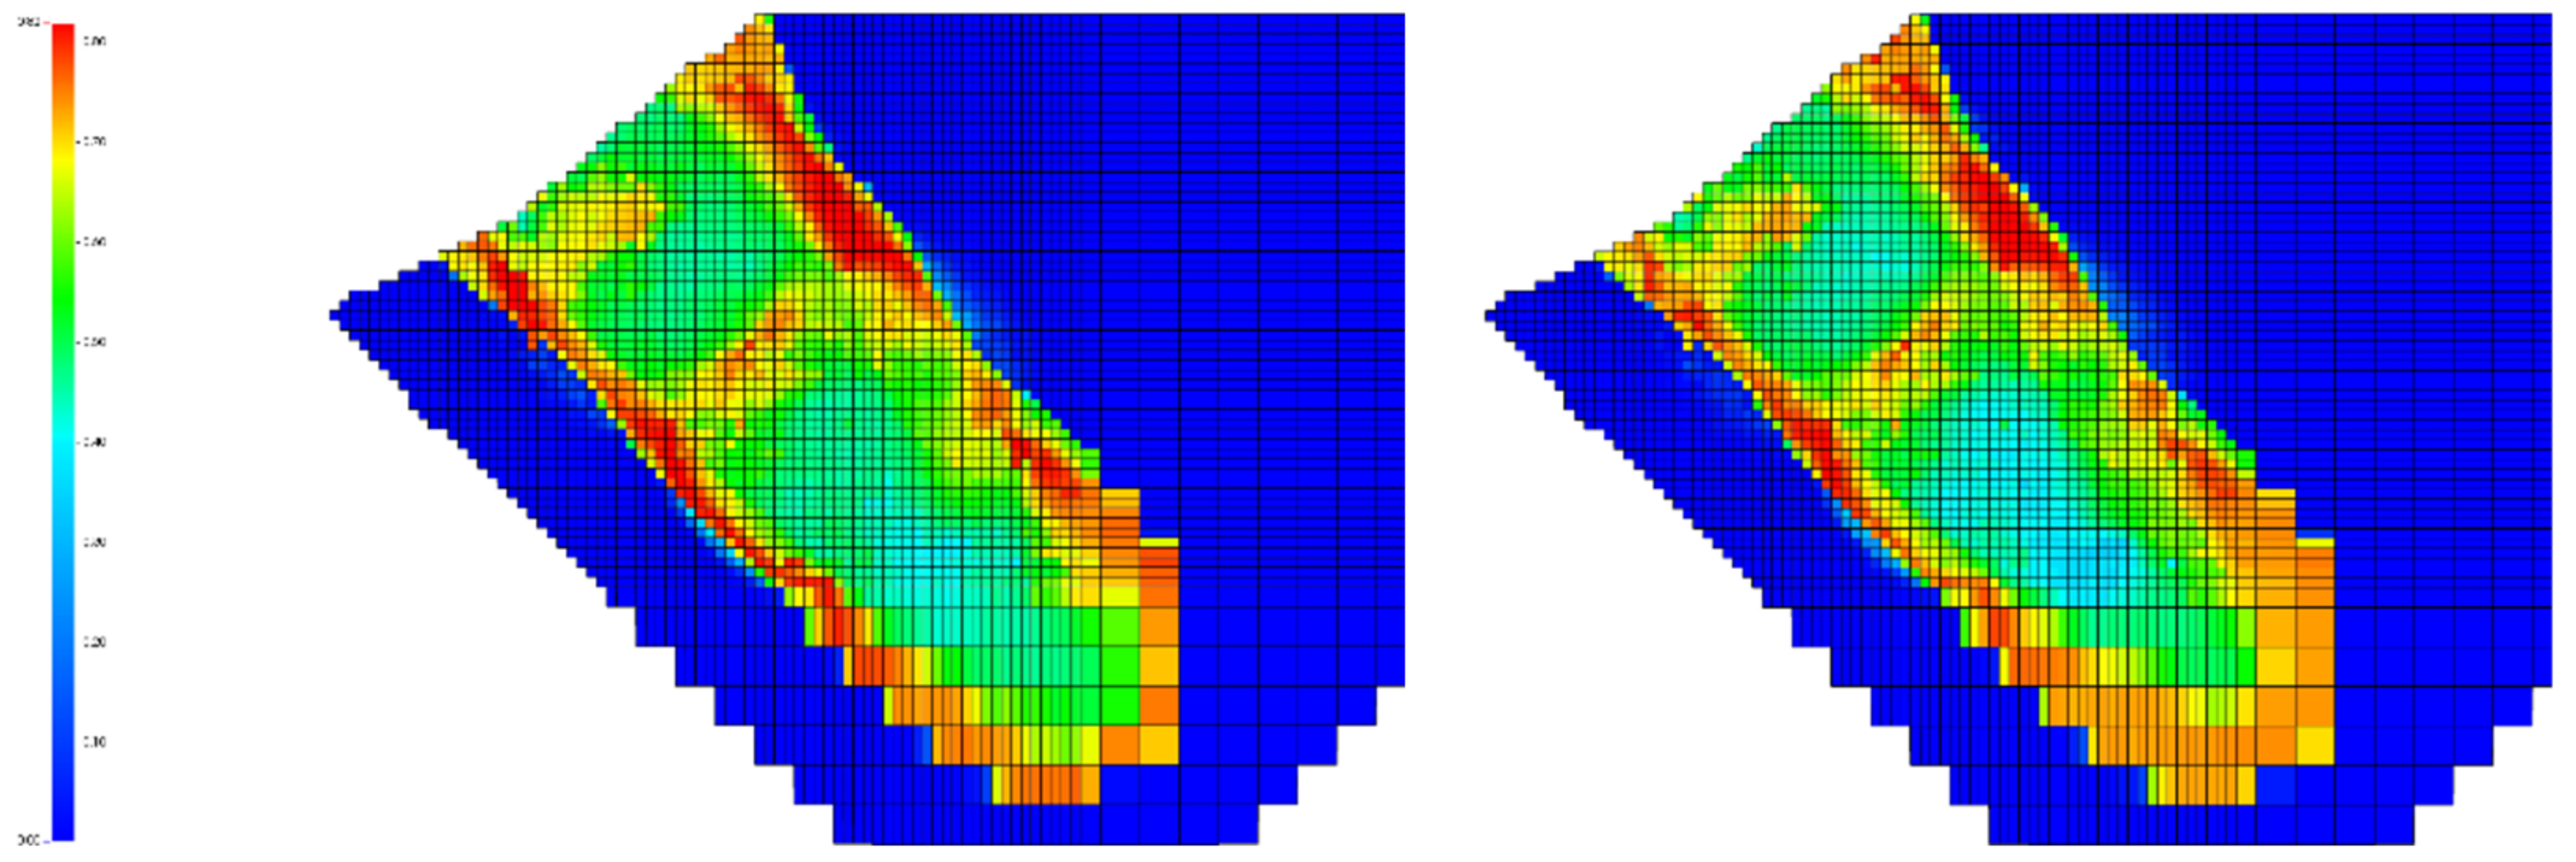
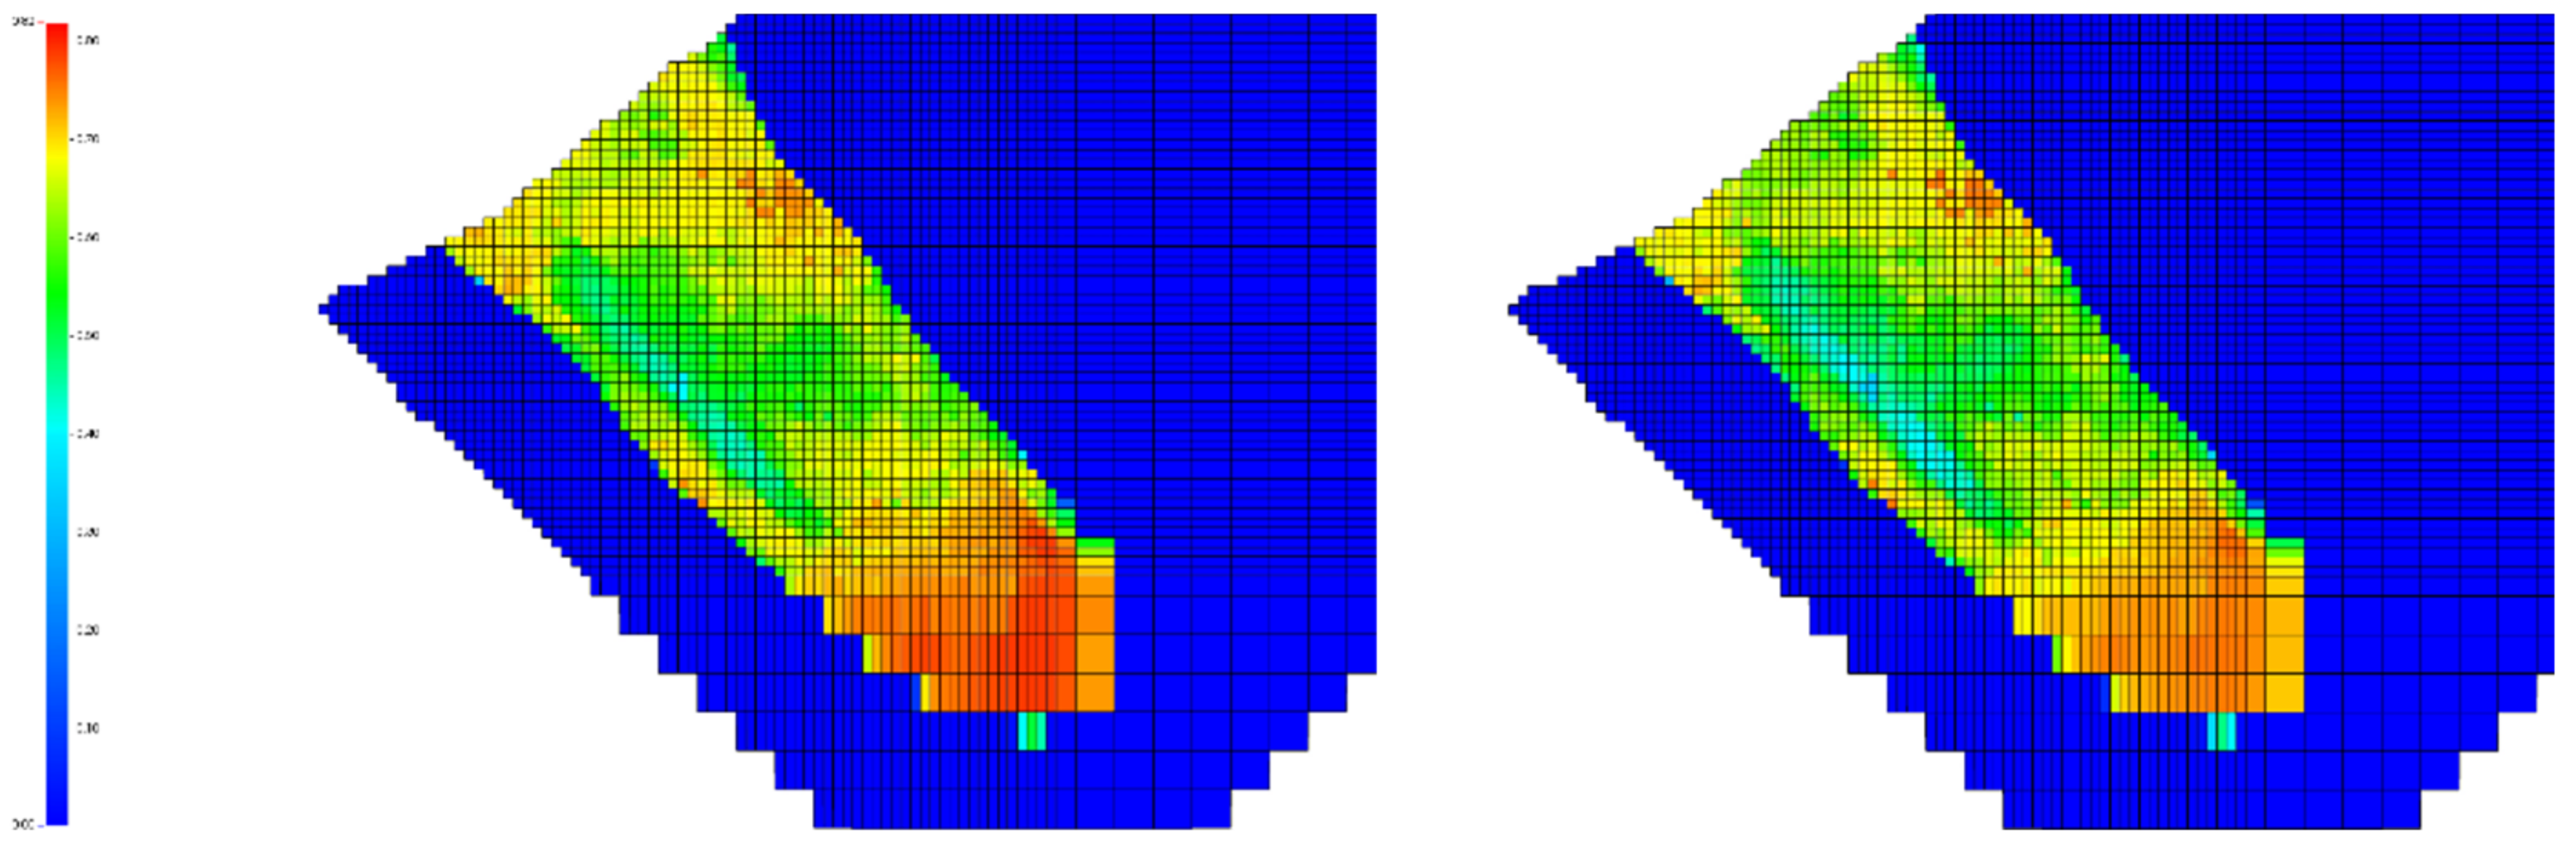
Comparing both recovery methods by applying them in a reservoir model shows that the investigated mechanisms take effect again. The WAG injection recovers more of the southeastern parts of the uppermost layer (Figure 22), whereas significant portions of the lowest layer are not effectively recovered (Figure 23). This can be explained by the gravity overriding behavior of the gas. FAWAG, on the other hand, could effectively display more oil in the lowest layer due to the reduced gas mobility, which drives the gas from the fractures into the matrix blocks (Figure 22). The reduction of the gas mobility also enables the gas to display more oil in the centers of the dual-five-spot pattern. Although it could not contact as much of the southeastern part of the reservoir as the WAG injection method, given more time, FAWAG could have recovered more hydrocarbons from that area.
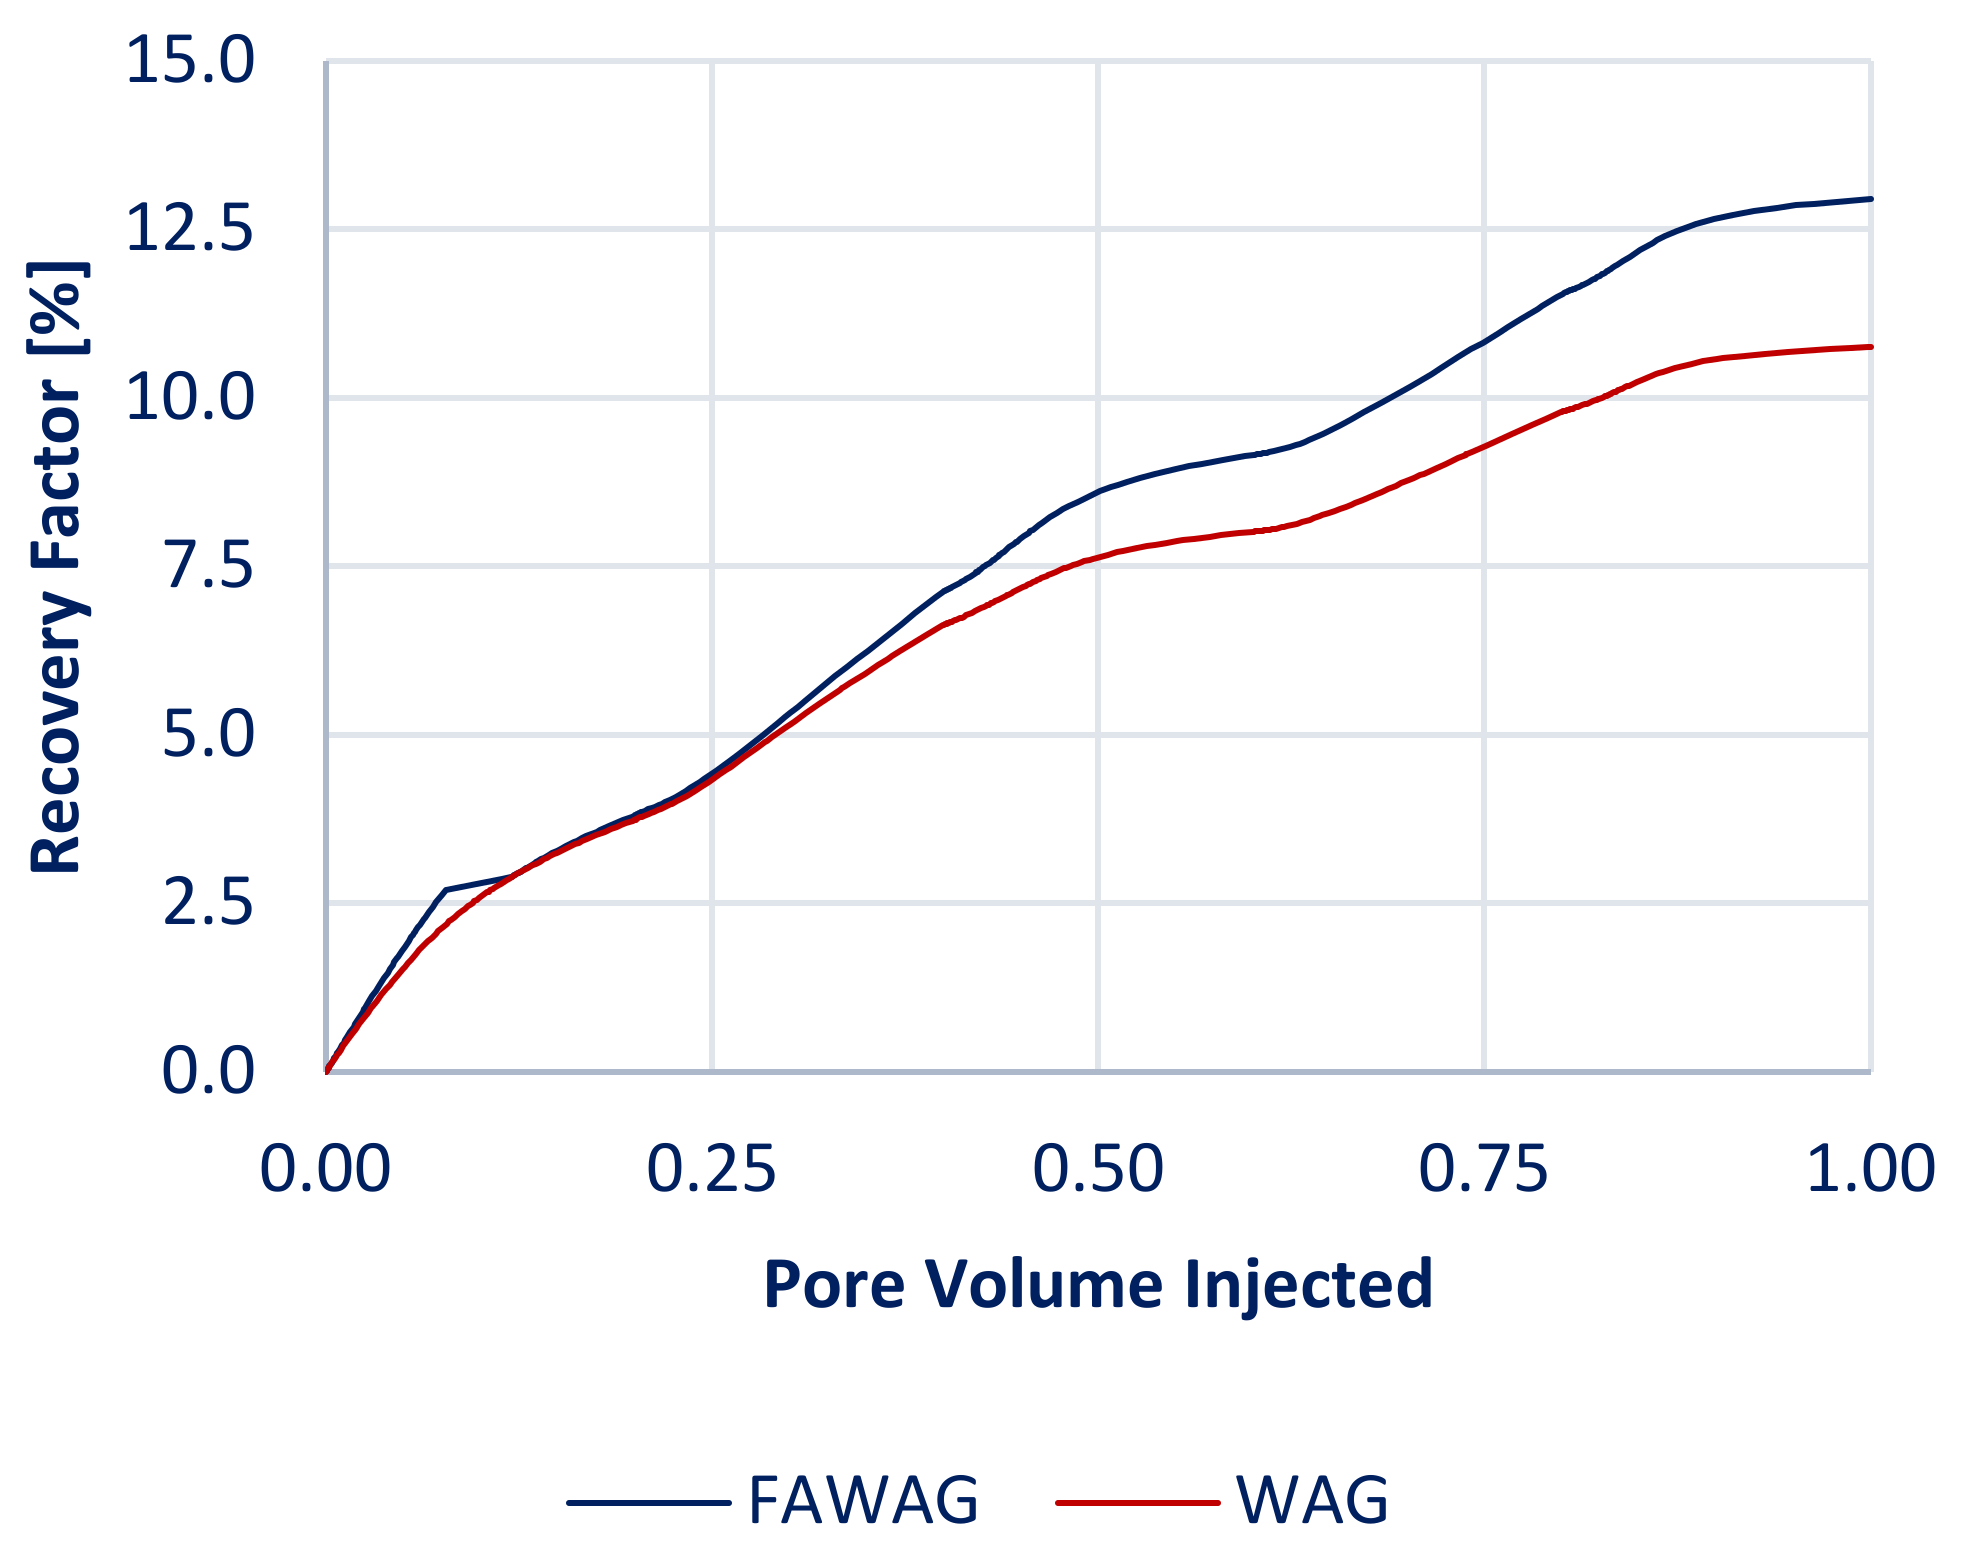
To put the recoveries into relation, FAWAG produces almost 2.5% more oil after injecting 1.0 PVI, as shown in Figure 24. Given more time, this difference can become substantially bigger. This shows that foam-assisted WAG can be an effective alternative for gas-invaded fractured reservoirs.
The foam-assisted water-alternating gas injection is a viable enhanced oil recovery method for naturally fractured carbonate reservoirs with a gas-invaded zone. In an idealized pilot model, the additional oil recovery when using FAWAG was 20% (Figure 6). Applying this method to a sector model based on actual reservoir data shows an increase of almost 2.5% (Figure 24). Further, the effective delay of the gas breakthrough is noticeable (Figure 6). By introducing surfactants to the injection water to produce foam in situ, the gas mobility is reduced tremendously. The CO2 movement along the fractures makes it visible that foam suppresses viscous fingering and that the lower portions of the reservoir are better swept. In addition, a much sharper and more highly saturated gas front is moving along the cross-section (Figure 8). The movement of foam along the matrix is rare. This is because foam has the proclivity to occupy space in the fractures and move sluggishly due to its higher apparent viscosity. This also allows the foam to impose a pressure gradient between the fractures and the matrix [28]. Thus, the injected gas is diverted into the matrix blocks.
The fracture network properties also significantly affect the recovery when using FAWAG. Oil recovery is most strongly influenced by fracture permeability (Figure 13). The sweep efficiency increases substantially, improving the recovery rate in the early stages of injection (Figure 14). The ultimate oil recovery seems to differ only by a slight margin.

9. Conclusions

In this work, the performance of gas-based EOR methods, such as WAG and FAWAG methods, were studied for a carbonated fractured reservoir based on core flooding data. The FAWAG process led to higher recovery than WAG in the gas-invaded zone based on the rock and fluid properties of the studied reservoir. FAWAG gas mobility reduction was more pronounced than WAG, where the gas front was much sharper in the FAWAG process, and gravity override by the gas was reduced. The sweep efficiency was, thus, greatly enhanced, leading to higher oil recovery. The fracture network properties also had a significant effect on the recovery. Evidently, oil recovery was most sensitive to fracture permeability. The sweep efficiency increased substantially, improving the recovery rate in the early injection stages; however, the ultimate oil recovery differed slightly. A lower fracture permeability facilitated the entry of gas into the matrix blocks.
Fracture permeability variation significantly impacted the recovery in the early stages of the FAWAG process. Fracture spacing contributed to oil recovery in a very different way. A tighter spacing allowed for more gravity drainage and better sweep in the early injection stages. Although there was an increase in oil recovery, the ultimate recovery was reduced with reduced fracture spacing, suggesting that the effect of gravity drainage eventually stops, and the matrix blocks are no longer invaded efficiently. A bigger fracture block height improves sweep efficiency by forcing more gas into the matrix blocks. This can be explained by the gas not having enough “highways” (horizontal fracture channels) connecting the injector and producer.
The reservoir sector model displayed similar results to the core and pilot. However, the key difference was that the performance was different due to the heterogeneity of the matrix and the fracture network. The WAG injection recovered more of the southeastern parts of the uppermost layer, whereas significant portions of the lowest layer were not effectively recovered. In contrast, FAWAG was more effective in the lowest layer of the reservoir.
The application of FAWAG as a late-stage recovery method in naturally fractured carbonate reservoirs featuring a bulky gas-invaded zone is a viable method for improving recovery. The mobility-decreasing quality of foam improves sweep efficiency and allows the gas to enter the matrix blocks more efficiently. This strategy can greatly enhance the recovery of fields with little oil saturation left compared to using pure water and CO2 alone. Therefore, the addition of surfactant to water is worth considering.

Author Contributions

Conceptualization, R.K.; Formal analysis, R.G.; Investigation, R.G.; Methodology, R.K. and A.S.; Software, A.S.; Supervision, R.K. and H.O.; Writing—review & editing, R.K. and H.O. All authors have read and agreed to the published version of the manuscript.

Funding

This research received no external funding.

Institutional Review Board Statement

Not applicable.

Informed Consent Statement

Not applicable.

Data Availability Statement

Not applicable.

Acknowledgments

The authors would like to acknowledge the support provided by the Computer Modeling Group (CMG).

Conflicts of Interest

The authors declare no conflict of interest.

Nomenclature

WAGWater-alternating gas (injection)
FAWAGFoam-assisted water-alternating gas (injection)
EOREnhanced oil recovery
NFRNaturally fractured reservoir
GAGDGas-assisted gravity drainage
OW/MWOil-wet/medium-wet
WWWater-wet
IFTInterfacial tension
BTBreakthrough
CCEConstant composition expansion
DLDifferential liberation
PVTPressure-volume-temperature
PVIPore volume injected
GOCGas-Oil-Contact
WOCWater-oil-contact
SCALSpecial core analysis
KPermeability
ΦPorosity
FZIFlow zone indicator

References

  1. Van Golf-Racht, T. Developments in Petroleum Science 12—Fundamentals of Fractured Reservoir Engineerin; Elsevier Scientific Publishing Company: Amsterdam, The Netherlands, 1982. [Google Scholar]
  2. Morettini, E.; Thompson, A.; Eberli, G.; Rawnsley, K.; Roeterdink, R.; Asyee, W.; Christman, P.; Cortis, A.; Foster, K.; Hitchings, V.; et al. Combining high-resolution sequence stratigraphy and mechanical stratigraphy for improved reservoir characterization in the Fahud field of Oman. GeoArabia 2005, 10, 17–44. [Google Scholar] [CrossRef]
  3. Poursamad, R.; Tabatabaei, H. Reservoir Quality Evaluation of Sarvak Formation in Gachsaran Oil Field, SW of Iran. Int. J. Res. Innov. Earth Sci. 2019, 4, 43–47. [Google Scholar]
  4. Saidi, A.M. Reservoir Engineering of Fractured Reservoirs: Fundamental and Practical Aspects; Total: Paris, France, 1987. [Google Scholar]
  5. Silva, R.; Maini, B. Evaluation of Gas Assisted Gravity Drainage GAGD in Naturally Fractured Reservoirs NFR. In Proceedings of the SPE Improved Oil Recovery Conference, Tulsa, OK, USA, 11 April 2016; SPE-179585-MS. p. 17. [Google Scholar]
  6. Wan, T.; Sheng, J.; Soliman, M.; Zhang, Y. Effect of Fracture Characteristics on Behavior of Fractured Shale-Oil Reservoirs by Cyclic Gas Injection. Soc. Pet. Eng. 2016, 19, 350–355. [Google Scholar] [CrossRef]
  7. Khormali, A.; Bahlakeh, G.; Struchkov, I.; Kazemzadeh, Y. Increasing inhibition performance of simultaneous precipitation of calcium and strontium sulfate scales using a new inhibitor—Laboratory and field application. J. Pet. Sci. Eng. 2021, 202, 108589. [Google Scholar] [CrossRef]
  8. Kharrat, R.; Zallaghi, M.; Ott, H. Performance Quantification of Enhanced Oil Recovery Methods in Fractured Reservoirs. Energies 2021, 14, 4739. [Google Scholar] [CrossRef]
  9. Heeremans, J.; Esmaiel, T.; Kruijsdijk, C.V. Feasibility Study of WAG Injection in Naturally Fractured Reservoirs. In Proceedings of the SPE/DOE Symposium on Improved Oil Recovery, Tulsa, OK, USA, 22 April 2006; SPE 100034. p. 10. [Google Scholar]
  10. Lu, J.; Ghodarzi, A.; Chen, P.; Kim, D.; Britton, C.; Delshad, M.; Mohanty, K.; Weerasooriya, U.; Pop, G. Surfactant enhanced oil recovery from naturally fractured reservoirs. In Proceedings of the SPE Annual Technical Conference and Exhibition, San Antonio, TX, USA, 8 October 2012. SPE 159979. [Google Scholar]
  11. Cheng, X.; Kleppe, J.; Torsæter, O. Simulation Study of Surfactant Imbibition Mechanisms in Naturally Fractured Reservoirs. In Proceedings of the SPE Norway One Day Seminar, Bergen, Norway, 18 April 2018; SPE-191309-MS. p. 13. [Google Scholar]
  12. SayedAkram, N.; Mamora, D. Simulation Study on Surfactant-Polymer Flood Performance in Fractured Carbonate Reservoir. In Proceedings of the SPE/DGS Saudi Arabia Section Technical Symposium and Exhibition, Al-Khobar, Saudi Arabia, 15 May 2011; SPE 149106. p. 12. [Google Scholar]
  13. Ocampo, A.; Restrepo, A.; Clavijo, J.; Mejia, J. Successful Foams EOR Field Pilot in a Naturally Fractured Reservoir by the Injection of the Foaming Agent Dispersed in the Gas Stream. In Proceedings of the SPE Improved Oil Recovery Conference, Virtual, 30 August 2020; SPE-200377-MS. p. 7. [Google Scholar]
  14. Ocampo, A.; Restrepo, A.; Lopera, S.; Mejia, J. Creation of Insitu EOR Foams by the Injection of Surfactant in Gas Dispersions—Lab Confirmation and Field Application. In Proceedings of the SPE Improved Oil Recovery Conference, Tulsa, Oklahoma, USA, 14 April 2018; SPE-190219-MS. p. 8. [Google Scholar]
  15. Valdez, A.R.; Rocha, B.M.; da Fonseca Façanha, J.M.; de Souza, A.V.; Perez-Gramatges, A.; Chapiro, G.; Santos, R.W. Foam-Assisted Water-Gas Flow Parameters: From Core-Flood Experiment to Uncertainty Quantification and Sensitivity Analysis. Transp. Porous Media 2021. [Google Scholar] [CrossRef]
  16. Computer Modelling Group Ltd. GEM 2019.10 Manual; Computer Modelling Group Ltd.: Calgary, NW, Canada, 2019. [Google Scholar]
  17. Kharrat, R.; Mahdavi, S.; Ghorbani, D. A comprehensive EOR Study of Highly Fractured Field-Case Study. In Proceedings of the EAGE Annual Conference & Exhibition incorporating SPE Europec, Copenhagen, Denmark, 4 June 2012. SPE 153311. [Google Scholar]
  18. Gandomkar, A.; Kharrat, R. The Tertiary FAWAG Process on Gas and Water Invaded Zones: An Experimental Study. Energy Sources Part A Recovery Util. Environ. Eff. 2012, 34, 1913–1922. [Google Scholar] [CrossRef]
  19. Gandomkar, A.; Kharrat, R.; Motealleh, M.; Khanamiri, H.H.; Nematzadeh, M.; Ghazanfari, M.H. An Experimental Investigation of Foam for Gas Mobility Control in a Low-Temperature Fractured Carbonate Reservoir. Pet. Sci. Technol. 2012, 30, 976–985. [Google Scholar] [CrossRef]
  20. Nematzadeh, M.; Khanamiri, H.; Aghajani, M.; Kharrat, R.; Gandomkar, A.; Motealleh, M.; Ghazanfari, M. An Experimental Study of Secondary WAG Injection in a Low-Temperature Carbonate Reservoir in Different Miscibility Conditions. Pet. Sci. Technol. 2012, 30, 1359–1368. [Google Scholar] [CrossRef]
  21. Motealleh, M.; Kharrat, R.; Gandomkar, A.; Khanamiri, H.; Nematzadeh, M.; Ghazanfari, M. An Experimental Study on the Applicability of Water-alternating-CO2 Injection in the Secondary and Tertiary Recovery in One Iranian Reservoir. Pet. Sci. Technol. 2012, 30, 2571–2581. [Google Scholar] [CrossRef]
  22. Pedersen, K.S.; Christensen, P.L.; Shaikh, J.A. Phase Behaviour of Petroleum Fluids, 2nd ed.; Taylor & Francis Group: Boca Raton, FL, USA, 2015. [Google Scholar]
  23. Jalan, S.; Karkooti, H.; Masoudi, R. Challenges in Data Integration, Design and Modeling of the Coreflood for FWAG EOR. In Proceedings of the International Petroleum Technology Conference, Kuala Lumpur, Malaysia, 10 December 2014. IPTC-17920-MS. [Google Scholar]
  24. Lake, L.W.; Johns, R.; Rossen, B.; Pop, G. Fundamentals of Enhanced Oil Recovery; SPE Pub: Richardson, TX, USA, 2017. [Google Scholar]
  25. Haugen, A.; Ferno, M.A.; Graue, A.; Bertin, H.J. Experimental Study of Foam Flow in Fractured Oil-Wet Limestone for Enhanced Oil Recovery. In Proceedings of the SPE Improved Oil Recovery Symposium, Tulsa, OK, USA, 24–28 April 2010; SPE-129763-PA. pp. 24–28. [Google Scholar]
  26. Chekani, M.; Kharrat, R. Reservoir Rock Typing in a Carbonate Reservoir-Cooperation of Core and Log Data: Case Study. In Proceedings of the SPE/EAGE Reservoir Characterization and Simulation Conference, Abu Dhabi, United Arab Emirates, 19–21 October 2009. [Google Scholar]
  27. Mousavifar, M.; Kharrat, R.; Parchizadeh, A.; Mahdavi, S. Comparison between EOR methods (Gas Injection, Water injection, and WAG Processes) in One of Iranian Fractured Oil Reservoirs. Int. J. Sci. Eng. Res. 2012, 3, 503–507. [Google Scholar]
  28. Mogensen, K.; Masalmeh, S. A review of EOR techniques for carbonate reservoirs in challenging geological settings. J. Pet. Sci. Eng. 2020, 195, 107889. [Google Scholar] [CrossRef]
Figure 1. Fracture reservoir zonation (a) Static condition (b) Dynamic condition.
Energies 15 04921 g001
Figure 2. Simulation study workflow.
Energies 15 04921 g002
Figure 3. Coreflood history match: WAG and FAWAG recovery factor.
Energies 15 04921 g003
Figure 4. Coreflood history match: WAG and FAWAG gas production.
Energies 15 04921 g004
Figure 5. Quarter five-spot pilot simulation model (porosity profile).
Energies 15 04921 g005
Figure 6. Pilot model recovery factor vs. pore volume injected.
Energies 15 04921 g006
Figure 7. Pilot model cumulative gas production vs. pore volume injected.
Energies 15 04921 g007
Figure 8. Cross-sectional model (continuously fractured) comparison of gas-phase movement for FAWAG (left) and WAG (right) displacement processes after the injection of 0.02 PV of CO2 in a model with a 40% gas invaded zone (CO2 mole fraction).
Energies 15 04921 g008
Figure 9. Fracture networks (a): 10 m × 5 m; (b): 10 m × 10 m; (c): 10 m × 2.5 m; (d): 5 m × 5 m; (e): 2 m × 5 m.
Energies 15 04921 g009
Figure 10. Cross-sectional model (fracture block height: 5 m; fracture spacing: 10 m) recovery factor vs. pore volume injected.
Energies 15 04921 g010
Figure 11. Cross-sectional model (fracture block height: 5 m; fracture spacing: 10 m) gas saturation profile after (a) 0.05; (b) 0.2; (c) 0.4 gas pore volume injected (top: FAWAG; bottom: WAG).
Energies 15 04921 g011
Figure 12. Cross-sectional model (fracture block height: 5 m; fracture spacing: 10 m) CO2 gas mole fraction after (a) 0.05; (b) 0.2; (c) 0.4 gas PVI (top: FAWAG; bottom: WAG).
Energies 15 04921 g012
Figure 13. Sensitivity analysis gas saturation profiles after 0.4 total PV (0.2 water and 0.2 gas) (fracture permeability/(a): 100 mD; (b): 500 mD; (c): 1000 mD).
Energies 15 04921 g013
Figure 14. Sensitivity analysis—fracture permeability (100 mD; 500 mD; 1000 mD) recovery factor vs. pore volume injected.
Energies 15 04921 g014
Figure 15. Sensitivity analysis gas saturation profiles after 0.4 total PV (0.2 water and 0.2 gas) (fracture block height/(a): 10 m; (b): 5 m; (c): 2.5 m).
Energies 15 04921 g015
Figure 16. Sensitivity analysis—fracture block height (2.5 m; 5 m; 10 m) recovery factor vs. pore volume injected.
Energies 15 04921 g016
Figure 17. Gas saturation profiles after 0.4 total PV (0.2 water and 0.2 gas) (fracture spacing/(a): 10 m; (b): 5 m; (c): 2 m).
Energies 15 04921 g017
Figure 18. Sensitivity analysis—fracture spacing recovery factor vs. pore volume injected.
Energies 15 04921 g018
Figure 19. The reservoir sector model and its dual-five-spot well-placement.
Energies 15 04921 g019
Figure 20. Gas (left) and oil (right) saturation after creating the gas invaded zone in layer 1.
Energies 15 04921 g020
Figure 21. Gas (left) and oil (right) saturation after creating the gas invaded zone in layer 7.
Energies 15 04921 g021
Figure 22. Oil saturation after 1 PVI of WAG (left) and FAWAG (right) in layer 1.
Energies 15 04921 g022
Figure 23. Oil saturation after 1 PVI WAG (left) and FAWAG (right) in layer 7.
Energies 15 04921 g023
Figure 24. WAG and FAWAG recovery factor—sector model.
Energies 15 04921 g024
Table 1. Core properties, experimental parameters, water, and oil properties.
Core Properties
Length [cm]Diameter [cm]Pore Volume [cm3]Porosity [%]Permeability [mD]Swc [%]
11.43.8116.5512.730.319.3
Experimental Parameters
WAG Ratio/CyclesGas Rate [cm3/min]Water Rate [cm3/min]Pressure [psi]
1:1/100.220.281700
Water Properties
WaterDensity [kg/m3]Compressibility [1/bar]Reference pressure [psi]Viscosity [cP]
Laboratory989.7474.35 × 10−614.70.5822
Sector10942.3519 × 10−624500.854
Oil Properties
GOR [m3/m3]Temperature [°C]Initial Pressure [psi]Saturation Pressure [psi]Density [°API]Viscosity [cP]
44.4546.11
laboratory
50.00
sector
24501600430.82
Table 2. Oil and gas composition.
Component[mol%]Component[mol%]
H2S0.005IC40.467
CO29.621NC40.695
C126.459IC50.627
C22.628NC52.475
C310.83C6+46.937
M.W. of C6+199 [kg/kg·mol]S.G. of C6+0.8181
Table 3. Properties of the homogeneous model.
PropertyMatrixFracture
permeability8.169 mD500 mD
porosity23.8%5%
Publisher’s Note: MDPI stays neutral with regard to jurisdictional claims in published maps and institutional affiliations.

