Abstract
With the rising popularity of unmanned aerial vehicles (UAVs) and increasing variety of their applications, the task of providing reliable and robust control systems becomes significant. An active fault-tolerant control (FTC) scheme requires an effective fault detection and isolation (FDI) algorithm to provide information about the fault’s occurrence and its location. This work aims to present a prototype of a diagnostic system intended to recognize and identify broken blades of rotary wing UAVs. The solution is based on an analysis of acoustic emission recorded with an onboard microphone array paired with a lightweight yet powerful single-board computer. The standalone hardware of the FDI system was utilized to collect a wide and publicly available dataset of recordings in real-world experiments. The detection algorithm itself is a data-driven approach that makes use of an artificial neural network to classify characteristic features of acoustic signals. Fault signature is based on Mel Frequency Spectrum Coefficients. Furthermore, in the paper an extensive evaluation of the model’s parameters was performed. As a result, a highly accurate fault classifier was developed. The best models allow not only a detection of fault occurrence, but thanks to multichannel data provided with a microphone array, the location of the impaired rotor is reported, as well.
1. Introduction
1.1. Background
The increasing number and variety of applications of unmanned aerial vehicles raise the question of operational safety and reliability [1,2]. Few recent studies have pointed out the key causes of drone accidents in flight, with actuator faults being one of the major issues, both in military and commercial UAVs [3,4]. This challenge is often addressed with fault-tolerant control systems, which provide minimal performance for the aerial vehicle in the occurrence of faults [5]. FTC strategies are typically divided into two categories. Passive approaches aim to provide robustness of control algorithms and utilize hardware redundancy. On the other hand, active systems are based on the fault detection algorithm and real-time adjustment of the control laws [6]. The fault diagnosis stage itself is frequently divided into the basic detection of the fault followed by its isolation, which is defined as the determination of the exact location of the faulty component [7]. It is believed that precise fault detection and isolation systems, as crucial components of FTC control schemes, will significantly increase the safety of operating UAVs and, as a result, accelerate their introduction to practical applications [8].
1.2. Research Motivation
In this article, a new approach to the problem addressed in a couple of our previous works [9,10] is presented. The main focus was placed on the problem of efficient fault detection and isolation of damaged propellers of multirotor UAV. The initial approaches were based on the analysis of airframe vibrations thanks to data obtained with microelectromechanical (MEMS) accelerometers. These methods have proven to be efficient, with classification accuracy exceeding 96%. First, there is still room for improvement in terms of detection accuracy itself. Additionally, our solutions lacked precision in locating faulty rotors, especially in a situation where more than one blade was damaged. Finally, the method based on a sensory network required quite serious interference with the structure and equipment of the drone. Conducting experiments with vibration data led to the observation of clearly audible differences in the sound of healthy and damaged rotors. It leads to the concept of utilizing acoustic emission as a source of information about the propellers’ condition.
1.3. Literature Review
The topic of FDI schemes designed to detect UAV actuator faults is covered in quite a few recent papers. The first category of approaches to this diagnostic problem utilizes model-based fault diagnosis with sophisticated methods to evaluate model residuals and conclude on the fault’s occurrence. Notable examples are articles published by Cen et al. that comprise a series of developments, from initial proof of concept to practical implementation [11,12,13]. Their method is based on a nonlinear observer which was later boosted with adaptive mechanisms and implemented in real-time application on multirotor UAV. However, the study addresses only the consequence of the rotor’s impairment, since the analyzed type of fault is a simulated loss of effectiveness (LoE) in thrust generation. Some other papers follow the same approach with various methods of model-based fault estimation algorithms and following control strategies [14,15]. It is worth mentioning that the literature considers other types of UAV actuator faults, including stuck control signal [16] or multiple fault class scenarios. An example is an article describing the method that enabled the detection of wear of rotor shaft bearings, LoE and increases in winding resistance at the same time [17].
The problem of detecting physical damage to drone rotors is frequently solved thanks to data-driven FDI methods. They are based on statistical modeling and classification algorithms with sensory data used as a source of information. Some solutions are based on analysis of system states, such as attitude, angular rate and values of control signals. A notable example [18] that allows detection of a significantly damaged rotor is based on an artificial recurrent neural network (RNN) with long short-term memory architecture (LSTM) and provides a fault detection accuracy of approximately 92%. However, the majority of papers focus on two types of raw sensor signals: vibrations and acoustic emission. Among the first category, a few articles present methods based on characteristic features of vibration signals obtained with on-board inertial measurement units (IMUs). The work of Pourpanah et al. shows that such an approach, boosted with motor current measurements, can improve the accuracy of fault detection by more than 94% [19]. In another example, the success rate of fault classification is even higher at the cost of long (over 10 s in most cases) analysis time. It is worth mentioning that our previous works fall into this category as well.
Only a couple of papers describe FDI systems based on the analysis of acoustic emission. A notable example is the work of Gino et al. [20], with outstanding fault detection accuracy that exceeds 98%. However, the experiments were performed with a stationary, ground-fixed drone and an external high-class microphone. In addition, the detected fault was an imbalance of the rotor, which, as the authors assumed, was comparable to an actual partial loss of the blade. The results show a high potential for acoustic waves as a source of information on the occurrence of faults. In another article, a similar neural-based algorithm with physically impaired rotors and data collected in a real flight scenario resulted in only 92% of fault detection accuracy [21]. A paper written by Altinors et al. [22] considers even a wider set of fault conditions, including broken rotor blade, bearing failure and eccentric shaft faults. The algorithm presented was based on one-second-long sound samples collected with external recording equipment placed in the vicinity of faulty motors. Several different classification algorithms have proven to be very accurate in classifying fault signatures based on statistical features of audio signals. This is yet another work showing the potential of using acoustic emission in data-driven FDI systems for UAV actuators.
1.4. Main Contribution
We consider that acoustic-based FDI for UAV rotors proves to be a very promising field, both in terms of improving accuracy and the possibility of practical implementation. However, to the best of our knowledge, no method has been developed that would include the isolation of a faulty rotor. In addition, all of the existing works were carried out with external audio recording systems and very limited coverage of different flight scenarios. We consider that the acoustic emission of the hovering drone is significantly different from that of intensive maneuvers during which the rotors’ angular velocity varies more significantly. A number of papers show great potential in audio signals as a source of information on the fault occurrence and its properties. However, no experiments were performed using the signals recorded on board in close proximity to the rotors. The accuracy of data-driven FDI based on such data remains unclear. Therefore, we share an extensive dataset of audio recordings collected in different flight phases with multiple fault classes related to the location of a broken propeller. The data were collected with our custom-built onboard microphone array subsystem. Finally, the algorithm presented in this article shows the practical application of a highly accurate FDI system based on the mentioned dataset with an onboard acoustic data acquisition and processing system.
1.5. Study Outline
The following parts of this paper are composed as follows: the next section describes some major technical details of our work. It includes specific aspects of the Falcon V5 UAV used in experiments and the custom hardware setup for the acquisition and processing of audio signals. In addition, some initial observations and conclusions about the effects of operating broken UAV rotors are also presented. The third section provides a broad description of our fault detection and isolation algorithm, with consecutive steps of signal processing and feature classification explained. The fourth part of the article presents an acoustic dataset with multiple fault types and shows the results of the experimental evaluation. The final section summarizes the paper with some conclusions and future improvement plans.
2. Analyzed Uav System
2.1. Rotor Impairments
Partial destruction of the rotor leads to a series of consequences. At first, there are some practical implications of operating the UAV with such a fault. To show these negative effects, a short series of experiments was carried out using a stationary propulsion test stand [23]. The rig allows measuring thrust, power consumption and angular velocity of various motor–rotor setups. Three exemplary types of rotors were used, one in brand new condition and two that were diversely damaged. Figure 1 shows the blades used in stationary tests, with (H) a healthy rotor, one with a damaged edge (E) and several ones with fractured tips (F), as well as the general structure of the test stand.
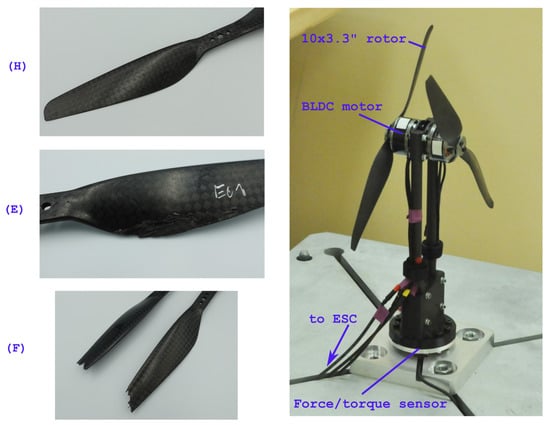
Figure 1.
Samples of rotors used in fault detection experiments and overview of the propulsion test rig.
A BrushLess Direct Current (BLDC) motor, rotor and Electronic Speed Controller (ESC) used in the experiments were identical to those mounted on our Falcon V5 UAV, which was later used for validation experiments. Multiple series of test runs were carried out with a full range of control signal applied and the results were averaged for every rotor. The performance graphs are shown in Figure 2. The measured values were the total thrust generated by the rotor and the power efficiency , expressed as the amount of thrust in relation to a single watt of electrical power.
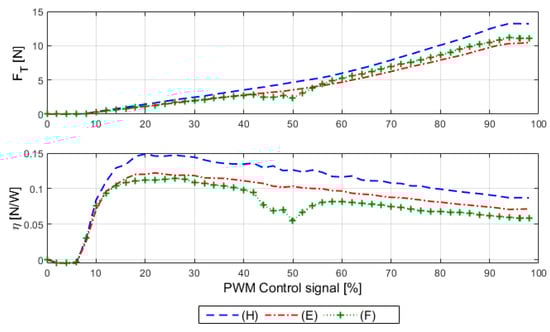
Figure 2.
Performance comparison of faulty and undamaged rotors: thrust of a single motor–rotor unit (top) and achieved power efficiency (bottom).
Stationary analysis of faulty propulsion shows that even slight damage to the rotor blades results in an observable loss in the thrust produced. The power efficiency drops significantly as well, therefore reducing flight time and payload capabilities of the UAV. In addition, during those test runs that utilized faulty units, a vibration resonance was observed. It confirms state-of-the-art knowledge on the effects of the broken and, as a result, the imbalanbced rotor [24,25]. In the case of undamaged blades, the mass distribution is symmetric around the motor shaft, which is the pivot point. After the fracture, it becomes irregular and the centrifugal forces induced by rotating blades no longer compensate. The resultant force leads to observable vibrations. In our previous works, this phenomenon was measured directly with MEMS accelerometers and used as a basis for fault diagnosis. In the presented solution, we utilize sound waves as derivatives of vibrations themselves. We consider several possible advantages of this new data source. Initially, some additional audio signal features that come from the aerodynamic effects of the broken rotor blade may increase the accuracy of the FDI system. Furthermore, microphones provide a much wider frequency coverage compared to inertial data.
2.2. Falcon V5 Uav
The Falcon V5 UAV was used to collect the acoustic recording dataset. It is a custom-built aerial research platform based on the so-called X8 quadrotor configuration and our custom-built avionics system. The vehicle provides high lift capabilities, a flight time of about 8 min and numerous data and power interfaces for attaching additional equipment used in experiments. An overview of the drone is presented in Figure 3.
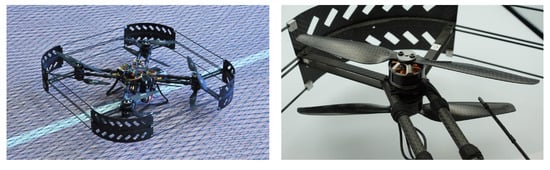
Figure 3.
The Falcon V5 UAV used for FDI experiments and a detailed view of the coaxial propulsion unit.
The main chassis of the UAV is designed as a four-arm cross with coaxial propulsion units at each end. The span of opposite rotors is equal to 450 mm with a vehicle mass of 2300 g. Eight MN3110 electric BLDC motors allow up to 65 N of total thrust to be produced within compact external dimensions of the UAV, as small as 610 × 610 mm. Each propulsion unit consists of two vertically aligned motors with 10 × 3.3 rotors. This design has been shown to be redundant in hardware and safer to operate in the event of partial or complete rotor loss [26], which greatly benefited us during numerous flight tests in faulty scenarios.
2.3. Acoustic Diagnostic System
In order to capture in-flight acoustic signals, a prototype of a data acquisition and processing system was developed. The aim was to utilize easily available off-the-shelf components to shorten preparations for experiments and provide a proof-of-concept solution that precedes the development of a dedicated embedded subsystem. Our setup is based on a single-board computer (SBC) Raspberry Pi 3B+ and a dedicated microphone array module. The latter component is Respeaker 4-mic Array (https://respeaker.io/4_mic_array/, accessed on 28 April 2022), a printed circuit initially designed for IoT (Internet of Things) solutions and dedicated to create voice-enabled applications in particular. The stack of RaspberryPi SBC and ReSpeaker “hat” is shown in Figure 4.
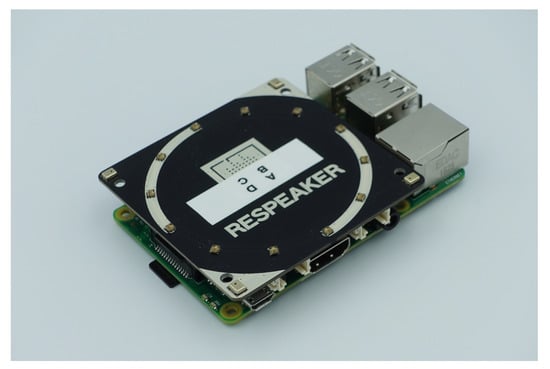
Figure 4.
The stack of Raspberry Pi 3B+ SBC and microphone array module.
The key components of the ReSpeaker microphone array are four MSM321A3729H9BP top-port miniature microphones manufactured in MEMS technology. They are located in every corner of the rectangular printed circuit board, which in our intention will allow one to locate the faulty rotor. Since these components are equipped with an analog output, the ReSpeaker module consists of a dedicated AC108 analog-to-digital converter (ADC). The ADC provides four independent channels of acquisition, a programmable gain block and a output bus. The maximum sampling rate for all four microphones reaches up to 48 kSps. Some important parameters of the MSM321A3729H9BP microphone are presented in Table 1.

Table 1.
Selected properties of the MSM321A3729H9BP microphone.
It is worth mentioning that although the performance of the array is quite mediocre in comparison to high-end components of this class and significantly lower in comparison to full-scale regular microphones, such a low-cost system provided us with satisfactory results. However, one of the key parameters in our consideration was the acoustic overload point (AOP) of the microphones, which is commonly defined as a level of sound pressure at which the total harmonic distortion (THD) factor exceeds 10%. The importance of AOP is crucial since the array is located in the direct vicinity of loud rotors. Some of the other MEMS microphone-based devices tested did not satisfy our needs, as the recorded sound was distorted beyond the level that would enable accurate fault detection.
The ready-to-flight experimental setup consisting of Falcon drone, SBC and microphone array is depicted in Figure 5. Custom 3D-printed brackets were prepared to fix the ReSpeaker module above the main avionics of the UAV.
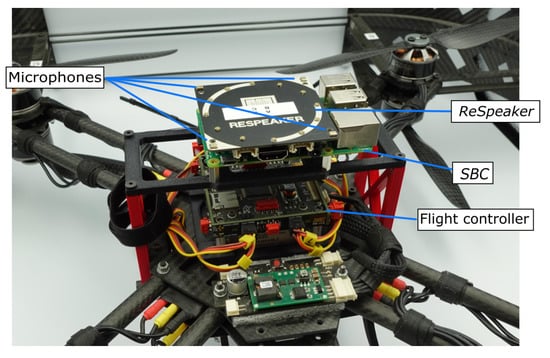
Figure 5.
Experimental setup to acquire acoustic data.
Custom software was developed for a Linux-based Rapsberry Pi computer. The set of Python programming language scripts was written based on the official driver for the ReSpeaker microphone array. Combined with built-in Wi-Fi connectivity and remote access mechanism such as SSH, the data acquisition system allows convenient experiments in flight. In addition, the quite considerable computing power of SBC enables the implementation of not only data acquisition, but also further signal processing and fault classification algorithms.
3. Proposed Method
Our approach to the stated FDI problem utilizes data-driven fault detection that takes advantage of a machine learning-based fault classifier with multichannel acoustic signal features as the model input. The following section describes the processing pipeline in a sequential manner, from raw acoustic data to the FDI system output indicating detected fault class.
3.1. Signal Processing
An algorithm is based on short chunks of the acoustic signal acquired with the UAV onboard microphone array. The length of the signal acquisition period is a factor that affects the classification performance, since longer chunks contain more information and provide the classifier with better-quality data.
At first, the raw acoustic signal is multiplied by a window function. The process is applied to all four channels of the audio file concurrently since the fault classifier is processing the data from all of the microphones combined. A Kaiser windowing function was used in presented analysis.
Afterward, the Mel Frequency Cepstrum Coefficients (MFCCs) are extracted independently for every audio channel. MFCC-based signal features are applied primarily and quite broadly in speech recognition systems [27]. However, they have also been used in numerous applications in the field of condition monitoring and fault detection as well [28,29]. The main idea behind the MFCC technique is first to convert every signal frame into a magnitude spectrum by applying a Fast Fourier Transform (FFT). Afterward, the obtained spectrum is passed through a set of triangle-shaped band-pass filters known as the Mel filter bank. The number of filters in the bank, annotated as , is an adjustable variable. The name “mel” corresponds to a unit of measure with variable spacing that is more natural to the frequency perceived by the human ear. In the next step, the logarithm is applied to filter bank outputs and finally, the discrete cosine transform of the resultant signal is taken to obtain MFCCs. In our algorithm, 104 cepstral coefficients are extracted from each channel. As a result, the fault classifier is provided with a 425-element input vector, consisting of MFCCs from 4 microphones and 9 labels of considered fault classes. The process of pre-processing acoustic signals in the FDI system is summarized in Figure 6.
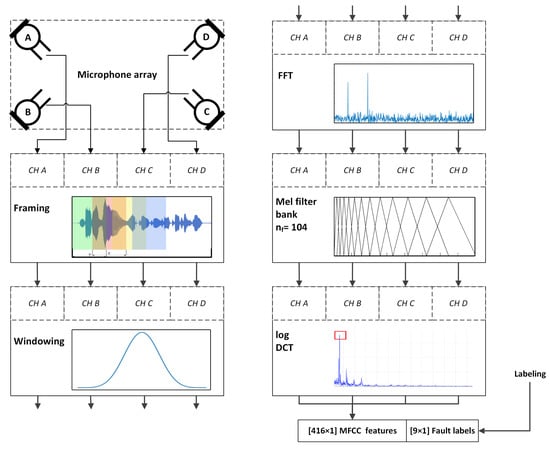
Figure 6.
Summary of the pretraining signal processing steps.
3.2. Fault Classification
Several models were developed for the fault classification task and two of them were chosen for further evaluation as the most promising ones. The first classifier is based on the LSTM artificial neural network (ANN) architecture. This kind of ANN falls into the category of recurrent neural networks with the great advantage of being able to overcome a vanishing gradient problem. LSTM-based models are commonly used in a variety of tasks that involve speech and acoustic recognition algorithms [30]. Such networks have been shown to be very efficient in time series prediction and keeping track of long-term dependencies [31]. In recent years, they have received widespread attention in the fields of fault diagnosis and condition monitoring, with a particularly high number of applications in the data-driven diagnosis of rotating machinery [32,33].
The LSTM-based network is more computationally demanding than the regular RNN because of the more complicated structure of a single cell of the LSTM network. An LSTM unit consists of a cell, an input gate, an output gate and a forget gate. The cell stores values over some arbitrary time intervals and the gates control the flow of data from subsequent iterations. This ensures that the output is affected by data from any range without gradient fading. Our model consists of one LSTM layer and two fully connected layers. The latter serves as an output layer to return the probability of the occurrence of a predefined fault type. The network outputs 9 such values, of which the first 8 are meant for combinations of two fault types at four different rotor locations (please refer to Table 2 for details about considered fault classes). The last output reports whether all the rotors are in healthy condition. The structure of the described ANN is shown in Figure 7.
Table 2.
Summary of flight experiments conducted and the quantities of data for every fault class considered.
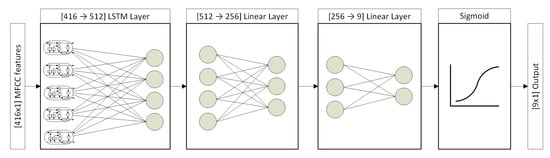
Figure 7.
Structure of the LSTM-based fault classifier.
The second classifier developed in our solution is based on convolutional ANN (CNN). Applications of this architecture proliferated mainly in the field of image processing. However, many successful attempts at machine diagnosis have been made [34,35]. A distinguishing feature of CNNs is that in the process of training, the parameters of neuron-shared filters are affected, instead of training weights that connect each neuron of one layer with each neuron of the next layer. This approach significantly reduces the memory size of the network. In each layer, a certain number of kernels move every stride along the input vector, creating representations that serve as inputs to subsequent layers.
A model consisting of six convolutional layers and one fully connected output layer was used to solve the rotor fault detection problem. The first convolutional layer has four channels, which corresponds to the data from the four-channel microphone array collected during the study. A ReLu activation function is used along with batch normalization to regularize inputs and prevent overfitting. The second layer has 64 channels, and each subsequent layer doubles the number of channels. The last convolutional layer reduces the number of channels down to 1 in order to link it to a fully connected output layer, whose input size depends on the number of convolutional layers and the size of the kernel. In our case, it has 9 outputs that serve as fault indicators in a manner similar to the previously presented LSTM-based classifier. Figure 8 shows a graphical representation of the structure of the CNN fault classifier.
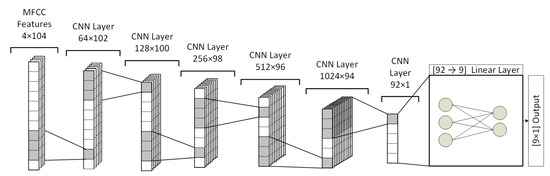
Figure 8.
Structure of CNN-based fault classifier.
4. Experimental Evaluation
4.1. Acoustic Dataset
In order to train and validate the presented fault classifiers, a series of flight experiments was carried out. The idea behind them was to collect acoustic data in flight in different scenarios with variable locations and types of faulty rotors. There were 36 flights in total and during each one of them, 200 to 240 s of 4-channel audio data were recorded. The rotors were switched in between the experiments, with variable location, type and number of damaged blades placed in the system. The sampling rate of sound signals is equal to 44,100 Hz. Recordings made during flights with damaged rotors were shorter due to the increased power consumption of the propulsion system. The methodology of the conducted experiments is shown in Figure 9.
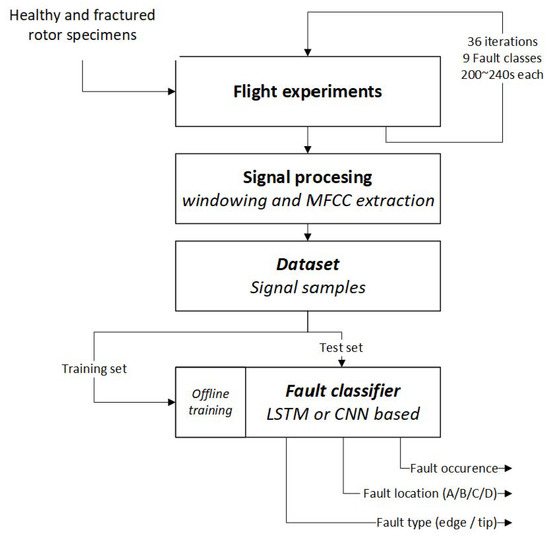
Figure 9.
Process of gathering samples of acoustic dataset and evaluating FDI method.
During every experiment, the UAV trajectory included a mix of hovering, ascending, descending and translational motions. The tests were carried out indoors inside the sports hall with dimensions of about 20 × 10 × 5 m. Three main categories of experiment scenarios were considered: flights with all-healthy rotors, the occurrence of a single damaged propeller and UAV equipped with two impaired rotors at the same time. In the latter variant, some of the tests were performed with two adjacent rotors damaged and the others with faults in opposite actuators. Figure 10 shows the flight variants performed.
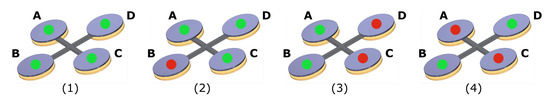
Figure 10.
Types of fault scenarios considered in experiments: (1) no faults, (2) single damaged rotor, (3) dual fault, adjacent, (4) dual fault, opposite actuators.
Multiple specimens of damaged rotors were used and healthy–damaged combinations were chosen in a way that provides all fault classes with a similar and sufficient amount of data for training the intelligent classifier. In the analysis, two types of blade impairment are considered: the fractured rotor tip and distorted edge, just as the initial examples analyzed with the stationary test stand. The structure and fault classes included in the dataset are summarized in Table 2.
The signal frames used in processing were extracted from audio files using variable window length and overlap, thus boosting the number of samples to several thousand for every model training process. In Figure 11, some selected samples of raw audio signals are shown. They are taken from the recordings of all-healthy flight (a) and the scenario with a single damaged propeller present in the system (b,c). Sample (b) was recorded with the microphone located opposite to the fault location, while frame (c) was acquired with the sensor located in the closest vicinity of the faulty rotor. Next to the raw signals, a power spectral density estimate is plotted to show differences in the frequency content of the recorded sounds.
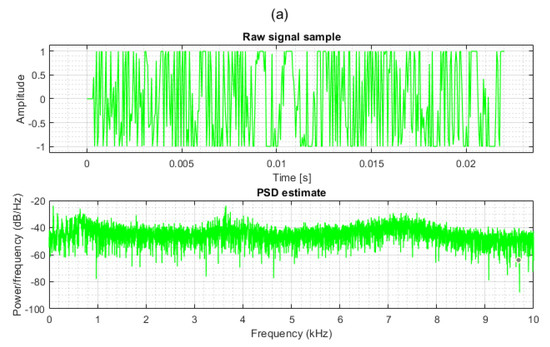
Figure 11.
Samples of recorded audio signals along with their PSD estimates: (a) all rotors healthy, (b) single damaged rotor, opposite microphone, (c) single damaged rotor, closest microphone.
In further analysis, the dataset was split into training, validation and testing sets. Signals from different flights were used in each of the three subsets to avoid overfitting the models. It is worth mentioning that to reduce data bias, the whole dataset was not always used for training and validation. However, since we aim to share the data publicly, all of the recordings are included, since some approaches may utilize different parts of the dataset. Refer to the Data Availability section at the end of the article for more details on access to the dataset.
4.2. Classification Results
The developed fault classifiers were put through the evaluation process to determine the impact of certain parameters of the signal processing and classification pipeline on the final efficiency. A set of conventional performance metrics was used to compare different models with accuracy, precision, recall and F-score among them. The two best classifiers mentioned in the previous section were considered as a reference point and several of their parameters were evaluated to show the capabilities of the proposed FDI scheme.
4.2.1. LSTM-Based Fault Classifier
At first, the lightweight LSTM model was evaluated with regard to the impact of layer sizes. The smallest ANN considered used 64 LSTM cells and 32 neurons in a linear layer. From this point on, the size of the network doubled at every step, to the point where no substantial improvement in performance metrics was observed. Table 3 summarizes the change in classifier efficiency due to the increase in the size of the layers.
Table 3.
Evaluation of the LSTM-based fault classifier.
The fourth model was selected for further analysis since no further performance improvement was observed. It is noticeable that even the smallest network provided satisfactory results. However, a low precision score meant that a higher proportion of false positives was reported. Therefore, models based on smaller ANNs provided a higher rate of false alarms. The hyperparameters of the selected classifier are summarized in Table 4.
Table 4.
Parameters of the selected LSTM-based fault classifier.
For the selected model, a final classification test was performed with a 7900-element subset of data derived from separate sound recordings. The confusion matrices for every fault class considered are shown in Table 5.
Table 5.
Confusion matrices for the LSTM-based fault classifier.
The results of the classification test show that although some fault classes are predicted with more false negatives and positives, the differences are relatively small in comparison with the correct predictions. Both types of faults are clearly distinguishable from each other.
4.2.2. CNN-Based Model
The second fault classifier was evaluated first on the basis of the internal parameters of the network. Different counts of convolutional layers, two kernel sizes and a variable number of filters were considered. The results are summarized in Table 6.
Table 6.
Evaluation of CNN-based fault classifier.
Performance metrics increase along with the number of convolutional layers and filters. Enlarging the kernel size increases accuracy with a small number of filters. However, it is the latter parameter that affects the memory footprint of the model most significantly. The best results were obtained with the highlighted model and therefore it was the subject of final testing. The global parameters of the selected classifier are summarized in Table 7.
Table 7.
Parameters of the best developed CNN-based fault classifier.
Detailed confusion matrices of the best CNN model are presented in Table 8.
Table 8.
Confusion matrices for CNN-based fault classifier.
Both fault detectors yield satisfactory results, with the main performance metrics scoring more than 97%. In either case, accuracy was the highest value, since it was a main metric used in the training process. Slightly better results were achieved with the LSTM-based model with regard to precision and recall. However, the differences are small enough to consider both approaches equally successful. On the other hand, the convolutional network is much more complicated with a larger number of layers and individual neurons. Therefore, some additional validation steps were performed.
4.2.3. Computation Time
Both models were tested for computational demands. The code was run using a PC workstation equipped with AMD Ryzen 9 3950X CPU, 128 GB DDR3 RAM and supported with an Nvidia RTX 2070 graphics card. Execution time of the signal processing stage, model training and single sample classification were gathered. The results are summarized in Table 9.
Table 9.
Execution time for feature extraction, training and classification steps.
As suspected, the time of fault signature classification for a single signal frame with four channels and 204 cepstral coefficients each is significantly higher in the case of a more sophisticated CNN-based model. Training of the latter classifier has a shorter duration. However, it is not a problematic issue since our plans for further development assume deploying an already pretrained classifier to an onboard embedded system. Another noteworthy fact is the relation of processing time in consecutive steps of the processing pipeline. The classification stage that consumes a fraction of a millisecond contributes to a small extent to the time elapsed from a fault’s occurrence to detection, since MFCC extraction consumes around 3 ms and the time of signal acquisition for considered models equals half of a second. However, we expect that the target implementation of signal processing on a low-power SBC will result in considerably longer computation. Therefore, substantial effort was put into optimizing the fault classifier.
4.2.4. Signal Frame Length
Since signal acquisition time contributes to the highest degree to a full FDI process, additional validation of the LSTM model was performed with shorter bursts of audio data. The main aim was to investigate how far the signal frame can be reduced with satisfactory performance metrics maintained. The results of the analysis are summarized in Table 10.
Table 10.
Effects of the length of the signal frame on the performance of the LSTM-based fault classifier.
It is clearly seen that buffer lengths below 200 ms result in a significant drop in performance, with precision and recall falling rapidly in the first place. Acquisition time is directly related to the spectral resolution of FFT as a part of the MFCC extraction process. With a constant sampling frequency, frame length becomes the only factor that affects the process. Therefore, with longer data frames, it is possible to observe and extract more detailed patterns. The results are consistent with our previous works [9,10], where similar lengths of vibration signals proved to be sufficient.
4.2.5. Number of Cepstral Coefficients
The last step of validation was to analyze the performance of the selected LSTM-based fault classifier due to the size of an input vector. Several quantities of MFCCs extracted for every channel were selected and performance metrics were computed. Table 11 shows the results with a similar outcome to the frame length validation. Since the number of mel filters controls how many frequencies are clustered into one cepstrum, a smaller number of MFCCs results in less detailed signal features. Some key fault frequencies might contribute to a smaller number of more generalized values and, as a result, be ignored by the model. However, the performance of fault classification decreases with the number of coefficients doubled in relation to the reference model. We suspect that such a phenomenon occurs due to the size of the ANN layers being insufficient for the 4 × 208 input vector.
Table 11.
Performance of the LSTM fault classifier with different numbers of cepstral coefficients extracted for every audio channel.
5. Conclusions
In the article, the development of a comprehensive, data-driven FDI method for multirotor UAV rotor faults is presented. An algorithm is aimed towards early detection of damaged rotor faults, which lead to degraded flight stabilization, decrease safety of the UAV operation and increase power consumption of the power train. An intelligent fault classification algorithm is based on the MFCC-based features extracted from the four-channel audio signal. The data were recorded in real-life flight experiments using a custom-built onboard microphone array subsystem. Various rotor impairments and their locations were considered with flights that included single- and double-damaged rotors in different combinations. The dataset was split into individual audio frames and MFCCs were extracted as input for the ANN-based fault classifiers. Two main approaches were tested, with convolutional and LSTM-based neural networks validated. Both variants provided satisfactory results, with the prediction accuracy and the F1 metric exceeding 98%. However, the LSTM-based model is more lightweight and consumes less computing time. Therefore, it was selected for further evaluation with the goal of decreasing fault detection and isolation time. The final analysis has shown that the longest step of the process, signal acquisition, can be further shortened with a slight drop in performance. As a result, the presented FDI algorithm based on 200 ms long signal samples achieved an accuracy exceeding 98%. The proposed method is able to accurately detect broken rotor blade faults with an additional ability to precisely predict which propulsion unit is damaged. Furthermore, both evaluated classification methods correctly distinguished between two types of impairment—fractured tip and damaged edge of the blade.
Our further development plans include real-time implementation of the fault classification algorithm on the low-power onboard SBC. Therefore, the method was tested with a decreased number of cepstral coefficients since the MFCC extraction step introduces the largest amount of computational load. Furthermore, many possible improvements to the FDI system are considered, such as training the classifier to recognize different actuator-related faults. Some initial analysis of the audio data suggests that the statistical and spectral features of the signals may allow the proposed FDI system to recognize motor-related bearing faults. Other possible improvements include extending the dataset with experiments carried out using different UAVs and combining features of vibration and acoustic signals to boost the FDI capabilities.
Author Contributions
Conceptualization, A.B. and W.G.; methodology, A.B., R.K. and M.K.; software, R.K. and M.K.; validation, A.B., M.K. and R.K.; resources, A.B., M.K. and R.K.; data curation, M.K. and R.K.; writing—original draft preparation, A.B; writing—review and editing, W.G. and A.B.; supervision, W.G. All authors have read and agreed to the published version of the manuscript.
Funding
This research was funded by Poznan University of Technology grant number 0214/SBAD/0237.
Institutional Review Board Statement
Not applicable.
Informed Consent Statement
Not applicable.
Data Availability Statement
The datasets gathered and analyzed during the current study are available at https://chmura.put.poznan.pl/s/tu52v0Dlx4hfmfO (accessed on 23 May 2022). The data are shared under CC-BY-NC 4.0 license.
Conflicts of Interest
The authors declare no conflict of interest.
Abbreviations
The following abbreviations are used in this manuscript:
| ADC | Analog-to-Digital Converter |
| ANN | Artificial Neural Network |
| AOP | Acoustic Overload Point |
| BLDC | Brushless Direct Current |
| CNN | Convolutional Neural Network |
| ESC | Electronic Speed Controller |
| FDI | Fault Detection and Isolation |
| FFT | Fast Fourier Transform |
| FTC | Fault-Tolerant Control |
| Inter-IC Sound | |
| IMU | Inertial Measurement Unit |
| LoE | Loss of Effectiveness |
| LSTM | Long Short-Term Memory |
| MEMS | Micro-electro-mechanical Systems |
| MFCC | Mel Frequency Cepstral Coefficients |
| RNN | Recurrent Neural Network |
| SBC | Single-Board Computer |
| SNR | Signal-to-Noise Ratio |
| SSH | Secure Shell |
| THD | Total Harmonic Distortion |
| UAV | Unmanned Aerial Vehicle |
References
- Stöcker, C.; Bennett, R.; Nex, F.; Gerke, M.; Zevenbergen, J. Review of the Current State of UAV Regulations. Remote. Sens. 2017, 9, 459. [Google Scholar] [CrossRef] [Green Version]
- Zhai, Q.; Ye, Z.S. How reliable should military UAVs be? IISE Trans. 2020, 52, 1234–1245. [Google Scholar] [CrossRef]
- Wild, G.; Murray, J.; Baxter, G. Exploring Civil Drone Accidents and Incidents to Help Prevent Potential Air Disasters. Aerospace 2016, 3, 22. [Google Scholar] [CrossRef] [Green Version]
- Susini, A. A Technocritical Review of Drones Crash Risk Probabilistic Consequences and its Societal Acceptance. In Proceedings of the RIMMA 2014 Berlin, Risk Information Management, Risk Models and Applications Conference, Berlin, Germany, 28–30 October 2015. [Google Scholar]
- Witczak, M.; Pazera, M. Fault tolerant-control: Solutions and challenges. Pomiary Autom. Robot. 2016, 20, 5–16. [Google Scholar] [CrossRef]
- Simani, S.; Fantuzzi, C.; Patton, R.J. Model-based fault diagnosis techniques. In Model-Based Fault Diagnosis in Dynamic Systems Using Identification Techniques; Springer: London, UK, 2003; pp. 19–60. [Google Scholar]
- Fekih, A. Fault diagnosis and Fault Tolerant Control design for aerospace systems: A bibliographical review. In Proceedings of the 2014 American Control Conference, Portland, OR, USA, 4–6 June 2014; pp. 1286–1291. [Google Scholar]
- Fourlas, G.K.; Karras, G.C. A Survey on Fault Diagnosis and Fault-Tolerant Control Methods for Unmanned Aerial Vehicles. Machines 2021, 9, 197. [Google Scholar] [CrossRef]
- Bondyra, A.; Gasior, P.; Gardecki, S.; Kasiński, A. Fault diagnosis and condition monitoring of UAV rotor using signal processing. In Proceedings of the 2017 Signal Processing: Algorithms, Architectures, Arrangements, and Applications (SPA), Poznan, Poland, 22–24 September 2017; pp. 233–238. [Google Scholar]
- Bondyra, A.; Gasior, P.; Gardecki, S.; Kasinski, A.J. Development of the Sensory Network for the Vibration-based Fault Detection and Isolation in the Multirotor UAV Propulsion System. In Proceedings of the 15th International Conference on Informatics in Control, Automation and Robotics, ICINCO, Porto, Portugal, 29–31 July 2018; pp. 112–119. [Google Scholar]
- Cen, Z.; Noura, H.; Younes, Y.A. Robust Fault Estimation on a real quadrotor UAV using optimized Adaptive Thau Observer. In Proceedings of the 2013 International Conference on Unmanned Aircraft Systems (ICUAS), Atlanta, Georgia, 28–31 May 2013; pp. 550–556. [Google Scholar]
- Cen, Z.; Noura, H. An Adaptive Thau Observer for estimating the time-varying LOE fault of quadrotor actuators. In Proceedings of the 2013 Conference on Control and Fault-Tolerant Systems (SysTol), Nice, France, 9–11 October 2013; pp. 468–473. [Google Scholar]
- Cen, Z.; Noura, H.; Susilo, T.B.; Younes, Y.A. Engineering implementation on fault diagnosis for quadrotors based on nonlinear observer. In Proceedings of the 2013 25th Chinese Control and Decision Conference (CCDC), Guiyang, China, 25–27 May 2013; pp. 2971–2975. [Google Scholar]
- Sharifi, F.; Mirzaei, M.; Gordon, B.W.; Zhang, Y. Fault tolerant control of a quadrotor UAV using sliding mode control. In Proceedings of the 2010 Conference on Control and Fault-Tolerant Systems (SysTol), Nice, France, 6–8 October 2010; pp. 239–244. [Google Scholar]
- Moghadam, M.; Caliskan, F. Actuator and sensor fault detection and diagnosis of quadrotor based on Two-Stage Kalman Filter. In Proceedings of the 2015 5th Australian Control Conference (AUCC), Gold Coast, Australia, 5–6 November 2015; pp. 182–187. [Google Scholar]
- Freddi, A.; Longhi, S.; Monteriù, A. Actuator fault detection system for a mini-quadrotor. In Proceedings of the 2010 IEEE International Symposium on Industrial Electronics, Bari, Italy, 4–7 July 2010; pp. 2055–2060. [Google Scholar]
- Cândido, A.S.; Harrop Galvão, R.K.; Yoneyama, T. Actuator fault diagnosis and control of a quadrotor. In Proceedings of the 2014 12th IEEE International Conference on Industrial Informatics (INDIN), Porto Alegre, Brazil, 27–30 July 2014; pp. 310–315. [Google Scholar]
- Fu, J.; Sun, C.; Yu, Z.; Liu, L. A hybrid CNN-LSTM model based actuator fault diagnosis for six-rotor UAVs. In Proceedings of the 2019 Chinese Control And Decision Conference (CCDC), Nanchang, China, 3–5 June 2019; IEEE: Piscataway, NJ, USA, 2019; pp. 410–414. [Google Scholar]
- Pourpanah, F.; Zhang, B.; Ma, R.; Hao, Q. Anomaly Detection and Condition Monitoring of UAV Motors and Propellers. In Proceedings of the 2018 IEEE SENSORS, Seoul, Korea, 12–14 March 2018; pp. 1–4. [Google Scholar]
- Iannace, G.; Ciaburro, G.; Trematerra, A. Fault Diagnosis for UAV Blades Using Artificial Neural Network. Robotics 2019, 8, 59. [Google Scholar] [CrossRef] [Green Version]
- Liu, W.; Chen, Z.; Zheng, M. An Audio-Based Fault Diagnosis Method for Quadrotors Using Convolutional Neural Network and Transfer Learning. In Proceedings of the 2020 American Control Conference (ACC), New Orleans, LA, USA, 1–3 July 2020; pp. 1367–1372. [Google Scholar]
- Altinors, A.; Yol, F.; Yaman, O. A sound based method for fault detection with statistical feature extraction in UAV motors. Appl. Acoust. 2021, 183, 108325. [Google Scholar] [CrossRef]
- Aszkowski, P.; Błoszyk, K.; Bondyra, A.; Gąsior, P.; Giernacki, W. UAV propulsion analysis system with reconfigurable controller feature. Meas. Autom. Monit. 2017, 63, 171–173. [Google Scholar]
- Ou, L.; Li, D.; Li, J. Shaft center orbit diagnoses technology of broken-blade propeller induced shaft vibration fault. In Proceedings of the 2013 International Conference on Quality, Reliability, Risk, Maintenance, and Safety Engineering (QR2MSE), Chengdu, China, 15–18 July 2013; pp. 1777–1780. [Google Scholar]
- Fries, J. The Effect of Helicopter Main Rotor Blade Damage on the Rotor Disk (Whole Rotor) Motion; Technical Report; U.S. Army Research Lab: Aberdeen, MD, USA, 2000. [Google Scholar]
- Peng, C.; Bai, Y.; Gong, X.; Gao, Q.; Zhao, C.; Tian, Y. Modeling and robust backstepping sliding mode control with Adaptive RBFNN for a novel coaxial eight-rotor UAV. IEEE/CAA J. Autom. Sin. 2015, 2, 56–64. [Google Scholar]
- Gupta, D.; Bansal, P.; Choudhary, K. The state of the art of feature extraction techniques in speech recognition. Speech Lang. Process. Hum.-Mach. Commun. 2018, 664, 195–207. [Google Scholar]
- Marwala, T. Data processing techniques for condition monitoring. Cond. Monit. Using Comput. Intell. Methods 2012, 27–51. [Google Scholar]
- Shaikh, K.B.T.; Jawarkar, N.P.; Ahmed, V. Machine diagnosis using acoustic analysis: A review. In Proceedings of the 2021 IEEE Conference on Norbert Wiener in the 21st Century (21CW), Melbourne, Australia, 13–16 July 2021; pp. 1–6. [Google Scholar]
- Yu, Y.; Si, X.; Hu, C.; Zhang, J. A Review of Recurrent Neural Networks: LSTM Cells and Network Architectures. Neural Comput. 2019, 31, 1235–1270. [Google Scholar] [CrossRef] [PubMed]
- Smagulova, K.; James, A.P. A survey on LSTM memristive neural network architectures and applications. Eur. Phys. J. Spec. Top. 2019, 228, 2313–2324. [Google Scholar] [CrossRef]
- Lindemann, B.; Maschler, B.; Sahlab, N.; Weyrich, M. A survey on anomaly detection for technical systems using LSTM networks. Comput. Ind. 2021, 131, 103498. [Google Scholar] [CrossRef]
- Jalayer, M.; Orsenigo, C.; Vercellis, C. Fault detection and diagnosis for rotating machinery: A model based on convolutional LSTM, Fast Fourier and continuous wavelet transforms. Comput. Ind. 2021, 125, 103378. [Google Scholar] [CrossRef]
- Zhang, T.; Dai, J. Mechanical Fault Diagnosis Methods Based on Convolutional Neural Network: A Review. J. Phys. Conf. Ser. 2021, 1750, 012048. [Google Scholar] [CrossRef]
- Neupane, D.; Seok, J. Bearing fault detection and diagnosis using case western reserve university dataset with deep learning approaches: A review. IEEE Access 2020, 8, 93155–93178. [Google Scholar] [CrossRef]
Publisher’s Note: MDPI stays neutral with regard to jurisdictional claims in published maps and institutional affiliations. |
© 2022 by the authors. Licensee MDPI, Basel, Switzerland. This article is an open access article distributed under the terms and conditions of the Creative Commons Attribution (CC BY) license (https://creativecommons.org/licenses/by/4.0/).