Communication

Uncovering Hidden Factors in Electricity Consumption Based on Gaussian Mixture Estimation

1
Department of Electrical and Computer Engineering, University of Michigan-Dearborn, Dearborn, MI 48128, USA
2
Department of Computer Science, Texas Tech University, Lubbock, TX 79409, USA
*
Author to whom correspondence should be addressed.
Energies 2022, 15(1), 319; https://doi.org/10.3390/en15010319
Submission received: 9 September 2021 / Revised: 18 December 2021 / Accepted: 28 December 2021 / Published: 4 January 2022
(This article belongs to the Special Issue Planning and Operation of Microgrids)

Abstract

:
Load characteristics play an essential role in the planning of power generation and distribution. Various undiscovered factors, which could be socioeconomic, geographic, or climatic, make it possible to describe the electricity demand by a multimodal distribution. This letter proposes a novel method based on multimodal distributions to characterize the hidden factors in electricity consumption. Consequently, a new approach is developed to evaluate the impact of the underlying factors of electricity consumption. Some quantifiable and predictable factors are analyzed in developing multimodal distribution to describe the expected demand. Simulations based on synthetic and real-world data have been conducted to demonstrate the usefulness and robustness of the proposed method.

1. Introduction

Characterizing and forecasting load demand have been challenging issues due to the dependency of load demand on a large number of hidden factors. Detailed study of electricity consumption involves knowledge of the trends and seasonality that can be exploited to extrapolate the demand characteristics [1]. Major factors driving electricity consumption include economic activities, meteorology, and human activity patterns. The impact of economic activities and meteorology on electricity demand is long term and large scale. Periodic temperature conversion (e.g., it is warmer in the summer than in the winter) and cyclical human activity patterns influence electricity demand in the short term [2]. Thus, understanding electricity demand patterns is crucial in planning and managing the type, size, and timing of supply needs [3]. For example, changes in demand levels and real-time prices will affect the value of storage capacity [4]. Statistical methods characterize the inherent similarities in historical electricity data and classify residential loads into several typical load patterns. The Gaussian mixture model (GMM) is a popular method that is used to extract the typical load patterns [5]. In [6], a multi-stage probabilistic method is proposed to estimate the monthly and hourly PV generation sequentially by GMM and maximum likelihood estimation (MLE).
The study described in this work has been partially motivated by results [7] showing that certain socioeconomic and meteorological factors are able to characterize electricity consumption patterns. As a natural next step, we propose a framework that helps to uncover hidden factors in electricity demand data as well as to evaluate the impact of these factors on electricity consumption. In particular, a multi-dimensional data set is constructed by fusing the electricity demand data with other socioeconomic or meteorological data sets. Since real-world electricity consumption data are multimodally distributed [7], we then use a Gaussian mixture to obtain an estimated electricity consumption model. Based on the Gaussian mixture model (GMM), genetic algorithms (GA) are consequently employed to uncover and evaluate the hidden factors. Experiments on synthetic data and real-world data are also conducted to show the usefulness of the proposed method in uncovering the hidden factor in electricity demand data. The proposed method is innovative and intuitive; its contributions can be summarized as follows:
  • A GMM-based residential load characterization method is proposed, which efficiently assesses the hidden factors in the residential load from real-world and synthesized data set.
  • A new metric, mixture error, is proposed, which is able to handle the uncertainty in the residential load.
  • The proposed method considers various specific properties of the multidimensional load data.
The results indicate that the proposed method is able to uncover various hidden factors and, at the same time, accurately characterize the load demand pattern. The rest of the paper is organized as follows. The proposed method of this study is presented in Section 2. Experiments on synthetic and real-life data are described in Section 3. Conclusions are drawn in Section 4.

2. Proposed Method

2.1. Multimodal Distribution and Mixing Error

A multimodla distribution is a probablity distribution with multiple modes that displays distinct peaks in the probability function. Power data naturally appear as a multimodal distribution due to the cyclic patterns of meteorological rotation and human activity [1]. Namely, electricity demand data can be estimated by the Gaussian mixture model, which can be stated as Equation (1) below.
f ( x ) = i K w i N μ i , σ i
where N μ i , σ i denotes the i- t h component characterized by normal distributions with means μ i and covariance σ i , and w i is the corresponding mixing parameter satisfying i K w i = 1 .
Here, we use an index S, defined in Equation (2), to quantify the separation of such a bimodal distribution [8]. Specificity, for a normal distribution, bimodality occurs for certain mixture proportions if, and only if, the separation index S is greater than 3.2237.
S = μ 1 μ 2 2 σ 1 + σ 2 .
In addition, a mixture error matrix E is defined as pair-wise intersection between components in Equation (3) below to measure the multimodality of the fitted distribution.
E = ϵ 11 ϵ 12 ϵ 1 K ϵ 21 ϵ 22 ϵ 2 K ϵ K 1 ϵ K 2 ϵ K K .
The pair-wise intersection can be compute according to Equation (4) below.
ϵ i j = ϵ j i = m i n w i p i ( x ) , w j p j ( x ) d x ,
where p i ( x ) is the component of the multimodal distribution in (1), and w i is the corresponding mixture proportion. Additionally, the intersect point x c i j can be obtained through w i p i ( x c i j ) = w j p j ( x c i j ) , which is the point where two components intersect. The parameter ϵ can be used to describe the mixing error that occurs when the tail of one component intersects the other component when forming a mixture distribution. This concept can be extended to any multimodal distributions besides Gaussian mixtures.

2.2. Multi-Dimensional Load Profile

In order to study the impact of hidden factors on electricity demand, a multi-dimensional data set needs to be constructed. The multi-dimensional data must include the electricity demand and at least one hidden factor data set, e.g., socioeconomic or meteorological data. For example, a daily load demand and the corresponding daily temperature can be constructed as three-dimensional vectors and expressed as P , T , t R 3 , where the three axis represent load demand P, temperature T, and time t, respectively. This concept can be extended to other applications that utilize information from multiple domains.

2.3. Uncover the Hidden Factors

As discussed in Section 1, the load demand is statistically characterized as bimodal distributions [7]. With the availability of multi-dimensional electricity load data, we now propose a strategy to characterize the hidden factors in an electricity load profile. Firstly, the GMM is employed to estimate the probability density function (PDF) of the load demand, f ( x ) = w i p i ( x ) , i = 1 , 2 , , m , where x R k is a multi-dimensional variable, p i ( x ) N ( μ i , σ i ) is the mixture component, and w = w 1 , w 2 , , w m is the mixing parameter. We then compute the original mixing error ϵ 0 of f 0 ( x , w ) . Secondly, based on the number of GMM components m, the multi-dimensional data set E is divided into m subsets E i | E i E , i = 1 , 2 , , m . The data volume in each subset is proportional to the corresponding mixing parameter V E i w i . We now employ Gaussian distribution to estimate the corresponding PDFs p ^ i of subsets E i . Thirdly, p ^ i is re-mixed to form a new GMM f ^ ( x , w ) . If the new mixing error ϵ ^ is greater than ϵ 0 , we re-split the original data set to obtain a new GMM and mixing error. Eventually, we aim to find a proper grouping scheme of E that has the minimal mixing error ϵ ^ ϵ 0 and the critical point x ^ c . In order to improve the efficiency of the algorithm and ensure reliable results, a genetic algorithm is employed to handle the data set splitting process. The details of the proposed method are summarized in Algorithm 1.    
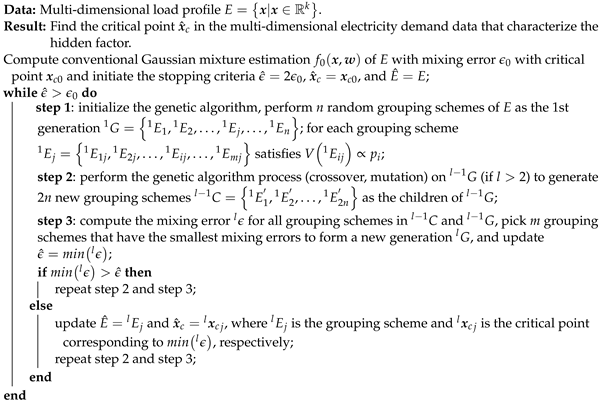
Algorithm 1: Uncovering hidden factor from multi-dimensional load profile.
Energies 15 00319 i001

3. Case Studies

In this section, two case studies of both synthetic and real-life scenarios are conducted to demonstrate the performance of the proposed approach.

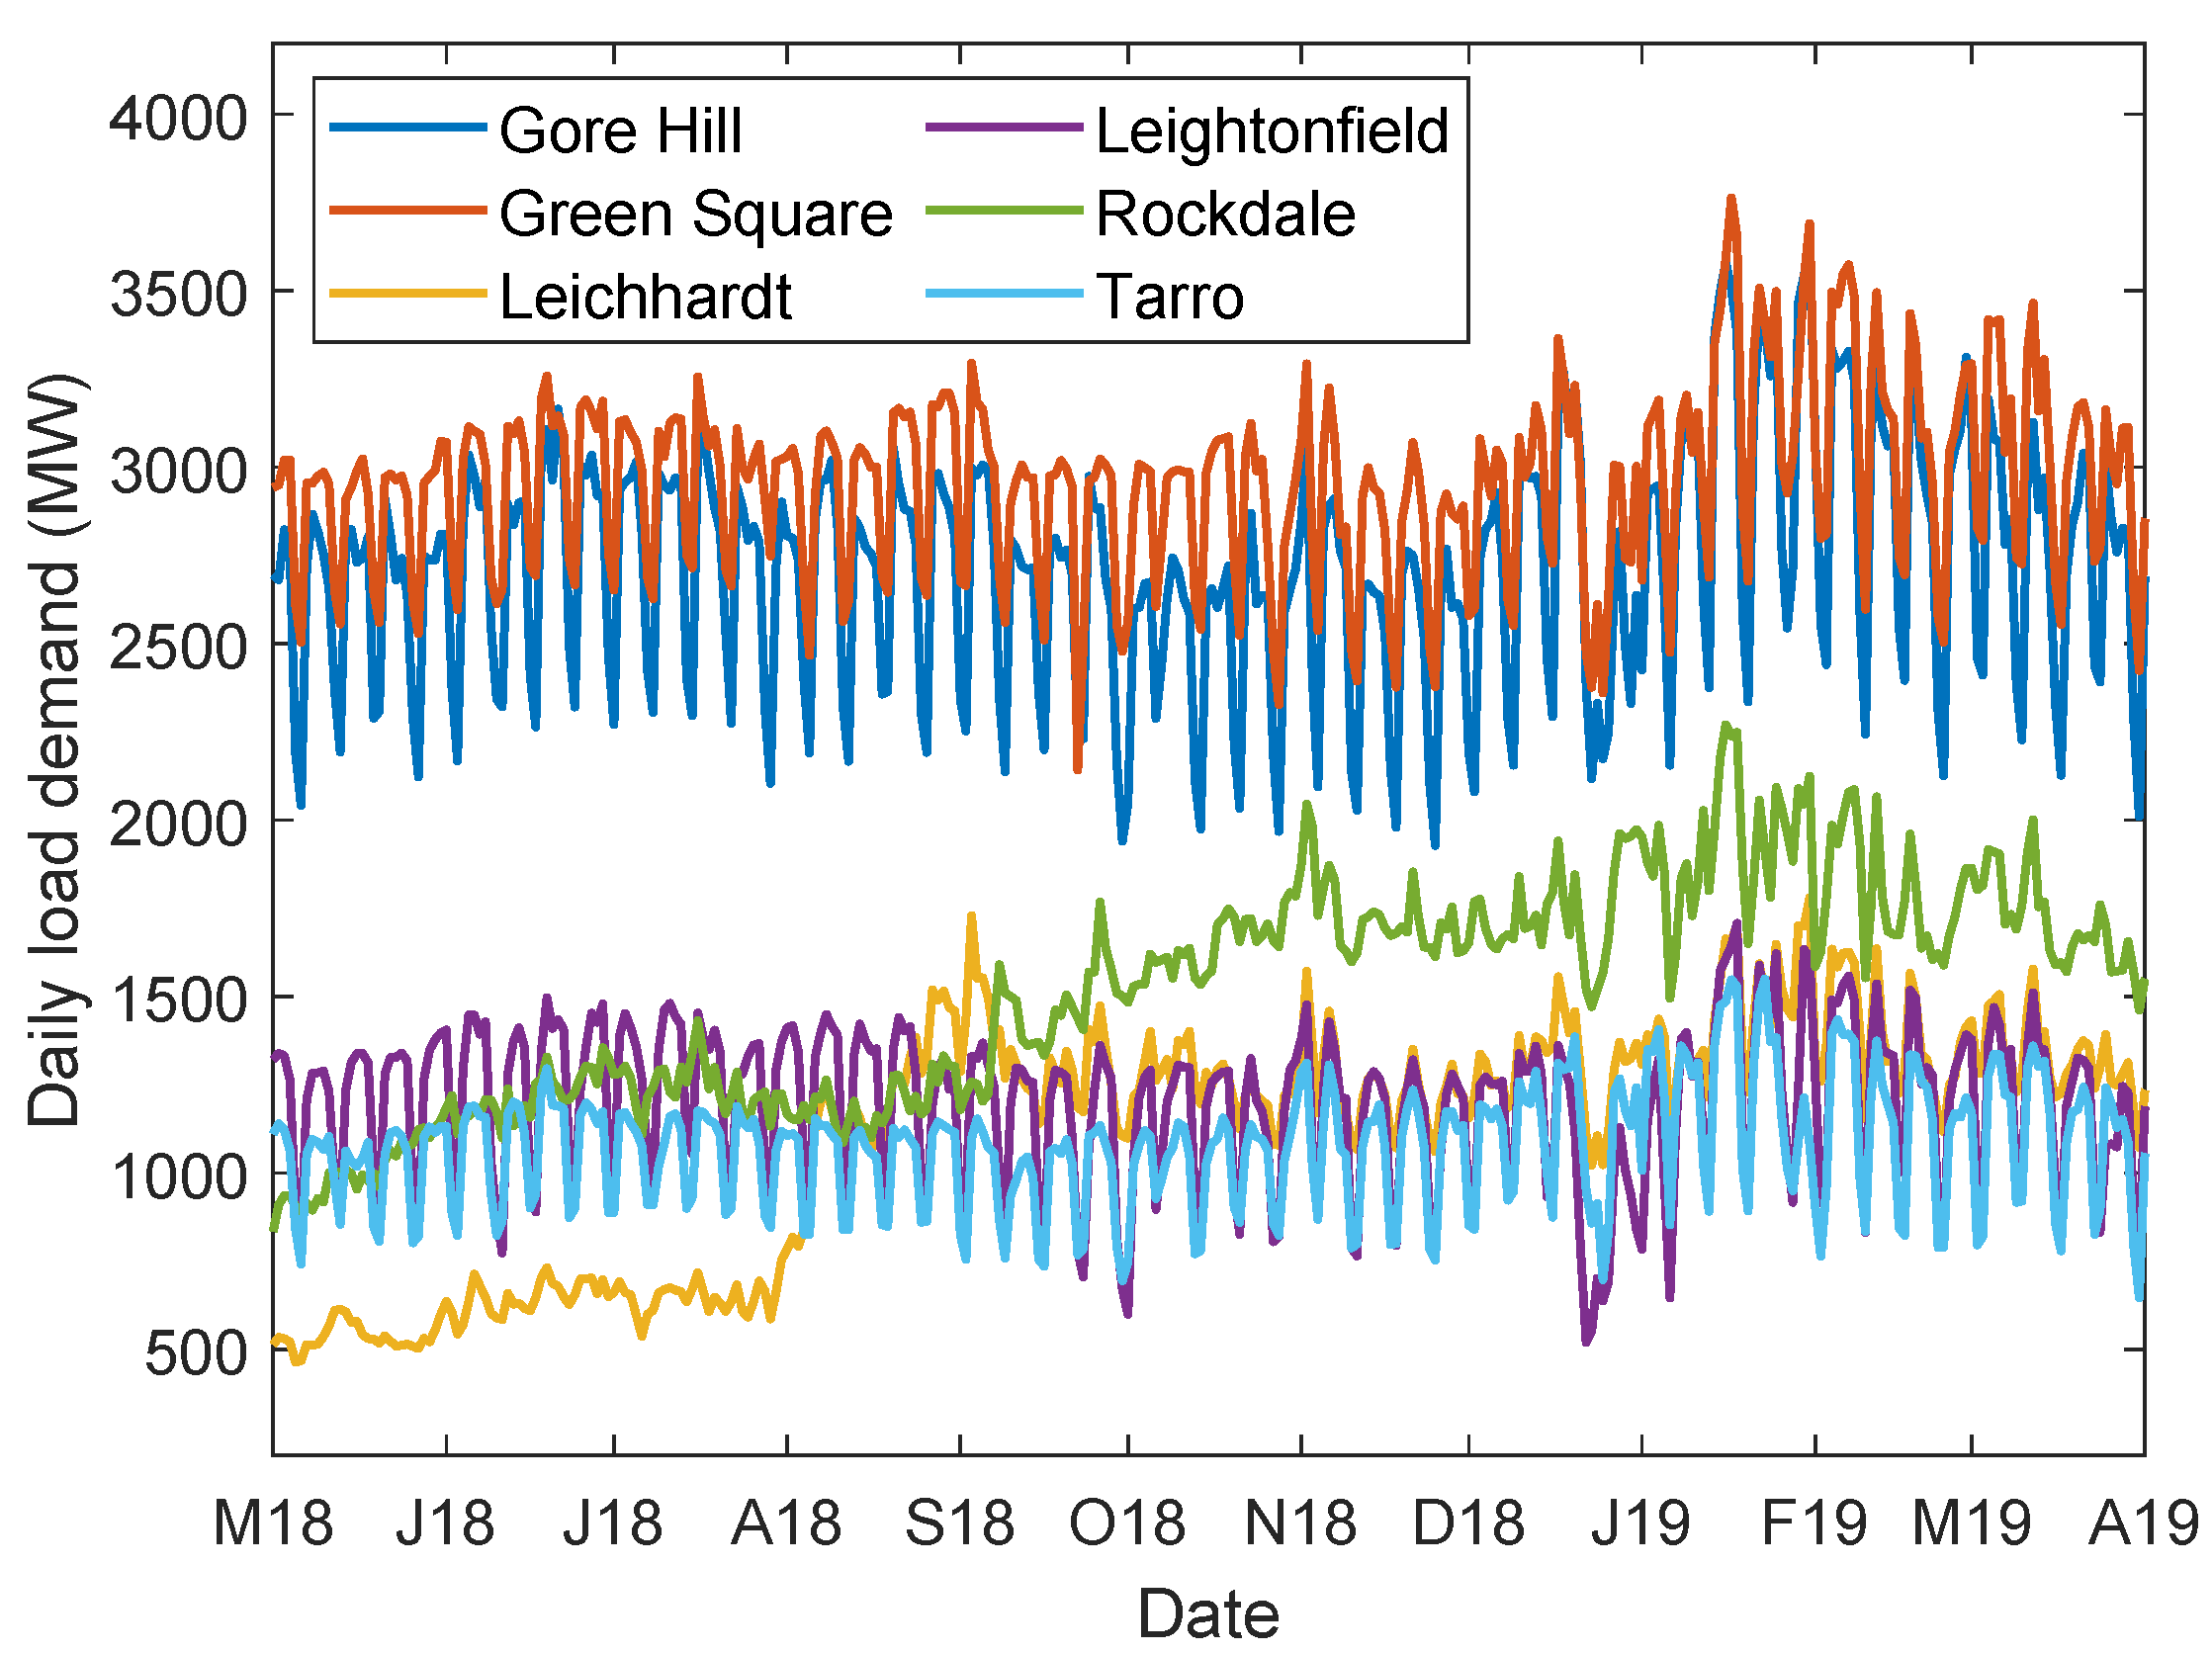
3.1. The Hidden Factor of Household Population

In the first case study, we use a synthetic load profile to study the impact of household population on peak load demand. The synthetic load profile data are generated by the load profile generator (LPG) [9]. The LPG simulates the full behavior of people in a household [10]. In this study, we generate a data set E 1 containing the electricity consumption profiles of 1257 households over a year. The data set E 1 contains hourly electric loads and number of persons living in each household. The house model and human activity pattern are based on a German census in 1996. Before applying the proposed method, conventional GMM is employed to obtain a Gaussian mixture estimation f 1 ( x , w ) with a separation index of S 1 = 2.2437 and a mixing error of ϵ 1 = 0.0159 . Figure 1 shows the grouping results and the corresponding f ^ 1 ( x , w ) , with the mixing error being ϵ ^ 1 = 0.0159 . The new Gaussian mixture f ^ 1 ( x , w ) and its corresponding grouping scheme E ^ 1 indicate that the data are clustered due to the household population. Specifically, the critical point is x ^ c 1 = 81.3 kWh , 4.5 , inferring that if a house has five or more people, the maximum daily electricity consumption of this household will increase significantly, where there is a 91.84% probability that the consumption will exceed 81.3 kWh. On the other hand, if a house has four or fewer people, the maximum daily electricity consumption has a probability of 98.68% to be less than 81.3 kWh.

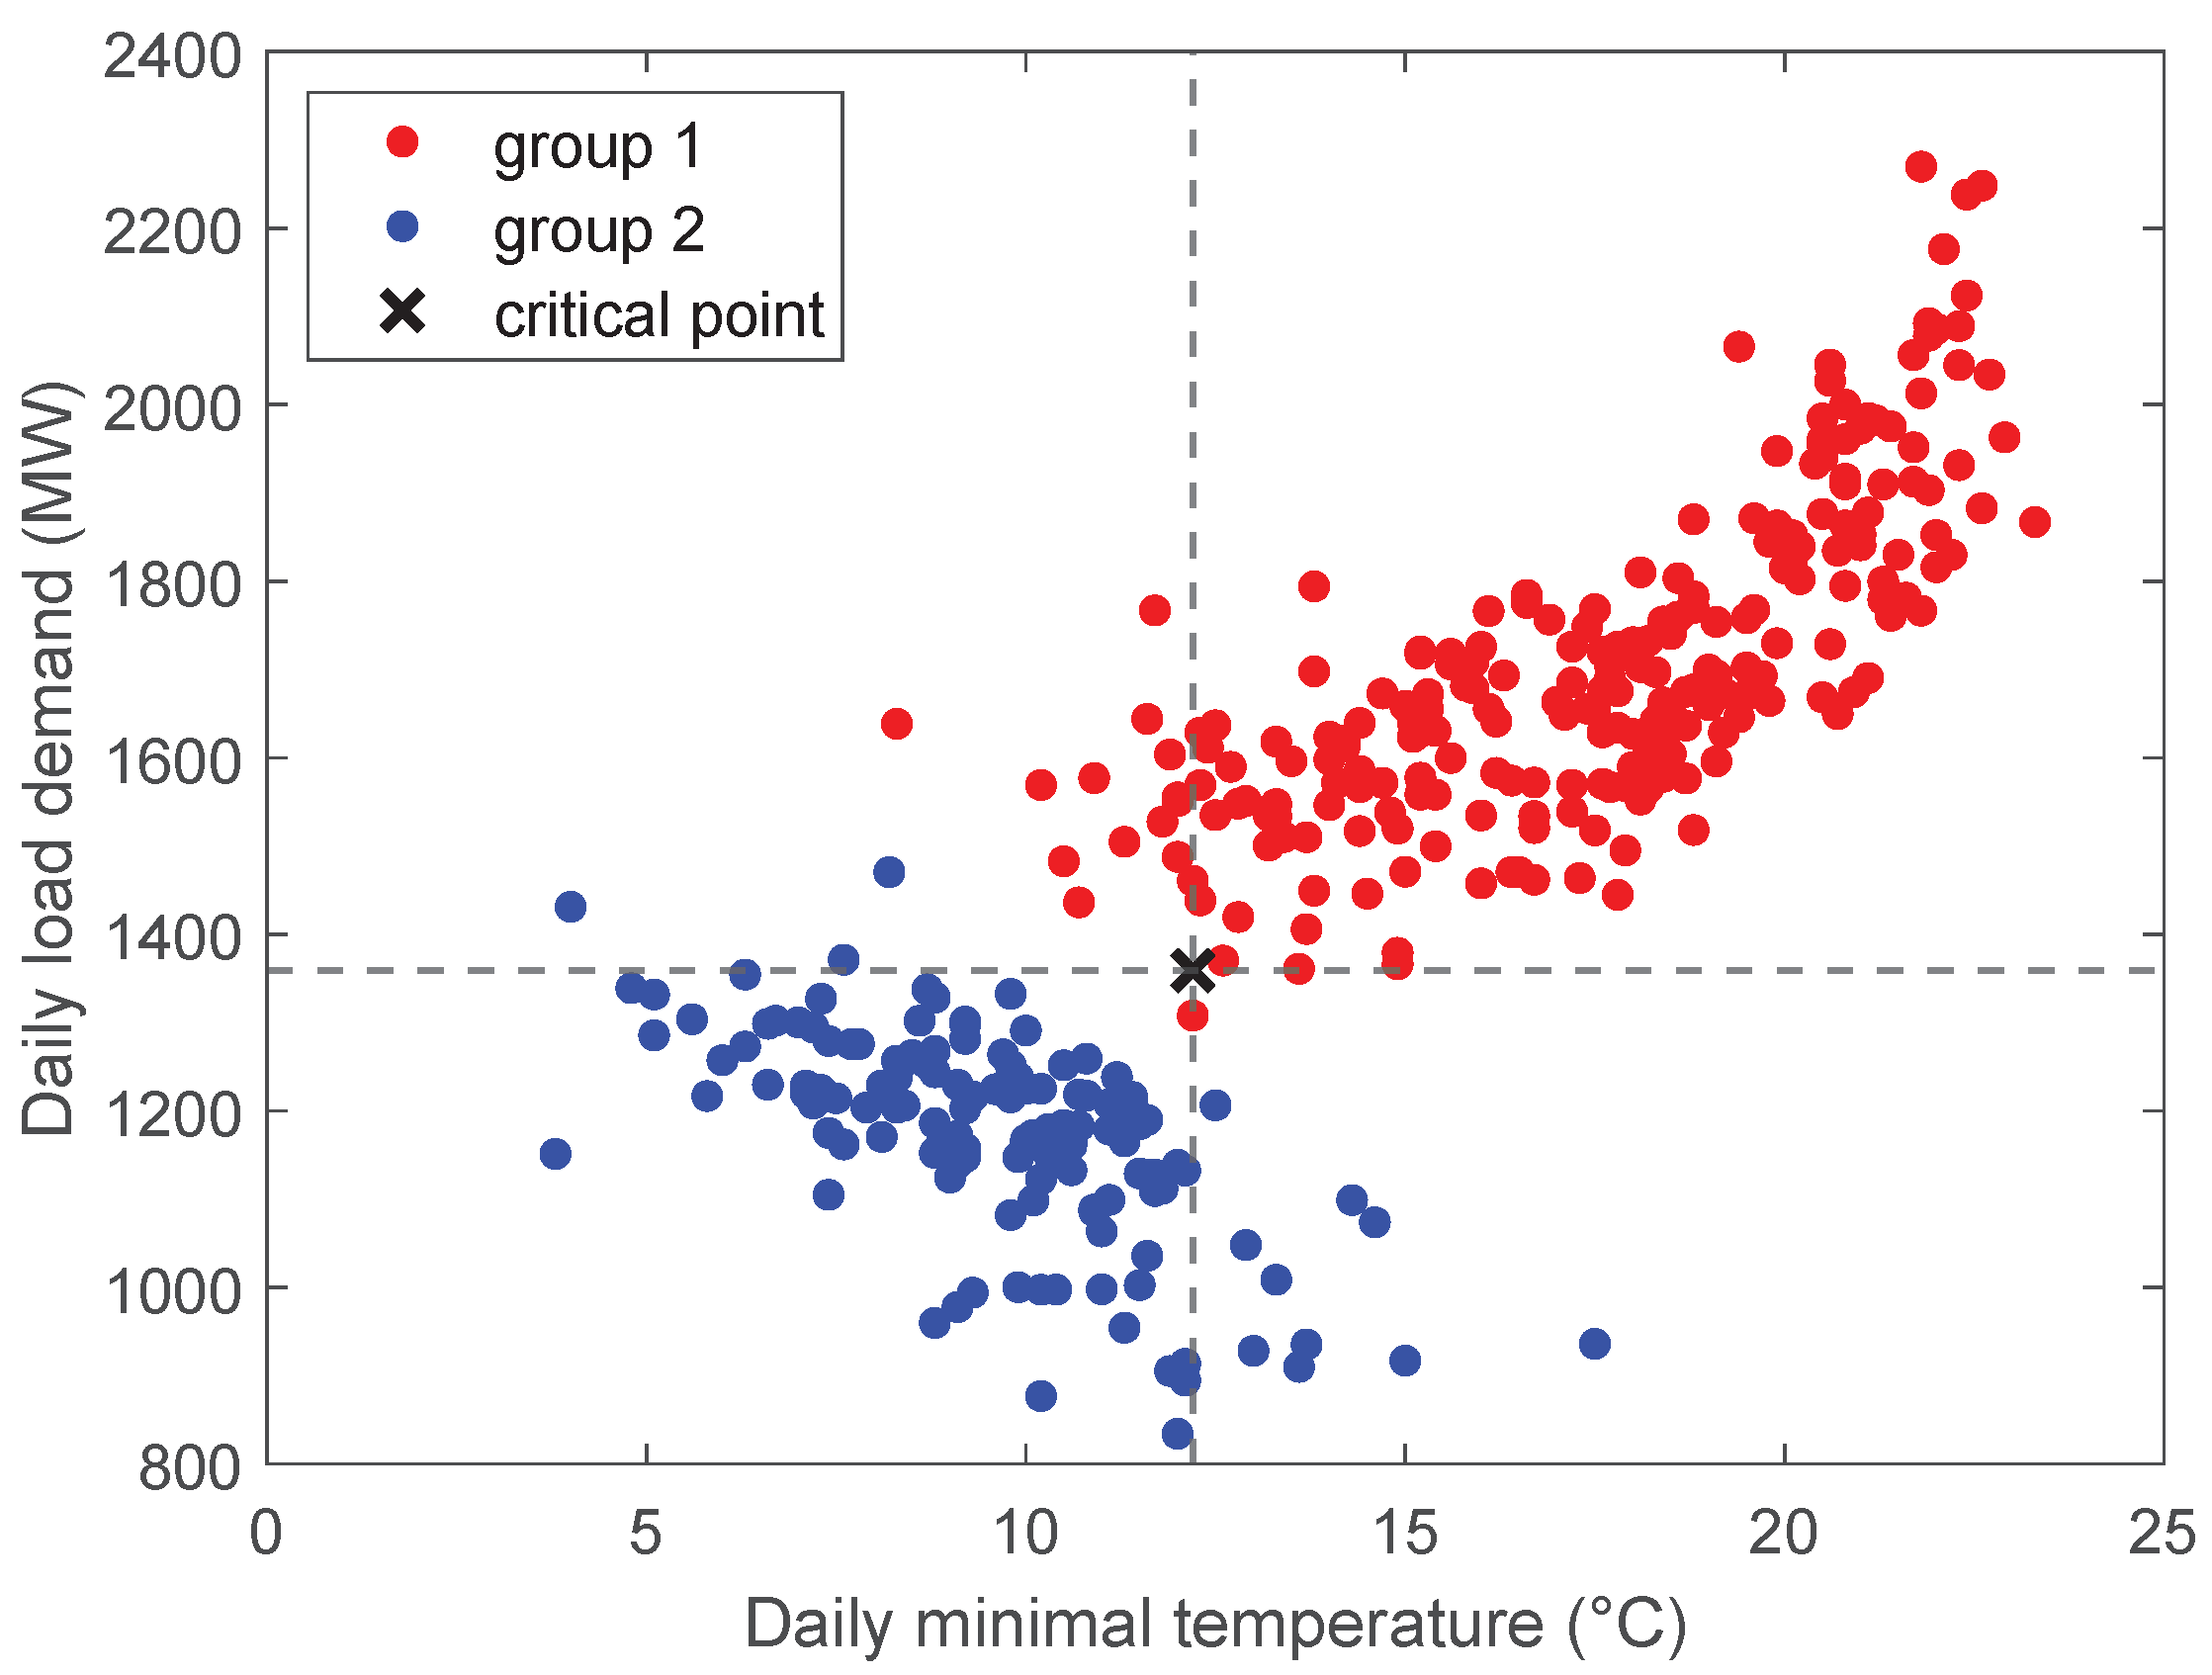
3.2. The Hidden Factor of Temperature

In the second case study, we analyze how the minimum daily temperature characterizes the daily load demand. Every year, Ausgrid (an electricity distribution company in Sydney, Australia) will publish 12 months of the load demand data of its substations. The data contain load demand profiles of over 180 zone substations, which form the boundary between the sub-transmission network and the distribution (11 kV) network. The second case study uses the daily average load data covering the period from 1 May 2018 to 30 April 2019. Figure 2 shows the daily load demand curves of six different substations. It can be observed that the load demand follows a weekly periodical pattern. The electricity demand is high during weekdays and drops sharply on weekends, as expected. However, the daily load curves of Rockdale (green) and Leichhardt (yellow) in Figure 2 do not follow the weekly pattern of the others. Through our investigation, we found that temperature can also be an important factor affecting load demand. As well as the substations’ daily average load data from Ausgrid, the daily max/min temperature data are obtained from the Bureau of Meteorology, Australia. By inserting the daily average load data with the corresponding temperature data, we end up with a 4-D load data set E 2 ( t , T m i n , T m a x , P m e a n ) , where t is the timestamp in day, P m e a n is the average daily load, and T m i n and T m a x are the minimal and the maximum daily temperature, respectively. The distributions of the daily average load and daily temperature both appear bimodal. The daily average load data of the Rockdale substation are used to test the proposed method. Before the grouping procedure, we obtain the conventional GMM of Rockdale f 2 ( x , w ) , with a separation index of S 2 = 1.4918 and a mixing error of ϵ 2 = 0.0744 . Figure 3 shows the results of grouping scheme E ^ 2 and critical point (black cross) x ^ c 2 = [ 12.2 C , 1359 MW ] . The mixing error of the new Gaussian mixture f ^ 2 ( x , w ) that corresponds to E ^ 2 is now ϵ ^ 2 = 0.0740 . The results indicate that the daily temperature is an important factor in characterizing the daily average load. The critical point indicates that the daily average load will increase as the temperature rises higher than 12.2 C . As a result, there is a 95.24% probability that that the daily average load of Rockdale will exceed 1359 MW. This information discovered here by the proposed method is useful in planning electricity generation and supply based on historical temperature data and weather forecasting.

4. Conclusions

The emerging grid modernization is evolving rapidly, constantly reshaping our long-lasting expectation of electric consumption patterns. While much attention has been paid to time-series load forecasting, there is little literature on uncovering significant yet hidden factors that affect electricity consumption. In this paper, we set out to obtain a fresh perspective on understanding the multidimensional database and gain insight into load demand analysis for real-world applications. The case studies indicate that electricity consumption is correlated with various variables/factors in a more complicated way than we have imagined.
This letter proposes a new approach to study electricity demand patterns. The procedure starts by assembling electricity demand data with other types of data into a multidimensional database and modeling such multidimensional data as a multimodal distribution. Based on such a multidimensional data set, the proposed method is able to uncover hidden factors in load demand. Numerical studies based on real and synthetic data sets demonstrate the usefulness of the proposed framework. Understanding the underlying factors and how they influence the load demand pattern will benefit power suppliers in planning the type and size of electricity generation accordingly. For our future work, we plan to incorporate the hidden factor analysis into new market mechanism designs, such as a personalized demand response program.

Author Contributions

Conceptualization, S.L., L.W. and W.S.; methodology, S.L.; validation, S.L.; formal analysis, S.L.; writing—original draft preparation, S.L.; writing—review and editing, L.W. and W.S. All authors have read and agreed to the published version of the manuscript.

Funding

This research received no external funding.

Institutional Review Board Statement

Not applicable.

Informed Consent Statement

Not applicable.

Data Availability Statement

Data used in the first case study is synthesized data generated by Load Profile Generator developed by Noah Pflugradt. Data used in the second case study is a shared dataset from Ausgrid that can be accessed via https://www.ausgrid.com.au/Industry/Our-Research/Data-to-share/Distribution-zone-substation-data (accessed on 8 September 2021).

Conflicts of Interest

The authors declare no conflict of interest.

References

  1. Gaur, K.; Kumar, H.; Agarwal, R.P.K.; Baba, K.V.S.; Soonee, S.K. Analysing the electricity demand pattern. In Proceedings of the 2016 National Power Systems Conference (NSC), Bhubaneswar, India, 19–21 December 2016; pp. 1–6. [Google Scholar]
  2. Su, W.; Huang, A.Q. Energy Internet: An Open Energy Platform to Transform Legacy Power Systems into Open Innovation and Global Economic Engine; Woodhead Publishing: Cambridge, UK, 2018. [Google Scholar]
  3. Chen, T.; Alsafasfeh, Q.; Pourbabak, H.; Su, W. The next-generation retail electricity market with customers and prosumers—A bibliographical survey. Energies 2018, 11, 8. [Google Scholar] [CrossRef] [Green Version]
  4. Su, W.; Wang, J.; Ton, D. Smart grid impact on operation and planning of electric energy systems. In Handbook of Clean Energy Systems; Yan, J., Ed.; Wiley: Hoboken, NJ, USA, 2015. [Google Scholar]
  5. Yuan, Y.; Dehghanpour, K.; Bu, F.; Wang, Z. A Data-Driven Customer Segmentation Strategy Based on Contribution to System Peak Demand. IEEE Trans. Power Syst. 2020, 35, 4026–4035. [Google Scholar] [CrossRef] [Green Version]
  6. Bu, F.; Dehghanpour, K.; Yuan, Y.; Wang, Z.; Guo, Y. Disaggregating Customer-Level Behind-the-Meter PV Generation Using Smart Meter Data and Solar Exemplars. IEEE Trans. Power Syst. 2021, 36, 5417–5427. [Google Scholar] [CrossRef]
  7. Liao, S.; Wei, L.; Kim, T.; Su, W. Modeling and Analysis of Residential Electricity Consumption Statistics: A Tracy-Widom Mixture Density Approximation. IEEE Access 2020, 8, 163558–163567. [Google Scholar] [CrossRef]
  8. Schilling, M.F.; Watkins, A.E.; Watkins, W. Is human height bimodal? Am. Stat. 2002, 56, 223–229. [Google Scholar] [CrossRef]
  9. LoadProfileGenerator. Available online: https://www.loadprofilegenerator.de/ (accessed on 7 July 2020).
  10. Pflugradt, N. Modellierung von Wasser und Energieverbräuchen in Haushalten. Ph.D. Dissertation, Technischen Universität Chemnitz, Chemnitz, Germany, 2016. [Google Scholar]
Figure 1. Grouping scheme and critical point in household population-load profile.
Energies 15 00319 g001
Figure 2. Daily load demand curves of six Ausgrid substations.
Energies 15 00319 g002
Figure 3. Grouping scheme and critical point in temperature–load profile.
Energies 15 00319 g003
Publisher’s Note: MDPI stays neutral with regard to jurisdictional claims in published maps and institutional affiliations.

