Article

A Multi-Scale Numerical Model for Investigation of Flame Dynamics in a Thermal Flow Reversal Reactor

School of Transportation and Vehicle Engineering, Shandong University of Technology, Zibo 255000, China
*
Author to whom correspondence should be addressed.
Energies 2022, 15(1), 318; https://doi.org/10.3390/en15010318
Submission received: 6 December 2021 / Revised: 30 December 2021 / Accepted: 30 December 2021 / Published: 3 January 2022
(This article belongs to the Special Issue Combustion and Energy Conversion under Small Scales)

Abstract

:
In this paper, the flame dynamics in a thermal flow reversal reactor are studied using a multi-scale model. The challenges of the multi-scale models lie in the data exchanges between different scale models and the capture of the flame movement of the filtered combustion by the pore-scale model. Through the multi-scale method, the computational region of the porous media is divided into the inlet preheating zone, reaction zone, and outlet exhaust zone. The three models corresponding to the three zones are calculated by volume average method, pore-scale method, and volume average method respectively. Temperature distribution is used as data for real-time exchange. The results show that the multi-scale model can save computation time when compared with the pore-scale model. Compared with the volumetric average model, the multi-scale model can capture the flame front and predict the flame propagation more accurately. The flame propagation velocity increases and the flame thickness decreases with the increase of inlet flow rates and mixture concentration. In addition, the peak value of the initial temperature field and the width of the high-temperature zone also affect the flame propagation velocity and flame thickness.

1. Introduction

With the rapid development of the global economy, the demand for resources is also increasing. In the meantime, a mass of low-concentration ventilation air is produced during coal mining, and a large amount of methane is released into the atmosphere directly every year. In 2009, global emissions of methane from ventilated air reached 14 billion m3 [1]. Methane is an intensive greenhouse gas with 25 times the global warming potential of CO2 [2]. At the same time, as a kind of clean energy, methane collection can create objective economic benefits. Therefore, the use of ventilation air methane can solve the problem of the huge demand for resources to a certain extent. Although several low-concentration ventilation air utilization and safe transportation technologies have been developed to improve methane utilization [3,4]. Ventilation air with a concentration below 1% is rarely used for industrial applications.
Su et al. [5] conducted an in-depth study and discussion on the utilization and recovery methods of ultra-low concentration ventilation air. However, at present, only catalytic flow reversal reactor (CFRR) and thermal flow reversal reactor (TFRR) are mainly used in industry. The utilization of ventilation air with an ultra-low concentration in both reactors can not only maintain self-sustaining combustion, but even achieve heat capture at a slightly higher concentration.
The simulation calculations for this study include a multi-scale, and the two other scales which are commonly considered are the coarse-scale (also known as the continuous scale) and the pore scale (also known as the mesoscale). Different scales are considered for different research attributes. At present, the three methods commonly used in the study of porous media are the volume-average method, pore-scale method, and multi-scale method.
The volume average method is used for many numerical studies and analyses of porous media combustion. By using the volume-averaging method, conclusions can be drawn about the influence of different factors on flame propagation rate [6,7,8] and flame inclination [9]. In addition, the volume averaging method has a small amount of calculation, which can save computing resources. However, it cannot accurately simulate the shape of the flame and the law of propagation and inclination.
In order to obtain more accurate numerical results, the pore-scale method for a numerical solution has been used. The pore-scale method can accurately study the thermal non-equilibrium of burners [10], the composition and temperature profile [11], and the flames in the pores [12]. The influence of equivalent ratio on the peak temperature in the combustion of porous media can also be calculated more accurately. Besides, the relationship between the flame propagation velocity and the inlet flow rate, and the thickness of the observed flame can also be calculated more accurately [13]. However, the size of the computational domain calculated by the pore-scale method is small, and few models with large domains are simulated by the pore-scale method.
Both volume averaging method and pore-scale method have their advantages and disadvantages, while multi-scale method combines the advantages of both methods. The multi-scale method can not only accurately capture the position of the flame front and observe the thickness and shape of the flame, but also simplify the calculation and save computing resources. Multi-scale methods can be divided into temporal multi-scale method and spatial multi-scale method. The temporal multi-scale method is to use changing time steps to calculate different regions, and the smaller time step helps to improve the calculation accuracy of the regions concerned. Spatial multiscale can be divided into hierarchical multiscale [14] and regional multiscale [15]. The hierarchical multi-scale method mainly divides the computational domain into macro-scale and micro-scale. Some parameters calculated at the micro-scale are applied to the macro scale to carry out the overall calculation. In this way, the calculated results are in better agreement with the experimental results. The multi-scale method of region division divides the computational domain into sub-computational domains with different computational scales and real-time data exchange conducted between sub-computational domains. The multi-scale method of region division is used in this paper.
In recent years, many people performed simulation calculations by multi-scale models to perform simulation calculations. Tang et al. [15] simulated the process of biofilm growth and reaction by using a multi-scale model of region division, and the results were in good agreement with the experiment. Bharadwaj et al. [14] used the hierarchical multi-scale model to study silica-supported catalysts and proved that the multi-scale model proposed had a certain guiding effect on catalyst design. Xin et al. [16] calculated the fluid energy equation and solid energy equation in the computational domain at different scales respectively to study the complex heat transfer characteristics of porous coal medium under low-temperature nitrogen injection. In addition, they obtained results that were more consistent with the experiment. Lu et al. [17] coupled the fluid energy equation at the representative elementary volume scale with the solid particle heat conduction equation at the pore scale to consider the temperature difference of solid particles. It was shown that the multi-scale model is more suitable to predict the local thermal non-equilibrium effect in porous media with low thermal conductivity than the two-equation model.
The flame front is constantly moving downstream for the filtration combustion of the extremely lean premixed gas. Thus, the interface between the pore-scale model and the volume-average model needs to move with the flame to realize the adaptability of the multi-scale models. Therefore, the dynamic mesh method is needed to ensure the quality of the mesh.
The dynamic mesh has been widely used in simulations and can be used to simulate crack propagation [18], gas–water two-phase flow through a thin porous layer [19], and engine cylinder-piston movement [20]. At present, the research on the filter combustion of very lean premixed gas through the dynamic mesh technique is very scarce to the best of the author’s knowledge.
There are other ways to define the flame position, such as G-equation method [21,22]. The G-equation is used to calculate the position of the flame front by defining the field of a scalar G and arbitrary G0. This method can not only accurately locate the flame front position but also save computing resources if fluid motion is modeled analytically. However, the flame thickness and the heat transfer between fluid and solid are ignored.
In this paper, a multi-scale model is established to numerically study the combustion characteristics of very lean premixed gas filter combustion. The novel feature of this paper is the development of an adaptive two-dimensional multi-scale model. UDF programming is used to realize the adaptivity of the mesh to the flame movement and the data exchange between different scales. The purpose of this paper is to obtain the law of flame movement and the thickness of flame front under different concentrations, intake flow rates, and initial temperature conditions.

2. Model

In this study, the experimental equipment used in Mao et al. [23] is simulated. The experimental equipment consists of four parts: combustion system, countercurrent system, preheating system, and data acquisition and control system. The packed bed is the main component of the size of 600 × 600 × 1900 mm. The cordierite honeycomb ceramic blocks (as shown in Figure 1) of 60 CPSI (channel per square inch) are used as the filling material, with a porosity of 0.56. To reduce the loss of heat to the surroundings, the entire reaction chamber is wrapped in 40 mm thick ceramic fiber insulation. The packed bed has two openings at the top and bottom, dividing the packed bed into A and B zones, which have separate entrances but are internally connected. The device runs well with a maximum feed flow of 800 m3 (STP)/h and a feed methane concentration in the range of 0.2–1.0 vol%.
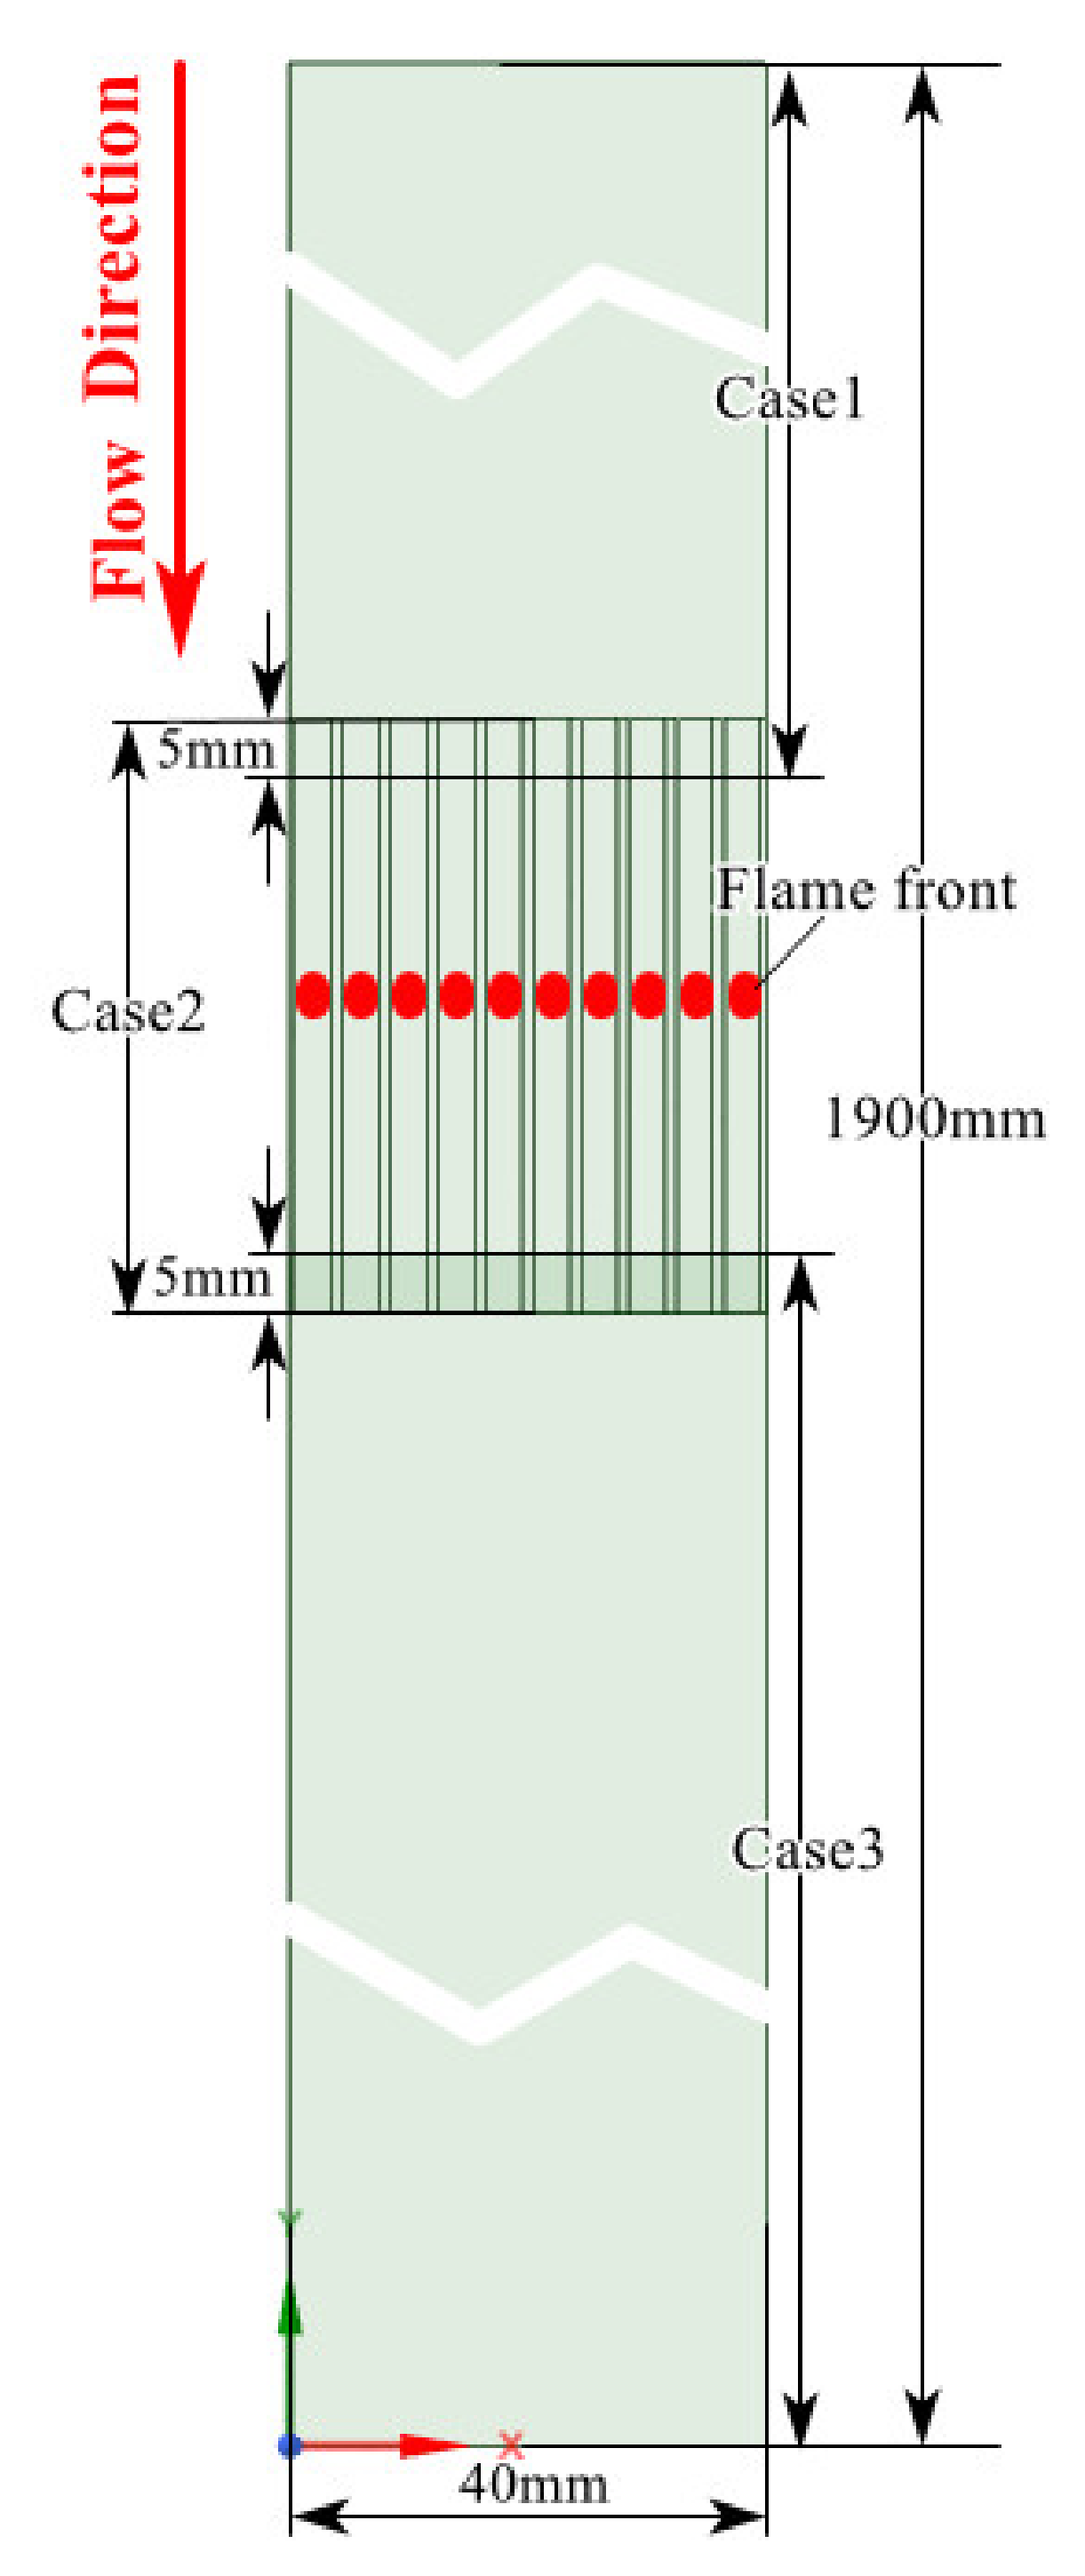
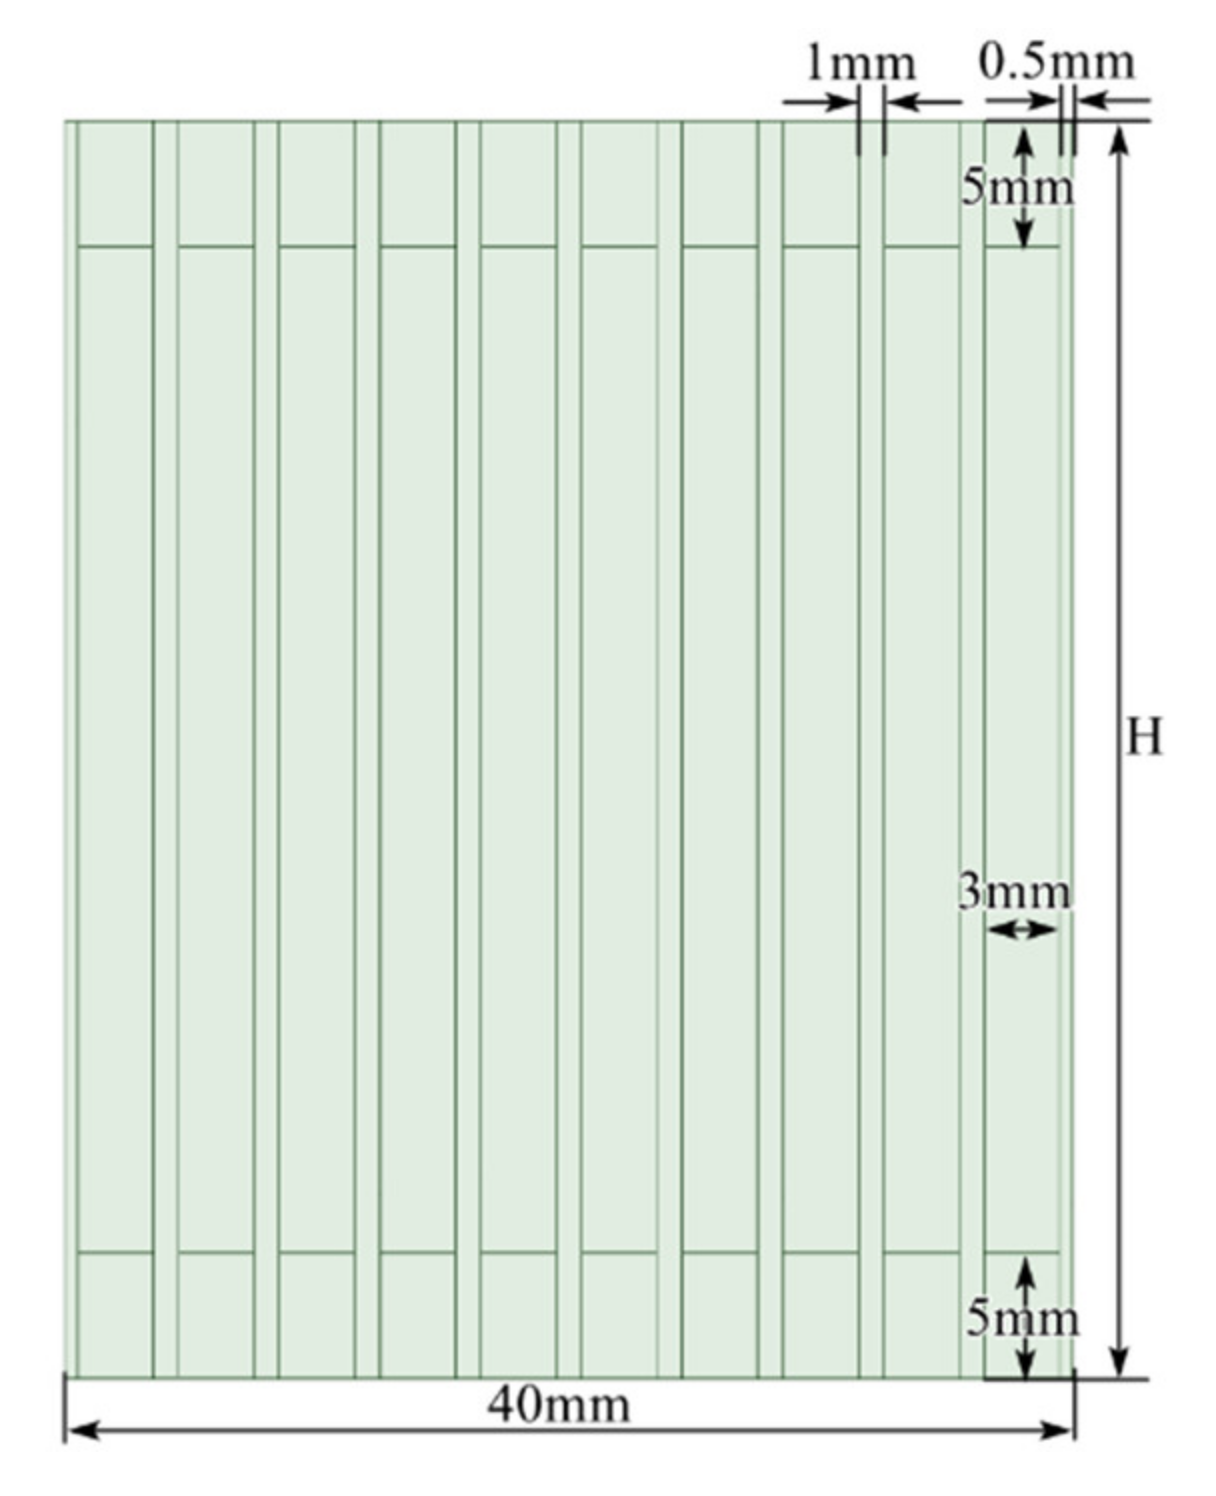
The physical model is a 2D model by cutting a 40 mm strip from the packed bed [23]. The total length of the computational domain is 1900 mm and the width is 40 mm. The whole calculation domain is divided into three regions (Case1, Case2, and Case3), as shown in Figure 2. In both Case1 and Case3, the volume-average models (VAM) are used to save computing resources. In Case2, the pore-scale model (PSS) is used to improve calculation accuracy. In Case2, the flow channel is 3 mm wide and the channel wall is 1 mm thick. The left and right boundaries of the calculation domain are set as symmetric boundaries, and the channel wall thickness on the boundary in Case2 is 0.5 mm thick, as shown in Figure 3. During calculation, the three models are calculated simultaneously, and the data are exchanged in real-time.
Before the region is divided, the position of the flame front is confirmed by using the overall volume average method in the whole calculation region. After that, the location of the flame front is set for Case2. Case1 is the upstream region of Case2, and Case3 is the downstream region, as shown in Figure 2. The height H of Case2 in Figure 3 is obtained by determining the height of the region where the reaction rate is greater than 1 × 10⁻⁸ kg·mol/(m3·s) by volume averaging method.
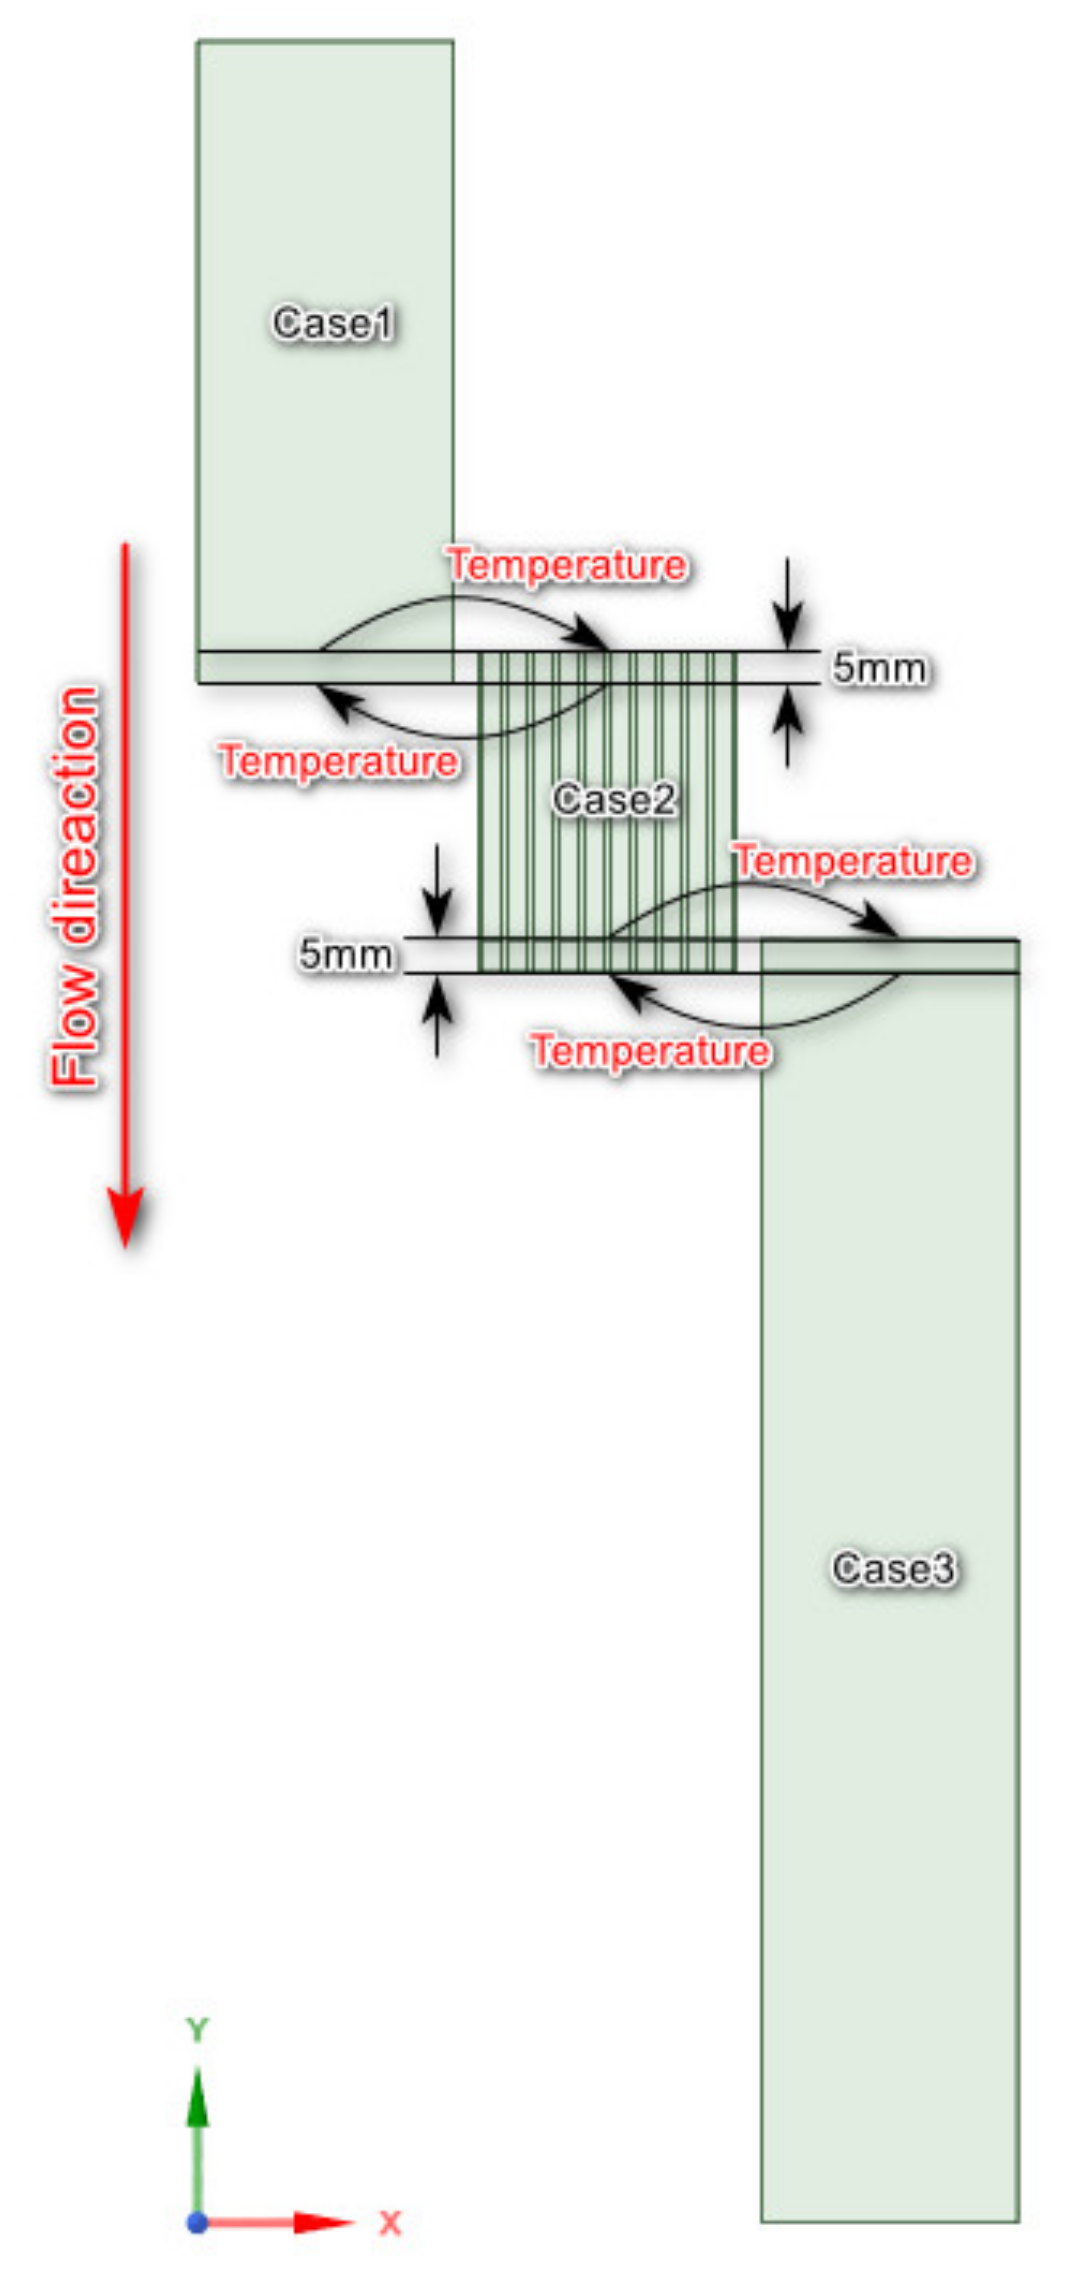
The UDF program in FLUENT is used to realize real-time data exchange. The temperature distribution at the outlet of Case1 is acquired on the section 5 mm downstream of the inlet of Case2 in the previous time step. The temperature distribution on the section 5 mm upstream the outlet of Case1 in the current time step is used in the inlet of Case2. The temperature distribution on the section 5 mm downstream the inlet of Case3 in the previous time step is used in the outlet of Case2. The temperature distribution at the section 5 mm upstream of the exit of Case2 in the current time step is used at the inlet of Case3, as shown in Figure 4. Symbols used in this work can be find in Table 1.
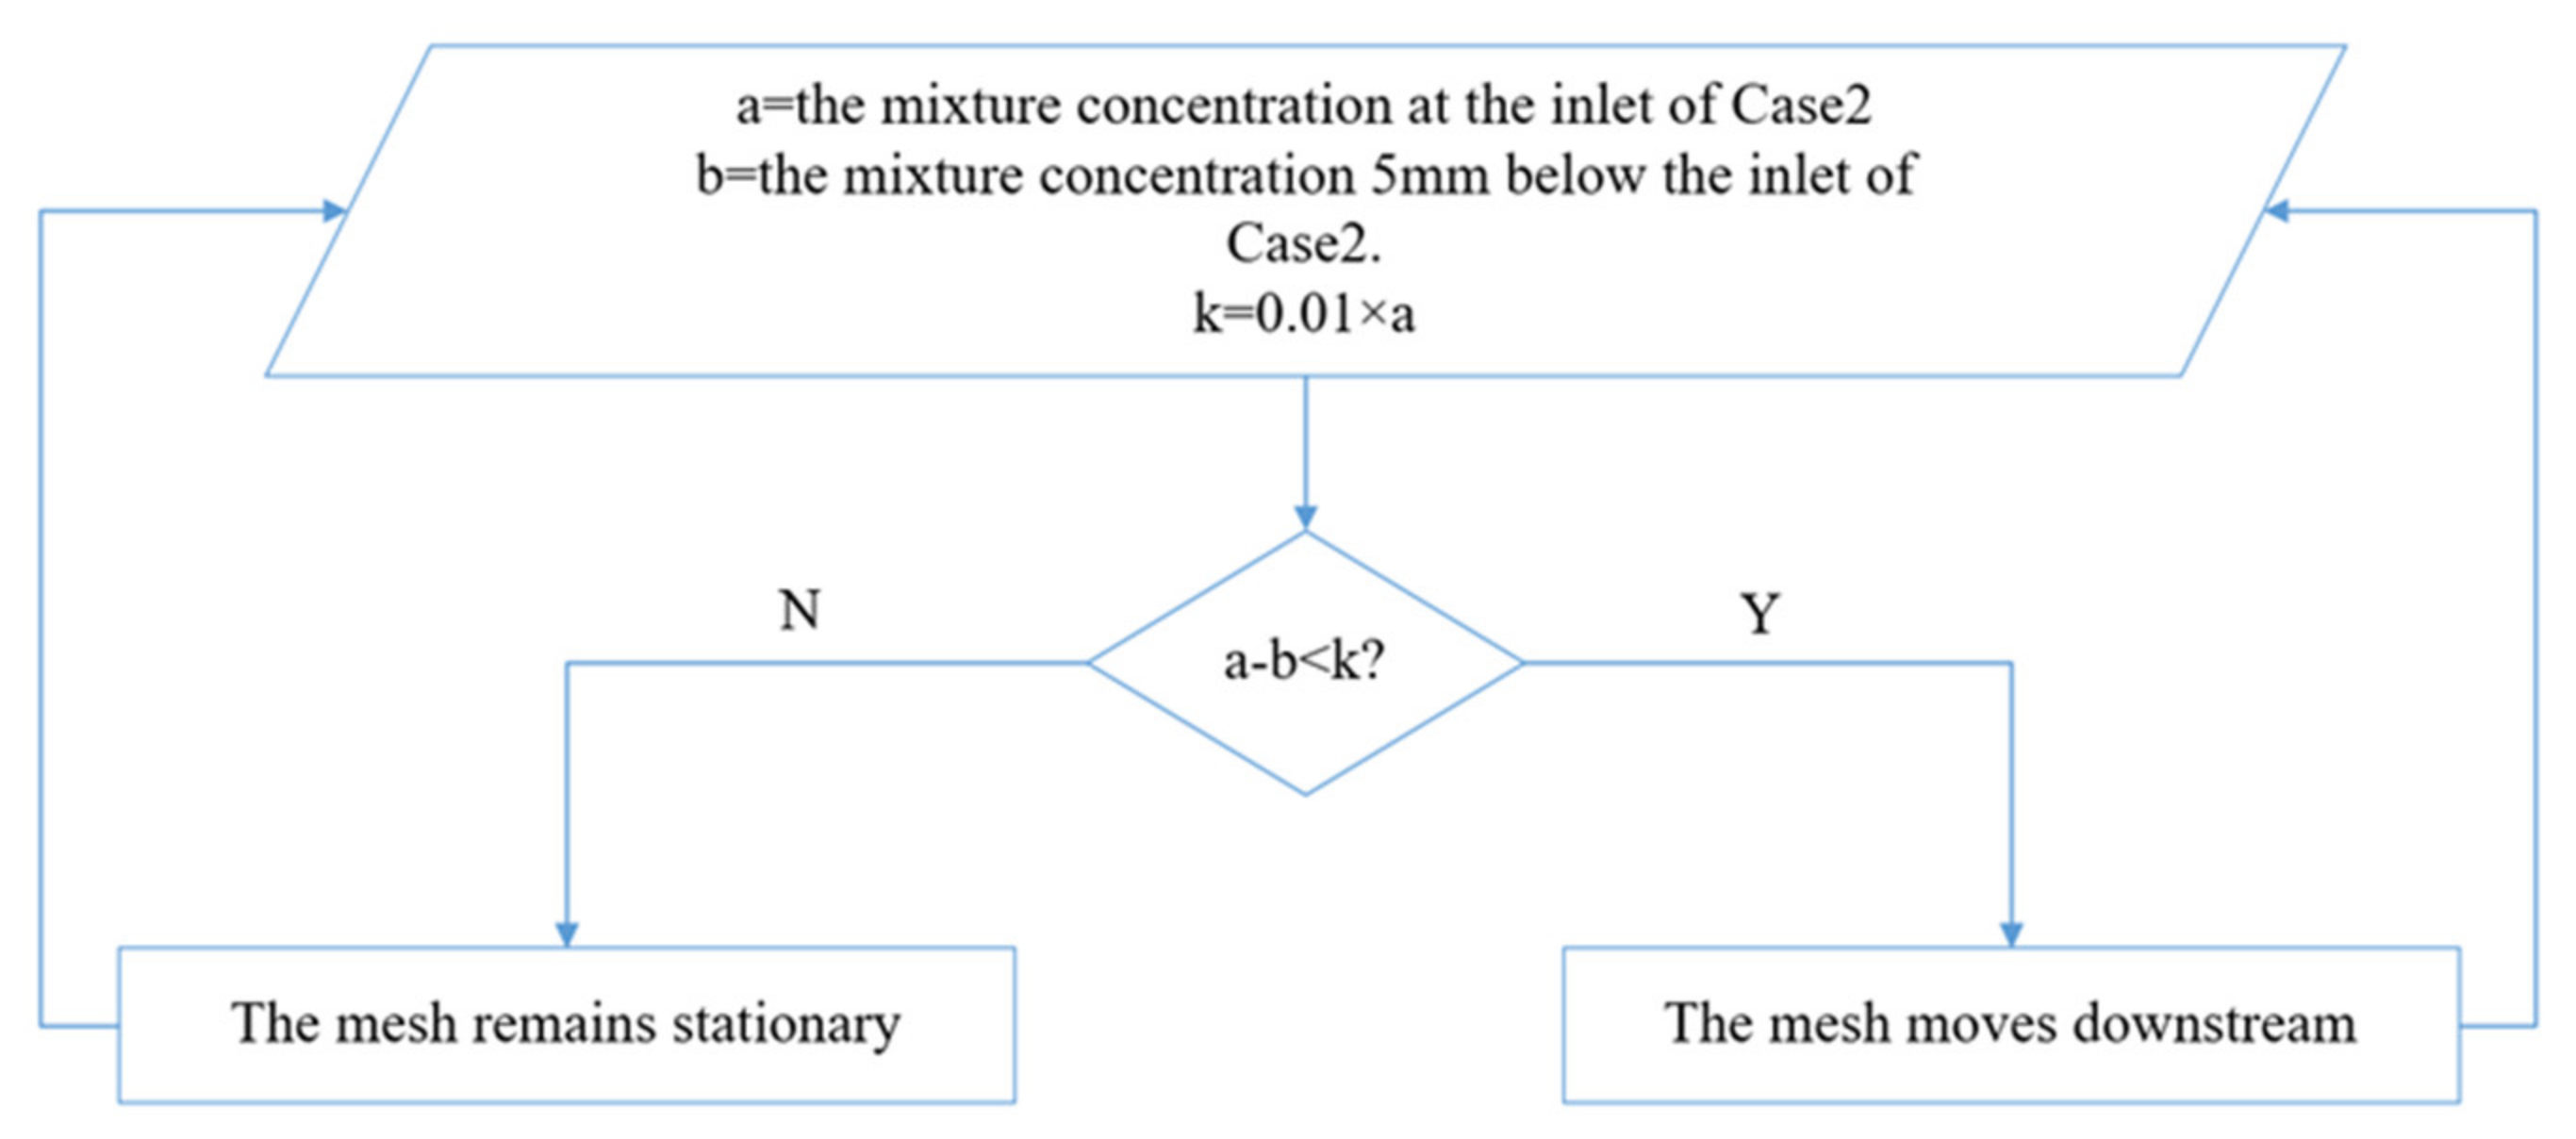
In order to realize the adaptivity, Case2 should accurately capture the flame front. This paper proposes a strategy using UDF program and dynamic mesh. Depending on the difference of the mixture concentration between at the inlet of Case2 and the 5 mm downstream of the inlet, the reaction zone can be judged whether to move downward or not. If the difference between the two concentrations is lower than the set value, it proves that the reaction region has moved downward. Then the domain Case2, interface between Case2 and Case1 and interface between Case2 and Case3 need to move down. Otherwise, it means that the reaction region has not run out of the computational domain of Case2, and the mesh does not need to move. The strategy is shown in Figure 5. The flame travels mainly downstream due to ventilation air concentration being so low. The upstream propagation of the combustion wave is not considered.

2.1. Pore Scale Model

Considering the complexity of heat transfer between the gas and solid, the model is simplified and the following assumptions are made:
(1)
The matrix is considered as opaque and inert porous media.
(2)
The surface-to-surface radiation is taken into account and computed by DO model, solid surface scattering is ignored.
(3)
The heat loss by the outer surfaces to the surroundings is neglected.
(4)
The radiation at inlet and outlet is neglected because the local temperature is low.
(5)
There is a uniform distribution of channels.
Therefore, we have the following differential equations (Symbols used in this work can be find in Table 1):
Continuity equation:
ρ g t + ( ρ g v ) = 0
where ρ g is gas density; t is time, and v is the gas velocity vector.
Momentum equation:
ρ g u i t + ( ρ g u i v ) = ( μ u i ) p
where u i is the i component of velocity vector; μ is the dynamic viscosity.
Gas phase energy equation:
C g ρ g T g t + ( C g ρ g v T g ) = ( λ g T g ) w i Q W i
where T g , C g , λ g , w i , W i are the gas mixture temperature, special heat, thermal conductivity, reaction rate, and the molecular weight of species i, respectively. Q is the heat content of the premixed mixture.
Solid phase energy equation:
C s ρ s T s t + ( λ s T s ) = 0
where C s , ρ s , T s , λ s are the solid special heat, density, temperature, thermal conductivity, respectively.
Species conservation equation:
ρ g Y i t + ( ρ g v Y i ) = ( ρ g D i Y i ) + w i W i
where Y i , D i are the mass fraction, diffusion coefficient, respectively. The one-step reaction mechanism provided by FLUENT is adopted.
Ideal gas state equation:
p = ρ g R T g
where R is the general constant of the gas.
The following boundary conditions are specified in the model:
Inlet:
Tg = T(x), u = 0, v = v0, XCH4 = XCH4,in, XO2 = XO2,in
where v is the velocity in the y direction, XCH4 is volume fraction of methane, XO2 is volume fraction of oxygen.
Outlet:
T g y = T s y = Y i y = 0 , T g = T ( x ) .
Symmetry:
T g x = T s x = Y i x = v x = u = 0

2.2. Volume-Average Model

First, some assumptions are made for the volume-average model.
(1)
The mixture is assumed to be an ideal gas, ignoring radiation.
(2)
Porous media are noncatalytic, homogeneous, and optically thick. Solid radiation is considered using the Rosseland method.
(3)
There is thermal non-equilibrium between gas and solid.
Then the governing equations are set up:
Continuity equation:
( ε ρ g ) t + ( ε ρ g u ) = 0
where ε is the porosity.
Horizontal momentum equation [9]:
( ε ρ g u ) t + ( ε ρ g u u ) = p x + ( μ u ) + C 1 μ u + C 2 ρ g 2 u 2
where u is the horizontal velocity; C1 and C2 represent the permeability and the inertial resistance [24,25,26,27] and are measured experimentally, respectively.
Vertical momentum equation:
( ε ρ g v ) t + ( ε ρ g v u ) = p y + ( μ v ) + C 1 μ u + C 2 ρ g 2 u 2
where v is the vertical velocity.
Gas phase energy equation:
( ε C g ρ g T g ) t + ( ε C g ρ g u T g ) = ( ε λ e f f g T g ) + h v ( T s T g ) ε i w i h i W i
where λ e f f g = λ g + ρ g C g , h v = m π λ g d 2 2 + 1.1 Pr 0.3333 Re 0.6 [7,28]; h i is the molar enthalpy of species. Pr = C g μ λ g , Re = ε ρ d v μ , m is the ratio of heat transfer coefficient between honeycomb ceramics and alumina pellets, determined experimentally m = 0.453 e T g 452.6 + 1.45 , d = 4 ε / π P P C [29].
Solid phase energy equation:
( 1 ε ) ( C s ρ s T s ) t = ( λ e f f s T s ) + h v ( T g T s )
where λ e f f s = ( 1 ε ) λ s + λ r a d , λ r a d = 32 σ d ε T s 3 9 ( 1 ε ) [30].
Species conservation equation:
( ε ρ g Y i ) t + ( ε ρ g u Y i ) = ( ε ρ g D i Y i ) + ε w i W i
Ideal gas state equation:
ρ g = p R T g
The following boundary conditions are specified in the model:
Case1:
Inlet:
Tg = 300 K, u = 0, v = v0, XCH4 = XCH4,in, XO2 = XO2,in
Outlet:
T g y = T s y = Y i y = 0 ,   T g = T ( x ) .
Symmetry:
T g x = T s x = Y i x = v x = u = 0
Case3:
Inlet:
Tg = T(x), u = 0, v = v0, XCH4 = XCH4,in, XO2 = XO2,in
Outlet:
T g y = T s y = Y i y = 0
Symmetry:
T g x = T s x = Y i x = v x = u = 0

2.3. Mesh

Because this model structure is simple and regular. Considering this, the structured grid is used in our computations. In order to reduce the calculation cost and ensure that the number of grids on each surface is no less than 3 (as shown in the Figure 6), mesh 2, which is shown in Table 2, is adopted as the grid model for final calculation. Therefore, the grid size of Case1 and Case3 is 0.5 mm, and the grid size of Case2 is 0.2 mm. The mesh number of the volume average model is 281,600 with 88,800 in Case1 and 192,800 in Case3, and the mesh number of the pore-scale model is 150,750 in Case2. The total mesh number of the multi-scale model is 432,350.

2.4. Setup

The numerical simulation is based on ANSYS. The geometries and grids have been generated with GAMBIT. The Standard k-ε model is used [31,32]. The velocity and pressure coupling uses the SIMPLE algorithm. A second-order upwind scheme is used for the equations of momentum, energy, and species transport. To ignite the lean mixture, an initial temperature field of a quadratic parabola shape is set. A residual error of 10−6 the equations are taken as convergence criteria.

3. Results and Discussion

3.1. Model Validation

Figure 7 and Figure 8 show the experimental value and the temperature distribution predicted by the three models with XCH4 = 0.8% and 0.4%, and an overall flow rate of 700 m3/h. The temperature distribution is along the center line. In Figure 7a and Figure 8a, the initial temperature distribution of the experiment is used for data fitting to obtain the temperature curve that can be used in the model. In Figure 7b and Figure 8b we present the temperature comparison of VAM model, multi-scale model, pore-scale model, and experiment at 108 s. It can be seen that the numerical results calculated by the multi-scale model proposed in this paper are in good agreement with the experimental results. Therefore, the multi-scale model proposed in this paper can accurately estimate the flame propagation law of the extremely lean premixed filter combustion.

3.2. Comparison of Volume Average Model, Multi-Scale Model, and Pore-Scale Model

Figure 9, Figure 10 and Figure 11 show the comparison of results among the volume average model, the multi-scale model and the pore-scale model in the height range of 1.2–1.45 m at 108 s when XCH4 = 0.8%, and the inlet flow is 700 m3/h. The cloud chart of reaction rate, mass fraction of CH4 and temperature are displayed respectively in Figure 9, Figure 10 and Figure 11. It can be observed in Figure 9 that the reaction rate calculated by the volume-averaged model is horizontally layered, so the flame front is flat. The results obtained by the multi-scale model and the pore model show the fingerlike-shaped flame in many channels. This is due to the consideration of the detailed structure of the porous media when the latter two models are used.
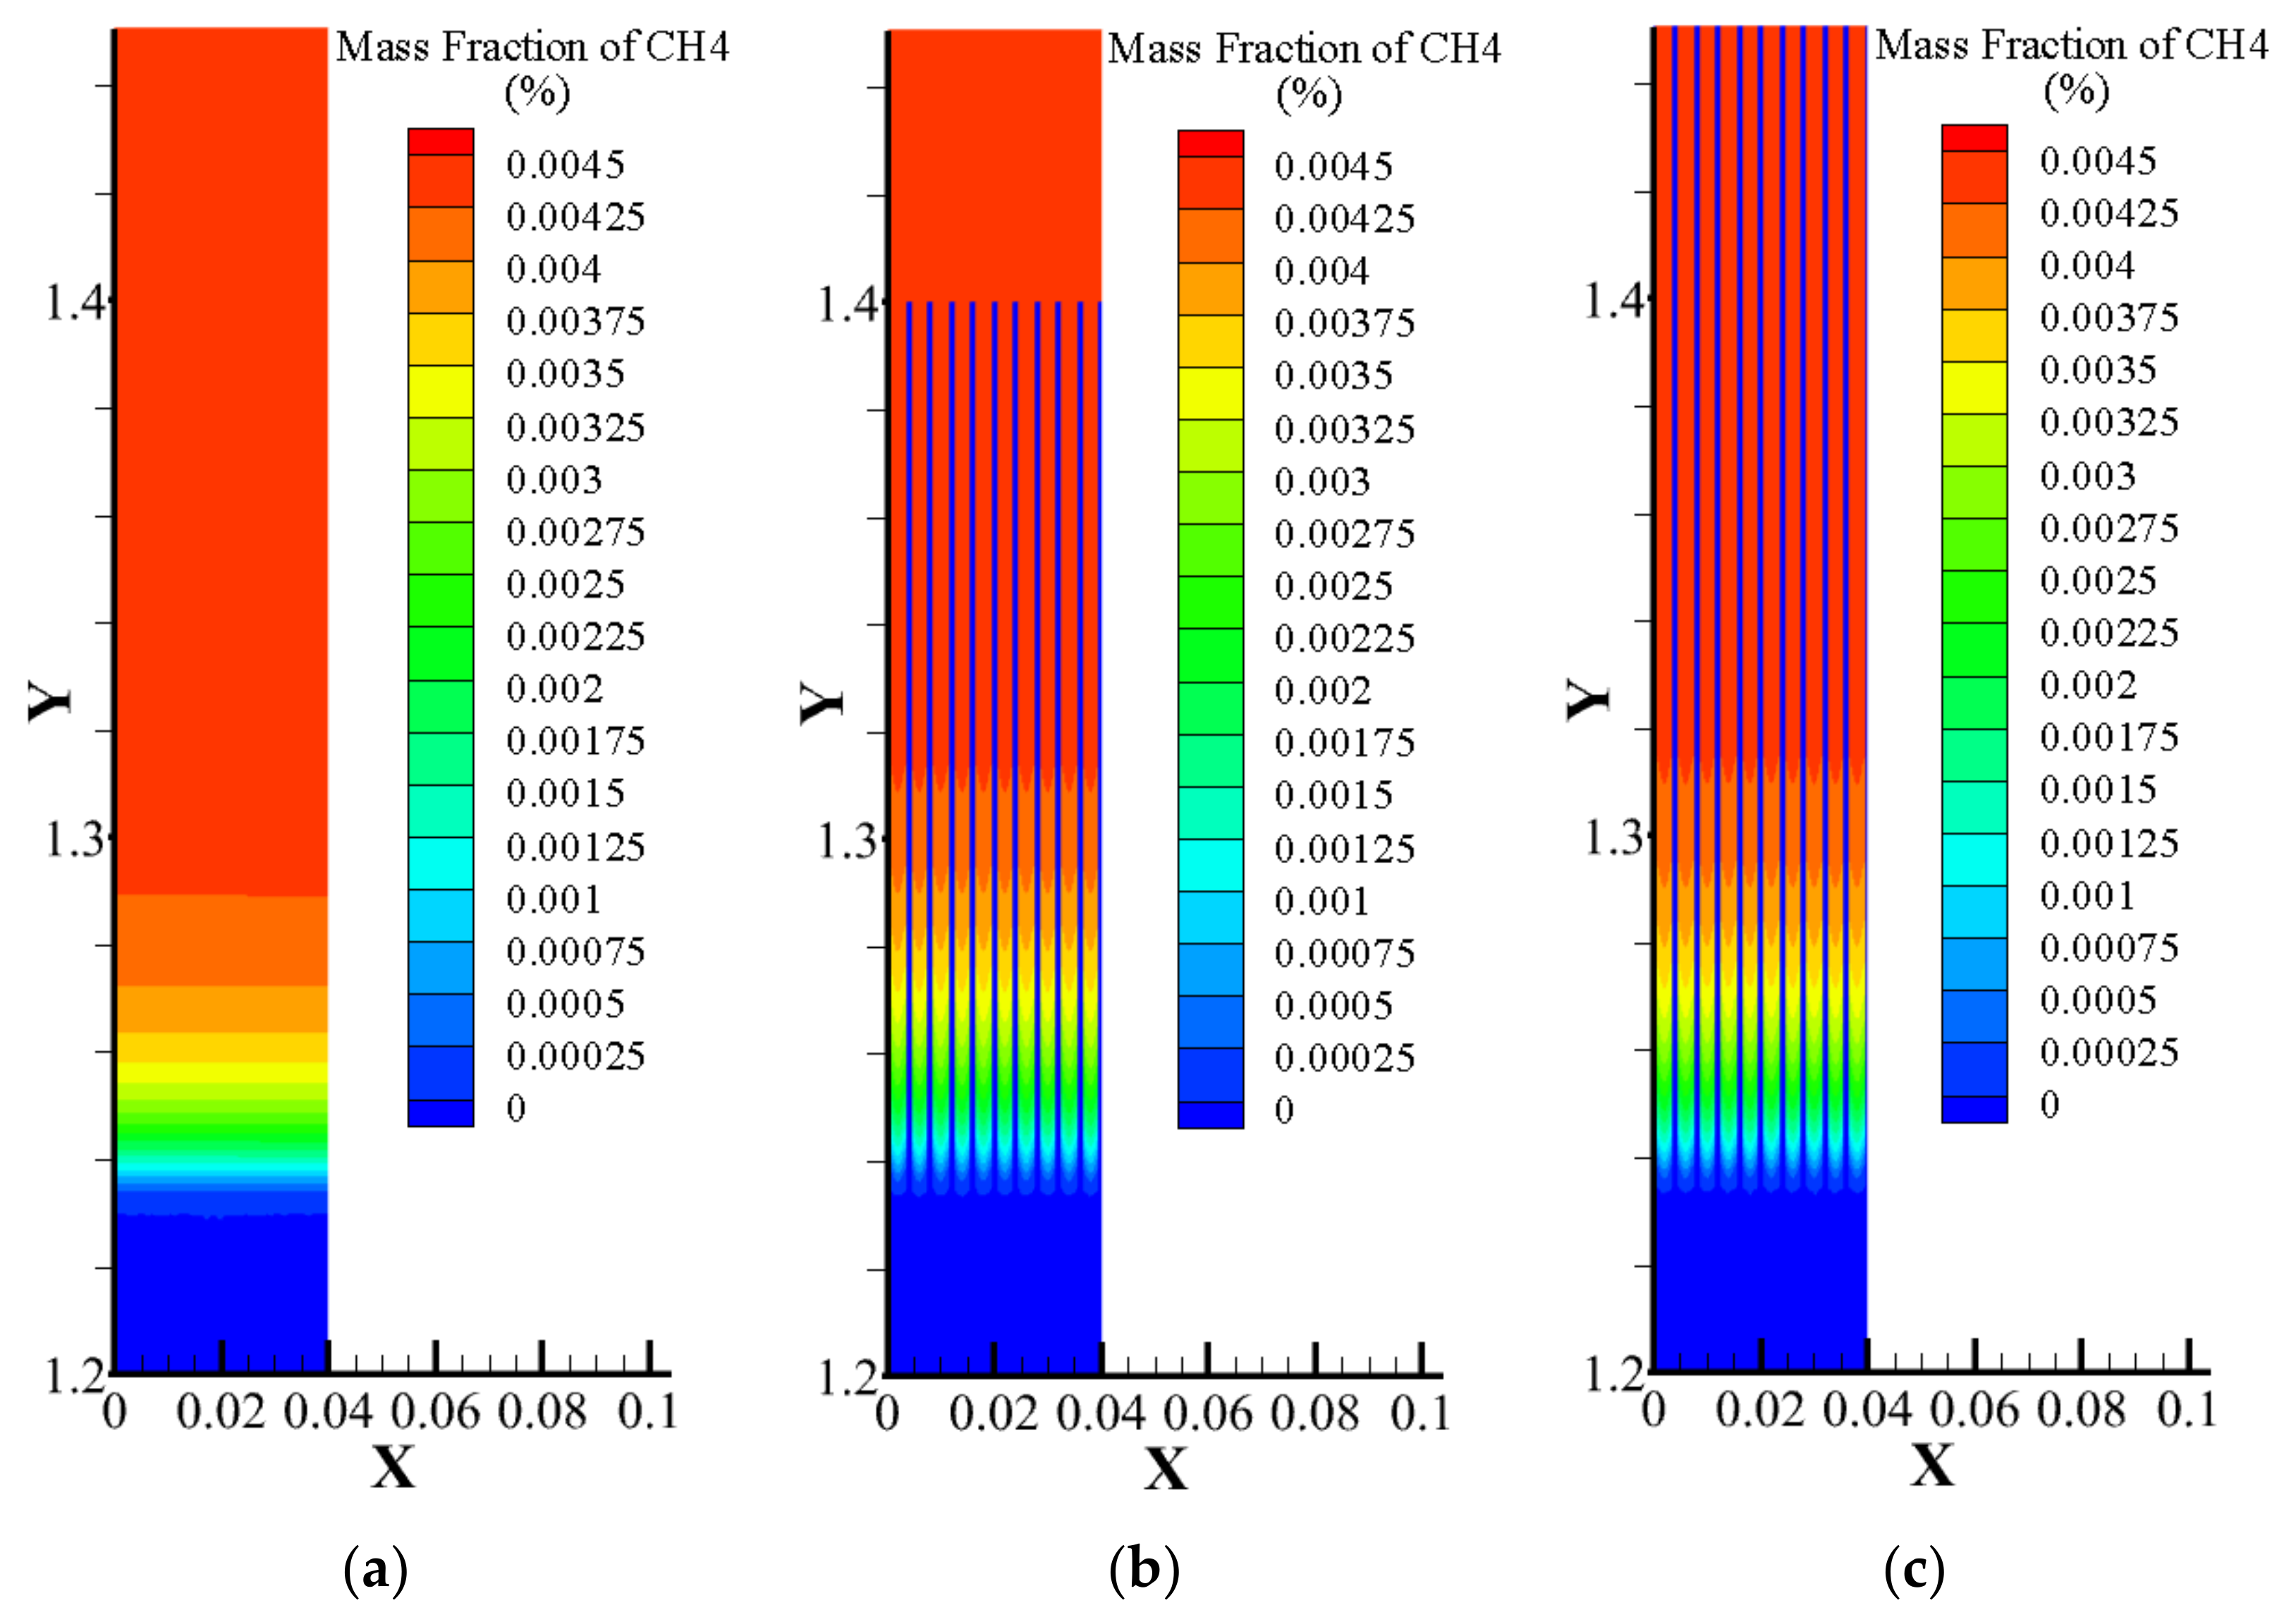
Figure 10 shows the distribution of mass fraction of CH4. It can be seen that the mass fraction of CH4 calculated by the volume-average model is horizontally fattened distribution. While the results obtained by the multi-scale model and the pore-scale model show the detailed process of the change of mass fraction of CH4 in the porous media channels.
Figure 11 shows the temperature distribution. As shown in Figure 11, the volume-average model cannot distinguish the temperature difference between the gas and the solid. However, the thermal non-equilibrium can be captured by the multi-scale model and the pore-scale model.
The computer used in this simulation is installed with AMD Ryzen 9 3900X 12-core Processor and four 16G memory sticks. The physical time length for calculation is 108 s, the physical time step is set to 0.1 s and the iterative steps are 20 during each physical time step. About 4370 min for the pore-scale model, 944 min for the multi-scale model, and 1209 min for the volume-average model are spent. It can be seen that the multi-scale model saves a lot of time compared with the pore-scale model.

3.3. Effect of Methane Concentration on Flame Propagation and Thickness of the Flame

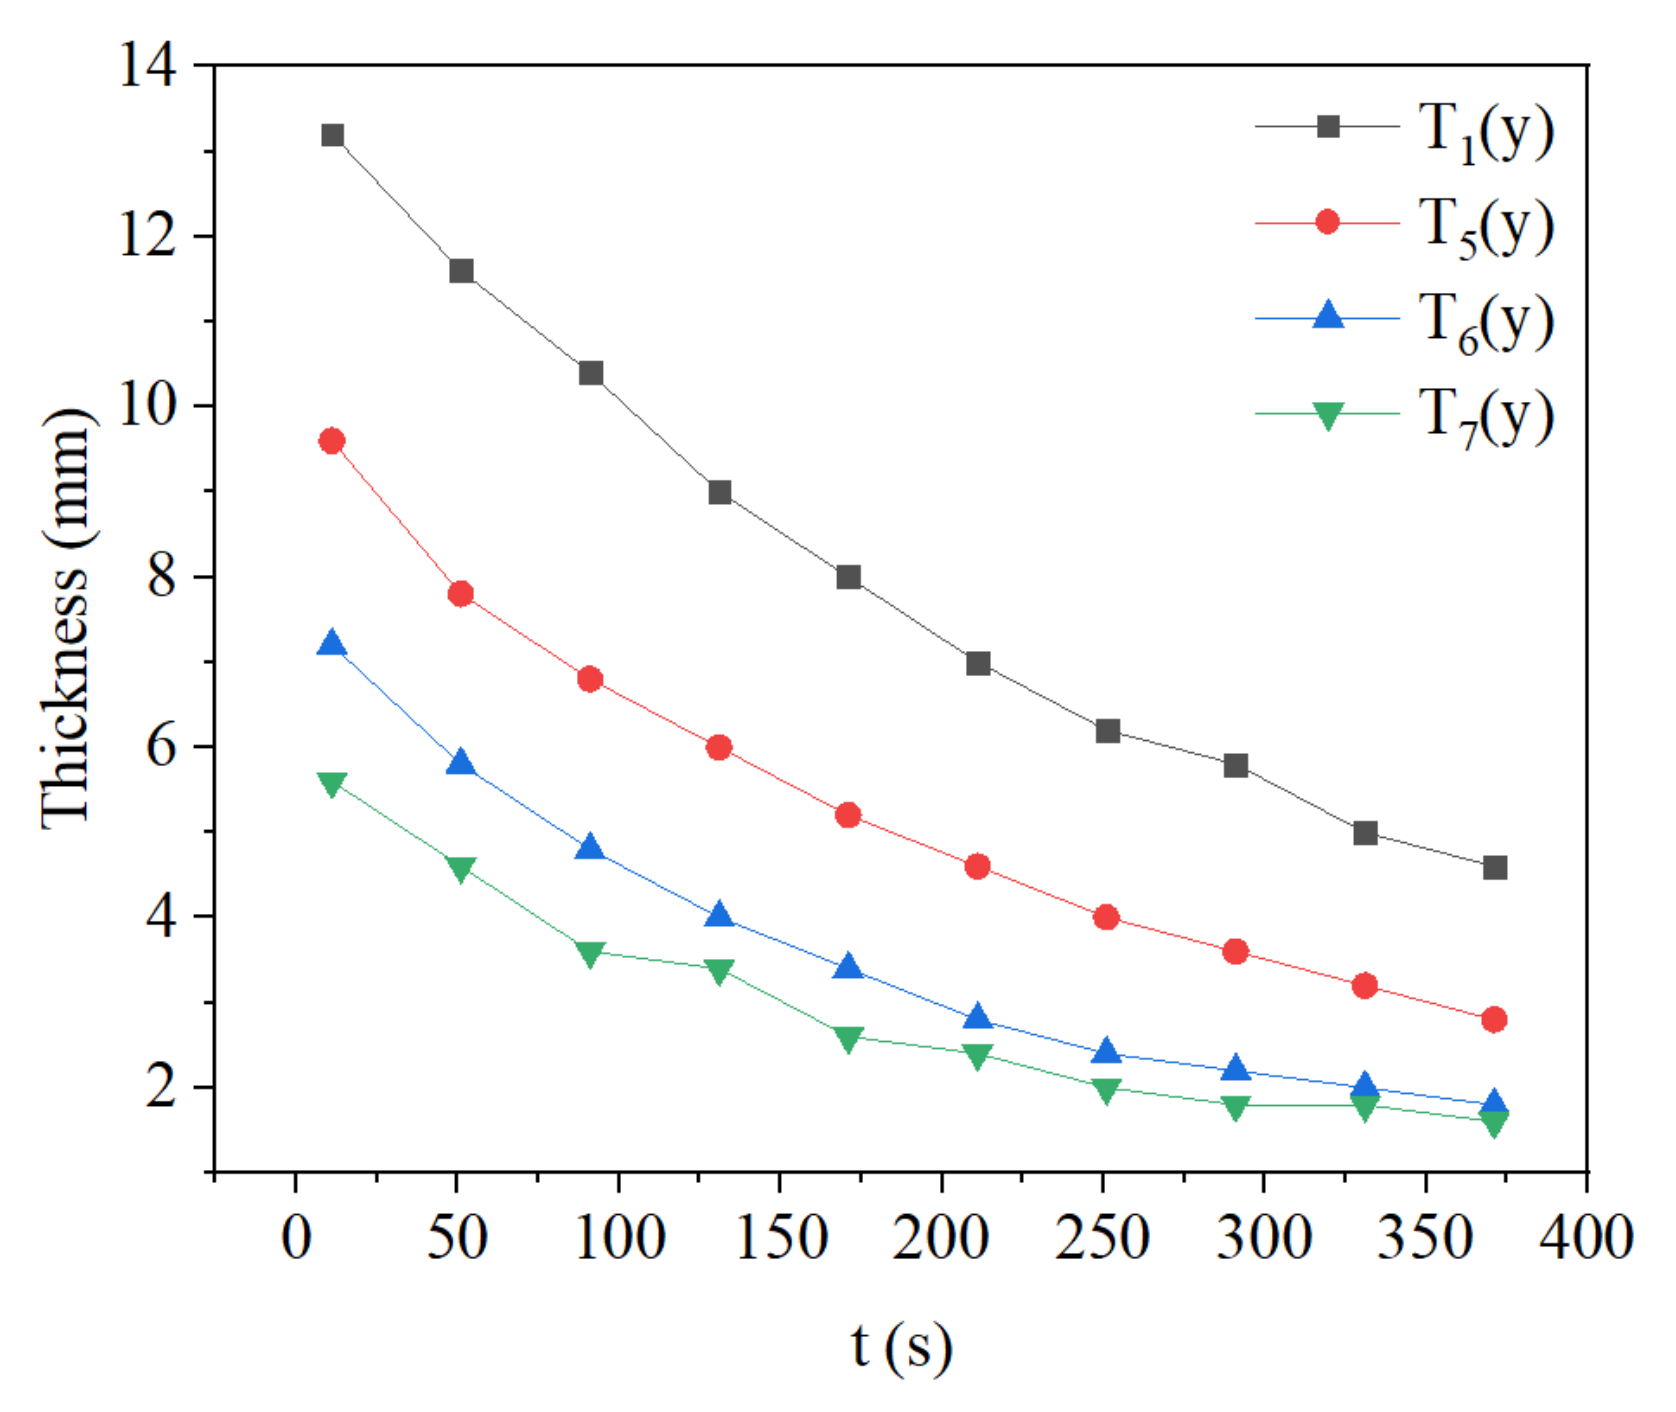
Figure 12 (Parameter Settings for the simulation in the figure can be found in Table 3.) shows the flame thickness changes with time at different concentrations of the mixture with a flow rate of 700 m3/h. The flame thickness is calculated by determining the width of the reaction zone with a reaction rate 95% of the peak reaction rate, as shown in Figure 12b. The calculation method is similar to that of Wang [33] et al., and the flame thickness obtained is millimeter-grade. In Figure 12a, it is found that flame thickness decreases continuously over time, while flame becomes thicker with lower concentrations of the mixture. This is because, at the beginning, the low temperature of the reaction zone leads to a small reaction rate of methane and a long reaction distance. As a result, the flame thickness at the initial moment is relatively thick. With the continuous exothermic reaction of the mixture, the increasing temperature of the reaction zone makes the reaction rate larger and the thickness of the flame become smaller. When the mixture has a low concentration, the reaction rate and the heat released are low. Therefore, the temperature rises slowly and the reaction zone is wide.
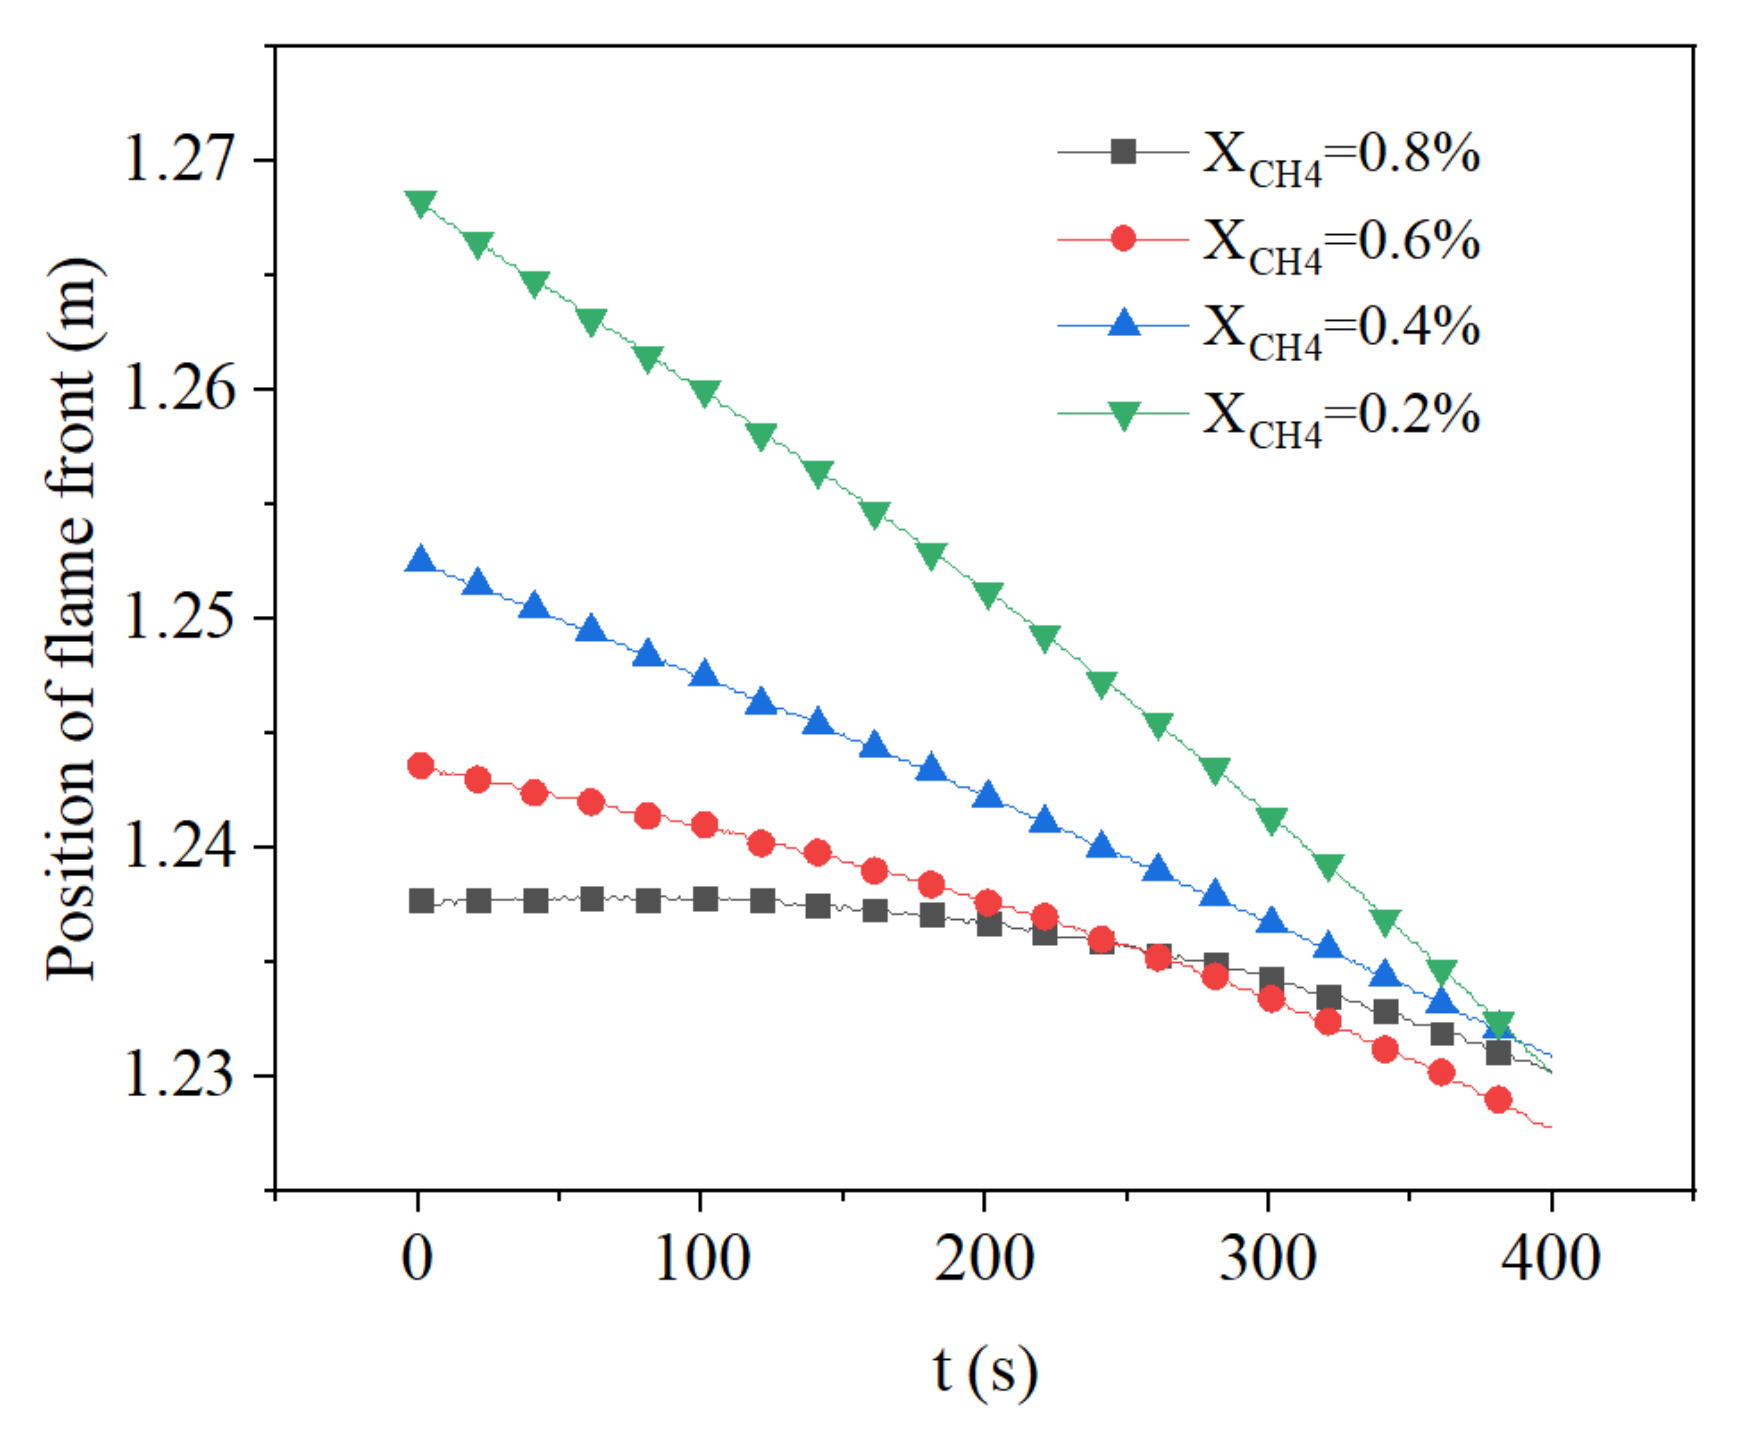
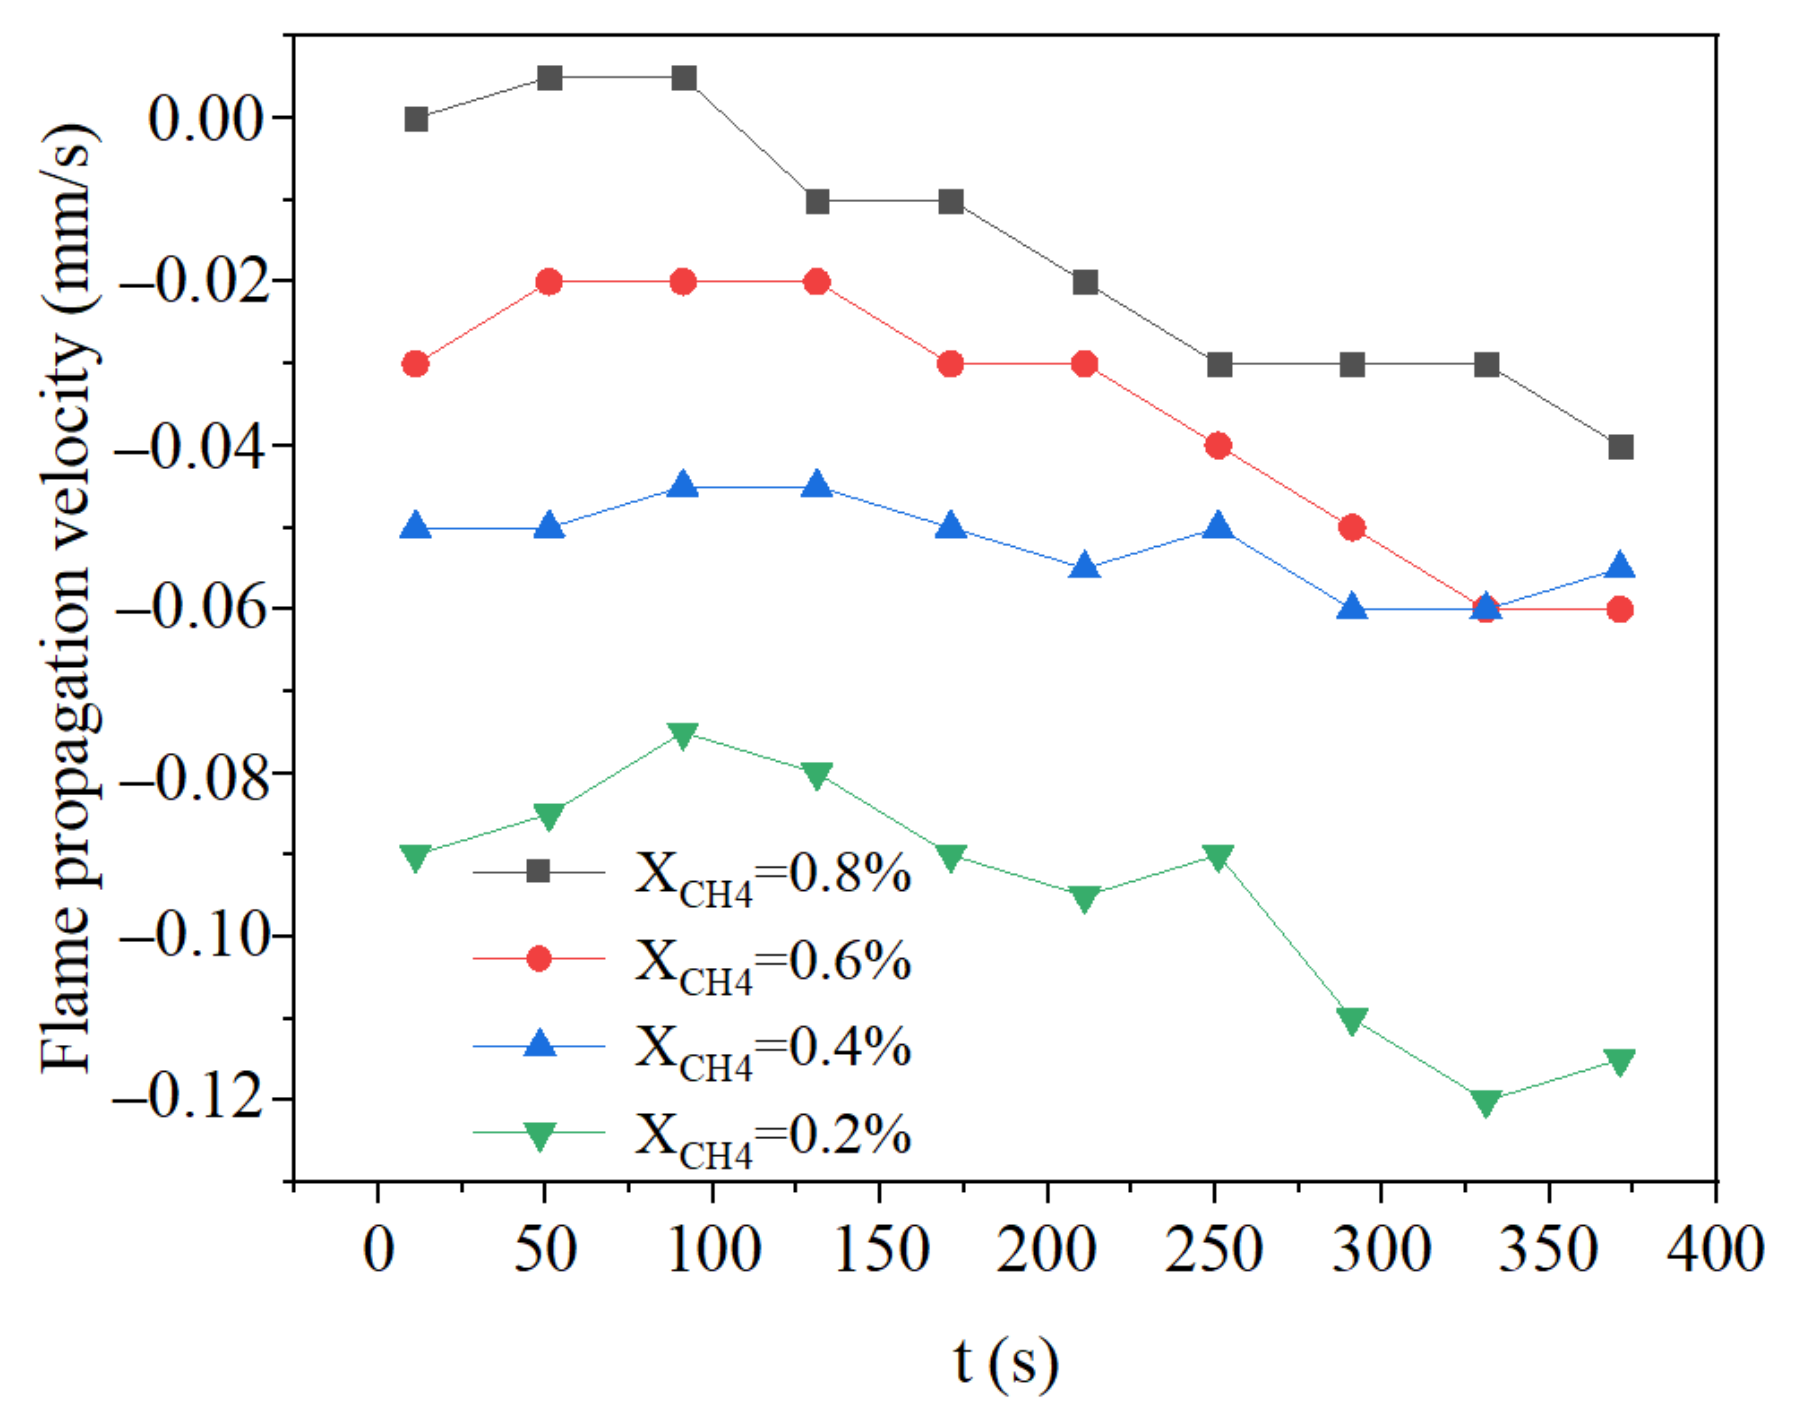
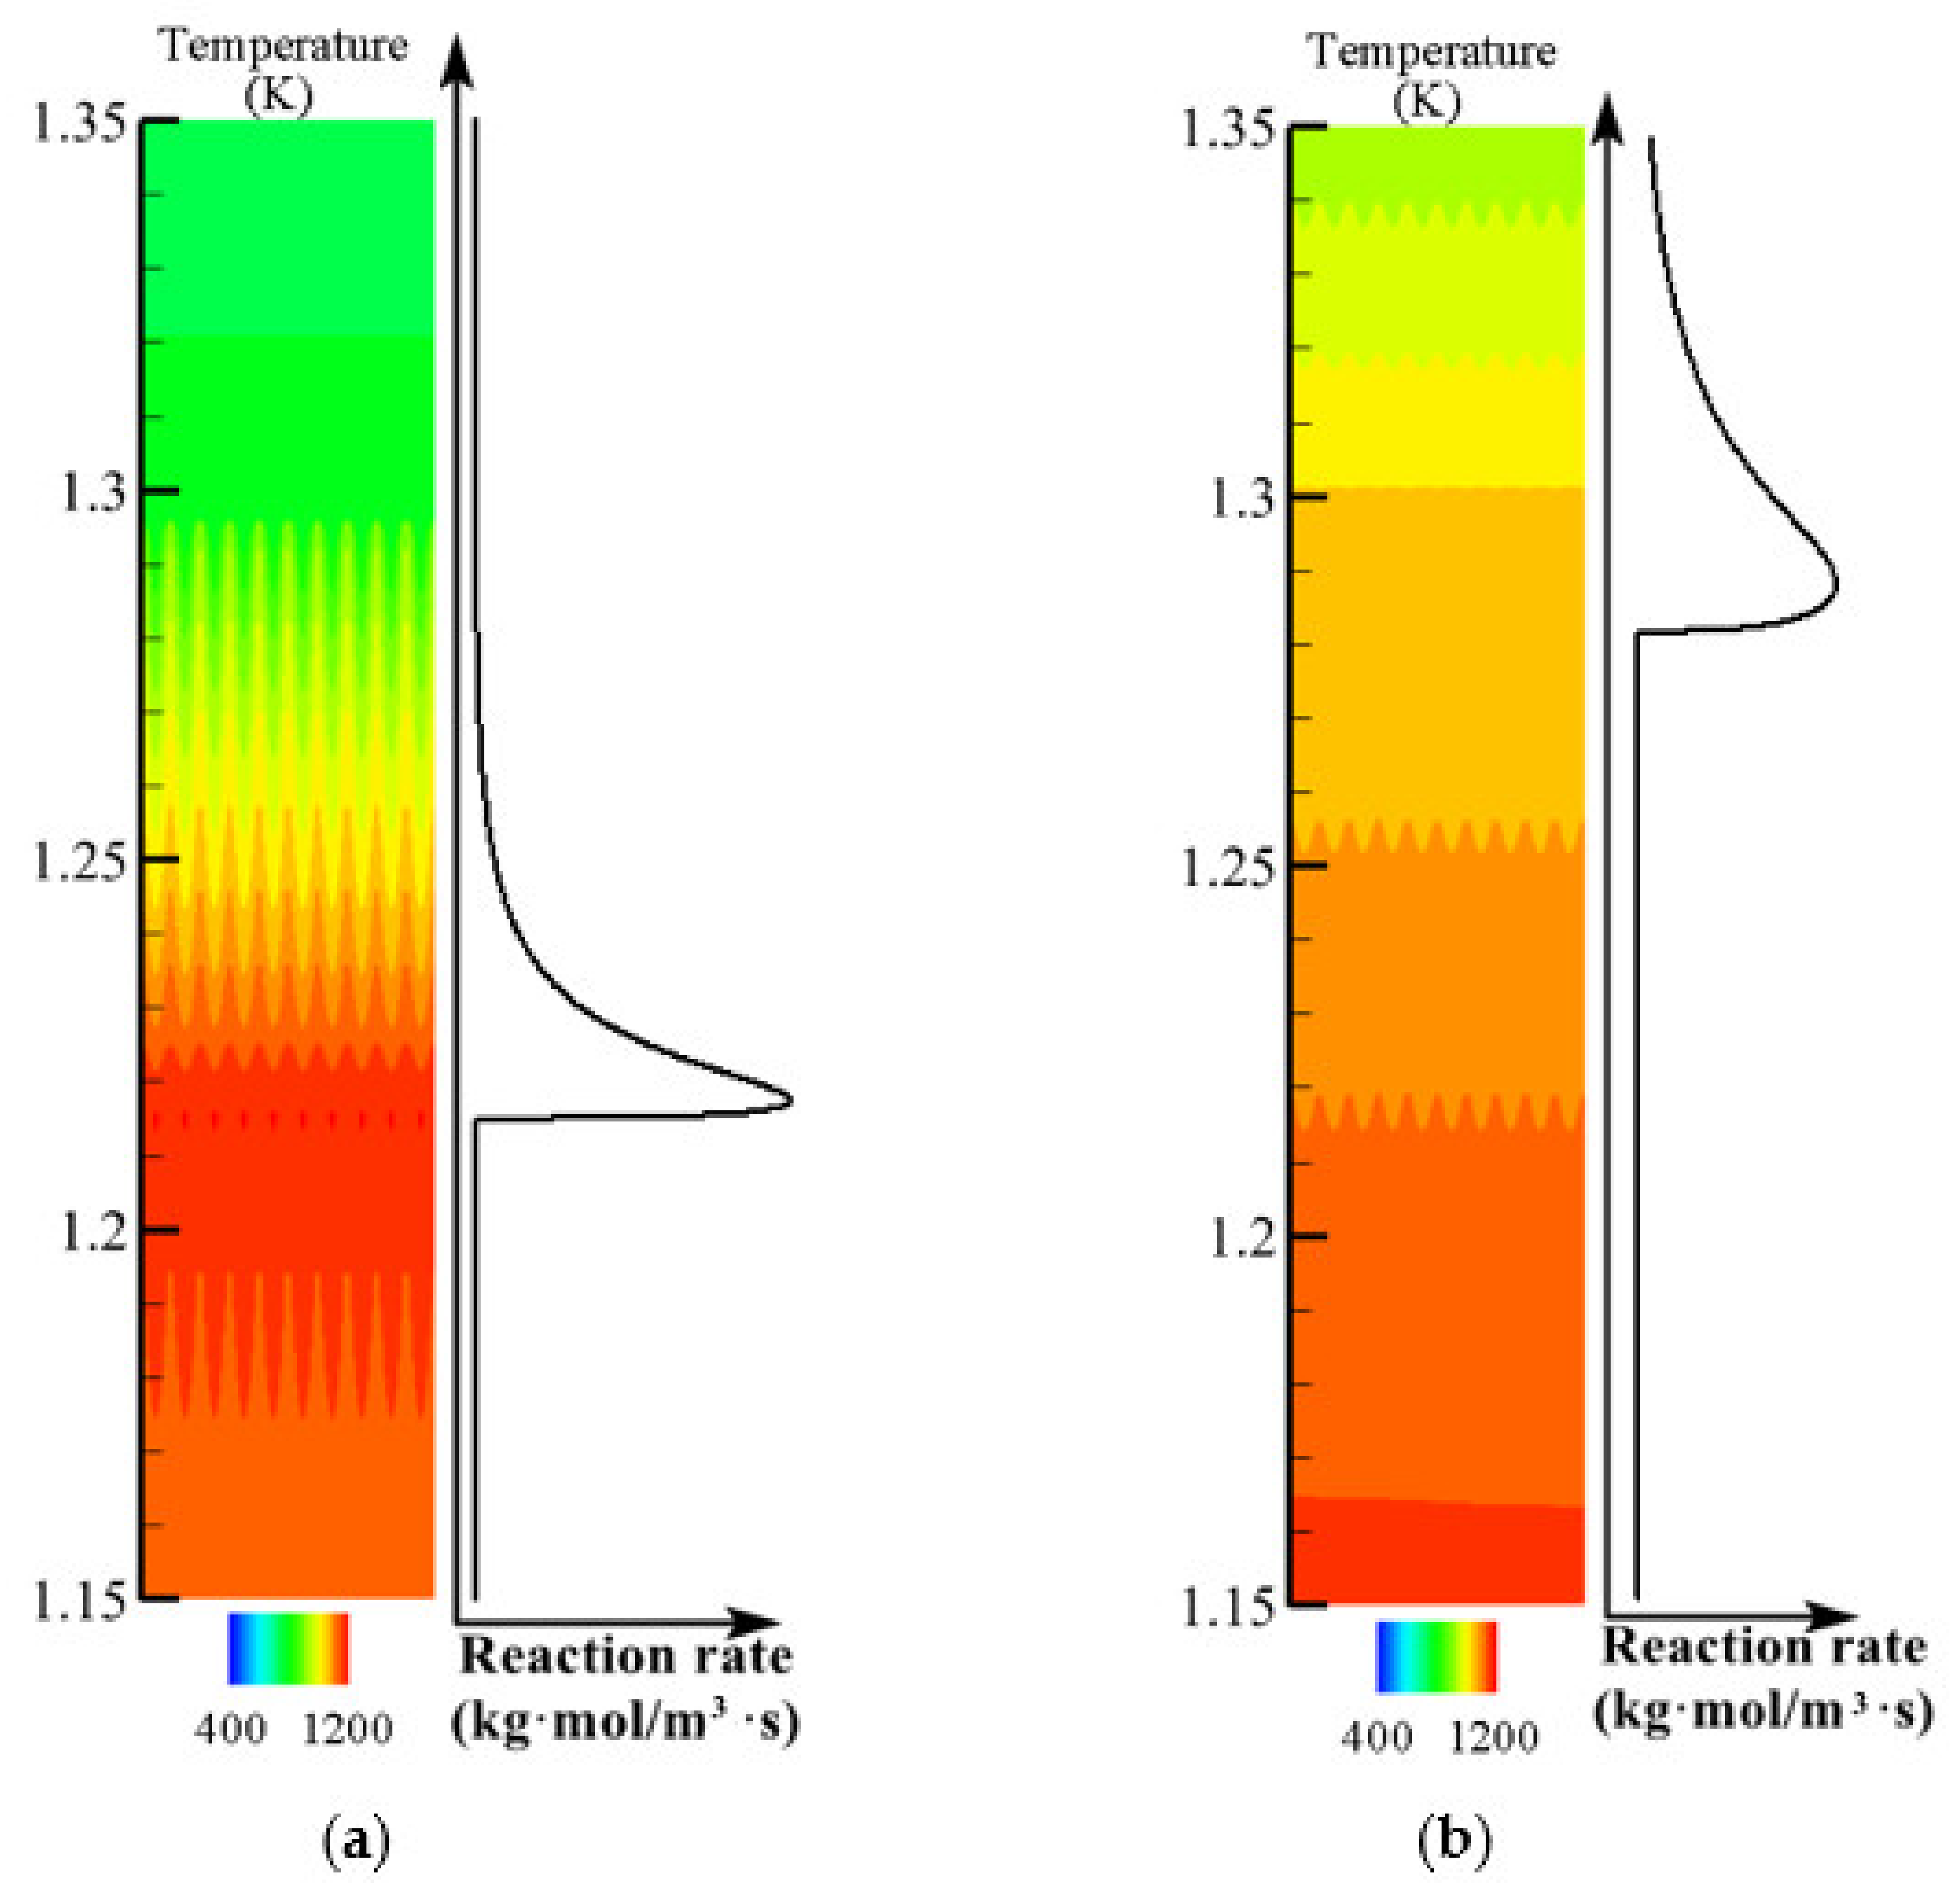
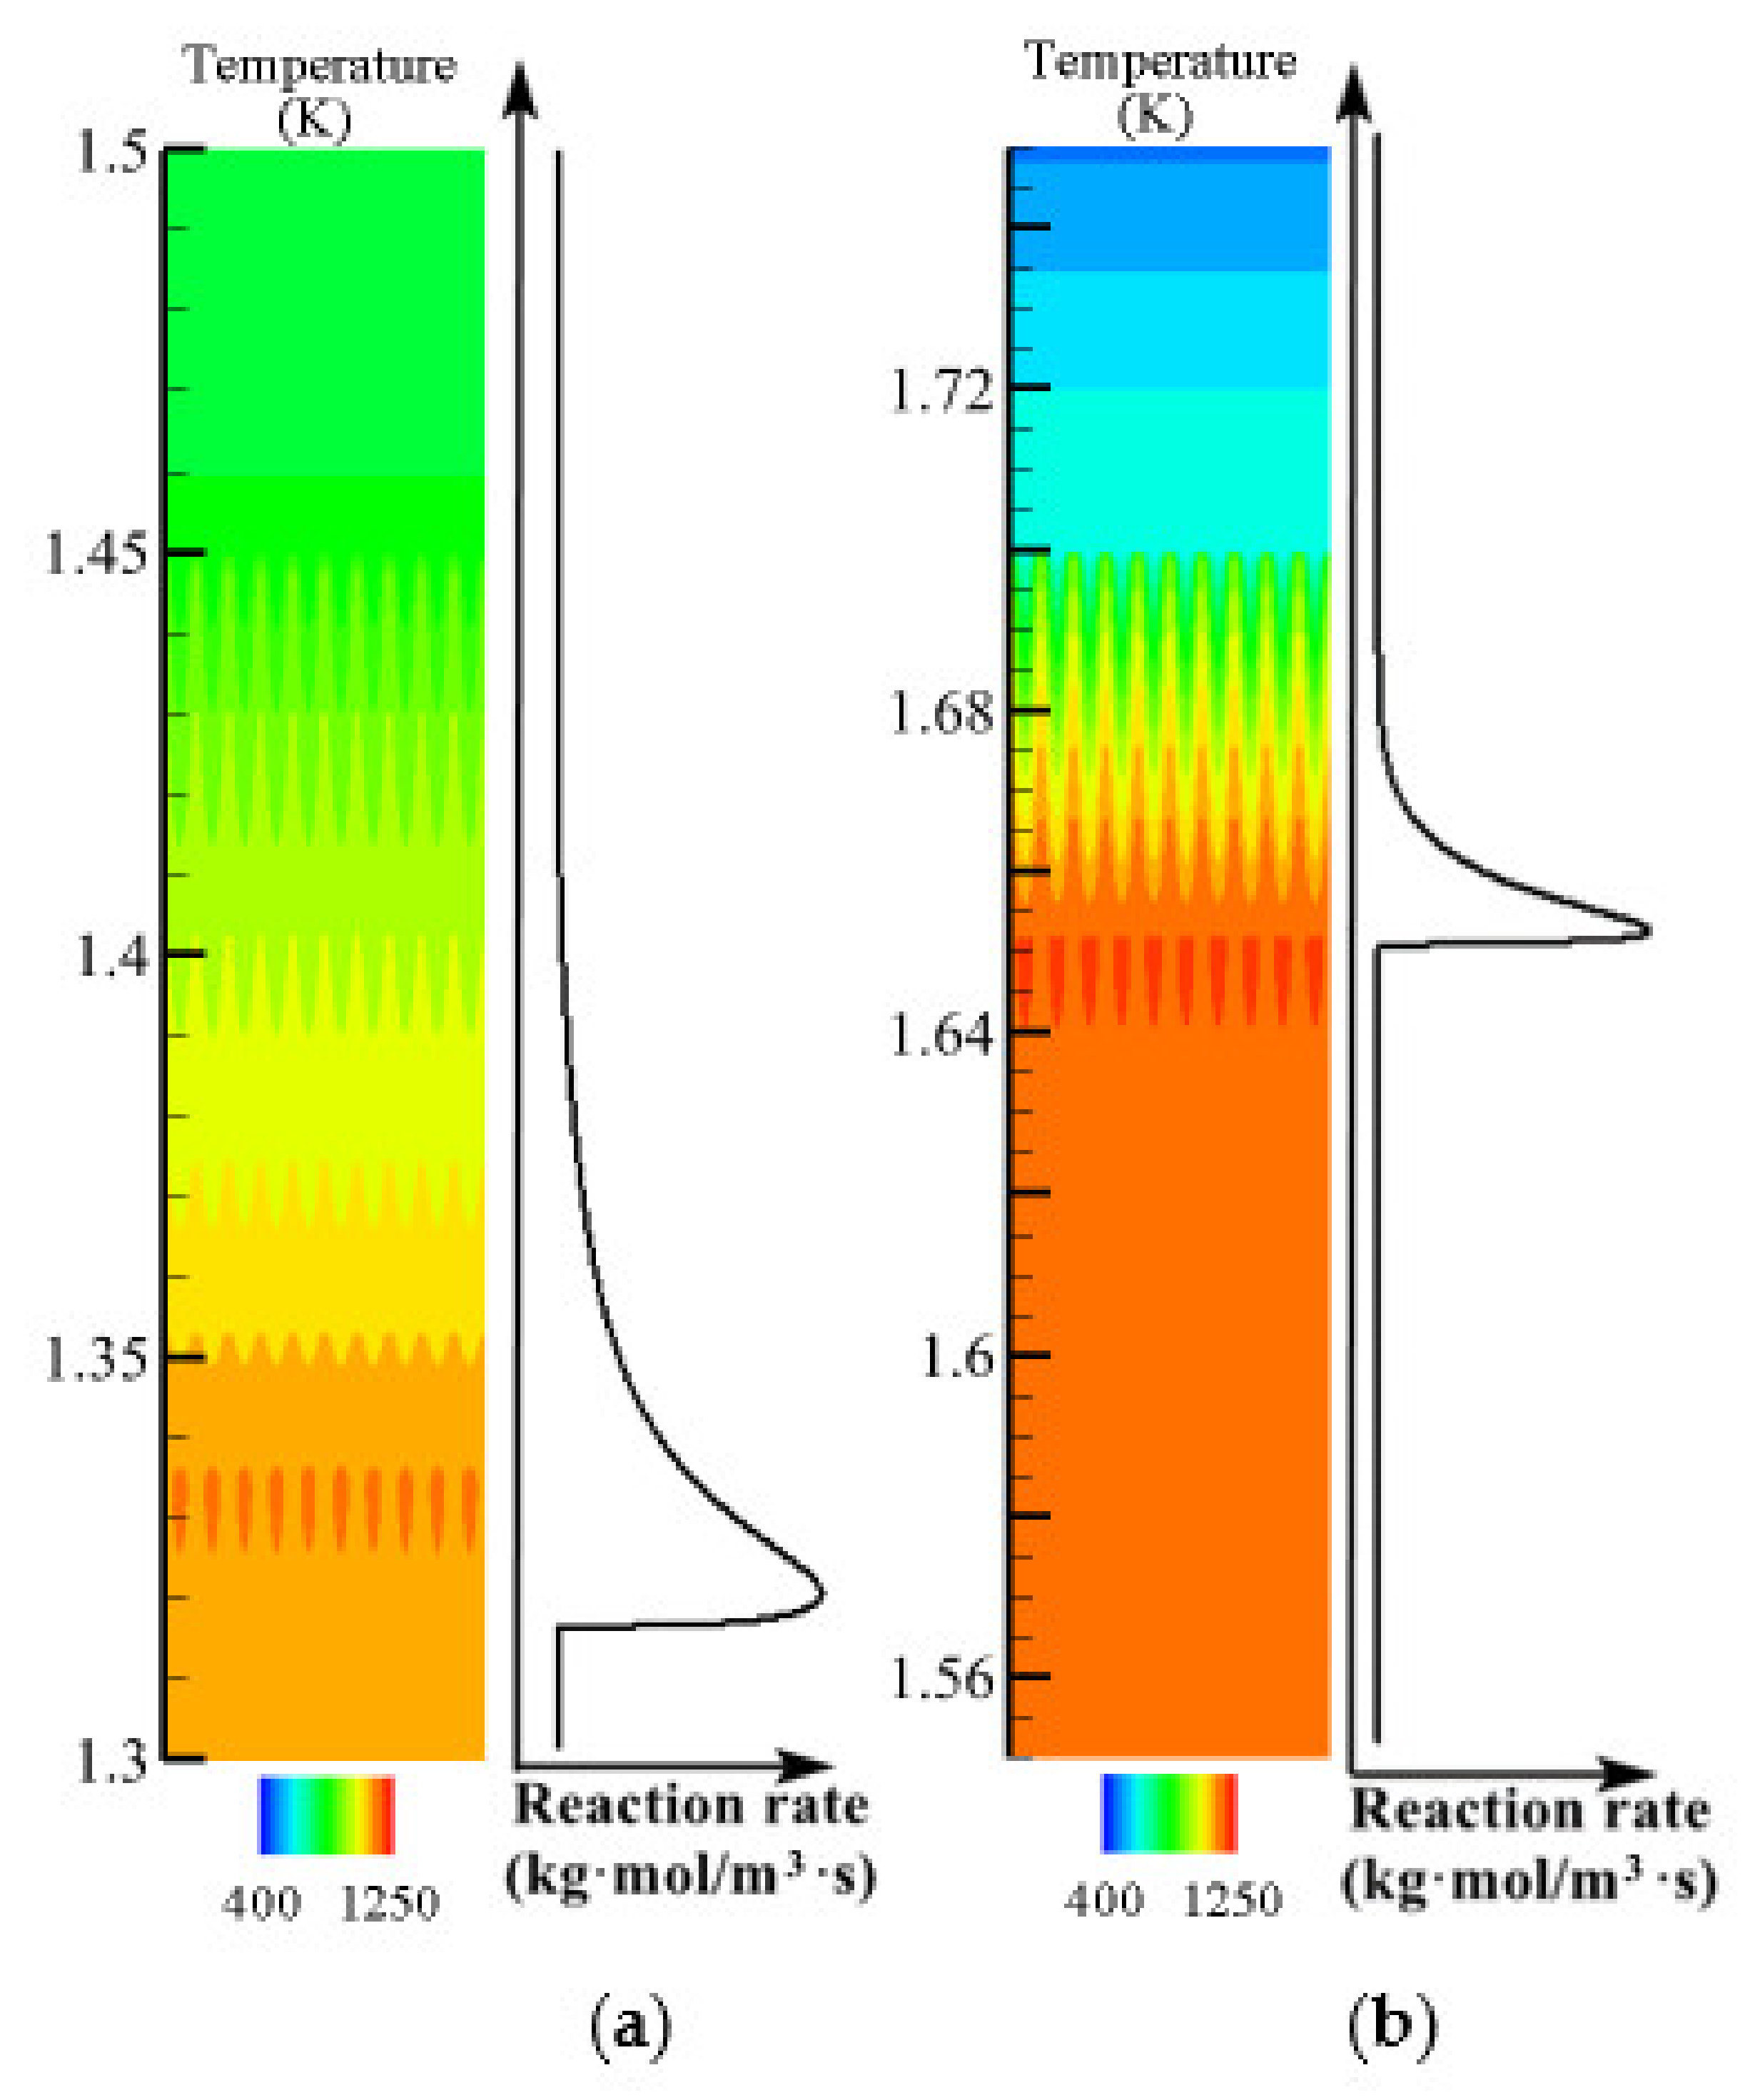
Figure 13 and Figure 14 respectively show the flame position variation and flame propagation velocity at different concentrations of mixture with a flow rate of 700 m3/h. Here, the flame position is indicated by the position of the peak reaction rate, and the flame propagation velocity is calculated with the average value over 20 s. The flow direction of the mixture is the negative direction of the Y-axis. Thus, the continuous decrease of the flame position and the negative value of the flame propagation rate indicates that the flame is propagating downward. It can be seen from Figure 13 the flame is further upstream and propagates faster with lower inlet concentration. This is because the total amount of methane is smaller at a lower concentration of the mixture, and the reaction is completed sooner. Due to the low concentration of the mixture, the reaction rate and the heat generated are low. Therefore, it is necessary to continuously absorb heat from the honeycomb ceramic. As the heat absorbed is greater than the heat released, the flame continuously moves to the high-temperature zone (temperature higher than 900 °C area) downstream to maintain combustion. The reaction released heat is lower with lower concentrations, therefore the flame propagates faster to the high-temperature zone. As can be seen from Figure 14, the flame propagation velocity gets faster with time. This is because the temperature in the reaction zone rises with downward propagation of the flame (as shown in Figure 15) which leads to the expansion and acceleration of the gas flow rate.

3.4. Effect of Flow Rate on Flame Propagation and Flame Thickness

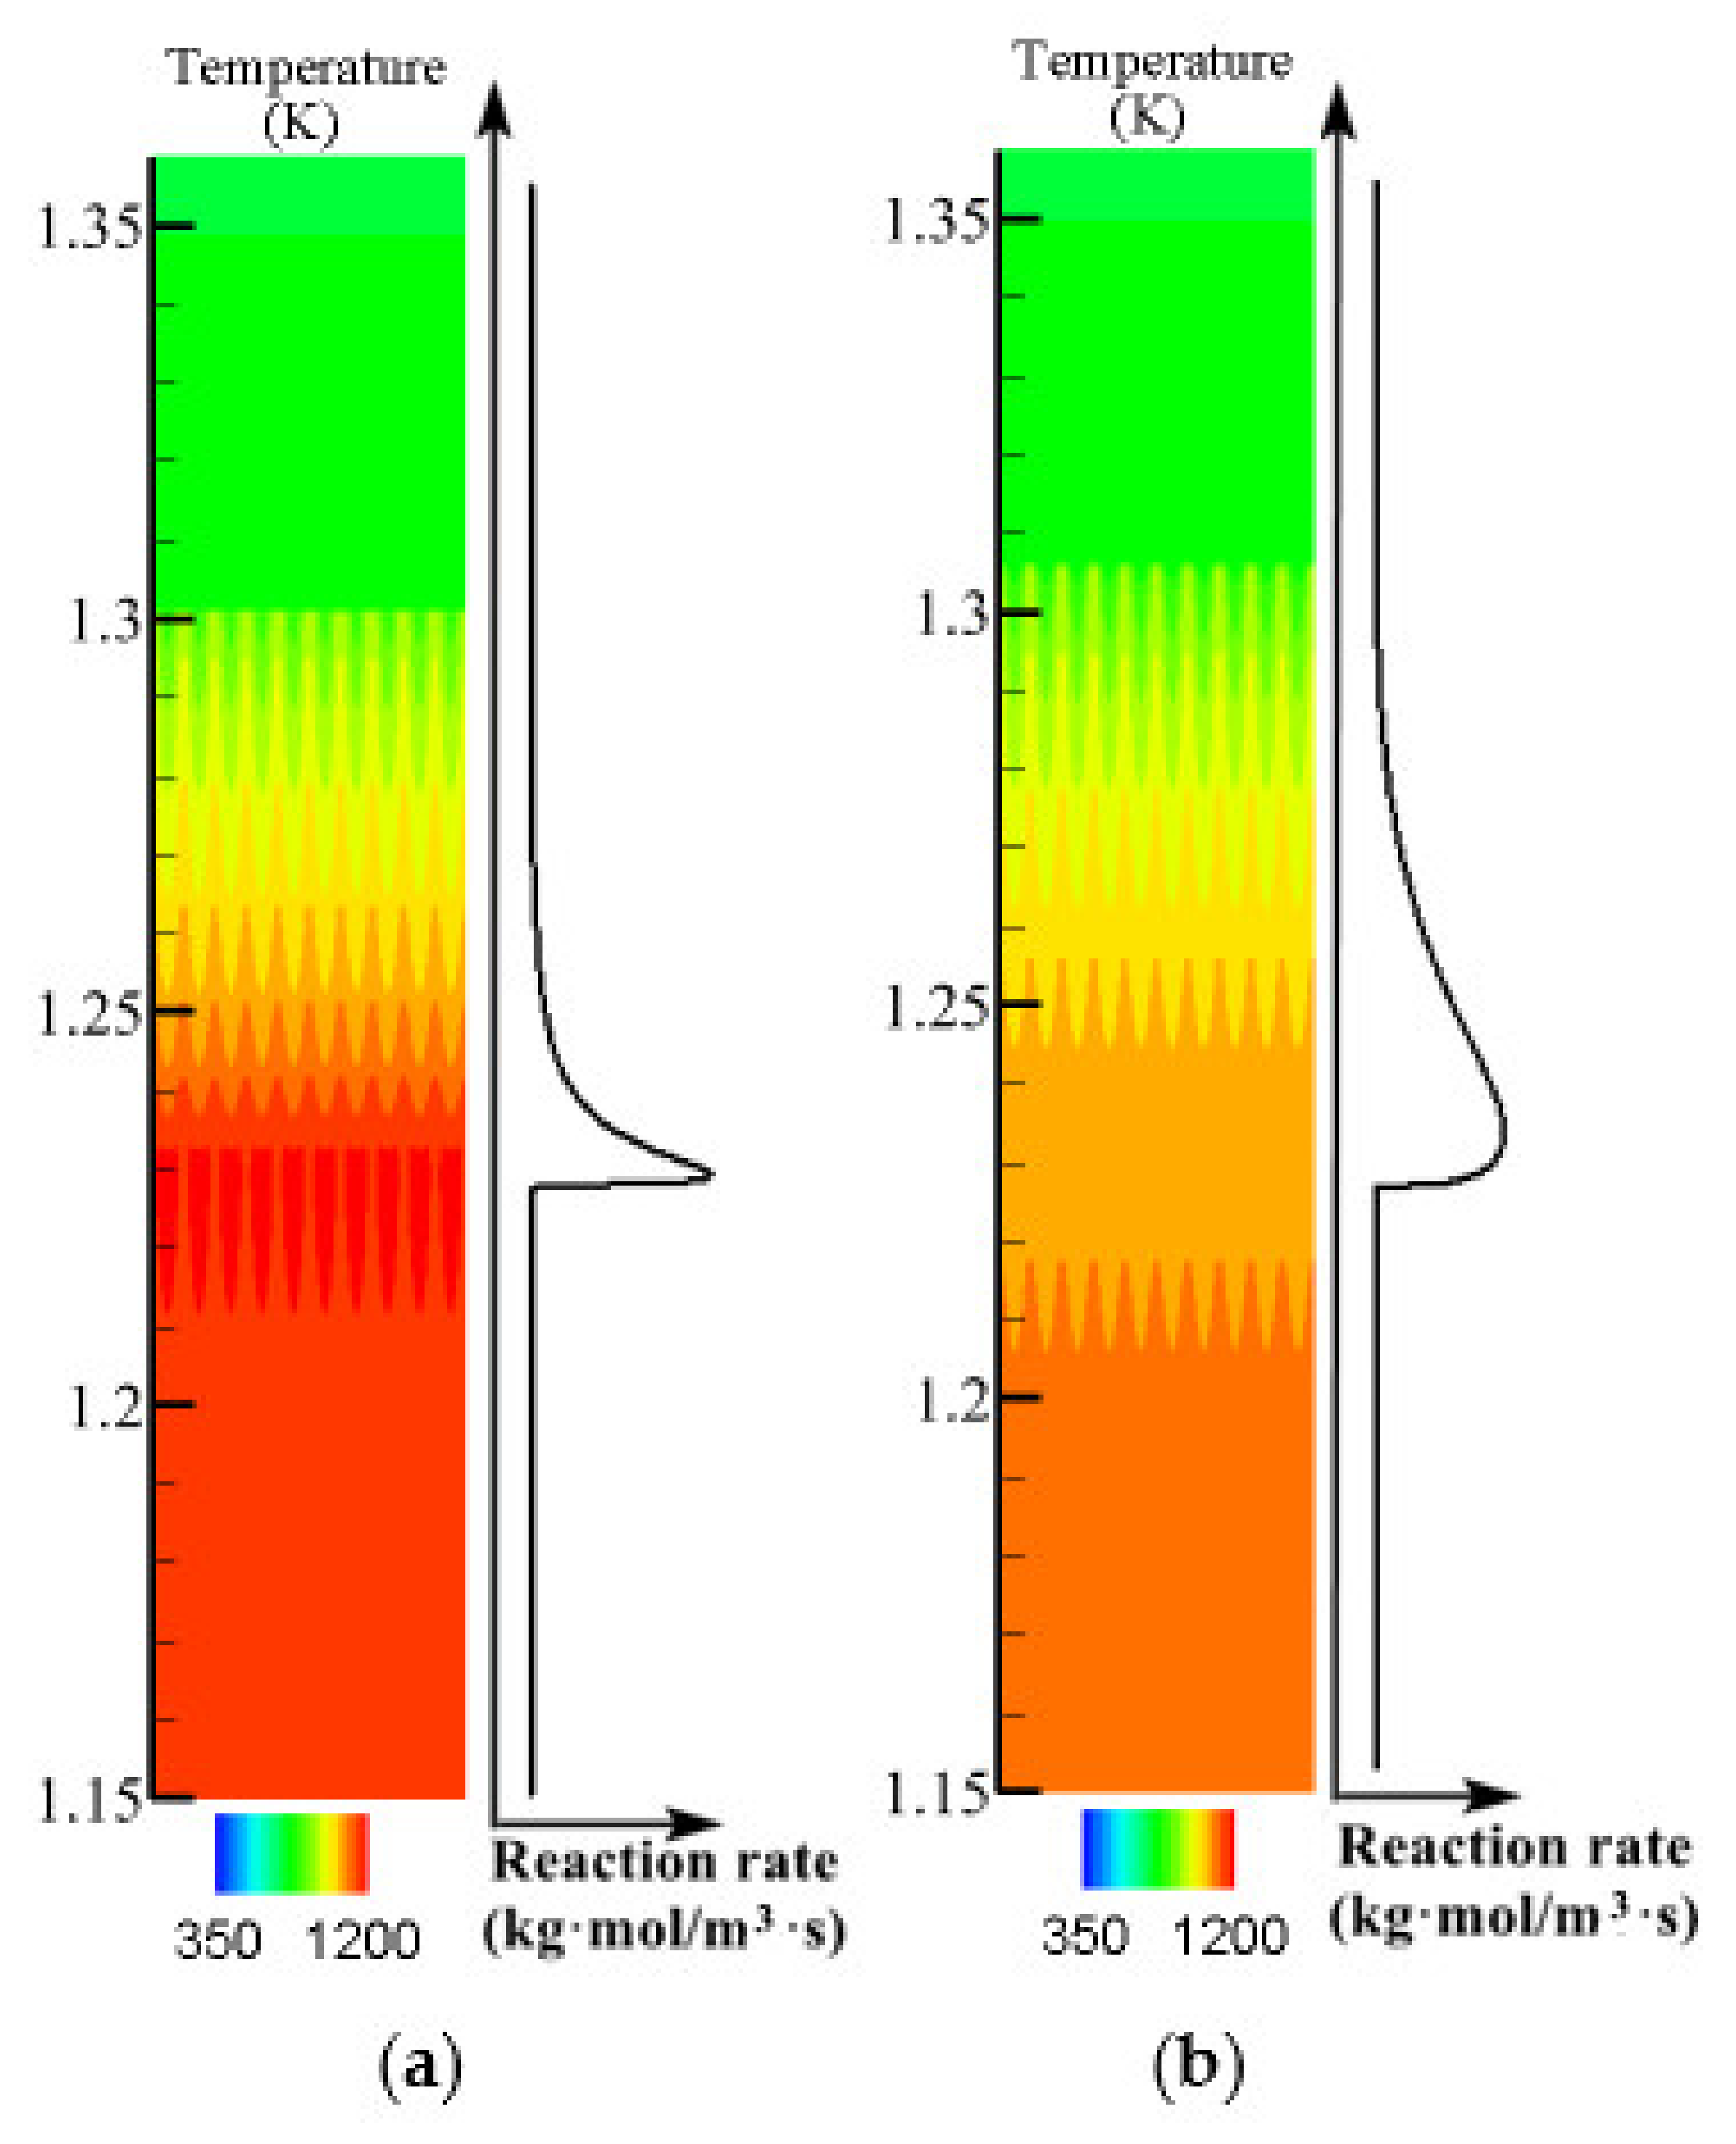
Figure 16 (Parameters are shown in Table 4) indicates the variation law of flame thickness at different inlet flow rates overtime when inlet mixture concentration is 0.6%. It can be seen from Figure 16 that the flame thickness decreases when the inlet flow rate is higher. When the inlet flow increases, the total amount of methane supplied to the reaction zone per unit of time is larger. Then, the heat generated by the reaction is more, so the average temperature in the reaction zone is higher (as shown in Figure 17). This improves the reaction rate and spurs the reaction of methane completed in a narrower reaction zone.
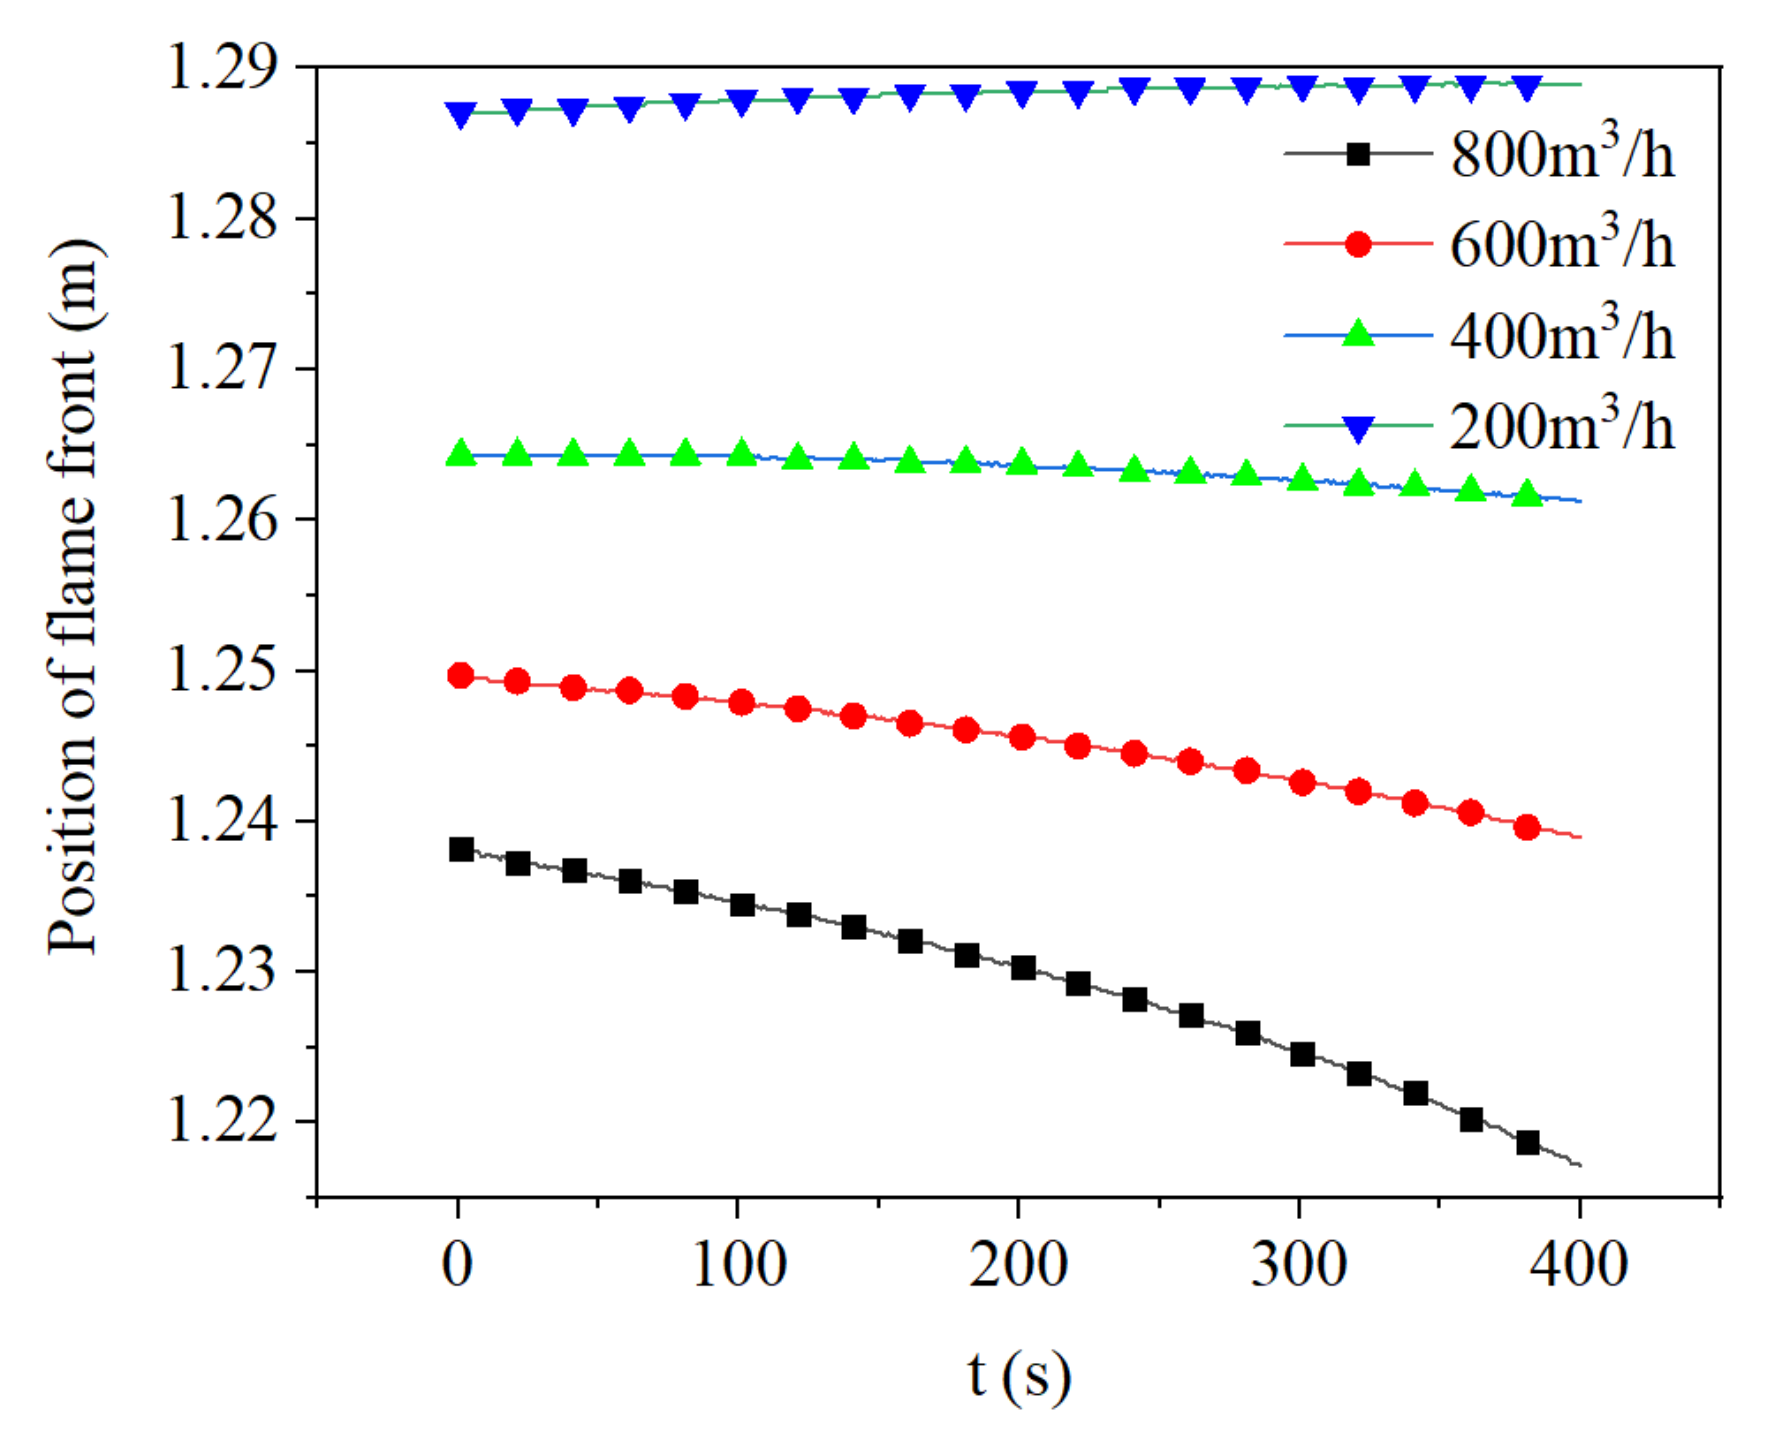
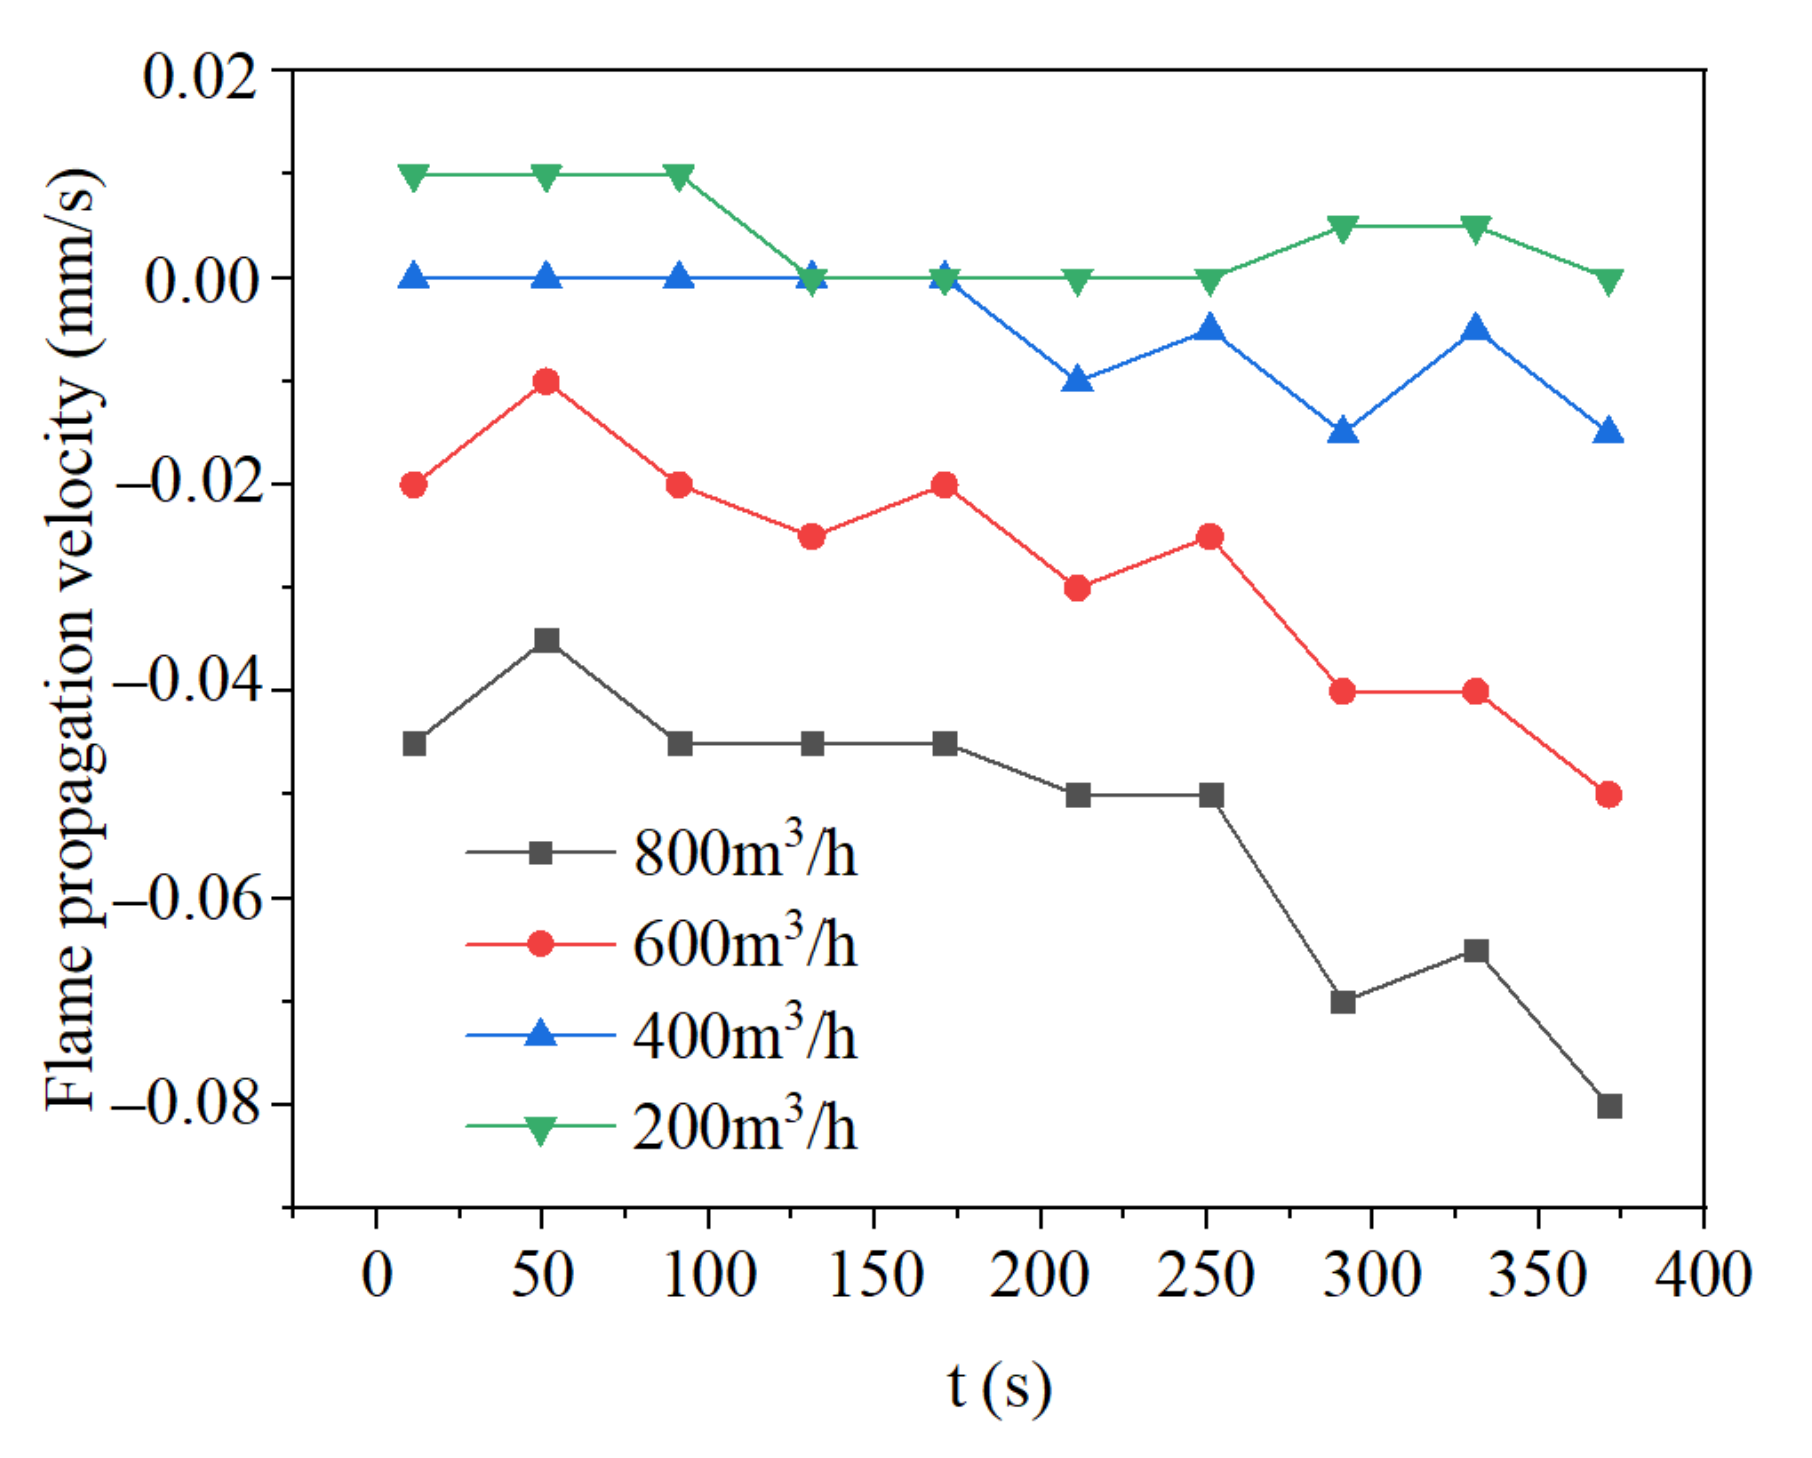
Figure 18 and Figure 19 show the variation of flame front position and flame propagation rate of different inlet flow rates with time when inlet mixture concentration is 0.6%. It can be seen from Figure 18 that higher inlet flow corresponds to the flame front of further downstream position. This is because more mixture is provided to the reaction zone per unit time by the higher inlet flow rate. The more mixture leads that a longer time is needed to warm up the mixture to reaction temperature. Then the reaction zone is further downstream. It can be seen from Figure 19 that the flame propagation velocity increases at a higher inlet flow rate. This is because the flow rate exceeds the reaction rate and the flame propagates downstream faster.

3.5. Effect of Initial Temperature Field on Flame Propagation and Flame Thickness

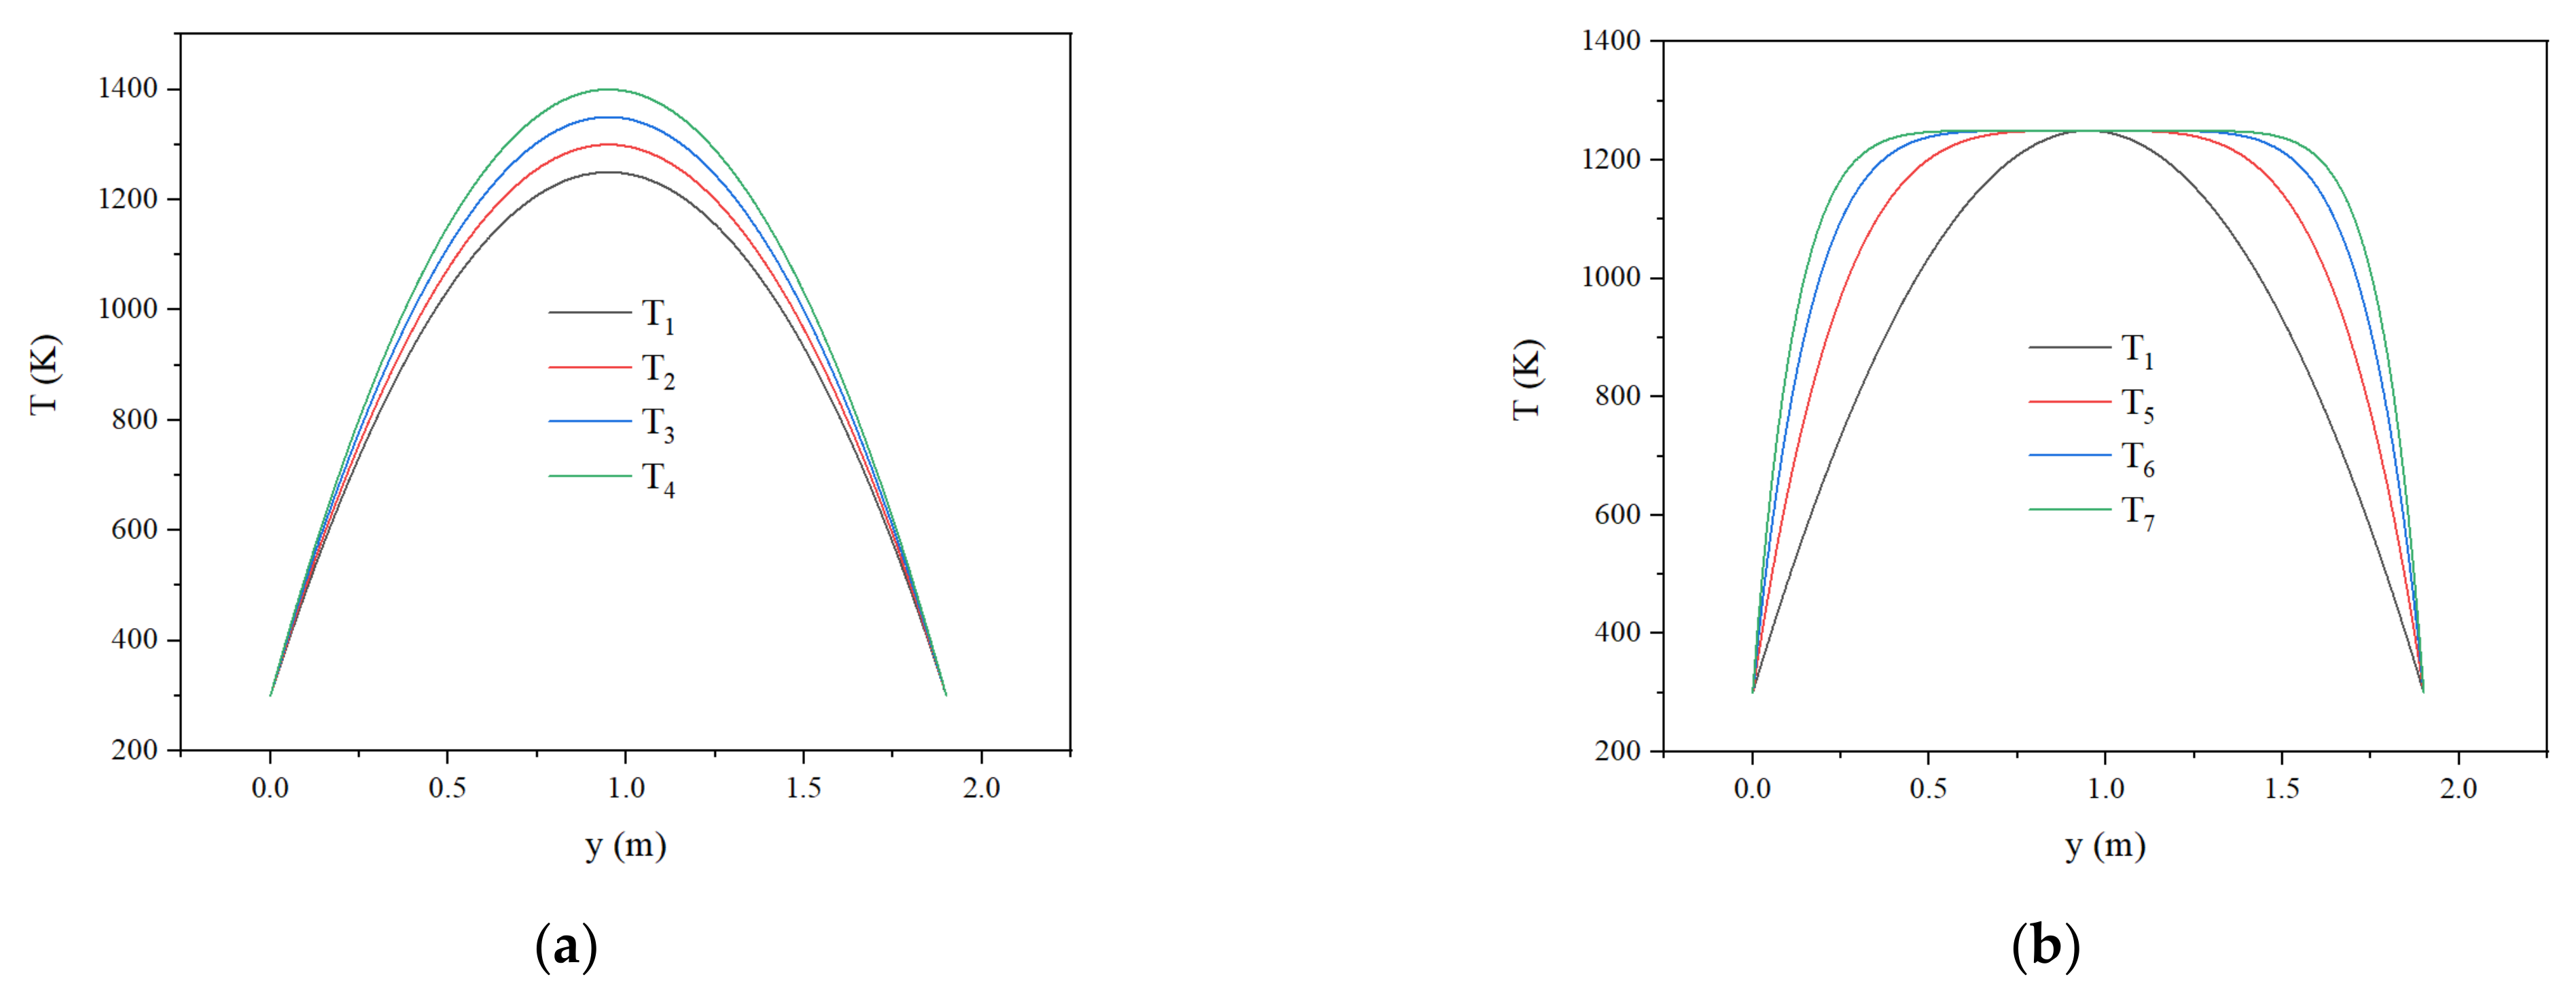
The influence of the peak value and the width of high-temperature zone of initial temperature field on flame propagation and flame thickness are studied respectively. In order to facilitate the study, seven temperature curves are fitted by the following formulas.
T A ( y ) = ( a 300 ) × ( y 0.95 ) 2 0.9025 + a T B y = 950 × ( y 0.95 ) b 0.95 b + 1250
The fitted temperature field curves are all parabolas. TA(y) is applied for the temperature curve fitting to study the effect of the peak temperature of the initial temperature field on flame propagation and flame thickness. TB(y) is employed for the temperature curve fitting to study the effect of the high-temperature zone width of the initial temperature field. The fitted temperature curves are shown in Figure 20, where T1, T2, T3, and T4 correspond to the temperature curves with a = 1250, 1300, 1350, 1400 in TA(y) respectively, and T5, T6, and T7 correspond to the temperature curves with b = 4, 6, 8 in TB(y) respectively.
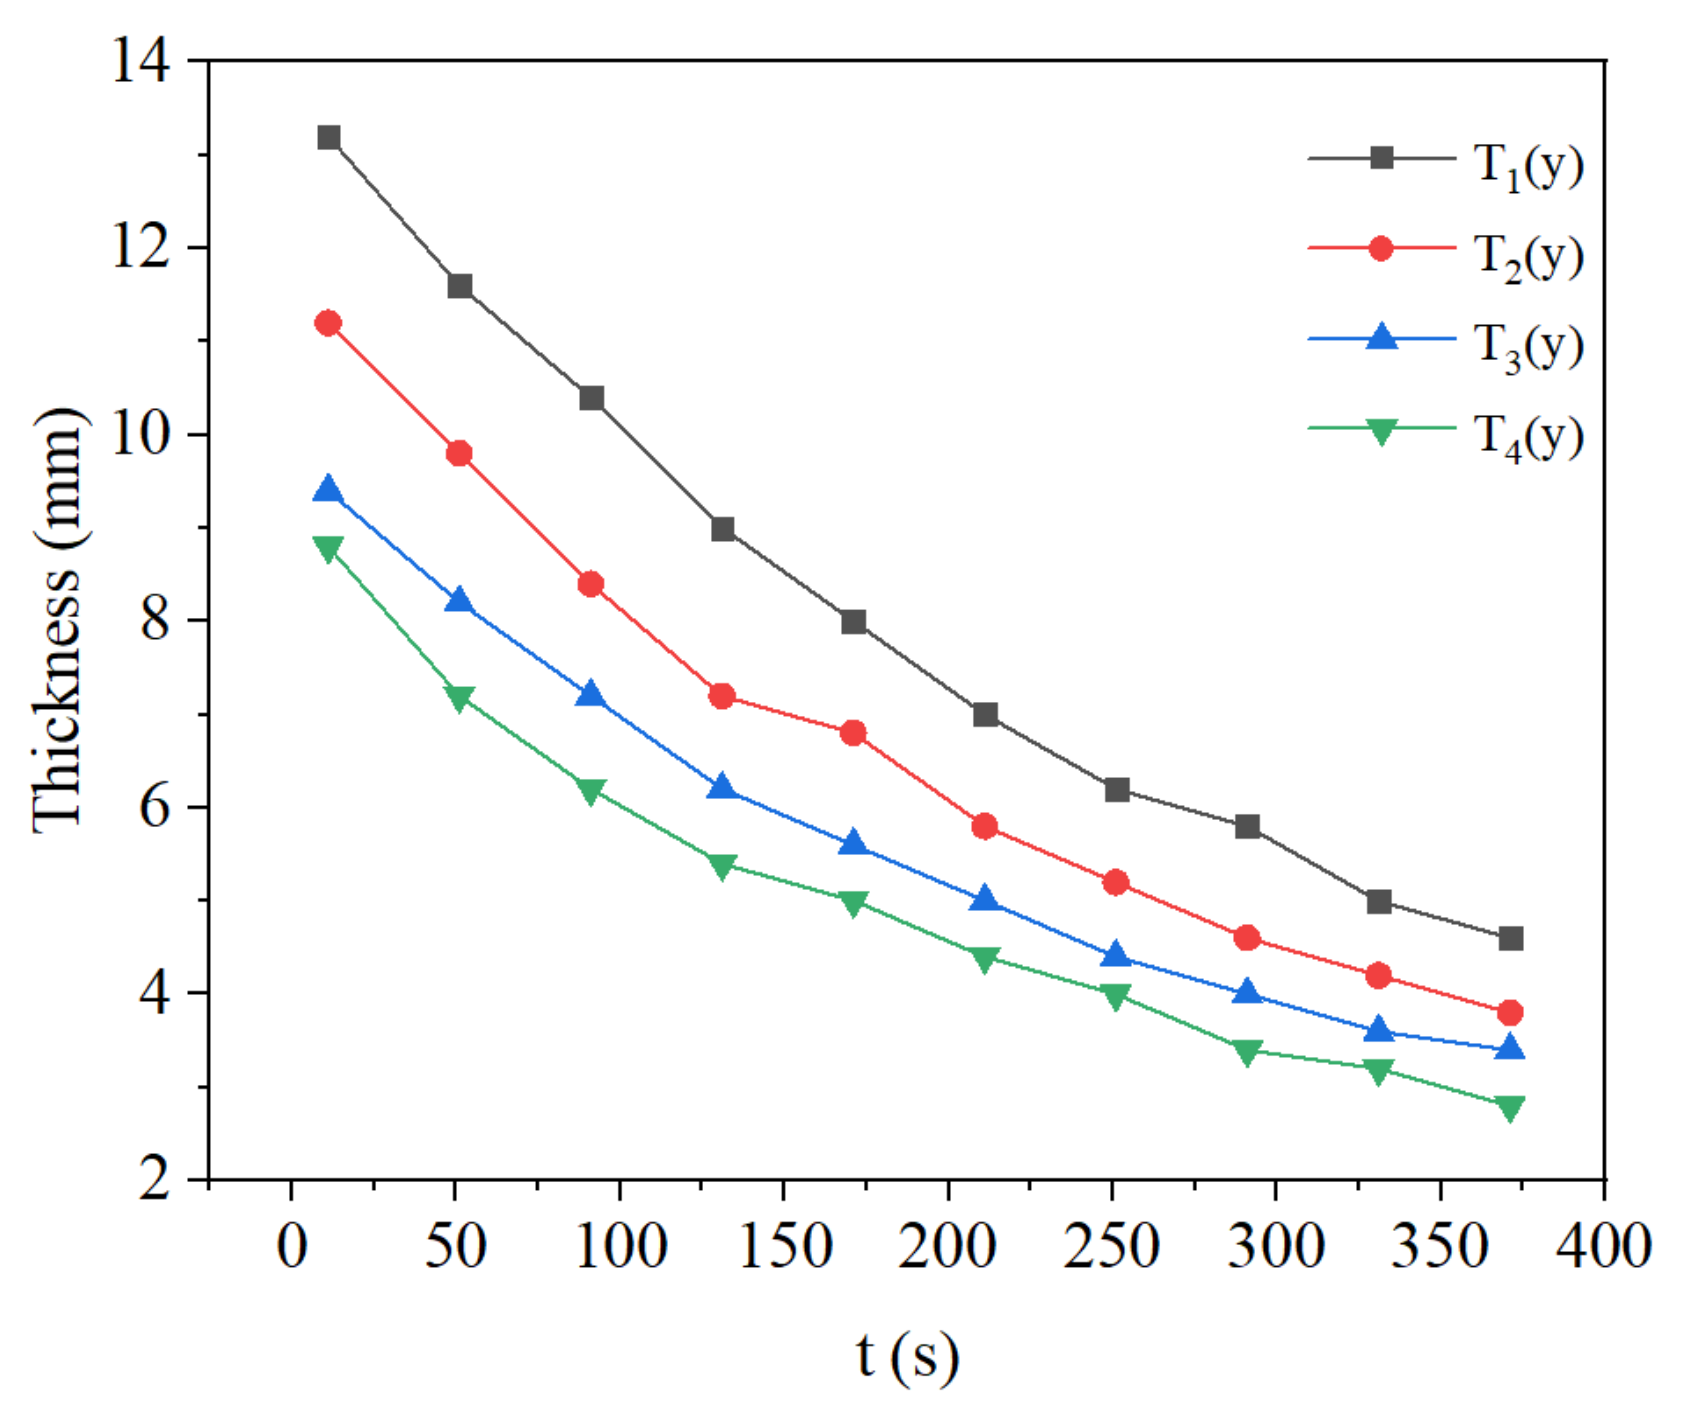
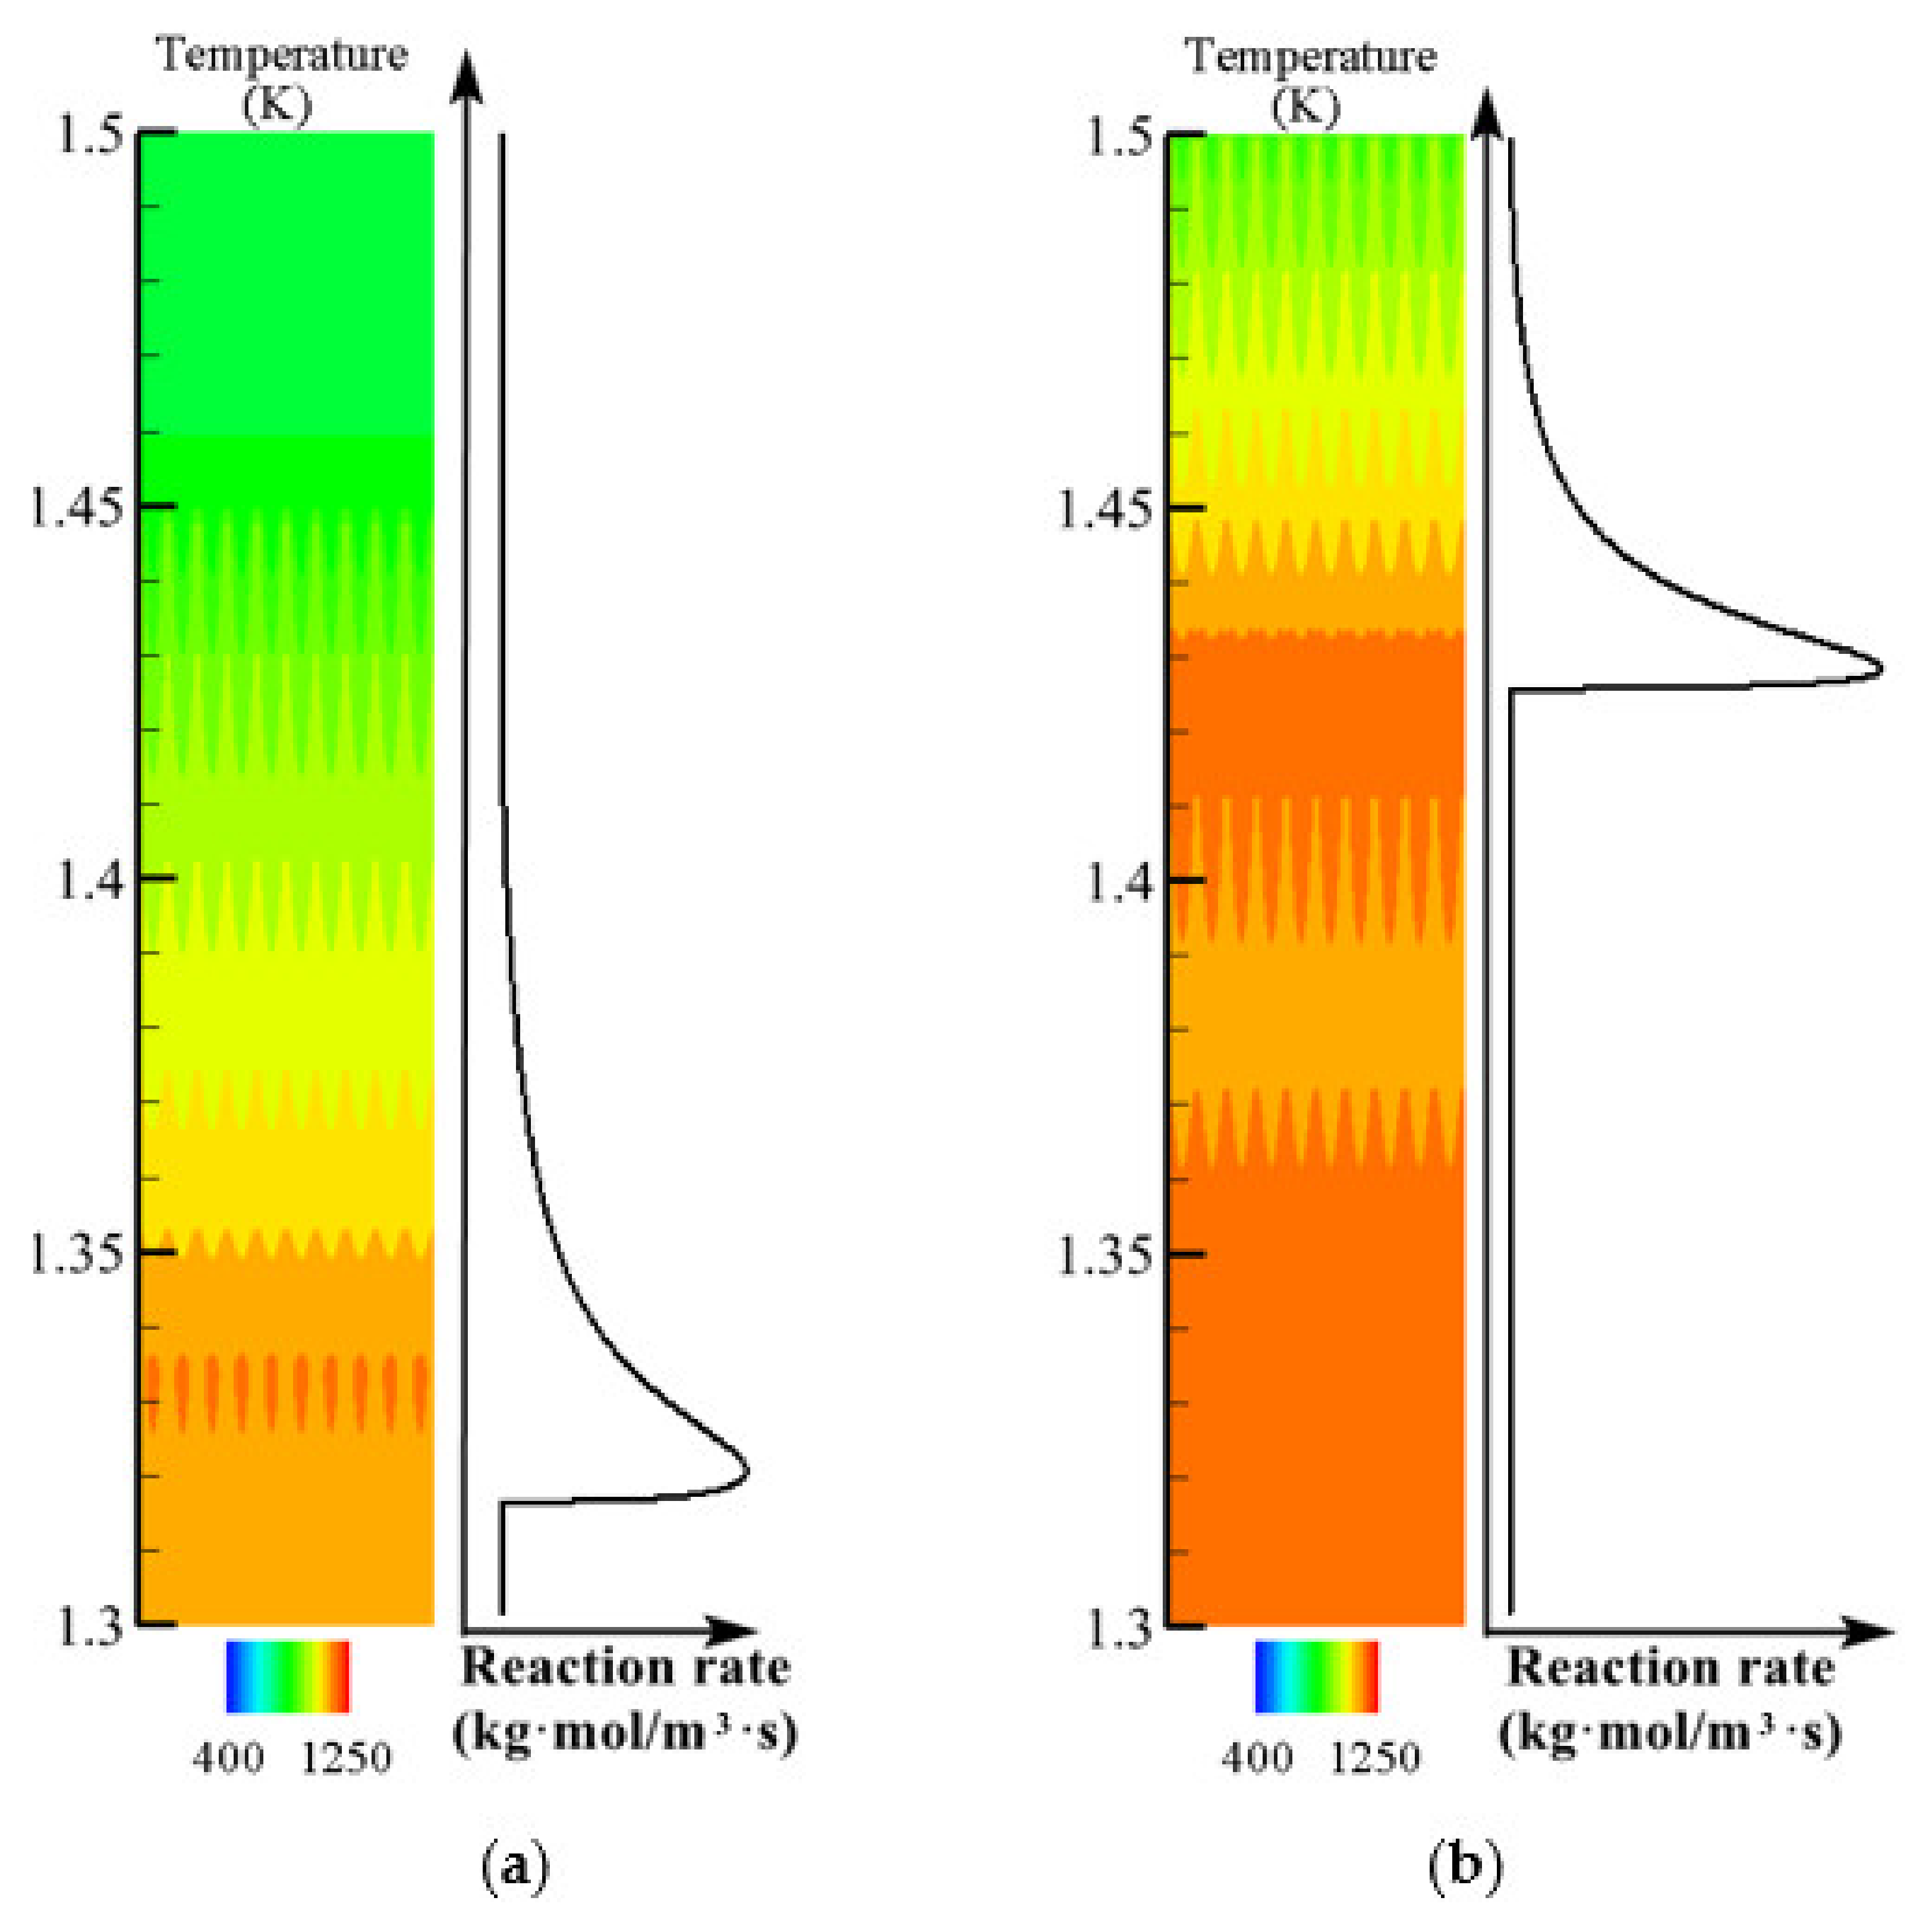
Figure 21 (Parameter Settings for the simulation in the figure can be found in Table 5.) shows the variation of flame thickness with time using the initial temperature field with different peak values when the inlet flow rate is 700 m3/h and the inlet methane volume fraction is 0.6%. It can be seen from Figure 21 that the flame thickness decreases when the peak of the initial temperature field is larger. When the initial temperature field has a large peak value, the temperature gradient in the reaction zone is relatively large. Large temperature gradient leads to a higher average temperature in the reaction zone (as shown in Figure 22) and increases the reaction rate. Methane can be fully reacted in a shorter distance, so the flame thickness will be smaller.
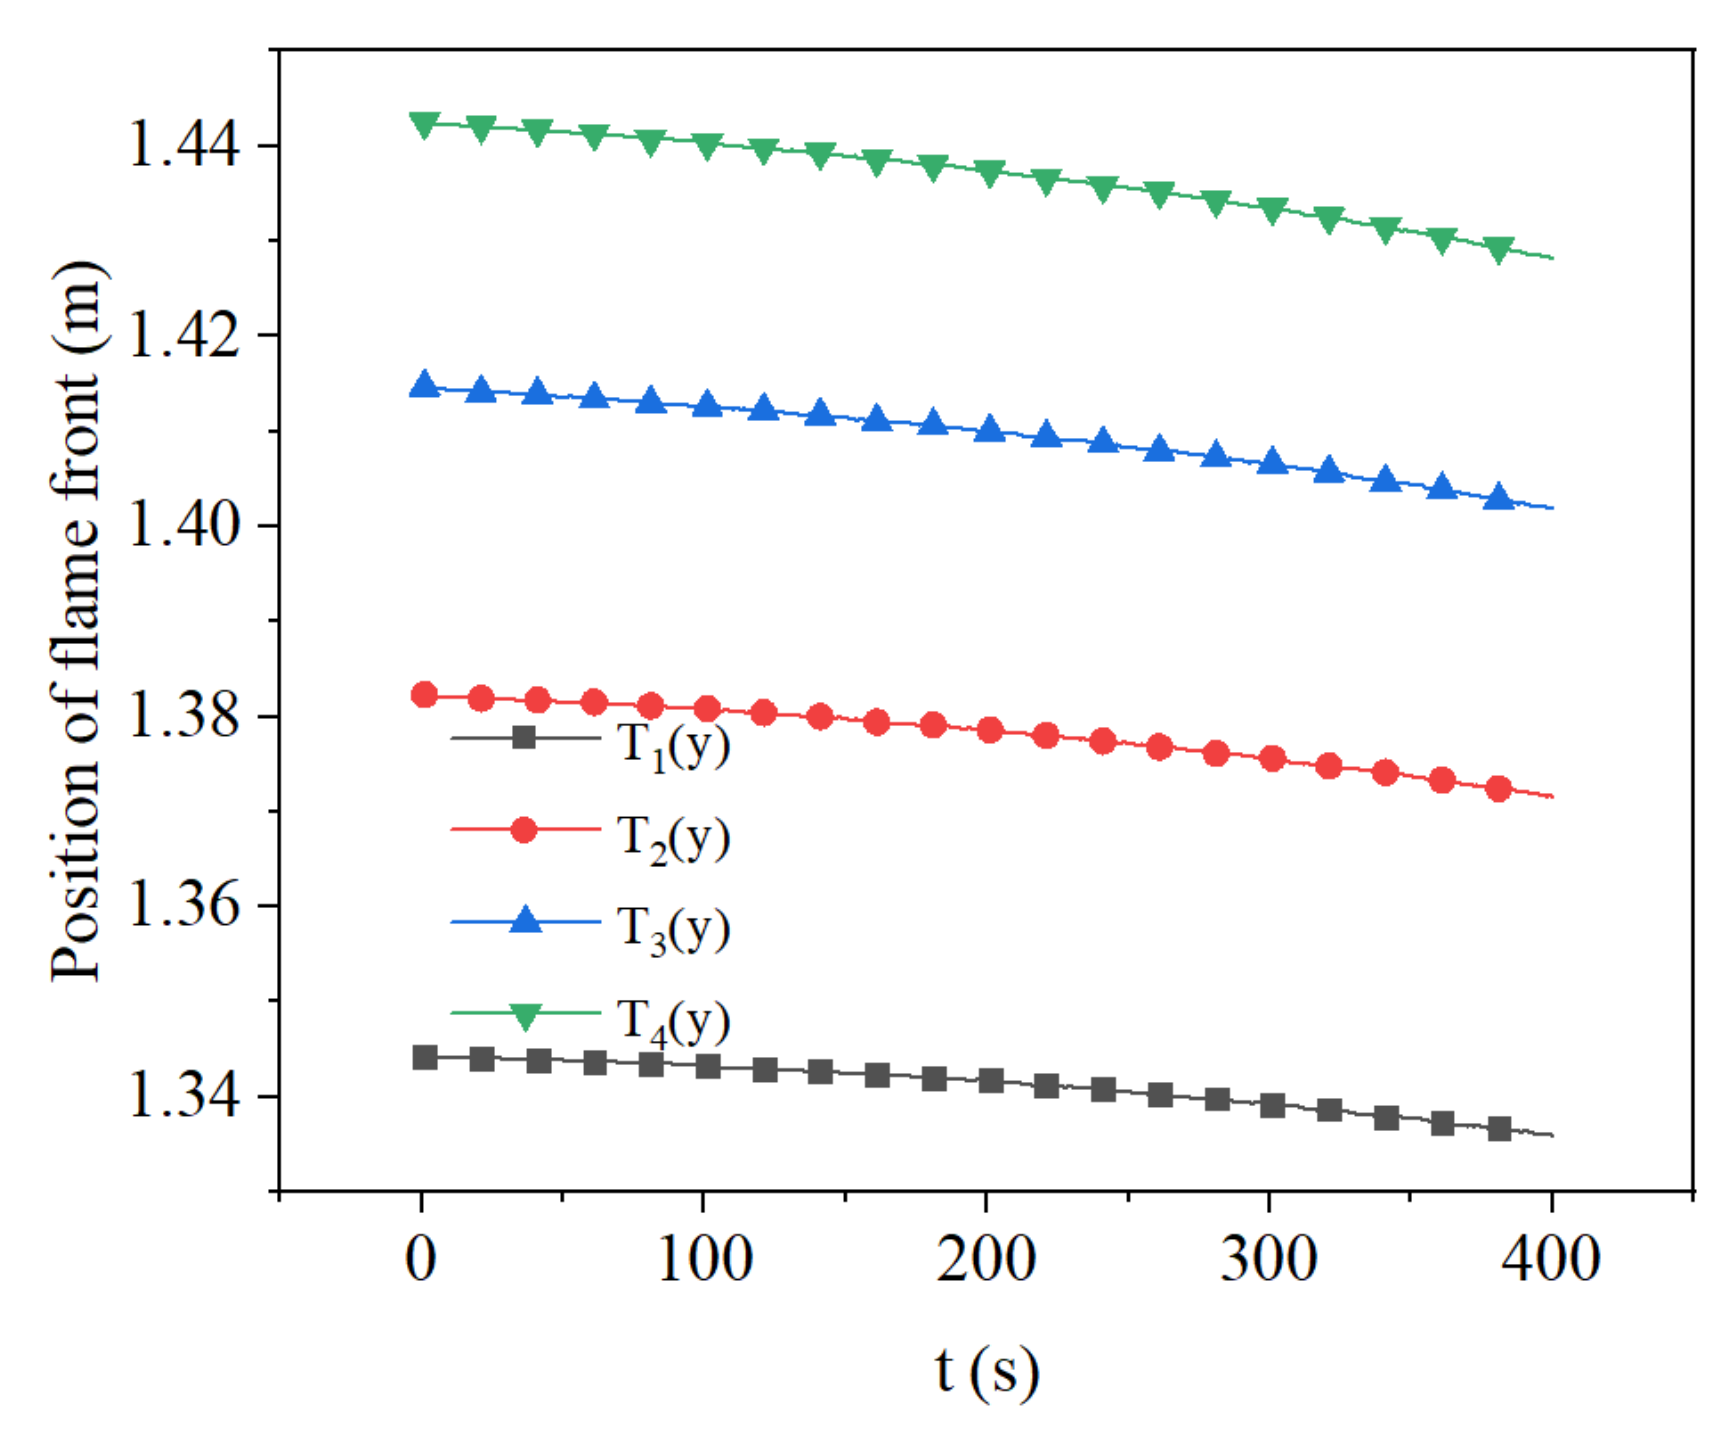
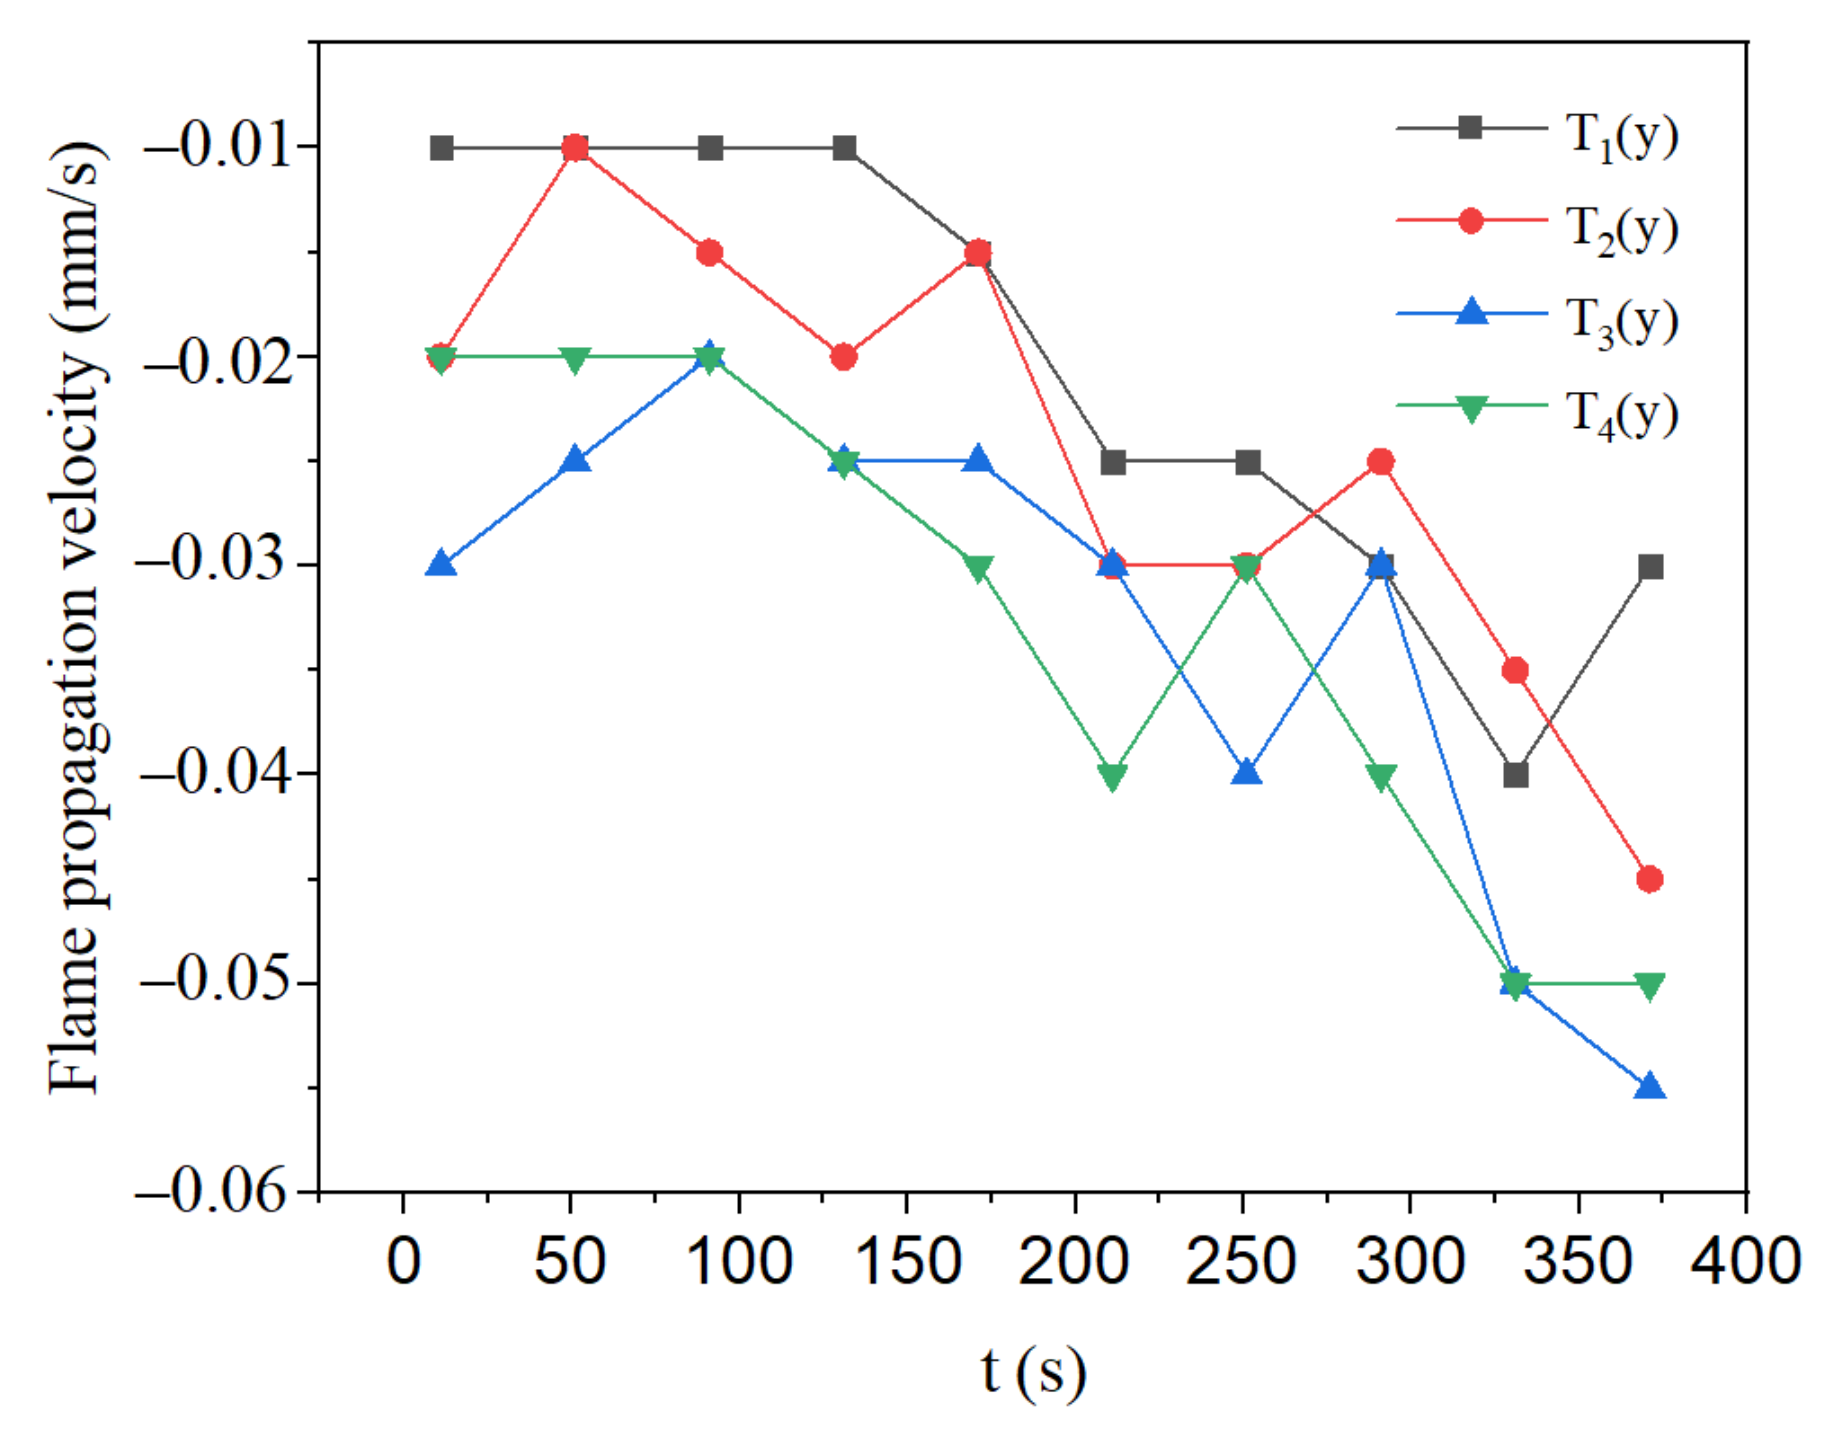
Figure 23 and Figure 24 show the variation of flame position and flame propagation rate over time using the initial temperature field with different peaks when the inlet flow rate is 700 m3/h and the inlet methane volume fraction is 0.6%. It can be seen from Figure 23 that when the initial temperature field peak value is higher, the initial position of the flame moves upstream. The reason is that when the peak value of the initial temperature field is high, the position with ignition temperature is further upstream. Therefore, the flame front is further upstream. It can be seen from Figure 24 that the flame propagation velocity increases over time as a whole despite fluctuation. The reason is that there is a large temperature gradient in the initial temperature field with a high peak value. The large temperature gradient leads to a higher average temperature in the reaction zone and a faster flow rate of the mixture, resulting in a faster flame propagation velocity.
Figure 25 (Parameter Settings for the simulation in the figure can be found in Table 5) shows the variation of flame thickness overtime when inlet flow rate is 700 m3/h and methane volume fraction is 0.6% with different high-temperature zone widths. It can be seen from Figure 25 that the thickness of the flame decreases when there is a wide high-temperature region. The reason is that the average temperature of the reaction zone is higher due to the higher temperature gradient brought by the wider high-temperature zone (as shown in Figure 26). Therefore, the length of the reaction zone required to complete the methane reaction becomes shorter, and the flame thickness becomes smaller.
Figure 27 and Figure 28 respectively show the influence of different high-temperature zone widths on flame front position and flame propagation velocity when the inlet flow rate is 700 m3/h and inlet methane volume fraction is 0.6%. It can be seen from Figure 27 that the flame front position moves upstream when the high-temperature region of the initial temperature field is wide, because the mixture ignition temperature can be reached earlier. It can be observed from Figure 28 that the flame propagates is faster and growth rate of the propagation velocity is larger when the high-temperature region of the initial temperature field is wide. The reason is that the temperature gradient in the reaction zone is higher when the initial temperature field is in a wider high-temperature zone. Then the average temperature in the reaction zone is larger, leading to increased mixture flow rate and flame propagation velocity. In addition, the reaction rate increases and the heat generated per unit time increases. Then, faster reaction rate further increases the temperature of the reaction zone and makes the flame propagation rate grow faster.

4. Conclusions

In this paper, an adaptive multi-scale numerical simulation method is proposed for filtration combustion of an extremely lean methane–air mixture. Real-time data exchange between different scales and mesh adaptation to flame movement is realized by UDF. The advantages of multi-scale model compared with the VAM model and the pore-scale model are analyzed. The influence of intake concentration, flow rate and initial temperature field on flame propagation and flame thickness are studied. The main results are as follows:
(1)
Compared with the VAM model, the temperature non-equilibrium between gas and solid can be shown more intuitively in the multi-scale model proposed in this paper. The multi-scale model can display the flame thickness and propagation more accurately. Compared with the pore-scale model, the multi-scale model saves computing resources. The results from the multi-scale model are in good agreement with the experimental results.
(2)
During the flame downward propagation, the propagation velocity increases and the flame thickness gets smaller with time. This is because the heat generated by the reaction increases the temperature of the reaction zone.
(3)
The growth of intake concentration increases the reaction rate and temperature, leading to a decrease of flame propagation velocity and smaller flame thickness.
(4)
The increase of flow rate increases the average temperature of the reaction zone and the reaction rate, thus making the flame thickness smaller. When the inlet flow rate increases, the growth rate of the flow rate is greater than that of the reaction rate in the reaction zone. Then the flame propagation velocity accelerates.
(5)
The larger peak value and width of the high-temperature zone of the initial temperature field increase the average temperature of the reaction zone. The high average temperature speeds up the flame propagation and decreases the flame thickness.

Author Contributions

The experiments and put forward the modification suggestion to this paper. J.L. performed the simulation and wrote the paper. M.G. and Q.C. processed the simulation data. M.-M.M., J.-R.S. and Y.-Q.L. put forward the modification suggestion to this paper. All authors have read and agreed to the published version of the manuscript.

Funding

This research was funded by National Natural Science Foundation of China, grant numbers 52106170.

Institutional Review Board Statement

Not applicable.

Informed Consent Statement

Not applicable.

Data Availability Statement

Not applicable.

Conflicts of Interest

The authors declare no conflict of interest.

References

  1. Somers, J.M.; Schultz, H.L. Coal mine ventilation air emissions: Project development planning and mitigation technologies. In Proceedings of the 13th United States/North American Mine Ventilation Symposium, Sudbury, ON, Canada, 13–16 June 2010; pp. 115–121. [Google Scholar]
  2. Boucher, O.; Folberth, G.A. New Directions: Atmospheric methane removal as a way to mitigate climate change. Atmos. Environ. 2010, 44, 3343–3345. [Google Scholar] [CrossRef]
  3. Uddin, N.; Blommerde, M.; Taplin, R.; Laurence, D. Sustainable development outcomes of coal mine methane clean development mechanism projects in China. Renew. Sustain. Energy Rev. 2015, 45, 1–9. [Google Scholar] [CrossRef]
  4. Zhou, F.; Xia, T.; Wang, X.; Zhang, Y.; Sun, Y.; Liu, J. Recent developments in coal mine methane extraction and utilization in China: A review. J. Nat. Gas Sci. Eng. 2016, 31, 437–458. [Google Scholar] [CrossRef]
  5. Su, S.; Beath, A.; Guo, H.; Mallett, C. An assessment of mine methane mitigation and utilization technologies. Prog. Energy Combust. Sci. 2005, 31, 123–170. [Google Scholar] [CrossRef]
  6. Shi, J.; Yu, C.; Li, B.; Xia, Y.; Xue, Z. Experimental and numerical studies on the flame instabilities in porous media. Fuel 2013, 106, 674–681. [Google Scholar] [CrossRef]
  7. Zheng, C.; Cheng, L.; Saveliev, A.; Luo, Z.; Cen, K. Numerical studies on flame inclination in porous media combustors. Int. J. Heat Mass Transf. 2011, 54, 3642–3649. [Google Scholar] [CrossRef]
  8. Chen, L.; Xia, Y.; Li, B.; Shi, J. Flame front inclination instability in the porous media combustion with inhomogeneous preheating temperature distribution. Appl. Therm. Eng. 2018, 128, 1520–1530. [Google Scholar] [CrossRef]
  9. Wang, G.; Tang, P.; Li, Y.; Xu, J.; Durst, F. Flame front stability of low calorific fuel gas combustion with preheated air in a porous burner. Energy 2019, 170, 1279–1288. [Google Scholar] [CrossRef]
  10. Shi, J.; Chen, Z.; Li, H.; Lv, J.; Mao, M. Pore-scale study of thermal nonequilibrium in a two-layer burner formed by staggered arrangement of particles. Appl. Therm. Eng. 2020, 176, 1359–4311. [Google Scholar] [CrossRef]
  11. Shi, J.; Mao, M.; Li, H.; Liu, Y.; Lv, J. A pore level study of syngas production in two-layer burner formed by staggered arrangement of particles. Int. J. Hydrog. Energy 2020, 45, 2331–2340. [Google Scholar] [CrossRef]
  12. Yue, M.; Xie, M.-Z.; Shi, J.-R.; Liu, H.-S.; Chen, Z.-S.; Chang, Y.-C. Numerical and Experimental Investigations on Combustion Characteristics of Premixed Lean Methane–Air in a Staggered Arrangement Burner with Discrete Cylinders. Energies 2020, 13, 6397. [Google Scholar] [CrossRef]
  13. Liu, Y.; Deng, Y.; Shi, J.; Xiao, R.; Li, H. Pore-level numerical simulation of methane-air combustion in a simplified two-layer porous burner. Chin. J. Chem. Eng. 2021, 34, 87–96. [Google Scholar] [CrossRef]
  14. Bharadwaj, V.S.; Pecha, M.B.; Bu, L.; Dagle, V.L.; Dagle, R.A.; Ciesielski, P.N. Multi-scale simulation of reaction, transport and deactivation in a SBA-16 supported catalyst for the conversion of ethanol to butadiene. Catal. Today 2019, 338, 141–151. [Google Scholar] [CrossRef]
  15. Tang, Y.; Valocchi, A.J.; Werth, C.J. A hybrid pore-scale and continuum-scale model for solute diffusion, reaction, and biofilm development in porous media. Water Resour. Res. 2015, 51, 1846–1859. [Google Scholar] [CrossRef]
  16. Xin, C.; Lu, L.; Shi, B.; Liu, Z. Numerical investigation of local thermal non-equilibrium effects in coal porous media with cryogenic nitrogen injection. Int. J. Therm. Sci. 2018, 133, 32–40. [Google Scholar] [CrossRef]
  17. Lu, L.; Du, X.; Xin, C. Modeling and Simulation of Local Thermal Non-equilibrium Effects in Porous Media with Small Thermal Conductivity. Transp. Porous Media 2018, 124, 553–575. [Google Scholar] [CrossRef]
  18. Kardaś, D.; Polesek-Karczewska, S.; Tiutiurski, P.; Wardach-Świȩcicka, I. Applying dynamic mesh to examine evolution of effective thermal conductivity in porous medium undergoing macrostructure change. Appl. Therm. Eng. 2021, 187, 116583. [Google Scholar] [CrossRef]
  19. Qin, C.; Guo, B.; Celia, M.; Wu, R. Dynamic pore-network modeling of air-water flow through thin porous layers. Chem. Eng. Sci. 2019, 202, 194–207. [Google Scholar] [CrossRef]
  20. Xu, Y.; Li, Z.; Liu, H.; Jia, M.; Wang, Q.; Zhang, M.; Xu, Y. Modeling of the dynamic behaviors of heat transfer during the construction of roadway using moving mesh. Case Stud. Therm. Eng. 2021, 26, 100958. [Google Scholar] [CrossRef]
  21. Pitsch, H. A consistent level set formulation for large-eddy simulation of premixed turbulent combustion. Combust. Flame 2005, 143, 587–598. [Google Scholar] [CrossRef]
  22. Semlitsch, B.; Orchini, A.; Dowling, A.P.; Juniper, M.P. G-equation modelling of thermoacoustic oscillations of partially premixed flames. Int. J. Spray Combust. Dyn. 2017, 9, 260–276. [Google Scholar] [CrossRef] [Green Version]
  23. Mao, M.; Shi, J.; Liu, Y.; Gao, M.; Chen, Q. Experimental investigation on control of temperature asymmetry and nonuniformity in a pilot scale thermal flow reversal reactor. Appl. Therm. Eng. 2020, 175, 1359–4311. [Google Scholar] [CrossRef]
  24. Cravero, C.; De Domenico, D.; Leutcha, P.; Marsano, D. Strategies for the Numerical Modelling of Regenerative Pre-heating Systems for Recycled Glass Raw Material. Math. Model. Eng. Probl. 2019, 6, 324–332. [Google Scholar] [CrossRef] [Green Version]
  25. Hayes, A.M.; Khan, J.A.; Shaaban, A.H.; Spearing, I.G. The thermal modeling of a matrix heat exchanger using a porous medium and the thermal non-equilibrium model. Int. J. Therm. Sci. 2008, 47, 1306–1315. [Google Scholar] [CrossRef]
  26. Azizi, S.; Hosseini, S.H.; Moraveji, M.; Ahmadi, G. CFD modeling of a spouted bed with a porous draft tube. Particuology 2010, 8, 415–424. [Google Scholar] [CrossRef]
  27. Mao, M.; Liu, Y.; Gao, Z.; Tang, S.; You, Y. Experimental study on flow uniformity in a hot countercurrent reaction. J. China Coal Soc. 2011, 36, 1349–1353. [Google Scholar]
  28. Li, Q.; Bai, F.; Yang, B.; Wang, Y.; Xu, L.; Chang, Z.; Wang, Z.; El Hefni, B.; Yang, Z.; Kubo, S.; et al. Dynamic simulations of a honeycomb ceramic thermal energy storage in a solar thermal power plant using air as the heat transfer fluid. Appl. Therm. Eng. 2018, 129, 636–645. [Google Scholar] [CrossRef]
  29. Fu, X.; Viskanta, R.; Gore, J.P. Measurement and correlation of volumetric heat transfer coefficients of cellular ceramics. Exp. Therm. Therm. Fluid Sci. 1998, 17, 285–293. [Google Scholar]
  30. Bubnovich, V.; Toledo, M. Analytical modelling of filtration combustion in inert porous media. Appl. Therm. Eng. 2007, 27, 1144–1149. [Google Scholar] [CrossRef]
  31. Huang, H.; Sun, T.; Zhang, G.; Li, D.; Wei, H. Evaluation of a developed SST k-ω turbulence model for the prediction of turbulent slot jet impingement heat transfer. Int. J. Heat Mass Transf. 2019, 139, 700–712. [Google Scholar] [CrossRef]
  32. Cademartori, S.; Cravero, C.; Marini, M.; Marsano, D. CFD Simulation of the Slot Jet Impingement Heat Transfer Process and Application to a Temperature Control System for Galvanizing Line of Metal Band. Appl. Sci. 2021, 11, 1149. [Google Scholar] [CrossRef]
  33. Wang, S.; Fan, A. Combustion regimes of syngas flame in a micro flow reactor with controlled temperature profile: A numerical study. Combust. Flame 2021, 230, 10–2180. [Google Scholar] [CrossRef]
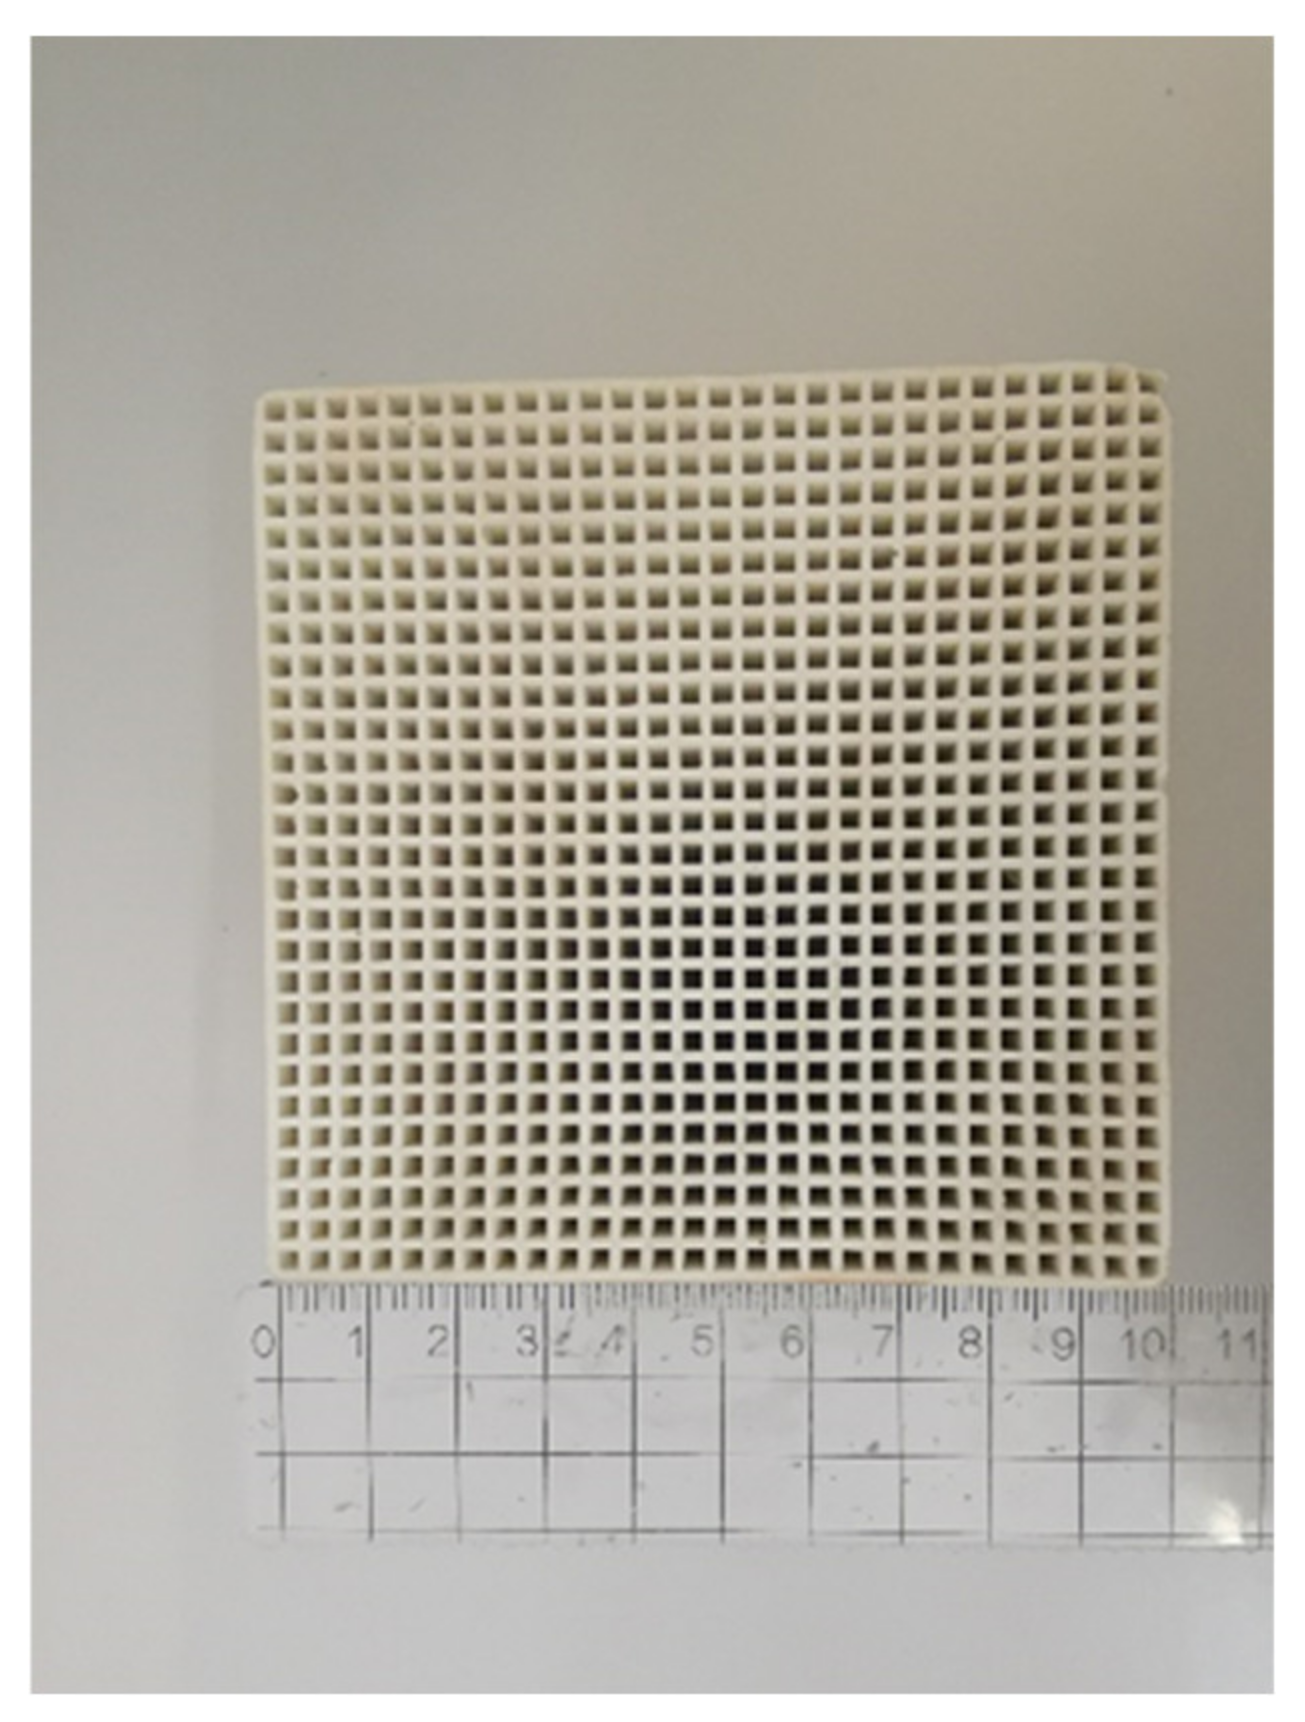
Figure 1. Ceramic honeycomb block.
Energies 15 00318 g001
Figure 2. Schematic diagram of the multi-scale model.
Energies 15 00318 g002
Figure 3. Case2 schematic.
Energies 15 00318 g003
Figure 4. Schematic diagram of data exchange.
Energies 15 00318 g004
Figure 5. Mesh movement control strategy.
Energies 15 00318 g005
Figure 6. Grid at the outlet of Case2. (a) The grid size of Case2 = 0.1 mm; (b) The grid size of Case2 = 0.2 mm; (c) The grid size of Case2 = 0.5 mm.
Energies 15 00318 g006
Figure 7. Experimental and simulated temperature profiles with XCH4 = 0.8% and inlet flow rate of 700 m3/h.
Energies 15 00318 g007
Figure 8. Experimental and simulated temperature profiles with XCH4 = 0.4% and inlet flow rate of 700 m3/h.
Energies 15 00318 g008
Figure 9. Reaction rate contour comparison of three models at 108 s with XCH4 = 0.8% and inlet flow rate of 700 m3/h. (a) VAM model; (b) Multi-scale model; (c) PSS model.
Energies 15 00318 g009
Figure 10. Mass fraction of methane contour comparison of three models at 108 s with XCH4 = 0.8% and inlet flow rate of 700 m3/h. (a) VAM model; (b) Multi-scale model; (c) PSS model.
Energies 15 00318 g010
Figure 11. Temperature contour comparison of three models at 108 s with XCH4 = 0.8% and inlet flow rate of 700 m3/h. (a) VAM model; (b) Multi-scale model; (c) PSS model.
Energies 15 00318 g011
Figure 12. Variation of flame thickness with time at different concentrations with the inlet flow rate of 700 m3/h. (a) The thickness of the flame; (b) Flame thickness calculation method.
Energies 15 00318 g012
Figure 13. Change of flame front position with time at different concentrations with the inlet flow rate of 700 m3/h.
Energies 15 00318 g013
Figure 14. Variation of flame propagation velocity with time at different concentrations with the inlet flow rate of 700 m3/h.
Energies 15 00318 g014
Figure 15. Comparison of temperature field in the reaction zone with an inlet flow rate of 700 m3/h, t = 400 s. (a) XCH4 = 0.8%; (b) XCH4 = 0.2%.
Energies 15 00318 g015
Figure 16. Variation of flame thickness with time at different inlet flow rates with XCH4 = 0.6%.
Energies 15 00318 g016
Figure 17. Comparison of temperature field in the reaction zone with XCH4 = 0.6%, t = 400 s. (a) Inlet flow = 800 m3/h; (b) Inlet flow = 200 m3/h.
Energies 15 00318 g017
Figure 18. Change of flame front position with time at different inlet flow rates with XCH4 = 0.6%.
Energies 15 00318 g018
Figure 19. Variation of flame propagation velocity with time at different inlet flow rates with XCH4 = 0.6%.
Energies 15 00318 g019
Figure 20. Initial temperature fields comparison. (a) TA(y); (b) TB(y).
Energies 15 00318 g020
Figure 21. Variation of flame thickness with time at different initial temperature field peaks with the inlet flow rate of 700 m3/h, XCH4 = 0.6%.
Energies 15 00318 g021
Figure 22. Comparison of temperature field in the reaction zone with an inlet flow rate of 700 m3/h, XCH4 = 0.6%, t = 400 s. (a) The initial temperature is set to T1(y); (b) The initial temperature is set to T4(y).
Energies 15 00318 g022
Figure 23. Change of flame front position with time at different initial temperature peaks with the inlet flow rate of 700 m3/h, XCH4 = 0.6%.
Energies 15 00318 g023
Figure 24. Variation of flame propagation velocity with time at different initial temperature peaks with the inlet flow rate of 700 m3/h, XCH4 = 0.6%.
Energies 15 00318 g024
Figure 25. Variation of flame thickness with time at different initial widths of high-temperature zone with the inlet flow rate of 700 m3/h, XCH4 = 0.6%.
Energies 15 00318 g025
Figure 26. Comparison of temperature field in the reaction zone with an inlet flow rate of 700 m3/h, XCH4 = 0.6%, t = 400 s. (a) The initial temperature is set to T1(y). (b) The initial temperature is set to T7(y).
Energies 15 00318 g026
Figure 27. Change of flame front position with time at different widths of high-temperature zone with the inlet flow rate of 700 m3/h, XCH4 = 0.6%.
Energies 15 00318 g027
Figure 28. Variation of flame propagation velocity with time at different widths of high-temperature zone with the inlet flow rate of 700 m3/h, XCH4 = 0.6%.
Energies 15 00318 g028
Table 1. Symbols used in this work.
Nomenclature
Cspecific heat, kJ/kg·KDidiffusion coefficient of species i, cm2/s
wwidth of modelhimolar enthalpy of species i, kj/Kg
amixture concentration at the inlet of Case2; coefficientbmixture concentration 5 mm below the inlet of Case2; coefficient
Gincident radiation, W/m2qRradiation heat flux, W/m3
ppressure, PaT0ambient temperature, K
Ttemperature, Kvvertical velocity, m/s
uhorizontal velocity, m/sWimolecular weight of species i, Kg/Kmol
v gas velocity vector, m/sXmolar fraction
xvertical coordinate, mYmass fraction
yhorizontal coordinate, mkdifference value
man experimental coefficientttime
uithe i component of velocity vectorQheat content of the premixed mixture
Rgeneral constant of the gasC1permeability resistance
C2inertial resistance
Greek symbols
φequivalent ratioλthermal conductivity, W/m·K
ρdensity, kg/m3εporosity
εrsolid surface emissivityωireaction rate of species i, Kmol/m3·s
σStephan–Boltzmann constant, W/m2·K4μkinematic viscosity, Pa·s
αgas absorption coefficient, 1/mβheat loss coefficient, W/m3·K
Subscripts
ggasssolid
inburner inletoutburner outlet
ispecies in the gas mixture
Table 2. Mesh configuration.
NameGrid Size of Case1Grid Size of Case2Grid Size of Case3
Mesh10.2 mm0.1 mm0.2 mm
Mesh20.5 mm0.2 mm0.5 mm
Mesh31 mm0.5 mm1 mm
Table 3. Parameters in this section.
XCH4Inlet Flow RateT0Initial Temperature Field
0.8%700 m3/h300 K T = 274.9 + 982.7 × e 0.5 × ( y 1.02 0.38 ) 2
0.6%700 m3/h300 K T = 274.9 + 982.7 × e 0.5 × ( y 1.02 0.38 ) 2
0.4%700 m3/h300 K T = 274.9 + 982.7 × e 0.5 × ( y 1.02 0.38 ) 2
0.2%700 m3/h300 K T = 274.9 + 982.7 × e 0.5 × ( y 1.02 0.38 ) 2
Table 4. Parameters in this section.
XCH4Inlet Flow RateT0Initial Temperature Field
0.6%800 m3/h300 K T = 274.9 + 982.7 × e 0.5 × ( y 1.02 0.38 ) 2
0.6%600 m3/h300 K T = 274.9 + 982.7 × e 0.5 × ( y 1.02 0.38 ) 2
0.6%400 m3/h300 K T = 274.9 + 982.7 × e 0.5 × ( y 1.02 0.38 ) 2
0.6%200 m3/h300 K T = 274.9 + 982.7 × e 0.5 × ( y 1.02 0.38 ) 2
Table 5. Parameters in this section.
XCH4Inlet Flow RateT0Initial Temperature Field
0.6%700 m3/h300 KT1(y)
0.6%700 m3/h300 KT2(y)
0.6%700 m3/h300 KT3(y)
0.6%700 m3/h300 KT4(y)
0.6%700 m3/h300 KT5(y)
0.6%700 m3/h300 KT6(y)
0.6%700 m3/h300 KT7(y)
Publisher’s Note: MDPI stays neutral with regard to jurisdictional claims in published maps and institutional affiliations.