
Polish Cittaslow Local Governments’ Support for Renewable Energy Deployment vs. Slow City Concept


Abstract
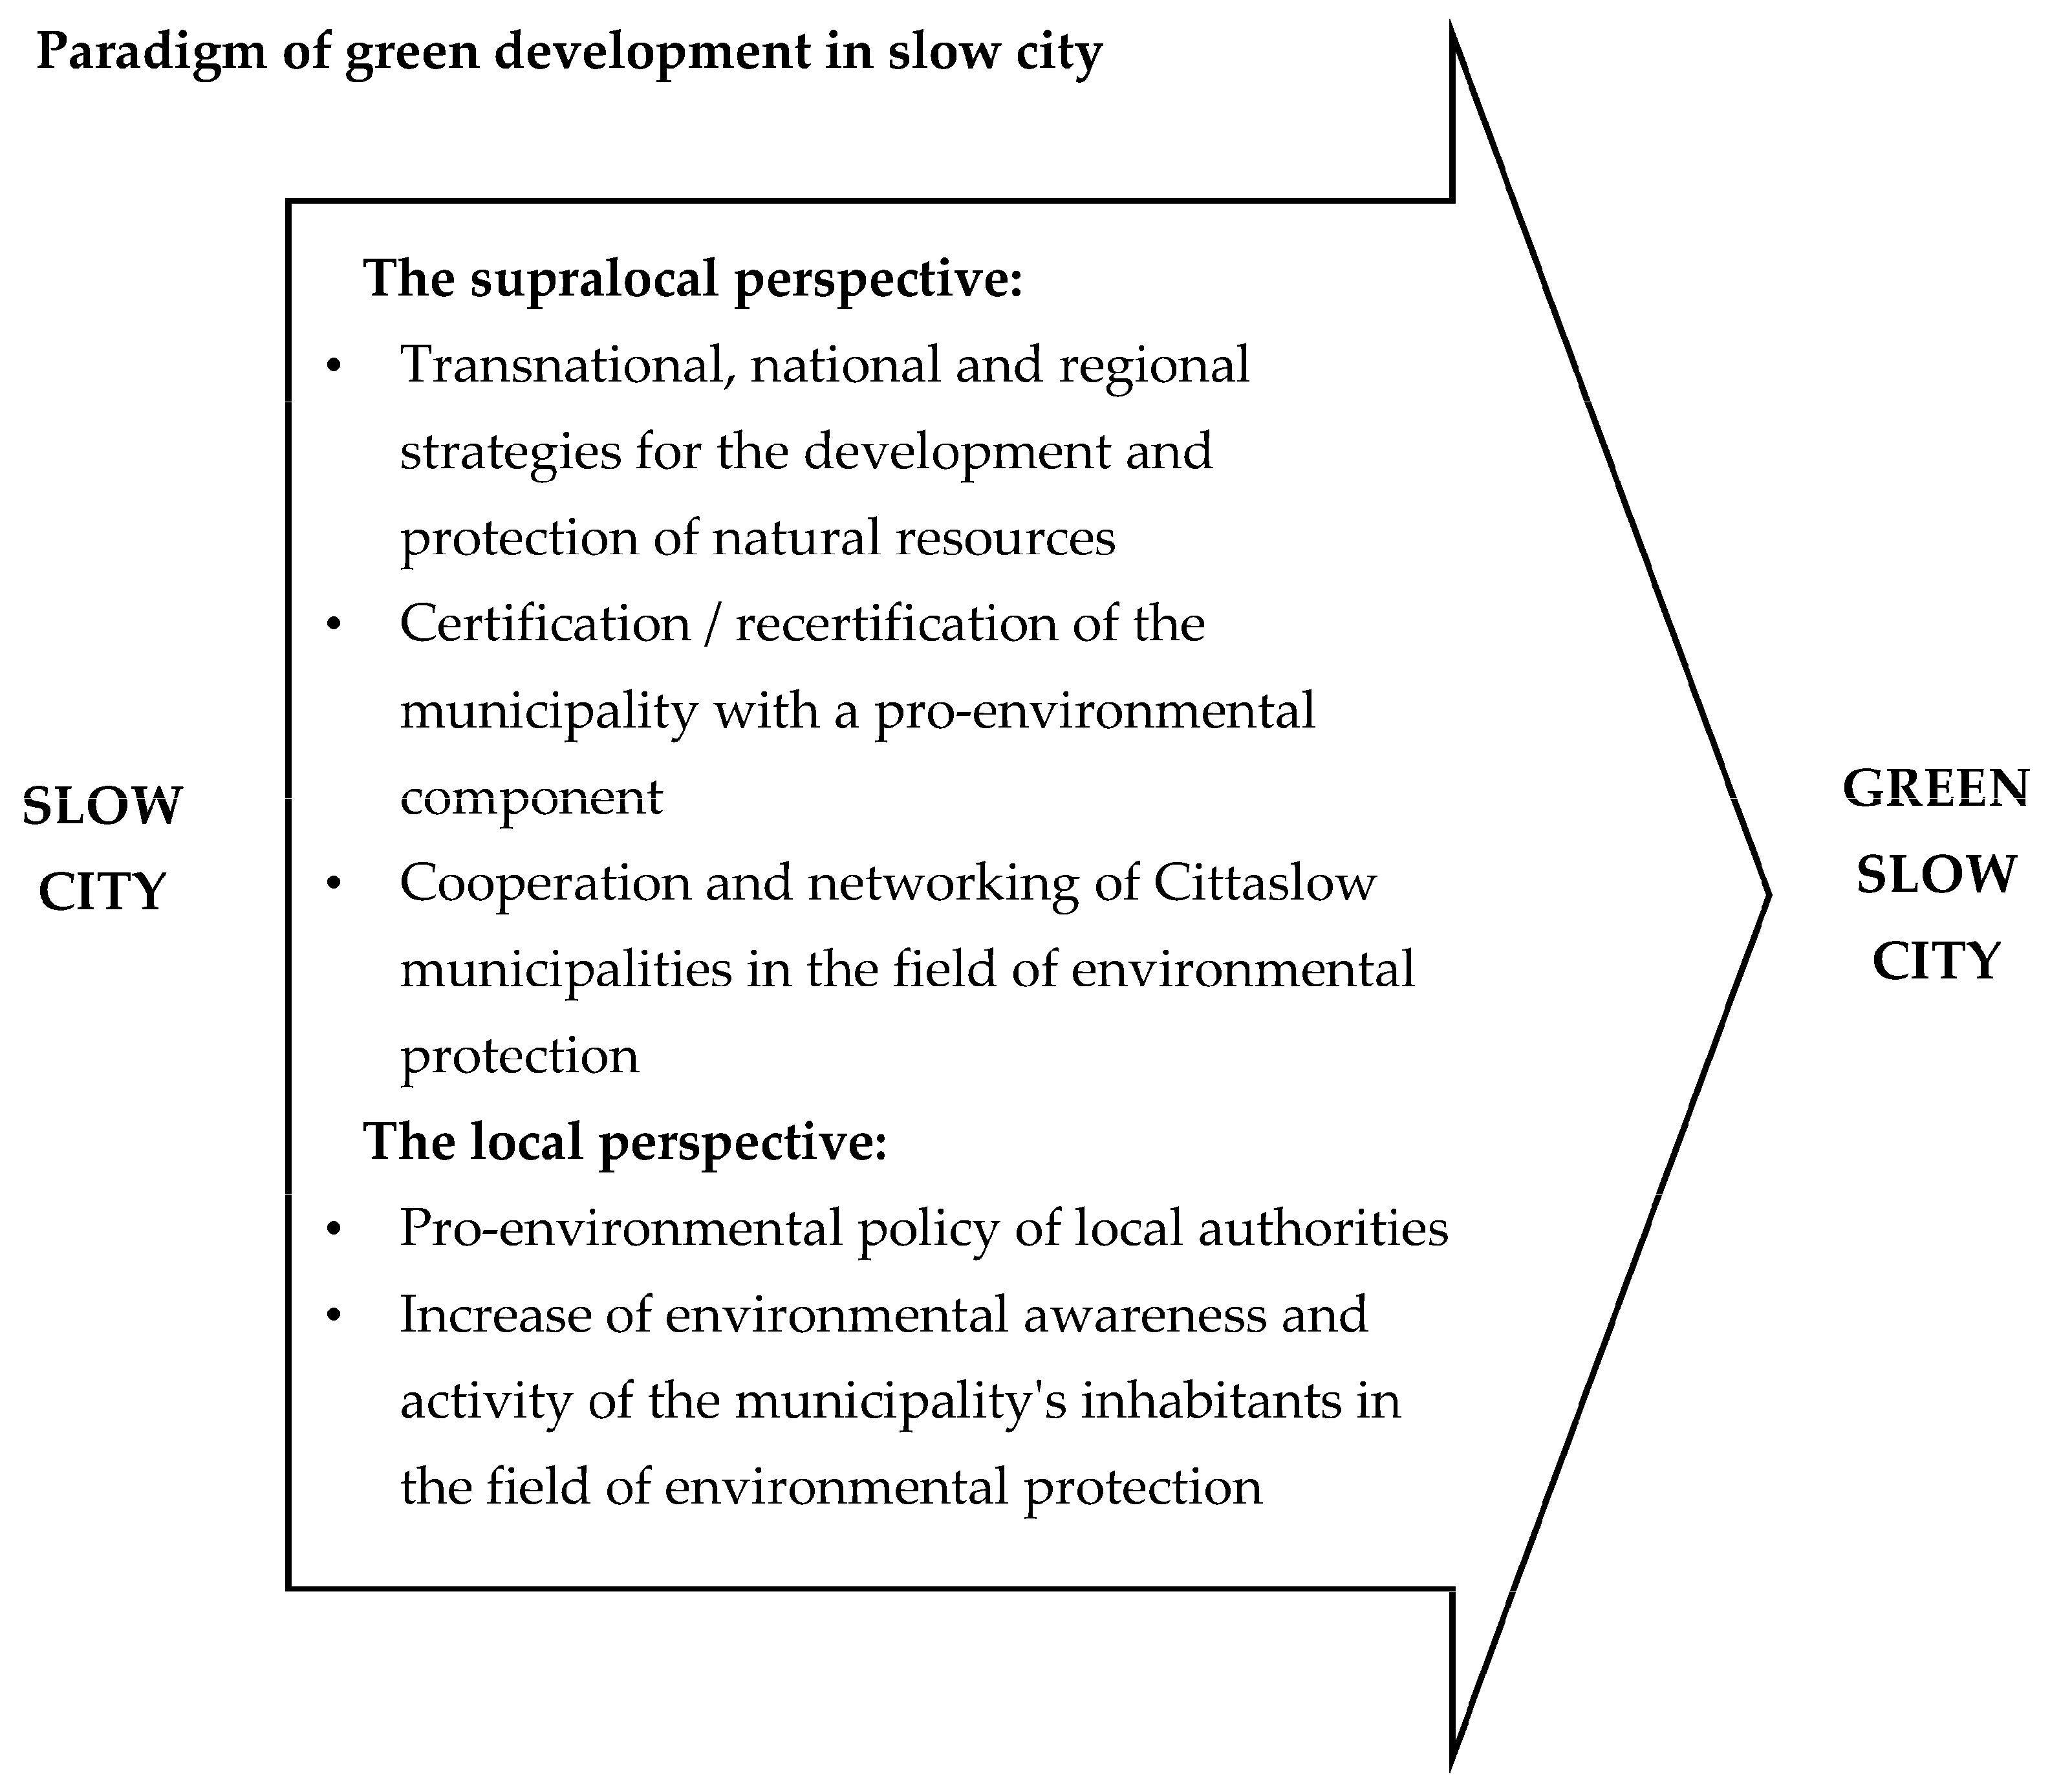
:1. Introduction
2. Literature Review
3. Materials and Methods
- total budget revenues in PLN per capita (average for 2014–2020);
- budget revenues from personal tax in PLN per capita (average for 2014–2020);
- income budgets from corporate tax in PLN per capita (average for 2014–2020);
- percentage of people in pre-working age;
- percentage of people of working age;
- indicator of economic entities per 10,000 population (average for 2014–2020);
- number of social welfare beneficiaries per 10,000 inhabitants (average for 2014–2020);
- percentage of inhabitants using the sewage system in 2019;
- percentage of inhabitants using water supply systems in 2019;
- the percentage of inhabitants using the gas network in 2019;
- the number of unemployed (average for 2014–2020).
4. Results
4.1. Renewable Energy in the Development Strategies of Cittaslow Municipalities
4.2. The Implementation of Tasks Related to Renewable Energy Sources in Different Types of Cittaslow Municipalities and Correlation between the Renewable Energy Goals Included in the Strategies and the Practical Deployment of Various Types of Renewable Energy
4.3. Differentiation in the Implementation of Tasks Related to Renewable Energy Sources in Cittaslow Municipalities Depending on Their Socio-Economic Profile
4.4. The Quality of Life Synthetic Index of Cittaslow Municipalities and Its Correlation with the Local Governments’ Activities Supporting the Deployment of Renewable Energy
5. Discussion
6. Conclusions and Recommendations
Author Contributions
Funding
Institutional Review Board Statement
Informed Consent Statement
Data Availability Statement
Conflicts of Interest
References
- Directive 2009/28/EC of the European Parliament and of the Council of 23 April 2009 on the Promotion of the Use of Energy from Renewable Sources and Amending and Subsequently Repealing Directives 2001/77/EC and 2003/30/EC (‘RES Directive’) (OJ L 140, 5.6.2009). Available online: https://eur-lex.europa.eu/legal-content/EN/ALL/?uri=celex%3A32009L0028 (accessed on 21 September 2021).
- Regulation (EU) 2018/1999 of the European Parliament and of the Council of 11 December 2018 on the Governance of the Energy Union and Climate Action, Amending Regulations (EC) No 663/2009 and (EC) No 715/2009 of the European Parliament and of the Council, Directives 94/22/EC, 98/70/EC, 2009/31/EC, 2009/73/EC, 2010/31/EU, 2012/27/EU and 2013/30/EU of the European Parliament and of the Council, Council Directives 2009/119/EC and (EU) 2015/652 and Repealing Regulation (EU) No 525/2013 of the European Parliament and of the Council. Available online: https://eur-lex.europa.eu/legal-content/EN/TXT/?uri=uriserv%3AOJ.L_.2018.328.01.0001.01.ENG (accessed on 30 September 2020).
- European Commission. A Policy Framework for Climate and Energy in the Period from 2020 to 2030; COM(2014) 15 Final; European Commission: Brussels, Belgium, 2014; Available online: https://eur-lex.europa.eu/legal-content/EN/ALL/?uri=celex%3A52014DC0015 (accessed on 21 September 2021).
- Leikučs, J.; Strīķis, V. An overview of legislative and institutional barriers of Latvia’s renewable energy production. Manag. Theory Stud. Rural Busines Infrastruct. Dev. 2011, 26, 146–155. [Google Scholar]
- Rennkamp, B.; Haunss, S.; Wongsa, K.; Ortega, A.; Casamadrid, E. Competing coalitions: The politics of renewable energy and fossil fuels in Mexico, South Africa and Thailand. Energy Res. Soc. Sci. 2017, 34, 214–223. [Google Scholar] [CrossRef]
- OECD. Linking Renewable Energy to Rural Development, OECD Green Growth Studies; OECD Publishing: Paris, France, 2016. [Google Scholar] [CrossRef]
- Stokes, L.C. The politics of renewable energy policies: The case of feed-in-tariffs in Ontario, Canada. Energy Policy 2013, 56, 490–500. [Google Scholar] [CrossRef]
- Stokes, L.C.; Breetz, H.L. Politics in the U.S. energy transition: Case studies of solar, wind, biofuels and electric vehicles policy. Energy Policy 2018, 113, 76–86. [Google Scholar] [CrossRef] [Green Version]
- Standar, A.; Kozera, A.; Satoła, Ł. The Importance of Local Investments Co-Financed by the European Union in the Field of Renewable Energy Sources in Rural Areas of Poland. Energies 2021, 14, 450. [Google Scholar] [CrossRef]
- Brodziński, Z.; Kurowska, K. Cittaslow idea as a new proposition to stimulate sustainable local development. Sustainability 2021, 13, 5039. [Google Scholar] [CrossRef]
- Zadęcka, E. Slow city as a local development model. Econ. Reg. Stud. 2018, 11, 84–106. [Google Scholar] [CrossRef] [Green Version]
- Zawadzka, A.K. Making small towns visible in Europe: The case of Cittaslow network—The strategy based on sustainable development. Transylv. Rev. Adm. Sci. 2017, 90–106. [Google Scholar] [CrossRef] [Green Version]
- Manifest Miast Slow dla Nowego Humanizmu Bycia i Mieszkania. 1999. Available online: https://cittaslowpolska.pl/images/PDF/Manifest_miast_Cittaslow.pdf (accessed on 15 October 2021).
- Cittaslow List. 2021. Available online: https://www.cittaslow.org/sites/default/files/content/page/files/246/cittaslow_list_june_2021.pdf (accessed on 2 November 2021).
- Global Status Reporton Local Renewable Energy Policies. Available online: https://inis.iaea.org/collection/NCLCollectionStore/_Public/46/105/46105568.pdf (accessed on 21 September 2021).
- Renewables on Cities. Global Status Report. 2019. Available online: https://www.ren21.net/wp-content/uploads/2019/05/REC-2019-GSR_Full_Report_web.pdf (accessed on 21 September 2021).
- International Renewable Energy Agency. Rise of Renewables in Cities: Energy Solutions for the Urban Future; International Renewable Energy Agency: Abu Dhabi, United Arab Emirates, 2020; Available online: https://www.irena.org/-/media/Files/IRENA/Agency/Publication/2020/Oct/IRENA_Renewables_in_cities_2020.pdf (accessed on 21 September 2021).
- COM(2010) 639 Final of 10 November 2010 ‘Energy 2020: A Strategy for Competitive, Sustainable and Secure Energy’; SEC(2010) 1346; European Commission: Brussels, Belgium; Available online: https://eur-lex.europa.eu/LexUriServ/LexUriServ.do?uri=COM:2010:0639:FIN:En:PDF (accessed on 3 October 2021).
- Alonso, P.M.; Hewitt, R.; Díaz-Pacheco, J.; Bermejo, L.R.; Hernández-Jiménez, V.; Guillén, J.V.; Bressers, H.; de Boer, C. Losing the roadmap: Renewable energy paralysis in Spain and its implications for the EU low carbon economy. Renew. Energy 2016, 89, 680–694. [Google Scholar] [CrossRef]
- Negro, S.O.; Alkemade, F.; Hekkert, M.P. Why does renewable energy diffuse so slowly? A review of innovation system problems. Renew. Sustain. Energy Rev. 2012, 16, 3836–3846. [Google Scholar] [CrossRef] [Green Version]
- White, W.; Lunnan, A.; Nybakk, E.; Kulisic, B. The role of governments in renewable energy: The importance of policy consistency. Biomass Bioenergy 2013, 57, 97–105. [Google Scholar] [CrossRef]
- Boon, F.P.; Dieperink, C. Local civil society based renewable energy organisations in the Netherlands: Exploring the factors that stimulate their emergence and development. Energy Policy 2014, 69, 297–307. [Google Scholar] [CrossRef]
- Cansino, J.M.; Pablo-Romero, M.P.; Román, R.; Yñiguez, R. Promoting renewable energy sources for heating and cooling in EU-27 countries. Energy Policy 2011, 39, 3803–3812. [Google Scholar] [CrossRef]
- Peidong, Z.; Yanli, Y.; Jin, S.; Yonghong, Z.; Lisheng, W.; Xinrong, L. Opportunities and challenges for renewable energy policy in China. Renew. Sustain. Energy Rev. 2009, 13, 439–449. [Google Scholar] [CrossRef]
- Prados, M.J. Renewable energy policy and landscape management in Andalusia, Spain: The facts. Energy Policy 2010, 38, 6900–6909. [Google Scholar] [CrossRef]
- Comodi, G.; Cioccolanti, L.; Polonara, F.; Brandoni, C. Local authorities in the context of energy and climate policy. Energy Policy 2012, 51, 737–748. [Google Scholar] [CrossRef]
- Cheung, G.; Davies, P.J.; Trück, S. Transforming urban energy systems: The role of local governments’ regional energy master plan. J. Clean. Prod. 2019, 220, 655–667. [Google Scholar] [CrossRef]
- Fouché, E.; Brent, A. Journey towards Renewable Energy for Sustainable Development at the Local Government Level: The Case of Hessequa Municipality in South Africa. Sustainability 2019, 11, 755. [Google Scholar] [CrossRef] [Green Version]
- Mey, F.; Diesendorf, M.; MacGill, I. Can local government play a greater role for community renewable energy? A case study from Australia. Energy Res. Soc. Sci. 2016, 21, 33–43. [Google Scholar] [CrossRef]
- 30. In United Nations Sustainable Development Goals Report 2016; U.N. Publications: New York, NY, USA, 2016.
- Sperling, K.; Hvelplund, F.; Mathiesen, B.V. Centralisation and decentralisation in strategic municipal energy planning in Denmark. Energy Policy 2011, 39, 1338–1351. [Google Scholar] [CrossRef]
- Gronkowska, J. Model energy cluster—Special energy zone delivering integrated territorial energy. Geomat. Landmanag. Landsc. 2017, 3, 47–57. [Google Scholar] [CrossRef]
- Węglarz, A.; Winkowska, E.; Wójcik, W. Gospodarka Niskoemisyjna Zaczyna się w Gminie. Podręcznik dla Polskich Samorządów; Adelphi: Berlin, Germany, 2015. [Google Scholar]
- Kosiński, E.; Trupkiewicz, M. Gmina jako podmiot systemu wspierania wytwarzania energii elektrycznej z odnawialnych źródeł energii (A municipality as a part of the suport system for generetion of electricity from renewable energy sources). Ruch Praw. Ekononiczny Socjol. 2016, 78, 93–107. [Google Scholar] [CrossRef] [Green Version]
- Carp, J. Cittaslow mean resilience. In Alterarchitectures Manifiesto: Observatory of Innovative Architectural and Urban Processes in Europe; Paquot, T., Masson-Zanussi, Y., Stathopoulos, M., Eds.; Eterotopia: Milan, Italy, 2012; pp. 169–172. [Google Scholar]
- Strzelecka, E. Concept of resilience and development of small towns and rural area. Barom. Reg. 2018, 16, 121–130. [Google Scholar]
- Farelnik, E.; Stanowicka, A.; Wierzbicka, W. Cittaslow—Model Rozwoju i Współpracy Małych Miast; Uniwersytet Warmińsko-Mazurski w Olsztynie: Olsztyn, Poland, 2020. [Google Scholar]
- Zawadzka, A.K. Architectural and urban attractiveness of small towns: A case study of Polish coastal Cittaslow towns on the Pomeranian Way of St. James. Land 2021, 10, 724. [Google Scholar] [CrossRef]
- Sept, A. ‘Slowing down’ in small and medium-sized towns: Cittaslow in Germany and Italy from a social innovation perspective. Reg.Stud. Reg. Sci. 2021, 8, 259–268. [Google Scholar] [CrossRef]
- Jeong, H.K.; Brian, E.M.; Seongseop, K.; Sam, K. Developing a slow city tourism evaluation index: A Delphi-AHP review of Cittaslow requirements. J. Sustain. Tour. 2021. [Google Scholar] [CrossRef]
- Cittaslow—International Network of Cities Where Living Is Easy. Innovation by Tradition. 2019. Available online: www.cittaslow.org/sites/default/files/content/page/files/246/cittaslow_2019_brochure_1.pdf (accessed on 15 October 2021).
- Idea Cittaslow. Available online: https://cittaslowpolska.pl/index.php/pl/idea (accessed on 11 October 2021).
- Cittaslow International Charter. 2017. Available online: https://www.cittaslow.org/sites/default/files/content/page/files/257/nuovo_statuto_cittaslow_en_12.05.pdf (accessed on 10 October 2021).
- Farelnik, E.; Stanowicka, A. Smart city, slow city and smart slow city as development models of modern cities. Olszt. Econ. J. 2016, 11, 359–370. [Google Scholar] [CrossRef] [Green Version]
- Wierzbicka, W. Socio-economic potential of cities belonging to the Polish National Cittaslow Network. Oeconomia Copernic. 2020, 11, 203–224. [Google Scholar] [CrossRef]
- Śleszyński, P. Gmina Dobra do Życia. Wskaźnik Jakości Życia w Gminach; Serwis Samorządowy PAP: Warszawa, Poland, 2021; Available online: https://samorzad.pap.pl/sites/default/files/2021-11/Raport_Gmina_dobra_do_zycia_0.pdf (accessed on 15 October 2021).
- Senetra, A.; Szarek-Iwaniuk, P. Socio-economic development of small towns in the Polish Cittaslow Network—A case study. Cities 2020, 103, 102758. [Google Scholar] [CrossRef]
- The European Green Deal, Brussels, 11.12.2019 COM(2019) 640. Available online: https://eur-lex.europa.eu/resource.html?uri=cellar:b828d165-1c22-11ea-8c1f-01aa75ed71a1.0002.02/DOC_1&format=PDF (accessed on 2 November 2021).
- Jaszczak, A.; Kristianova, K. Social and cultural role of greenery in development of Cittaslow towns. IOP Conf. Ser. Mater. Sci. Eng. 2019, 603, 032028. [Google Scholar] [CrossRef]
- Bogdański, M. Employment diversification as a determinant of economic resilience and sustainability in provincial cities. Sustainability 2021, 13, 4861. [Google Scholar] [CrossRef]
- Drobniak, A. Hybrydyzacja jako współczesny wzorzec rozwoju polskich miast. Studia Ekonomiczne. Zesz. Nauk. Uniw. Ekon. W Katowicach 2018, 365, 5–29. [Google Scholar]
- Tocci, G. Slow and intelligent cities. When slow is also smart. In Slow Tourism, Food and Cities. Pace and the Search for the ‘Good Life’; Clancy, M., Ed.; Routledge: London, UK, 2018; pp. 110–128. [Google Scholar]
- Ferrara, R. The smart city and the green economy in Europe: A critical approach. Energies 2015, 8, 4724–4734. [Google Scholar] [CrossRef] [Green Version]
- Landry, C. The Creative City. A Toolkit for Urban Innovators; Earthscan: London, UK, 2008. [Google Scholar]
- Stawasz, D.; Sikora-Fernandez, D. Koncepcja Smart City na tle Procesów i Uwarunkowań Rozwoju Współczesnych Miast; Wyd. Uniwersytetu Łódzkiego: Łódź, Poland, 2016. [Google Scholar]
- Mierzejewska, L. Rozwój Zrównoważony Miasta. Zagadnienia Poznawcze i Praktyczne; Wydawnictwo Naukowe Uniwersytetu Adama Mickiewicza w Poznaniu: Poznań, Poland, 2009. [Google Scholar]
- Mierzejewska, L. W poszukiwaniu nowych modeli rozwoju miasta. Studia Miej. 2011, 4, 81–92. [Google Scholar]
- Drobniak, A. Resilience and hybridization of development of small and medium towns in Poland. Olszt. Econ. J. 2019, 14, 47–62. [Google Scholar] [CrossRef]
- Roe, J.; McCay, L. Restorative Cities: Urban Design for Mental Health and Wellbeing; Bloomsbury: London, UK, 2021. [Google Scholar]
- Mayer, H.; Knox, P.L. Slow cities: Sustainable places in a fast world. J. Urban Aff. 2006, 28, 321–334. [Google Scholar] [CrossRef]
- Roma, G.; Fioretti, C.; Sampaolo, S.; Coletta, V. Cittaslow: From Italy to the World. International Network of Cities Where Living is Easy; Franco-Angeli: Milano, Italy, 2012. [Google Scholar]
- Clancy, M. Practicing slow. Political and ethical implications. In Slow Tourism, Food and Cities. Pace and the Search for the ‘Good Life’; Clancy, M., Ed.; Routledge Taylor & Francis Group: London, UK, 2017; pp. 63–75. [Google Scholar]
- Shi, Y.; Zhai, G.; Zhou, S.; Chen, W.; He, Z. Slow city development in China: Process, approaches and acceptability. Third World Q. 2019, 40, 1265–1282. [Google Scholar] [CrossRef]
- Local Data Bank of Statistics Poland. 2021. Available online: https://bdl.stat.gov.pl/BDL/dane/teryt/jednostka (accessed on 15 October 2021).
- Smart Energy Cities in a 100% Renewable Energy Context. Available online: https://www.sciencedirect.com/science/article/pii/S1364032120302136 (accessed on 21 September 2021).
- Bibri, S.E.; Krogstie, J. Smart Eco-City Strategies and Solutions for Sustainability: The Cases of Royal Seaport, Stockholm, and Western Harbor, Malmö, Sweden. Urban Sci. 2020, 4, 11. [Google Scholar] [CrossRef] [Green Version]
- Silverman, D. Doing Qualitative Research, 2nd ed.; Sage Publications: London, UK, 2005. [Google Scholar]
- Charmaz, K. Teoria Ugruntowana. In Praktyczny Przewodnik po Analizie Jakościowej; Wydawnictwo PWN: Warsaw, Poland, 2009. [Google Scholar]
- Glaser, B.G.; Strauss, A.L. Odkrywanie teorii ugruntowanej. In Strategie Badania Jakościowego; Nomos: Cracov, Poland, 2009. [Google Scholar]
- DEGURBA Classification. Available online: https://ec.europa.eu/eurostat/ramon/miscellaneous/index.cfm?TargetUrl=DSP_DEGURBA (accessed on 15 October 2021).
- Szyrski, M. Rola Samorządu Terytorialnego w Rozwoju Odnawialnych Źródeł Energii (OZE); Analiza Administracyjnoprawna, Wolters Kluwer: Warszawa, Poland, 2017. [Google Scholar]
- Rzeńca, A. (Ed.) EkoMiasto#Środowisko. In Zrównoważony, Inteligentny i Partycypacyjny Rozwój Miasta; Wydawnictwo Uniwersytetu Łódzkiego: Łódź, Poland, 2016. [Google Scholar]
- Sánchez-Pantoja, N.; Vidal, R.; Pastor, M.C. EU-funded projects with actual implementation of renewable energies in cities. Analysis of their concern for aesthetic impact. Energies 2021, 14, 1627. [Google Scholar] [CrossRef]
- Rakowska, J.; Ozimek, I. Renewable Energy Attitudes and Behaviour of Local Governments in Poland. Energies 2021, 14, 2765. [Google Scholar] [CrossRef]
- Busch, H.; McCormick, K. Local power: Exploring the motivations of mayors and key success factors for local municipalities to go 100% renewable energy. Energy Sustain. Soc. 2014, 4, 5. [Google Scholar] [CrossRef]
- Morell, I.A. Can Renewable Energy Contribute to to Poverty Reduction? A Case Study on Romafa, a Hungarian LEADER. In Evaluating the European Approach to Rural Development: Grass-Roots Experiences of the LEADER Programme; Granberg, L., Adersson, K., Kovách, I., Eds.; Routledge Taylor & Francis Group: London, UK; New York, NY, USA, 2015. [Google Scholar]
- Collier, U. Local authorities and climate protection in the European Union: Putting subsidiarity into practice? Local Environ. 1997, 2, 39–57. [Google Scholar] [CrossRef]
- Rakowska, J. Value and Aims of Investing Funds from Operational Programmes 2007–2013 by Rural Communes of Warmińsko-Mazurskie. Olszt. Econ. J. 2018, 13, 207–218. [Google Scholar] [CrossRef]
- Thellufsen, J.Z.; Lund, H. Roles of local and national energy systems in the integration of renewable energy. Appl. Energy 2016, 183, 419–429. [Google Scholar] [CrossRef]
- Terrados, J.; Almonacid, G.; Hontoria, L. Regional energy planning through SWOT analysis and strategic planning tools: Impact on renewables development. Renew. Sustain. Energy Rev. 2007, 11, 1275–1287. [Google Scholar] [CrossRef]
- Petersen, J.P. The application of municipal renewable energy policies at community level in Denmark: A taxonomy of implementation challenges. Sustain. Cities Soc. 2018, 38, 205–218. [Google Scholar] [CrossRef] [Green Version]
- Jones, E.; Leach, M. Devolving Residential Energy Efficiency Responsibility to Local Government: The case of HECA. Local Environ. 2000, 5, 69–81. [Google Scholar] [CrossRef]
- Batyk, I.; Woźniak, M. Benefits of belonging to the Cittaslow network in the opinion of residents of member cities. Econ. Reg. Stud. 2019, 12, 56–67. [Google Scholar] [CrossRef] [Green Version]
- Villamor, E.; Akizu-Gardoki, O.; Azurza, O.; Urkidi, L.; Campos-Celador, A.; Basurko, I.; Barcena Hinojal, I. European Cities in the Energy Transition: A Preliminary Analysis of 27 Cities. Energies 2020, 13, 1315. [Google Scholar] [CrossRef] [Green Version]
- Hoesen, V.J.; Letendre, S. Evaluating potential renewable energy resources in Poultney, Vermont: A GIS-based approach to supporting rural community energy planning. Renew. Energy 2010, 35, 2114–2122. [Google Scholar] [CrossRef]
- Sait, M.A.; Chigbu, U.E.; Hamiduddin, I.; De Vries, W.T. Renewable Energy as an Underutilised Resource in Cities: Germany’s ‘Energiewende’ and Lessons for Post-Brexit Cities in the United Kingdom. Resources 2019, 8, 7. [Google Scholar] [CrossRef] [Green Version]
- Bartłomiejski, R.; Kowalewski, M. Polish urban allotment gardens as ‘slow city’ enclaves. Sustainability 2019, 11, 3228. [Google Scholar] [CrossRef] [Green Version]
- Jaszczak, A.; Morawiak, A.; Żukowska, J. Cycling as a sustainable transport alternative in Polish Cittaslow Towns. Sustainability 2020, 12, 5049. [Google Scholar] [CrossRef]
- Farelnik, E. Determinants of the development of slow cities in Poland. Pr. Nauk. Uniw. Ekon. Wrocławiu 2020, 64, 18–36. [Google Scholar] [CrossRef]
- Ślusarz, G.; Gołębiewska, B.; Cierpiał-Wolan, M.; Twaróg, D.; Gołębiewski, J.; Wójcik, S. The role of agriculture and rural areas in the development of autonomous energy regions in Poland. Energies 2021, 14, 4033. [Google Scholar] [CrossRef]

| Research Questions | Data Categories and Sources | Methods |
|---|---|---|
| 1. Is the deployment of renewable energy included as a goal in the Cittaslow municipalities’ strategies? | Qualitative data from the development strategies of municipalities | Qualitative data analysis |
| 2. Do the local governments of Cittaslow municipalities in Poland support the deployment of renewable energy? | Qualitative data from the survey | Qualitative data analysis Shapiro-Wilk test non-parametric Kruskal-Wallis test Spearman’s rank test |
| 3. Is there any relation between the goals included in the development strategies and the practical deployment of various types of renewable energy in Cittaslow municipalities? | Qualitative data from the development strategies of municipalities and from the survey | descriptive statistics (N, %) Spearman’s rank test |
| 4. Is there any relation between the deployment of renewable energy in Cittaslow municipalities and their social and economic profiles? | Qualitative data from the survey and from Local Data bank, Statistics Poland | descriptive statistics |
| 5. Is there any relation between the deployment of renewable energy in Cittaslow municipalities and the living standards determined by the Quality of Life Synthetic Index? | Qualitative data from the survey and the Quality of Life Synthetic Index | descriptive statistics Spearman’s rank test |
| Categories of Municipalities by Population | Number of Renewable Energy Types | |||||||
|---|---|---|---|---|---|---|---|---|
| Three | Two | One | None | |||||
| N | % | N | % | N | % | N | % | |
| A | 2 | 66.7 | 3 | 42.9 | 3 | 21.4 | 1 | 9.1 |
| B | 1 | 33.3 | 3 | 42.9 | 5 | 35.7 | 7 | 63.6 |
| C | 0 | 0 | 1 | 14.2 | 6 | 42.9 | 3 | 27.3 |
| All | 3 | 100 | 7 | 100 | 14 | 100 | 11 | 100 |
| Categories of Municipalities by Population | Biomass Energy | Solar Energy | Wind Energy | Water Energy | Geothermal Energy | |||||
|---|---|---|---|---|---|---|---|---|---|---|
| N | % | N | % | N | % | N | % | N | % | |
| A | 1 | 100 | 7 | 30.4 | 5 | 62.5 | 0 | 0 | 2 | 66.7 |
| B | 0 | 0 | 9 | 39.2 | 2 | 25.0 | 2 | 100 | 1 | 33.3 |
| C | 0 | 0 | 7 | 30.4 | 1 | 12.5 | 0 | 0 | 0 | 0 |
| All | 1 | 100 | 23 | 100 | 8 | 100 | 2 | 100 | 0 | 100 |
| Kruskal-Wallis Test | H(2) | p |
|---|---|---|
| Solar energy | <0.05 | <0.05 |
| Wind energy | 4.216 | >0.04 |
| Water energy | 0.302 | >0.59 |
| Biomass | 0.493 | >0.49 |
| Geothermal energy | 1.770 | >0.19 |
| Categories of Municipalities by Population | Renewable Energy Declared in Strategies | Deployed Renewable Energy | ||
|---|---|---|---|---|
| N | % | N | % | |
| A | 6 | 23.1 | 15 | 40.6 |
| B | 14 | 53.8 | 14 | 37.8 |
| C | 6 | 23.1 | 8 | 21.6 |
| All | 26 | 100 | 37 | 100 |
| Type of Municipalities | Mean | Median | Max | Min | Range | Std. Dev | Var | |
|---|---|---|---|---|---|---|---|---|
| Total budget revenues in PLN per capita, average for 2014–2020 | passive | 4186.9 | 4066.1 | 5399.6 | 3722.1 | 1677.5 | 498.3 | 248,286.9 |
| active | 4086.3 | 4022.7 | 5388.5 | 3546.5 | 1842.1 | 440.4 | 193,934.1 | |
| Income of budgets from personal tax in PLN per capita, average for 2014–2020 | passive | 614.1 | 598.0 | 911.7 | 335.7 | 575.9 | 173.5 | 30,114.1 |
| active | 622.4 | 597.5 | 1384.3 | 316.6 | 1067.7 | 214.9 | 46,177.1 | |
| Income of budgets from corporate tax in PLN per capita, average for 2014–2020 | passive | 21.4 | 21.6 | 58.7 | 0.3 | 58.5 | 16.8 | 280.8 |
| active | 22.5 | 13.9 | 100.2 | 1.3 | 98.9 | 24.5 | 600.8 | |
| Percentage of people of pre-working age | passive | 18.1 | 18.4 | 22.0 | 15.9 | 6.1 | 1.7 | 2.9 |
| active | 17.5 | 17.2 | 20.0 | 15.3 | 4.7 | 1.3 | 1.7 | |
| Percentage of people of working age | passive | 60.7 | 61.3 | 63.0 | 58.1 | 4.9 | 1.7 | 2.9 |
| active | 60.7 | 60.7 | 63.3 | 58.5 | 4.8 | 1.6 | 2.4 | |
| Index of economic entities per 10,000, average for 2014–2020 | passive | 1102.6 | 1255.6 | 1643.3 | 54.5 | 1588.8 | 548.9 | 301,265.9 |
| active | 1114.3 | 1327.7 | 1785.3 | 96.4 | 1688.9 | 539.4 | 290,906.8 | |
| Number of social welfare beneficiaries per 10,000, average for 2014–2020 | passive | 1029.1 | 947.0 | 1847.0 | 290.0 | 1557.0 | 439.6 | 193,245.2 |
| active | 973.2 | 909.3 | 1730.2 | 313.0 | 1417.2 | 330.3 | 109,124.2 | |
| Percentage of residents using the sewage system, 2019 | passive | 93.2 | 93.8 | 100.0 | 79.6 | 20.4 | 6.3 | 40.0 |
| active | 95.4 | 96.8 | 100.0 | 78.9 | 21.1 | 4.9 | 24.4 | |
| Percentage of residents using the water supply system, 2019 | passive | 73.2 | 75.2 | 96.7 | 38.3 | 58.4 | 17.9 | 320.4 |
| active | 73.6 | 76.2 | 99.6 | 38.2 | 61.4 | 16.5 | 272.0 | |
| Percentage of residents using the gas network, 2019 | passive | 38.1 | 52.5 | 89.2 | 0.0 | 89.2 | 31.3 | 976.5 |
| active | 37.1 | 41.2 | 88.7 | 0.0 | 88.7 | 30.5 | 930.8 | |
| Number of unemployed people, average for 2014–2020 | passive | 596.2 | 519.4 | 1068.6 | 174.4 | 894.1 | 326.8 | 106,773.4 |
| active | 764.7 | 796.3 | 1406.4 | 202.3 | 1204.1 | 375.5 | 141,005.4 |
| Categorization of Municipalities by Population | Max | Min | Average | Range | Var |
|---|---|---|---|---|---|
| A | 57.14 | 45.91 | 49.52 | 11.23 | 18.5 |
| B | 59.06 | 44.02 | 50.14 | 15.04 | 15.2 |
| C | 55.53 | 44.26 | 47.69 | 11.27 | 10.8 |
| All | 59.06 | 44.02 | 49.28 | 15.04 | 15.0 |
Publisher’s Note: MDPI stays neutral with regard to jurisdictional claims in published maps and institutional affiliations. |
© 2021 by the authors. Licensee MDPI, Basel, Switzerland. This article is an open access article distributed under the terms and conditions of the Creative Commons Attribution (CC BY) license (https://creativecommons.org/licenses/by/4.0/).
Share and Cite
Batyk, I.M.; Farelnik, E.; Rakowska, J.; Maciejczak, M. Polish Cittaslow Local Governments’ Support for Renewable Energy Deployment vs. Slow City Concept. Energies 2022, 15, 201. https://doi.org/10.3390/en15010201
Batyk IM, Farelnik E, Rakowska J, Maciejczak M. Polish Cittaslow Local Governments’ Support for Renewable Energy Deployment vs. Slow City Concept. Energies. 2022; 15(1):201. https://doi.org/10.3390/en15010201
Chicago/Turabian StyleBatyk, Iwona M., Eliza Farelnik, Joanna Rakowska, and Mariusz Maciejczak. 2022. "Polish Cittaslow Local Governments’ Support for Renewable Energy Deployment vs. Slow City Concept" Energies 15, no. 1: 201. https://doi.org/10.3390/en15010201
APA StyleBatyk, I. M., Farelnik, E., Rakowska, J., & Maciejczak, M. (2022). Polish Cittaslow Local Governments’ Support for Renewable Energy Deployment vs. Slow City Concept. Energies, 15(1), 201. https://doi.org/10.3390/en15010201