Article

Chopper-Based Control Circuit for BESS Integration in Solar PV Grids

by
B. V. Rajanna
* and
Malligunta Kiran Kumar
Electrical and Electronics Engineering, Koneru Lakshmaiah Education Foundation, Guntur 522502, India
*
Author to whom correspondence should be addressed.
Energies 2021, 14(6), 1530; https://doi.org/10.3390/en14061530
Submission received: 26 January 2021 / Revised: 27 February 2021 / Accepted: 2 March 2021 / Published: 10 March 2021

Abstract

:
The power delivered by photovoltaic (PV) arrays is dependent on environmental factors, and hence the availability and quality of power delivered by the PV array is low. These issues can be mitigated by integrating a battery energy storage system (BESS) with PV arrays. The integration of the BESS with PV arrays requires controller circuits to regulate power flow between the BESS, PV array, and the load. In this paper, a boost converter-based controller is proposed. The proposed controller has higher reliability and efficiency, and lower operational complexity. It improves the power quality and availability by adjusting the power flow to/from the BESS while delivering the required load power. A simulation study was performed to validate the proposed controller under varying irradiance and temperature of the PV array. The controller was validated against both lithium-ion and lead-acid BESSs.

1. Introduction

The high energy demand and pollution awareness has led to the need for green energy systems [1]. As a result, a lot of focus has been on using renewable energy sources. Solar power and the use of PV arrays have emerged as a promising technology due to the abundant availability of solar energy. This has paved the way for small and medium-sized PV grids operating in remote locations. Integration of PV array is a great challenge and is not like conventional power plants [2]. The use of PV arrays has some major challenges, as follows:
  • They are non-dispatchable;
  • Uncertainty of generation time;
  • Low availability and power quality.
The power delivered by a PV grid is subject to environmental factors. The power delivered may change based on the amount of irradiance received by the PV panels and the temperature of the PV modules. These types of power sources which generate power but cannot deliver power in a reliable manner are called non-dispatchable power sources.
Solar energy is not available during night; therefore, the availability of a conventional PV grid is very small. In order to improve this, a hybrid solar PV grid [3] with a battery energy storage system (BESS) is used. This increases the efficiency of the grid in terms of availability and power quality. Non-dispatchable resources are converted to dispatchable energy sources by integrating them with an energy storage system [4]. The standalone PV array grids in conjunction with integrated energy storage systems can play an important role in power delivery to isolated areas far away from distribution systems [5]. The annual operating cost of the hybrid PV grid has decreased due to reductions in the cost of the batteries. This has led to a wider adoption of PV arrays with BESSs in standalone off-grid peak power delivery systems [6,7,8,9,10,11,12]. BESSs, along with PV arrays, are needed to reduce power disturbances in the system, for providing continuous power to the load, and for improving utilization factors of the system.
The integration of a BESS to a grid requires a controller to regulate the power flow between the PV grids, the BESS, and the connected load. In previous works, controllers for integrating the batteries with PV arrays have used multiple H bridges [13]. The power generated from the PV array is converted to AC, and then if excess power is generated, AC to DC converters is used to charge the batteries [14]. The AC-DC converters need complex gating signals and introduce harmonics in the output power, thus reducing the power quality. Capacitor banks are used to filter these harmonics and improve the power quality [15]. Due to the large number of components used in these converters, there are multiple points of failure, resulting in reduced reliability. In the conventional approach [16], the DC power is converted to AC and then back to DC, resulting in a loss of power due to dissipation in the conversion process. In this paper, a chopper-based control circuit is proposed to integrate the BESS with a standalone PV grid [17]. The proposed controller operates on the DC side of the PV grid and directly taps into the DC power generated by the PV array. Thus, a simpler DC-DC converter is sufficient to control the power flow to/from the BESS [18]. Due to reductions in the number of components and a simpler gating signal requirement, the proposed controller has a higher efficiency and reliability, and lower operational complexity. The proposed controller implements a closed loop control circuit to regulate the power flow between the BESS and PV array and maintain steady output power, even when the power generated by the PV array varies due to variation in irradiance [19,20]. Most of smart grids and micro grids use lithium-ion and lead-acid batteries in the BESS [21,22,23,24]. The proposed controller was validated by performing a simulation study using both a lithium-ion and lead-acid BESS [25,26].
The paper is organized in the following manner. The proposed controller is discussed in Section 2. A description of the simulation circuit and its components are given in Section 3. The simulation scenarios are discussed in Section 4. The simulation results and observations are discussed in Section 5. The conclusion is given in Section 6.

2. Proposed Controller

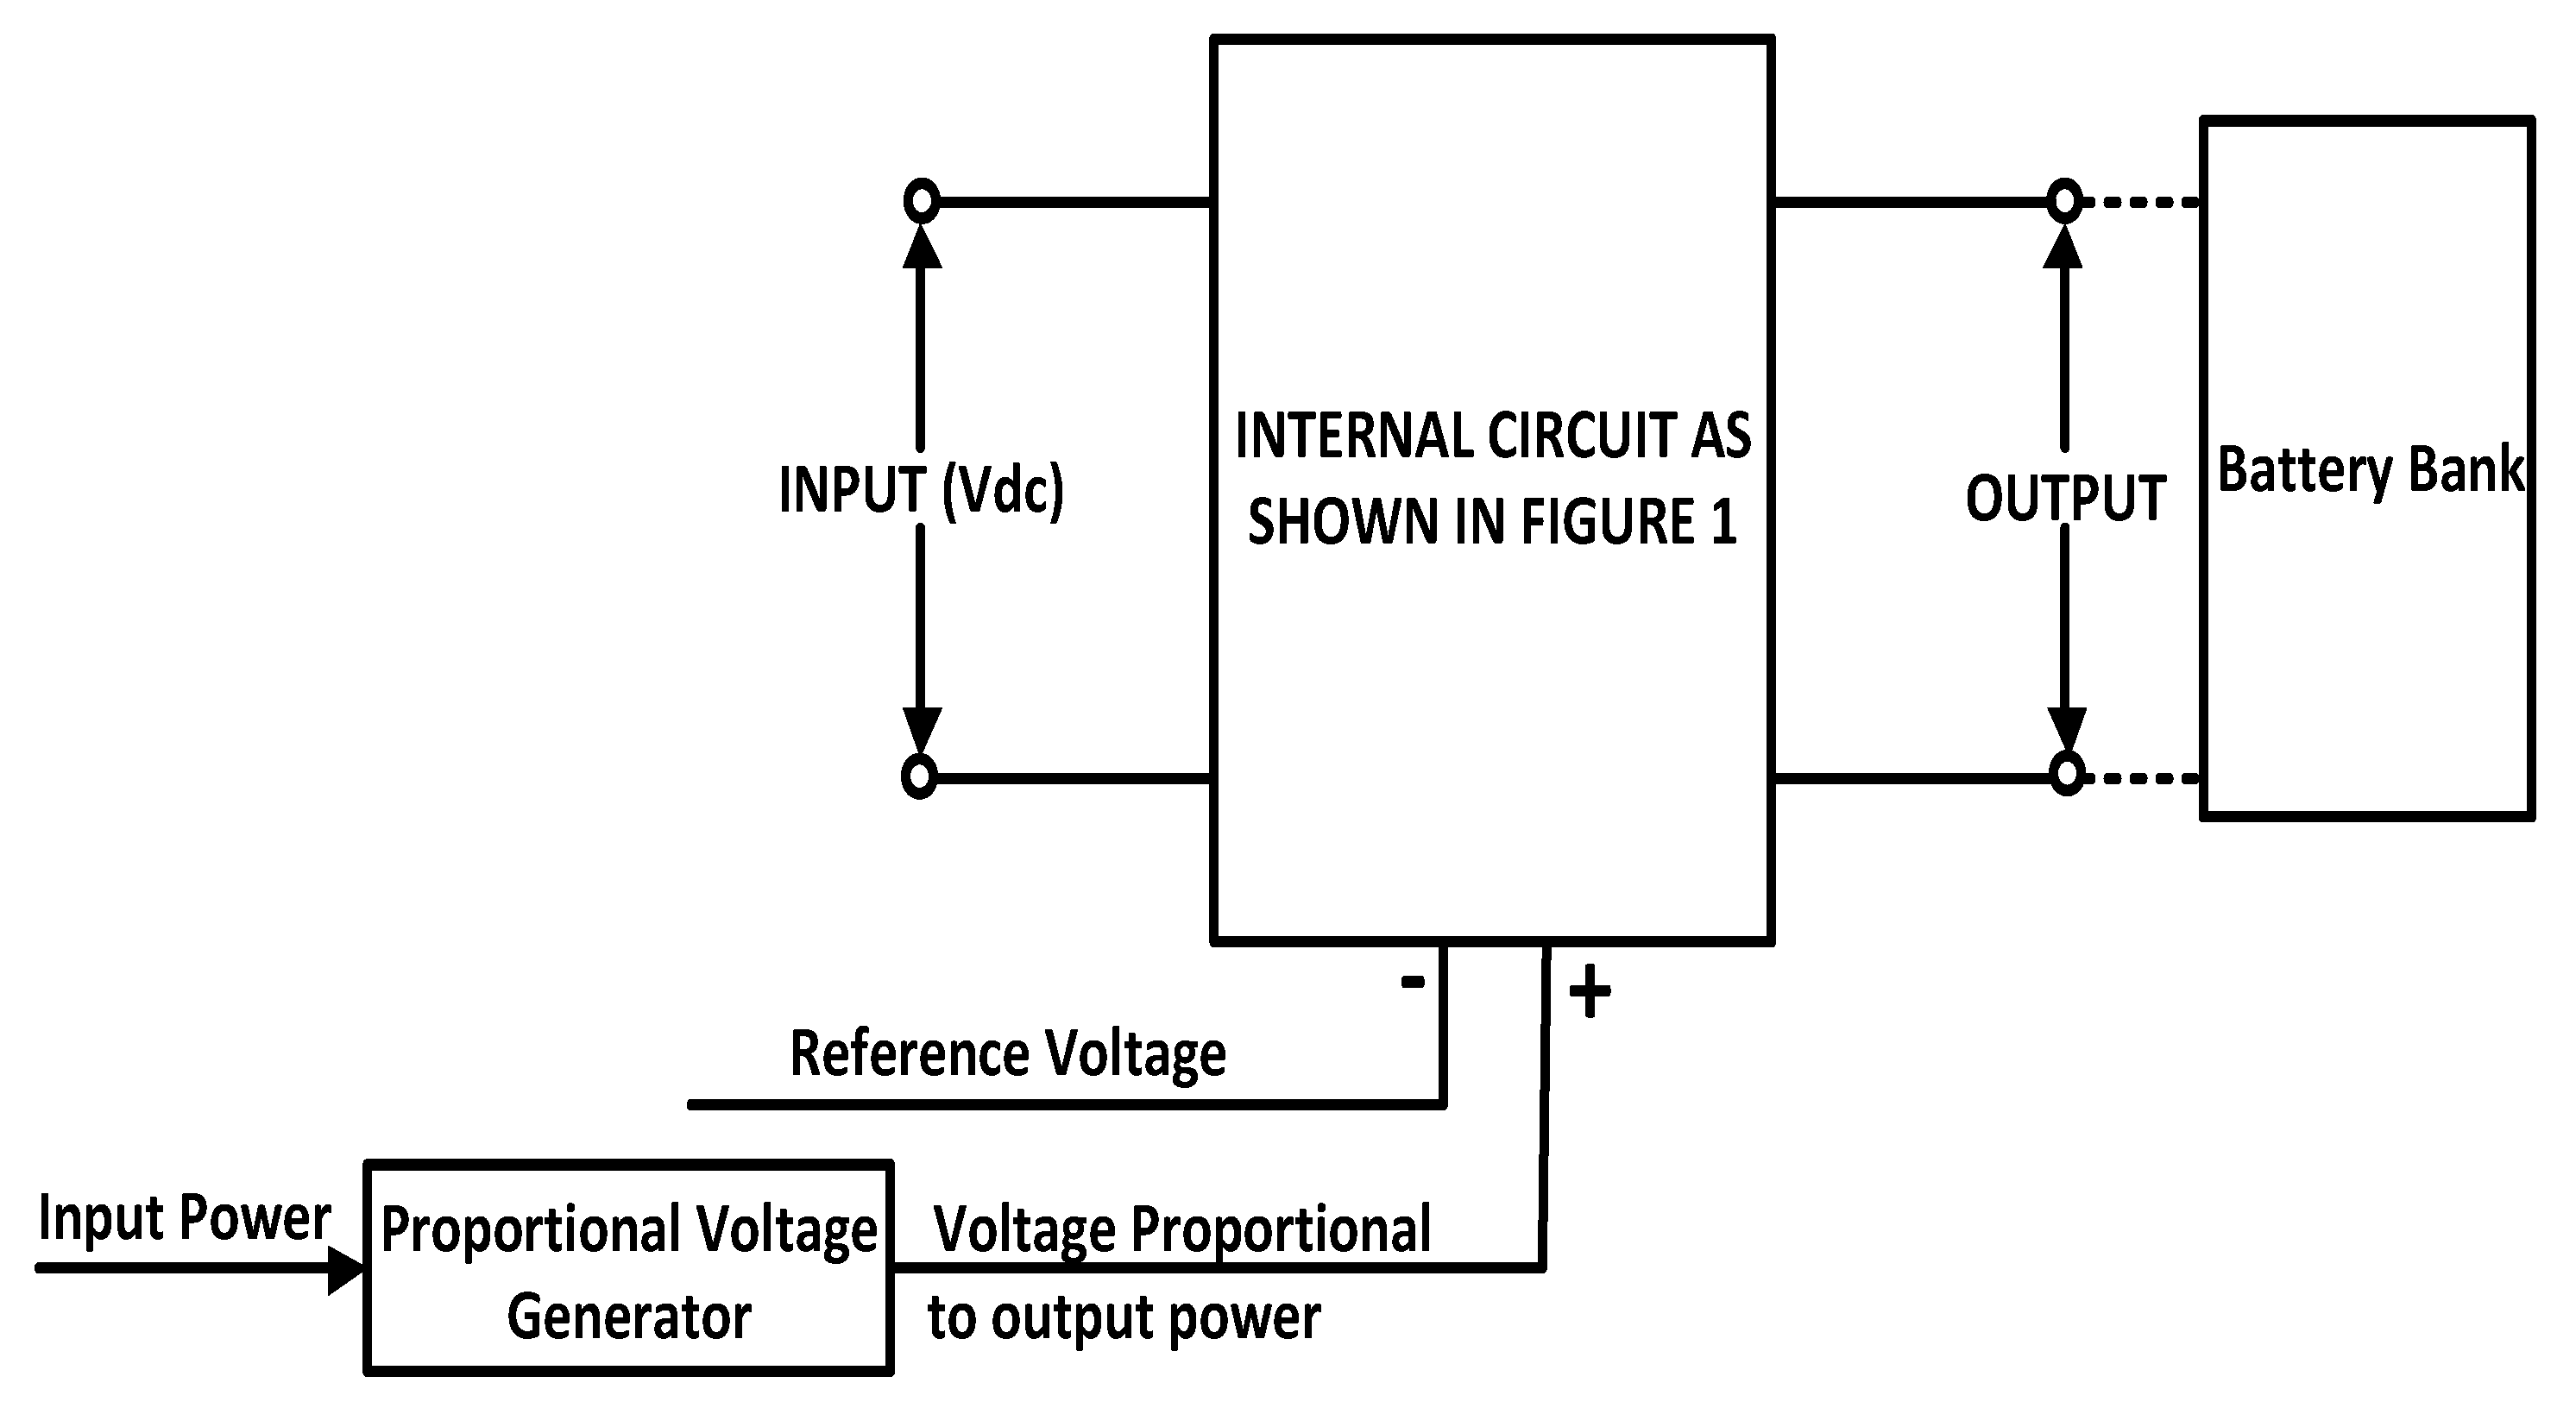
The diagram below in Figure 1 shows the proposed controller which consists of boost converter, Insulated-gate bipolar transistor (IGBT) switch, Proportional Integral (PI) controller, Comparator and Duty Cycle Generator.
The value of the output power delivered on the load side is used as feedback to the discharge controller. The feedback signal is then compared with the set reference value and a control signal is generated. Using the control signal generated from the comparator, the PI controller generates a duty cycle value. This value is fed to the duty cycle generator, which in turn is fed to the IGBT switch of the boost converter. Based on the duty cycle of the IGBT switch, the boost converter changes the output power delivered to the load side. The accuracy of the corrective action taken depends on the tuning parameters and the type of controller used to generate the duty cycle.
The proposed controller can further be enhanced by using a proportional-integral-derivative (PID) controller instead of using a PI controller. A PI controller is used because it is easy to tune and will sufficiently demonstrate the proof of concept.

Operating Range of Controller

The operating range of the proposed controller is directly related to the operational range of the boost converter being used. The operating voltage of the boost converter should be chosen in such a way that it matches the input voltage variation and provide the required output voltage.
The input voltage variation is dependent on the type of batteries used in the battery bank and the maximum depth of discharge (DOD) until which the battery is used. For example, the voltage variations of lead-acid batteries are greater when compared to lithium-ion batteries, so if this controller needs to be used with lead-acid battery banks then a converter with a wider operating range will have to be selected, resulting in higher costs.
The input and output voltage relationship of a boost converter is given by Equation (1) as:
V o = V i 1 D

3. Simulation Model of Photovoltaic Grid System with Battery Integration Using a Controller

In this section, a detailed description of the simulation model of a PV grid system with a battery is introduced. The simulation model was constructed using Simulink blocks in the MATLAB R2018b environment.

3.1. Description of Simulation Model and Its Components

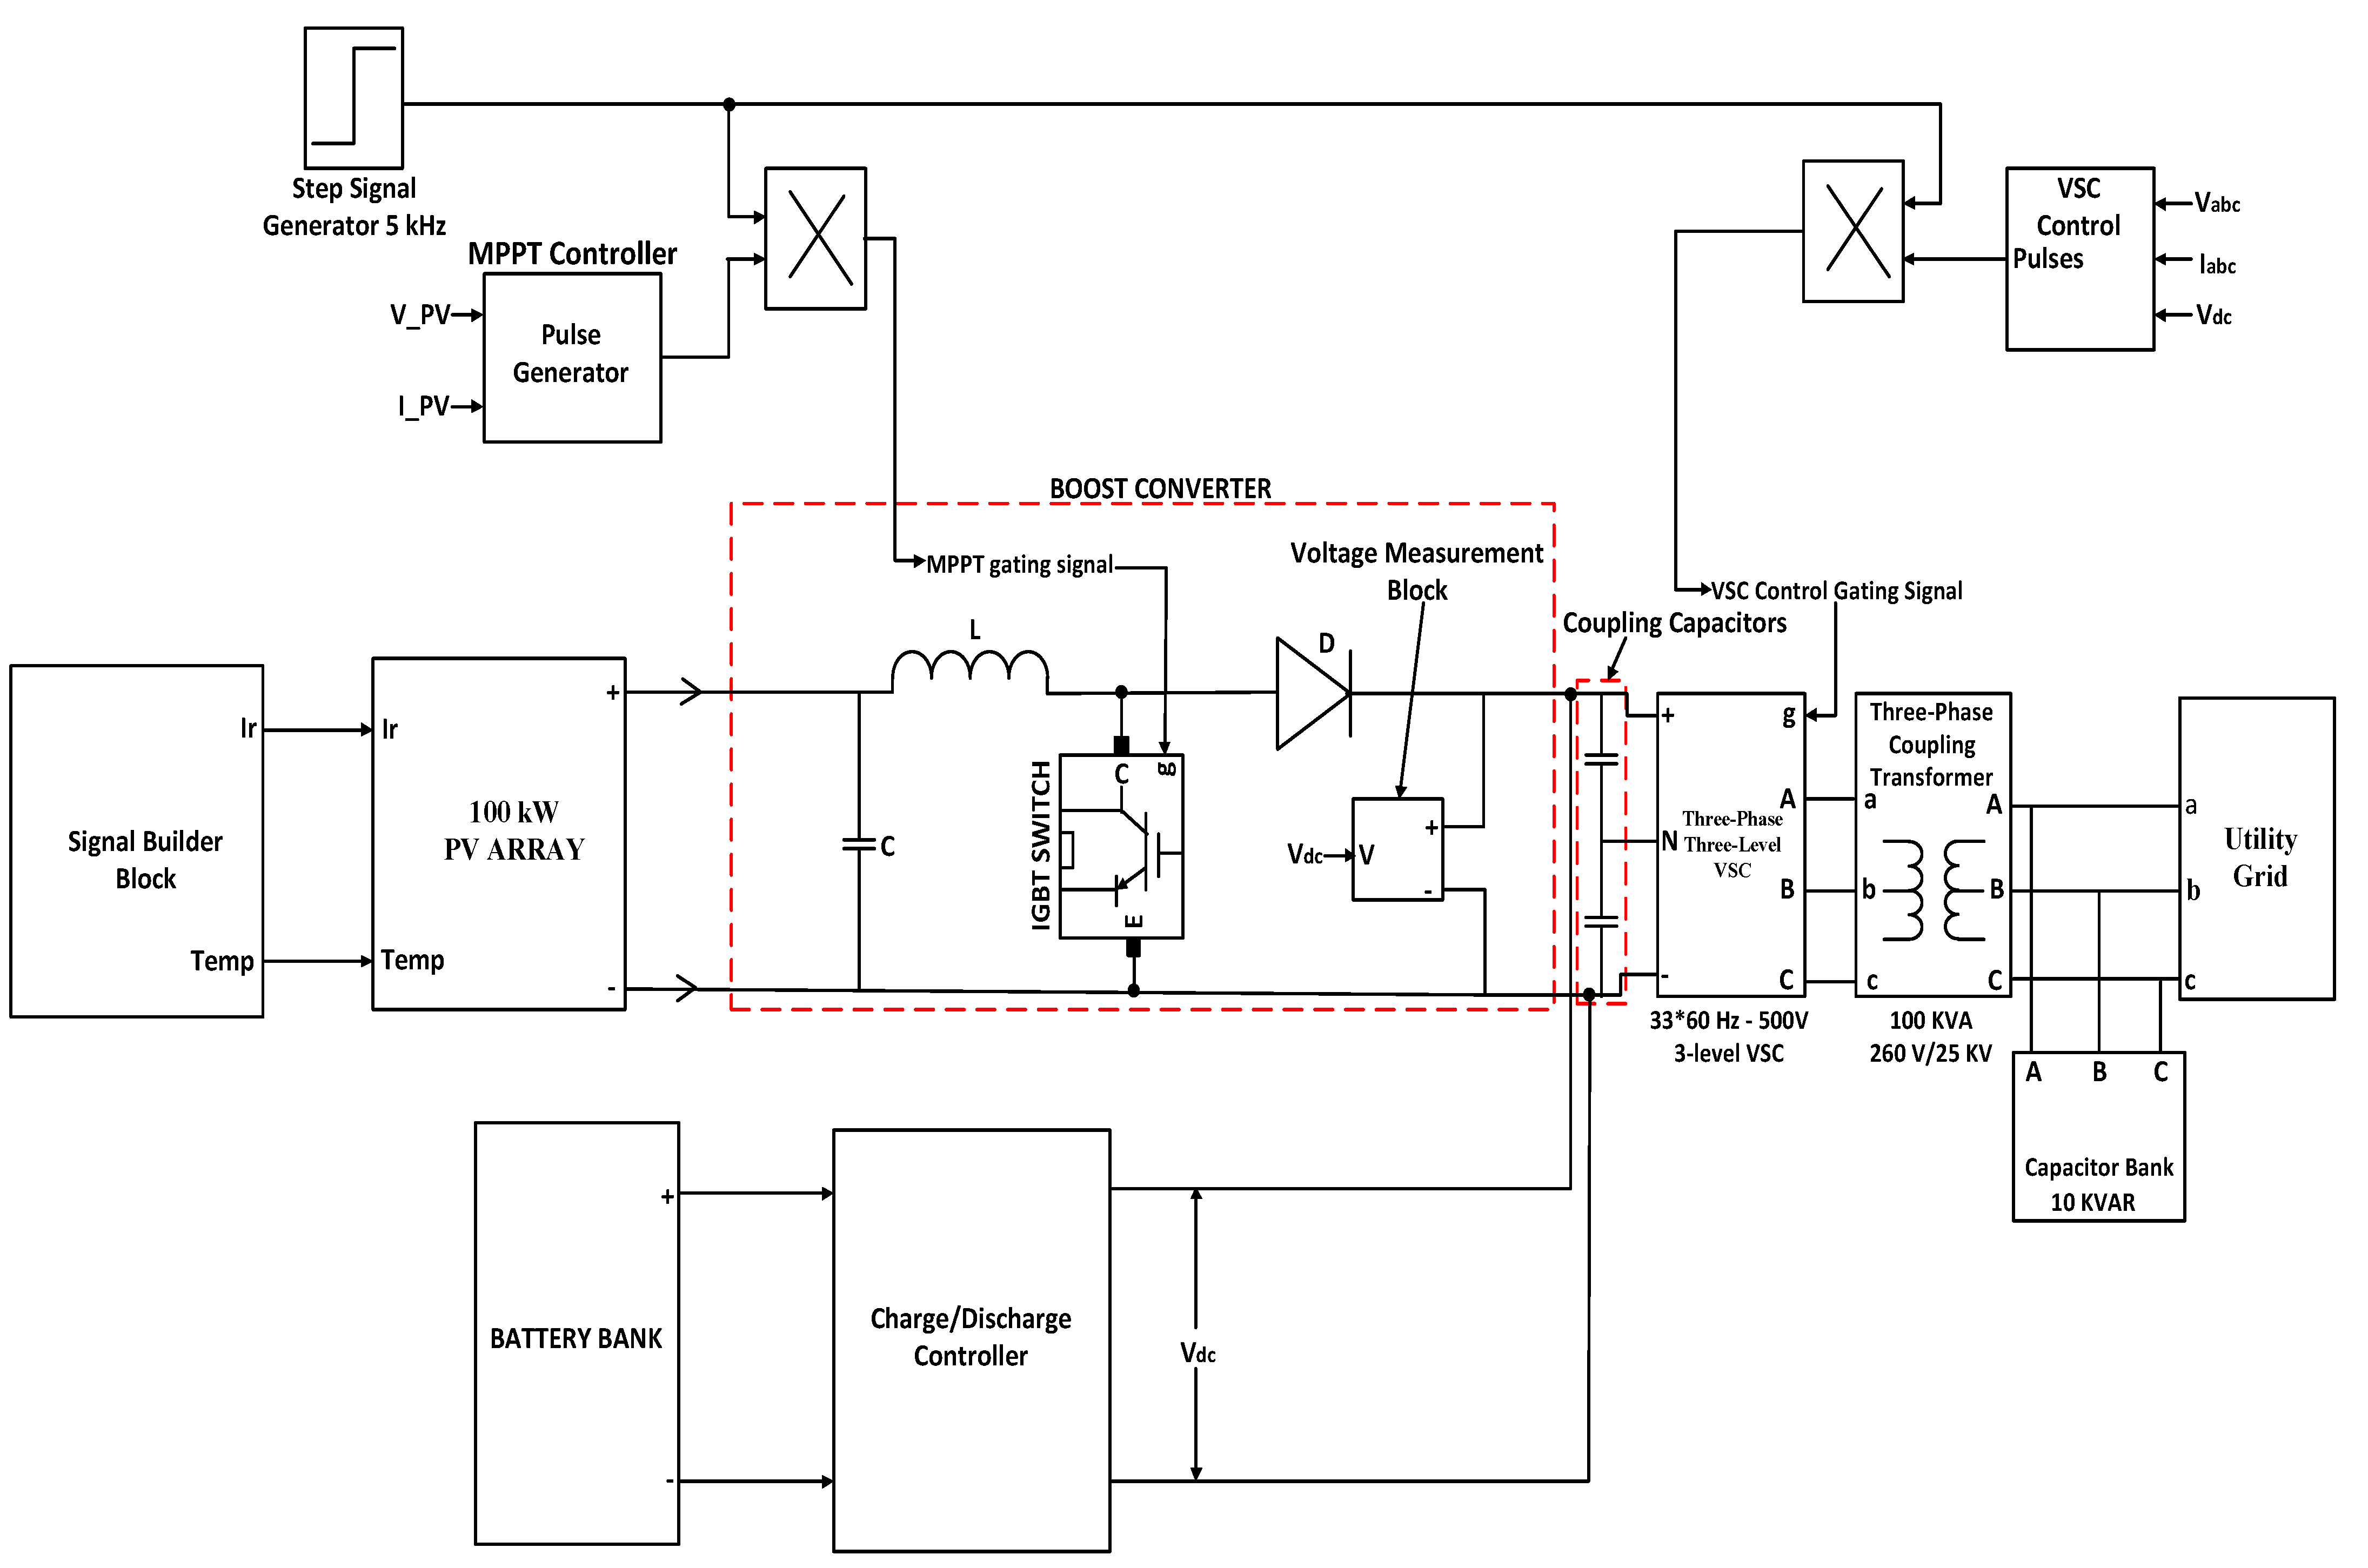
The detailed PV system configuration and system description block diagram are shown in Figure 2. Power delivered by the 100 kW PV array is channeled through a DC-DC boost converter which is connected to a three-phase, three-level voltage source converter (VSC). A three-phase three-level VSC feeds into a coupling transformer used to deliver power to a 25 kV grid. The algorithm employed in maximum power point tracking (MPPT) is “Incremental Conductance + Integral Regulator” [6].
The components contained in the detailed model are as follows:
  • PV Array: Maximum power delivered by the PV array is 100 kW at 1000 W/m2 solar irradiance.
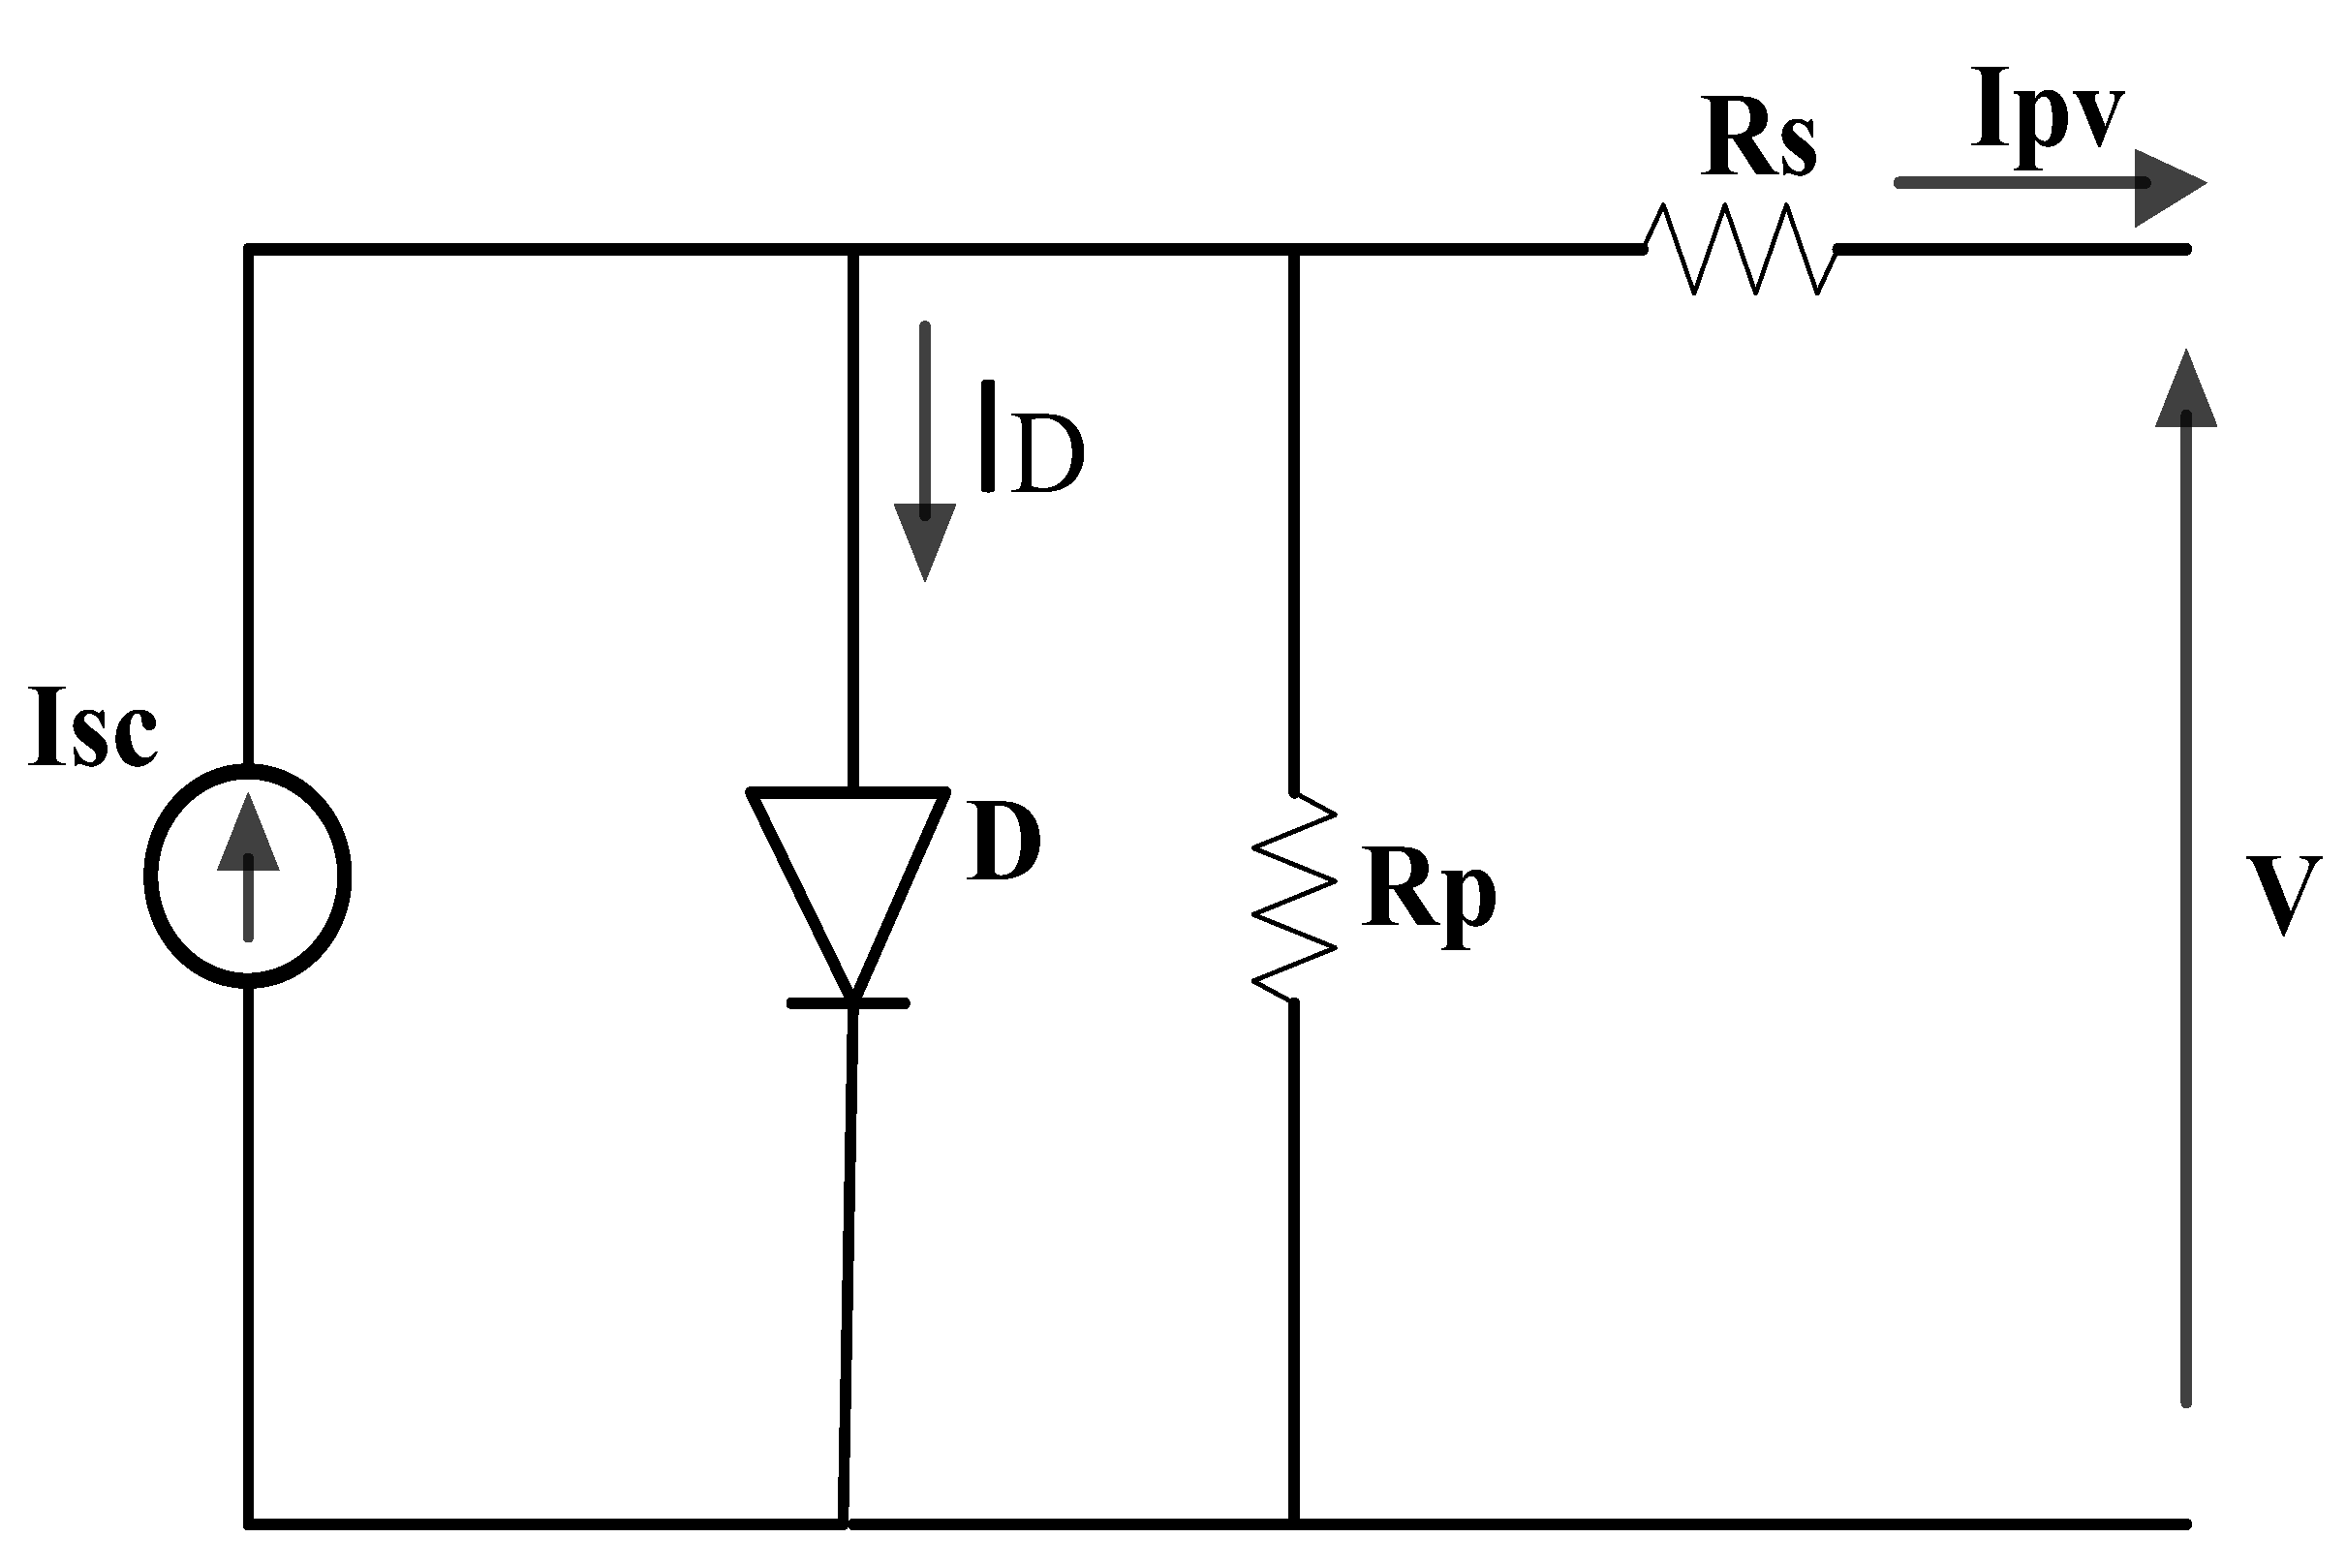
A total of 330 Sun Power (San Jose, CA, USA) modules (SPR-305E-WHT-D) were used in the 100 kW PV array. Five modules were connected in series making a string; 66 such strings were connected in parallel. The solar cell equivalent circuit is shown in Figure 3. Solar cell characteristics are given by Equation (2). The selection of PV array ratings is given in Table 1.
I p v =   N p I s c N s I 0 { e ( q ( V p v + I p v R s ) N s Q d B c T p n ) 1 } V p v + ( I p v R s R p )
The DC link voltage is stepped up by a DC-DC boost converter which is connected to the PV array. Boost converters’ suitable switching regulates the PV voltage for maximum average PV array power output. PV array operational voltage at a given irradiation condition varies with the PV power flow. The inverter and boost converter are connected by using the DC link in between them.
The solar irradiance (W/m2) and temperature (°C) were the two inputs given to the block PV array. The block of the signal builder in Simulink library was used to set the input values for PV array solar irradiance and temperature.
  • DC-DC boost converter: At maximum power, PV output voltage was 273 V DC, which increased to 500 V DC by a DC-DC boost converter of 5 kHz. The optimization of the switching duty cycle was performed by a maximum power point tracking (MPPT) controller by using the “Incremental Conductance + Integral Regulator” algorithm. The duty cycle is automatically varied by the MPPT system to provide the voltage required to take out maximum power;
  • Three-level three-phase VSC: The simulation circuit and working details of the VSC are presented elsewhere. The output voltage of boost converter was converted from 500 V DC to 260 V AC, and the power factor of unity was maintained by the VSC. VSC uses a switching frequency of 1980 Hz;
  • Capacitor bank:VSC harmonics are filtered by DC link capacitors;
  • Three-phase coupling transformer: Three-phase coupling transfer of rating 100 kVA 260 V/25 kV was used for stepping-up the VSC output voltage of 260 V AC to 25 kV AC;
  • Utility grid: The utility grid consisted of a 25 kV distribution feeder and a 120 kV equivalent transmission system;
  • The battery bank and charge/discharge controllers are discussed in separate sections.

3.2. Battery Bank Description

Four batteries of either lead-acid or lithium-ion type were connected in parallel to form a battery bank. The PV array was connected to the boost converter and maintained 500 V at coupling capacitor. The voltage across coupling capacitors is marked as Vdc in Figure 2. For the batteries to maintain the same voltage at coupling capacitors, the battery Simulink block voltage parameter was set to 582.5 V. Demand of the utility grid was 100 kW. Minimum voltage to be maintained at coupling capacitor had to match the voltage generated by the PV array, i.e., 500 V. Many battery models are available in the literature [27,28,29,30,31,32,33,34,35,36,37,38,39] but not all of them can be used in simulation because of algebraic loop problem. A generic battery model from the MATLAB SimPower Systems library with appropriate parameters was used for analyzing battery charging and discharging performance [40]. The selection of battery ratings is given in Table 2.

Reference Equations of the Generic Battery Model

For the lead-acid battery type, the model uses these equations:
The discharge model ( i > 0 ) is given in Equation (3) [40].
f 1 ( i t , i , i , E x p ) = E 0 K · Q Q i t · i K · Q Q i t · i t + L a p l a c e 1 ( E x p ( s ) S e l ( s ) · 0 )
The charge model ( i < 0 ) is given in Equation (4) [40].
f 2 ( i t , i , i , E x p ) = E 0 K · Q i t + 0.1 · Q · i K · Q Q i t · i t + L a p l a c e 1 ( E x p ( s ) S e l ( s ) · 1 s )
Sel(s) = 0 during battery discharge, Sel(s) = 1 during battery charging.
For the lithium-ion battery type, the model uses these equations:
The discharge model ( i > 0 ) is given in Equation (5) [40].
f 1 ( i t , i , i ) = E 0 K · Q Q i t · i K · Q Q i t · i t + A · exp ( B · i t )
The charge model ( i < 0 ) is given in Equation (6) [40].
f 2 ( i t , i , i ) = E 0 K · Q i t + 0.1 · Q · i K · Q Q i t · i t + A · exp ( B · i t )
V b a t = E R b a t I b a t
Equation (7) shows the simple dynamic battery model which consisted of a controlled-voltage source (E), which was the battery open-circuit voltage and battery variable internal resistance ( R b a t ).
The discharge-controlled voltage is given in Equation (8) [40].
E = E 0 K Q m a x Q m a x Q Q K Q m a x | Q | 0.1 Q m a x i + A e B Q
The maximum battery energy extracted is represented by Q in Equation (9) [41].
Q = I b a t d t
Battery state of charge (SOC) is given in Equation (10) [41,42].
SOC = 100 ( 1 Q Q m a x )
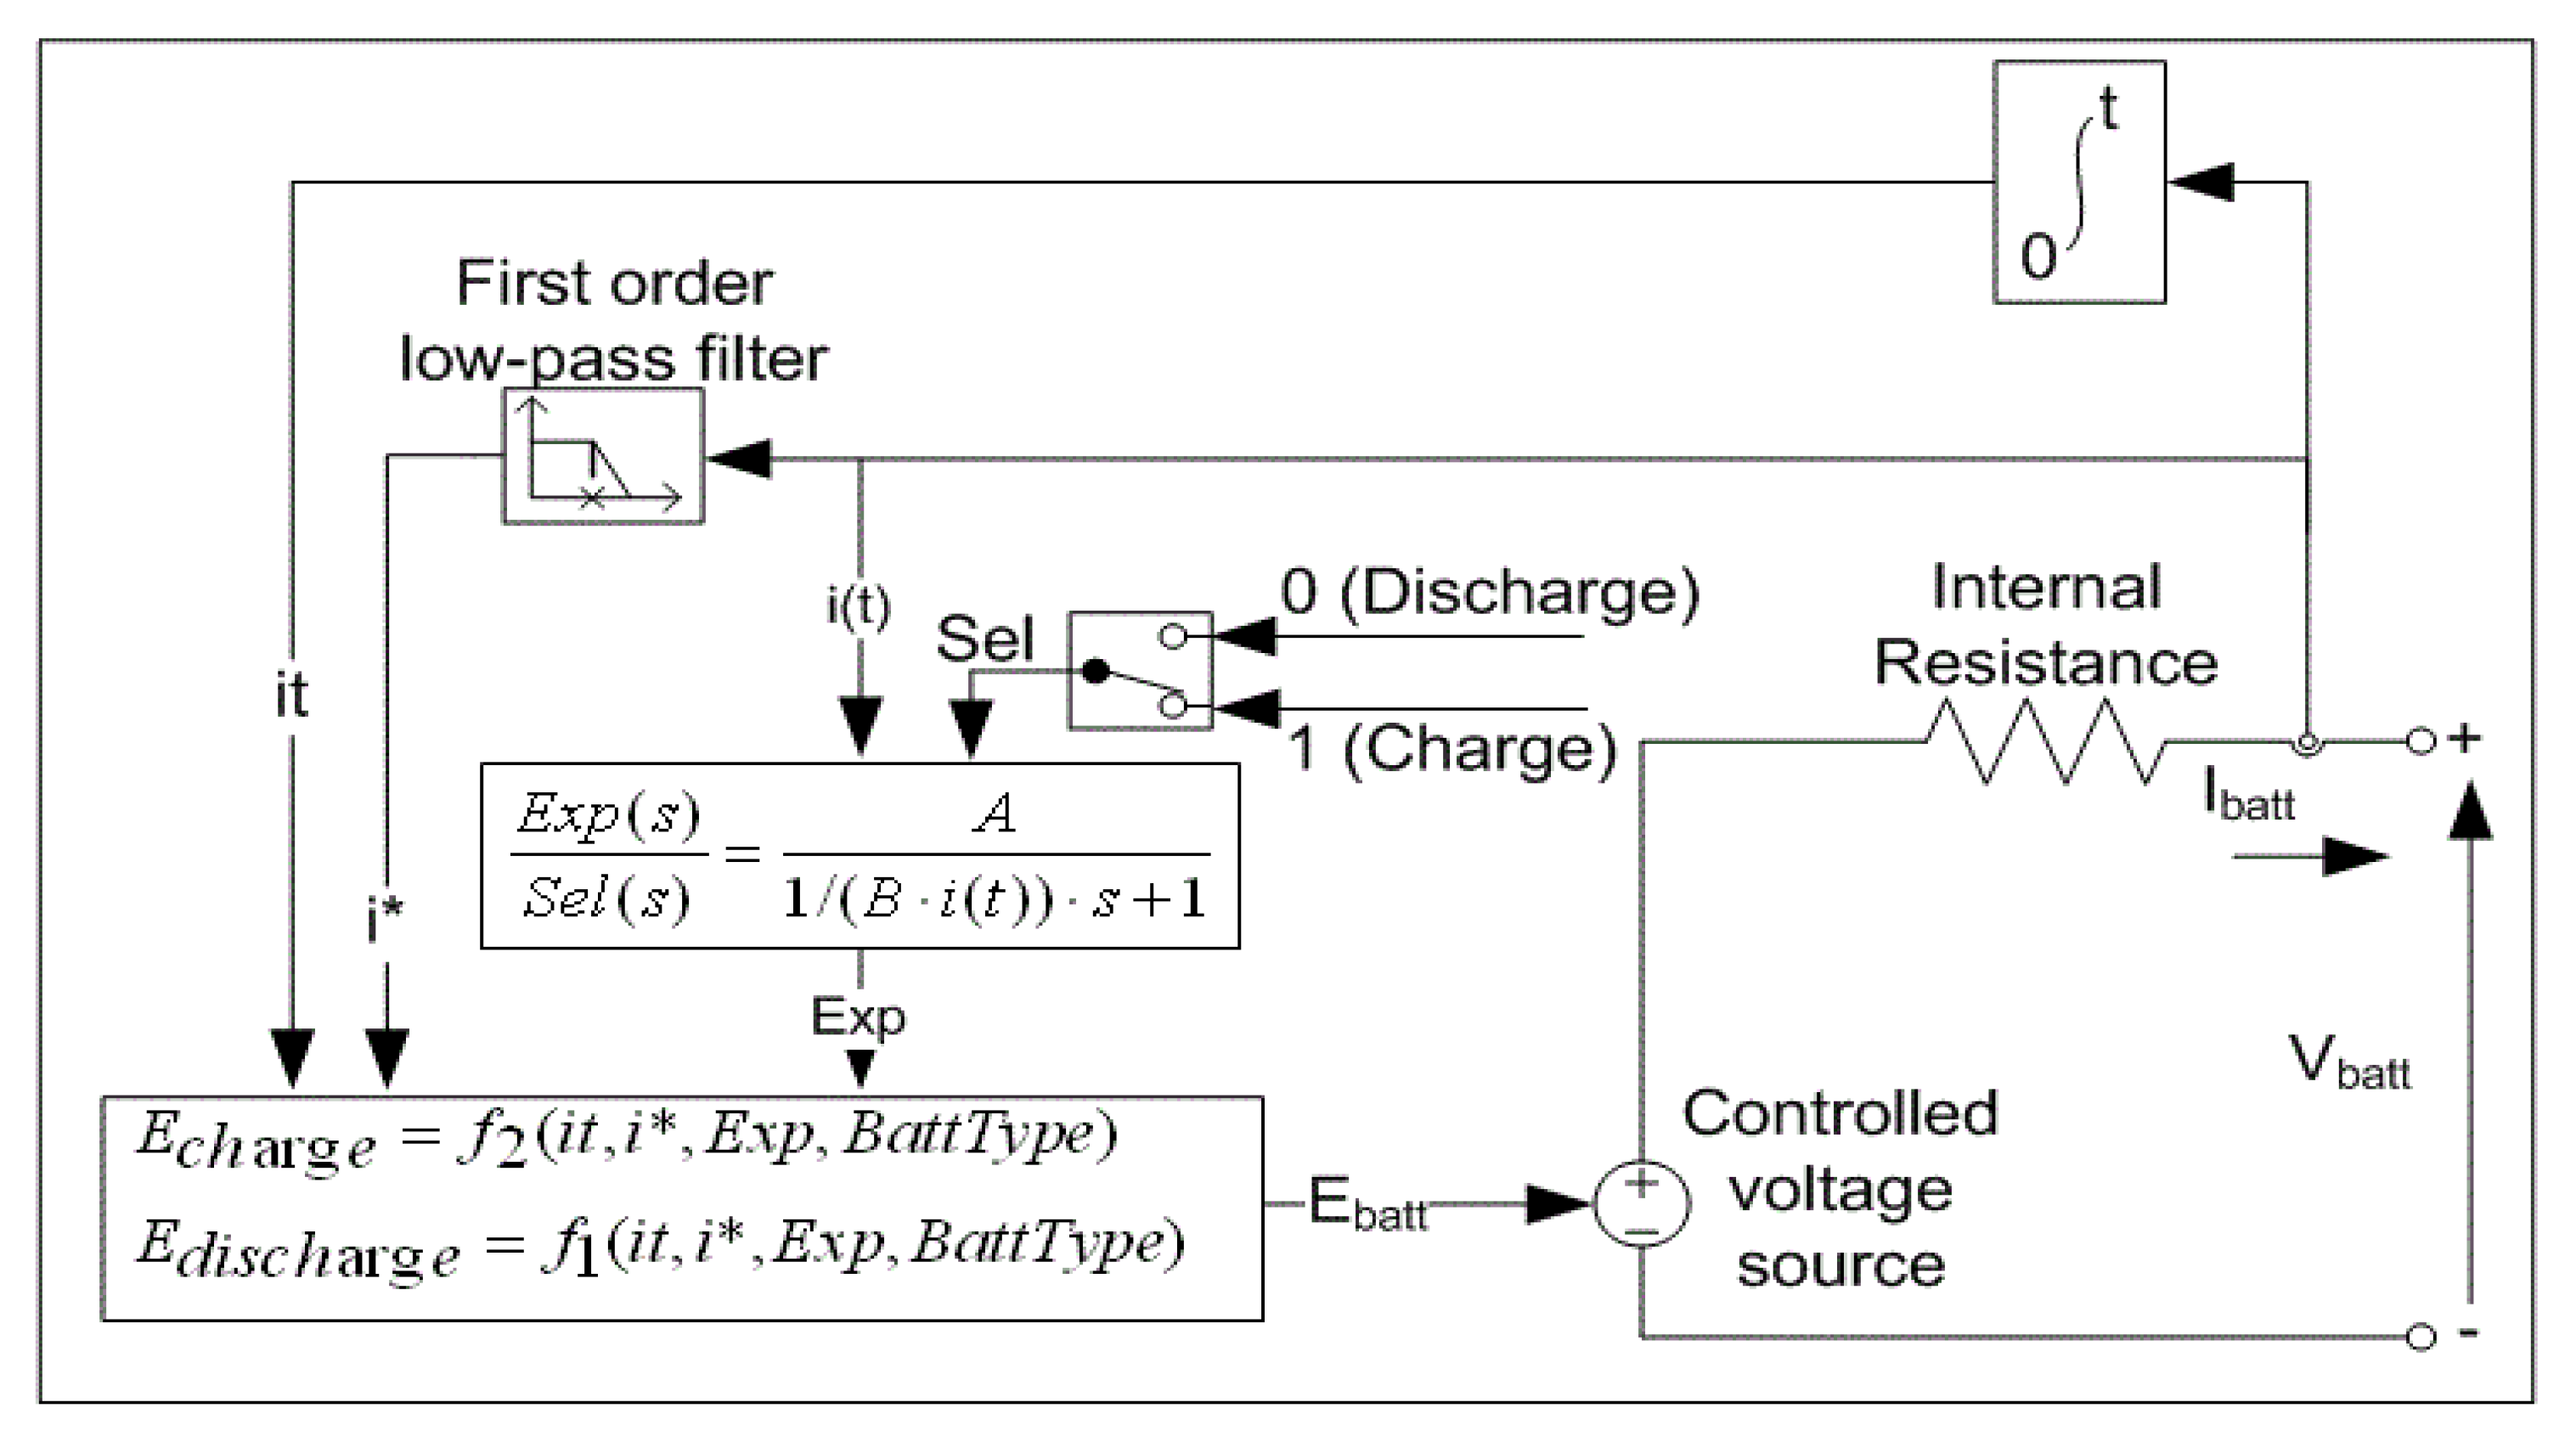
The Simulink diagram of the generic battery model is shown in Figure 4.

3.3. Charge/Discharge Controller

The power generated by the PV array depends on environmental factors; due to this, the energy delivered or absorbed by the battery has to be constantly throttled to maintain constant power delivery on the load side. For this purpose, charge and discharge controllers are used.

4. Simulation Scenarios

Two scenarios were simulated to analyze the discharging and charging performance of the batteries while using the proposed controller.
Scenario 1: In this scenario, the PV array was initially supplying power of 98.72 kW to utility grid. At t = 1 s, solar irradiation was brought down from 1000 W/m2 to 250 W/m2. A battery bank as connected to the PV array to supply power to the utility grid. This scenario simulates a situation in which the PV array is not able to meet utility grid load demand due to cloudiness in the sky. It is expected that under such circumstances, the additional power demand is met by the battery bank. The controller used starts extracting power from the battery bank and supplies the required load power. The proposed controller was connected to the simulation circuit as shown in Figure 5. The controller operation of the Figure 5 is shown in Section 2. The controller circuit comprises a boost converter, PI controller, duty cycle generator, and a comparator. The value of the output power delivered to the load was used as feedback to the controller. The feedback signal is then compared with the set reference value, and a control signal is generated. Using the control signal generated from the comparator, the PI controller generates a duty cycle value. This value is fed to the duty cycle generator which in turn is fed to the IGBT switch of the boost converter. Based on the duty cycle of the IGBT switch, the boost converter changes the output power delivered to the load side. The controller can be further enhanced by using a PID controller instead of using a PI controller.
The details of the working and the changes taking place in the simulation circuit are as follows.
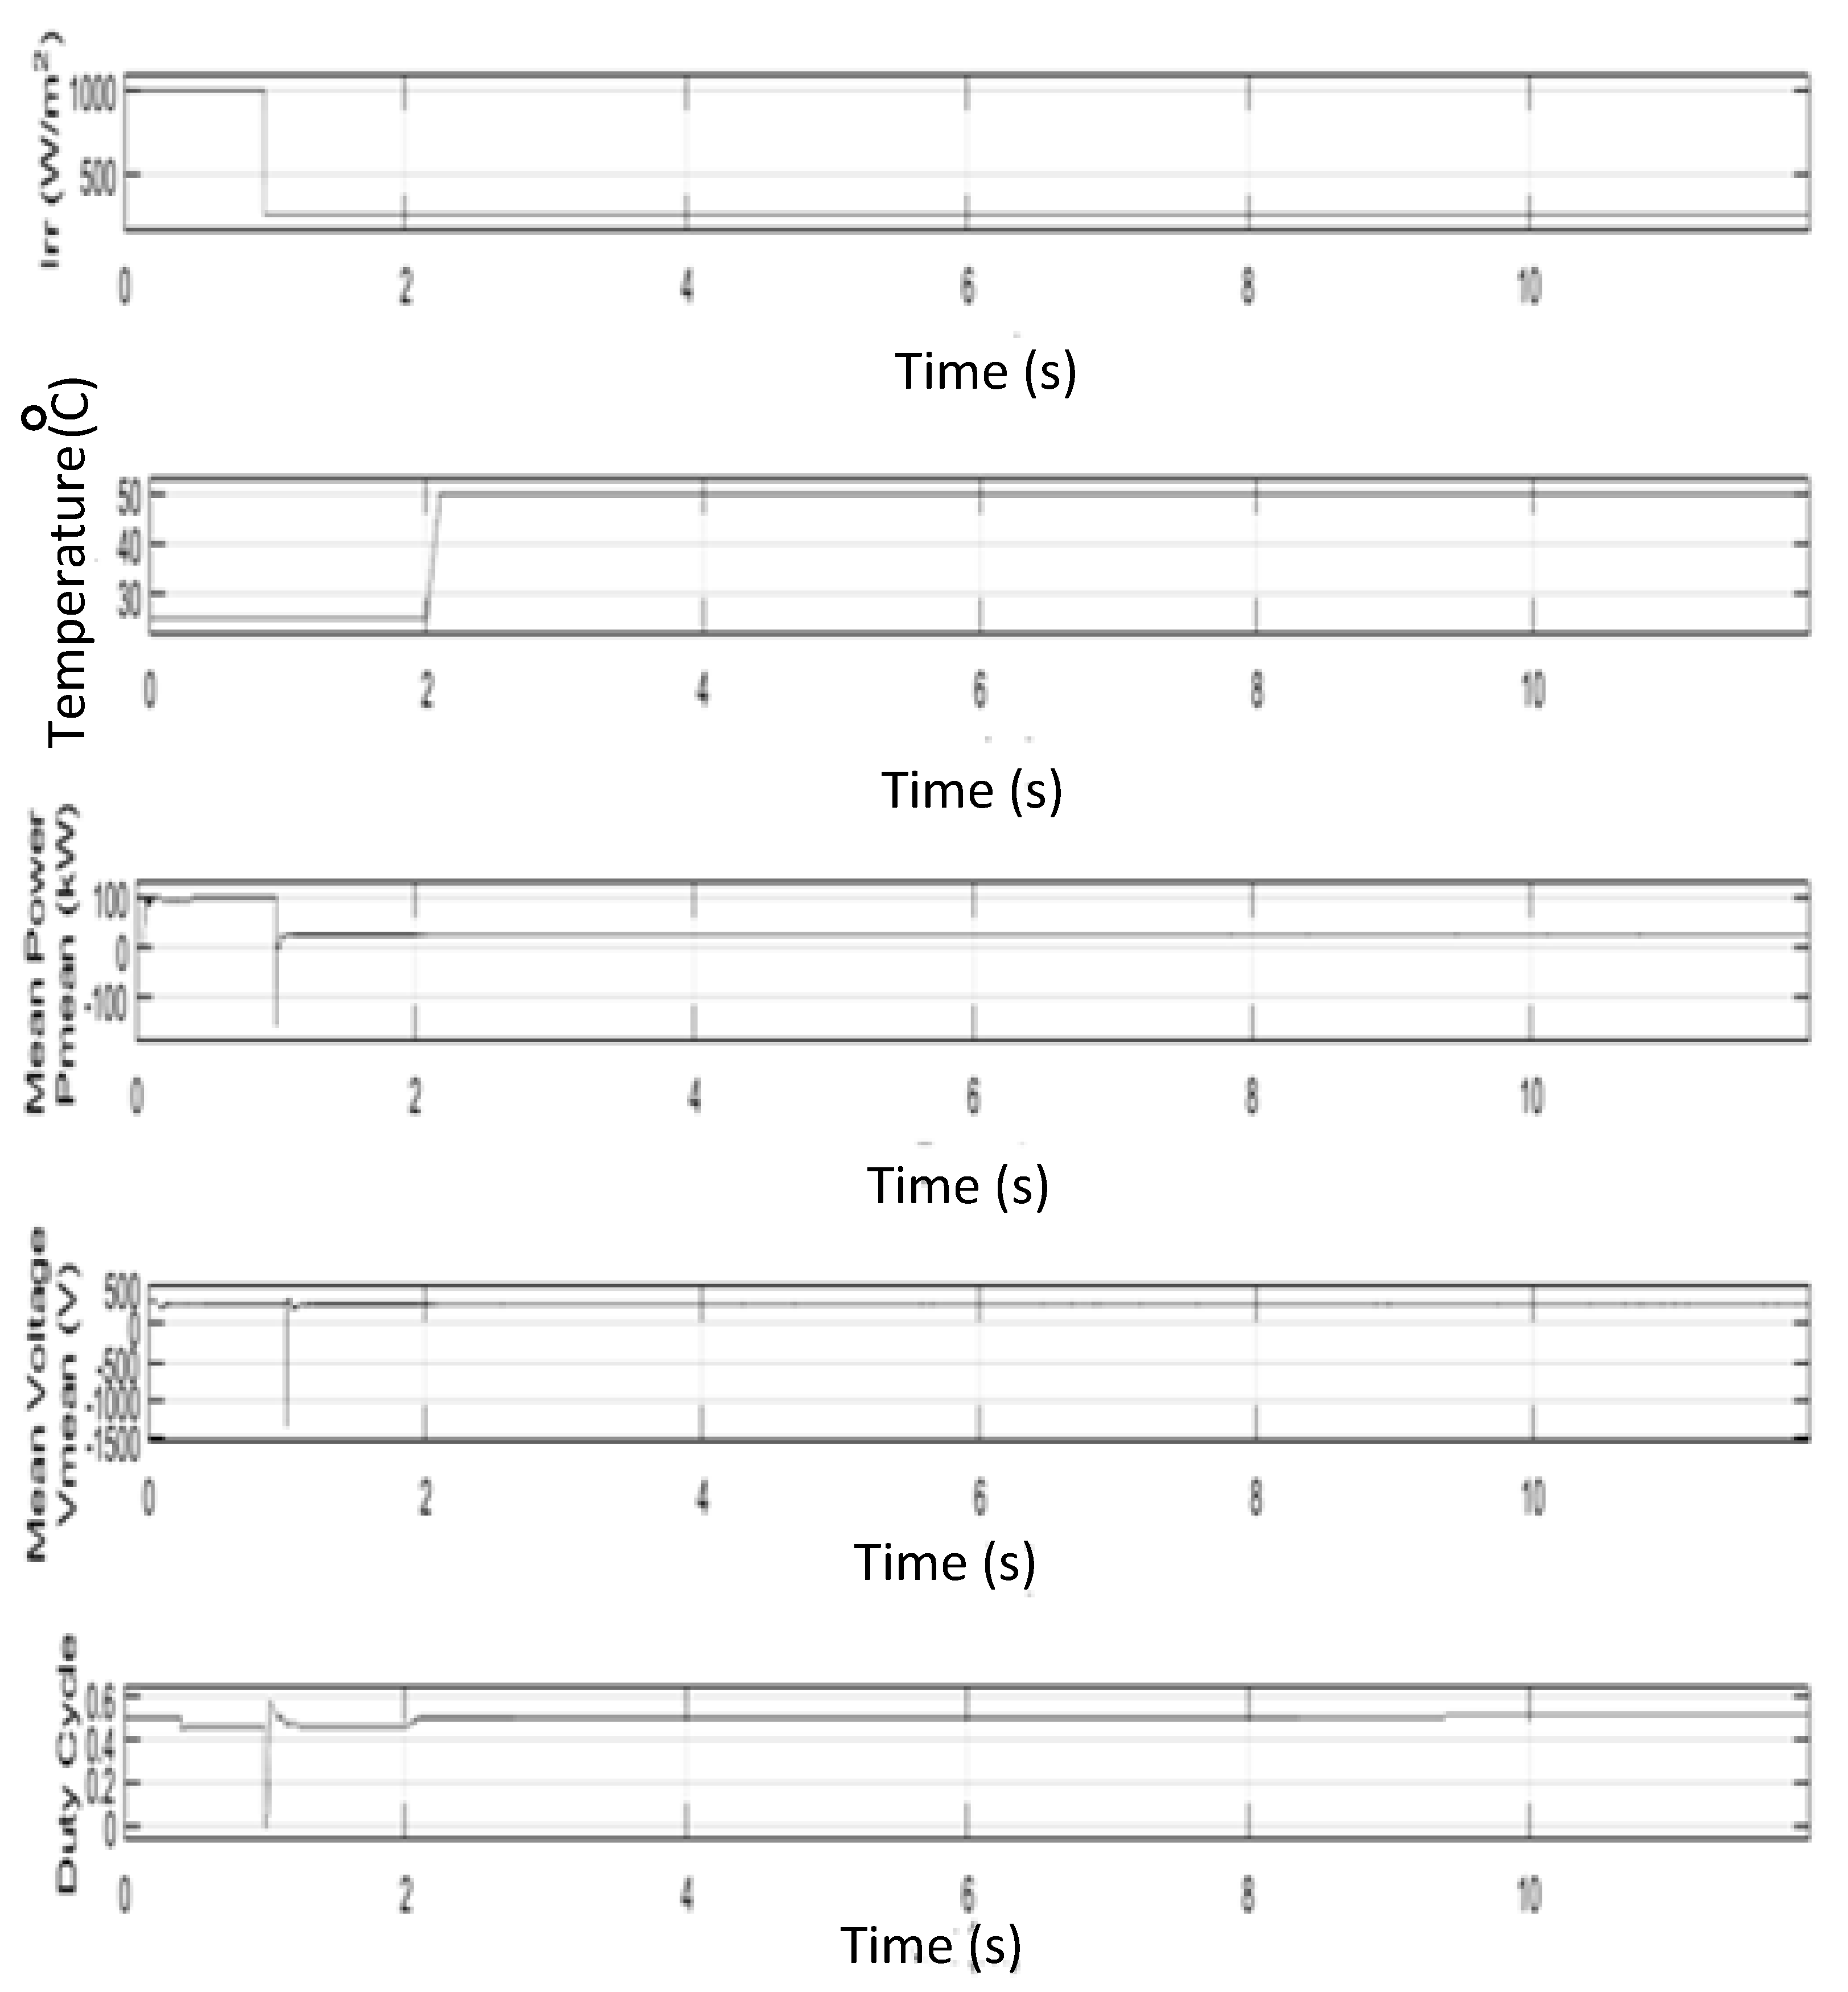
The simulation circuit DC link capacitors were charged by boosting the PV voltage above 500 V. Voltage across DC link capacitors was used to drive the voltage source inverter which acted as a three-phase rectifier. Boost and VSC circuits were activated at t = 0.05 s. The voltage of Vdc = 500 V at the DC link was maintained. The duty cycle applied to the boost converter was 0.5. Initially, at t = 0.05 s, only the PV Array was catering to the power demand of the utility grid. When solar irradiance fell from 1000 W/m2 to 250 W/m2 at t = 1 s, as shown in Figure 6, the PV array was unable to support the power demand alone; then, power from the battery energy storage bank was drawn to compensate for the shortage of the power delivered by the PV array. At t = 1.2 s, the steady-state was reached.
The temperature of the PV array has been varied from 25 °C to 50 °C. The effect of this can be seen in the form of a dip in output power around t = 2 s. Output power of the PV array at t = 0.05 s + was Pmean = 96 kW. The MPPT was enabled at t = 0.4 s. The MPPT regulator started regulating PV voltage by varying the duty cycle to extract maximum power. From t = 1 s to t = 12 s, the batteries started delivering power to the utility grid. The input values were given to the PV array by the signal builder block. The battery banks were discharged while maintaining constant power output to the utility grid.
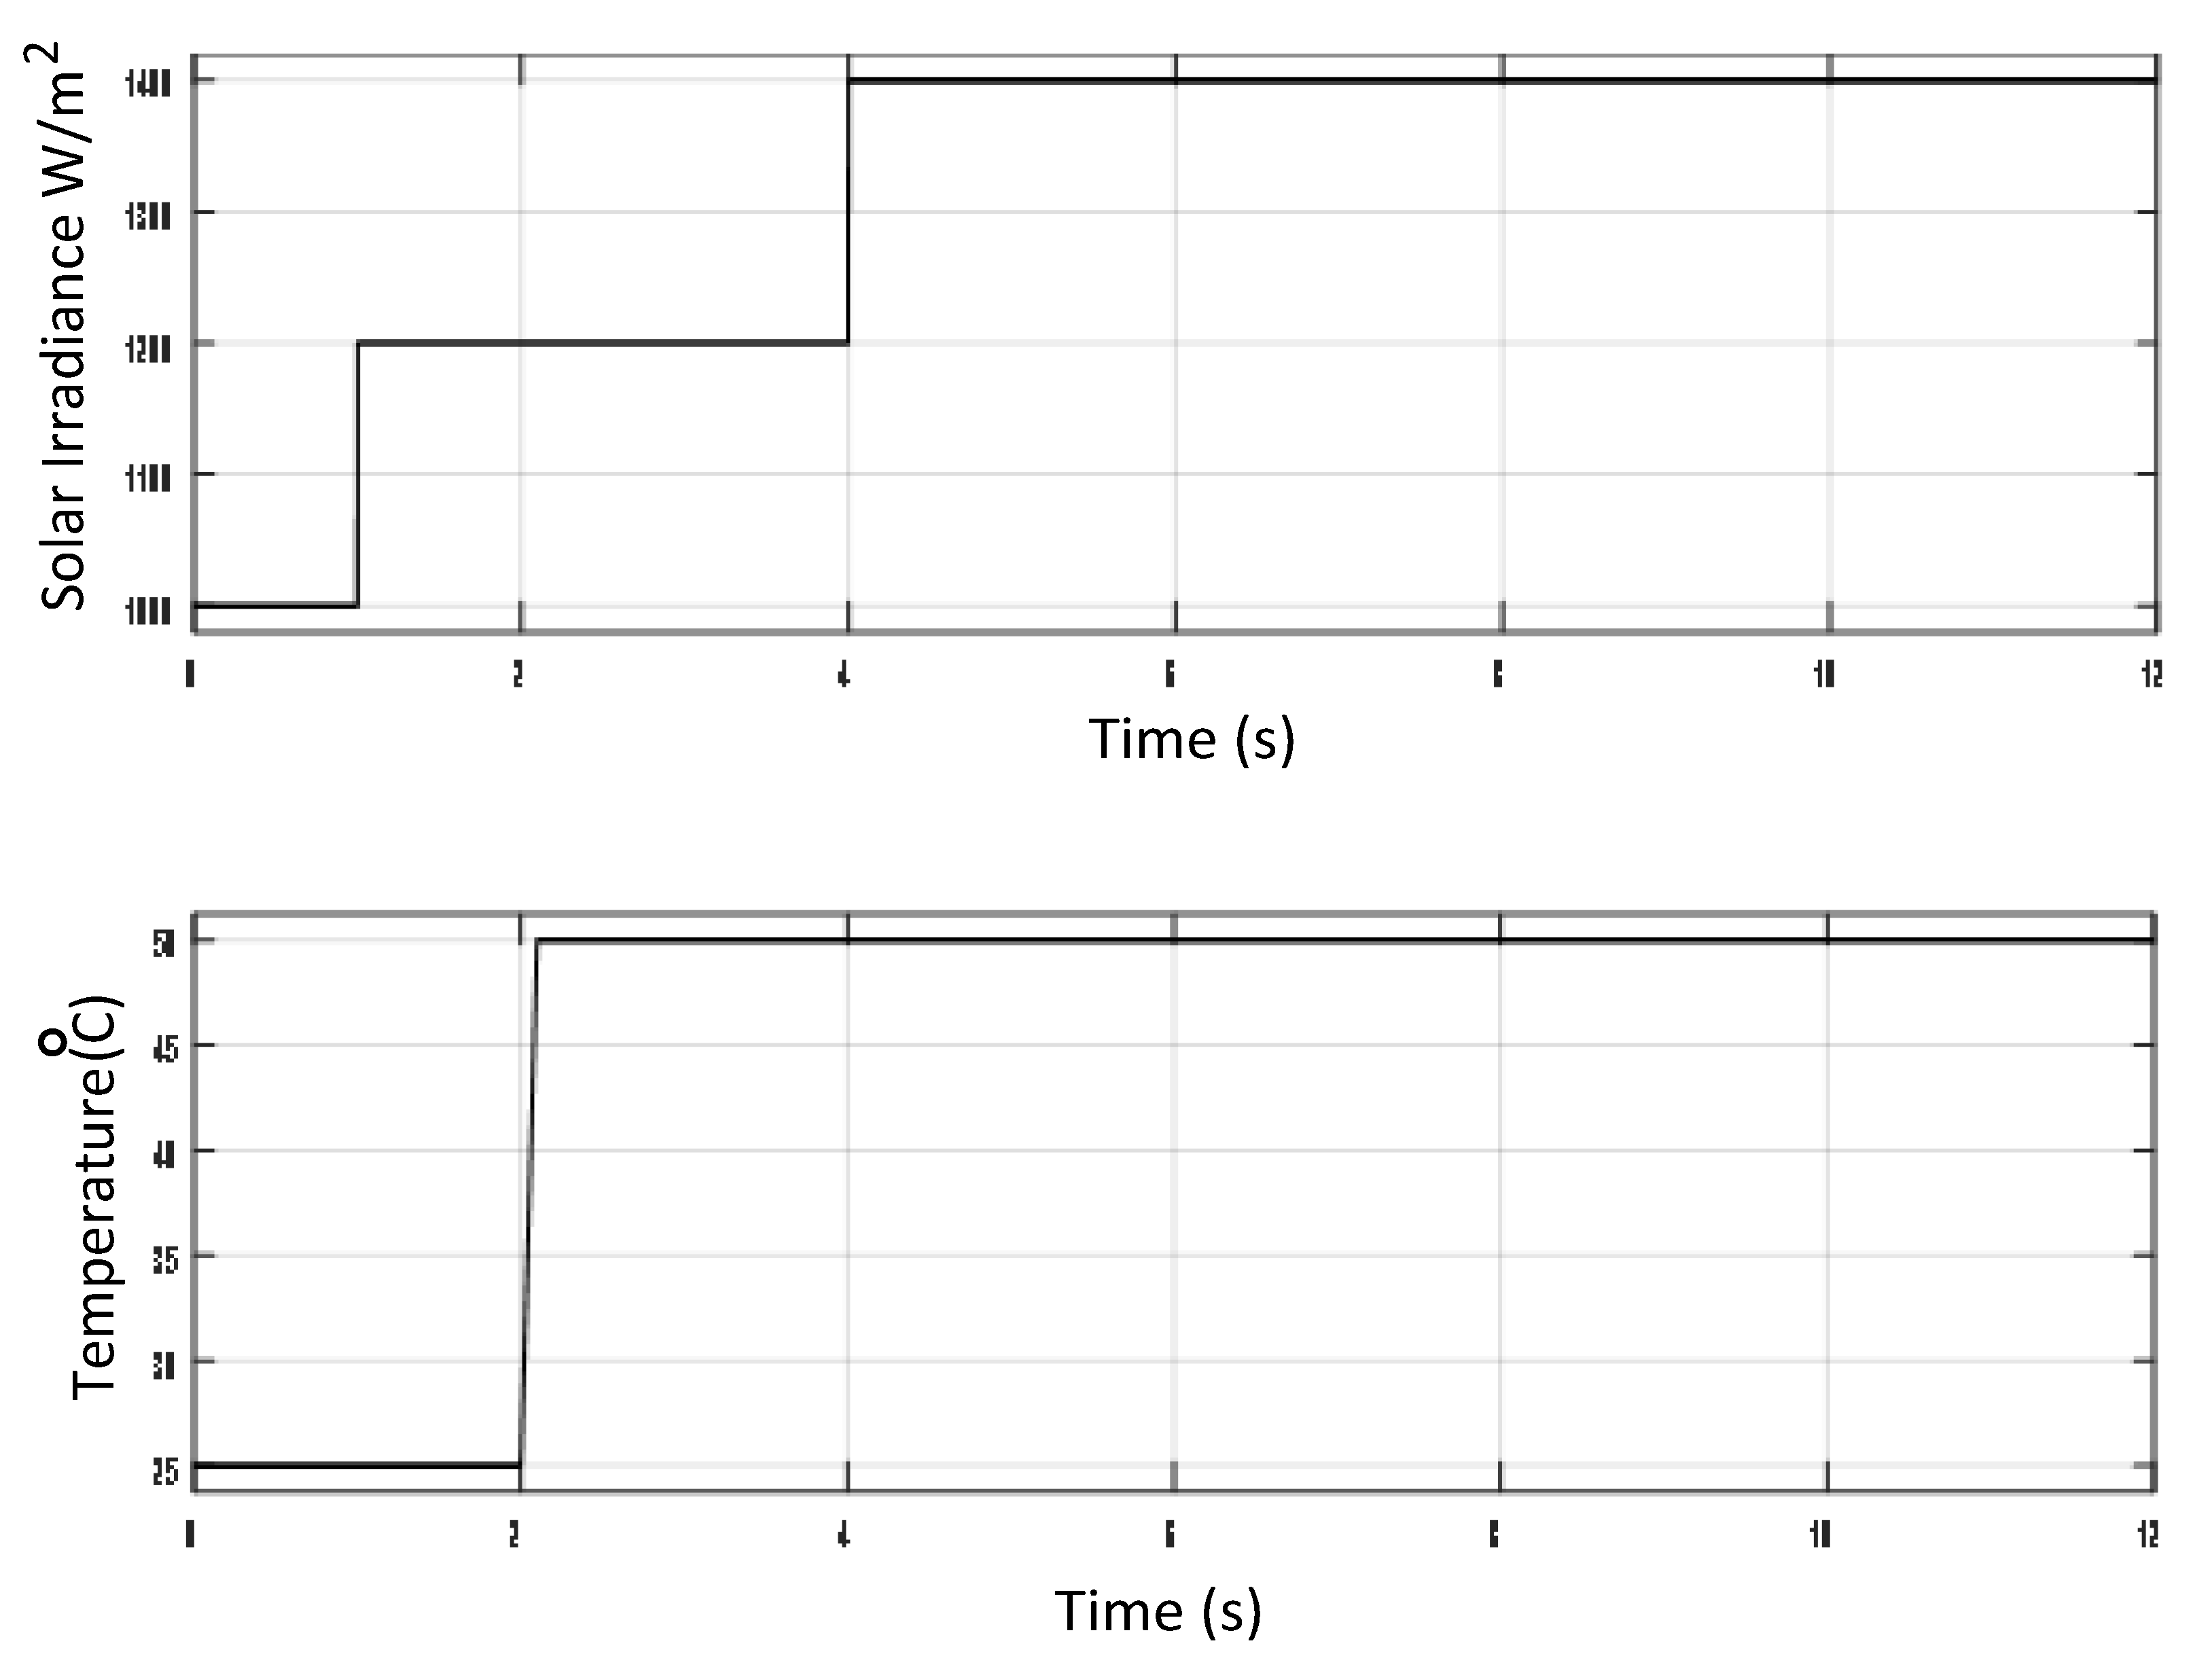
Scenario 2: In this scenario, initially (at t = 0 s), the PV array alone was catering to the utility grid power demand. The input values were given to the PV array by the signal builder block. The battery banks were charged while maintaining constant power output to the utility grid. This scenario demonstrates charging of the battery banks when excess power is delivered to utility grid while maintaining constant load power. The proposed controller was connected to the simulation circuit as shown in Figure 7. The controller operation of Figure 7 is given in Section 2. The boost converter in the circuit boosts the voltage from the grid to charge the battery bank when excess power is produced from the PV grid. In the case of this controller, the reference signals given to the comparator are reversed. When the power delivered to the load increases, the comparator produces a negative feedback signal, resulting in lower duty cycles to stop delivering power to the grid and start consuming the power from the grid. The excess power from the grid is stored in the battery bank. When solar irradiance increased from 1000 W/m2 to 1200 W/m2 at t = 1 s and from 1200 W/m2 to 1400 W/m2 at t = 4 s, as shown in Figure 8, the excess power generated by the PV array was used to charge the battery bank.

5. Results and Observations

5.1. Scenario 1

5.1.1. Comparison of Discharging with and without the Controller

The graphs in Figure 9 show the discharge parameters of the battery without using the grid controller. As can be seen from the graphs, the power delivered gradually decreased as time elapsed. The decrease in power is due to the decrease in battery voltage as it discharges.
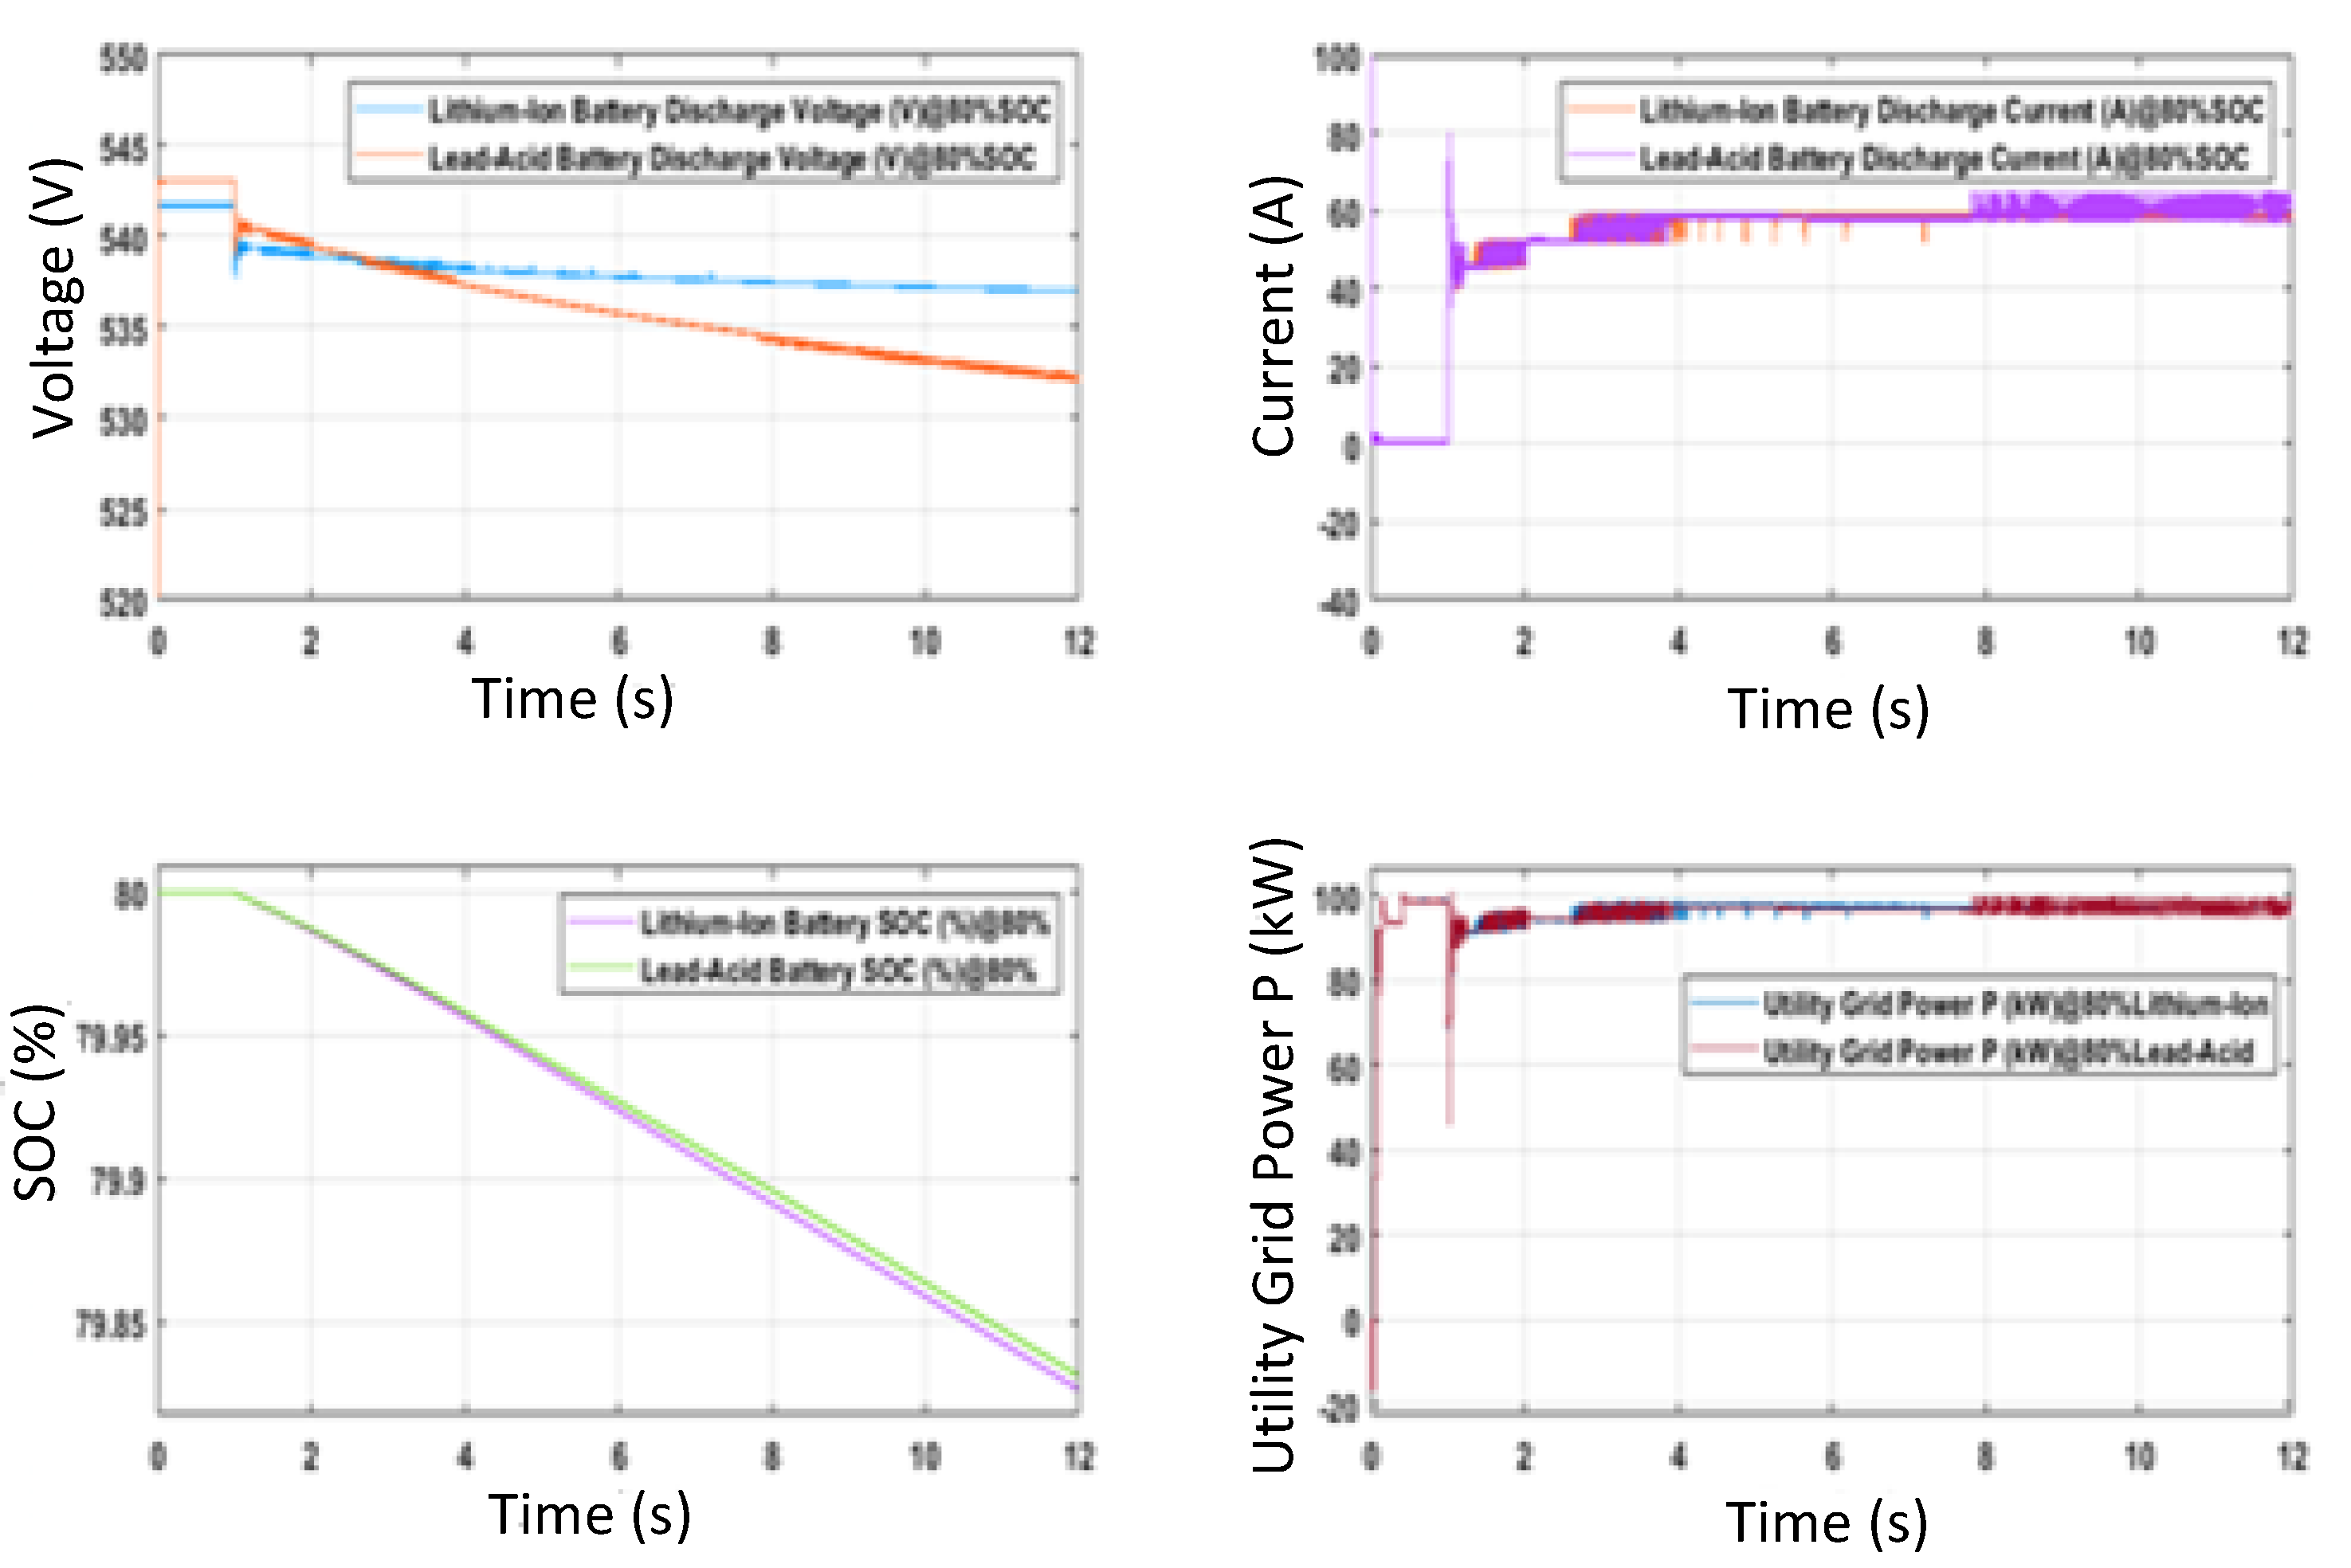
When comparing this with the graphs with the controller, as shown in Figure 10, it can clearly be seen that the output power is more stable and does not taper off as the voltage decreases.

5.1.2. Recovery Time of Discharge Controller

As detailed in scenario 1, there was a decrease in irradiance of PV array at t = 1 s and increase in temperature of the PV array at t = 2 s, both of which caused a reduction in power delivered by the PV array. Because of this, a dip can be seen in the power delivered at both t = 1 s and t = 2 s, approximately. The output power reached its set limit and stabilized at about 3 s. It took about one second for the controller to restore the output load power to set power, i.e., the controller had a recovery time of 1 s. The recovery time of one second is quite large, but it could be reduced by using a PID controller instead of a PI controller and by tuning the control parameters more precisely.

5.2. Scenario 2

5.2.1. Comparison of Charging with and without the Controller

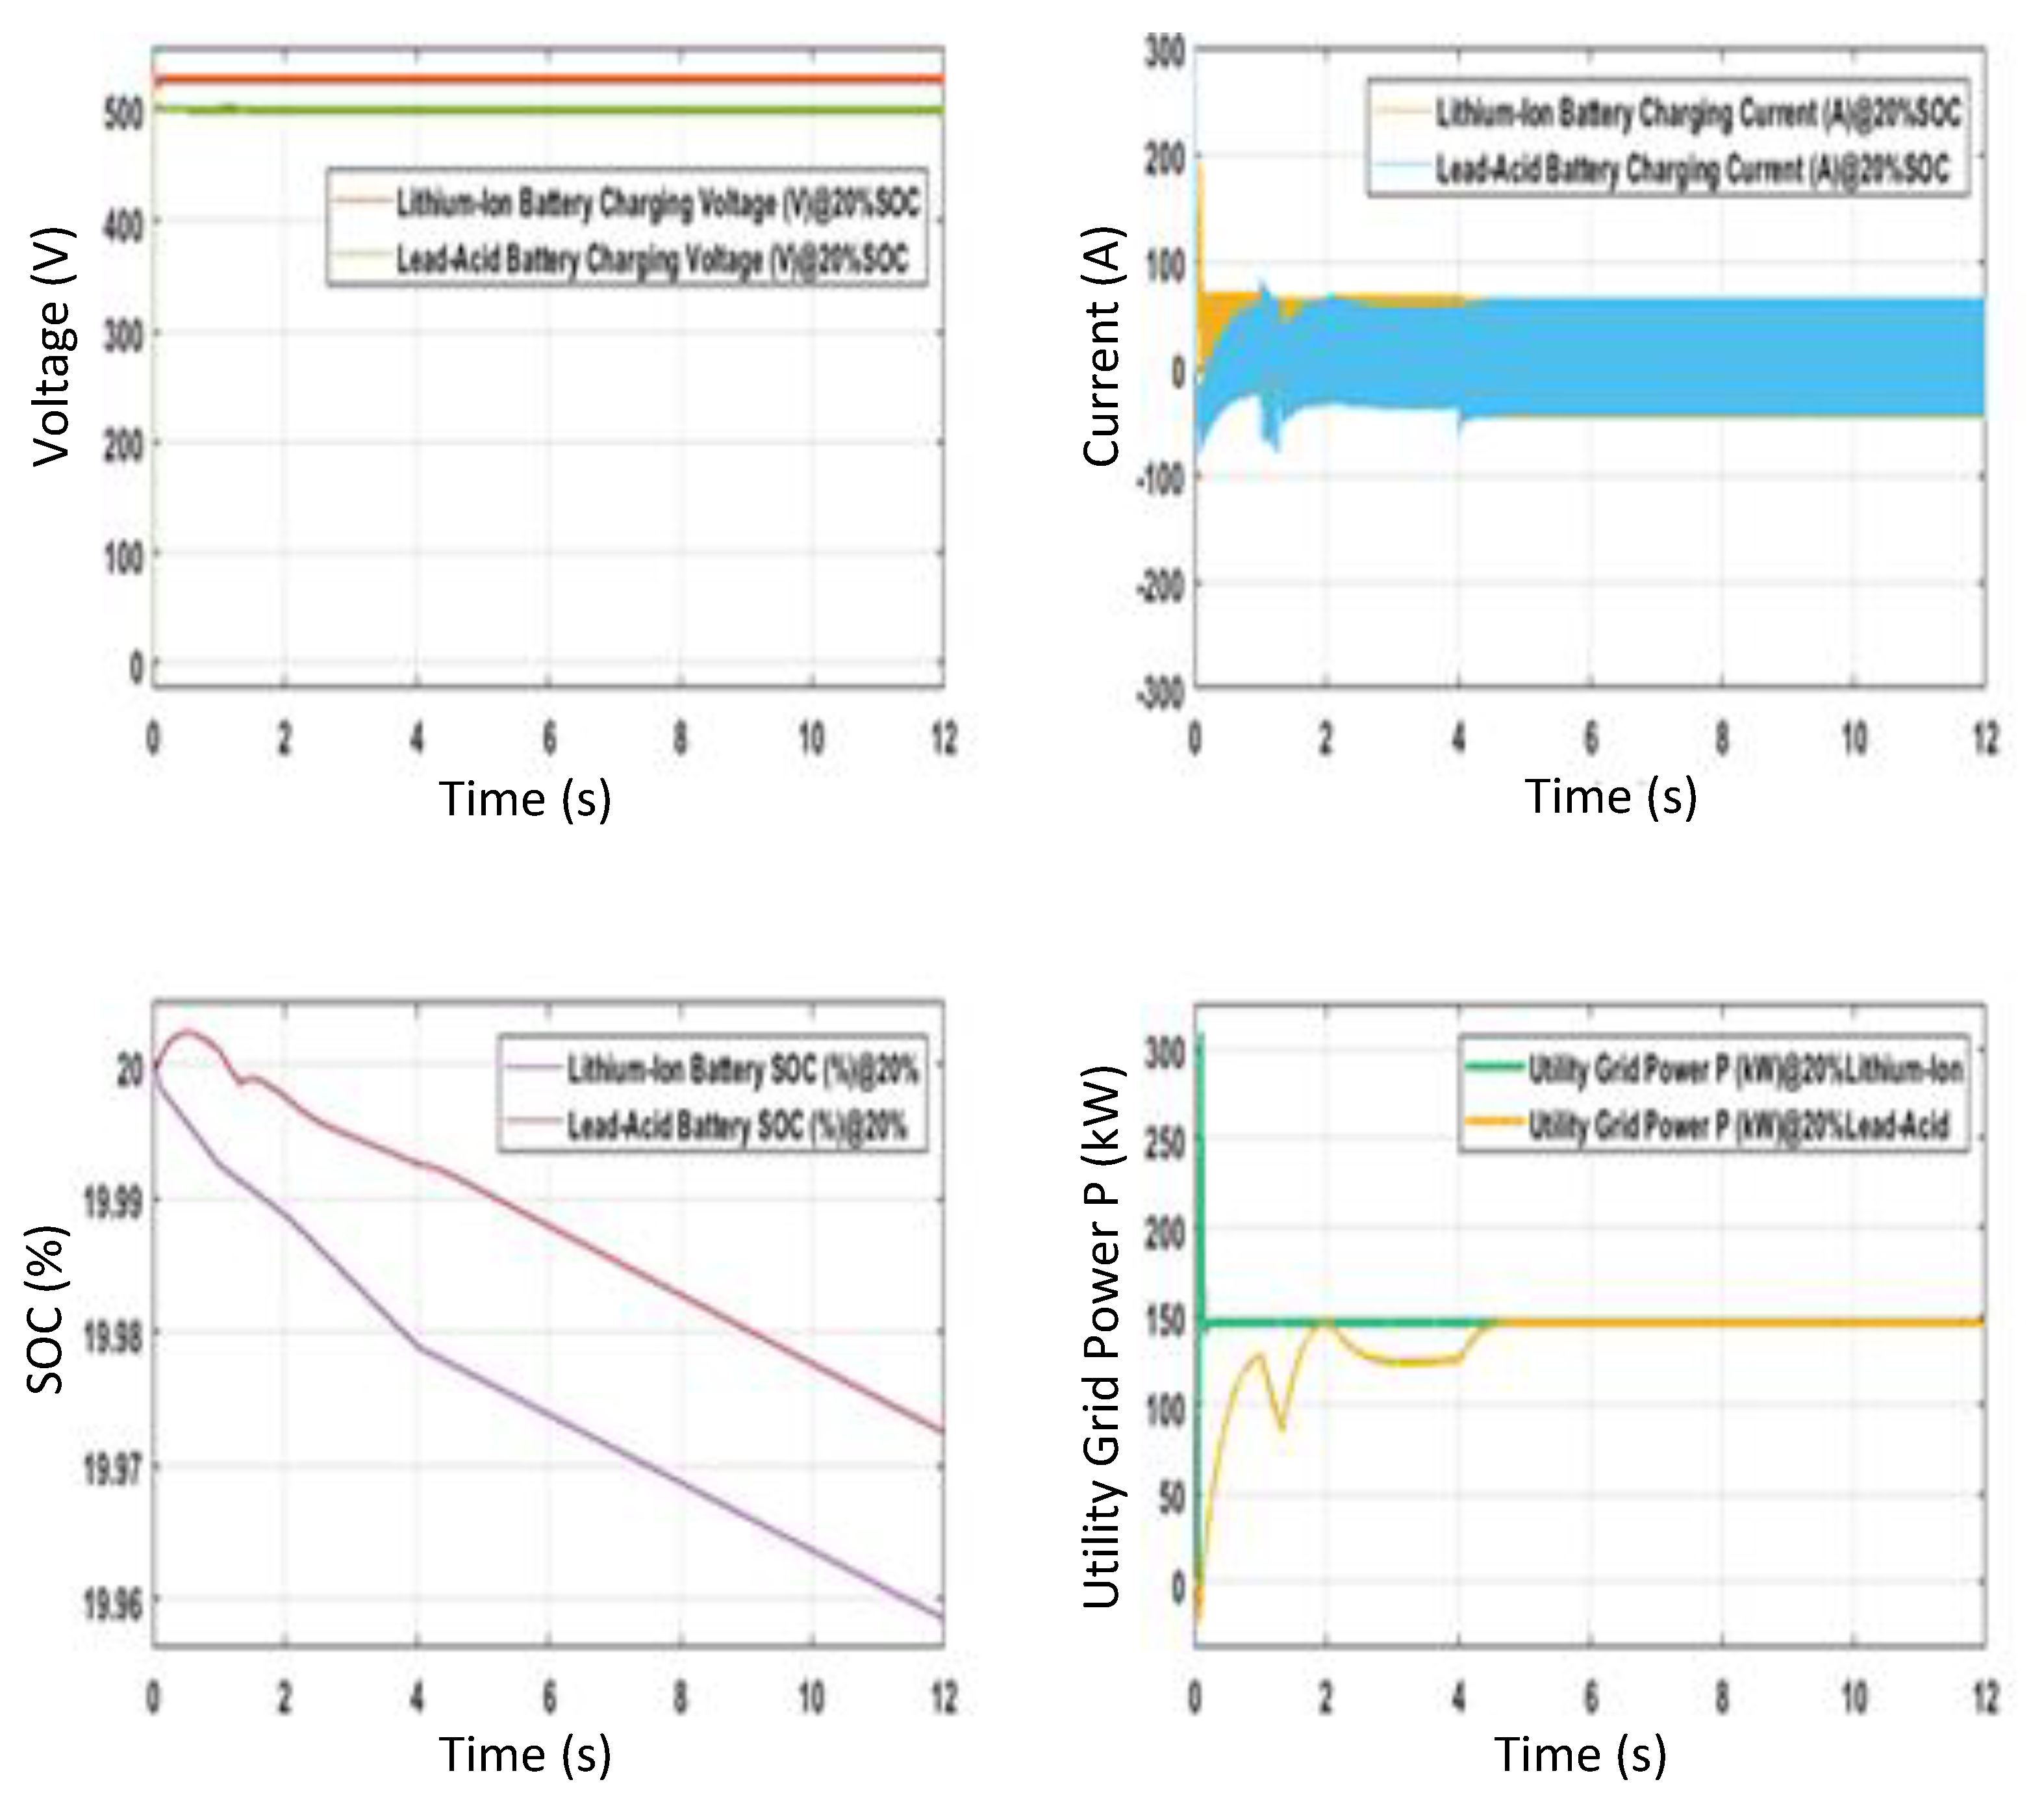
The graphs in Figure 11 and Figure 12 show the charging parameters with and without using the proposed controller. When not using the controller, the excess power generated by the PV array due to an increase in irradiance was directly passed on to the grid, leading to a higher grid power delivery than needed. Even though the battery was connected to the grid, it had considerable control on how much power to send to the battery bank. The amount of power delivered to the grid was approximately 146–150 KW when not using the controller, as shown in Figure 11.
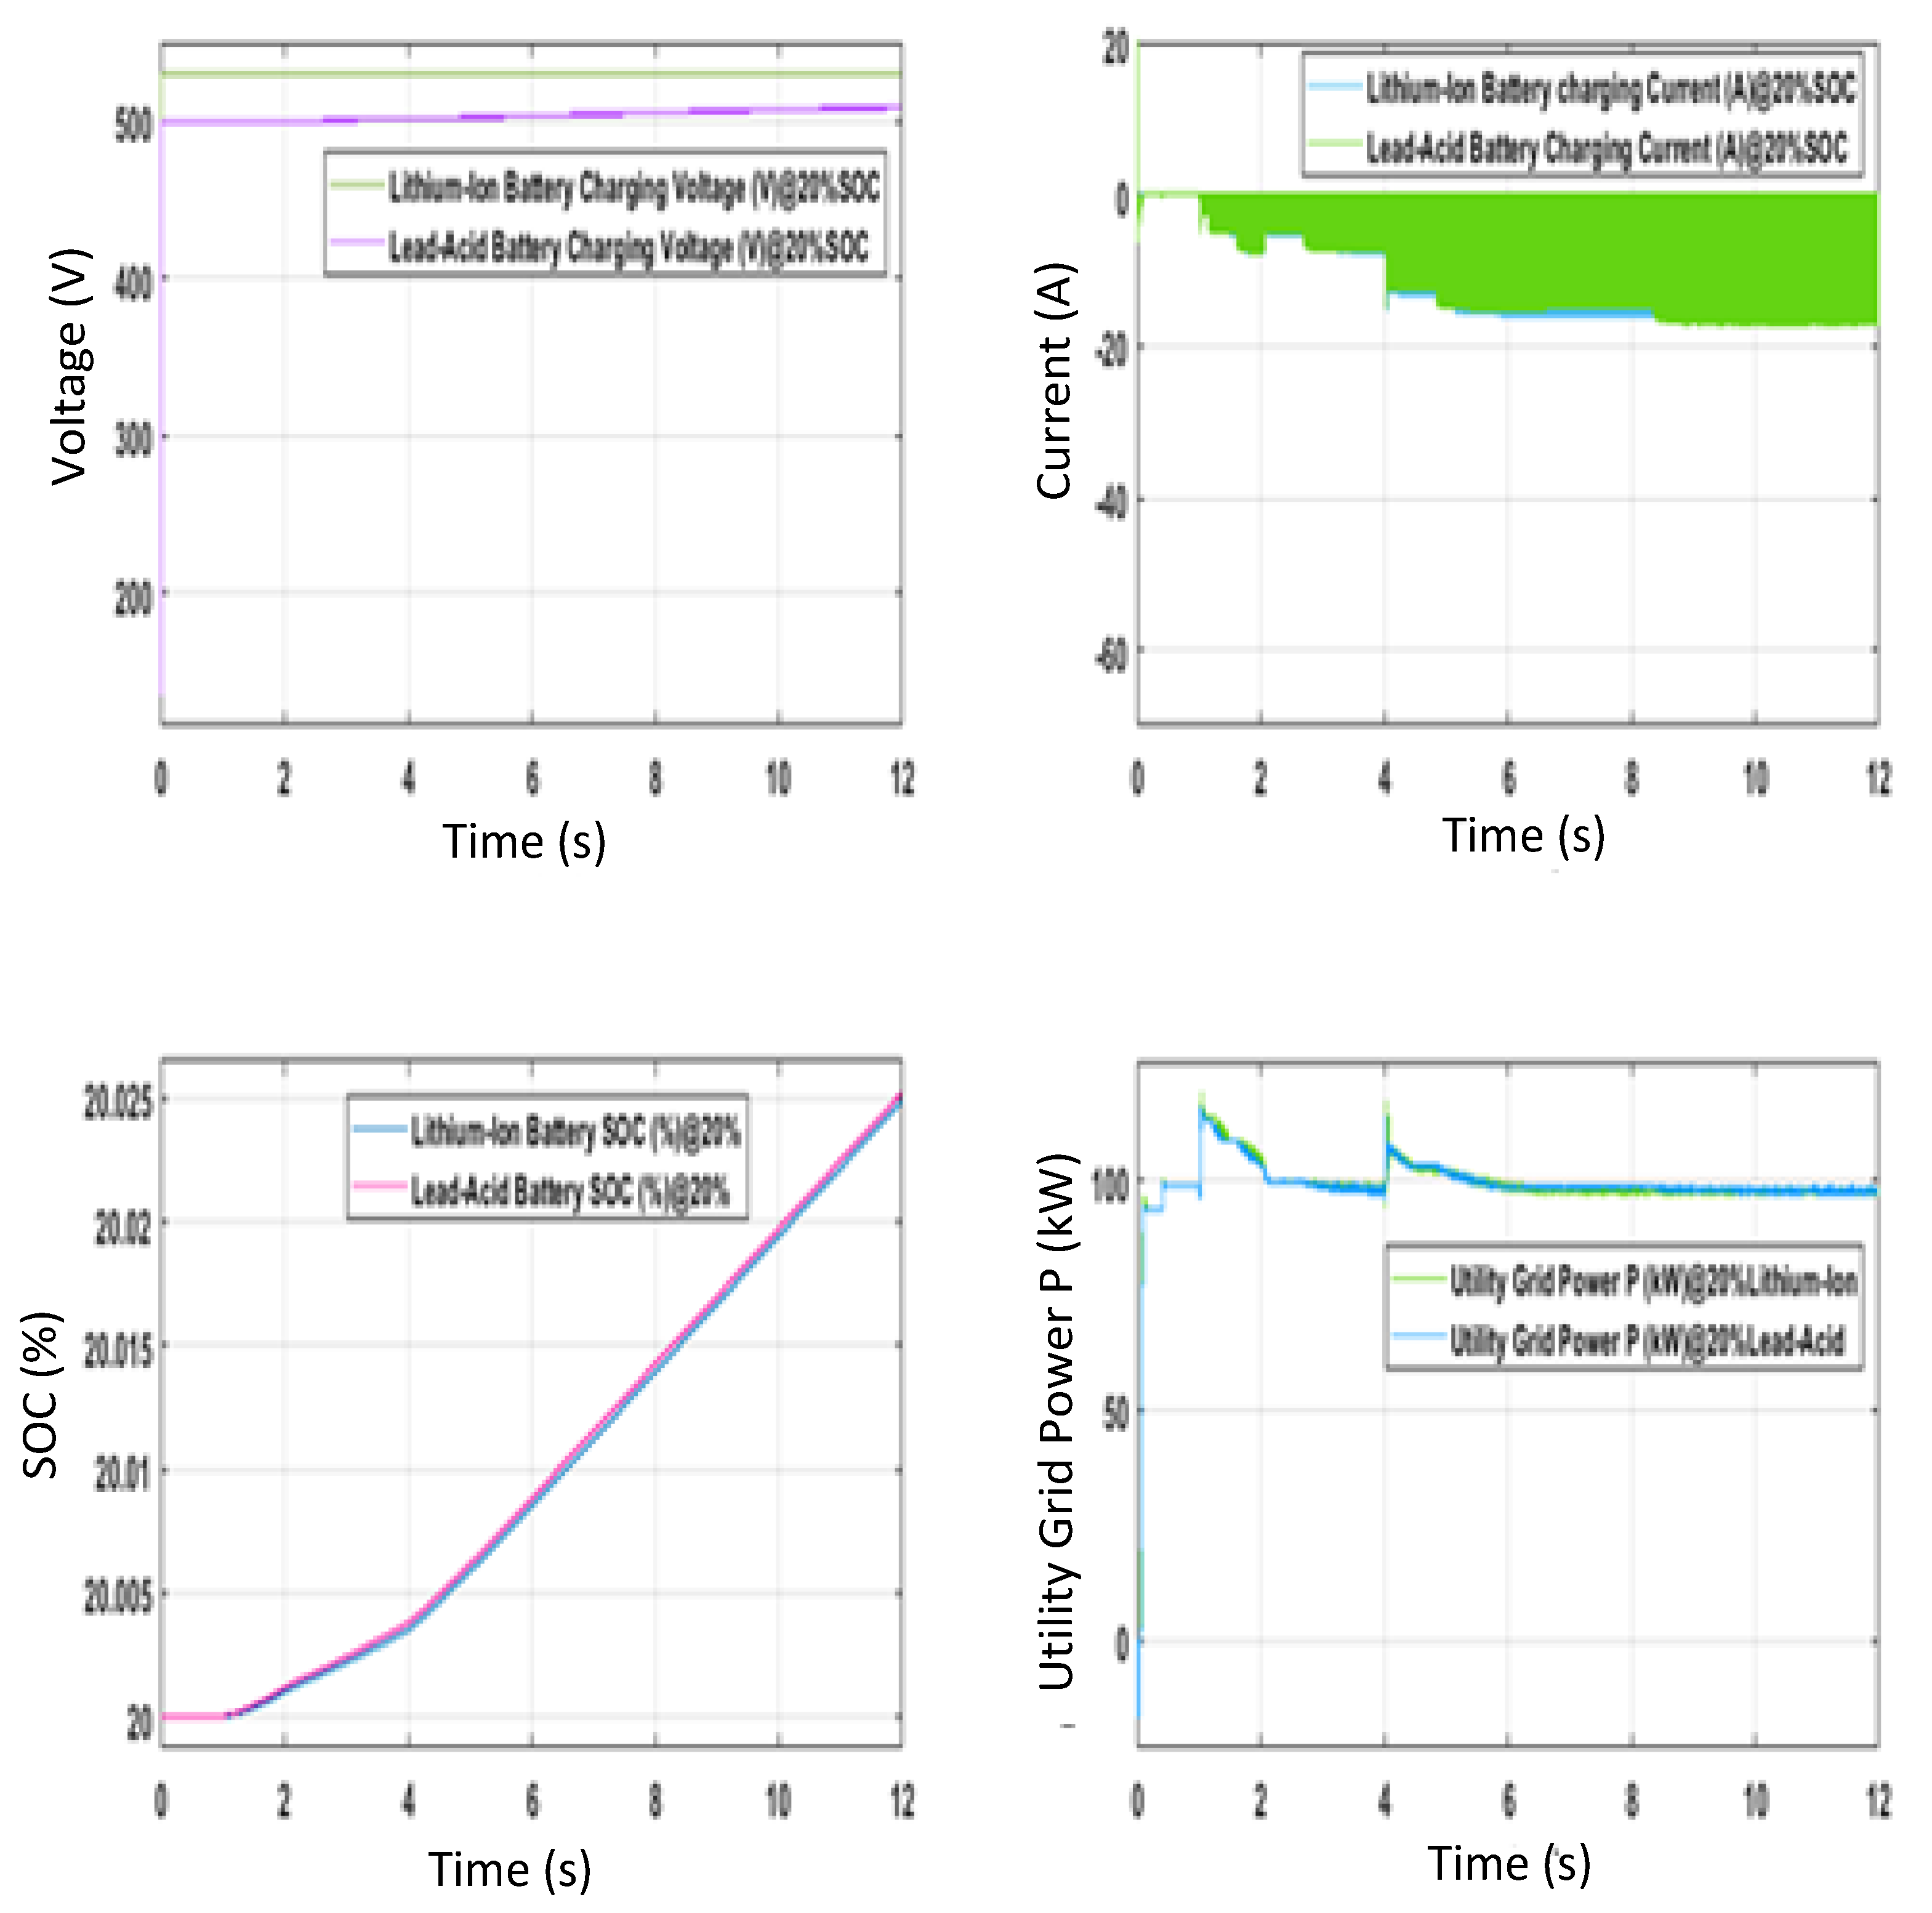
When using the controller, it can be seen from the graphs in Figure 12 that the power on the load side was maintained at the set level, and the excess power was sent into the battery bank. It has a lot of control on how much power needs to be sent to the battery bank. As the power delivered to the grid increases and rises higher than the set point, the controller then receives a negative feedback and it starts transferring the excess power to the battery bank and maintains the power at the required level.

5.2.2. Recovery Time of Charge Controller

The irradiance to the PV array increased at t = 1 s and at t = 4 s. The corresponding increase in output power can be seen at those times in the graph (Figure 12). The load power increased, but returned to the set point. The recovery time, or the time it takes to recover from the disturbance, was approximately 1 s. The recovery time could be improved by making the controller more sensitive.

5.2.3. Improving the Quality of the Output Power

The output power shown in Figure 13 had some amount of jitter. This jitter can be reduced by using output capacitors. The recovery time of the controller was about 1 s. These performance characteristics could be improved by replacing the PI controller with a PID controller and increasing the gain in the control parameters. Increase in gain will result in a greater corrective effect applied when the output deviates from the set reference. However, too much gain can make the controller unstable and result in more jitter. A PI controller would be used to reduce the tuning effort. Tuning a PID controller manually is difficult because there is a need to tune one or more parameters using a trial-and-error method.

5.2.4. Performance Range of Controllers

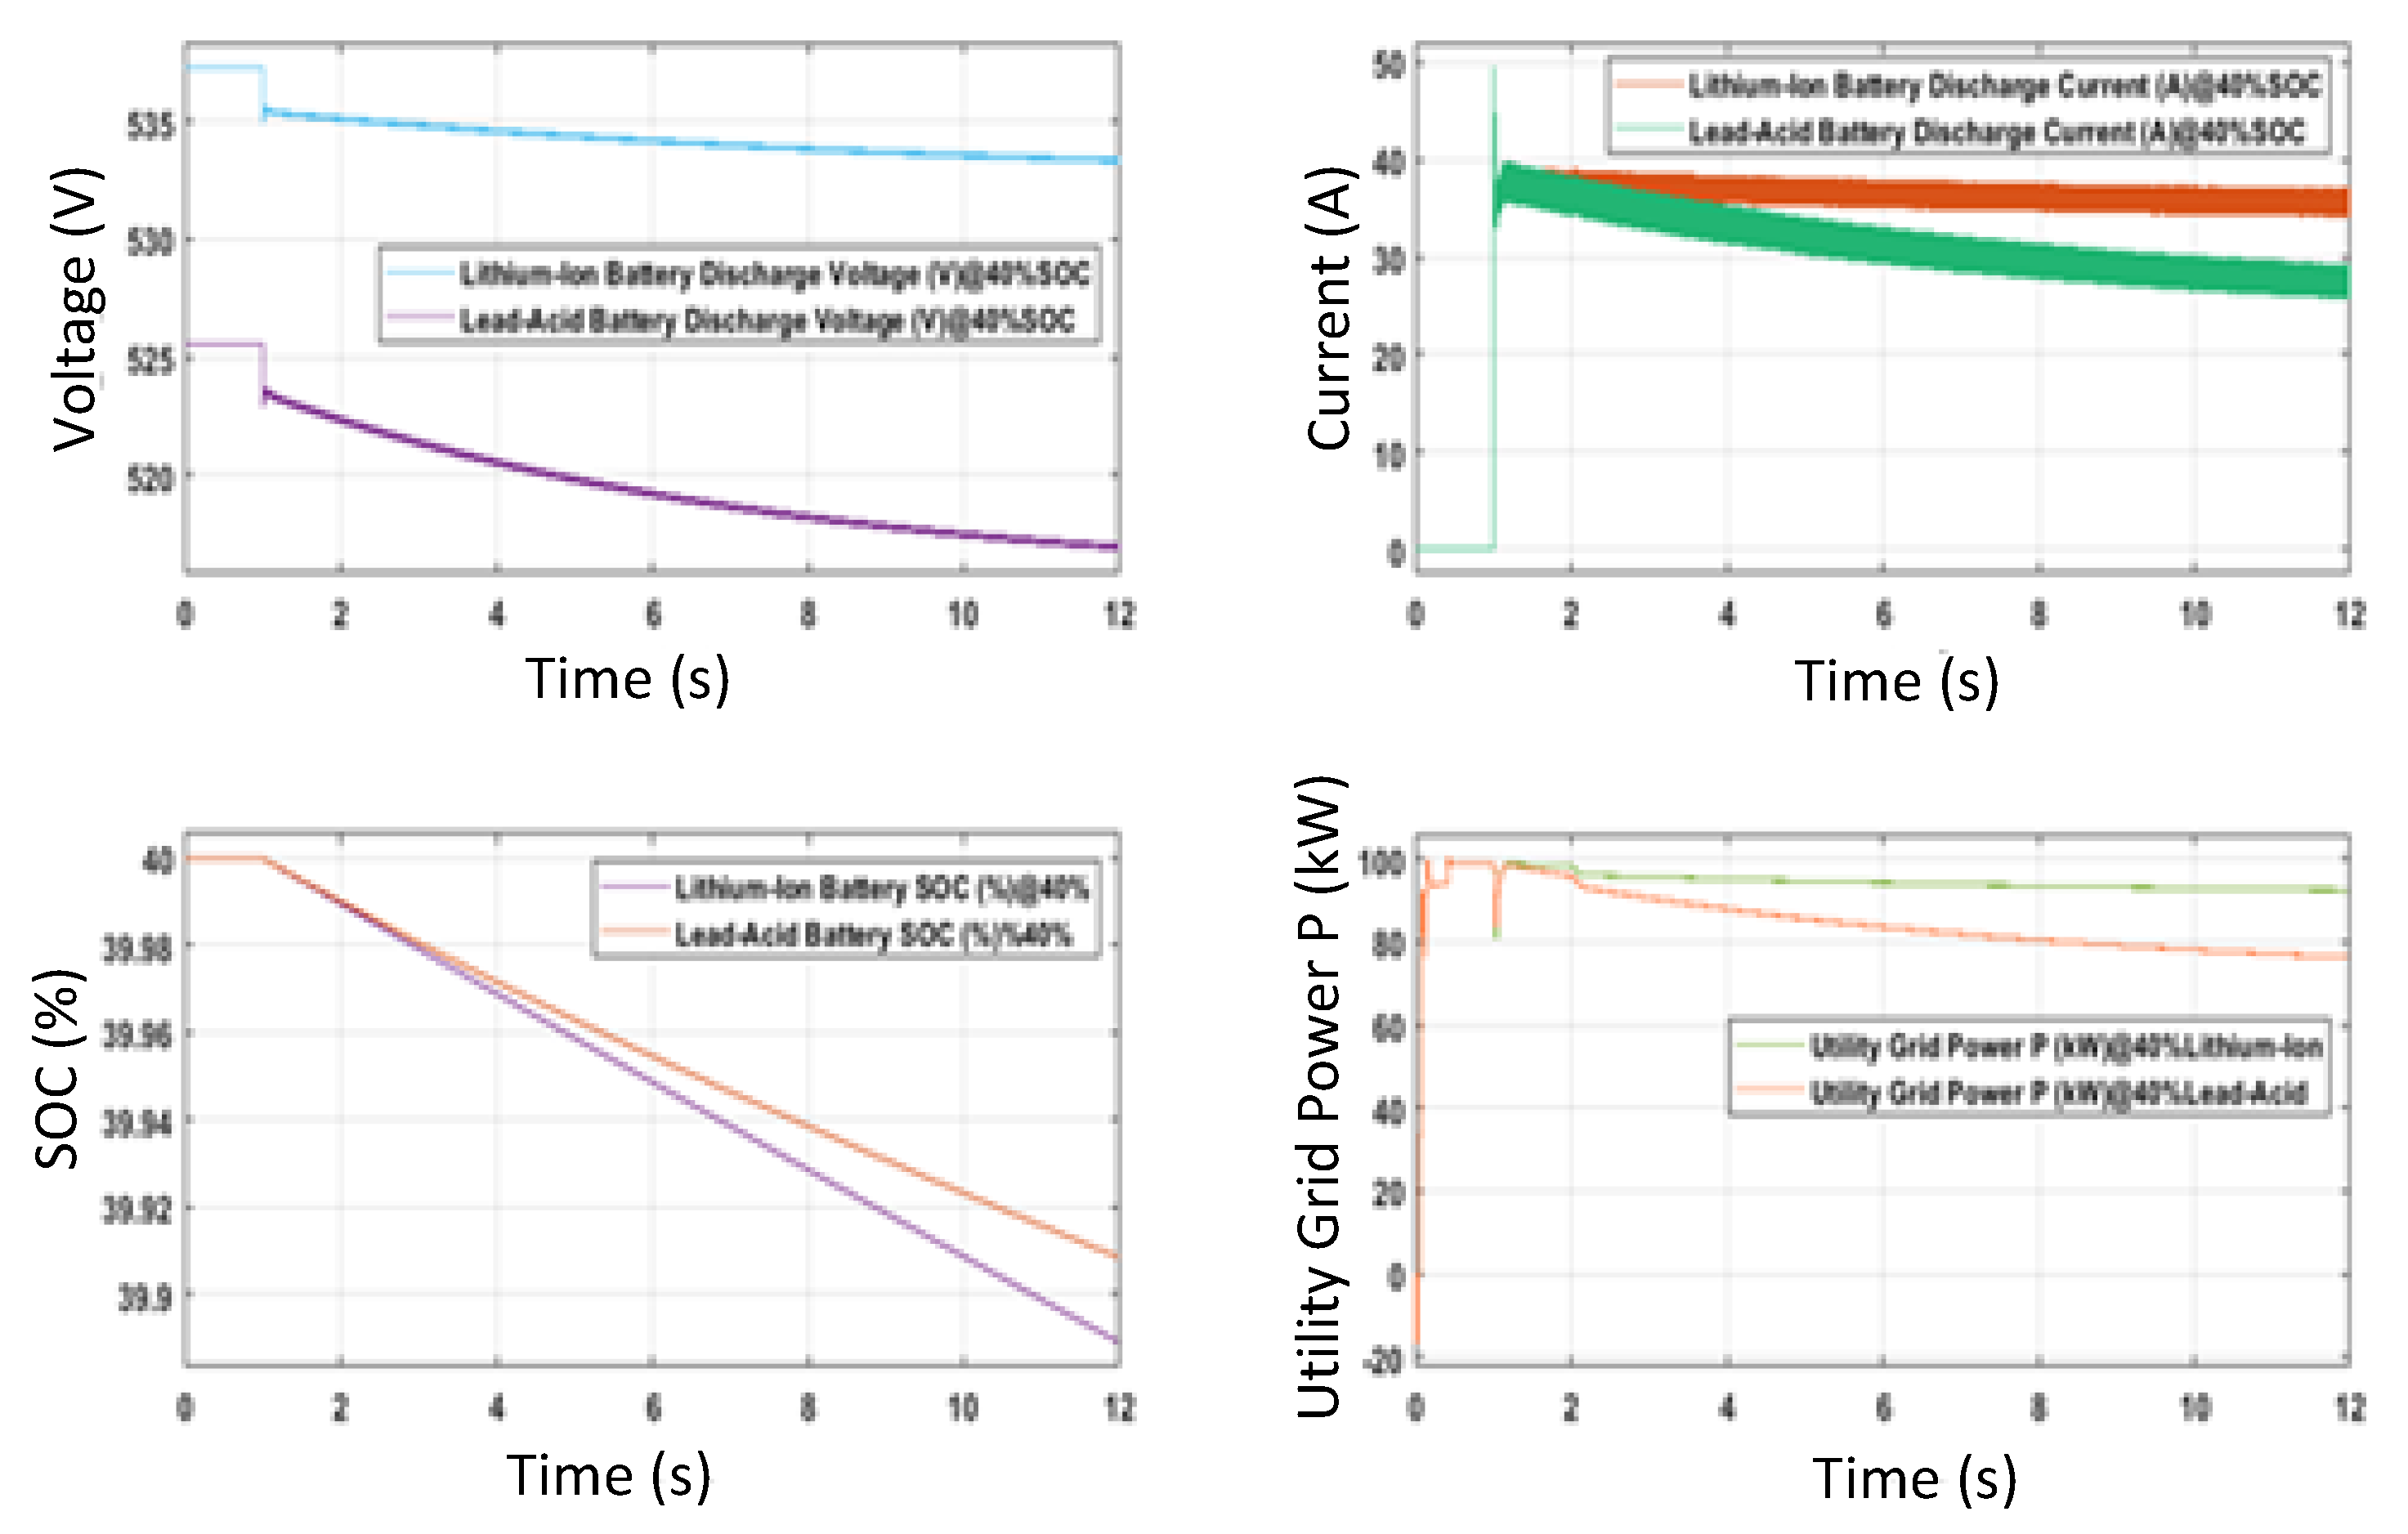
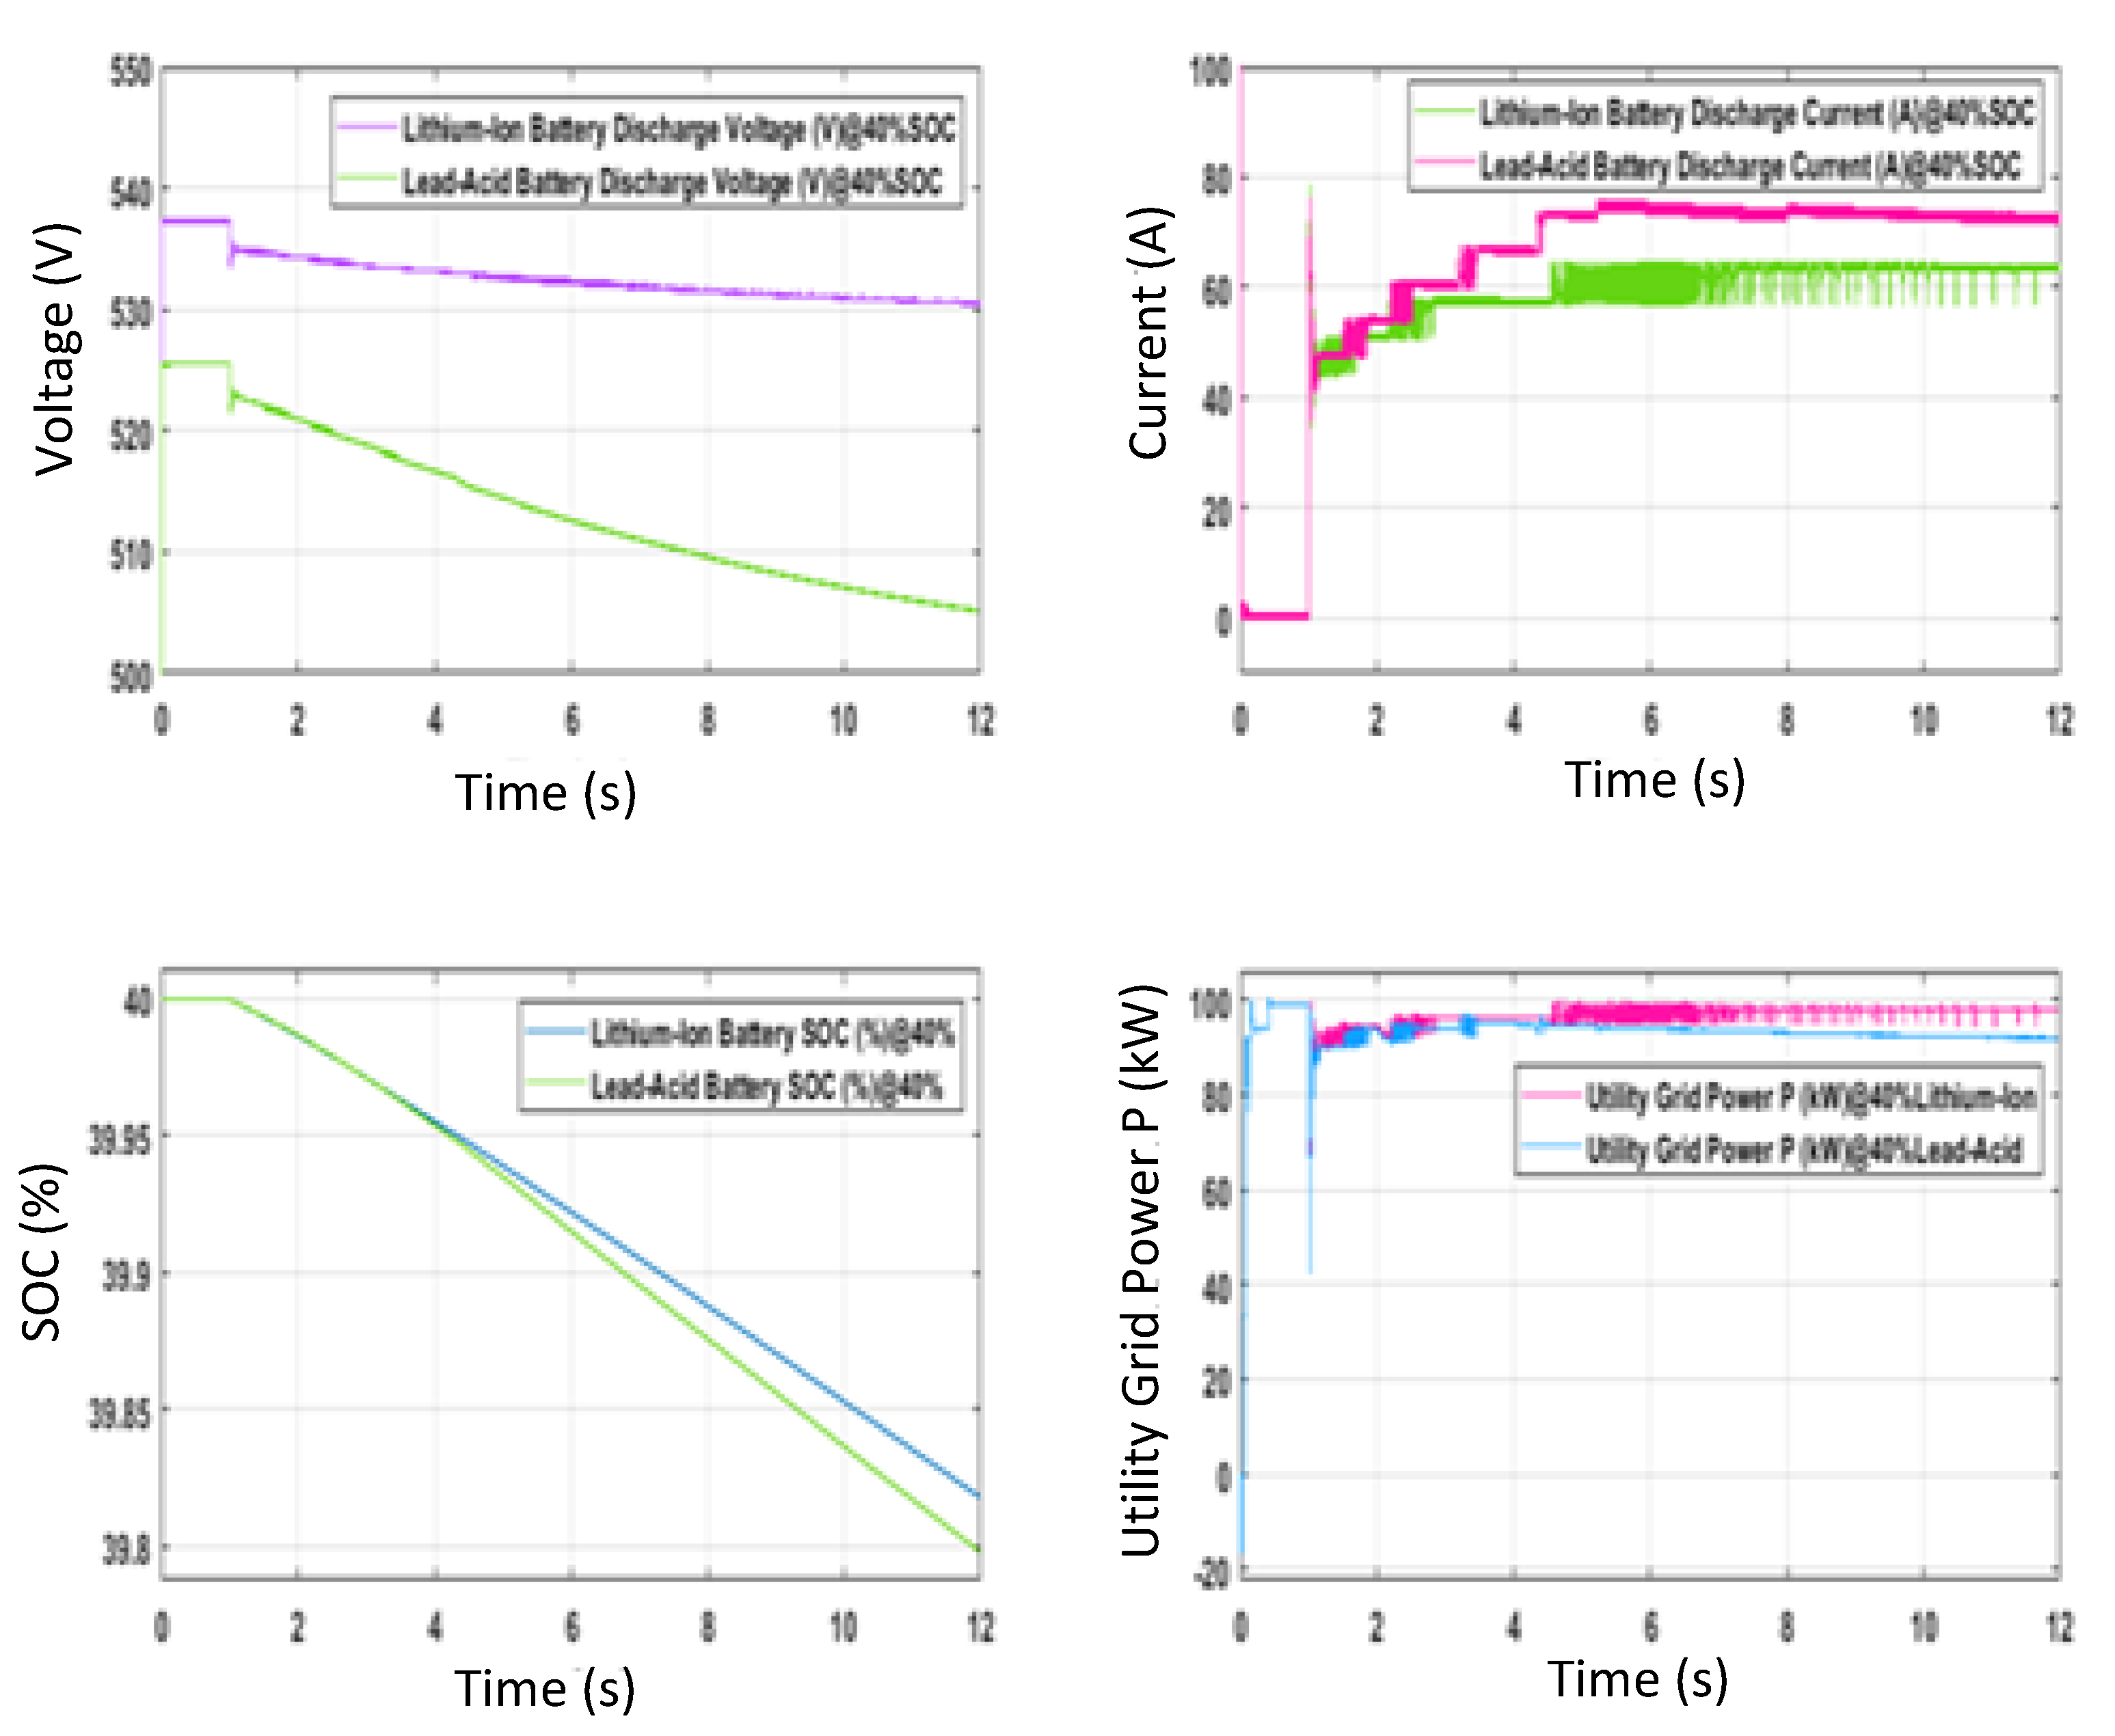
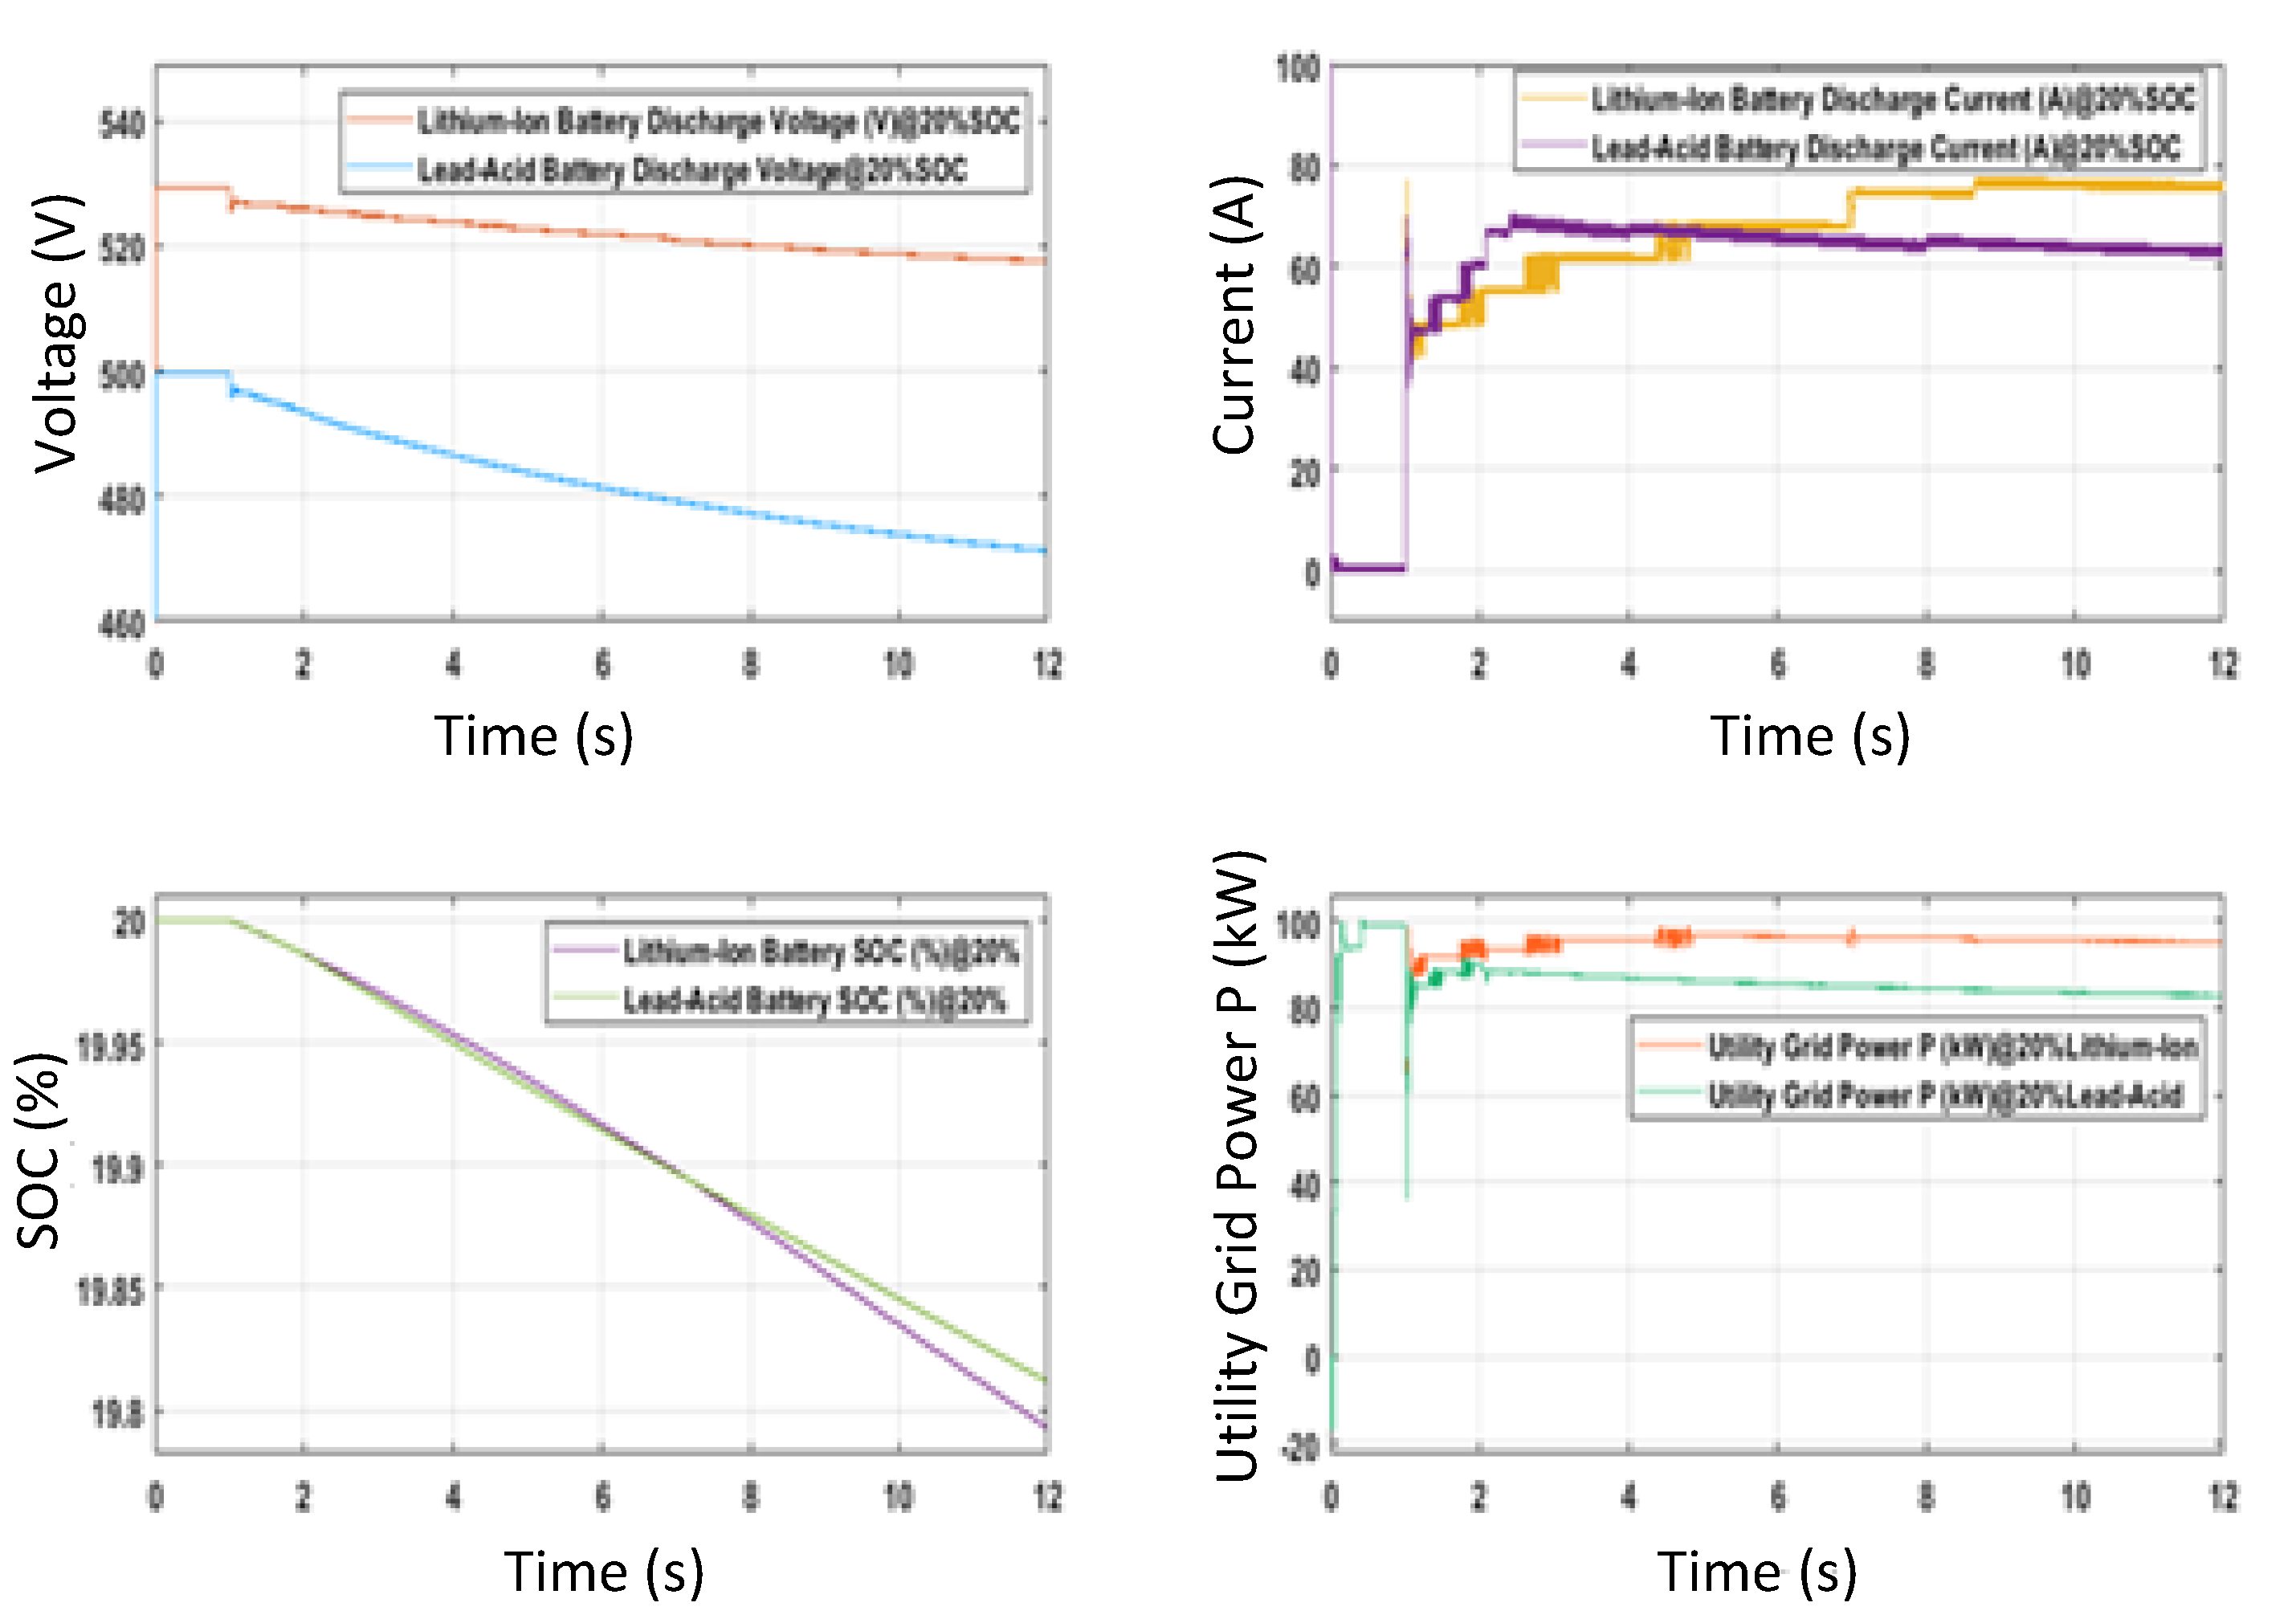
The graphs in Figure 13 and Figure 14 show the discharge parameters of the PV grid at various levels of battery charge, or SOC. The controller is able to compensate for the reduction in battery voltage at 40% SOC and 20% SOC in the case of the lithium-ion battery bank, but fails to compensate in the case of the lead-acid battery. This is because the variation in voltage has crossed the threshold beyond which the corrective action of the controller is ineffective.
Similarly, in the case of the charge controller at 79% SOC, it can be seen in Figure 15 that it cannot direct as much power as it can when the batteries are at 20% SOC. There is a limit to the amount of power that can be pushed into the battery bank, and it reduces with the increase in the terminal voltage of the batteries. The terminal voltage of the battery at various levels of SOC is different for different type of batteries. For example, lead-acid batteries have higher voltages than lithium-ion batteries at SOCs higher than 80%; therefore, it is more difficult to transfer power to lead-acid batteries at higher SOCs.
The voltage range within which the controller can maintain the output power depends on the amount of minimum and maximum voltage generated by the boost converter. The boost converter has to be designed to match the operating voltage range of the battery bank being used.

6. Conclusions

Conventional PV array grids have low availability and low power quality due to the variation in environmental factors. Integration of the proposed controller improves the power quality by compensating for the variation in the power generated by the PV grid. The results from the simulation study show that it is capable of operating effectively at various SOC conditions of the BESS and handles both charging and discharging scenarios effectively. The proposed controller does not require a complex gating signal generator and is easy to design when compared to rectifier-based controllers. There can be further improvements to the controllers, such as taking the battery temperature into account, and using a better feedback controller, i.e., a PID instead of a PI controller.

Author Contributions

Conceptualization, B.V.R. and M.K.K.; methodology, B.V.R.; software, B.V.R.; validation, B.V.R. and M.K.K.; formal analysis, B.V.R. and M.K.K.; investigation, B.V.R.; resources, M.K.K.; data curation, B.V.R.; writing—original draft preparation, B.V.R. and M.K.K.; writing—review and editing, B.V.R. and M.K.K.; visualization, B.V.R.; supervision, B.V.R. and M.K.K.; project administration, B.V.R.; funding acquisition, B.V.R. Both authors have read and agreed to the published version of the manuscript.

Funding

This research received no external funding.

Conflicts of Interest

The authors declare no conflict of interest.

Nomenclature

IpvCurrent in PV cell (A)
VpvVoltage in PV cell (V)
IscShort-circuit current of the PV cell (A)
I0Current at saturation level (A)
NsNumber of series-connected PV cells
NpNumber of parallel-connected PV cells
Tpnp-n junction temperature (°C)
BcBoltzmann constant (J K−1)
qCharge of an electron (C)
RsPV array series equivalent resistance (Ω)
RpPV array Parallel equivalent resistance (Ω)
QdIdeality factor of diode
EVoltage controlled source (V)
IbatBattery discharge current (A)
VbatBattery terminal voltage (V)
VoOutput voltage of boost converter (V)
ViInput voltage of boost converter (V)
DDuty cycle of boost converter
LInductance value of boost converter (H)
CCapacitance value of boost converter (F)
SOCBattery state of charge (%)
RbatBattery variable internal resistance (Ω)
EoConstant battery voltage (V)
KResistance of polarization (Ω)
QmaxCapacity of the battery (Ah)
QCharge in the real battery (Ah)
AThe magnitude of the exponential zone (V)
BThe inverse time constant of the exponential zone (Ah−1)
i*Filtered current (A)
BESSBattery energy storage system
PVPhotovoltaic
Exp(s)Exponential zone dynamics (V)
Sel(s)Battery mode
tCharge or discharge time (s)
iBattery current (A)
itExtracted capacity (Ah)
EbattNonlinear voltage (V)

References

  1. Lai, C.S.; Jia, Y.; Lai, L.L.; Xu, Z.; McCulloch, M.D.; Wong, K.P. A comprehensive review on large-scale photovoltaic system with applications of electrical energy storage. Renew. Sustain. Energy Rev. 2017, 78, 439–451. [Google Scholar] [CrossRef]
  2. Mamatha, G.; Rangasai, D.; Avinash, S.; Naveen, M. Integration of solar PV with the grid. Int. J. Appl. Eng. Res. 2017, 12, 430–434. [Google Scholar]
  3. Srikanth Goud, B.; Loveswararao, B.; Rami Reddy, C. Essentials for Grid Integration of Hybrid Renewable Energy Systems: A Brief Review. Int. J. Renew. Energy Res. 2020, 10, 813–830. [Google Scholar]
  4. Guru Prasad, S.; Srikanth, K.S.; Rajanna, B.V. Advanced active power filter performance for grid integrated hybrid renewable power generation systems. Indones. J. Electr. Eng. Comput. Sci. 2018, 11, 60–73. [Google Scholar] [CrossRef]
  5. Srikanth, M.; Vijay Muni, T.; Vishnu Vardhan, M.; Somesh, D. Design and simulation of PV-wind hybrid energy system. J. Adv. Res. Dyn. Control Syst. 2018, 10, 999–1005. [Google Scholar]
  6. Rajanna, B.V.; Lalitha, S.V.N.L.; Rao, G.J.; Shrivastava, S.K. Solar photovoltaic generators with MPPT and battery storage in microgrids. Int. J. Power Electron. Drive Syst. (IJPEDS) 2016, 7, 701. [Google Scholar] [CrossRef] [Green Version]
  7. Kumar, B.P.; Srikanth, M. Photovoltaic—Standalone system with SMES-battery energy storage system cascaded MLI for rural area applications. Int. J. Recent Technol. Eng. 2019, 7, 2064–2068. [Google Scholar]
  8. Lu, C.; Xu, H.; Pan, X.; Song, J. Optimal Sizing and Control of Battery Energy Storage System for Peak Load Shaving. Energies 2014, 7, 8396–8410. [Google Scholar] [CrossRef] [Green Version]
  9. Kapoor, A.; Sharma, A. Optimal Charge/Discharge Scheduling of Battery Storage Interconnected with Residential PV System. IEEE Syst. J. 2019, 14, 3825–3835. [Google Scholar] [CrossRef]
  10. Donepudi, S.R.; Priyanka, M.V.; Jahnavi, K.; Swathi, M. Optimization of an energy storage device in the photovoltaic system. Int. J. Appl. Eng. Res. 2017, 12, 547–552. [Google Scholar]
  11. Calero, F.; Canizares, C.A.; Bhattacharya, K. Detailed and Average Battery Energy Storage Model Comparison. In Proceedings of the 2019 IEEE PES Innovative Smart Grid Technologies Europe (ISGT-Europe), Bucharest, Romania, 29 September–2 October 2019; pp. 1–5. [Google Scholar]
  12. Cho, J.; Jeong, S.; Kim, Y. Commercial and research battery technologies for electrical energy storage applications. Prog. Energy Combust. Sci. 2015, 48, 84–101. [Google Scholar] [CrossRef]
  13. Rallabandi, V.; Akeyo, O.M.; Jewell, N.; Ionel, D.M. Incorporating Battery Energy Storage Systems Into Multi-MW Grid Connected PV Systems. IEEE Trans. Ind. Appl. 2019, 55, 638–647. [Google Scholar] [CrossRef]
  14. Muni, T.V.; Lalitha, S.V.N.L. Power management strategy in a solar PV system with battery protection scheme in dc microgrid. Int. J. Innov. Technol. Explor. Eng. 2019, 8, 960–964. [Google Scholar]
  15. Kumaraswamy, G.; Srinivasa Varma, P.; Chandrasekhar, P. Grid interconnected multi-level inverter-based PV system. J. Adv. Res. Dyn. Control Syst. 2017, 9, 154–160. [Google Scholar]
  16. Ramesh, V.; Latha, Y.K. Performance improvement of grid-connected PV system using new converter topologies. In Proceedings of the 2017 2nd IEEE International Conference on Electrical, Computer and Communication Technologies, ICECCT, Coimbatore, India, 22–24 February 2017. [Google Scholar]
  17. Luo, X.; Wang, J.; Dooner, M.; Clarke, J. Overview of current development in electrical energy storage technologies and the application potential in power system operation. Appl. Energy 2015, 137, 511–536. [Google Scholar] [CrossRef] [Green Version]
  18. Cedric, C.; Adnan, S.; Ahmed, A.-D.; Muyeen, S.M.; Adnan, S. Modeling and analysis of battery performance for renewable energy application. In Proceedings of the 2013 15th European Conference on Power Electronics and Applications (EPE), Lille, France, 3–5 September 2013; p. 110. [Google Scholar]
  19. Vijay Muni, T.; Lalitha, S.V.N.L. Implementation of control strategies for optimum utilization of solar photovoltaic system with energy storage systems. Int. J. Renew. Energy Res. 2020, 10, 716–726. [Google Scholar]
  20. Darabi, A.; Hosseina, M.; Gholami, H.; Khakzad, M. Modeling and Simulation of Lead- Acid Storage Batteries within Photovoltaic Power Systems. Int. J. Emerg. Technol. Adv. Eng. 2013, 18, 2250–2459. [Google Scholar]
  21. Keshan, H.; Thornburg, J.; Ustun, T. Comparison of lead-acid and lithium ion batteries for stationary storage in off-grid energy systems. In Proceedings of the 4th IET Clean Energy and Technology Conference (CEAT 2016), Kuala Lumpur, Malaysia, 14–15 November 2016; pp. 1–7. [Google Scholar]
  22. Moncecchi, M.; Brivio, C.; Corigliano, S.; Cortazzi, A.; Merlo, M. Battery modeling for microgrid design: A comparison between lithium-ion and lead acid technologies. In Proceedings of the 2018 International Symposium on Power Electronics, Electrical Drives, Automation and Motion (SPEEDAM), Amalfi, Italy, 20–22 June 2018; pp. 1215–1220. [Google Scholar]
  23. Chatzinikolaou, E.; Rogers, D.J. A Comparison of Grid-Connected Battery Energy Storage System Designs. IEEE Trans. Power Electron. 2016, 32, 6913–6923. [Google Scholar] [CrossRef]
  24. Soares dos Santos, G.; José Grandinetti, F.; Augusto Rocha Alves, R.; de Queiróz Lamas, W. Design and Simulation of an Energy Storage System with Batteries Lead Acid and Lithium-Ion for an Electric Vehicle: Battery vs. Conduction Cycle Efficiency Analysis. IEEE Latin Am. Trans. 2020, 18, 1345–1352. [Google Scholar] [CrossRef]
  25. Poullikkas, A. A comparative overview of large-scale battery systems for electricity storage. Renew. Sustain. Energy Rev. 2013, 27, 778–788. [Google Scholar] [CrossRef]
  26. Suraj, G.O.; Narasimha Raju, K.; Trivedi, N. Comparative analysis of Li-Ion battery charging with different rectifier topologies. Int. J. Innov. Technol. Explor. Eng. 2019, 8, 420–424. [Google Scholar]
  27. Kularatna, N. Dynamics and Modeling of Rechargeable Batteries: What electrochemists? Work tells the electronic engineers. IEEE Power Electron. Mag. 2014, 1, 23–33. [Google Scholar] [CrossRef]
  28. Chen, M.; Rincon-Mora, G.A. Accurate electrical battery model capable of predicting runtime and i-v performance. IEEE Trans. Energy Convers. 2006, 21, 504–511. [Google Scholar] [CrossRef]
  29. Akbar, N.; Islam, M.; Ahmed, S.S.; Al Hye, A. Dynamic model of battery charging. In Proceedings of the TENCON 2015—2015 IEEE Region 10 Conference, Macao, 1–4 November 2015; pp. 1–4. [Google Scholar]
  30. Yao, L.W.; Aziz, J.A.; Kong, P.Y.; Idris, N.Y.N. Modeling of Lithium-Ion Battery Using MATLAB/Simulink. IEEE 2013, 1729–1734. [Google Scholar]
  31. Rajanna, B.V.; Kumar, M.K. Comparison of one and two time constant models for lithium-ion battery. Int. J. Electr. Comput. Eng. (IJECE) 2020, 10, 670–680. [Google Scholar] [CrossRef] [Green Version]
  32. Stevanatto, L.C.; Tairov, S.; Brusamarello, V.J. Parameter Identification and Analysis of Uncertainties in Measurements of Lead–Acid Batteries. IEEE Trans. Instrum. Meas. 2013, 63, 761–768. [Google Scholar] [CrossRef]
  33. Schweighofer, B.; Recheis, M.; Gallien, T.; Wegleiter, H. Fast and accurate battery model including temperature dependency. In Proceedings of the Industrial Electronics Society, IECON 2013—39th Annual Conference of the IEEE, Vienna, Austria, 10–13 November 2013; pp. 6740–6745. [Google Scholar]
  34. Sparacino, A.R.; Reed, G.F.; Kerestes, R.J.; Grainger, B.M.; Smith, Z.T. Survey of battery energy storage systems and modeling techniques. In Proceedings of the 2012 IEEE Power and Energy Society General Meeting, SanDiego, CA, USA, 22–26 July 2012; pp. 1–8. [Google Scholar]
  35. Rajanna, B.V.; Kumar, M.K. Dynamic model development for a lead-acid storage battery. Indones. J. Electr. Eng. Comput. Sci. 2019, 15, 609–619. [Google Scholar] [CrossRef]
  36. Guasch, D.; Silvestre, S. Dynamic battery model for photovoltaic applications. Prog. Photovolt. Res. Appl. 2003, 11, 193–206. [Google Scholar] [CrossRef]
  37. Rodrigues, E.M.G.; Godina, R.; Osorio, G.J.; Lujano-Rojas, J.M.; Matias, J.C.O.; Catalao, J.P.S. Comparison of battery models for energy storage applications on insular grids. In Proceedings of the 2015 Australasian Universities Power Engineering Conference (AUPEC), Wollongong, NSW, Australia, 27–30 September 2015; pp. 1–6. [Google Scholar]
  38. Rosewater, D.M.; Copp, D.A.; Nguyen, T.A.; Byrne, R.H.; Santoso, S. Battery Energy Storage Models for Optimal Control. IEEE Access 2019, 7, 178357–178391. [Google Scholar] [CrossRef]
  39. Ravi Kumar, K.S.; Mohanta, D.K.; Sastry, V.V.; Rajesh, D.; Sekhar, O.C.; Varma, M.P.C. Design and fabrication of coulomb counter for estimation of SOC of battery. In Proceedings of the IEEE International Conference on Power Electronics, Drives and Energy Systems, PEDES 2016, Trivandrum, India, 14–16 December 2016; pp. 1–6. [Google Scholar]
  40. Tremblay, O.; Dessaint, L.-A.; Dekkiche, A. A Generic Battery Model for the Dynamic Simulation of Hybrid Electric Vehicles. In Proceedings of the IEEE Vehicle Power and Propulsion Conference, Gijón, Spain, 25–28 October 2007; pp. 284–289. [Google Scholar]
  41. Wang, W.; Mu, J. State of Charge Estimation for Lithium-Ion Battery in Electric Vehicle Based on Kalman Filter Considering Model Error. IEEE Access 2019, 7, 29223–29235. [Google Scholar] [CrossRef]
  42. How, D.N.T.; Hannan, M.A.; Lipu, M.S.H.; Ker, P.J. State of Charge Estimation for Lithium-Ion Batteries Using Model-Based and Data-Driven Methods: A Review. IEEE Access 2019, 7, 136116–136136. [Google Scholar] [CrossRef]
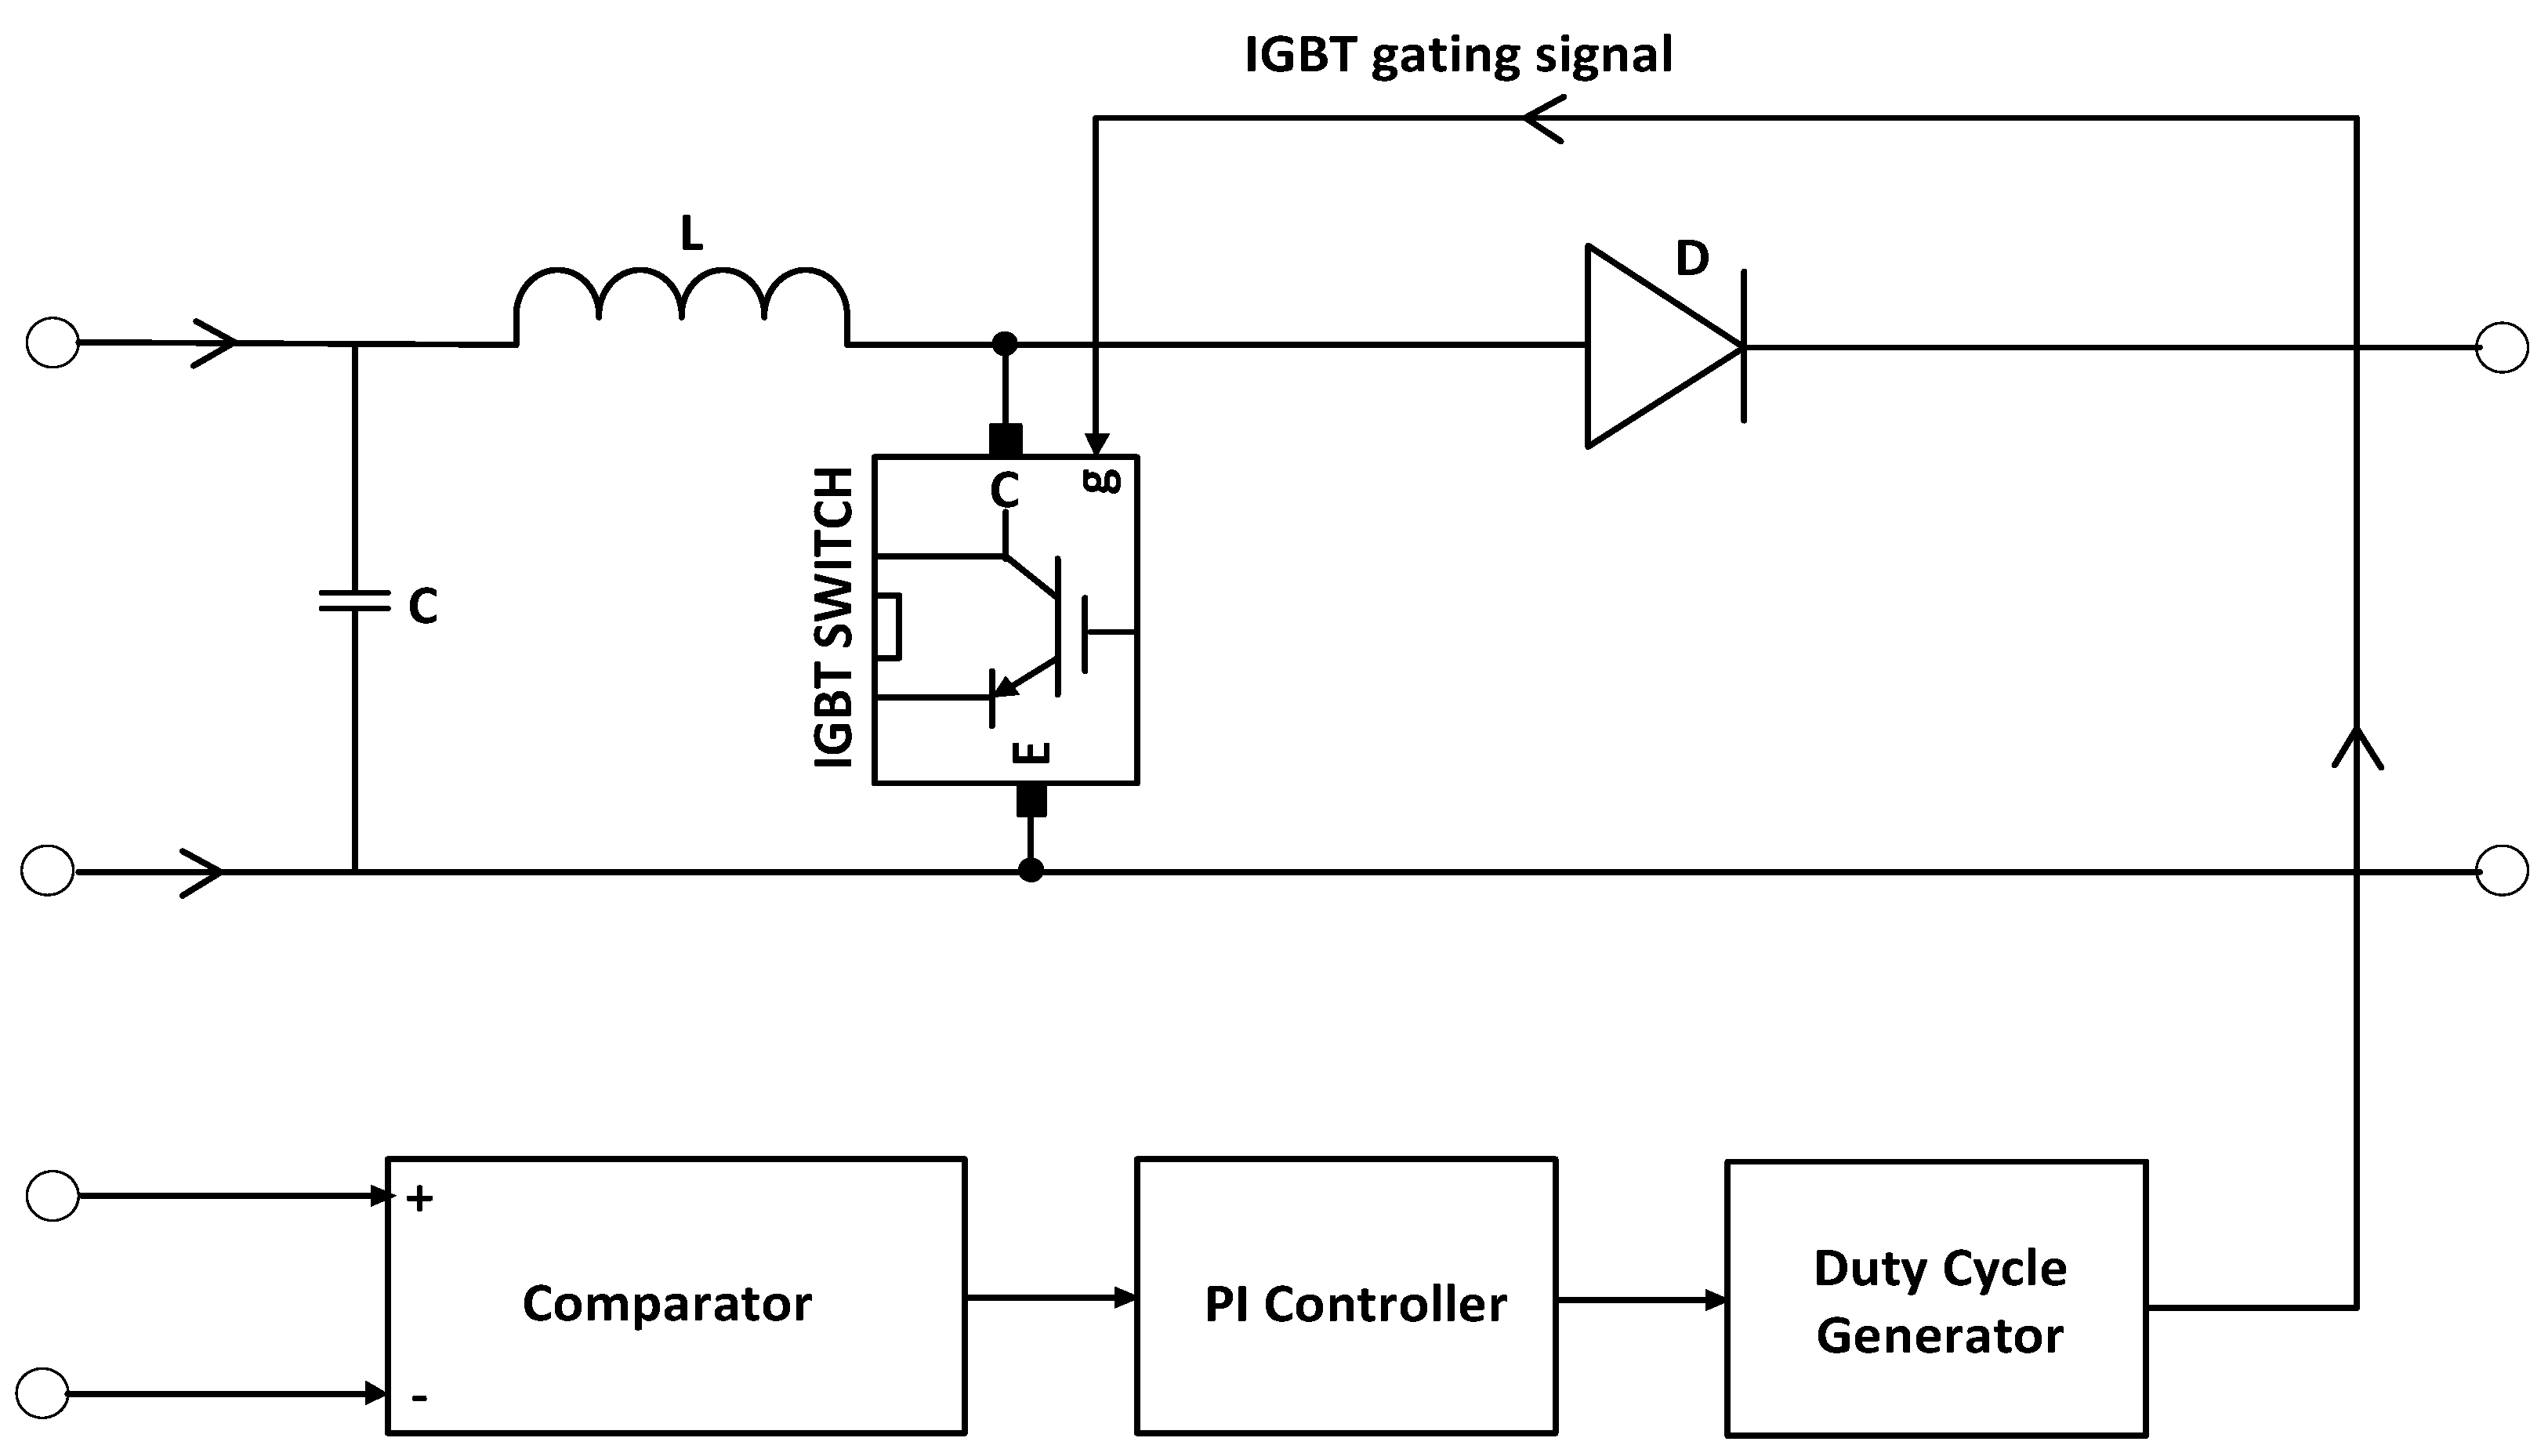
Figure 1. Proposed controller.
Energies 14 01530 g001
Figure 2. Detailed photovoltaic (PV) system configuration and system description block diagram.
Energies 14 01530 g002
Figure 3. Solar cell equivalent circuit with Rs and Rp [6].
Energies 14 01530 g003
Figure 4. Simulink diagram of the generic battery model [40].
Energies 14 01530 g004
Figure 5. Connection diagram in discharge scenario.
Energies 14 01530 g005
Figure 6. PV array irradiance (Irr), temperature (°C), mean power (Pmean), and mean voltage (Vmean); duty cycle of boost converter.
Energies 14 01530 g006
Figure 7. Connection diagram in charge scenario.
Energies 14 01530 g007
Figure 8. Step-up solar irradiance and temperature.
Energies 14 01530 g008
Figure 9. Battery discharging voltage, discharge current, battery state of charge (SOC), and utility grid power at 40% of SOC without discharge controller.
Energies 14 01530 g009
Figure 10. Battery discharging voltage, current, SOC, and utility grid power comparison at 80% of SOC with discharge controller.
Energies 14 01530 g010
Figure 11. Battery charging voltage, battery charging current, battery SOCs, and utility grid power at 20% SOCs of batteries without the charge controller.
Energies 14 01530 g011
Figure 12. Battery charging voltage, current, SOC, and utility grid power comparison at 20% of SOC with charge controller.
Energies 14 01530 g012
Figure 13. Battery discharging voltage, current, SOC, and utility grid power comparison at 40% of SOC with discharge controller.
Energies 14 01530 g013
Figure 14. Battery discharging voltage, current, SOC, and utility grid power comparison at 20% of SOC with discharge controller.
Energies 14 01530 g014
Figure 15. Battery discharging voltage, Current, SOC, and utility grid power comparison at 79% of SOC with charge controller.
Energies 14 01530 g015
Table 1. Selection of PV array ratings.
PV Array Ratings
330 Sun Power Modules (SPR-305E-WHT-D)
Remarks
Rating of PV Array100 kWNumber of strings in parallel × Number of modules per string × power per module = 66 × 5 × 305.2 W = 100.7 kW, approximately.
Utility Grid Demand100 kW
PV Module Power305 WVoltage at maximum power Vmp × Current at maximum power Imp = 54.7 V × 5.58 A = 305.2 W, approximately.
Number of modules330
Short-Circuit Current (Isc) of PV cell5.96 A
Open-Circuit Voltage (Voc) of PV cell64.2 V
Voltage at maximum power Vmp54.7 V
Current at maximum power Imp5.58 A
Number of series connected PV Cells96 per module
Number of strings in parallel66
Number of modules per string5
Table 2. Selection of battery ratings.
Battery RatingsValueRemarks
Number of Batteries Connected in Parallel4
Type of Battery UsedLead-Acid or Lithium-Ion
Nominal Voltage of Lead-Acid Battery535 V
Nominal Voltage of Lithium-Ion Battery500 V
Fully Charged Voltage of Batteries582.5 V
Ah Rating of Each Battery100 Ah
Power Rating of Battery Bank100 kW
DC Link Voltage, Vdc500 V
Total Current Delivered by the Cattery Bank200 A Total   current = power   rating   of   battery   bank DC   link   voltage   V dc = 100   kW 500   V = 200   A
Current Delivered by Each Battery50 A Total   current   delivered   by   battery   bank Number   of   batteries   connected   in   parallel = 200   A 4 = 50   A
Battery Bank Back-Up Time2 h Ah   rating   of   each   battery Current   delivered   by   each   battery = 100   Ah 50   A = 2   h
Publisher’s Note: MDPI stays neutral with regard to jurisdictional claims in published maps and institutional affiliations.