Article

Application of the Mechanical and Pressure Drop Tests to Determine the Sintering Temperature of Coal and Biomass Ash

Department of Energy Technologies, Turbines and Modelling of Thermal and Fluid Flow Processes, Wroclaw University of Science and Technology, 50-370 Wrocław, Poland
*
Author to whom correspondence should be addressed.
Energies 2021, 14(4), 1126; https://doi.org/10.3390/en14041126
Submission received: 12 January 2021 / Revised: 12 February 2021 / Accepted: 17 February 2021 / Published: 20 February 2021
(This article belongs to the Special Issue Modelling and Calculation of Raw Material Industry)

Abstract

:
The aim of this paper is to investigate the mechanical properties of coal and biomass ash during the sintering process. For this study, bituminous coal, lignite, wheat straw, barley straw, and rye straw were selected. The proximate, ultimate, and oxide analyses were performed. The ash from these fuels was prepared in a special way that ensured the physicochemical invariability of the initial state of the mineral matter of coal and biomass. The purpose of this selection was to obtain widely available and clearly diversified materials. Based on the results of ash composition and ultimate analysis the most common ash deposition, indices were determined. Certain conflict of index indications was observed. Then, the mechanical test and pressure drop test were performed. During the mechanical test, the fracture stress as a function of sintering temperature was measured. During the pressure drop test, the pressure before and behind the sample was measured as a function of sintering temperature. Both tests showed that the characteristic changes (the occurrence of a maximum on the pressure drop curve and the inflection point at the mechanical curve) dependencies were at nearly the same temperatures. These results were compared with the initial deformation temperature (IDT) from the standard Leitz method. A linear relationship between sintering temperatures determined by the mechanical test, pressure drop test, and IDT Leitz test was obtained. The obtained results are promising in terms of the application of the mechanical methods (fracture stress test and pressure drop test) as methods of the early stage prediction of slagging/fouling risks.

1. Introduction

The efficiency of the combustion system producing the energy depends on processes such as ash adhesion and ash removal. These processes lead to ash deposits creation on the heat exchanger tubes and in the gas circuit (slagging and fouling process). The formation of ash deposits on the surface of boilers and heat exchangers reduces the heat transfer rate and therefore the efficiency of the whole system. For this reason, it is important to study the slagging and fouling processes. These processes are mainly caused by reactive alkaline and alkaline earth compounds found in coal and in a relatively large amount of biomass.
The amount of alkaline elements significantly influences the mechanism of mineral matter transformation during the coal and biomass combustion process. These problems have been widely described and discussed by many authors, in particular during biomass combustion [1,2,3,4] and during coal combustion [5,6,7,8].
Slagging and fouling processes are closely associated with the ash fusion behavior—mainly with the melting of ash. The ash sintering process takes place on the microstructure level of the ash. But from a microscopic point of view, it is a very inhomogeneous material. The individual particles of the ash have different shapes, different chemical compositions, and different crystallographic structures. Then, it is very difficult to find a method that can predict the temperature at which this ash starts to be viscous and starts, therefore, to make the fouling or slagging on the surfaces of heat exchangers. The main mechanism of the ash sintering process is the melting of the surface of individual ash particles. The ash particles with melted surface coalescent as a result of minimization of the surface tension [6,9,10]. The formation of ash deposits—slagging in the radiative region and fouling in the convection region of the combustion system can cause consequences such as deterioration of heat transfer, damage of boiler surfaces, and even shutdown of the boiler [11,12]. It is interesting that the ash deposit buildup is rather related to ash physicochemical properties, while its strength development depends rather on ash sintering characteristics [12,13].
They are some widely used methods of assessing the slagging and fouling hazard. The ash fusion test (AFT) is widely used. This test determines temperatures at which change of samples’ shape is observed—deformation temperature (DT), spherical/softening temperature (ST), hemispherical temperature (HT), and fluid temperature (FT), which is a part of mineral matter transformation processes [3,5,14,15,16]. The other widely used method is based on the statistical observations of the relationship between the amount of basic and acid oxides and the tendency to slagging and fouling [17,18,19,20]. In addition to these two methods, there are others based on the observation of the change of physical properties of the ash. To detect the shrinkage behavior of the ash sample during the sintering process, the Thermomechanical Analysis (TMA) method can be implemented. That is originally applied in metallurgy [10]. The other interesting methods are thermal conductivity analysis [21], compressing strength analysis [22,23,24], electrical resistivity measurements [23], thermogravimetric analysis (TGA) [18,25], thermodynamic FactSage analysis [18], optical heating stage microscopy (OSHM) [26], pressure drop test [9,10,27,28], and other techniques presented in detail [29].
These methods are constantly applied to different types of solid fuels in order to better understand the process of mineral matter transformation of solid fuels and to develop a reliable and objective method for the assessment of operational hazards.
The interesting results of the ash deposits on tube strength in the convection section of pulverized coal-fired boilers were presented [22]. Based on the tested compressive strengths of sintered ash at three temperatures (750 °C, 850 °C, and 950 °C), it was found that the compressive strength was higher for higher temperatures and lower for larger ash particles. That was explained by the Frenkel sintering mechanism and the chemical reactions of the formation of calcium aluminosilicates [22].
Our article focuses on the study of the nonstandard mechanical method based on the measurement of the fracture stress of sintered ash samples in comparison with the results of the pressure drop test, oxide indices, and the standard AFT test. The aim of our study is to test the proposed mechanical method of the relationship between the fracture stress and the temperature of sintered samples for two types of solid fuels (coal and biomass). Two types of coal (bituminous and lignite) and three types of biomass (with relatively high Na and Ca content) were used as the experimental material. Due to the fact that the content of sodium and calcium determines the early stage of the ash sintering process [23], this choice will allow us to test the proposed nonstandard mechanical method—sensitive to the initial stage of the ash sintering process.
The proposed mechanical test has a large usage potential as an objective method for assessing the slagging and fouling hazards for coal ash and biomass. Interestingly, rapid changes in the breaking stress during the ash sintering process were observed in the same temperature range as the rapid changes in the pressure drop test. That observation shows that the breaking stress is very sensitive at the beginning stage of the ash sintering process. In turn, the study of the initial stage of the ash sintering process is very important in identifying the mechanisms of transformation of the mineral substance of solid fuels during combustion under different conditions [22,30].

2. Materials and Methods

The study was carried out on three selected types of crops (rye, barley, and wheat straw) and, as a reference, on two types of coals from Polish mines (lignite and bituminous coal). For all the tested materials, the mechanical test and pressure drop test were conducted to determine their technological suitability, i.e., technical and elemental analysis. Each tested biomass and coal sample was analyzed in terms of moisture content, ash content and volatile matter, the content of solid combustible parts, the content of elements such as C, H, O, S, N, and additionally, the heating value was determined.
The technical analysis was carried out in accordance with Polish Standards for solid fuels, i.e., determination of moisture content by the gravimetric method [31], ash content by the gravimetric method [32], the heat of combustion and calculation of calorific value by methods of calorimetry [33], and volatile matter content by the gravimetric method [34]. The results refer to the analytical state, i.e., the state of fuel with moisture and ash content like the sample brought to the level of equilibrium with the surrounding atmosphere. Fixed carbon (FC) is the solid combustible flammable residue that remains in fuel after moisture, volatile matter, and ash are expelled. FC content divided by the content of volatile matter is called the fuel ratio (FR). According to their fuel ratios, coals have been classified as anthracite with FR of at least 10; semi–anthracite with FR of 6 to 10; semi–bituminous with FR of 3 to 6; bituminous with FR of 3; and as alternative fuels with FR of 1 or less. The composition of the ashes was determined by the method of a Thermo iCAP 6500 Duo ICP plasma spectrometer using ASCRM–010 as a reference substance.
The ash samples with 200 μm fraction were tested, i.e., fraction sizes with polydispersed dust consistencies that agree with generally applied principles used for hard and brown coals, according to the norm [35].
Fuels of which ash samples were prepared were dried, grounded, and fractionated to a grain size of less than 200 µm. Subsequently, all of the tested fuels were initially degassed in a vertical oven (approx. 5 h time). Degassed samples were then sintered at 500 °C to achieve complete combustion of combustible components remaining in fuels after degassing (approx. 20–30 h). The temperature of fuel sintering (500 °C) was selected in the way that the melting point of mineral matter in the ashes was avoided. Therefore, these prepared ash samples were fractionated to grains below 100 µm. In the next step, the cylindrical samples from this form of ash are prepared.
In the strength method for forming the cylindrical samples, a special matrix was used. The specific quantity of tested ash was put into the special matrix (1 g) without any addition of binders. That sample was then compressed at constant pressure (1 Mpa). Formation of the samples occurs as a result of ash compaction. Dimensions of the samples were 8–8.5 mm in diameter and 10–12 mm in height. These obtained ash samples were then isochronally sintered for four hours in different temperatures ranging from 500 °C to 1200 °C. After being isochronally sintered, each sample was then mechanically tested in the following way: each sample was put under devastating stress using UCT—5882 device according to Figure 1.
The sample preparation for the pressure test method is similar to the mechanical one. The only difference is that the cylindrical shape of the samples is not formed in the matrix but directly in the measuring tube. This tube has special steel pins (upper and lower ones) fitted loosely in the tube. The lower pin serves as a base when forming cylindrical samples followed by the pressure on the sample of the upper pin using the hydraulic press under the same pressure as in the strength method (1.0 MPa). Samples obtained in the described process have a diameter of 10 mm and an approximate height of 1.5 mm.
Determination of the fouling temperature according to the pressure method is based on measuring the gradient of the pressure of compressed air flowing through a heated ash sample. The pressure drop system (Figure 2) includes (1) measuring tube, (2) ash sample, (3) electric furnace, (4) autotransformer with a temperature controller, (5) radiator, (6) thermocouple (6), (7) electronic pressure gauge, (8) electronic temperature gauge, (9) hoses with compressed air, (10) fittings, (11) recording system, and (12) rotameter.
Each mechanical and pressure measurement was repeated on five samples made of the same ash. The results presented in Figure 3, Figure 4 and Figure 5 are the arithmetic mean and the uncertainty is the mean standard deviation.

3. Results and Discussion

3.1. Samples Analysis

The results of proximate and elemental analysis of the selected biomass in comparison with the bituminous coal (BC) and lignite (LC) from Polish mines with data concerning the heating value (HHV) are provided in Table 1.
The results presented in Table 1 show some similarity (HHV, C, FC) of the basic physical–chemical properties of the examined biomasses and lignite samples. The heating values (HHV) and fixed carbon (FC) values are very close and are about twice lower than in the bituminous coal sample. Analytical moisture content is in the range from 2 wt.% (BC) to 10.7 wt.% (LC). The water content of biomass that comes from selected crops can vary between 5.7 wt.% and 8.5 wt.%. Increased moisture content results in an additional amount of water vapor in the exhaust. This leads to an increase in the volume of exhaust gases per unit of energy. Too high moisture content in fuel can, among other factors, impede ignition and lower the combustion temperature due to heat demand for water evaporation. Reduced combustion temperature affects the composition of combustion products and therefore also the level of hazardous emissions [4].
The tested biomass materials showed a high share of volatile matter (VM), ranging from 62.7 wt.% for barley to 69.3 wt.% for wheat biomass, in comparison with lignite (41.6 wt.%) and bituminous coal (26.9 wt.%). Due to the high content of volatiles, biomass can ignite at relatively low temperatures, and combustion proceeds quickly. Therefore, the combustion process should be adequately controlled [36].
The FR index value [37] for selected biomasses is nearly at the same level (0.31 for barley and rye biomass and 0.33 for wheat biomass) and is about twice lower than for lignite coal and about seven times lower than for bituminous coal.
The tested biomass material was characterized by low ash content—ranging from 3.6 wt.% (rye) to 8.2 wt.% (wheat) in comparison with the coal. Despite it, biomass ash is very dangerous in terms of operational hazards such as fouling and slagging because its chemical composition (high content of alkali metals like sodium, calcium, and potassium) increases exploitation hazards such as slagging, fouling, and corrosion. The ash in fuel has negative effects on the heating surfaces, increasing their erosive wear and causing the formation of slag and ash deposits [36].
The elemental carbon content in the tested biomass (45.5–47.8 wt.%) does not differ significantly from the content of this element in lignite (65.4 wt.%) and is lower than in bituminous coal (65.4 wt.%). The content of nitrogen and sulfur in the analyzed samples determines their potential to pose risks related to the emission of nitrogen oxides and sulfur dioxide. The nitrogen content determined in the studied biomass (from 0.4 wt.% for barley to 0.6 wt.% for wheat) is comparable with the value for lignite (0.7 wt.%) and about twice lower than for bituminous coal (1.3 wt.%). Sulfur content in tested biomasses (0.081–0.085 wt.%) is much lower than in bituminous coal (1.2 wt.%) and lignite (2.6 wt.%). Therefore, during combustion, the addition of selected biomass to the coal reduces nitrogen and sulfur emission.
The composition of the tested materials’ ash is presented in Table 2.
The content of elemental carbon, which is important because of its influence on HHV value, and nitrogen in selected biomasses is comparable with that in lignite and smaller than in bituminous coal. The content of elemental sulfur in selected biomasses is much lower than in both coals, whereas the content of oxygen is almost twice as high in lignite and about four times higher than in bituminous coal.
It can be seen that the potassium content is significantly higher in the biomass than in both coals. The opposite is the case of iron and aluminum oxides. Additionally, selected bituminous coal has a very high content of sulfur.
Various predictive factors for ash characterization have been developed at present deposition tendencies, such as silica content (SiO2), the chlorine content of the fuel (Cl), basic to acidic oxides (B/A), bed agglomeration index (BAI), Babcock index (Rs), fouling index (Fu), fouling factor (Rf), slag viscosity index (Sr) and initial deformation temperature (IDT). Indicators and the formulas used for the calculations are extensively described in [17,38]. Patterns used for this determination are listed below (1–6).
B A = F e 2 O 3 + C a O + M g O + N a 2 O + K 2 O + P 2 O 5 S i O 2 + A l 2 O 3 + T i O 2 ,
B A I = F e 2 O 3 N a 2 O + K 2 O ,
R s = ( B A ) · S d ,
F u = ( B A ) · ( N a 2 O + K 2 O ) ,
R f = ( B A ) · ( N a 2 O + 0.659 · K 2 O ) ,
S r = S i O 2 · 100 F e 2 O 3 + S i O 2 + C a O + M g O ,
Applicability of these indicators is limited because they are mainly established to characterize coal rather than biomass ash properties [17,38]. Ranges of slagging and fouling indices are presented in Table 3 and marked in greyscale to highlight the difference in values to improve its visibility. The same Table 3 shows indices calculated for fuels under analysis.
Oxide indices are widely used to characterize ash deposition tendencies. This method was based on the statistical observation of ash behavior. It was first proposed for coal and adopted for biomass. The ash deposition coefficients for tested coal and biomass are presented in Table 3. All tested fuels have a high potential of ash deposition tendency because of the high content of silica (>25 wt.%), with the lowest for lignite (29.12 wt.%) and the highest for barley straw (67.46 wt.%). Silica plays an important role because it reacts with sodium and potassium and creates eutectics with a low melting point. The chlorine content is extremely high for both coals (0.52 wt% for bituminous and 0.99 wt% for lignite), high for rye and barley straw (0.45 wt.%, 0.49 wt.%, respectively), and medium for wheat straw (0.22 wt.%). Chlorine is responsible for potassium chloride (KCl) formation and formation of ash deposits on low-temperature heating surfaces. In contrast, the basic to acid ratio, which describes the general melting behavior, is low for all samples, except for rye straw for which this ratio is high. The B/A ratio is the lowest for bituminous coal (0.24), but the values for lignite, barley straw, and wheat straw are similar (0.45–0.48). BAI index describes the tendency to agglomerate the bed during fluidized bed combustion—for all tested biomass it is below the limit, and for both coals, it is above the limit. The Babcock index (Rs) is medium for lignite (1.39) and low for other tested fuels, with the lowest for wheat and barley straw (0.04) and the higher for rye straw (0.17) and bituminous coal (0.29). This index provides some information about K2SO4, K2Ca(SO4)2, and K3Na(SO4)2 formation that may increase the deposition tendency on high-temperature heating surfaces. It means that tested biomass and bituminous coal are characterized by a low risk of ash deposition. Fouling index (Fu) is extremely high (>40) for rye straw (78.63), high for barley straw (9.75), wheat straw (9.15), and lignite (2.86) but is in its low range for bituminous coal (0.86). Fouling factor follows these tendencies. Slag viscosity index (Sr) is in the range of low value for barley straw (91.04), wheat straw (86.19), and bituminous coal (77.96). In contrast, for rye straw (62.20) and lignite (62.86), it is in a high range. The IDT temperature is the highest for bituminous coal (1030 °C) and lowers for lignite (910 °C), wheat straw (790 °C), barley straw (760 °C), and rye straw (730 °C). The data collected in Table 3 show a certain conflict of index indications. Therefore, it is difficult to unequivocally determine the degree of hazards associated with the slagging and fouling process solely on the basis of the chemical composition of solid fuels.

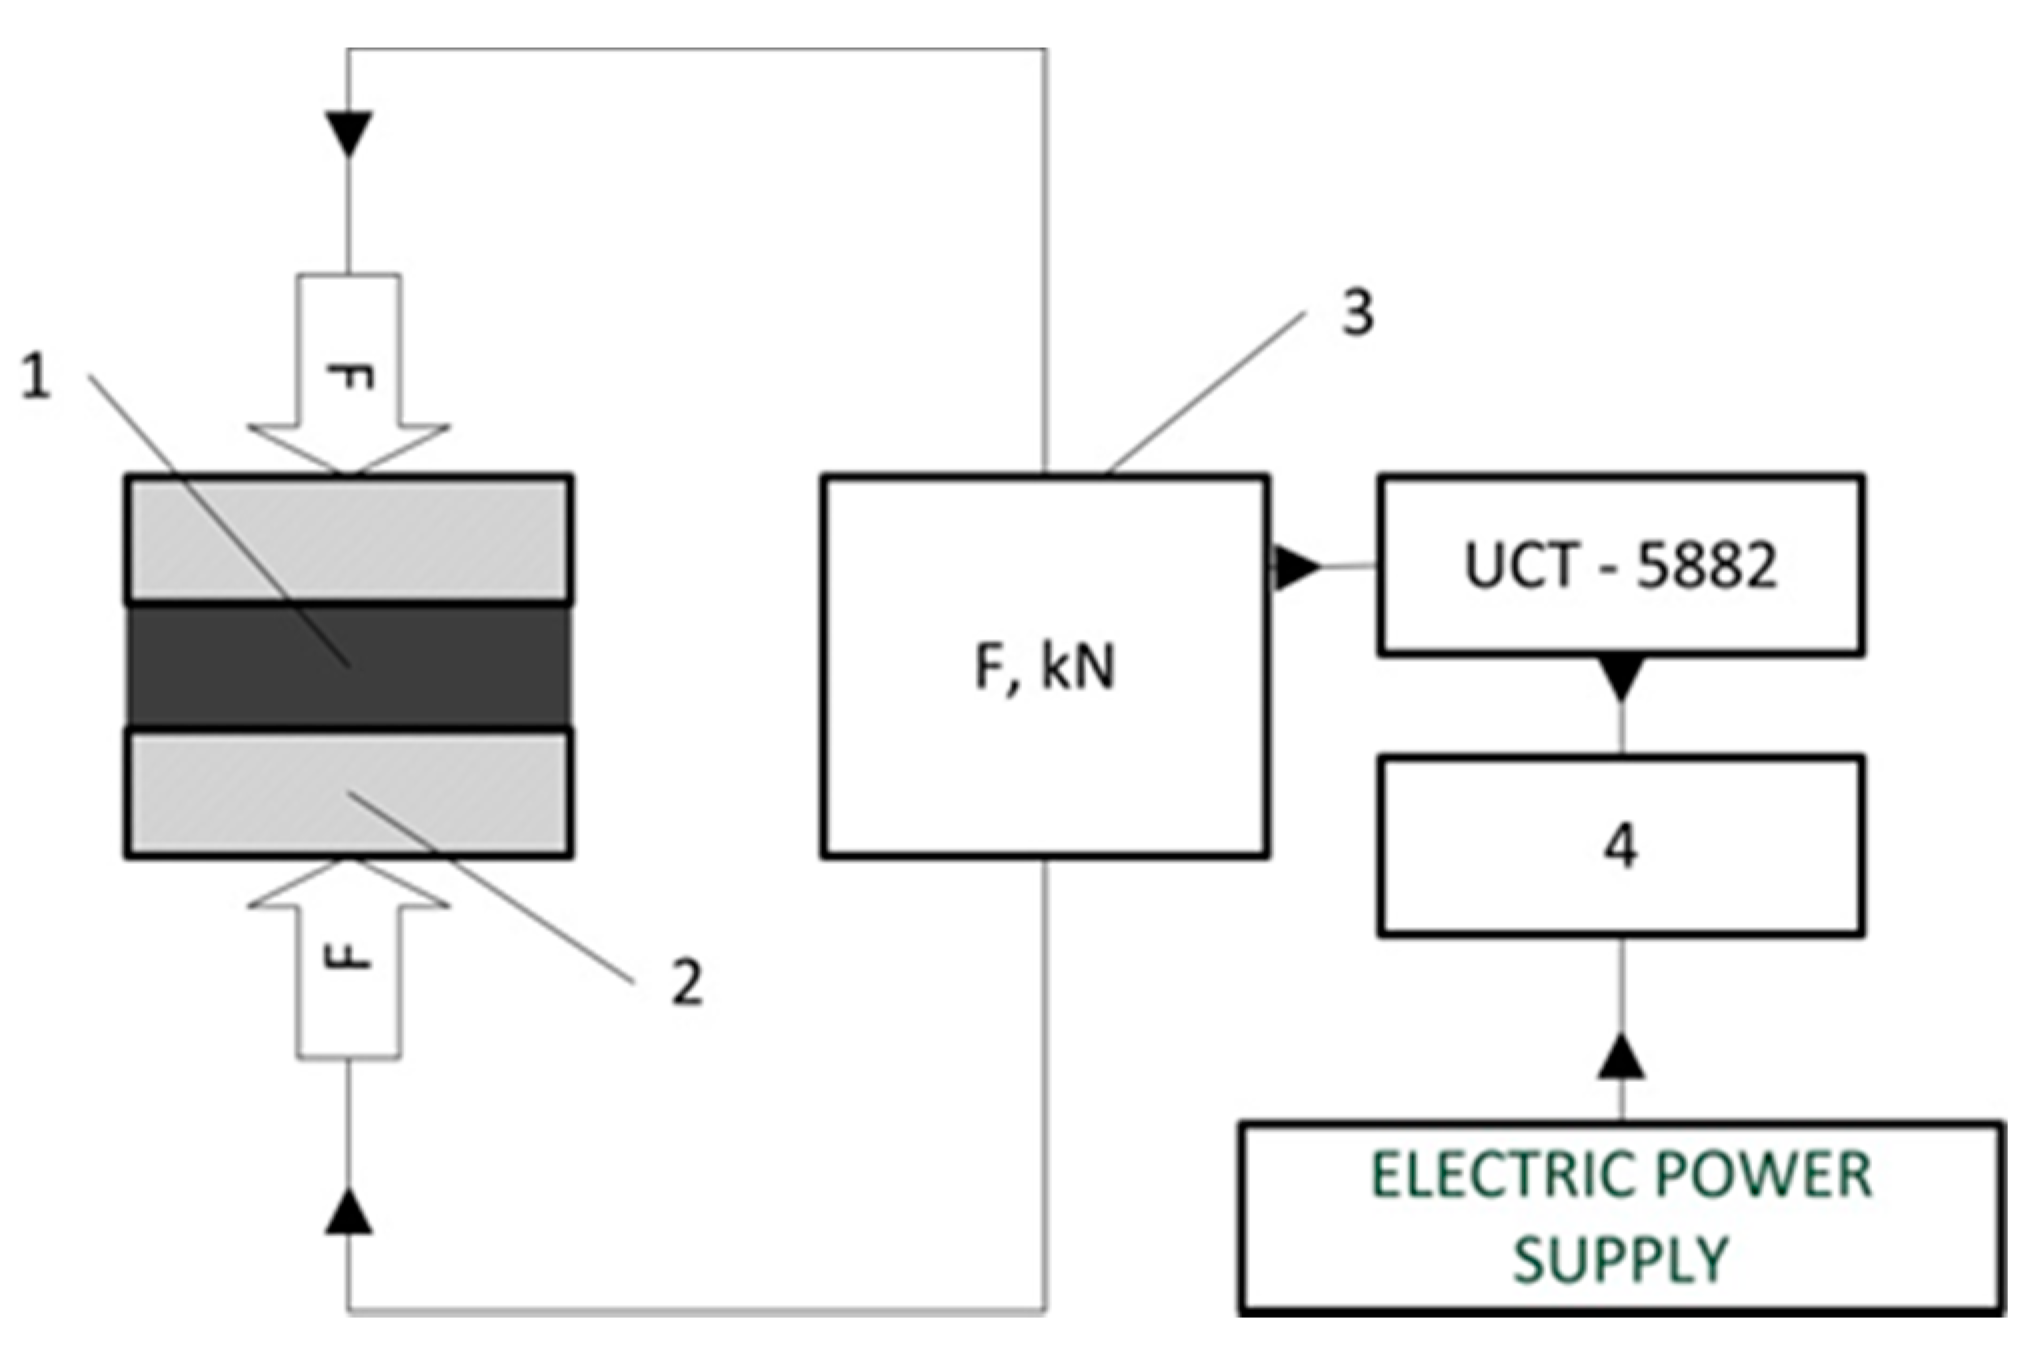
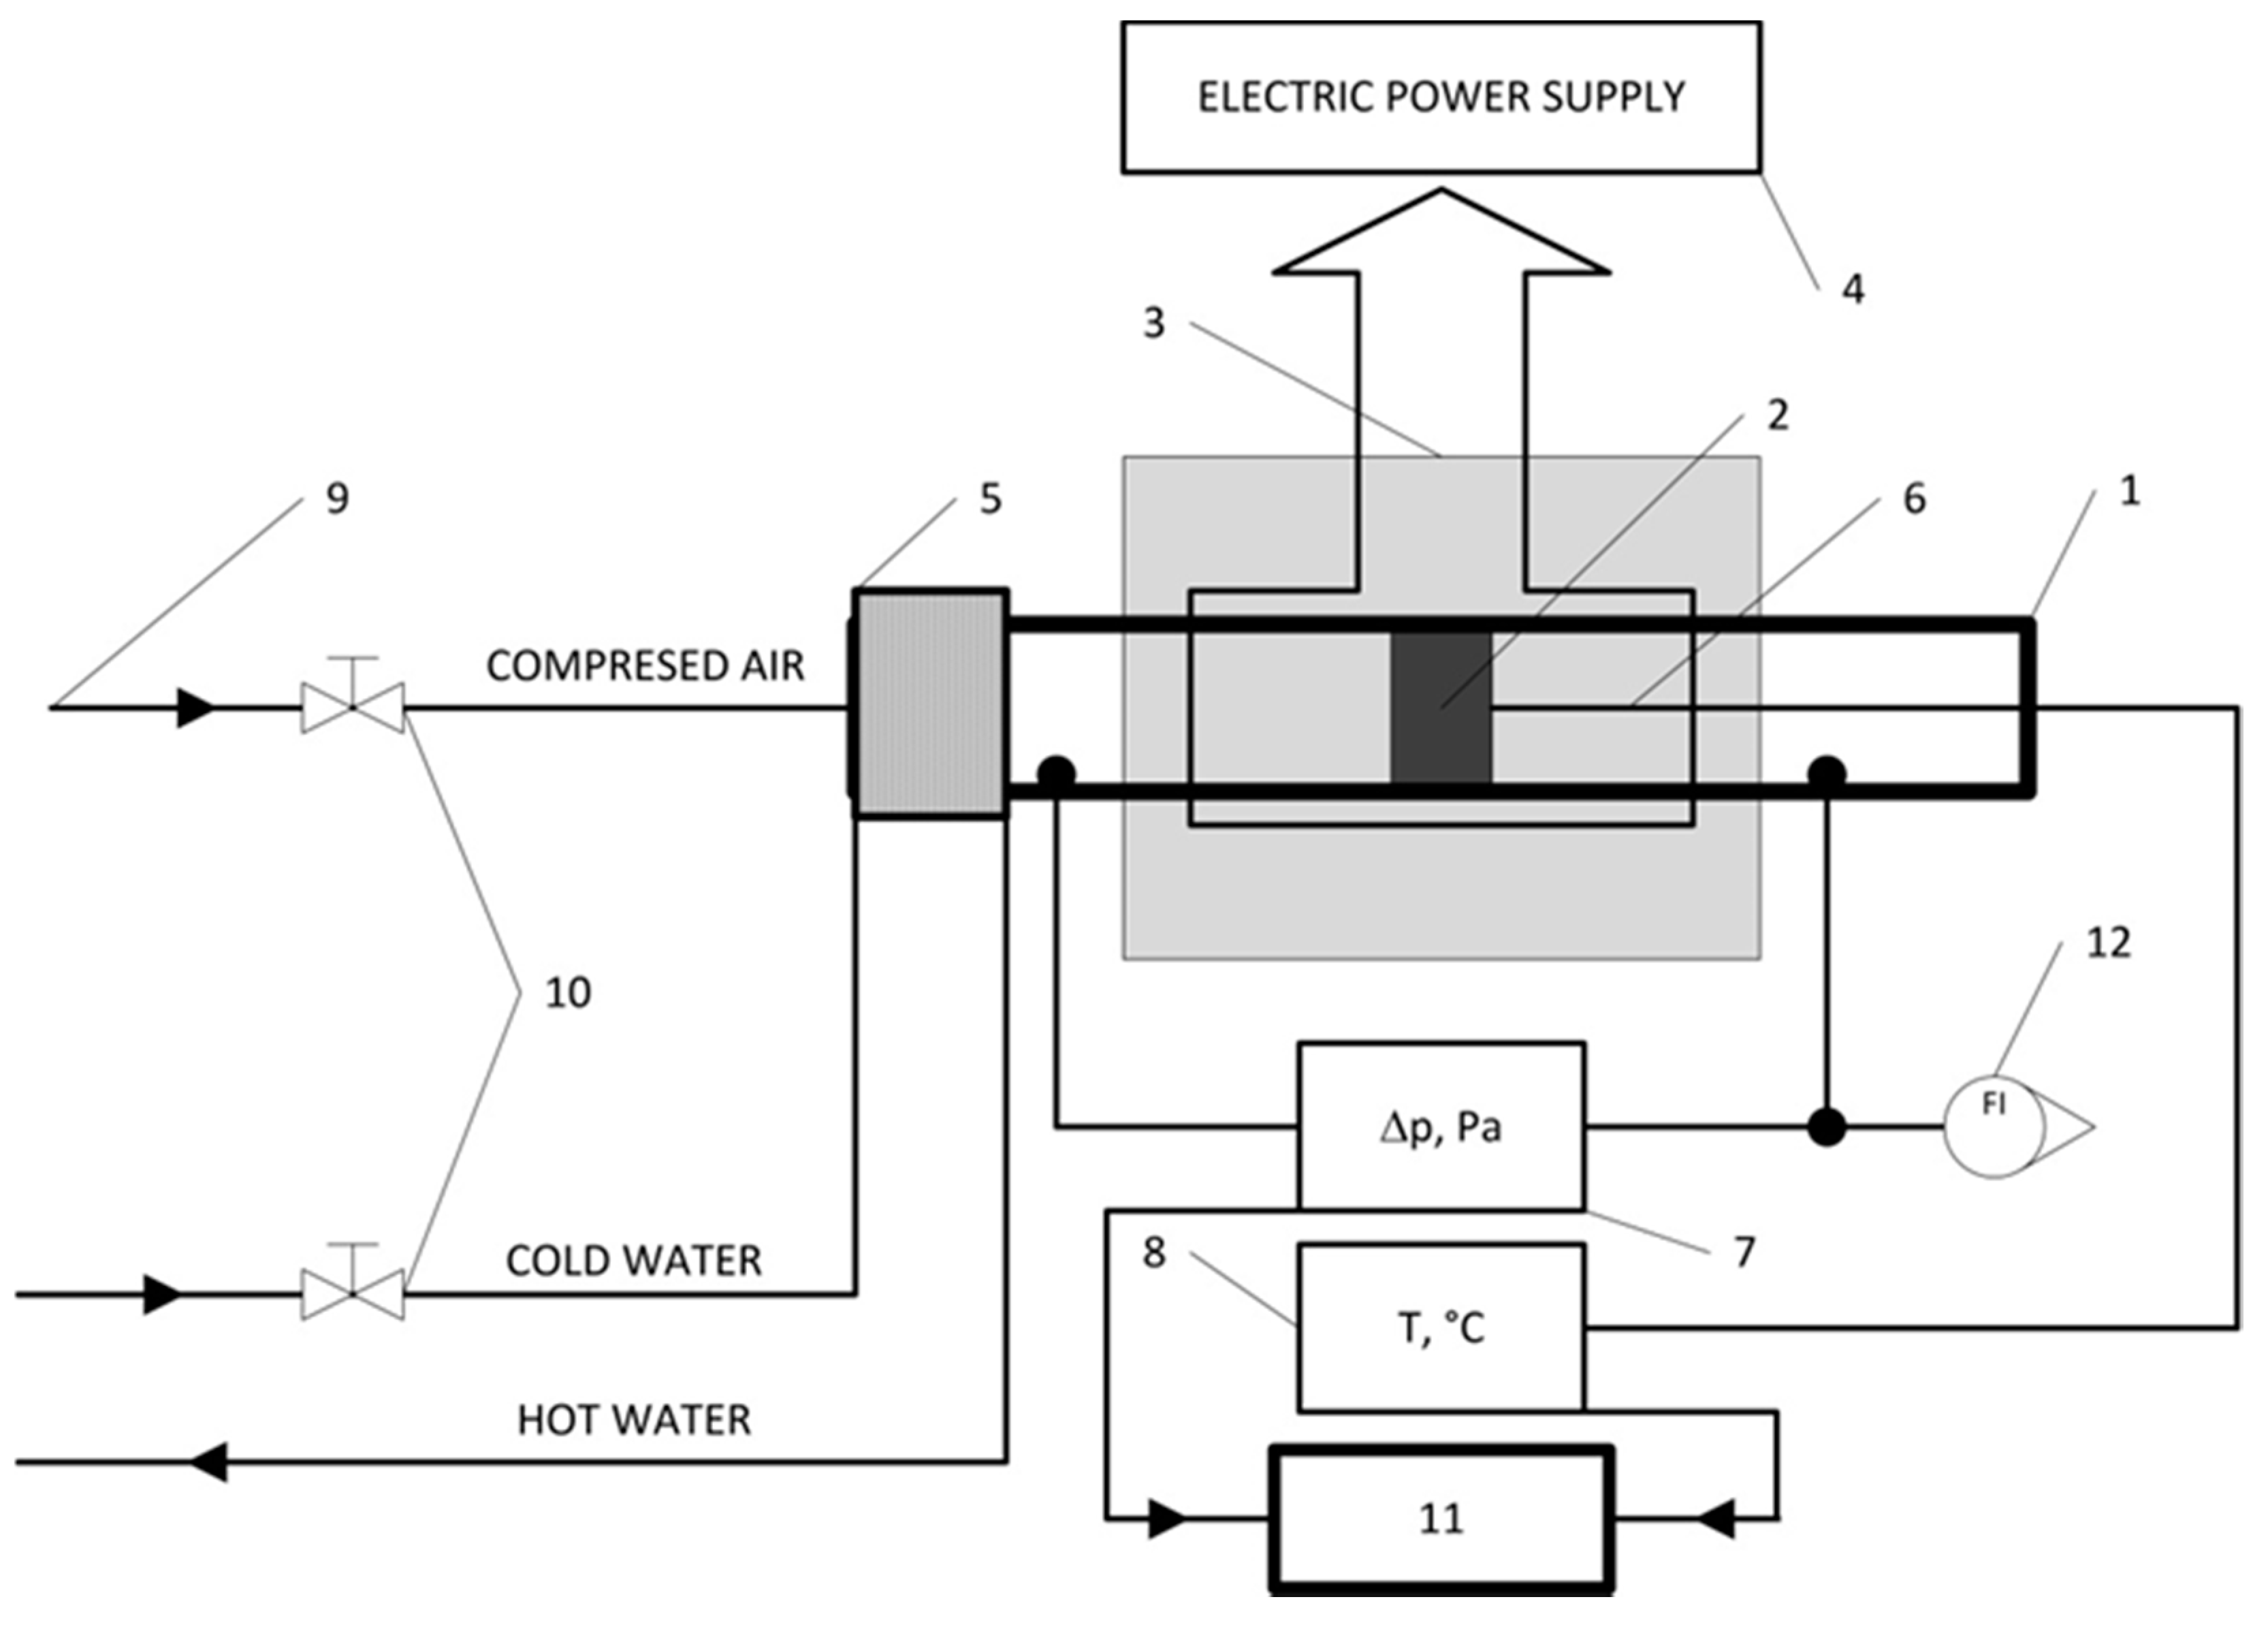
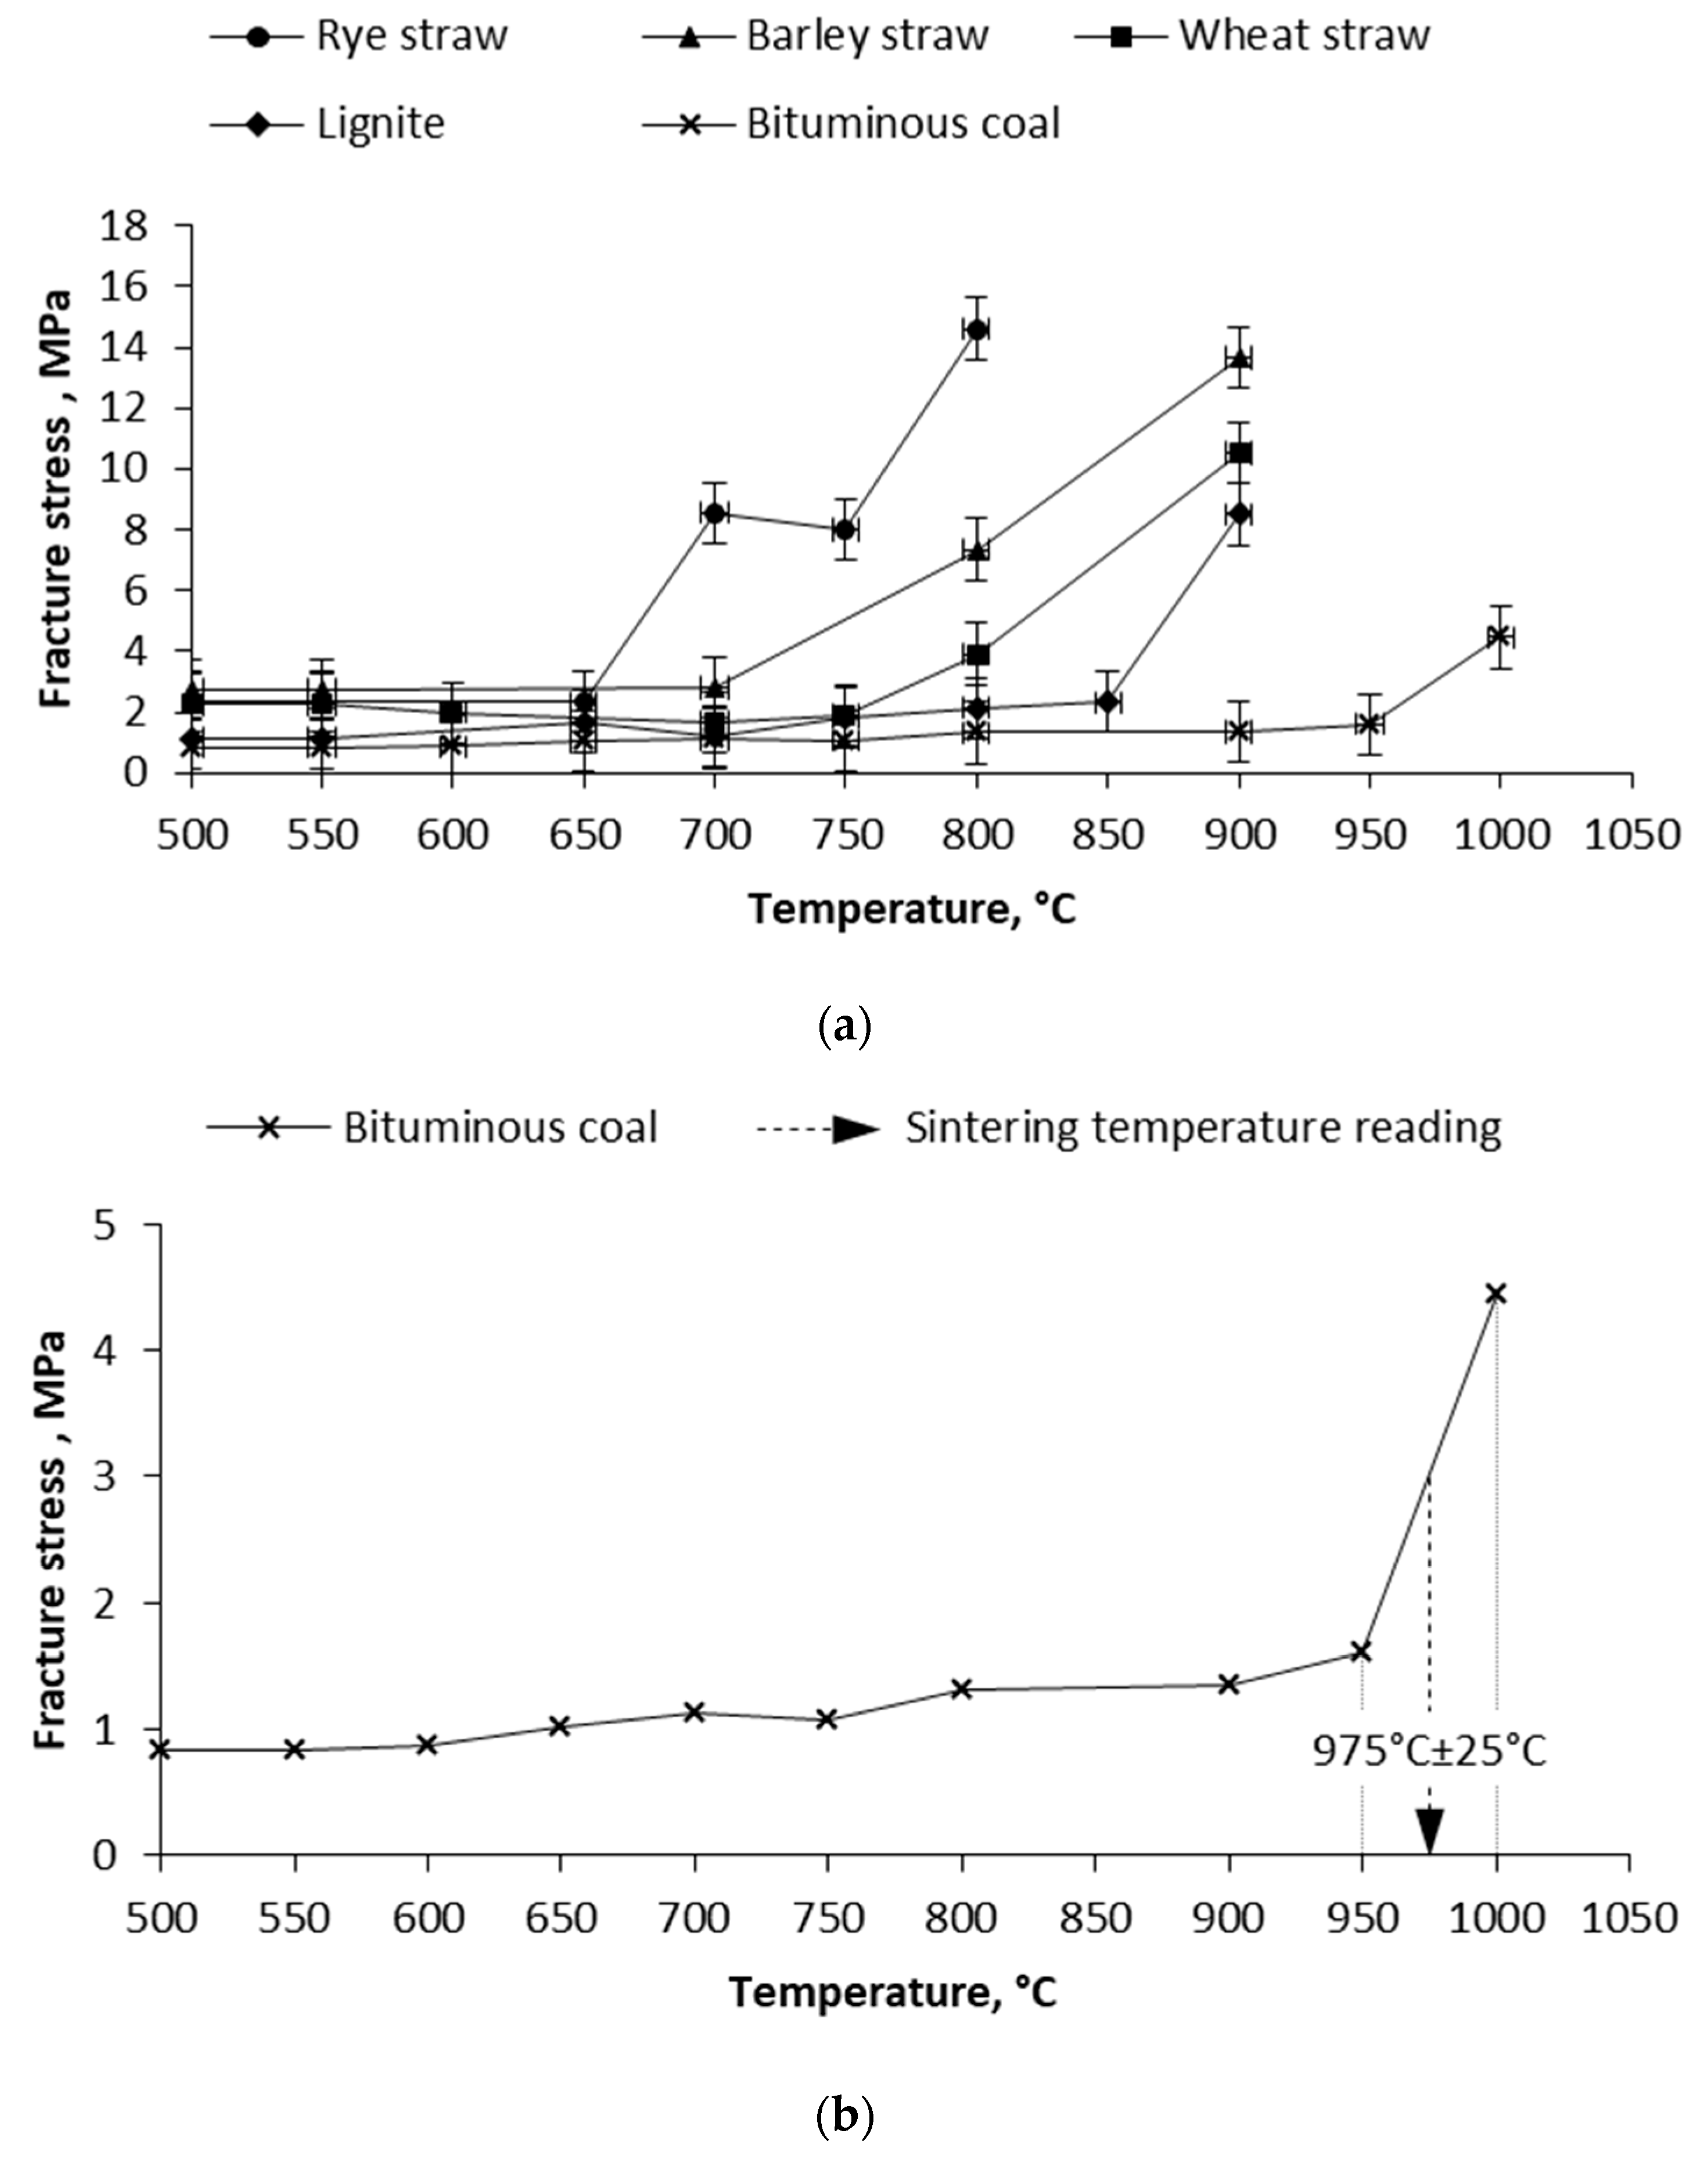
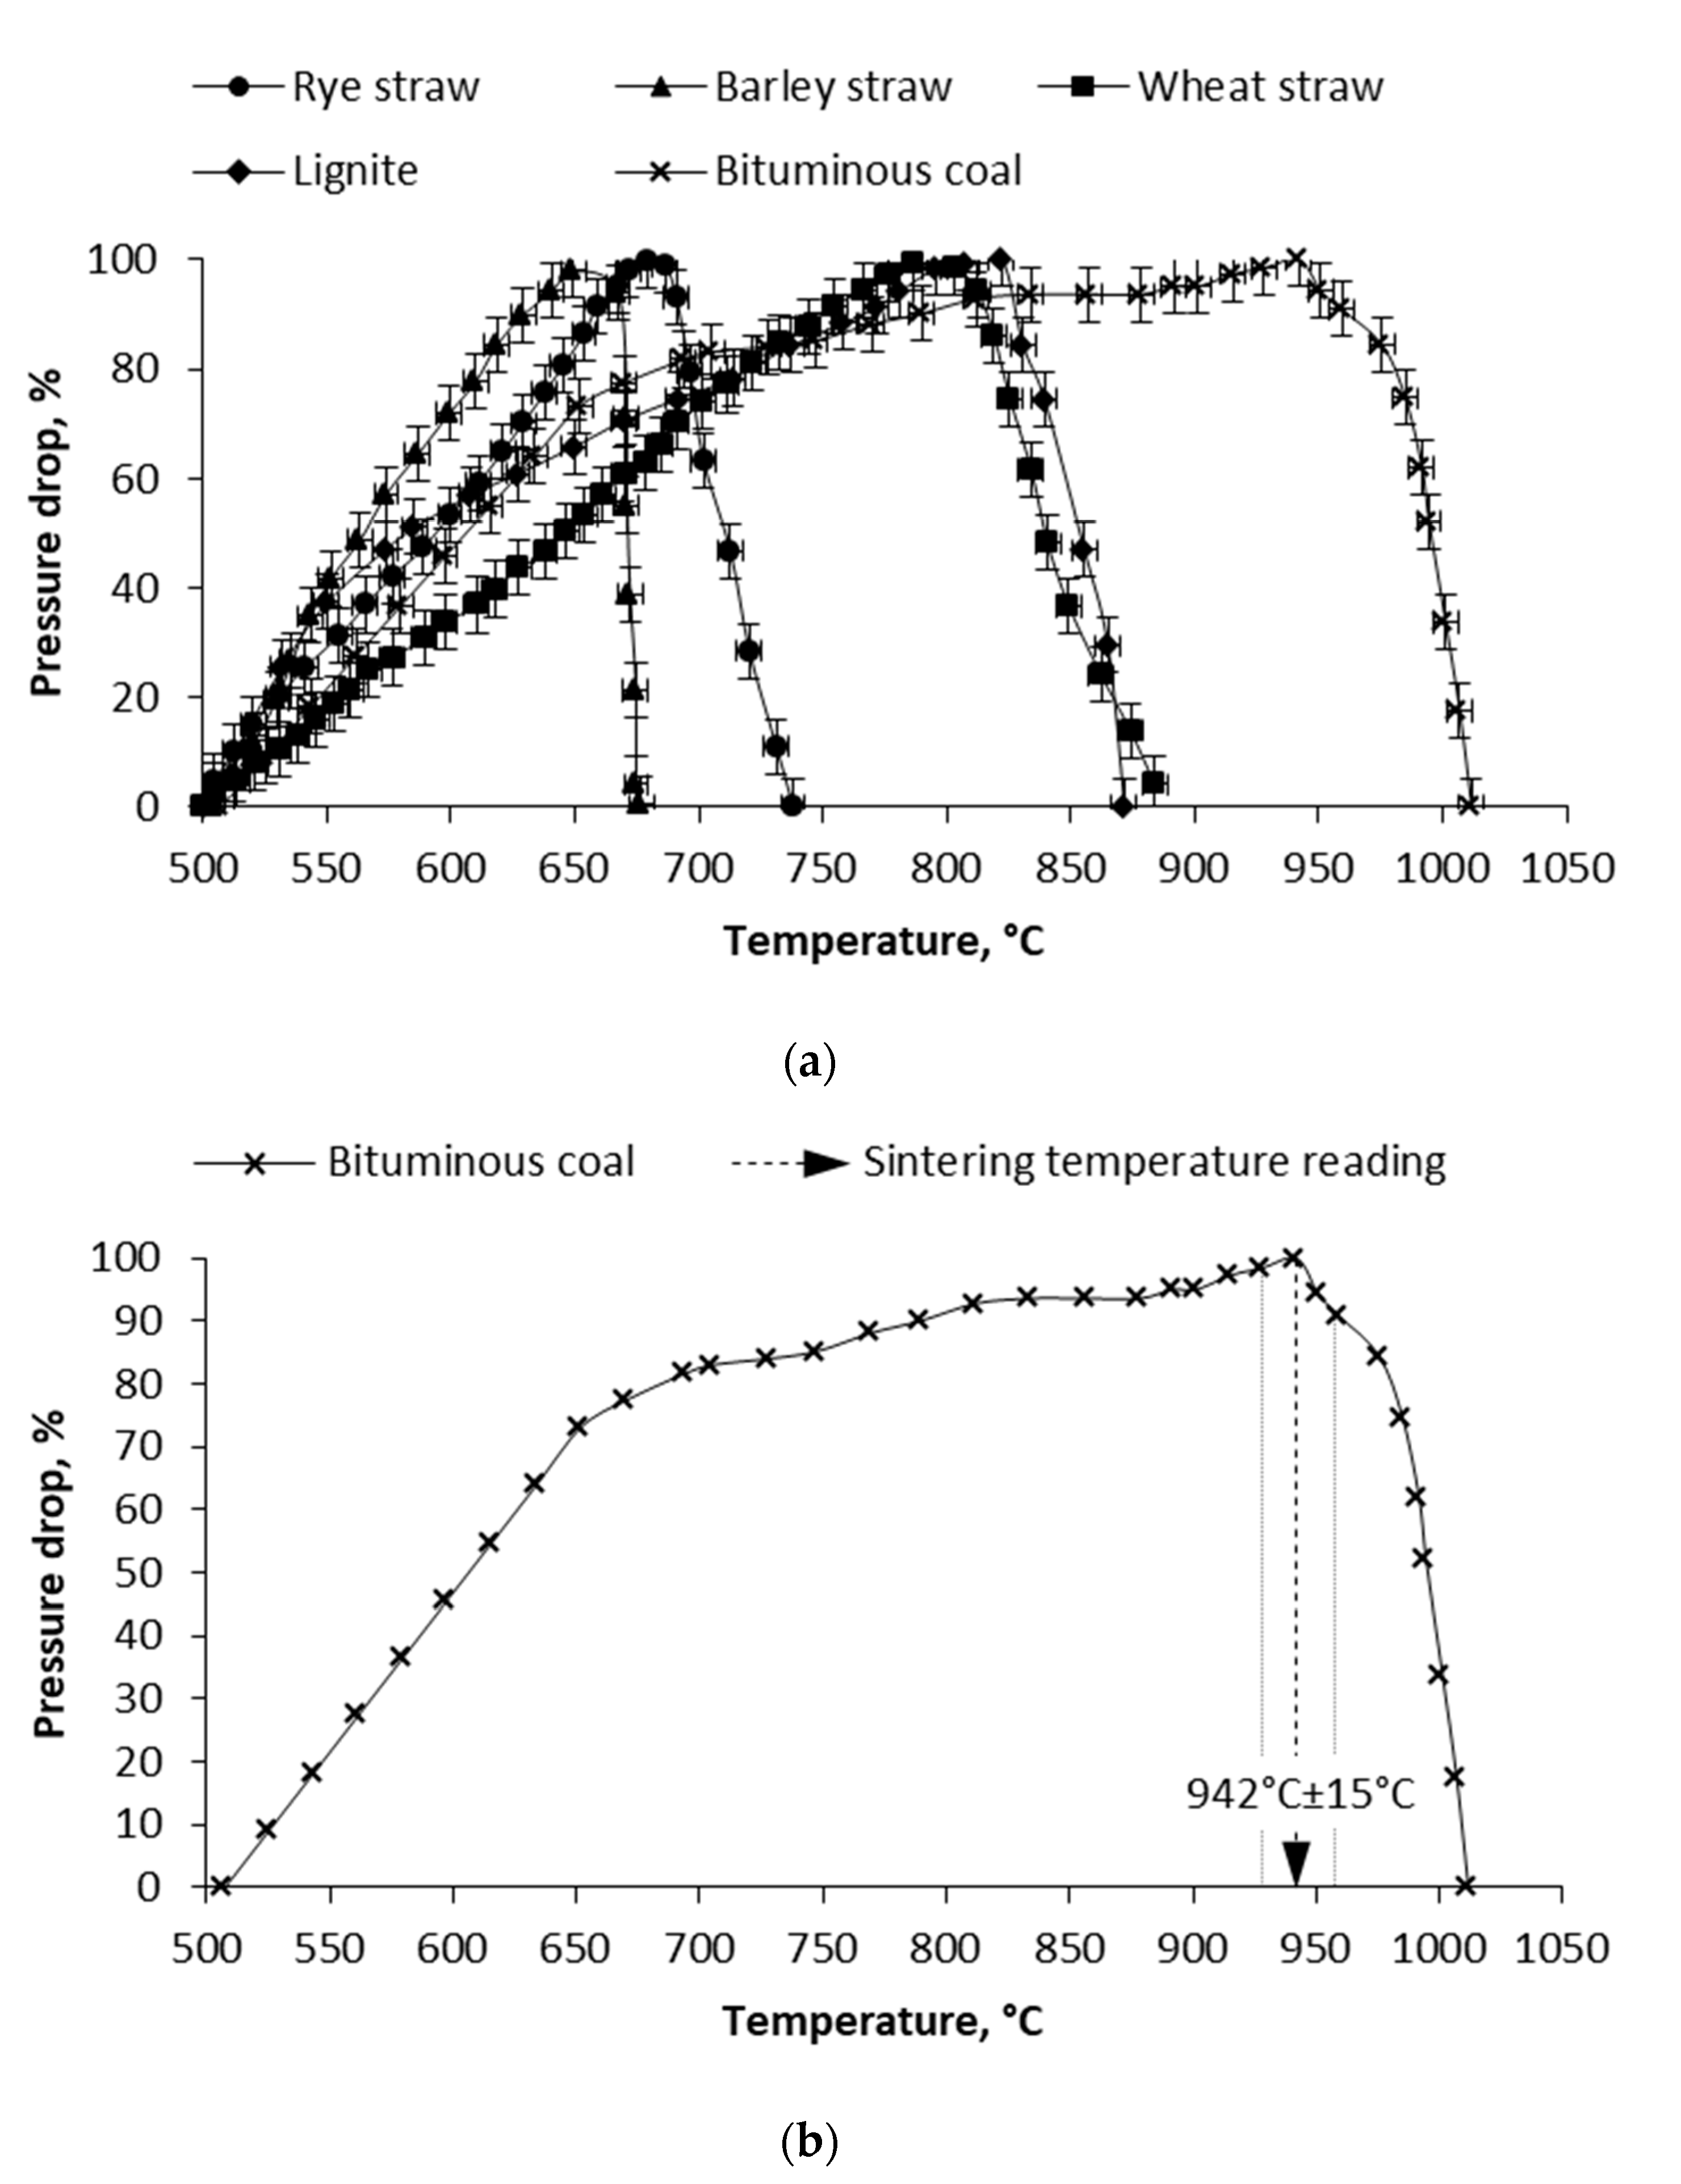
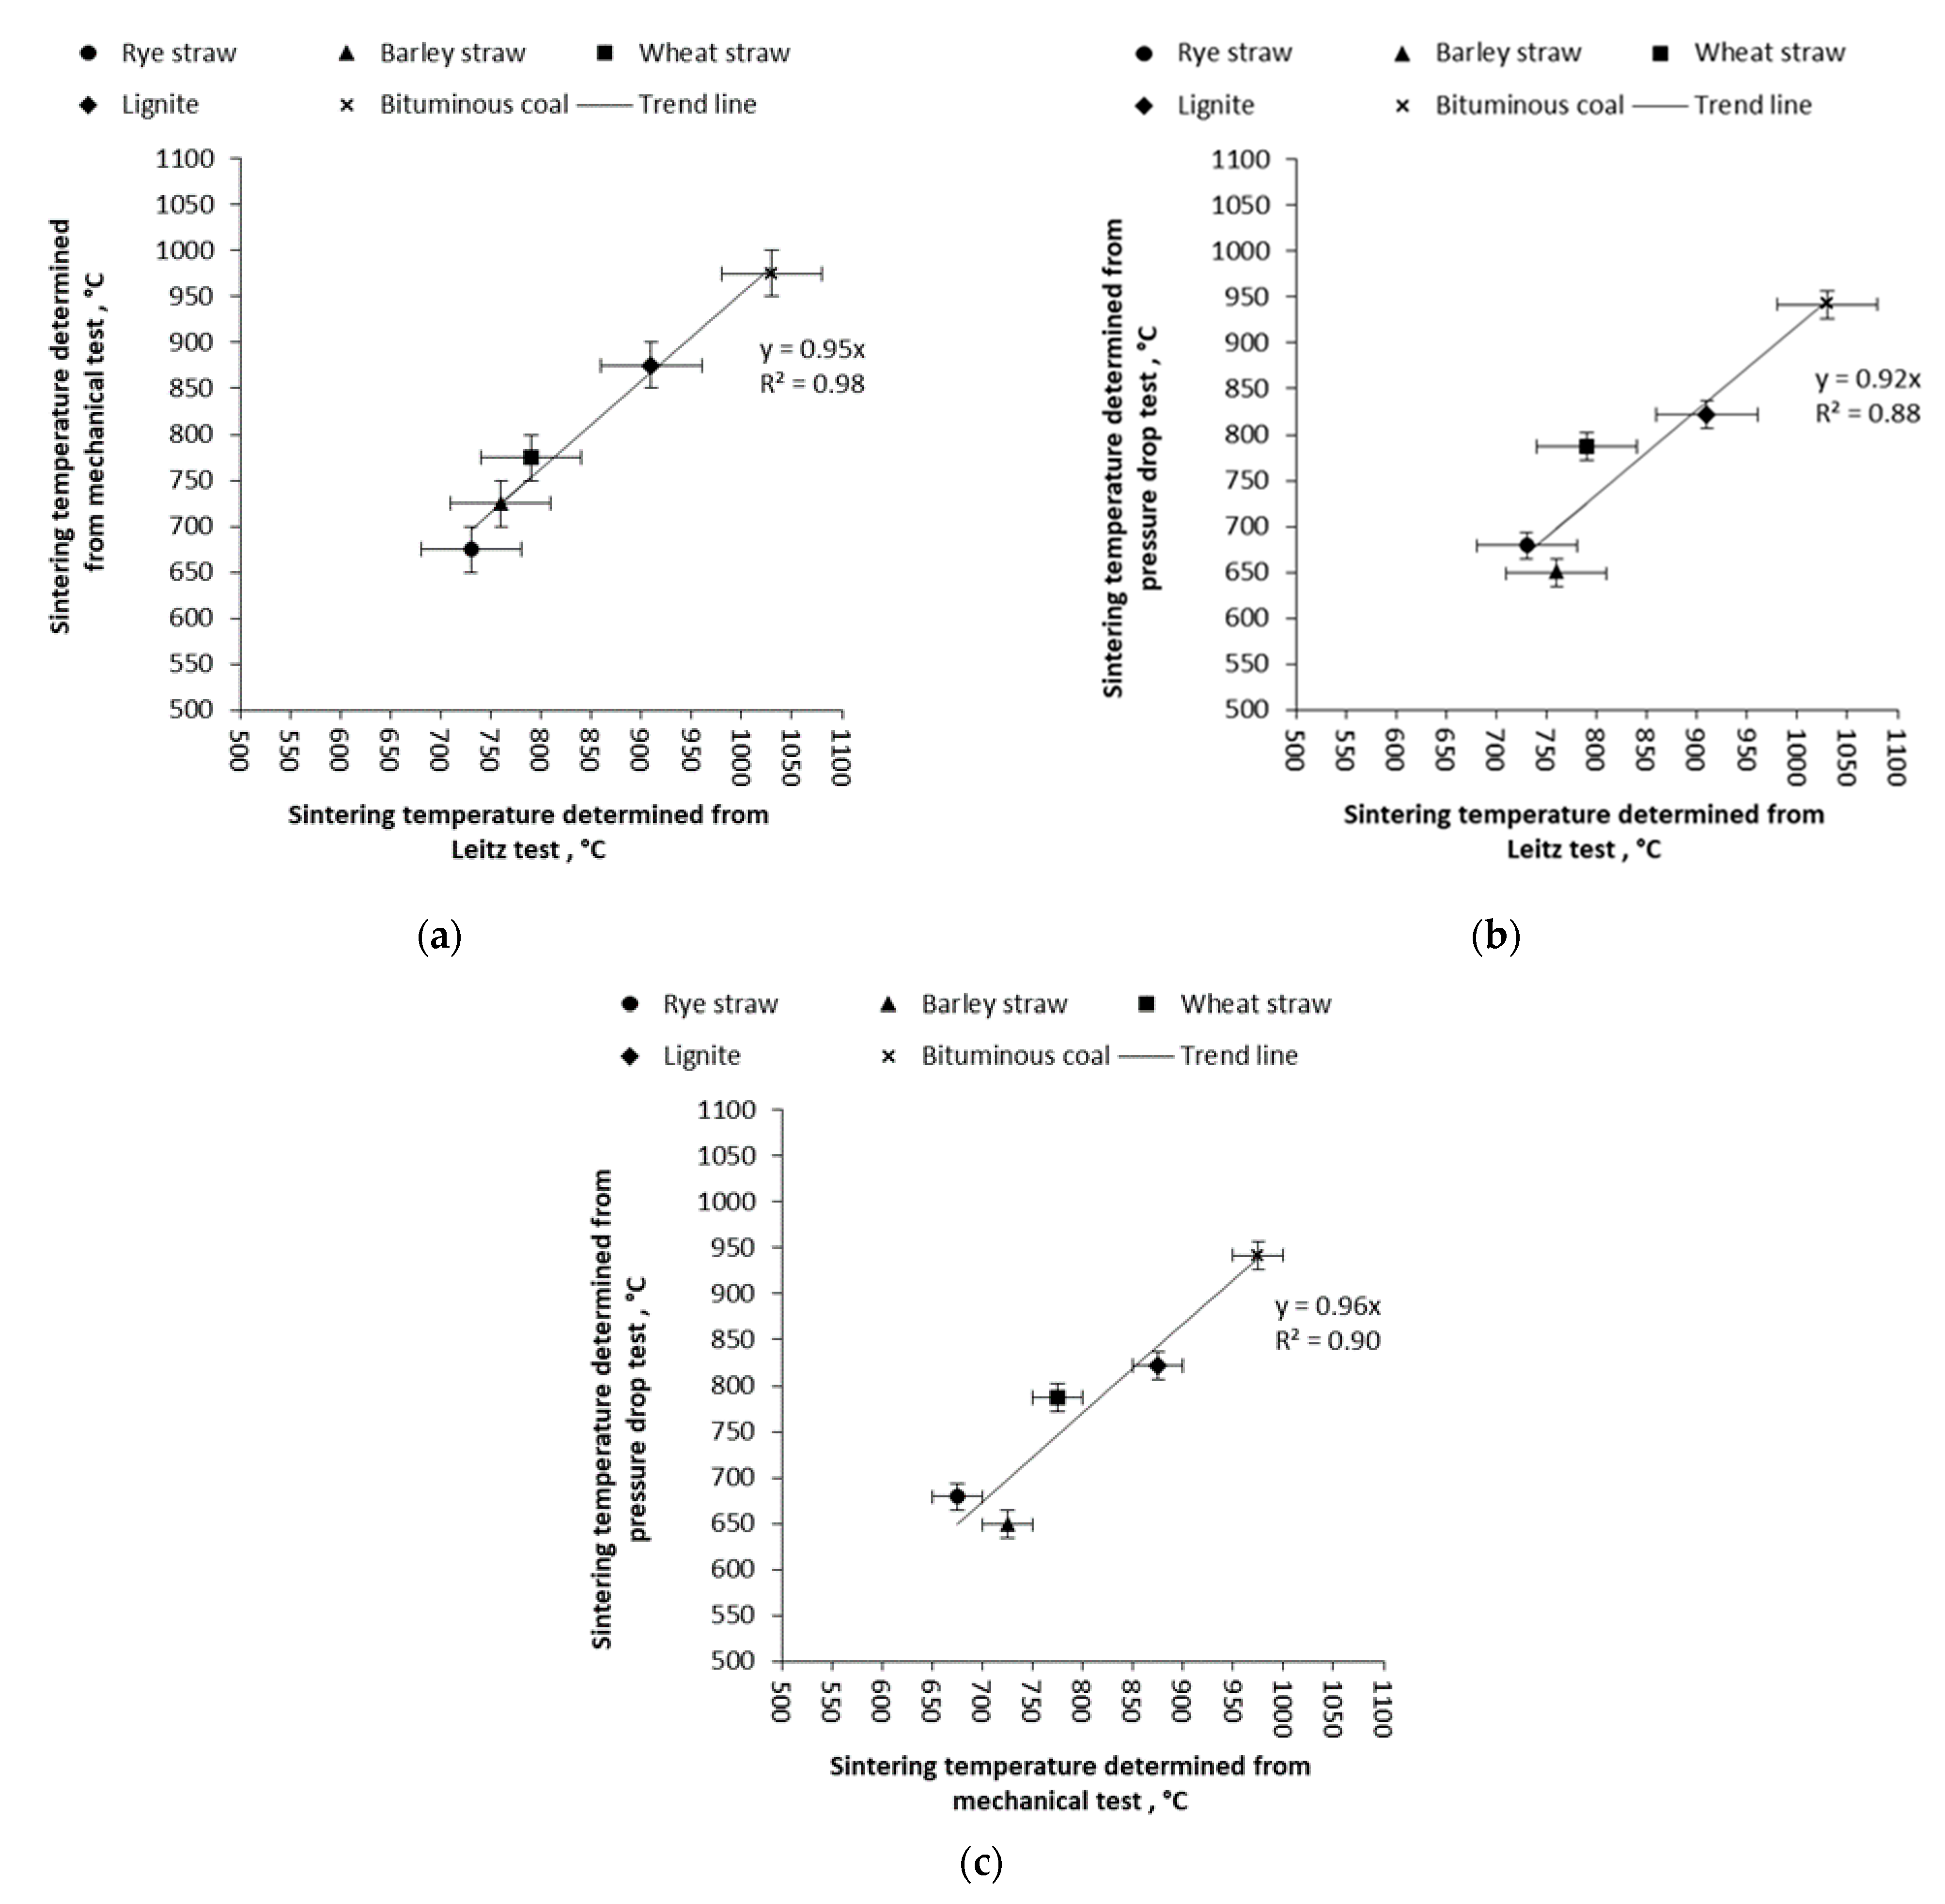
3.2. Mechanical Test and Pressure Drop Test

In the mechanical method, the fracture stress for the ash samples is measured. The correlation between the change of the slop of the fracture stress versus the sintering temperature curve was observed. The results of the series of measurements are shown in Figure 3. The measuring procedure consists of the series of measurements, during which the cylindrical ash sample is isochronally sintered at selected temperatures (500–1000 °C) in an electric furnace, then dropped on the metal plate at room temperature for quenching and then compressed at room temperature up to the fracture stress.
For all tested fuels, a rapid increase in fracture stress depending on the temperature was observed (Figure 3). The value of the temperature for which the change in the slope of the fracture stress versus temperature took place was taken as the sintering temperature. This ash sintering temperature was the lowest for rye straw (675 °C), higher for barley straw (725 °C), wheat straw (775 °C), and brown coal (875 °C), and the highest for hard coal (975 °C). This tendency is in line with the IDT results of the Leitz standard method (Table 4), but the sintering temperature values are slightly lower.
This procedure was repeated for each previously sintered sample. In that way, the dependency between fracture stress and the temperature was obtained. The temperature at which the evident change of the slope of that dependency can be observed was determined as the sintering temperature.
According to the pressure method, the fouling temperature determination is based on measuring the changes in the gradient of the pressure of the gas flowing by the ash sample that was previously positioned in the tube (low coefficient of expansion) with increasing temperature of the furnace.
For all tested fuels, a rapid decrease of pressure drop in relation to the temperature was observed (Figure 4). The value of the temperature at which the maximum of the relation between the pressure drop and temperature took place was taken as the sintering temperature. This ash sintering temperature was the lowest for barley straw (649 °C), higher for rye straw (679 °C), wheat straw (787 °C), and brown coal (822 °C), and the highest for hard coal (942 °C). This tendency is in accordance with the IDT results of the standard Leitz method and the results of mechanical tests (Table 4), except for the results for rye straw (higher than for barley straw).
The nature of the pressure drop dependency on the sample temperature is due to two main processes on a microscopic scale. The first process is the thermal expansion of the ash sample with increasing temperature. This leads to a better contact of the cylindrical sample with the walls of the tube and thus to an increase in pressure upstream in front of the sample—rising part of the curve in Figure 4. The second mechanism is due to the shrinkage of the ash sample as a result of chemical reactions and physical processes on a microscopic scale, such as phase change and minimization of surface tension. Melting the surface of individual ash particles causes the grains to stick to each other. The progressing sintering process causes further melting of the surface of single ash grains and the reduction of the viscosity of the already melted layer. The next step is the minimization of the surface tension of the sticked particles and forming the larger ones. In a macroscopic scale, it results in shrinkage of the ash sample.
The values of sintering temperatures determined by presented methods (mechanical test and pressure drop test) and by the standard Leitz method as reference are presented as linear relations (linear regression) in Figure 5.
The relation of type was obtained as follows:
T s i n t e r i n g ( m e c h a n i c a l ) = 0.95 · T s i n t e r i n g ( L e i t z ) ,
T s i n t e r i n g ( p r e s s u r e ) = 0.92 · T s i n t e r i n g ( L e i t z ) ,
T s i n t e r i n g ( p r e s s u r e ) = 0.96 · T s i n t e r i n g ( m e c h a n i c a l ) ,
It is clear (Equations (7) and (8)) that the sintering temperatures determined by tested nonstandard methods (mechanical test and pressure drop test) are lower than those determined by the standard Leitz method. It is obvious due to the visual character of the Leitz method (the sintering temperature is subjectively determined by the observer observing the change in the shape of the sample). The sintering temperature determined by the pressure drop test is slightly lower than that determined by the mechanical method (Equation (9)). The reason for that is the character of these two methods. A pressure drop test is a test conducted in situ. In this type of test, the measurements (the pressure drop) are continuously recorded during the sample’s heating, when the microstructure of the ash sample is in a non-stable state. In contrast, in the mechanical method, the tested samples are in a stable state (measurement at room temperature after some stage of the sintering process). It means that the results of the pressure drop test are more sensitive to the early stage of the sintering process.
Due to the relatively non-objective method of IDT determination using the standard Leitz method, this measurement is burdened with a fairly large error that can reach a value of up to 100 °C. The presented results of mechanical and pressure drop tests show the great potential of these two methods to assess the slagging/fouling hazards during coal and biomass combustion. These tests seem to be more adequate than the standard method because it directly shows the material shrinkage and increase of fracture stress due to changes in the microstructure of the ash mineral substance (pressure drop test) [27,28].
The observed increase of the fracture stress and decrease of the pressure drop is caused by viscous flow. However, we suggest that the viscous flow mechanism leads to the two macroscopic states of the ash. The processes that lead to these states occur simultaneously and are both controlled by viscous flow and the minimization of the surface tensile strength. One of these processes is the porosity change (decrease of closed pores and increase of open pores) of the coal ash proposed by Al-Ottom et al. [6]. The proposed mechanical test (fracture stress versus temperature) is rather slightly sensitive to other mechanisms of sintering. It is governed by the coalescent process of the individual ash particles (as a result of minimization of the surface tensile strength of the molten surface of ash grains) and the change of the microstructure of the ash sample. This microstructure change influences the increase of fracture stress.
Similar mechanical studies were carried out by Schimpke et al. [39] for lignite and hard coal ash. Slightly lower sintering temperature values obtained from the pressure drop test than from the mechanical test for the tested coal ash samples are consistent with the results presented in the literature [39]. The authors [39] noticed that the sintering initiating mass transport can take place already several Celsius degrees below the sintering temperatures obtained from the mechanical test. However, in the presented study, this effect was not observed for the tested biomass. It is still an open issue due to the very complicated microstructure of coal ash and biomass ash. From a physical point of view, ash is a very difficult material because it is composed of a lot of individual grains. Each of them is different in shape, have different crystallographic structure, different grain interfaces, and different chemical compositions. For this reason, the properties of the ash can be influenced by many different physicochemical processes. For this reason, the behavior of ash during its sintering process is the result of processes such as phase changes (e.g., melting), change of the crystallographic structure, chemical reactions, single grains sticking to each other, the coalescence of individual grains surrounded by molten layer, and the change of ash porosity. The obtained results are very promising, although they need further research.

4. Conclusions

Our paper presents the results of the pressure drop test and mechanical test of hard coal and brown coal, in addition to rye, barley, and wheat straw. The tested fuels differ in the proximate and ultimate analysis and the ash composition. Oxides indices for the tested ash samples were calculated. The conflict of these indices was found. Two nonstandard tests were performed—mechanical test (fracture stress as a function of temperature) and the pressure drop test (pressure drop as a function of temperature). It was observed that the characteristic rapid increase of fracture stress and rapid decrease of pressure drop test are at nearly the same temperature. This temperature was taken as the ash sintering temperature. This temperature was compared with the results of the Leitz IDT temperature. The linear relationship between the sintering temperature determined by mechanical test and Leitz method, by pressure drop test and Leitz method, and by pressure drop test and mechanical test were obtained. These two methods (mechanical test and pressure drop test) have a good potential for usage, especially as an ash diagnostic method because of their sensitivity in the early stage of the sintering process. However, from a physical point of view, ash is a very difficult material (a lot of individual grains, each with different shapes, different crystallographic structures, different boundaries, and different chemical compositions. For this reason, the exact identification of the processes taking place in the sintered ash requires further systematic research.

Author Contributions

Conceptualization, K.K. and D.N.-W.; methodology, K.K. and D.N.-W.; validation, K.K. and D.N.-W.; formal analysis, K.K. and D.N.-W.; investigation, K.K. and D.N.-W.; resources, K.K. and D.N.-W.; data curation, K.K. and D.N.-W.; writing—original draft preparation, K.K. and D.N.-W.; writing—review and editing, K.K. and D.N.-W.; supervision, D.N.-W. All authors have read and agreed to the published version of the manuscript.

Funding

This research received no external funding.

Institutional Review Board Statement

Not applicable.

Informed Consent Statement

Not applicable.

Data Availability Statement

Not applicable.

Conflicts of Interest

The authors declare no conflict of interest.

References

  1. Tchapda, A.H.; Pisupati, S.V. A Review of Thermal Co-Conversion of Coal and Biomass/Waste. Energies 2014, 7, 1098–1148. [Google Scholar] [CrossRef] [Green Version]
  2. Niu, Y.; Tan, H.; Hui, S. Ash-related issues during biomass combustion: Alkali-induced slagging, silicate melt-induced slagging (ash fusion), agglomeration, corrosion, ash utilization, and related countermeasures. Prog. Energy Combust. Sci. 2016, 52, 1–61. [Google Scholar] [CrossRef]
  3. Vassilev, S.V.; Baxter, D.; Vassileva, C.G. An overview of the behavior of biomass during combustion: Part II. Ash fusion and ash formation mechanisms of biomass types. Fuel 2014, 117, 152–183. [Google Scholar] [CrossRef]
  4. Nunes, L.; Matias, J.; Catalão, J. Biomass combustion systems: A review on the physical and chemical properties of the ashes. Renew. Sustain. Energy Rev. 2016, 53, 235–242. [Google Scholar] [CrossRef]
  5. Vassilev, S.V.; Kitano, K.; Takeda, S.; Tsuru, T. Influence of minerał and chemical composition of coal ashes on their fusibility. Fuel Process. Technol. 1995, 45, 27–51. [Google Scholar] [CrossRef]
  6. Al-Otoom, A.Y.; Elliott, L.K.; Wall, T.F.; Moghtaderi, B. Measurement of the Sintering Kinetics of Coal Ash. Energy Fuels 2000, 14, 994–1001. [Google Scholar] [CrossRef]
  7. Wall, T.; Creelman, R.; Gupta, R.; Gupta, S.; Coin, C.; Lowe, A. Coal ash fusion temperatures—New characterization techniques, and implications for slagging and fouling. Prog. Energy Combust. Sci. 1998, 24, 345–353. [Google Scholar] [CrossRef]
  8. Anthony, E.J.; Jia, L. Agglomeration and strength development of deposits in CFBC boilers firing high-sulfur fuels. Fuel 2000, 79, 1933–1942. [Google Scholar] [CrossRef]
  9. Jing, N.; Wang, Q.; Luo, Z.; Cen, K. Effect of different reaction atmospheres on the sintering temperature of Jincheng coal ash under pressurized conditions. Fuel 2011, 90, 2645–2651. [Google Scholar] [CrossRef]
  10. Shi, W.; Bai, J.; Kong, L.; Li, H.; Bai, Z.; Vassilev, S.V.; Li, W. An overview of the coal ash transition process from solid to slag. Fuel 2021, 287, 119537. [Google Scholar] [CrossRef]
  11. Bryers, R.W. Fireside slagging, fouling and high-temperature corrosion of heat-transfer surface due to impurities in stem rising fuels. Prog. Energy Combust. Sci. 1996, 22, 29–120. [Google Scholar] [CrossRef]
  12. Raask, E. Mineral Impurities in Coal Combustion: Behavior, Problems and Remedial Measures; Hemisphere Publishing Corporation: Washington, DC, USA, 1985; Chapter 10; pp. 137–160. [Google Scholar]
  13. Luan, C.; You, C.; Zhang, D. Composition and sintering characteristics of ashes from co–firing of coal and biomass in a la-boratory-scale drop tube furnace. Energy 2014, 69, 562–570. [Google Scholar] [CrossRef]
  14. Polish Standard PN-ISO 540:2001 Solid Fuels—Determination of Ash Fusibility at High Temperature Using the Pipe Method. Available online: https://sklep.pkn.pl/pn-iso-540-2001p.html (accessed on 19 February 2021).
  15. Du, S.; Yang, H.; Qian, K.; Wang, X.; Chen, H. Fusion and transformation properties of the inorganic components in biomass ash. Fuel 2014, 117, 1281–1287. [Google Scholar] [CrossRef]
  16. Li, Q.; Zhang, Y.; Meng, A.; Li, L.; Li, G. Study on ash fusion temperature using original and simulated biomass ashes. Fuel Process. Technol. 2013, 107, 107–112. [Google Scholar] [CrossRef]
  17. Jagodzińska, K.; Gądek, W.; Pronobis, M.; Kalisz, S. Investigation of ash deposition in PF boiler during combustion of torrefied biomass. In Proceedings of the IOP Conference Series: Earth and Environmental Science, Krakow, Poland, 14–17 November 2017; Volume 214, p. 012080. [Google Scholar]
  18. Magdziarz, A.; Wilk, M.; Gajek, M.; Nowak-Woźny, D.; Kopia, A.; Kalemba-Rec, I.; Koziński, J. Properties of ash genarated during sewage sludge combustion: A multifaceded analysis. Energy 2016, 113, 85–94. [Google Scholar] [CrossRef]
  19. Pronobis, M. Evaluation of the influence of biomass co-combustion on boiler furnace slagging by means of fusibility correlations. Biomass. Bioenergy 2005, 28, 375–383. [Google Scholar] [CrossRef]
  20. Pronobis, M. The influence of biomass co-combustion on boiler fouling and efficiency. Fuel 2006, 85, 474–480. [Google Scholar] [CrossRef]
  21. Al-Otoom, A.Y.; Bryant, G.W.; Elliott, L.K.; Skrifvars, B.J.; Hupa, M.; Wall, T.F. Experimental Options for Determining the Temperature for the Onset of Sintering of Coal Ash. Energy Fuels 2000, 14, 227–233. [Google Scholar] [CrossRef]
  22. Jung, B.; Schobert, H.H. Viscous sintering of coal ashes. 1. Relationships of sinter point and sinter strength to particle size and composition. Energy Fuels 1991, 5, 555–561. [Google Scholar] [CrossRef]
  23. Jung, B.; Schobert, H.H. Viscous sintering of coal ashes. 2. Sintering behavior at short residence times in a drop tube furnace. Energy Fuels 1992, 6, 59–68. [Google Scholar] [CrossRef]
  24. Moroń, W.; Rybak, W. Strength method for determining the ash sintering temperature. In Proceedings of the Scientific and Technical Conference: Energy 2002, Wroclaw, Poland, 6–8 November 2002; pp. 503–508. [Google Scholar]
  25. Febrero, L.; Granada, E.; Perez, C.; Patiño, D.; Arce, E.; Arce-Fariña, M.E. Characterisation and comparison of biomass ashes with different thermal histories using TG-DSC. J. Therm. Anal. Calorim. 2014, 118, 669–680. [Google Scholar] [CrossRef]
  26. Qin, Y.-H.; Feng, M.-M.; Zhao, Z.-B.; Vassilev, S.V.; Feng, J.; Vassileva, C.G.; Li, W.-Y. Effect of biomass ash addition on coal ash fusion process under CO2 atmosphere. Fuel 2018, 231, 417–426. [Google Scholar] [CrossRef]
  27. Płaza, P.; Moroń, W.; Król, K.; Ferens, W. Sintering of ashes from coal and biofuels. Syst. J. Transdiscipl. Syst. Sci. 2006, 11, 525–532. [Google Scholar]
  28. Płaza, P.; Hercog, J.; Hrycaj, G.; Król, K.; Rybak, W. Predicting Ash Deposit Formation During Co-Firig of Coal with Biomass, Success and Visions for Bioenergy. In Thermal Processing of Biomass for Bioenergy, Biofuels and Bioproducts; Bridgwater, A.V., Ed.; European Commission: Salzburg, Austria, 2007; p. 10. [Google Scholar]
  29. Vassilev, S.V.; Baxter, D.; Vassileva, C.G. An overview of the behavior of biomass during combustion: Part I. Phase-mineral transformations of organic and inorganic matter. Fuel 2013, 112, 393–449. [Google Scholar] [CrossRef]
  30. Wu, J.; Yu, D.; Liu, F.; Yu, X.; Zeng, X.; Han, J.; Yu, G.; Xu, M. Impact of Oxy-fuel Combustion on Ash Properties and Sintering Strength Development. Energy Fuels 2018, 32, 4315–4322. [Google Scholar] [CrossRef]
  31. ISO. Polish Standard PN-EN ISO 18134-1:2015-11 Solid Biofuels—Determination of Moisture Content—Oven Dry Method—Part 1: Total Moisture—Reference Method (ISO 18134-1:2015); ISO: London, UK, 2015. [Google Scholar]
  32. ISO. Polish Standard PN-EN ISO 18122:2016-01 Solid Biofuels—Determination of Ash Content (ISO 18122:2015); ISO: London, UK, 2015. [Google Scholar]
  33. ISO. Polish Standard PN-ISO 1928:2020-05 Solid Mineral Fuels—Determination of Gross Calorific Value by the Bomb Calorimetric Method and Calculation of Net Calorific Value; ISO: London, UK, 2020. [Google Scholar]
  34. ISO. Polish Standard PN-EN ISO 18123:2016-01 Solid Biofuels—Determination of the Content of Volatile Matter (ISO 18123:2015); ISO: London, UK, 2015. [Google Scholar]
  35. ISO. Polish Standard PN-G-04502:2014-11 Hard and Brown Coals—Sampling and Preparation of Samples for the Laboratory Tests—Primary Methods; ISO: London, UK, 2014. [Google Scholar]
  36. Abuelnuor, A.A.A.; Wahid, M.A.; Hosseini, S.E.; Saat, A.; Saqr, K.M.; Sait, H.H.; Osman, M. Characteristics of biomass in flameless combustion: A review. Renew. Sustain. Energy Rev. 2014, 33, 363–370. [Google Scholar] [CrossRef]
  37. Król, K.; Iskra, K.; Ferens, W.; Miodoński, J.M. Testing properties of sewage sludge for energy use. Environ. Prot. Eng. 2019, 45, 61–73. [Google Scholar] [CrossRef]
  38. Garcia-Maraver, A.; Mata-Sanchez, J.; Carpio, M.; Perez-Jimenez, J.A. Critical review of predictive coefficients for biomass ash deposition tendency. J. Energy Inst. 2017, 90, 214–228. [Google Scholar] [CrossRef]
  39. Schimpke, R.; Klinger, M.; Krzack, S.; Meyer, B. Determination of the initial ash sintering temperature by cold compression strength tests with regard to mineral transitions. Fuel 2017, 194, 157–165. [Google Scholar] [CrossRef]
Figure 1. Schematic diagram of the experimental system for the mechanical test (1—sample, 2—hydraulic press with strain gauge, 3—compression force measuring system, 4—data processing system).
Energies 14 01126 g001
Figure 2. Schematic diagram of the experimental setup for the pressure drop test.
Energies 14 01126 g002
Figure 3. (a) Fracture stress versus annealing temperature curves for tested ashes and (b) method for determining the sintering temperature.
Energies 14 01126 g003
Figure 4. (a) Pressure drop versus annealing temperature for tested ash samples and (b) method for determining the sintering temperature.
Energies 14 01126 g004
Figure 5. Relationships between sintering temperatures determined by the mechanical test/Leitz test (a), pressure drop test/Leitz test (b), and pressure drop test/mechanical test (c).
Energies 14 01126 g005
Table 1. Basic properties of the biomass and coal samples (on air dried basis).
SamplesProximate AnalysisUltimate AnalysisHeating Values
MAVMFCFRCHNSOClHHV
wt.%wt.%wt.%wt.%wt.%wt.%wt.%wt.%wt.%wt.%MJ/kg
Wheat straw5.73.769.321.30.3145.45.90.60.0838.40.2117.3
Barley straw8.58.262.720.60.3347.85.70.40.0928.90.4516.1
Rye straw6.33.668.721.40.3146.56.10.60.0836.40.4216.8
Bituminous coal2.017.326.953.82.0065.43.71.31.28.60.5127.8
Lignite coal10.719.541.628.20.6843.54.90.72.617.20.8816.6
Table 2. Chemical composition of biomass and coal ash.
SamplesWheat StrawBarley StrawRye StrawBituminous CoalLignite Coal
Oxideswt.%wt.%wt.%wt.%wt.%
SiO265.867.530.751.429.1
Al2O30.90.20.325.517.6
Fe2O30.50.20.36.611.3
CaO8.04.912.84.63.0
MgO2.01.55.63.32.9
Na2O0.40.40.11.04.5
K2O18.621.038.32.61.5
P2O52.52.76.40.50.1
TiO21.12.1
SO31.21.55.63.227.8
Mn3O40.10.1
BaO0.2
SrO0.1
Table 3. Predictive ash deposition indices with their ranges [17,38] and results of ash deposition indices of fuels under analysis.
Parameter/SymbolValueFuelUnit
LowMediumHighExtremely HighWheat StrawBarley StrawRye StrawBituminous CoalLignite Coal
Silica content in ashSiO2<2020–25>25 65.8267.4630.7351.3529.12wt.%
Chlorine content in fuelCld<0.20.2–0.30.3–0.5>0.50.220.490.450.520.99wt.%
Basic to acidic compounds ratioB/A<0.50.5–1.01.0–1.75 0.480.452.050.240.48
Bed agglomeration indexBAI <0.15 0.030.010.011.831.89
Babcock indexRs<0.60.6–2.02–2.6>2.60.040.040.170.291.39
Fouling indexFu0.6–2.0 2.0–40>409.159.7578.630.862.86
Fouling factorRf<0.20.2–0.50.5–1.0>1.06.106.4951.910.642.61
Slag viscosity indexSr>7265–72<65 86.1991.0462.2077.9662.86
Initial deformation temperatureIDT>1100900–1100<900 7907607301030910°C
d in dry state.
Table 4. The sintering temperatures as determined by Leitz, mechanical, and pressure drop methods.
SampleSintering Temperature Determined According to the Method:
Leitz, DTMechanical testPressure drop test
Wheat straw790 °C ± 50 °C775 °C ± 25 °C787 °C ± 15 °C
Barley straw760 °C ± 50 °C725 °C ± 25 °C649 °C ± 15 °C
Rye straw730 °C ± 50 °C675 °C ± 25 °C679 °C ± 15 °C
Bituminous coal1030 °C ± 50 °C975 °C ± 25 °C942 °C ± 15 °C
Lignite coal910 °C ± 50 °C875 °C ± 25 °C822 °C ± 15 °C
Publisher’s Note: MDPI stays neutral with regard to jurisdictional claims in published maps and institutional affiliations.

