
A New Tool to Assess Maximum Permissible Solar PV Penetration in a Power System


Abstract
:1. Introduction
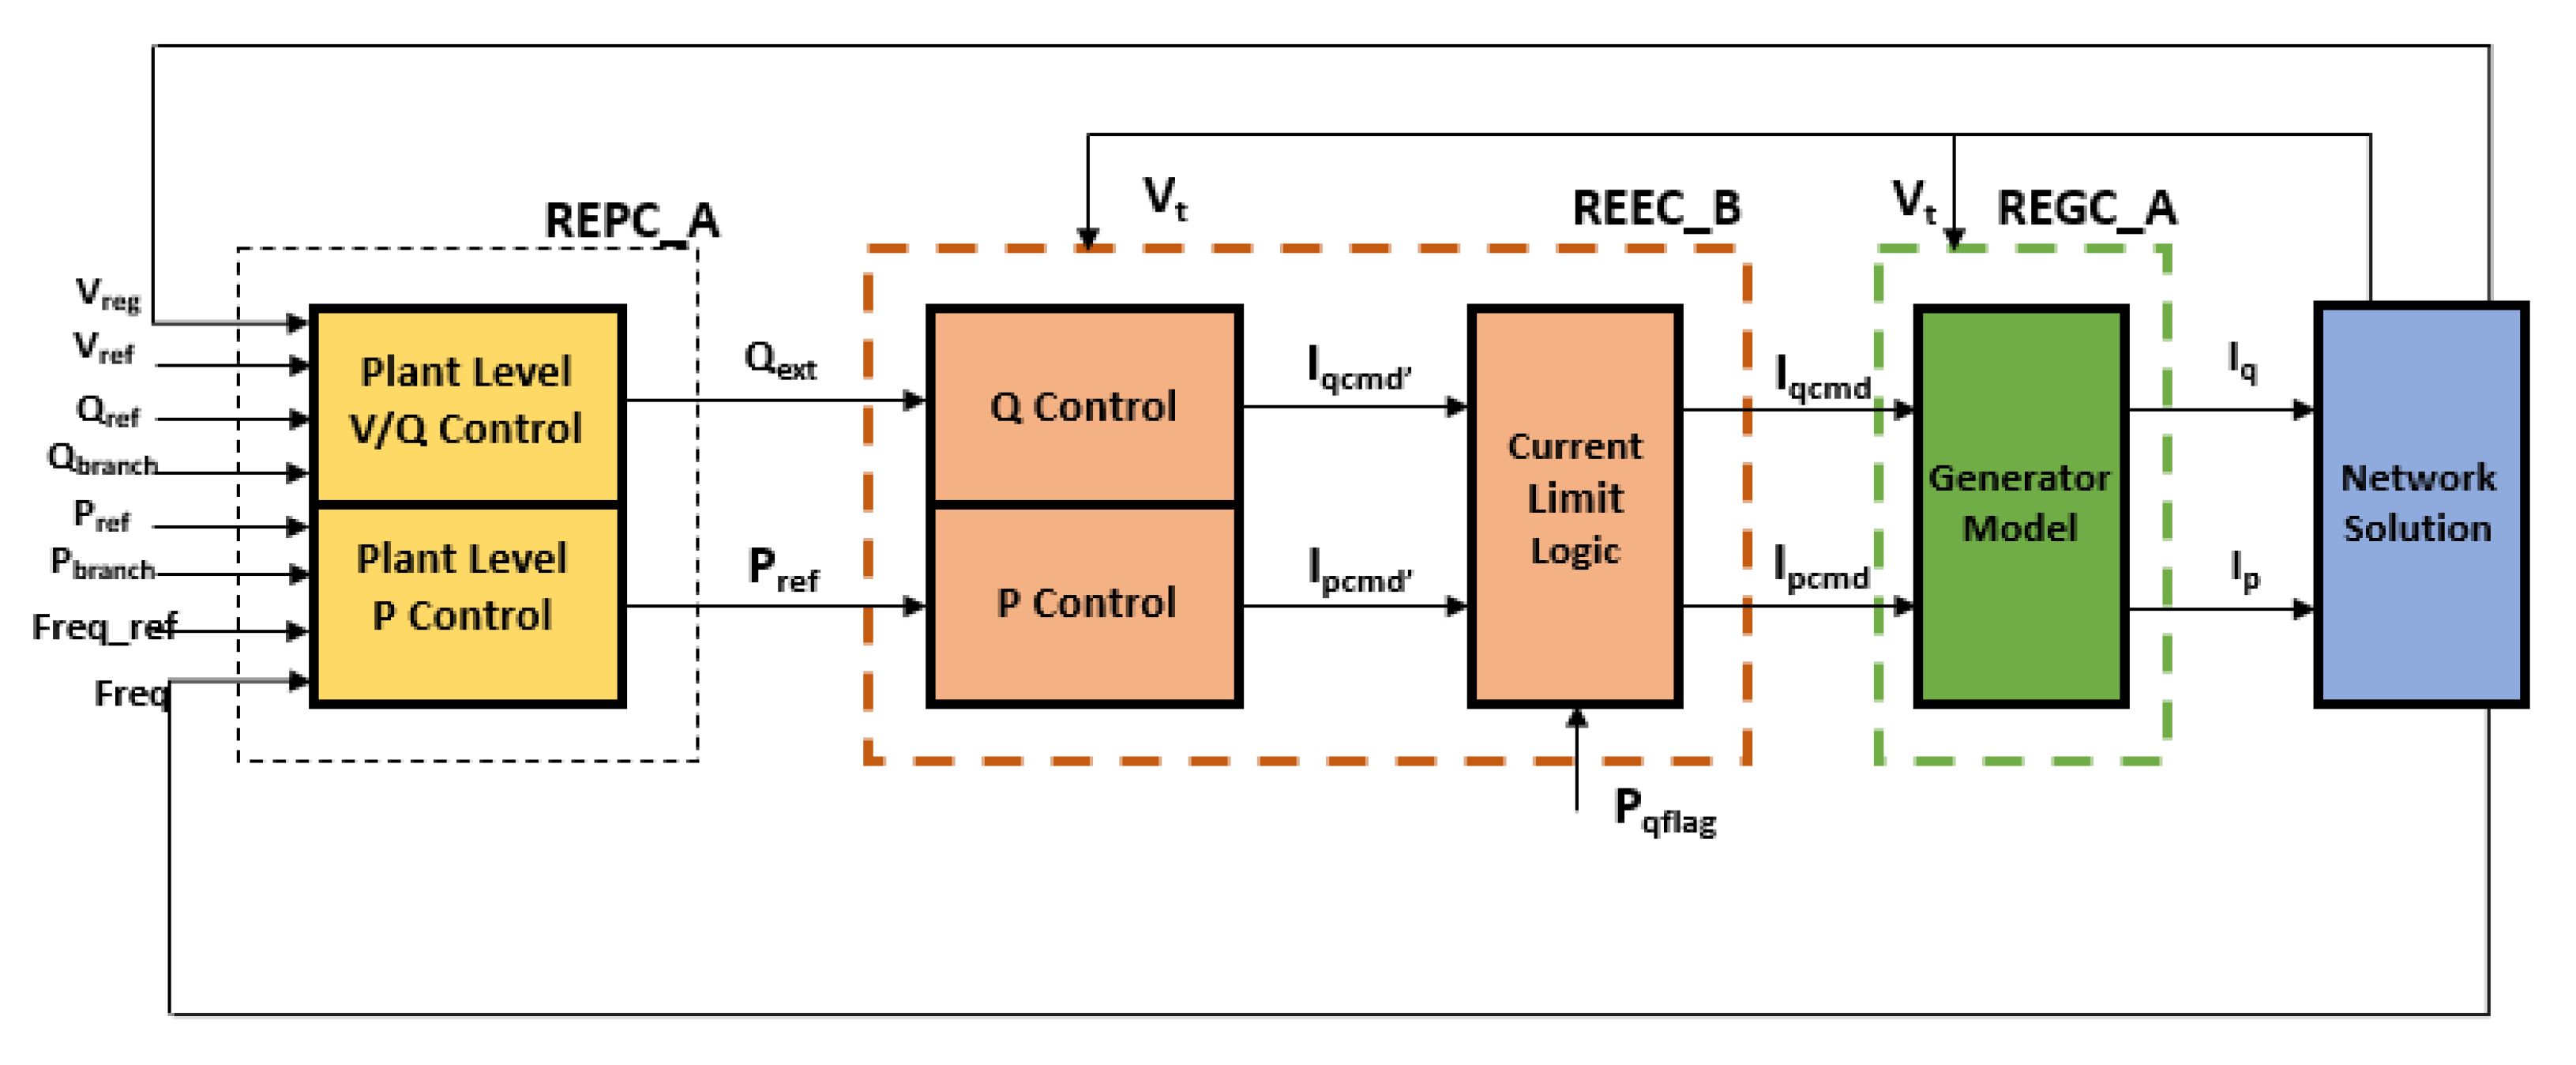
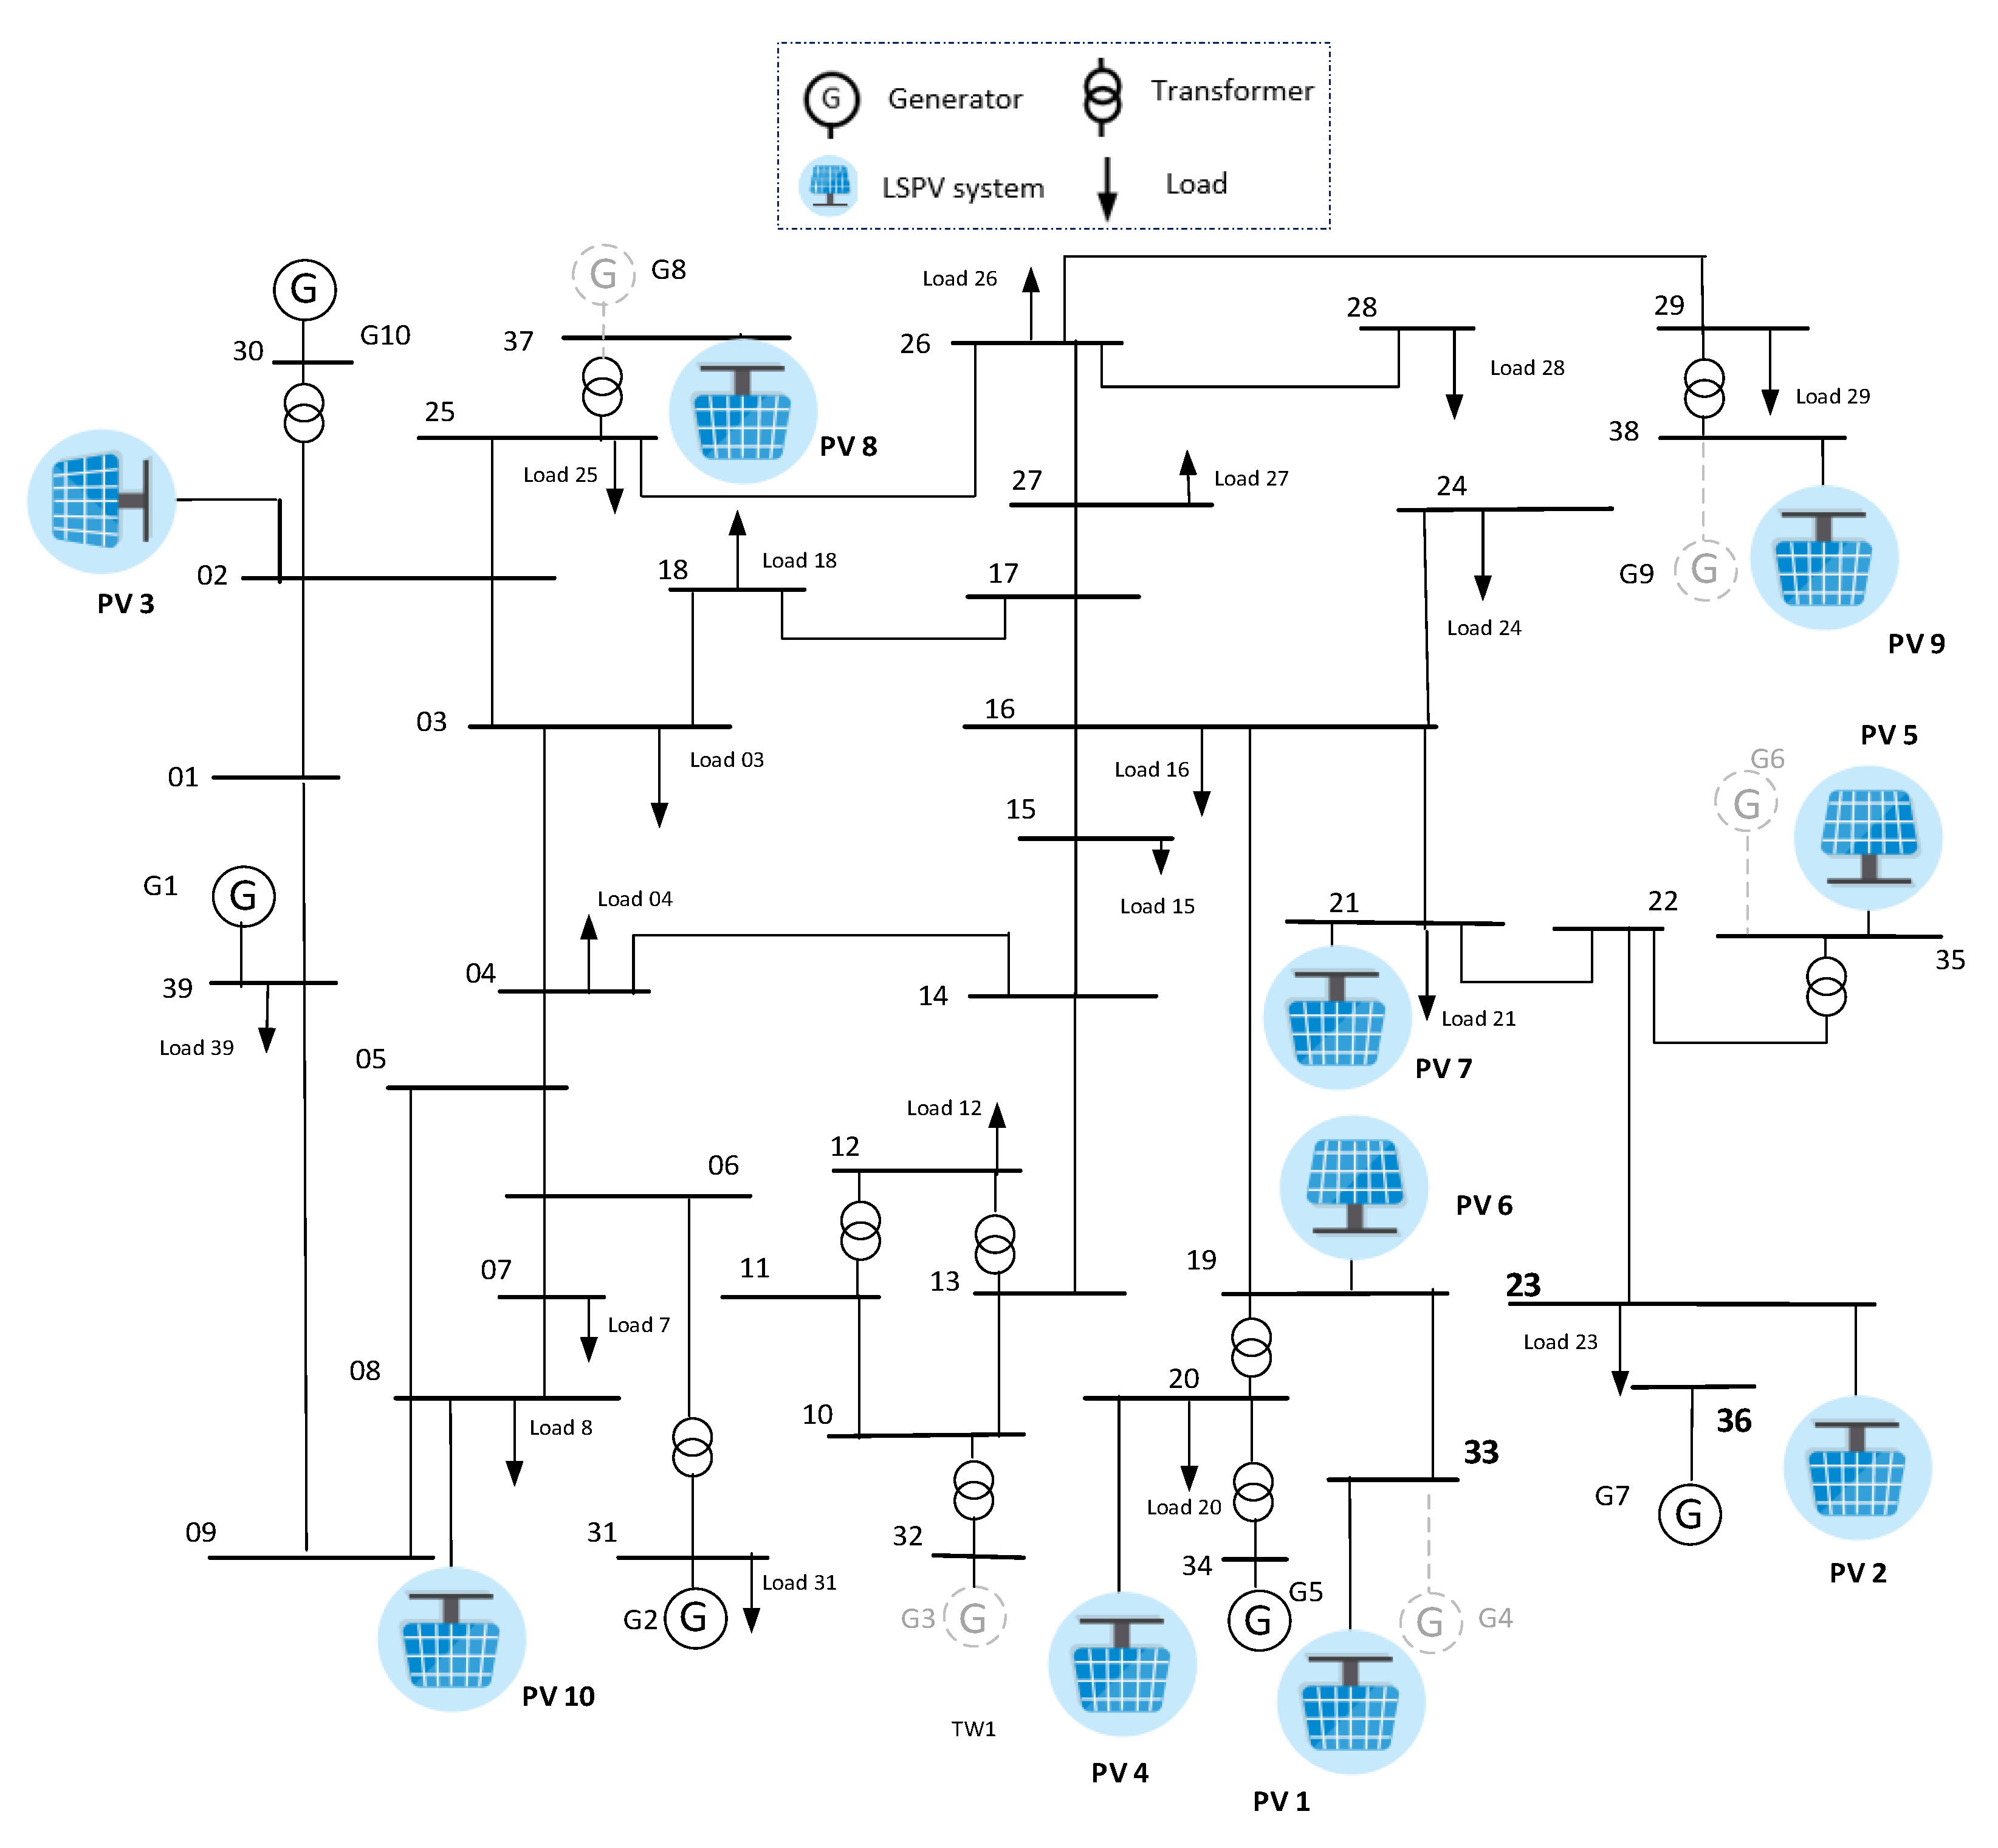
2. System Modeling
3. Methodology and Stability Analysis
- (a)
- Transient rotor angle stability;
- (b)
- Dynamic voltage security/severity;
- (c)
- Frequency stability.
- i.
- Define different operating conditions of test system by varying the generation mix of solar PV (0–60%) and CPP (40–100%).
- ii.
- Under each operating condition, apply 3-phase short circuit fault according to conditions mentioned in Table 1.
- iii.
- Calculate various stability/security indices as explained in Section 3.1–3.3. Based on the thresholds defined for these indices, classify the operating conditions as secure or insecure case.
- iv.
- Calculate percentage of secure/stable cases for each operating condition using Equation (1)
3.1. Transient Rotor Angle Stability
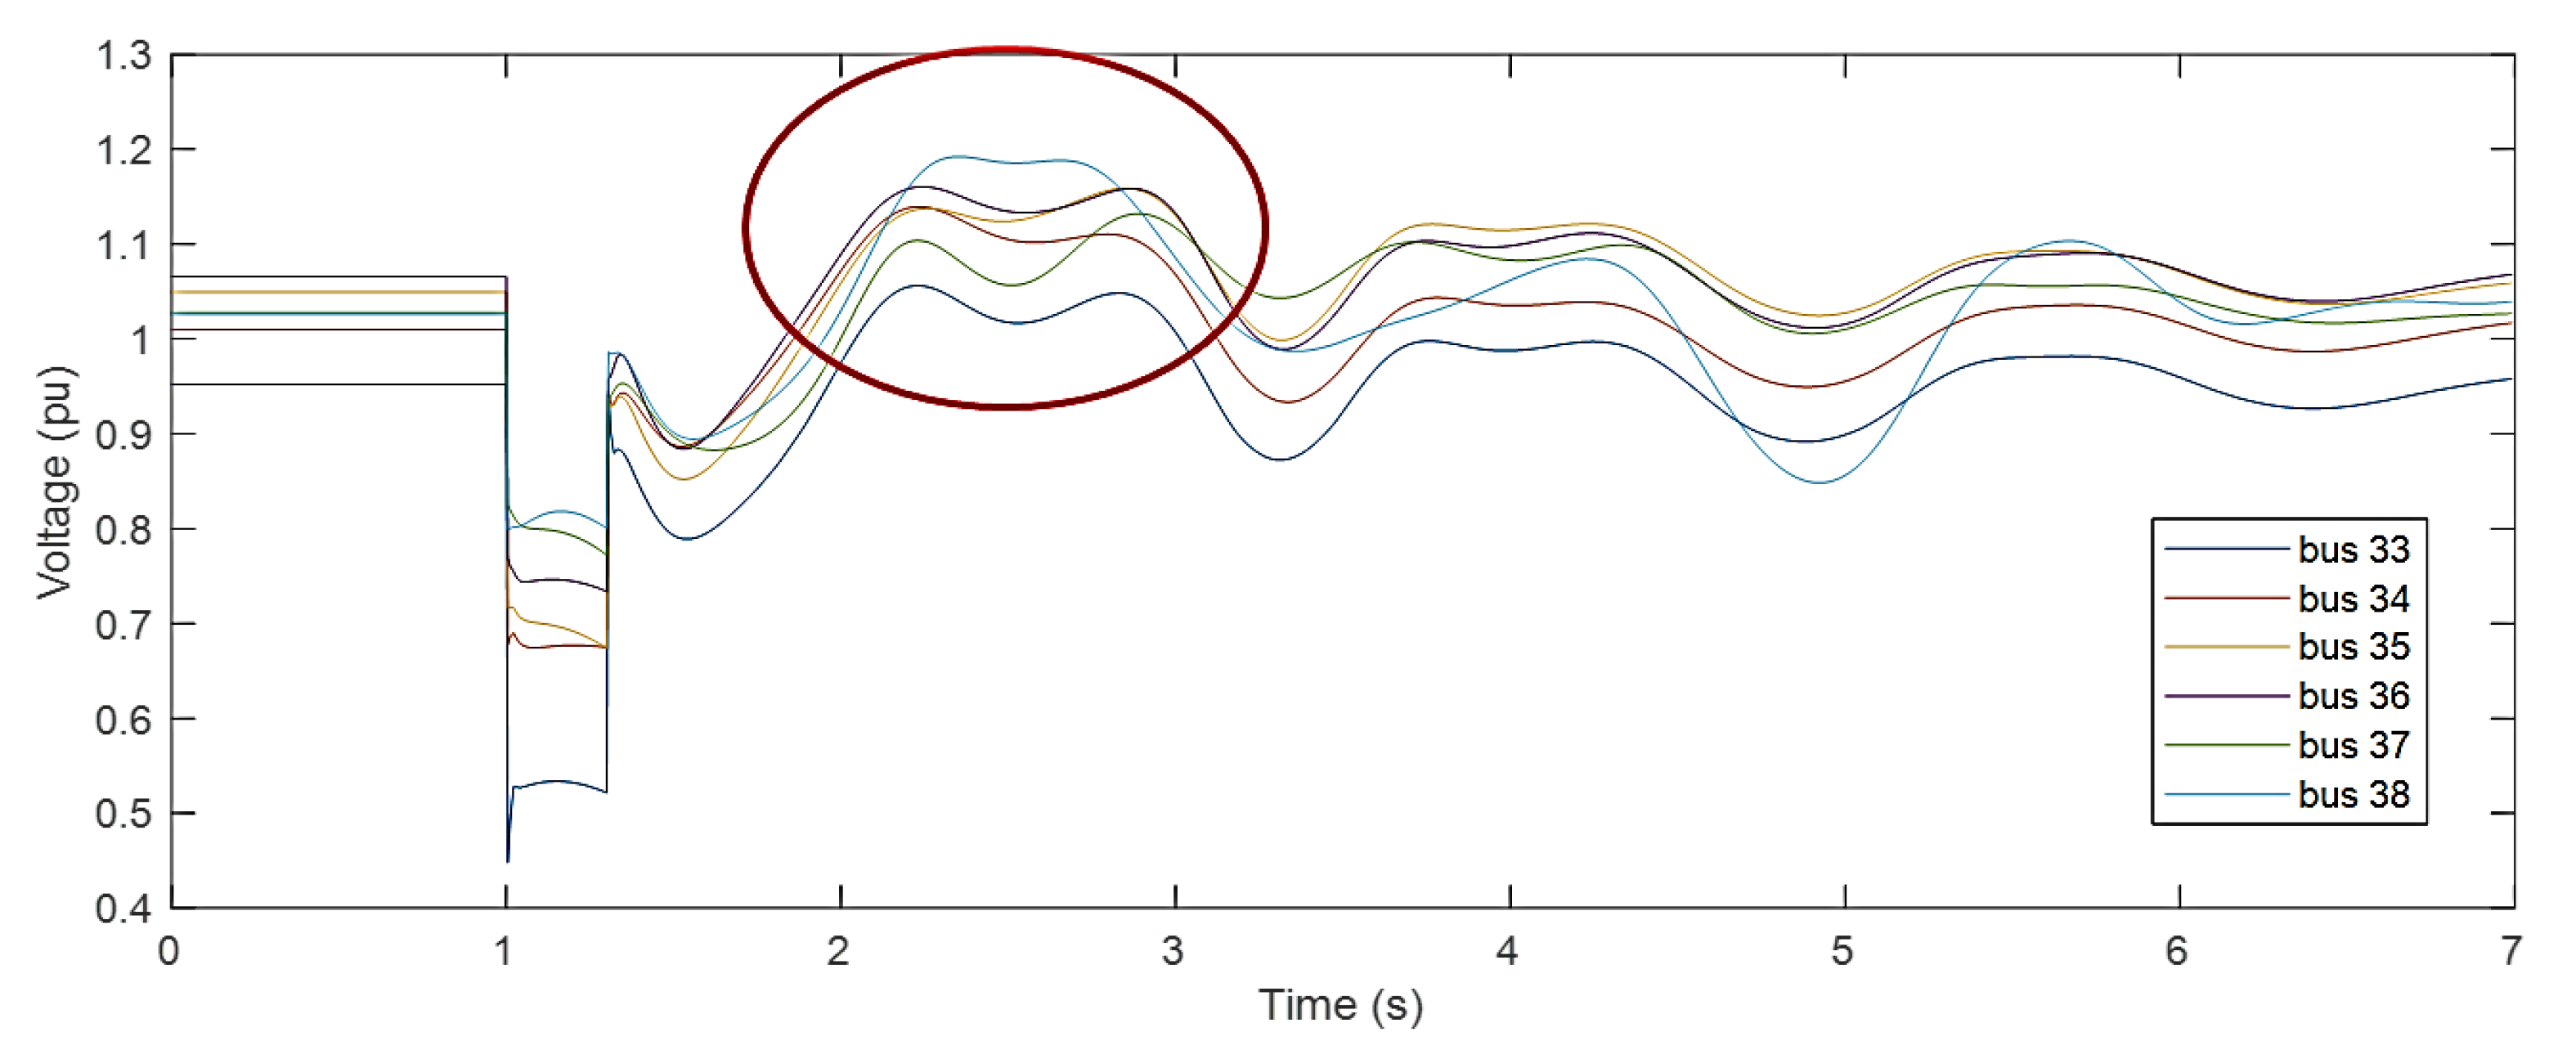
3.2. Dynamic Voltage Severity/Security
3.3. Frequency Stability
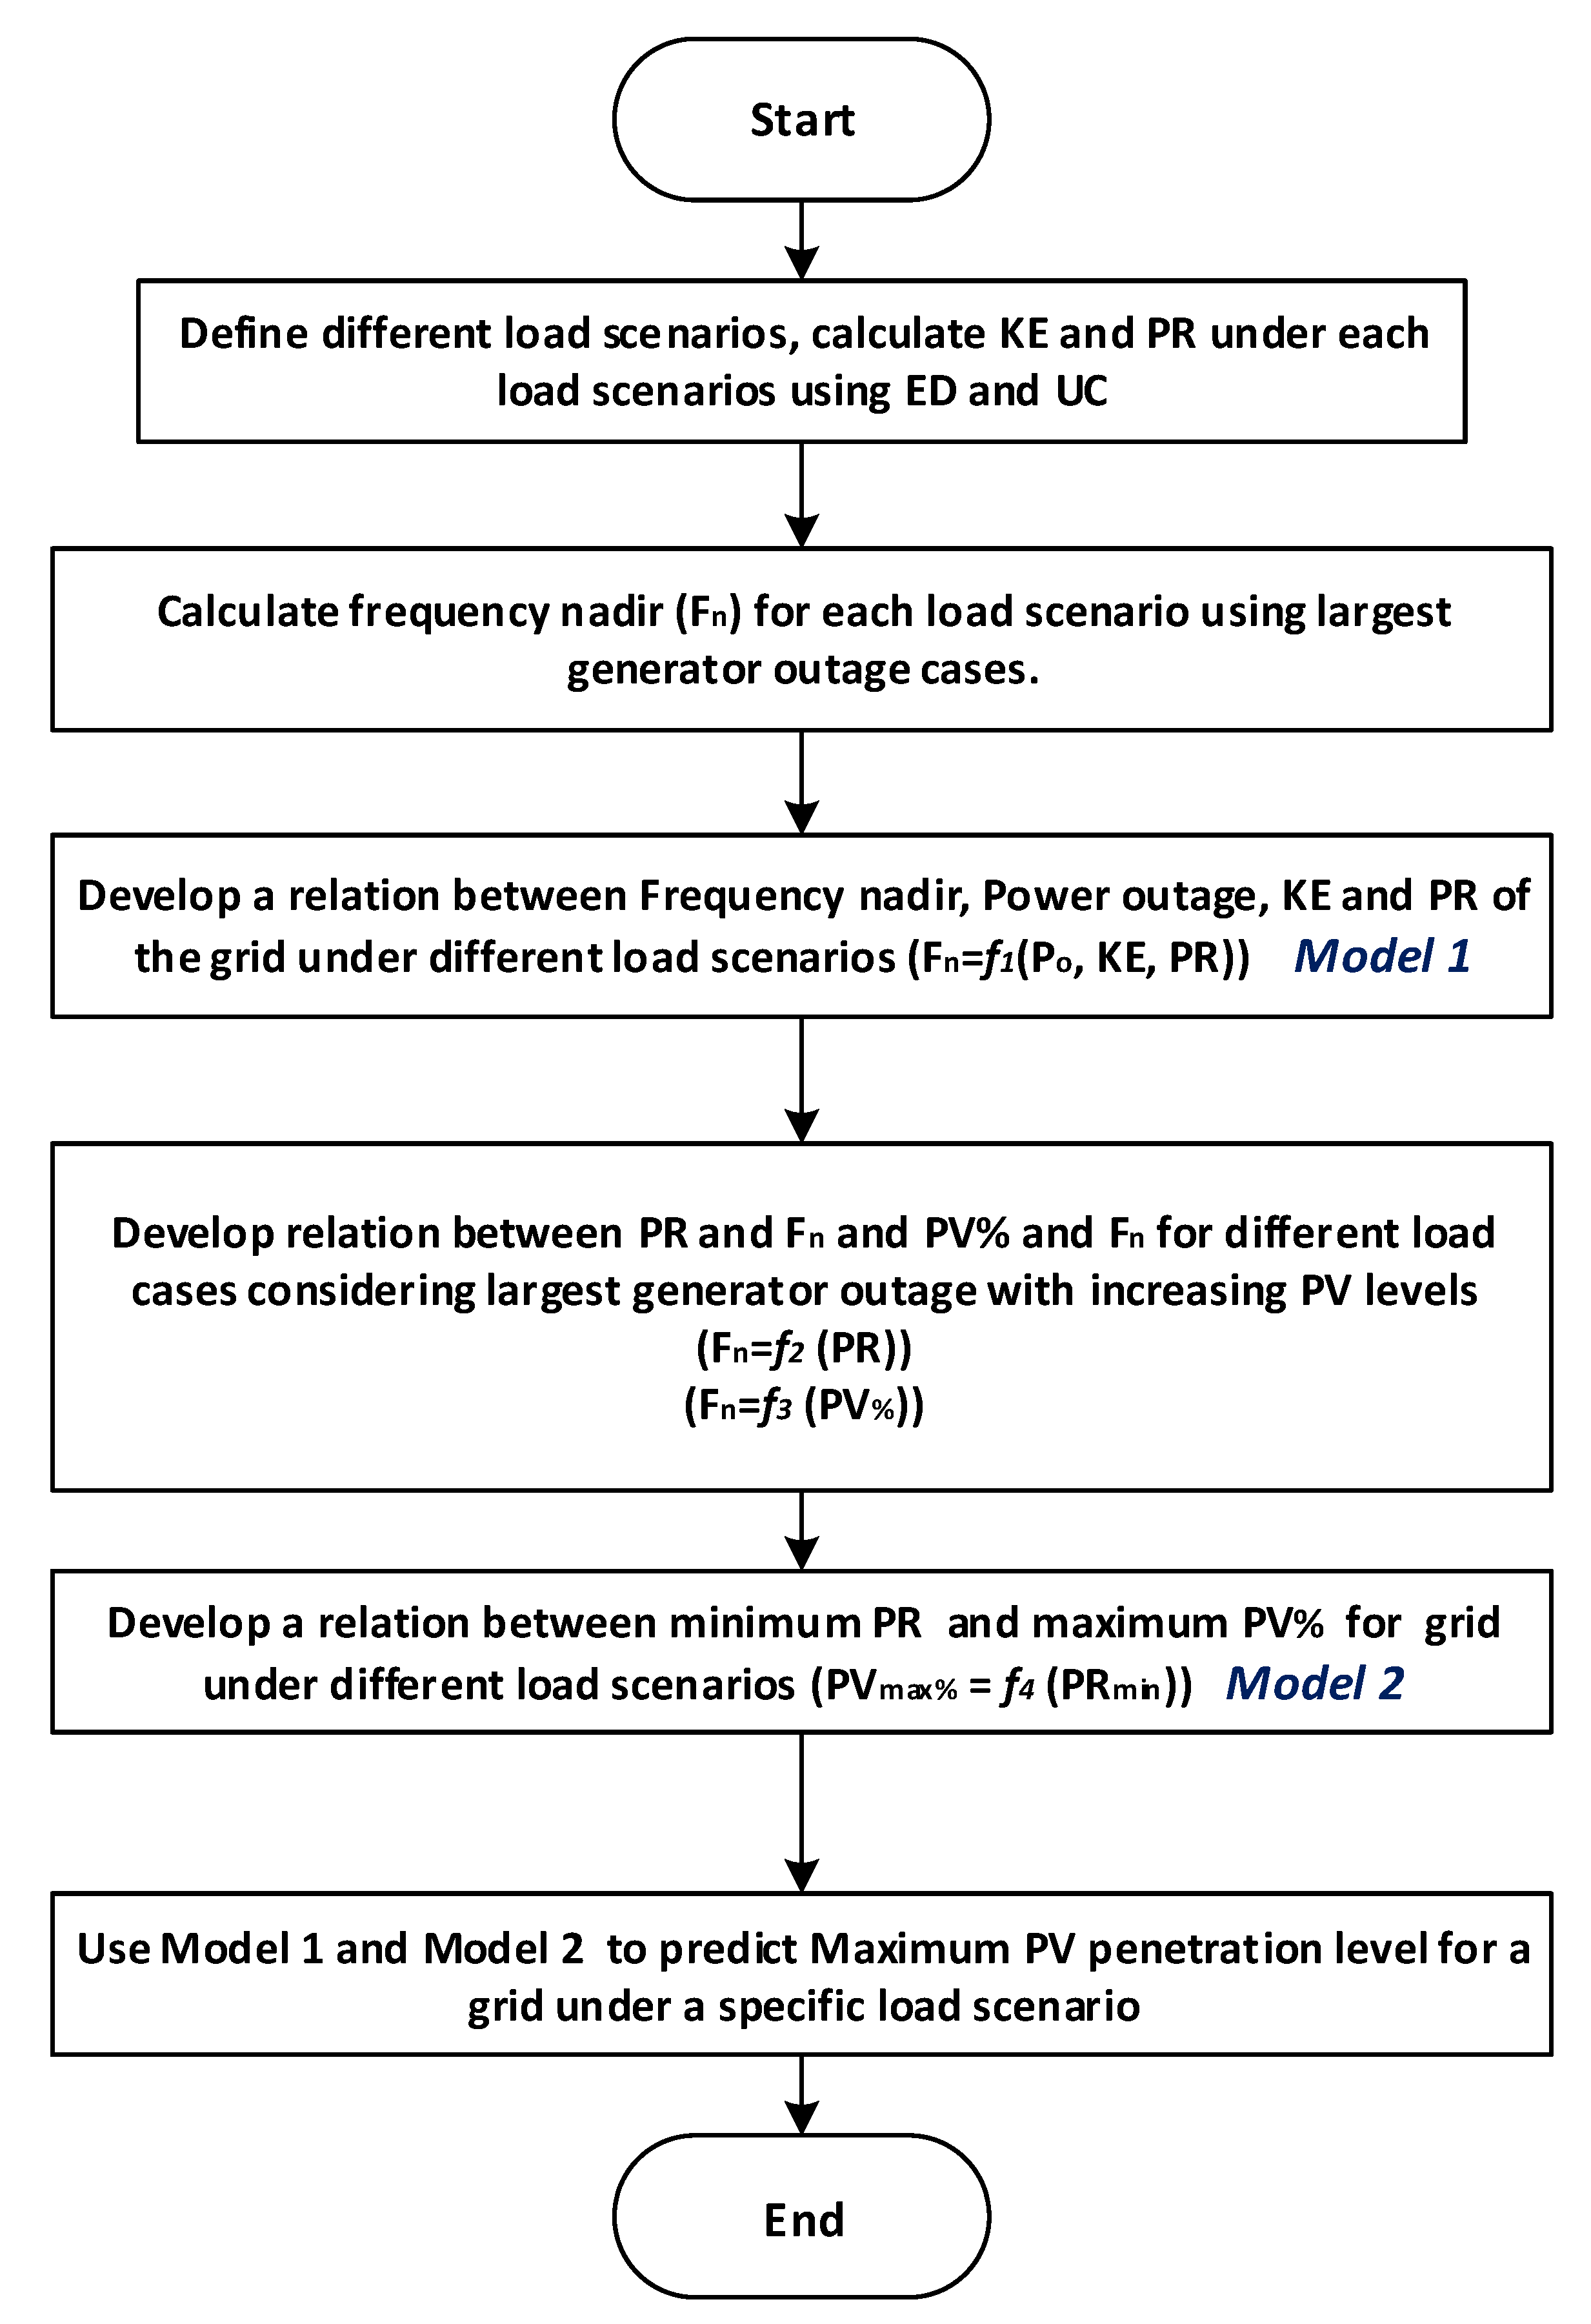
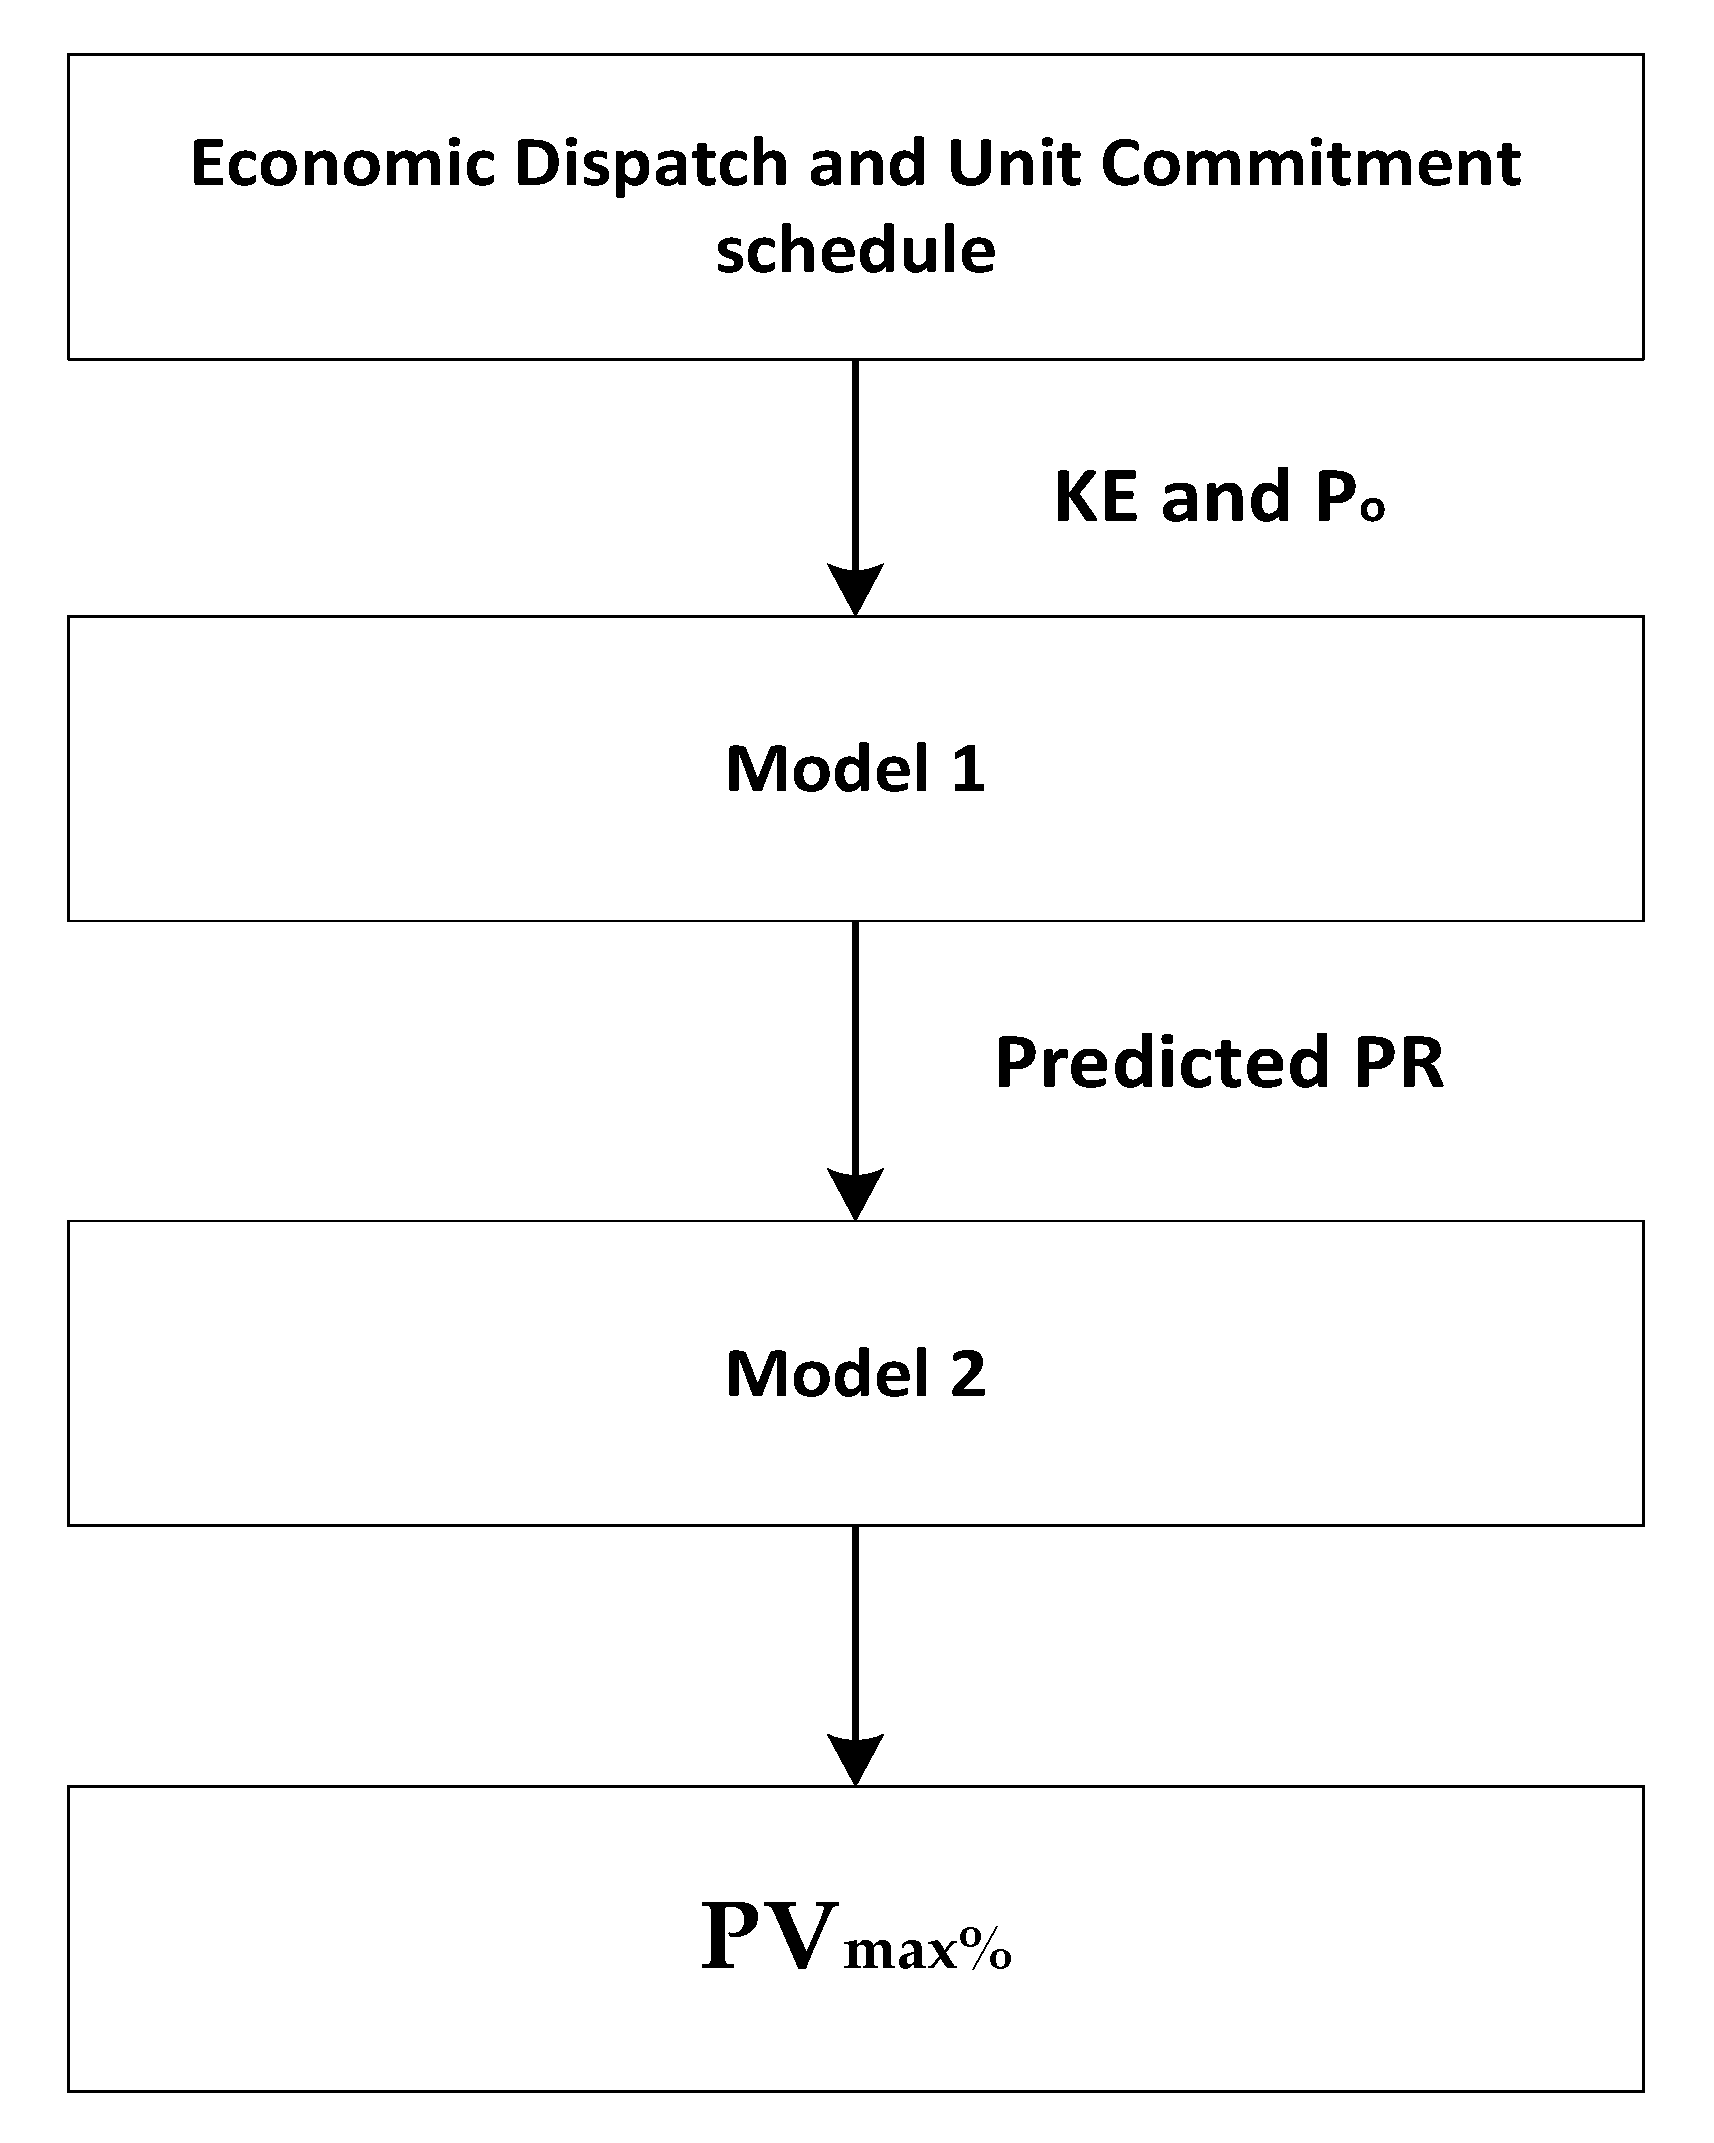
4. Proposed Tool to Estimate
4.1. Stage 1: Frequency Nadir-Based PVmax% Estimation
- i.
- For a particular load case, the number of committed synchronous generators remains constant thereby keeping KE constant.
- ii.
- Under a specific load case, the PV penetration level is increased by only changing the dispatch power of committed synchronous generator. Thus, the PR values change with change in PV penetration level.
- iii.
- Rate of Change of Frequency (RoCoF) is considered to be more dependent on the KE of the system and not PR. Hence for a specific load scenario, RoCoF changes are not considered as significant as changes in Frequency Nadir.
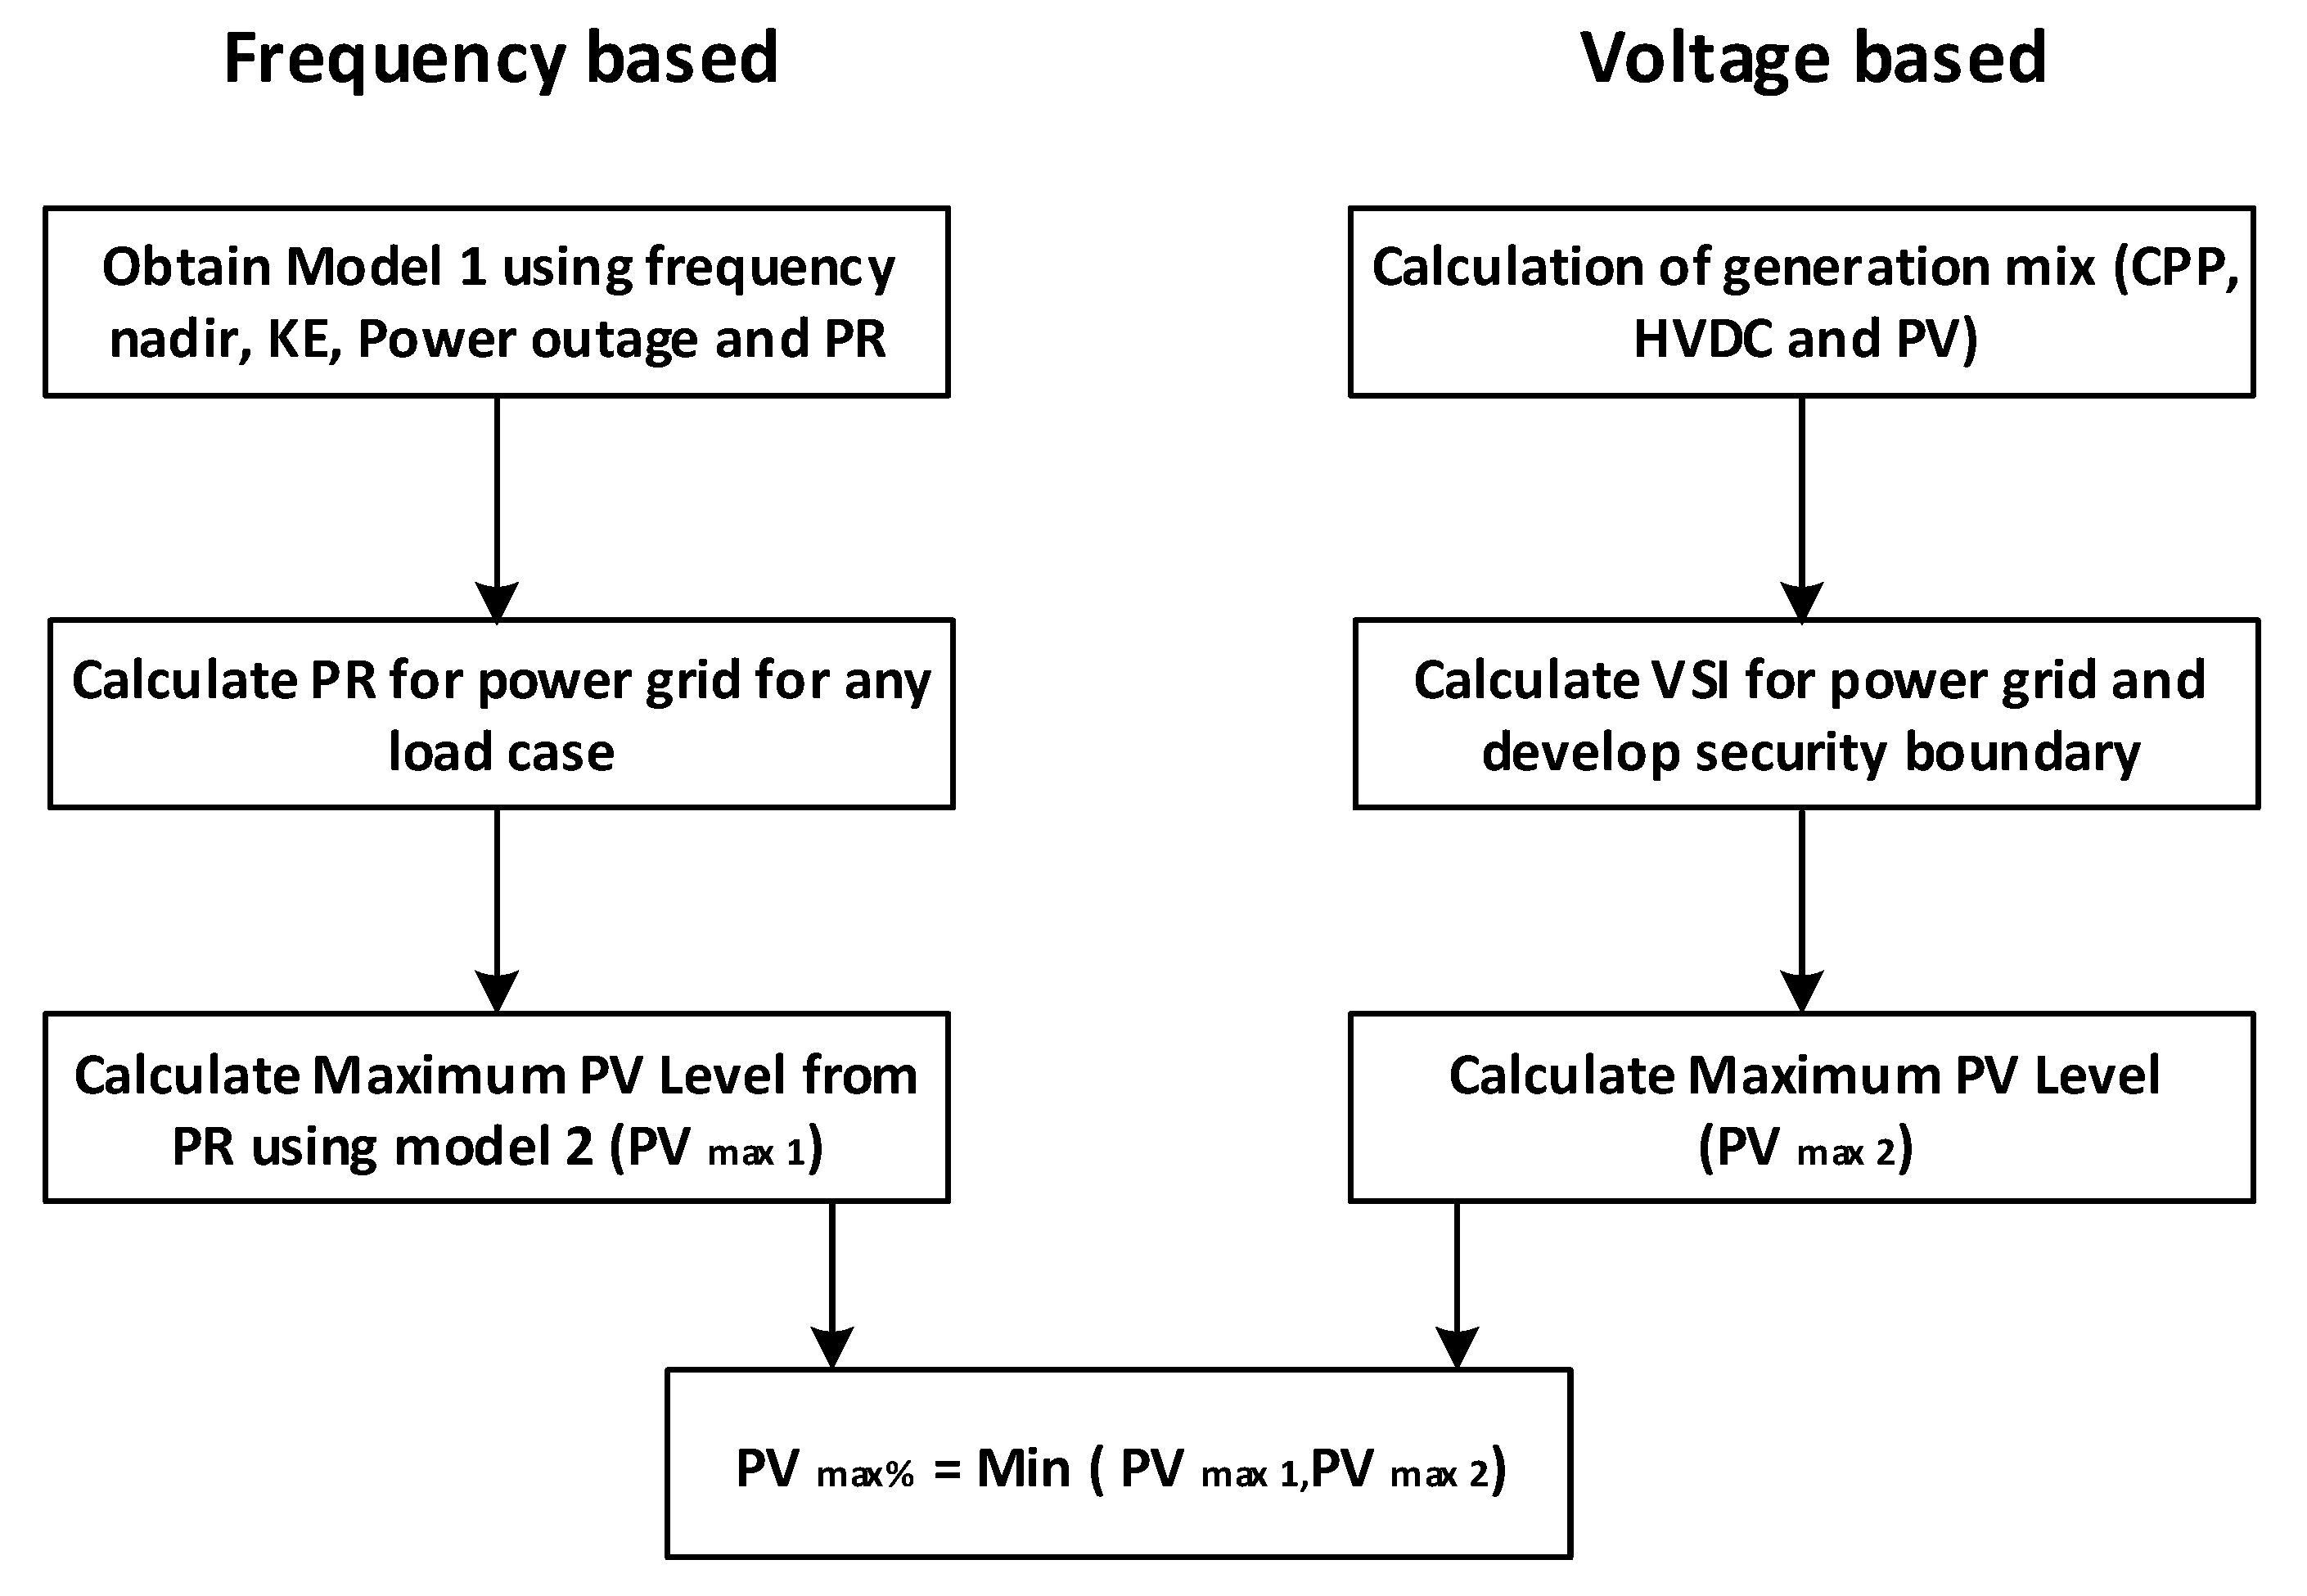
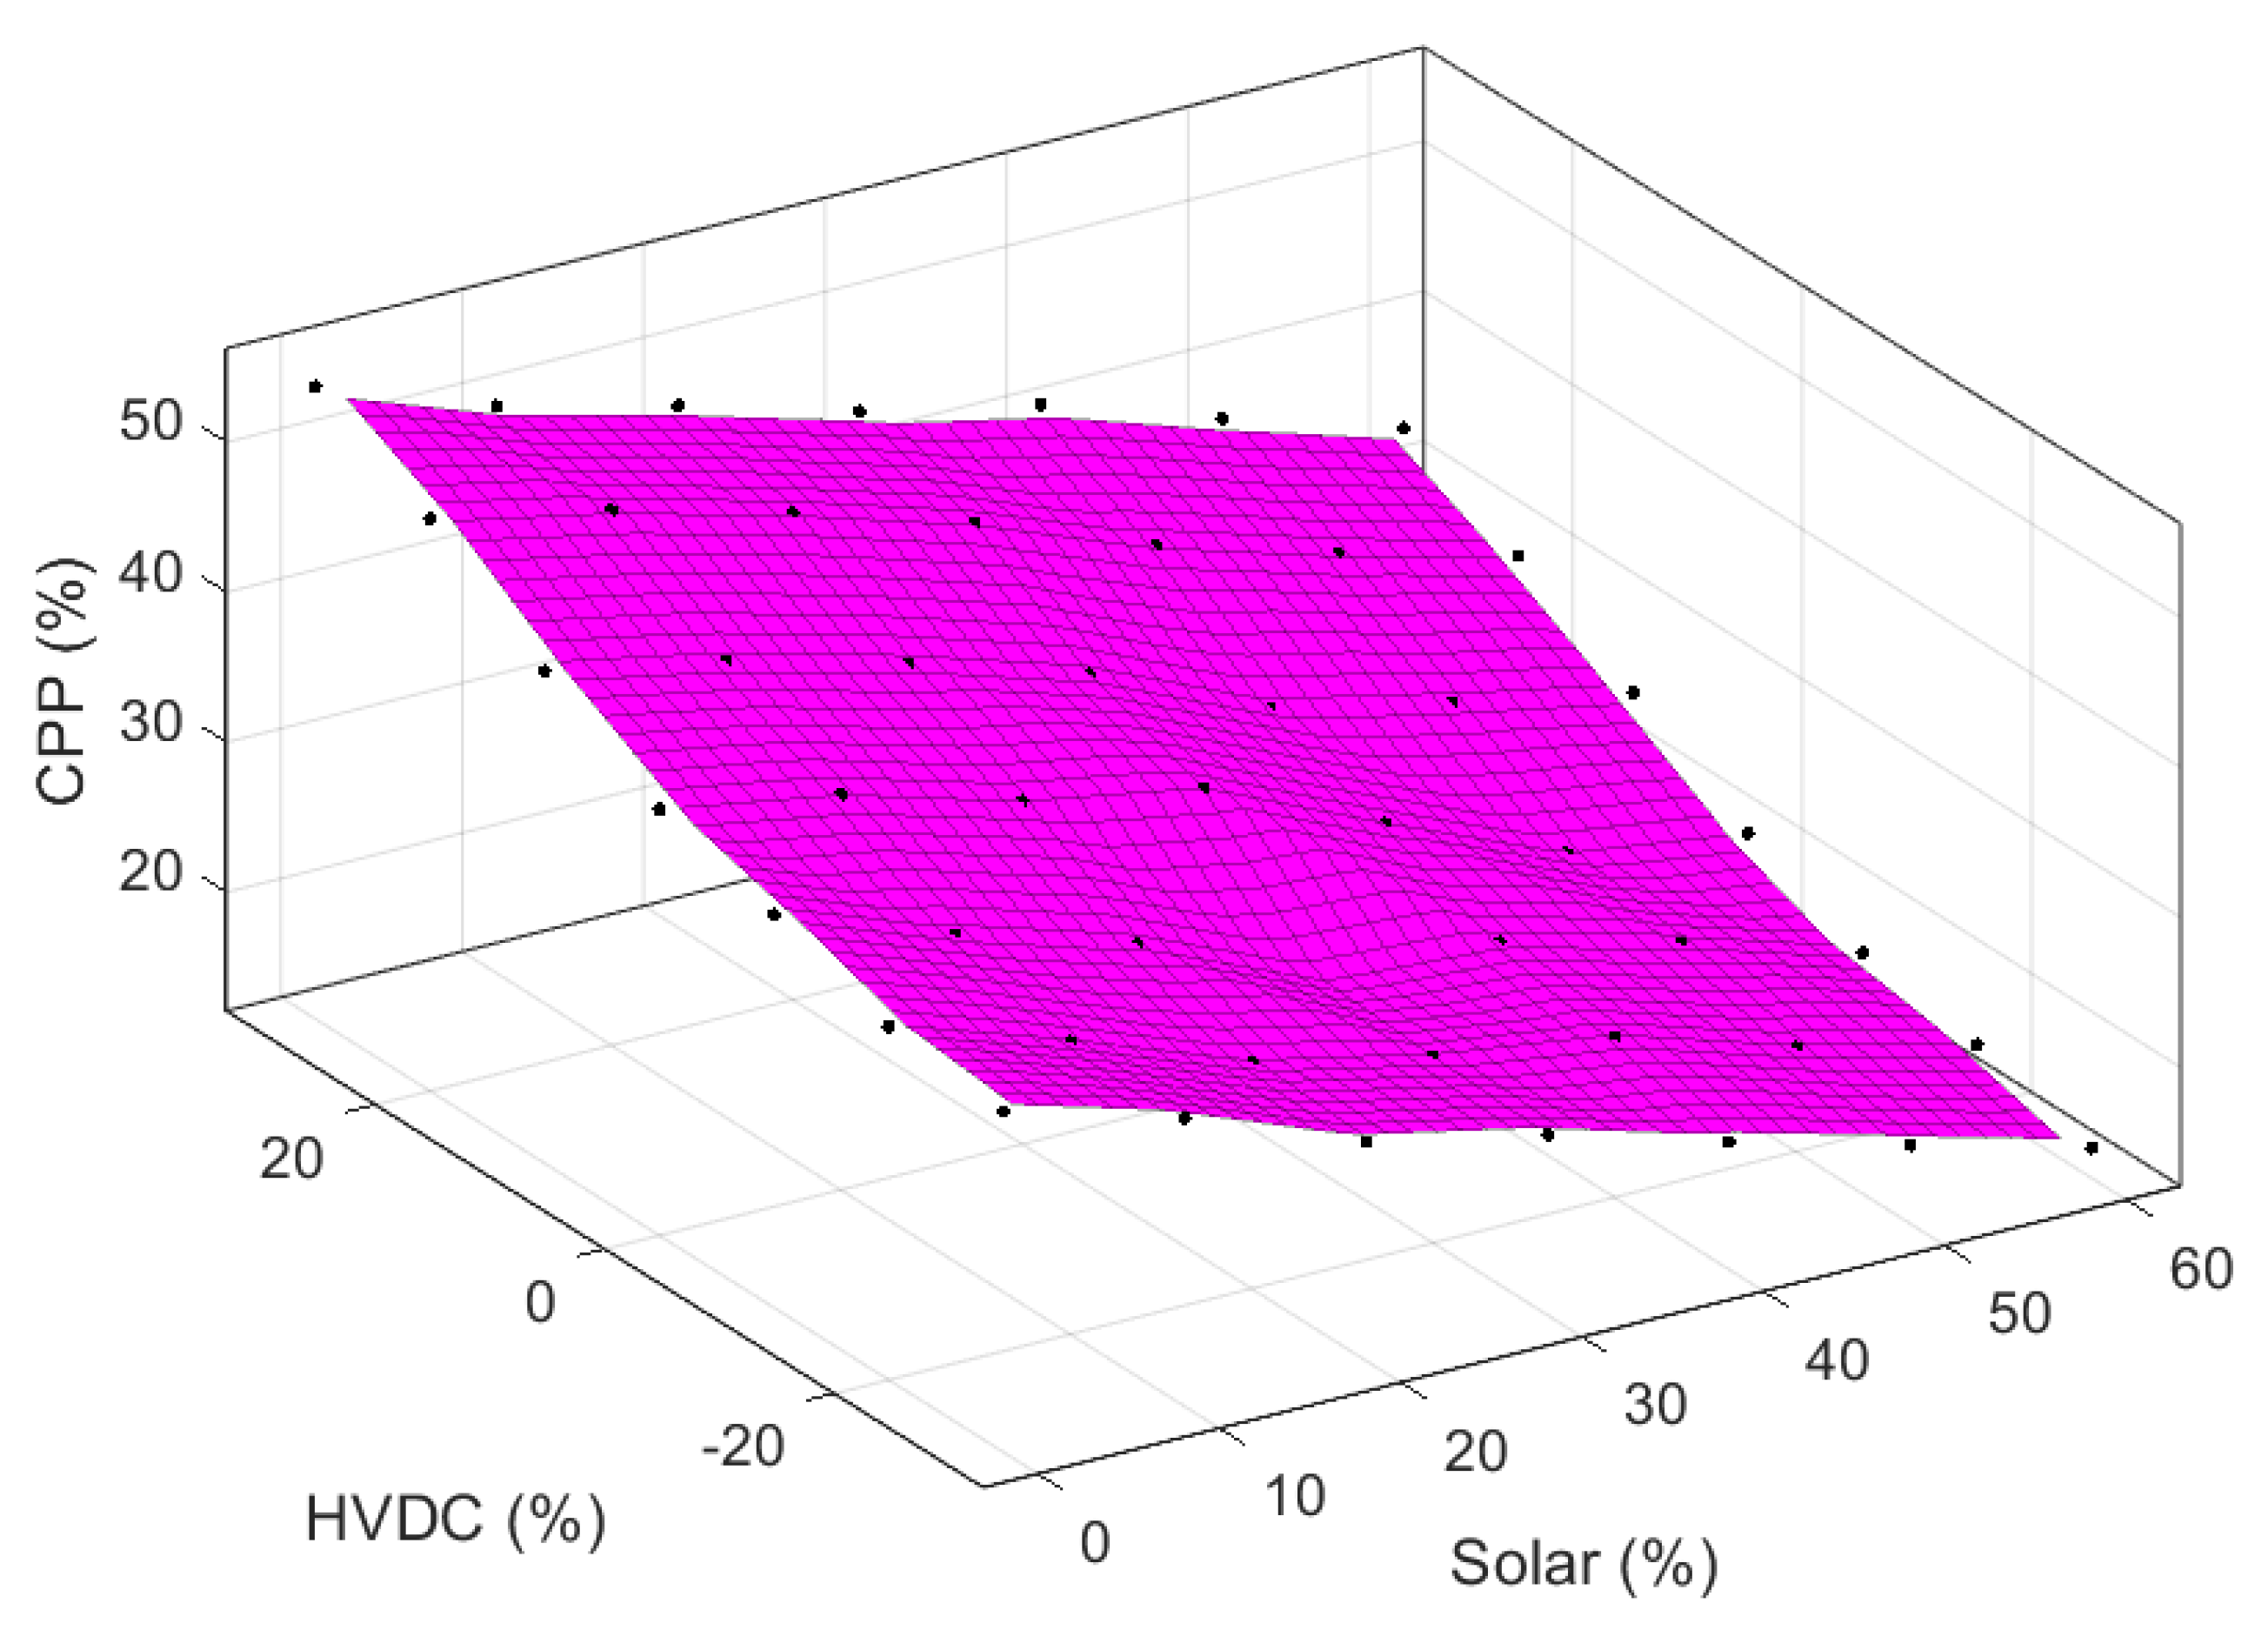
4.2. Stage 2: Voltage Severity Index-Based PVmax% Estimation
- Step 1: Create a number of operating scenarios by varying the generation mix in the test system. For obtaining various combinations, CPP is varied from 0–100%. HVDC sources are considered in the test system with a variation of 0–30% with both import and export conditions. The solar PV additions were varied between 0–60%. All the HVDC and PV penetration mix are calculated with respect to total system demand under respective load scenarios whereas CPP levels are calculated based on their total installed capacity.
- Step 2: The values of VSI are calculated using Equation (3) explained in Section 3.2. Various fault cases as listed in Table 1 were considered to calculate VSI values under all generation combinations with various operating conditions.
- Step 3: Using the calculated VSI values and generation mix of the system, a security boundary is derived for the studied test system. This boundary can be used to predict PVmax% which ensures voltage security of the test system corresponding to the chosen operating condition/load scanario.
4.3. Combined Utilization of Stage 1 and Stage 2 for PVmax% Estimation
5. Results and Discussion
5.1. Stage 1: Frequency Nadir-Based PVmax% Estimation
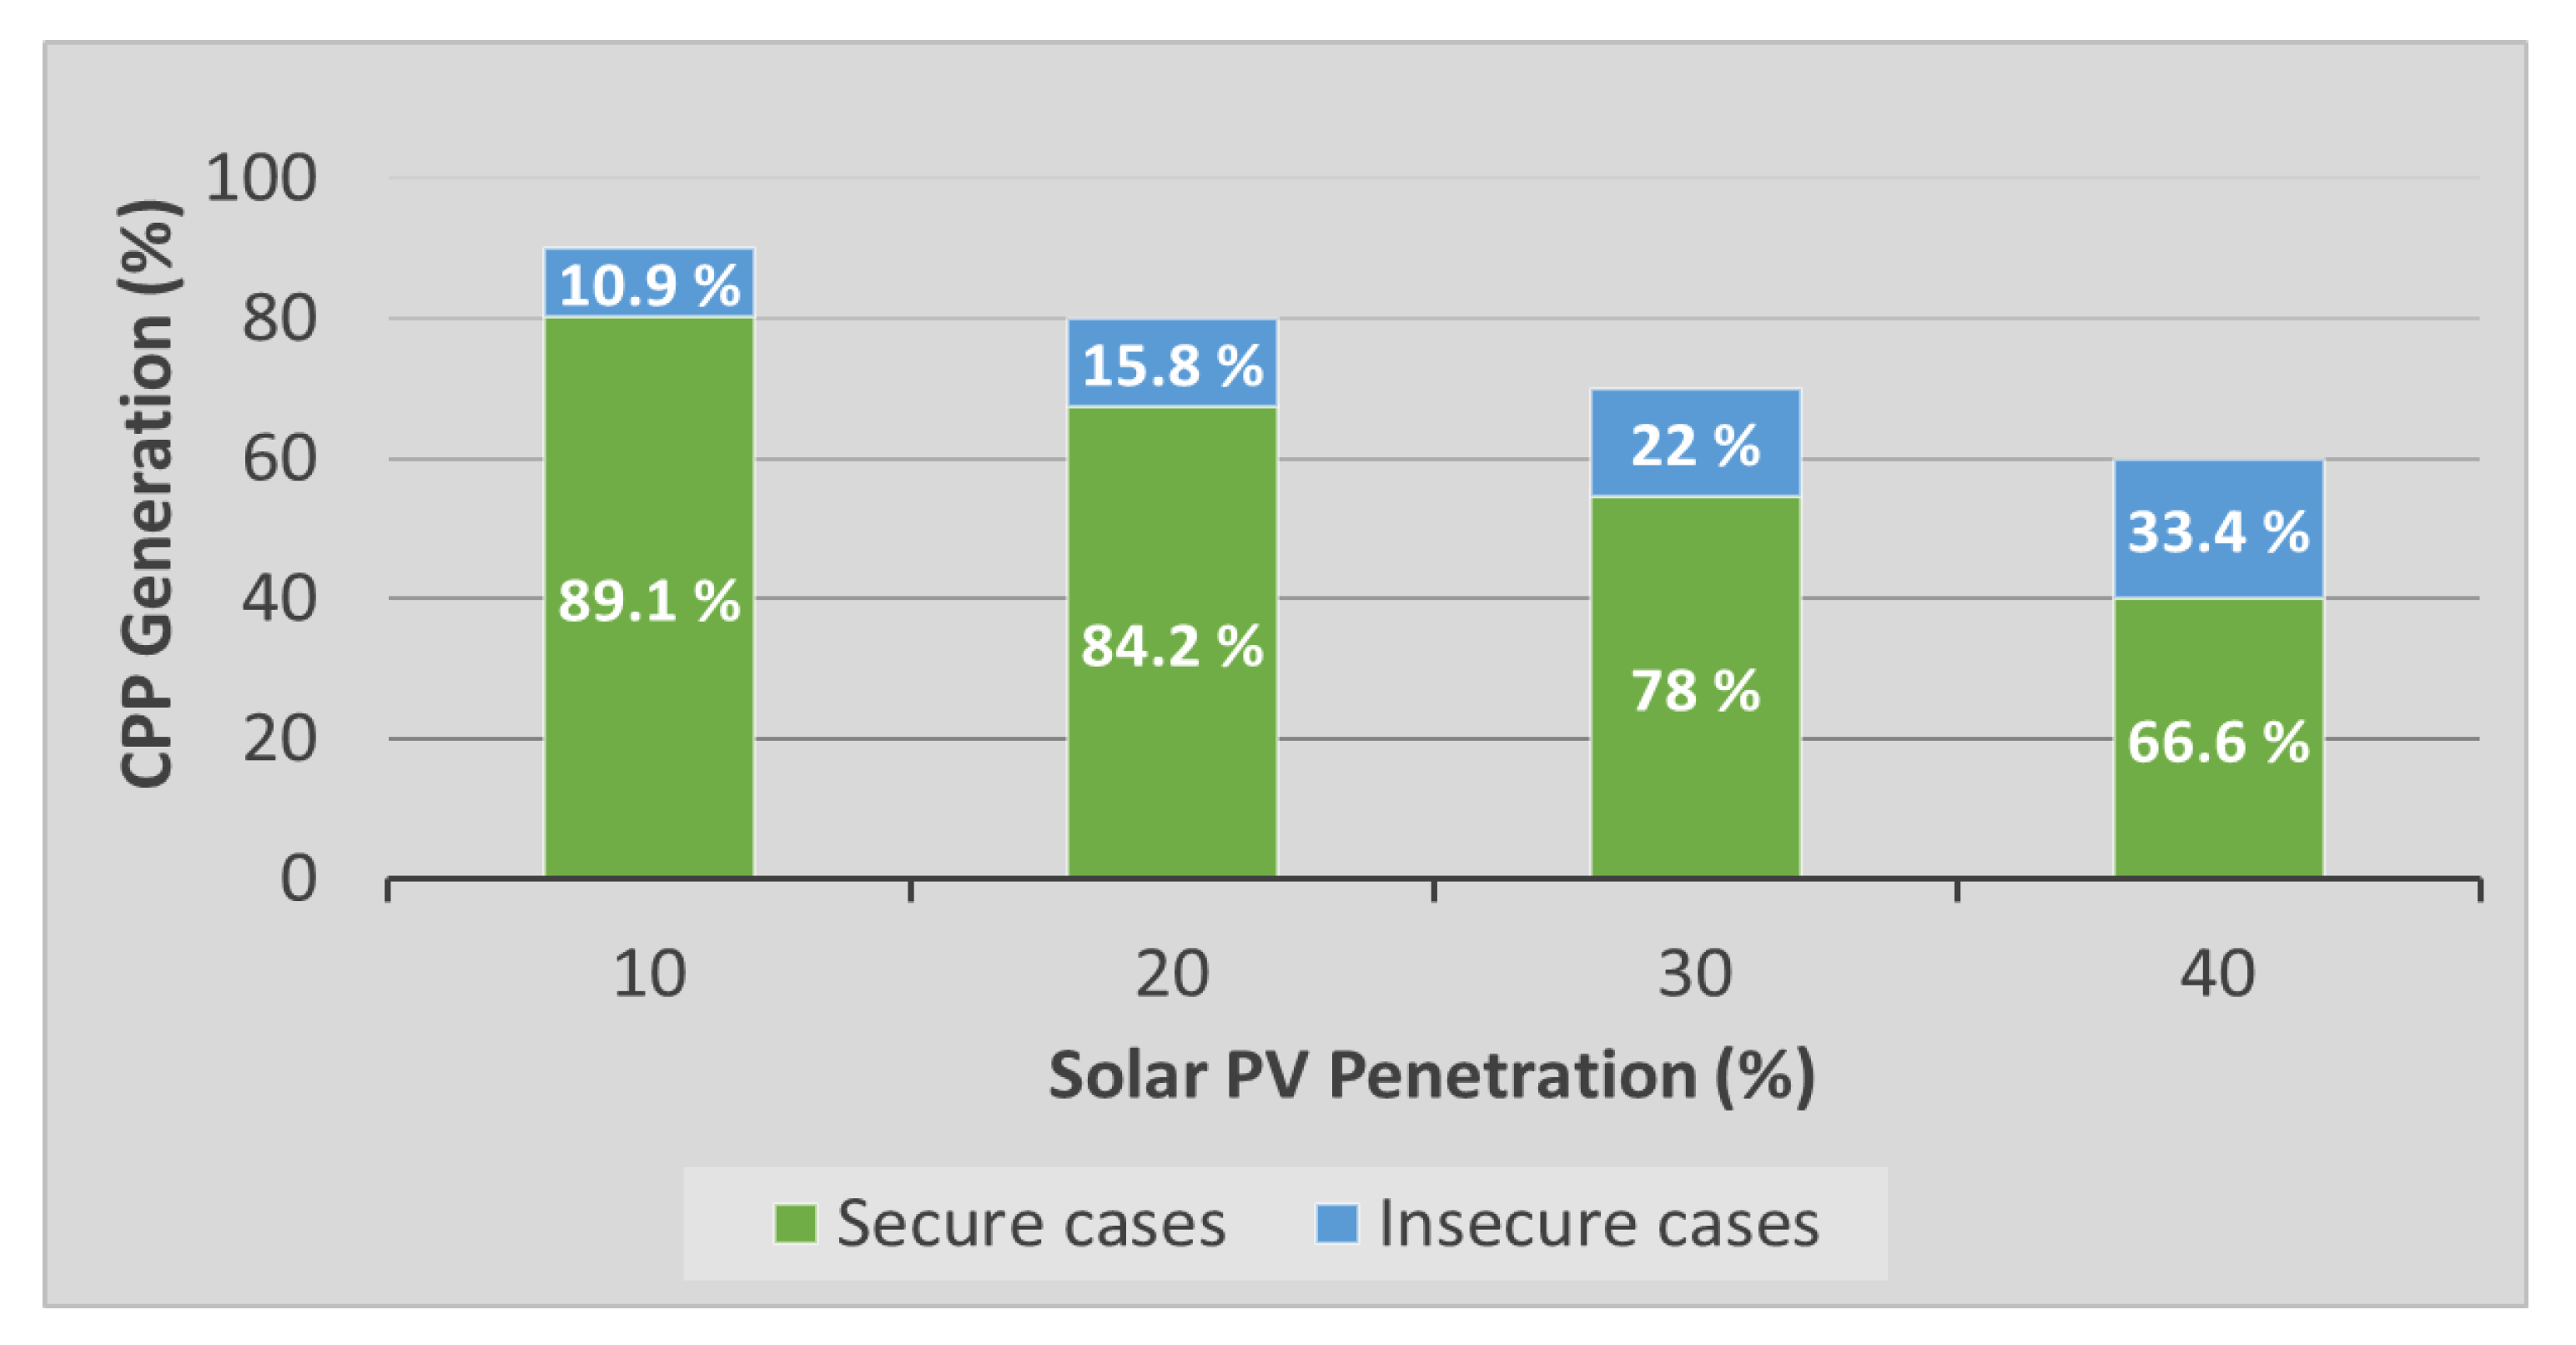
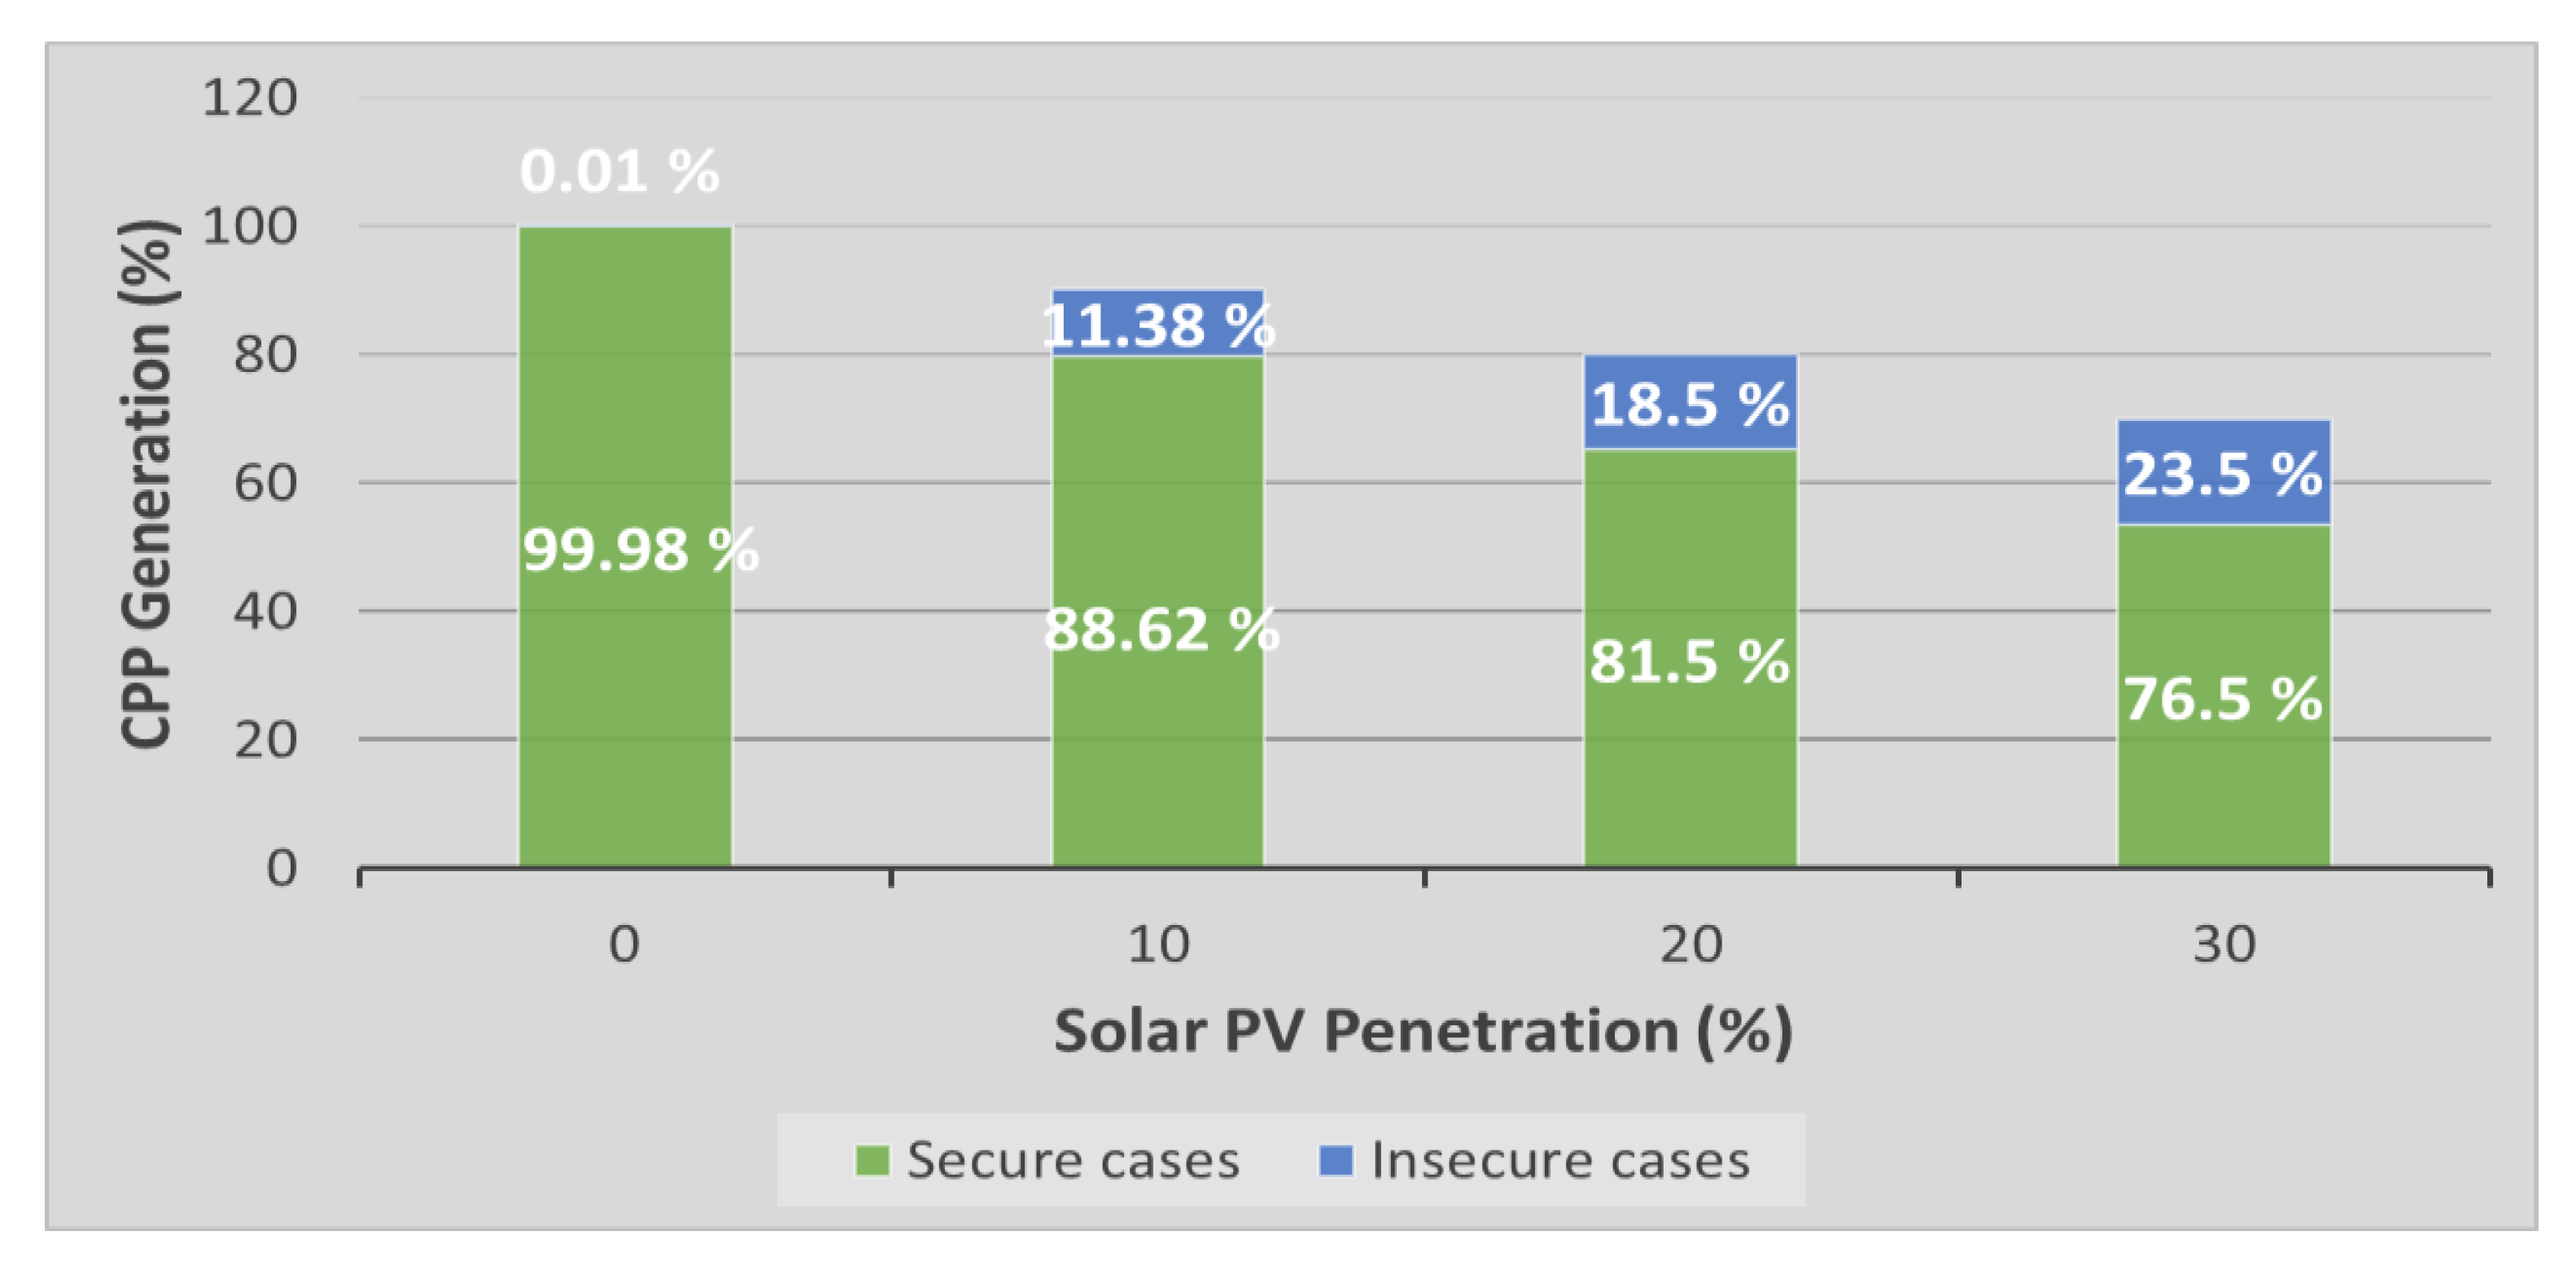
5.2. Stage 2: VSI-Based PVmax% Estimation
5.3. Validation of Proposed PVmax% Estimation Tool
5.4. Validation of Proposed PVmax% Estimation Approach in Presence of Emulated PV Inertia
6. Conclusions
Author Contributions
Funding
Institutional Review Board Statement
Informed Consent Statement
Acknowledgments
Conflicts of Interest
Nomenclature
| Fn | frequency nadir |
| inertia constant | |
| PRmin | minimum power reserve |
| PV penetration level | |
| PVmax% | maximum PV penetration level |
| generator actual power output | |
| generator rated power output | |
| generator MVA rating | |
| number of online generators | |
| number of generators with governors | |
| maximum rotor angle deviation | |
| CPP | conventional power plant |
| KE | kinetic energy |
| PFR | primary frequency reserves |
| Po | power outage |
| PR | power reserve |
| PV | photovoltaic |
| REEC_B | renewable energy electrical control module |
| REGC_A | renewable energy generator/converter module |
| REMTF | renewable energy modeling task force |
| REPC_A | renewable energy plant control module |
| RES | renewable energy sources |
| RoCoF | rate of change of frequency |
| TSI | transient stability index |
| TSO | transmission system operator |
| UFLS | under frequency load shedding |
| VSI | voltage severity index |
| WECC | Western Electricity Coordinating Council |
References
- Whiteman, A.; Akande, D.; Elhassan, N.; Escamilla, G.; Lebedys, A.; Arkhipova, I. Renewable Capacity Statistics 2021; International Renewable Energy Agency (IRENA): Abu Dhabi, United Arab Emirates, 2021; Available online: https://www.irena.org/publications/2021/March/Renewable-Capacity-Statistics-2021 (accessed on 30 April 2021).
- REN21.2020. Renewables 2020 Global Status Report; REN21 Secratariet: Paris, France. Available online: https://www.ren21.net/wp-content/uploads/2019/05/gsr_2020_full_report_en.pdf (accessed on 30 April 2021).
- Kabir, E.; Kumar, P.; Kumar, S.; Adelodun, A.A.; Kim, K.-H. Solar Energy: Potential and Future Prospects. Renew. Sustain. Energy Rev. 2018, 82, 894–900. [Google Scholar] [CrossRef]
- Aleem, S.A.; Hussain, S.M.S.; Ustun, T.S. A Review of Strategies to Increase PV Penetration Level in Smart Grids. Energies 2020, 13, 636. [Google Scholar] [CrossRef] [Green Version]
- Shah, R.; Mithulananthan, N.; Bansal, R.; Ramachandaramurthy, V. A Review of Key Power System Stability Challenges for Large-Scale PV Integration. Renew. Sustain. Energy Rev. 2015, 41, 1423–1436. [Google Scholar] [CrossRef]
- Achilles, S.; Schramm, S.; Bebic, J. Transmission System Performance Analysis for High-Penetration Photovoltaics; GE Global Research and NREL, US Department of Energy: Golden, CO, USA, 2008. [Google Scholar] [CrossRef] [Green Version]
- Eftekharnejad, S.; Vittal, V.; Heydt, G.T.; Keel, B.; Loehr, J. Impact of Increased Penetration of Photovoltaic Generation on Power Systems. IEEE Trans. Power Syst. 2013, 28, 893–901. [Google Scholar] [CrossRef]
- Mansouri, N.; Lashab, A.; Sera, D.; Guerrero, J.M.; Cherif, A. Large Photovoltaic Power Plants Integration: A Review of Challenges and Solutions. Energies 2019, 12, 3798. [Google Scholar] [CrossRef] [Green Version]
- Eltawil, M.A.; Zhao, Z. Grid-Connected Photovoltaic Power Systems: Technical and Potential Problems—A Review. Renew. Sustain. Energy Rev. 2010, 14, 112–129. [Google Scholar] [CrossRef]
- Australian Energy Market Operator. Black System South Australia 28 September 2016: Final Report. 2017. Available online: https://apo.org.au/node/74886 (accessed on 10 May 2021).
- Mohseni, M.; Islam, S.M. Review of International Grid Codes for Wind Power Integration: Diversity, Technology and a Case for Global Standard. Renew. Sustain. Energy Rev. 2012, 16, 3876–3890. [Google Scholar] [CrossRef]
- Arulkumar, K.; Palanisamy, K.; Vijayakumar, D. Recent Advances and Control Techniques in Grid Connected PV System—A Review. Int. J. Renew. Energy Res. 2016, 6, 1037–1049. [Google Scholar]
- Rather, Z.H.; Chen, Z.; Thogersen, P. Challenge of Primary Voltage Control in Large Scale Wind Integrated Power System: A Danish Power System Case Study. In Proceedings of the IEEE PES ISGT Europe 2013, Lyngby, Denmark, 6–9 October 2013; pp. 1–5. [Google Scholar] [CrossRef]
- Oprea, S.-V.; Bâra, A. Analyses of Wind and Photovoltaic Energy Integration from the Promoting Scheme Point of View: Study Case of Romania. Energies 2017, 10, 2101. [Google Scholar] [CrossRef] [Green Version]
- Ahmadi, H.; Ghasemi, H. Maximum Penetration Level of Wind Generation Considering Power System Security Limits. IET Gener. Transm. Distrib. 2012, 6, 1164–1170. [Google Scholar] [CrossRef]
- Tamimi, A.A.; Pahwa, A.; Starrett, S.; Williams, N. Maximizing Wind Penetration Using Voltage Stability Based Methods for Sizing and Locating New Wind Farms in Power System. In Proceedings of the IEEE PES General Meeting, Minneapolis, MN, USA, 25–29 July 2010; pp. 1–7. [Google Scholar] [CrossRef]
- Coath, G.; Dabbagh, M. Effect of Steady State Wind Turbine Generator Models on Power Flow Convergence and Voltage Stability Limit. Australasian Universities Power Engineering Conference, Tasmania, Australia, 25–28 September 2005. [Google Scholar]
- Sreedharan, S.; Ongsakul, W.; Singh, J.G.; Wartana, I.M.; Buayai, K. Development of PSO Based Control Algorithms for Maximizing Wind Energy Penetration. In Proceedings of the 2011 IEEE Power and Energy Society General Meeting, San Diego, CA, USA, 24–28 July 2011; pp. 1–6. [Google Scholar] [CrossRef]
- Tamimi, A.A.; Pahwa, A.; Starrett, S. Effective Wind Farm Sizing Method for Weak Power Systems Using Critical Modes of Voltage Instability. IEEE Trans. Power Syst. 2012, 27, 1610–1617. [Google Scholar] [CrossRef]
- Kaldellis, J.K.; Kavadias, K.A.; Filios, A.E. A New Computational Algorithm for the Calculation of Maximum Wind Energy Penetration in Autonomous Electrical Generation Systems. Appl. Energy 2009, 86, 1011–1023. [Google Scholar] [CrossRef]
- Yu, H.Y.; Bansal, R.C.; Dong, Z.Y. Fast Computation of the Maximum Wind Penetration Based on Frequency Response in Small Isolated Power Systems. Appl. Energy 2014, 113, 648–659. [Google Scholar] [CrossRef]
- Masood, N.A.; Yan, R.; Saha, T. A New Tool to Estimate Maximum Wind Power Penetration Level: In Perspective of Frequency Response Adequacy. Appl. Energy 2015, 154, 209–220. [Google Scholar] [CrossRef]
- Western Electricity Coordinating Council (WECC) Renewable Energy Modeling Task Force. (2010, August) WECC PV plant power flow modeling guidelines. Available online: https://www.wecc.biz/Reliability/WECCPVPlantPowerFlowModelingGuide.pdf (accessed on 1 November 2021).
- Western Electricity Coordinating Council (WECC) Renewable Energy Modeling Task Force. (2014, January) WECC second generation wind turbine models. Available online: https://www.wecc.biz/Reliability/WECCSecondGenerationWindTurbineModels012314.pdf (accessed on 1 November 2021).
- Munkhchuluun, E.; Meegahapola, L.; Vahidnia, A. Impact on Rotor Angle Stability with High Solar-PV Generation in Power Networks. In Proceedings of the 2017 IEEE PES Innovative Smart Grid Technologies Conference Europe (ISGT-Europe), Turin, Italy, 26–29 September 2017; pp. 1–6. [Google Scholar] [CrossRef]
- Vittal, E.; O’Malley, M.; Keane, A. Rotor Angle Stability with High Penetrations of Wind Generation. IEEE Trans. Power Syst. 2012, 27, 353–362. [Google Scholar] [CrossRef]
- Meegahapola, L.; Littler, T. Characterisation of Large Disturbance Rotor Angle and Voltage Stability in Interconnected Power Networks with Distributed Wind Generation. IET Renew. Power Gener. 2015, 9, 272–283. [Google Scholar] [CrossRef] [Green Version]
- Powertech Labs. DSATools: Dynamic Security Assessment Software. Available online: https://www.dsatools.com (accessed on 10 May 2021).
- Zhang, Y.; Zhu, S.; Sparks, R.; Green, I. Impacts of Solar PV Generators on Power System Stability and Voltage Performance. In Proceedings of the 2012 IEEE Power and Energy Society General Meeting, San Diego, CA, USA, 22–26 July 2012; pp. 1–7. [Google Scholar] [CrossRef]
- Zhang, Y.; Mensah-Bonsu, C.; Walke, P.; Arora, S.; Pierce, J. Transient Over-Voltages in High Voltage Grid-Connected PV Solar Interconnection. In Proceedings of the IEEE PES General Meeting, Minneapolis, MN, USA, 25–29 July 2010; pp. 1–6. [Google Scholar] [CrossRef]
- Xue, Y.; Manjrekar, M.; Lin, C.; Tamayo, M.; Jiang, J.N. Voltage Stability and Sensitivity Analysis of Grid-Connected Photovoltaic Systems. In Proceedings of the 2011 IEEE Power and Energy Society General Meeting, Detroit, MI, USA, 24–28 July 2011; pp. 1–7. [Google Scholar] [CrossRef]
- Eber, E.; Corbus, D. Hawaii Solar Integration Study: Executive Summary; National Renewable Energy Laboratory, US Department of Energy: Golden, CO, USA, 2013. [Google Scholar]
- Gevorgian, V.; Booth, S. Review of PREPA Technical Requirements for Interconnecting Wind and Solar Generation; National Renewable Energy Laboratory, US Department of Energy: Golden, CO, USA, 2013. [Google Scholar] [CrossRef] [Green Version]
- Lacommare, K.S.H. Review of the Recent Frequency Performance of the Eastern, Western and ERCOT Interconnections; Lawrence Berkeley National Laboratory: Berkeley, CA, USA, 2010. [Google Scholar] [CrossRef] [Green Version]
- Kundur, P. Power System Stability and Control; McGraw Hill: New York, NY, USA, 1994; pp. 271–314, 959–1024. [Google Scholar]


| Fault Settings | Conditions |
|---|---|
| Fault Type | 3-phase short circuit |
| Fault Location | All 39 buses |
| Retained Fault Voltages | 0 pu, 0.3 pu, 0.5 pu, 0.7 pu |
| Fault Durations | 150 ms, 600 ms, 900 ms, 1200 ms |
| TSI | Retained Fault Voltage = 0.3 pu; Fault Duration 300 ms | ||||
| Fault Location | 0% PV | 10% PV | 20% PV | 30% PV | |
| Bus 01 | 62.7 | 61.5 | 64.7 | 59.1 | |
| Bus 12 | 65.46 | 62.64 | 62.35 | 61.38 | |
| Bus 20 | 40.87 | 47.66 | 50.38 | 56.56 | |
| Bus 33 | 50.22 | 63.8 | 65.69 | 67.84 | |
| Bus 39 | 63.54 | 62.9 | 63.02 | 58.4 | |
| Load Scenarios | P0 (MW) | KE (MWs) | PR (MW) | Fn (Hz) |
|---|---|---|---|---|
| Load Case 1 | 1000 | 78,269.5 | 894.2 | 46.602 |
| Load Case 2 | 660 | 75,669.7 | 1143.6 | 48.788 |
| Load Case 3 | 630 | 74,819.5 | 991.4 | 49.14 |
| Load Case 4 | 800 | 74,789.5 | 1490.4 | 48.56 |
| Load Case 5 | 900 | 75,839.8 | 807.9 | 47.046 |
| Load Case 6 | 550 | 78,260.5 | 1302.8 | 49.362 |
| Load Case 7 | 650 | 75,629.8 | 1136.4 | 49.134 |
| Load Case 8 | 508 | 74,689.5 | 287.3 | 48.804 |
| Load Scenarios | Mathematical Relation between Fn and PR | PRmin (MW) |
|---|---|---|
| Load Case 1 | Fn = −0.000102 (PR) + 49.32 | 1176.4 |
| Load Case 2 | Fn = −0.000181 (PR) + 49.42 | 1222.22 |
| Load Case 3 | Fn = −0.000074 (PR) + 49.31 | 1486.48 |
| Load Case 4 | Fn = −0.000044 (PR) + 49.29 | 2045.45 |
| Load Case 5 | Fn = −0.000091 (PR) + 49.28 | 879.12 |
| Load Case 6 | Fn = −0.000058(PR) + 49.35 | 2586.2 |
| Load Case 7 | Fn = −0.000057 (PR) + 49.3 | 1818.18 |
| Load Case 8 | Fn = 0.000067 (PR) + 49.19 | 597.01 |
| Load Scenarios | Mathematical Relation between Fn and PV% | PVmax% (%) |
|---|---|---|
| Load Case 1 | Fn = −0.0608 (PV%) + 48.73 | 12 |
| Load Case 2 | Fn = −0.0701 (PV%) + 49.16 | 14.74 |
| Load Case 3 | Fn = −0.0340 (PV%) + 49.37 | 22.37 |
| Load Case 4 | Fn = −0.0171 (PV%) + 48.95 | 40.61 |
| Load Case 5 | Fn = −0.0615 (PV%) + 48.64 | 10.4 |
| Load Case 6 | Fn = −0.0203 (PV%) + 49.23 | 42.85 |
| Load Case 7 | Fn = −0.0314 (PV%) + 49.49 | 33.82 |
| Load Case 8 | Fn = −0.1632 (PV%) + 49.42 | 8.7 |
| Load Case | PVmax% (Using Tool) | PVmax% (Using Simulation) | Deviation (%) |
|---|---|---|---|
| IEEE 39 bus system | |||
| Load Case 1 | 41.5 | 43 | 3.4 |
| Load Case 2 | 14.42 | 15 | 3.86 |
| Load Case 3 | 26.7 | 28 | 4.6 |
| Gujarat State Grid | |||
| Load Case 1 | 45.1 | 47 | 4.31 |
| Load Case 2 | 28.9 | 30 | 3.66 |
| Load Case 3 | 50.8 | 53 | 4.15 |
| Load Case | PVmax% (Using Tool) | PVmax% (Using Simulation) | Deviation (%) |
|---|---|---|---|
| IEEE 39 bus system | |||
| Load Case 1 | 33.1 | 35 | 5.4 |
| Load Case 2 | 18.7 | 20 | 6.5 |
Publisher’s Note: MDPI stays neutral with regard to jurisdictional claims in published maps and institutional affiliations. |
© 2021 by the authors. Licensee MDPI, Basel, Switzerland. This article is an open access article distributed under the terms and conditions of the Creative Commons Attribution (CC BY) license (https://creativecommons.org/licenses/by/4.0/).
Share and Cite
Lekshmi J, D.; Rather, Z.H.; Pal, B.C. A New Tool to Assess Maximum Permissible Solar PV Penetration in a Power System. Energies 2021, 14, 8529. https://doi.org/10.3390/en14248529
Lekshmi J D, Rather ZH, Pal BC. A New Tool to Assess Maximum Permissible Solar PV Penetration in a Power System. Energies. 2021; 14(24):8529. https://doi.org/10.3390/en14248529
Chicago/Turabian StyleLekshmi J, Dhanuja, Zakir Hussain Rather, and Bikash C Pal. 2021. "A New Tool to Assess Maximum Permissible Solar PV Penetration in a Power System" Energies 14, no. 24: 8529. https://doi.org/10.3390/en14248529
APA StyleLekshmi J, D., Rather, Z. H., & Pal, B. C. (2021). A New Tool to Assess Maximum Permissible Solar PV Penetration in a Power System. Energies, 14(24), 8529. https://doi.org/10.3390/en14248529