Article

Design of Hybrid (PV-Diesel) System for Tourist Island in Karimunjawa Indonesia

1
Department of Electrical Engineering, University of Siliwangi, Tasikmalaya 46115, Jawa Barat, Indonesia
2
Department of Mechanical Engineering, University of Muhammadiyah, Tasikmalaya 46115, Jawa Barat, Indonesia
*
Author to whom correspondence should be addressed.
Energies 2021, 14(24), 8311; https://doi.org/10.3390/en14248311
Submission received: 5 November 2021 / Revised: 20 November 2021 / Accepted: 1 December 2021 / Published: 9 December 2021

Abstract

:
The main problem with electricity supply on densely populated islands is reliable, low-carbon, and sustainable electricity. The availability of potential energy needs in-depth observation to ensure that the system can be built sustainably. This paper examines the integration of PV systems and diesel power systems on Karimunjawa Island to meet the need for reliable systems from economic, ecological, and technological aspects. Using the DigSilent Power Factory program to obtain the system response interference and penetration of the Photovoltaic (PV) system. Furthermore, this paper also tests short circuit analysis and economic feasibility analysis while validating the Levelized Cost of Electricity (LCOE) and Electric Production Cost (EPC) approaches. The results show that the availability of irradiation can handle the electricity needs on Karimunjawa Island. In addition, it proposes the designed requirements for an integrated PV power system and Diesel Power Plant (DPP) system. The research has also captured the synergistic profile of PV and DPP working coordination within 24 h.

1. Introduction

Karimunjawa is an Indonesian archipelago in the Java Sea. Economic growth that is not high but is one of the islands of tourist visits, then the island of Karimunjawa becomes more attention from the central government. One of the government’s goals is to improve energy efficiency through energy diversification on the island of Karimunjawa Therefore, in this article, an in-depth observation was carried out regarding the characteristics of energy needs and the potential of new renewable energy sources on the island of Karimunjawa. And the energy optimization aspect of a hybrid-based system on a small island is a priority challenge. Several analyzes were performed in this research, including power flow analysis, short circuit analysis, Levelized Cost of Electricity (LCOE) calculation analysis, and Electric Production Cost (EPC).
Currently, all electricity production on Karimunjawa Island is supplied from the Diesel Power Plant (DPP) system with a capacity of 2 × 2.7 MW. The increasing price of diesel fuel causes the cost of production to be very high, reaching 0.464 $/kWh. This reason was a consideration for Grid system in Karimunjawa.
Karimunjawa to try to reduce the cost of production. In line with the central government’s plan, that the addition of this renewable energy plant has started running a renewable energy program with a target of 23% by 2025 [1]. Therefore, a low-cost hybrid-based Intermittent generator reduces the cost of producing electric power [2]. DPP hybrid power plants with Photovoltaic (PV) systems were believed to reduce production costs [3].
The Photovoltaic (PV) system is an energy source that is environmentally friendly and inexpensive because it does not require fuel for its generation [4]. PV system is widely recommended as a feasible system of an integrated power plant [5]. However, the use of PV in large quantities and the long term [6] will contribute to serious environmental problems in the future [7]. These severe problems have an immediate and long-term impact on the environment. There are two sources of problems from the PV system: the high carbon emissions during the solar panel production process at the factory. Then there is no technology for recycling waste solar panels that can no longer be used. We believe that scientists have not found a solution to decomposing waste solar panels that are no longer used [8].
The PV penetration analysis is a method used to determine the feasibility level of the system as a power plant [9] and to determine the economic value of the PV system [10]. In addition, the existing DPP system needs to be analyzed to calculate the PV system by considering the various PV penetrations. Therefore, this paper proposed a hybrid-based power generation system (PV & DPP) in a case study on Karimunjawa Island, Indonesia.
We have carried out several tests in this work. First, the simulation of PV penetration at an extreme value of 75% and analyzed the system’s response. Second, investigation on the penetration relationship from 0% to 100% of energy production costs. In addition, it presents that each system works synergistically for 24 h by adjusting the characteristics of daily electrical loads and features of available energy sources with the availability of energy sources from DPP systems, PV systems, battery discharge, and battery charging. The Levelized Cost of Electricity (LCOE) and Electric Production Cost (EPC) calculate economic feasibility. Finally, we have tested the penetration of 10% to 100% to get the optimization value on the generating system. We have tested the penetration of 10% to 100% to get the optimization value on the generating system. The DigSilent Power Factory program is used to analyze the system’s response to a 75% reduction in solar radiation.
The performance of the generating system is represented based on the index value of the analysis results. Load flow simulation determines the voltage at each end of the feeder and losses in the generator system model. In contrast, the short circuit ratio simulation is used to determine the breaking short-circuit current (Ib) or the passable limit of the critical current value. Transient simulation is used to determine the value of frequency stability when the condition is intermittent or the loss of photovoltaic (PV) generators at low loads or when clouds cover the solar panels.
The next research plan is, we will offer a hybrid system involving several new renewable energy sources such as Oscillating water column (OWC) for low ocean wave energy extraction, power wind system, solar collector system
The main goal of this study is to design and analyze the integrated DPP system and PV system model. Therefore, exploration and analyzing the response of the PV system to variations in radiation penetration in the solar module to obtain a reliable system based on load characteristics and the existing DPP system.

2. Background Theory

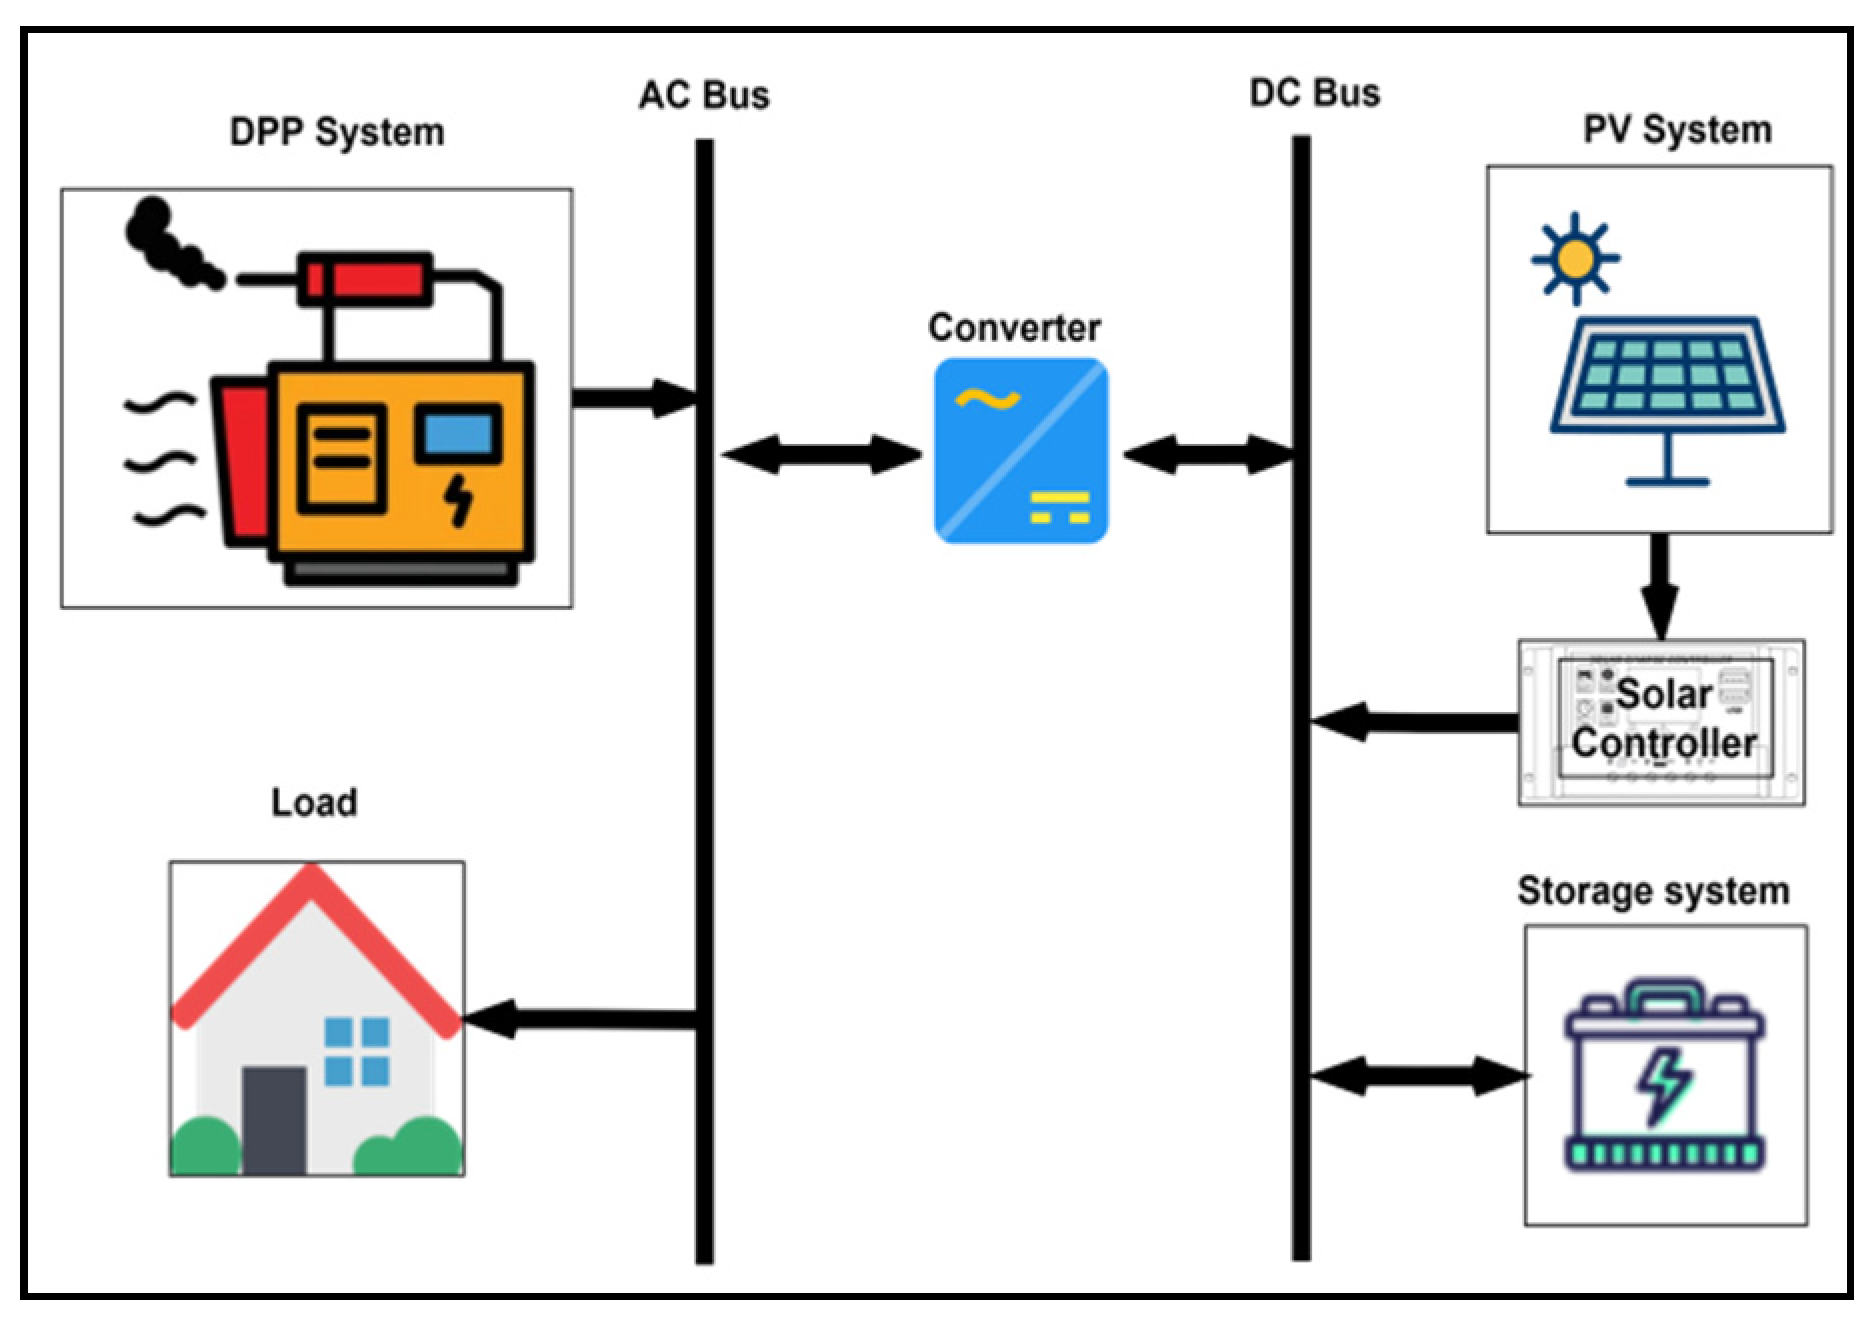
2.1. Hybrid Power Generation

A hybrid system uses two or more power plants with different sources [3] in a rural area, and a hybrid system is a way out to meet electricity needs [11]. Hybrid systems are part of energy diversification. So in the general case, the primary purpose of the hybrid system is basically that in power systems with multiple sources. It could be said that there is a cross-subsidization or symbiosis-mutualism system. One system to another fulfills each other alternately or together, either simultaneously or at a partial time.
The hybrid system is a solution to increase the generated and achievable power capacity and reduce carbon production [12]. Although several researchers have conducted studies on different energy sources in hybrid PV-diesel systems [13], hydro-PV [14], the main problems of hybrid systems are control and power quality.

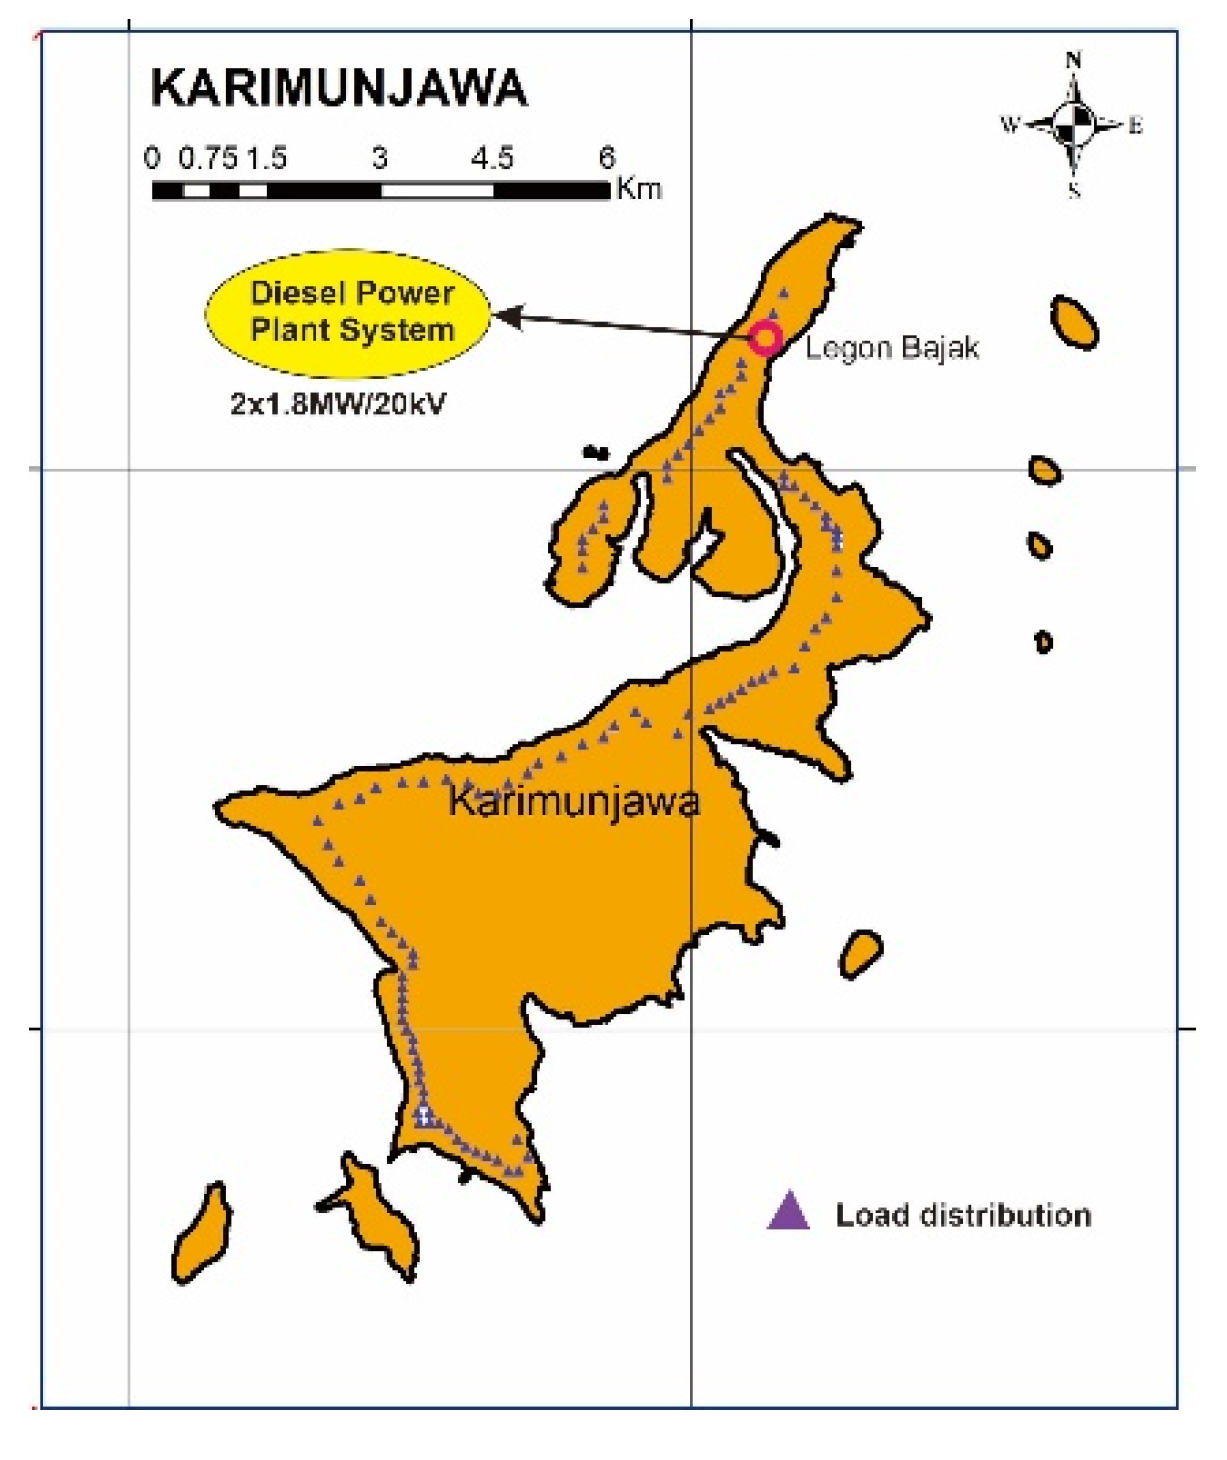
2.2. Diesel Power Plant (DPP) System

Diesel Power Plant (DPP) system is the most commonly used generation technology for electric power systems in remote islands [2]. Diesel generators operate most efficiently at a given load, generally 65–80% of maximum capacity [15]. Island power plants are typically designed to meet various demands while keeping the generator as close to load as possible. The DPP system is currently a problem due to the high cost of procuring diesel fuel. For the size of a small island, DPP can contribute to increased carbon pollution, namely 1 kg to 5 kg CO2/liter [16] or 148.5 kg CO2/h [17], noise pollution at up to 96 dB [18], so it can reduce the comfort to humans around. At the same time, the island power plants are generally designed to meet various demands while keeping the generator as close to the load as possible. This technique provides higher efficiency and provides backup power to meet increasing needs.
The DPP system works because the engine burns fuel and converts chemical energy into heat energy (wasted heat) and rotational energy. The machine is attached to an alternator which converts rotational kinetic energy into electrical energy. Diesel generators operate most efficiently at a given load, generally 62–63% [19].
Many stationary power-generation units use diesel engines because of their high torque output, size flexibility, durability, and fuel efficiency [20]. When diesel engines are coupled to a synchronous machine and run in parallel with renewable energy sources in remote communities in Canada [21], the most demanding application provides light and energy services to small communities. The following expression gives a diesel generator’s hourly energy output (EDEG) as Equation (1) [22]. Where the EDEG is the energy output hourly from DPP (Wh), PDEG is a rate of power output (watts), ηDEG is the diesel generator efficiency (%).
E ( D E G ) ( t ) = P ( D E G ) ( t ) η ( D E G )
An inverter and rectifier module are combined in the converter unit. Batteries and PV systems are connected to the DC bus, while diesel generators are connected to the AC bus and then to the system loads. The dummy load system converts the excess power generated by the diesel generator into a charge sent to the battery. In addition, the diesel generator will charge the battery, and Equation (1) represents the model of the rectifier.

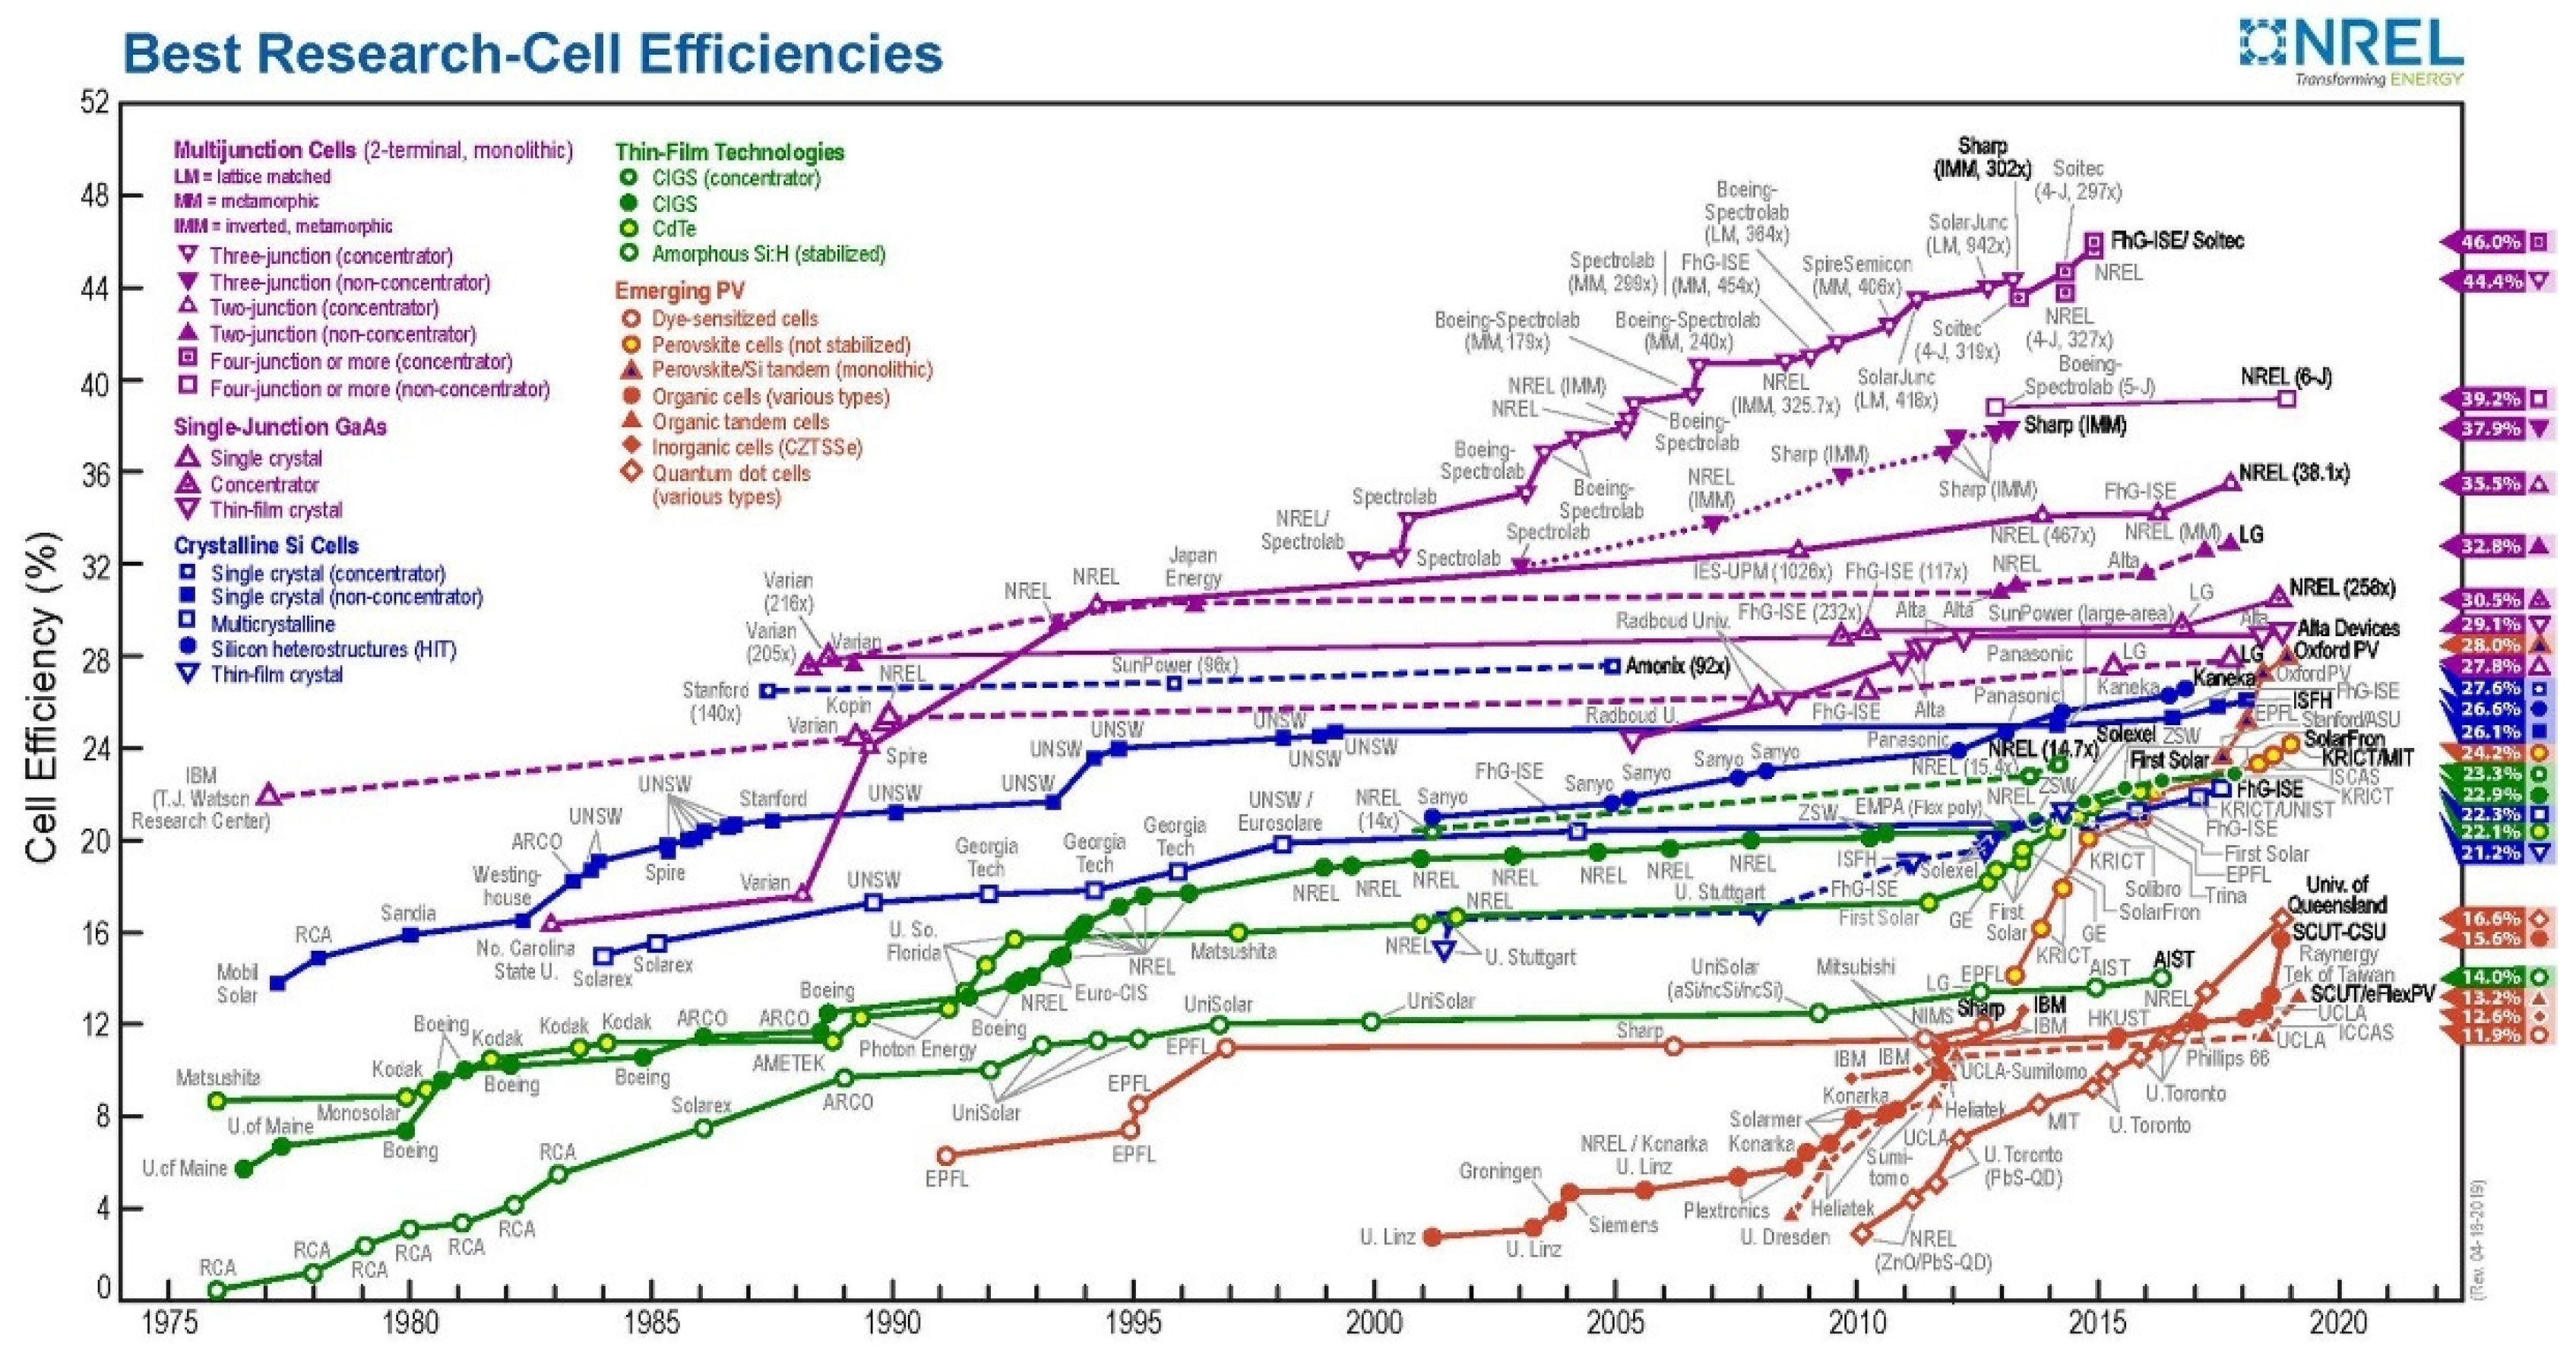
2.3. Photovoltaic (PV) Power Plant System

PV system is a power generation system that converts photons from the sun into electricity using photovoltaic wafers [23]. In Indonesia, Photovoltaic (PV) power plant systems are currently experiencing a high use trend. The PV system is one of the major government programs to increase the Renewable Energy (RNE) percentage for primary energy availability [24]. The high use of PV systems then impacts the decrease in installation costs and the cost of solar panel modules. Based on the report from the Ministry of Energy and Mineral Resources of the Republic of Indonesia. Many researchers have estimated the decrease of PV system plan cost, from the initial cost of 1329 $USD/kWp in 2014 to 362 $USD/kWp in 2050, or a decrease in installation costs 40% to 75% [25]. One of the plausible reasons for this decline is consumers’ high demand for solar systems in the last five years. Figure 1 shows the development of the study on PV (1975–2020) from the National Renewable Energy Laboratory (NREL). The evolution of PV since 1975 has made significant progress. Starting with thin-film type PV with an efficiency of less than 10%, then progressing to Crystalline Si Cells type PV starting at around 15% efficiency (1977), and then multijunction type PV Cells starting at around 16% efficiency (1983), Emerging PV started at efficiency 5% (1991). Then in 2015, all types of PV experienced an efficiency increase. Multijunction cell type PV in particular (three-junction concentrator) reached 46% [26].
The daily energy in hourly (EPVG) that is produced from solar radiation can be calculated by Equation (2) [22]. The EPVG(t) is energy output hourly from PV system (Wh), G(t) is the hourly irradiance in (kWh/m2), A is the surface area in (m2), P is the PV penetration level factor, ηPVG the efficiency of PV generator (%).
The primary considerations why PV systems are suitable to be implemented in Indonesia. Because solar energy is available in large quantities in Indonesia, diversification, and distribution of power allow it to be built in remote areas because it does not require energy transmission or transportation of energy sources [27]. The calculation of solar radiation with wave characteristics such as wavelength (λ) is inversely proportional to the photon’s energy [28].
The energy produced from the inverter (kWh) is calculated by Equation (3) [22], where EPVG-IN(t) is the hourly energy output from inverter in (kWh), EPVG(t) is the hourly energy output of the PV generator ηINV is the efficiency of inverters.
E P Y G ( t ) = G ( t ) A P η P Y G
E P Y G I N ( t ) = E P Y G ( t ) η I N V

2.4. Power Storage System

Power storage in hybrid systems generally uses a Battery Cell Unit (BCU) [29] equipped with an energy management system with an intelligent approach to cope with peak loads [30]. In this case, the battery capacity B c a p in (Ah) is calculated using Equation (4) as in [29], where I is the current capacity (A), and t is the operating time (hours). Bcap can also be calculated based on the operational energy requirements of the installed load. In addition, it is also necessary to pay attention to the current capacity of the IBCU (A), where the current capacity of the IBCU (A) must be greater than the output current from the solar panel (ImaxPanel) [31], so the battery current capacity IBCU is mathematically expressed in Equation (5) [31].
B c a p = I t
I B C U > I max P a n e l
Equation (6) is the equation to calculate the energy output of the inverter where EBAT-INV(t) [22] is the hourly energy output from the inverter in case of battery (kWh), EBAT(t − 1) is the energy stored in battery at hour 1 (kWh), ELOAD(t) is the hourly energy consumed by the load side, kWh, η I N V is the efficiency of the inverter (%), and η D C H G is the battery discharging efficiency (%) and battery bank was calculated by Equation (4).
E B A T I N V ( t ) = [ ( E B A T ( t 1 ) E L O A D ( t ) ) η I N V η D C H G ]

2.5. Power Flow Analysis and Short Circuit Ratio (SCR)

Load flow studies are used to determine voltage, current, active power, or reactive power at various points/buses on the power grid under normal operating conditions [2]. The reliability of a hybrid-based power system is tested for short circuits in the system [32], or on the inverter module [33], in the distribution network [34], so that losses, voltage regulation, electricity production costs, and Short Circuit Ratio (SCR) are recognizable. This test was carried out on a simulation model using the Dig Silent Power Factory program. SCR is defined as the ratio of the short-circuited MVA at the interconnect point (before generator interconnection) to the MW of the interconnect generator. SCR is used to measure the power of the electric power system concerning the generator interconnection [35]. The lower the SCR, the weaker an electric power system is. Vulnerable systems become more prone to problems when a hybrid power plant with a fast controller is connected to the primary power system. SCR in the range of 2–20 is used as a rule of thumb [2]. Where, I S C R is the max current limit on the response of the current breaker module (A) [34], Sc is the apparent power capacity of the interconnect points (MVA), P g is the active power capacity of the interconnect generator (MW).
I S C R = S c P g

2.6. Levelized Cost of Energy (LCOE) and Electric Production Cost (EPC)

Measured energy costs or LCOE are similar to the concept of energy system returns. However, instead of measuring how much is required to cover the initial investment. The LCOE determines how much to pay per unit of electricity (kWh). Includes initial capital investment, maintenance costs, fuel costs for the system (if any), all operating costs, and discount rates. LCOE, in this case, can be calculated using Equation (8) [36]. Where it is the investment in year t, Mt is the cost of operation and maintenance in year t, Ft is the cost of fuel in year t, Et is the electrical energy produced in year t, r is the discount rate, and n is the life of the system. (years). Electric Production Cost (EPC) is the average cost of generation in a power system. In the power system at Karimunjawa, there is only one type of power plant, namely Hybrid generators. Therefore the EPC can be said to be the same as the LCOE value [36].
LCOE is calculated using Equation (8) [36,37], where It is the investment expenditures in year t (including financing). Mt is the operations and maintenance expenditures in a year (t). And Ft is the fuel expenditures in a year (t). It is the electrical energy generated in (t). r is the discount rate, and n is the assumed useful life of the system.
L C O E = t n = 1 I t + M t + F t ( 1 + r ) t t n = 1 E t ( 1 + r ) t

3. Materials and Methods

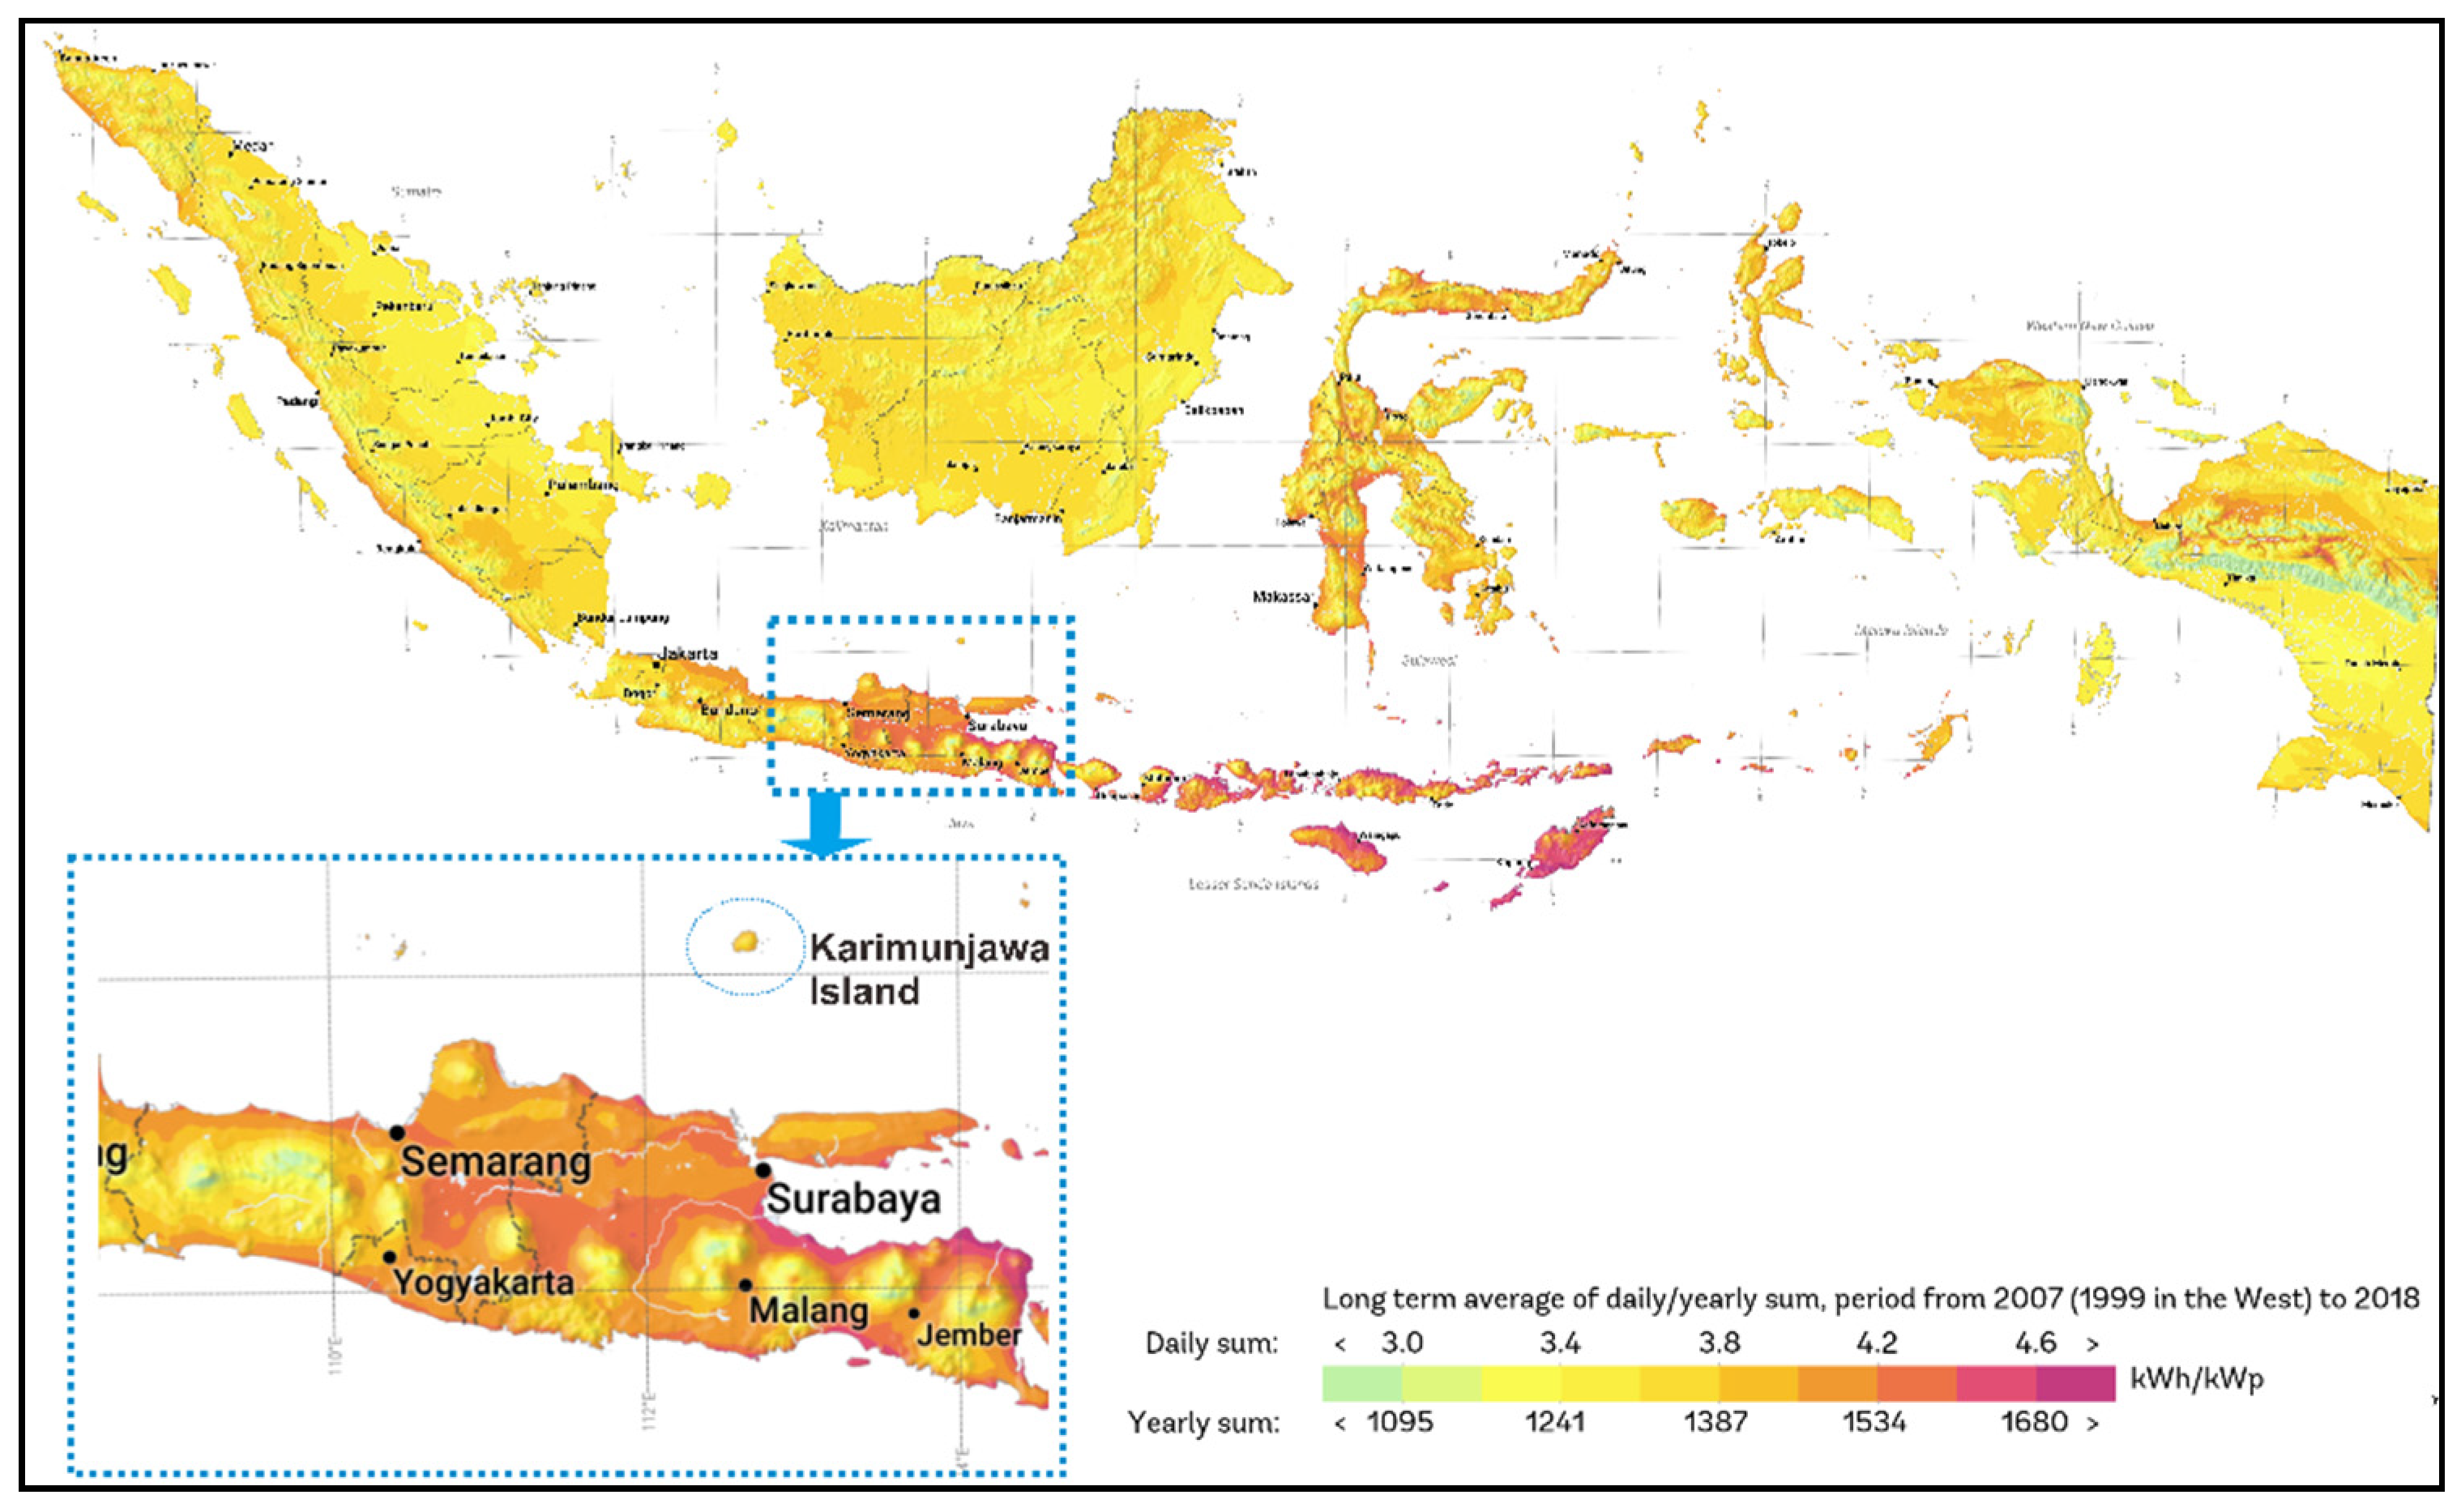
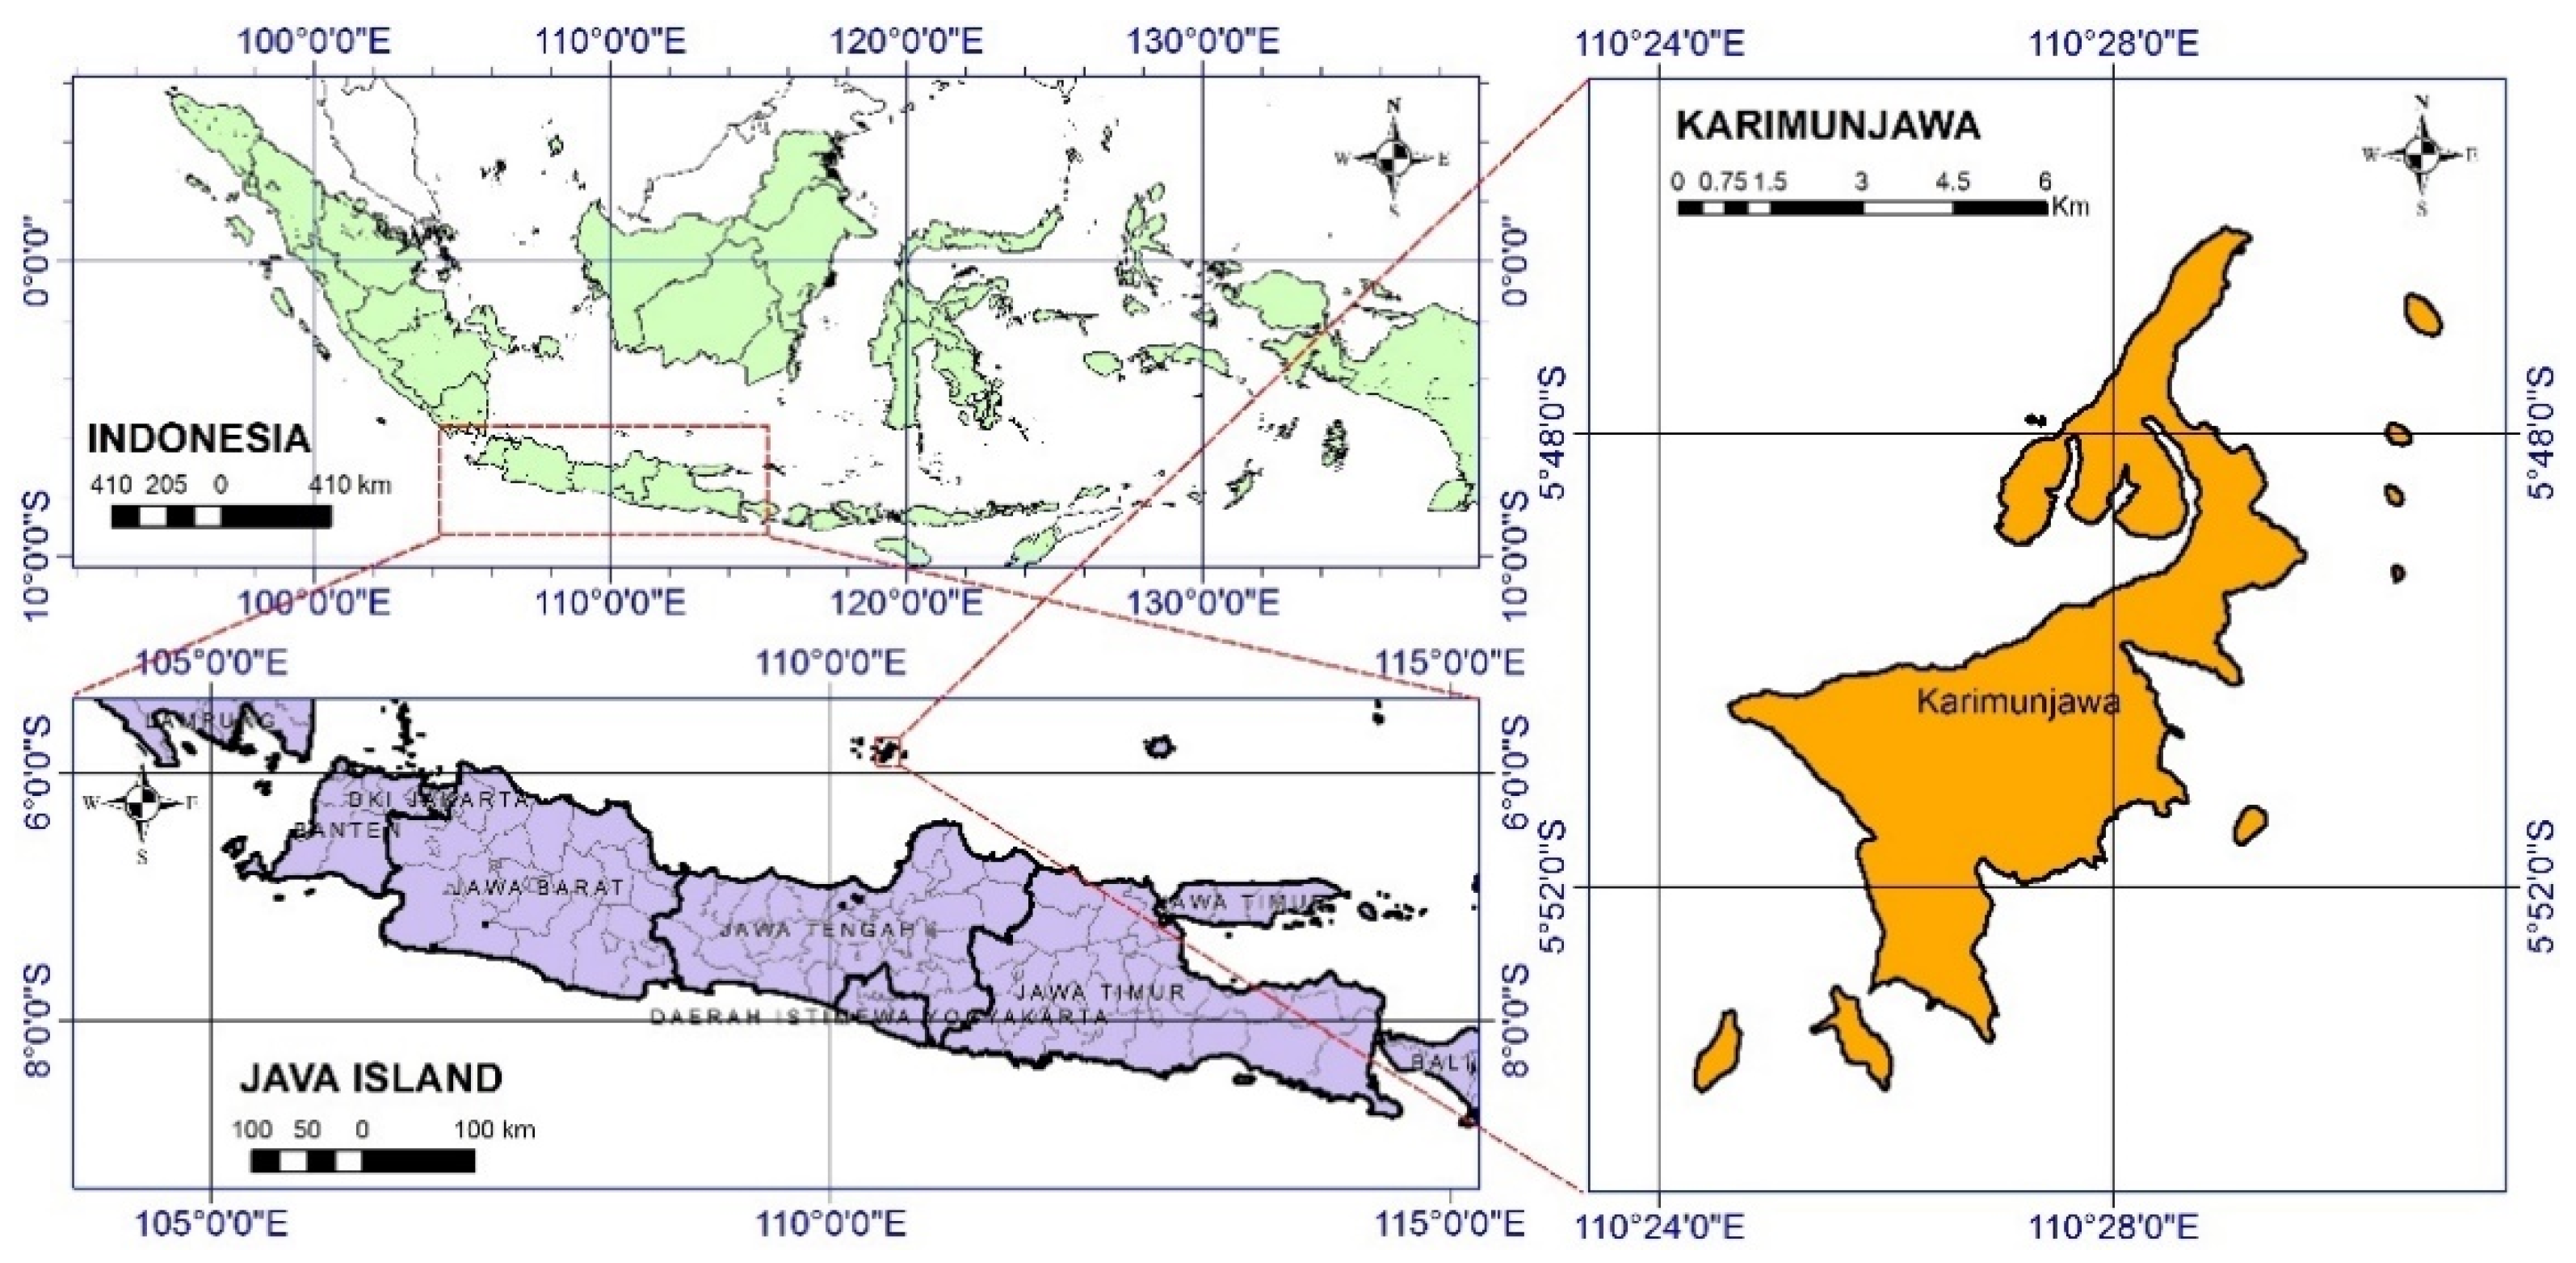
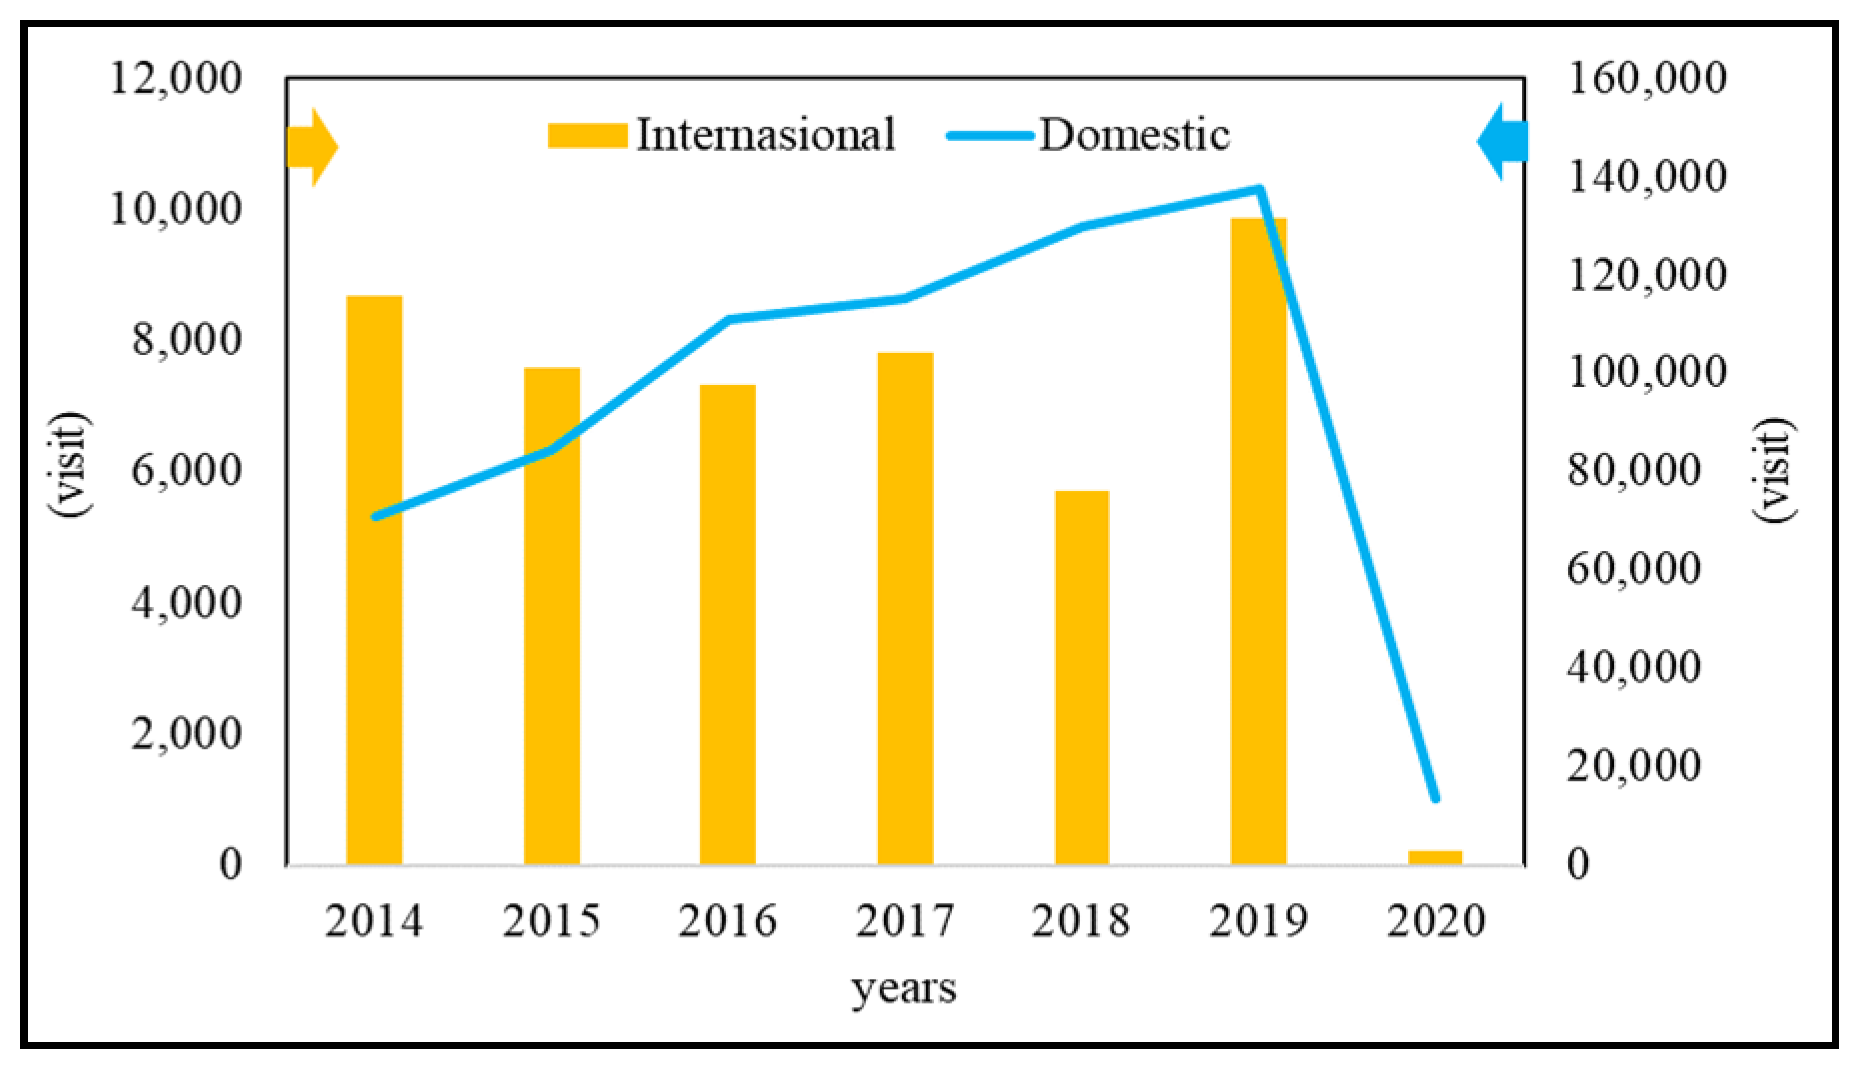
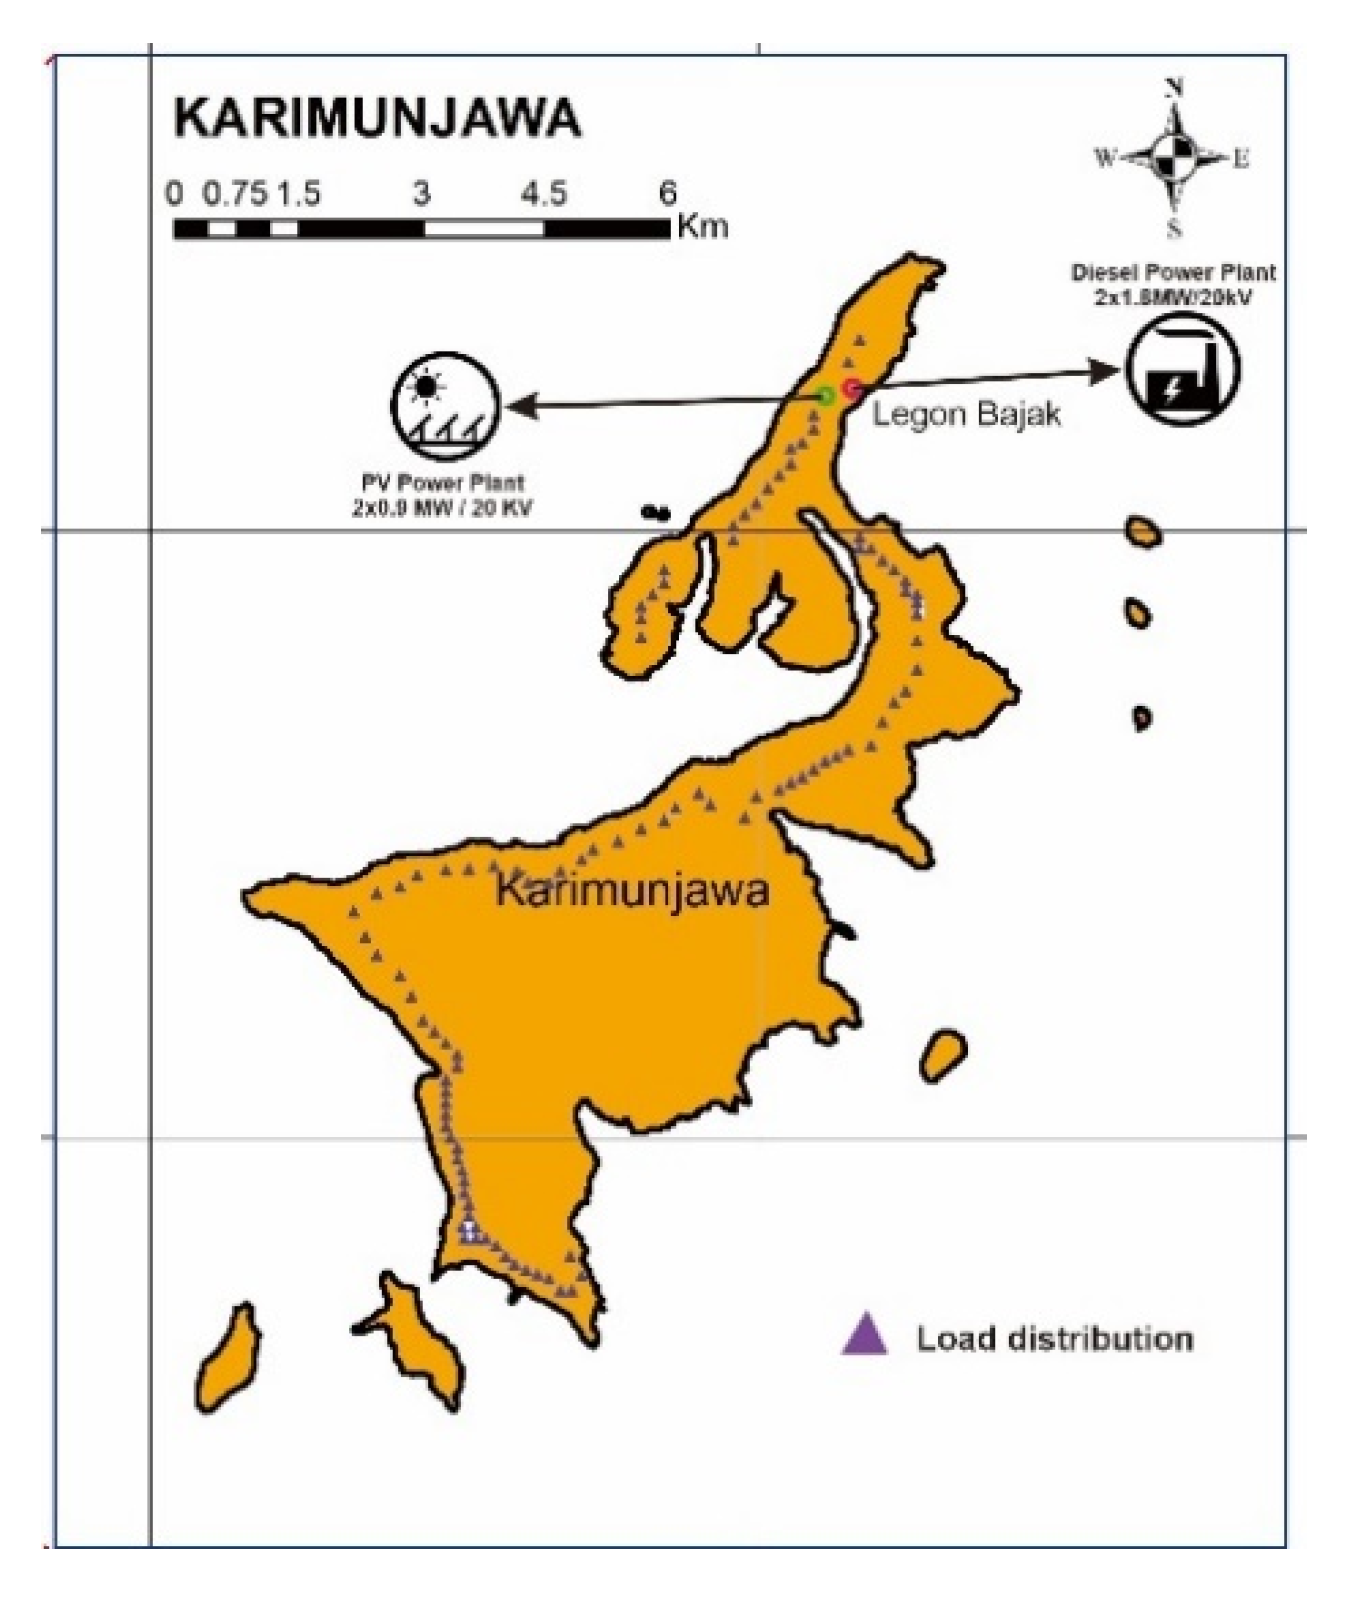
3.1. Karimunjawa Island

Karimunjawa Island is located in the northern part of the Java sea 50 km from Jepara Regency, Central Java, coordinates −5.847193, 110.443920 with total coverage area is 71.2 km2. The distance from Jepara to Karimunjawa Island is about 3 h by boat (see Figure 2). in Karimunjawa, 25 tourist attractions are favorite tours for domestic and international tourism. The superior products of the Karimunjawa Island are marine tourism objects, culinary delights, and views from small islands around which are not the same as other islands in Indonesia. Figure 3 shows that the existing DPP system location in Karimunjawa Island.
Based on the annual report on tourist visits from The Ministry of Tourism and Creative Economy Indonesia in 2014–2020 [38], the number of tourist visits to Karimunjawa Island experienced a positive trend from 2014 to 2019. Then due to the COVID-19 pandemic, there was a negative trend in 2020 (see Figure 4).
The location of the DPP system is Legon Bajak in the north of Karimunjawa Island [39], as seen in Figure 5, with a capacity of 2 × 1.8 MW/20 kV. We have observed daily solar irradiation data on the island of Karimunjawa through visual capture by satellite using the Homer Energy program. We were using linear regression based on data on electricity usage characteristics from 2017–2018.
Solar irradiation data in Karimunjawa Island uses historical data from NASA’s prediction of Worldwide Energy Resource (POWER) database in a range of 30 years (January 1984 to December 2013). Meanwhile, the wind speed data from the region used the data collected in 22 years range (July 1983 until June 2005) at the height of 50 m above the earth’s surface. Homer Energy is used to capture irradiation data and wind speed.

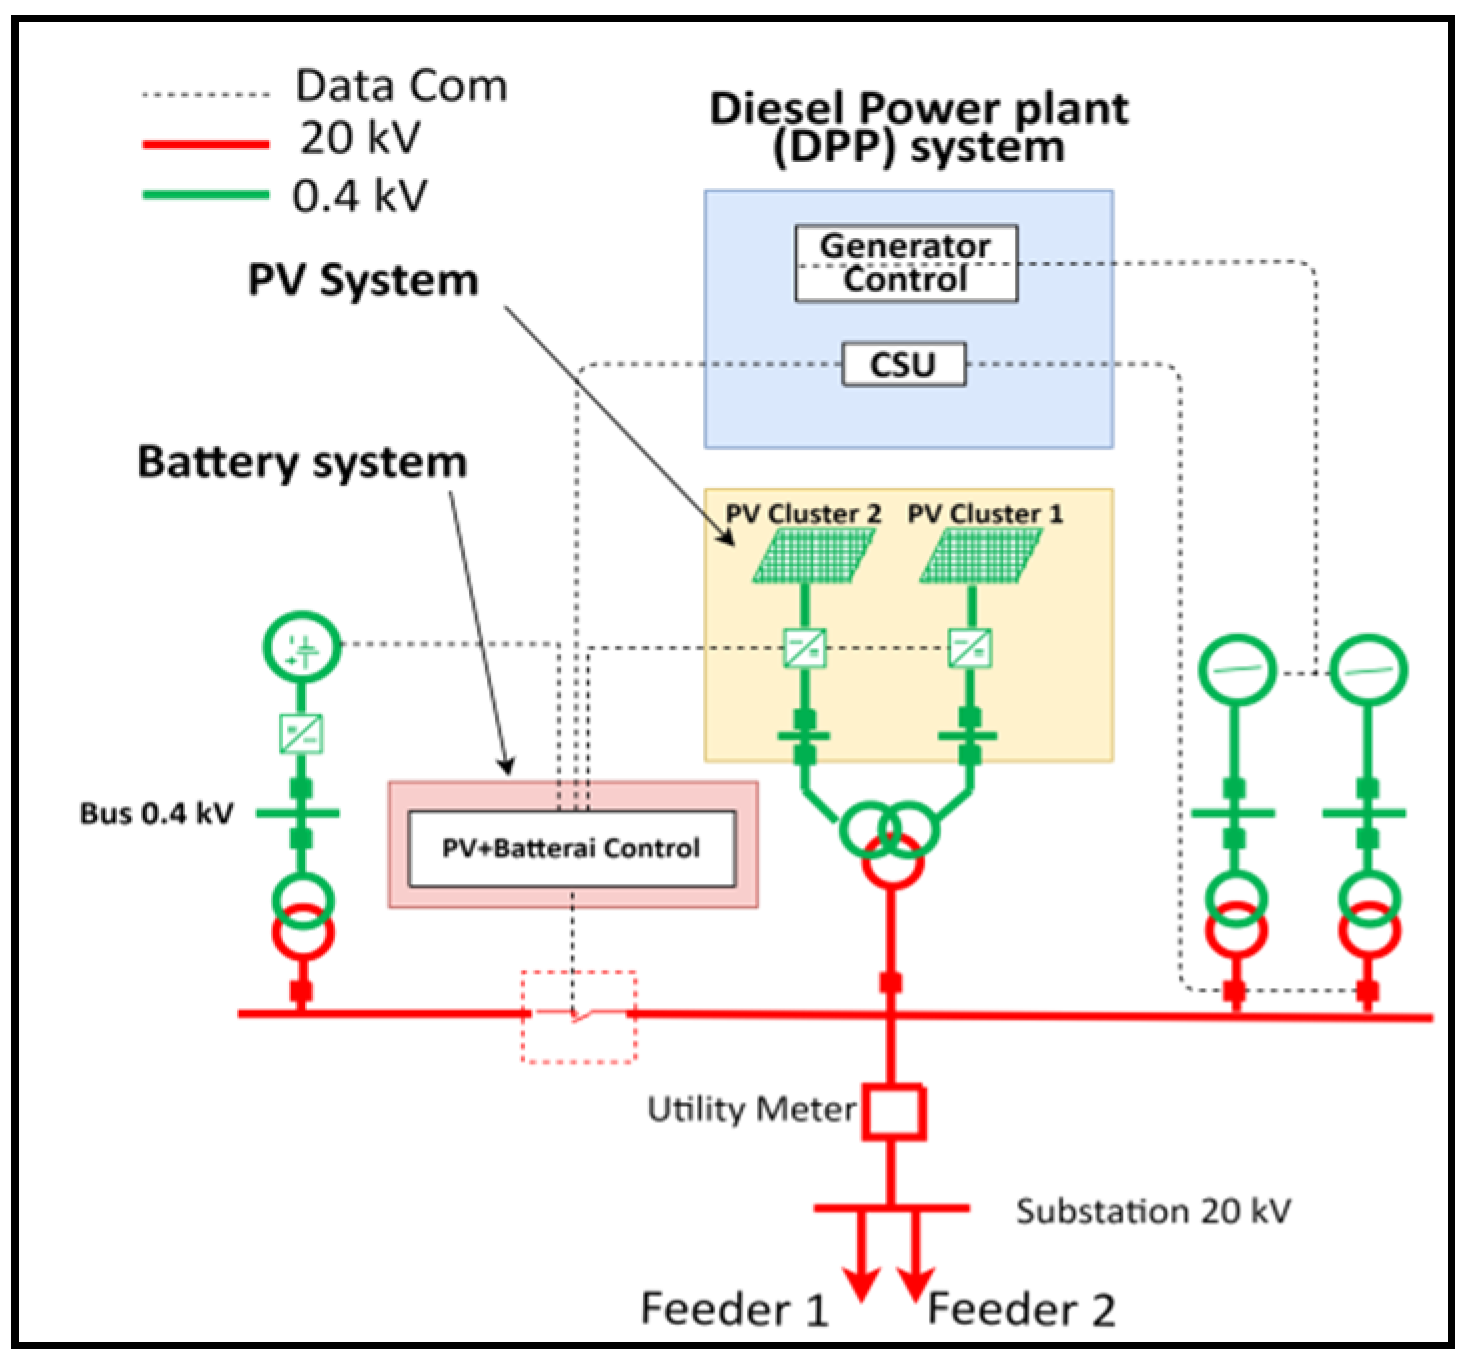
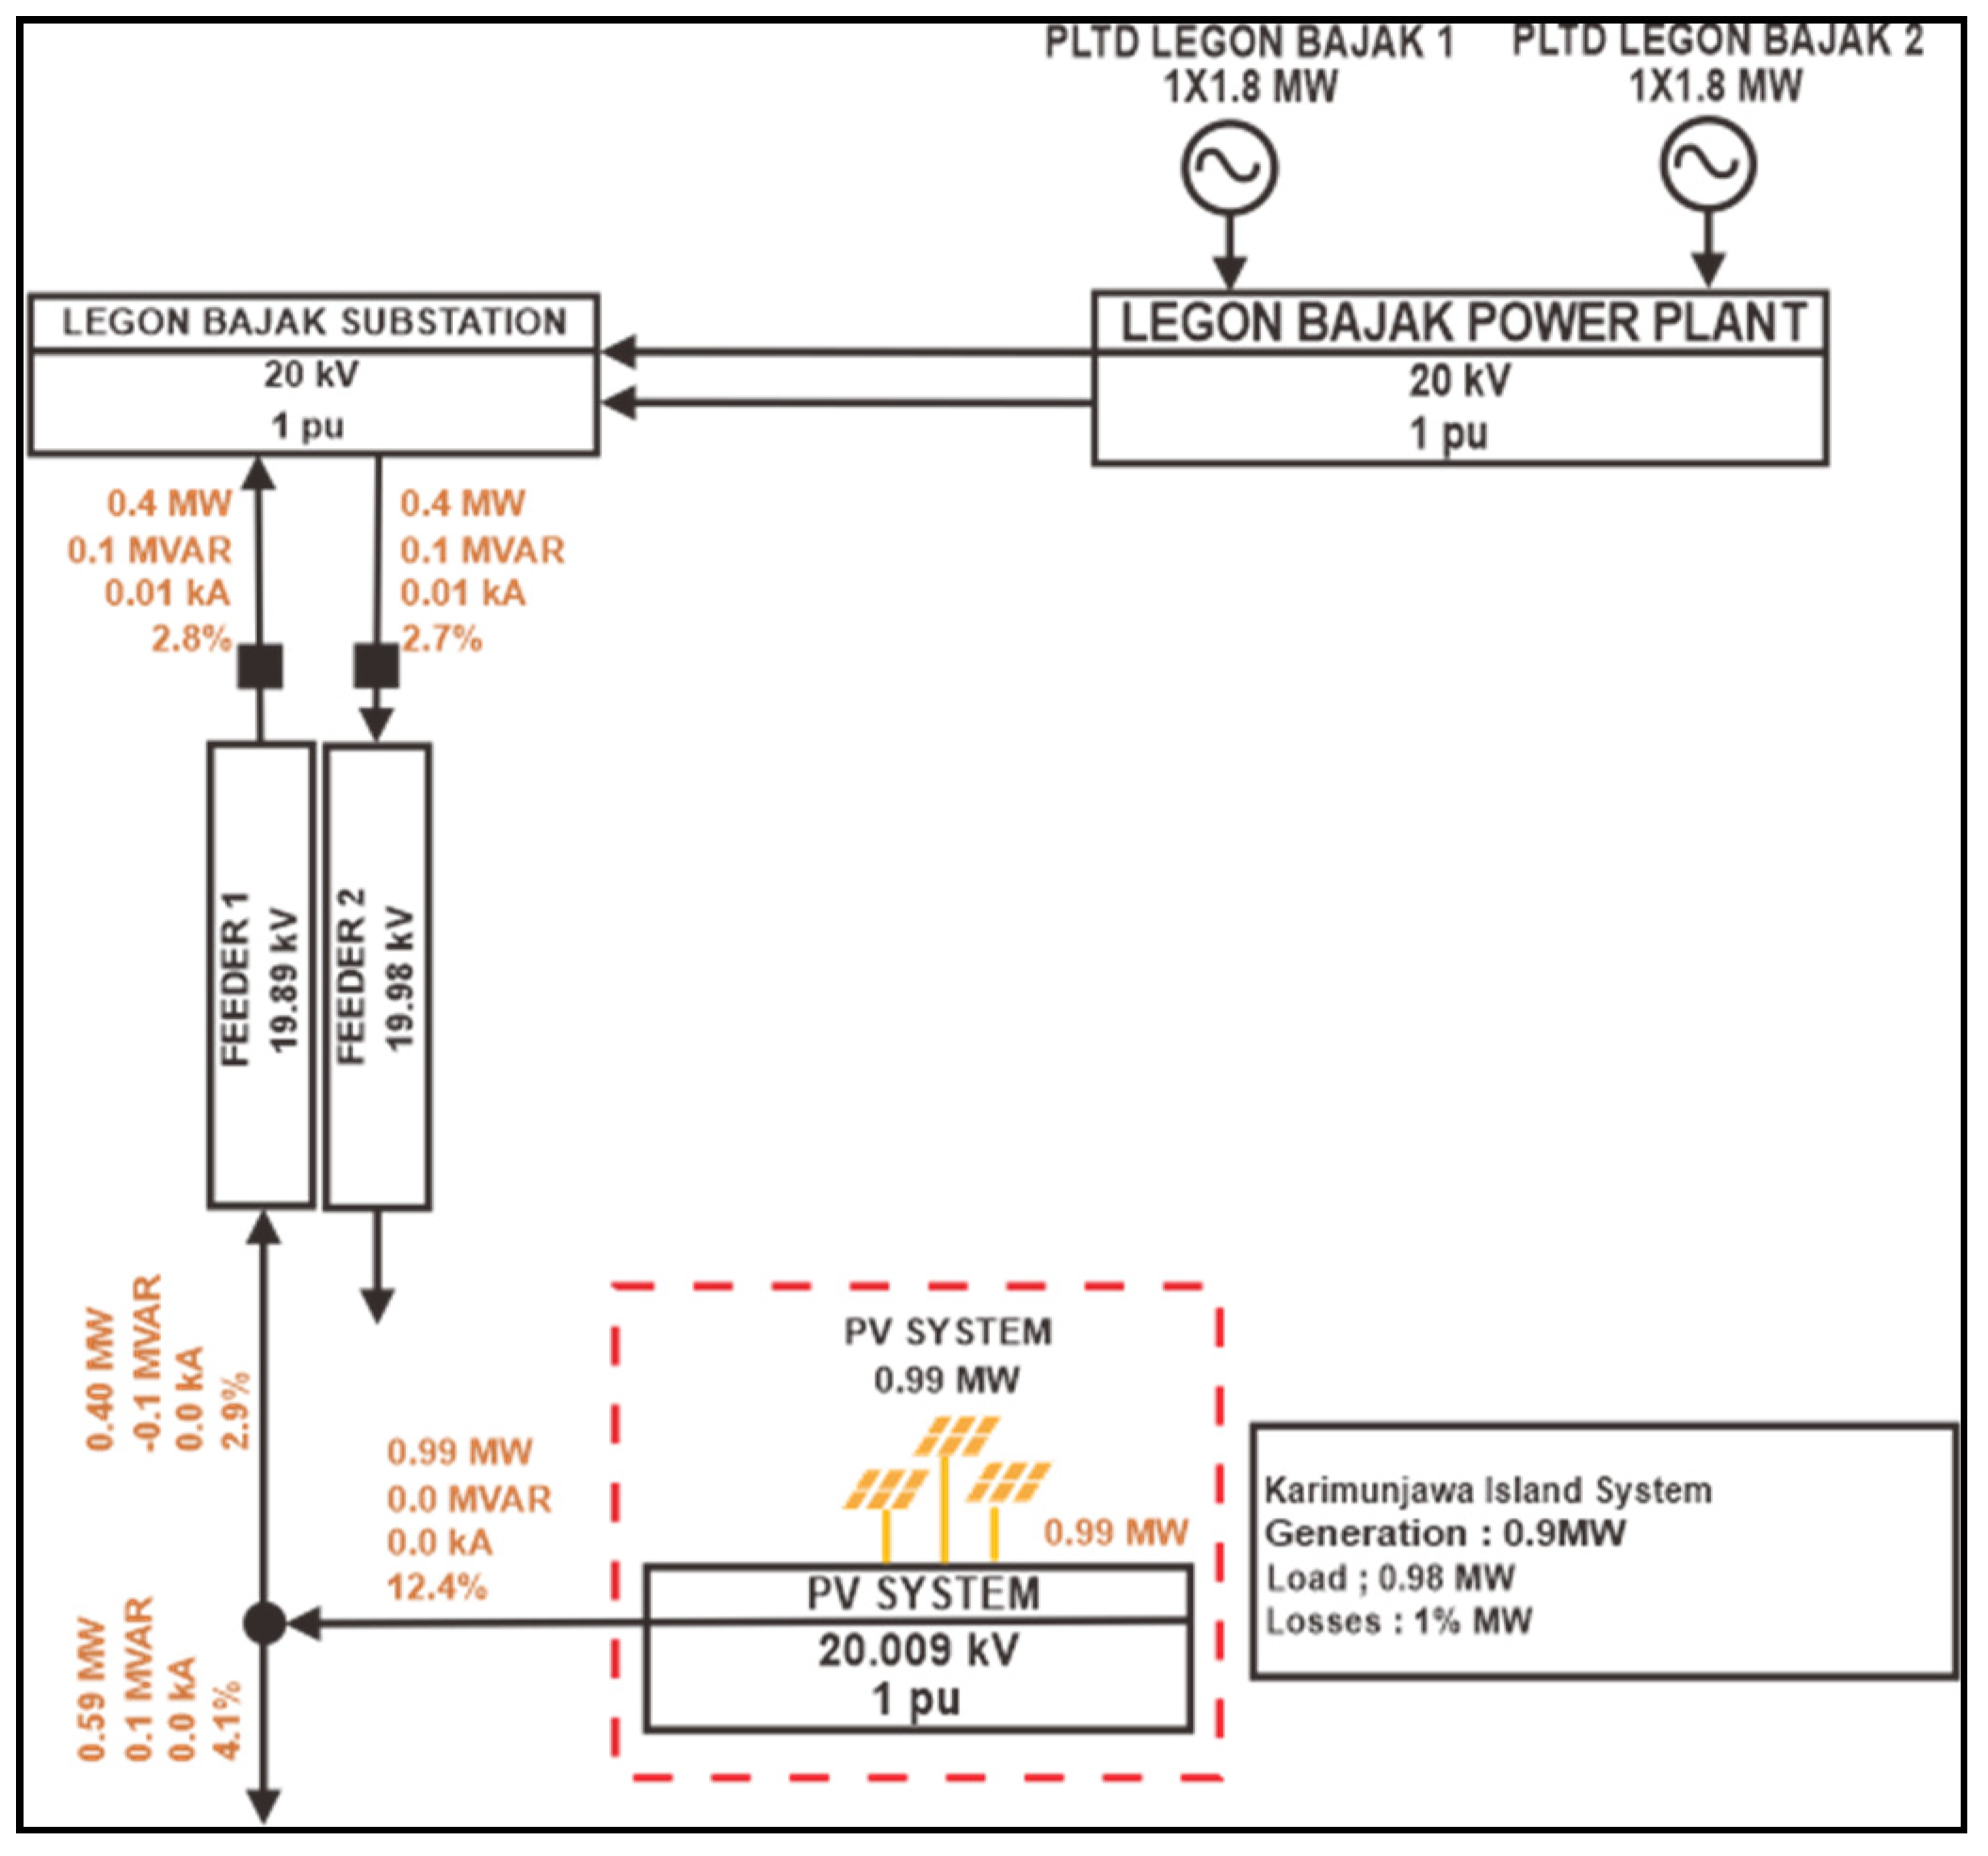
3.2. Power System Model and Scenario

The Karimunjawa Island electricity system is a stand-alone electricity system without interconnection with Java Island, Central Java. Electricity on the island of Karimunjawa is supplied from the DPP Legon Bajak system. The electrical network diagram of the Legon Bajak DPP system is shown in Figure 5. It appears that the DPP system capacity is 2 × 1.8 MW/20 kV to supply power to Feeder 1 (19.87 kV) and Feeder 2 (19.86 kV). The average load is known to be 0.98 MW, with losses of 1.01%.
There is a tendency that the use of electricity is increasing every year on the island of Karimunjawa. In contrast, solar energy in the islands of Karimunjawa has not yet been used as the main power plant, apart from the existing DPP system. Therefore, we propose a hybrid system consisting of a DPP system and a PV system. Thus, the natural potential will optimally supply the electricity availability and support the available DPP system energy sources.
We propose the concept of a hybrid on-grid system as the line diagram of the system show Figure 5. The hybrid system consists of a PV system to supply electricity to the existing grid. The DPP system is also still used as a primary power source. In addition to providing electricity to the load, the PV system can also charge the power storage system simultaneously. During the day, the solar panels charge the battery and deliver the load. Then in the afternoon, the load system is powered by batteries. At night until the morning, the load system is supplied by the DPP system. When there is intermittency, the battery system will provide power to the system. The proposed hybrid system concept consists of the DPP and PV systems connected to a single bus, the Legon Bajak Power Plant. In the Karimunjawa electrical system, the configuration of the PV system is made of 2 clusters with a capacity of 0.99 MW/20.09 kV (see: Figure 6), with the aim that when a disturbance occurs in one of the PV modules, the PV system can still work with supply from the PV module cluster. The operating pattern on the Karimunjawa system is that the DPP system will perform at night or when the load is peaked, while the PV system works during the day or at low loads. A generator system will regulate the switch from the DPP system to the PV system. The generator system has been set according to the specified operation mode.
During the day, when the PV has excess energy, the PV and battery control will command the switch to ON so that the power from the PV can charge the battery. In this condition, the battery does not function as full storage but as intermittency and frequency control. Thus, the battery will only work when the DPP system changes to PLTS and PLTS to the DPP system and when a disturbance causes the PV power to decrease, for example, when clouds cover the PV.
The number of PVTOT requirements is calculated using Equation (9) as in [40], where NModul is the number of solar panel modules (11) [40], NString is the number of strings in one array (12) [40], and NArray is the number of arrays (13) [40]. Vidc is converter output voltage (V), Current converter output voltage ( V i ), Vu is DC voltage to obtain AC voltage, and Ma is Constanta of inverter modulastio index, in this case, Ma = 0.9. Vmpp is the maximum output voltage of the solar panel (volt). PA is the power produced by one array (Watts). Pstring is the overall string power (Watts). Solar field area requirements (PVArea) are calculated using Equation (14) [40], APV is the area of PV modules per unit (m2), including the operational area, generally requiring additional space of 1 m2/module.
P V T O T = N M o d u l N S t r i n g N A r r a y
N M o d u l = V i d c V m p p
V i d c = 2 2 V u 3 M a
N S t r i n g = P a P S t r i n g
N A r r a y = P p l t s P a
P V A r e a = P V T O T A P V 1000
The delay in PV performance degradation caused by blocking from the cloud can be seen through Equation (15) [40]. Where t is the power drop time from 100% to 25%, PPV is the PV power (watts), ζ is the PV performance drop (%), m is the power drop gradient (MW/s). The value of m is calculated using Equation (16) [40], where Vw is the wind speed around PV (m/s), and a is the available PV field area (m2).
t = P P V ζ m
m = P P V a V w

4. Result and Discussion

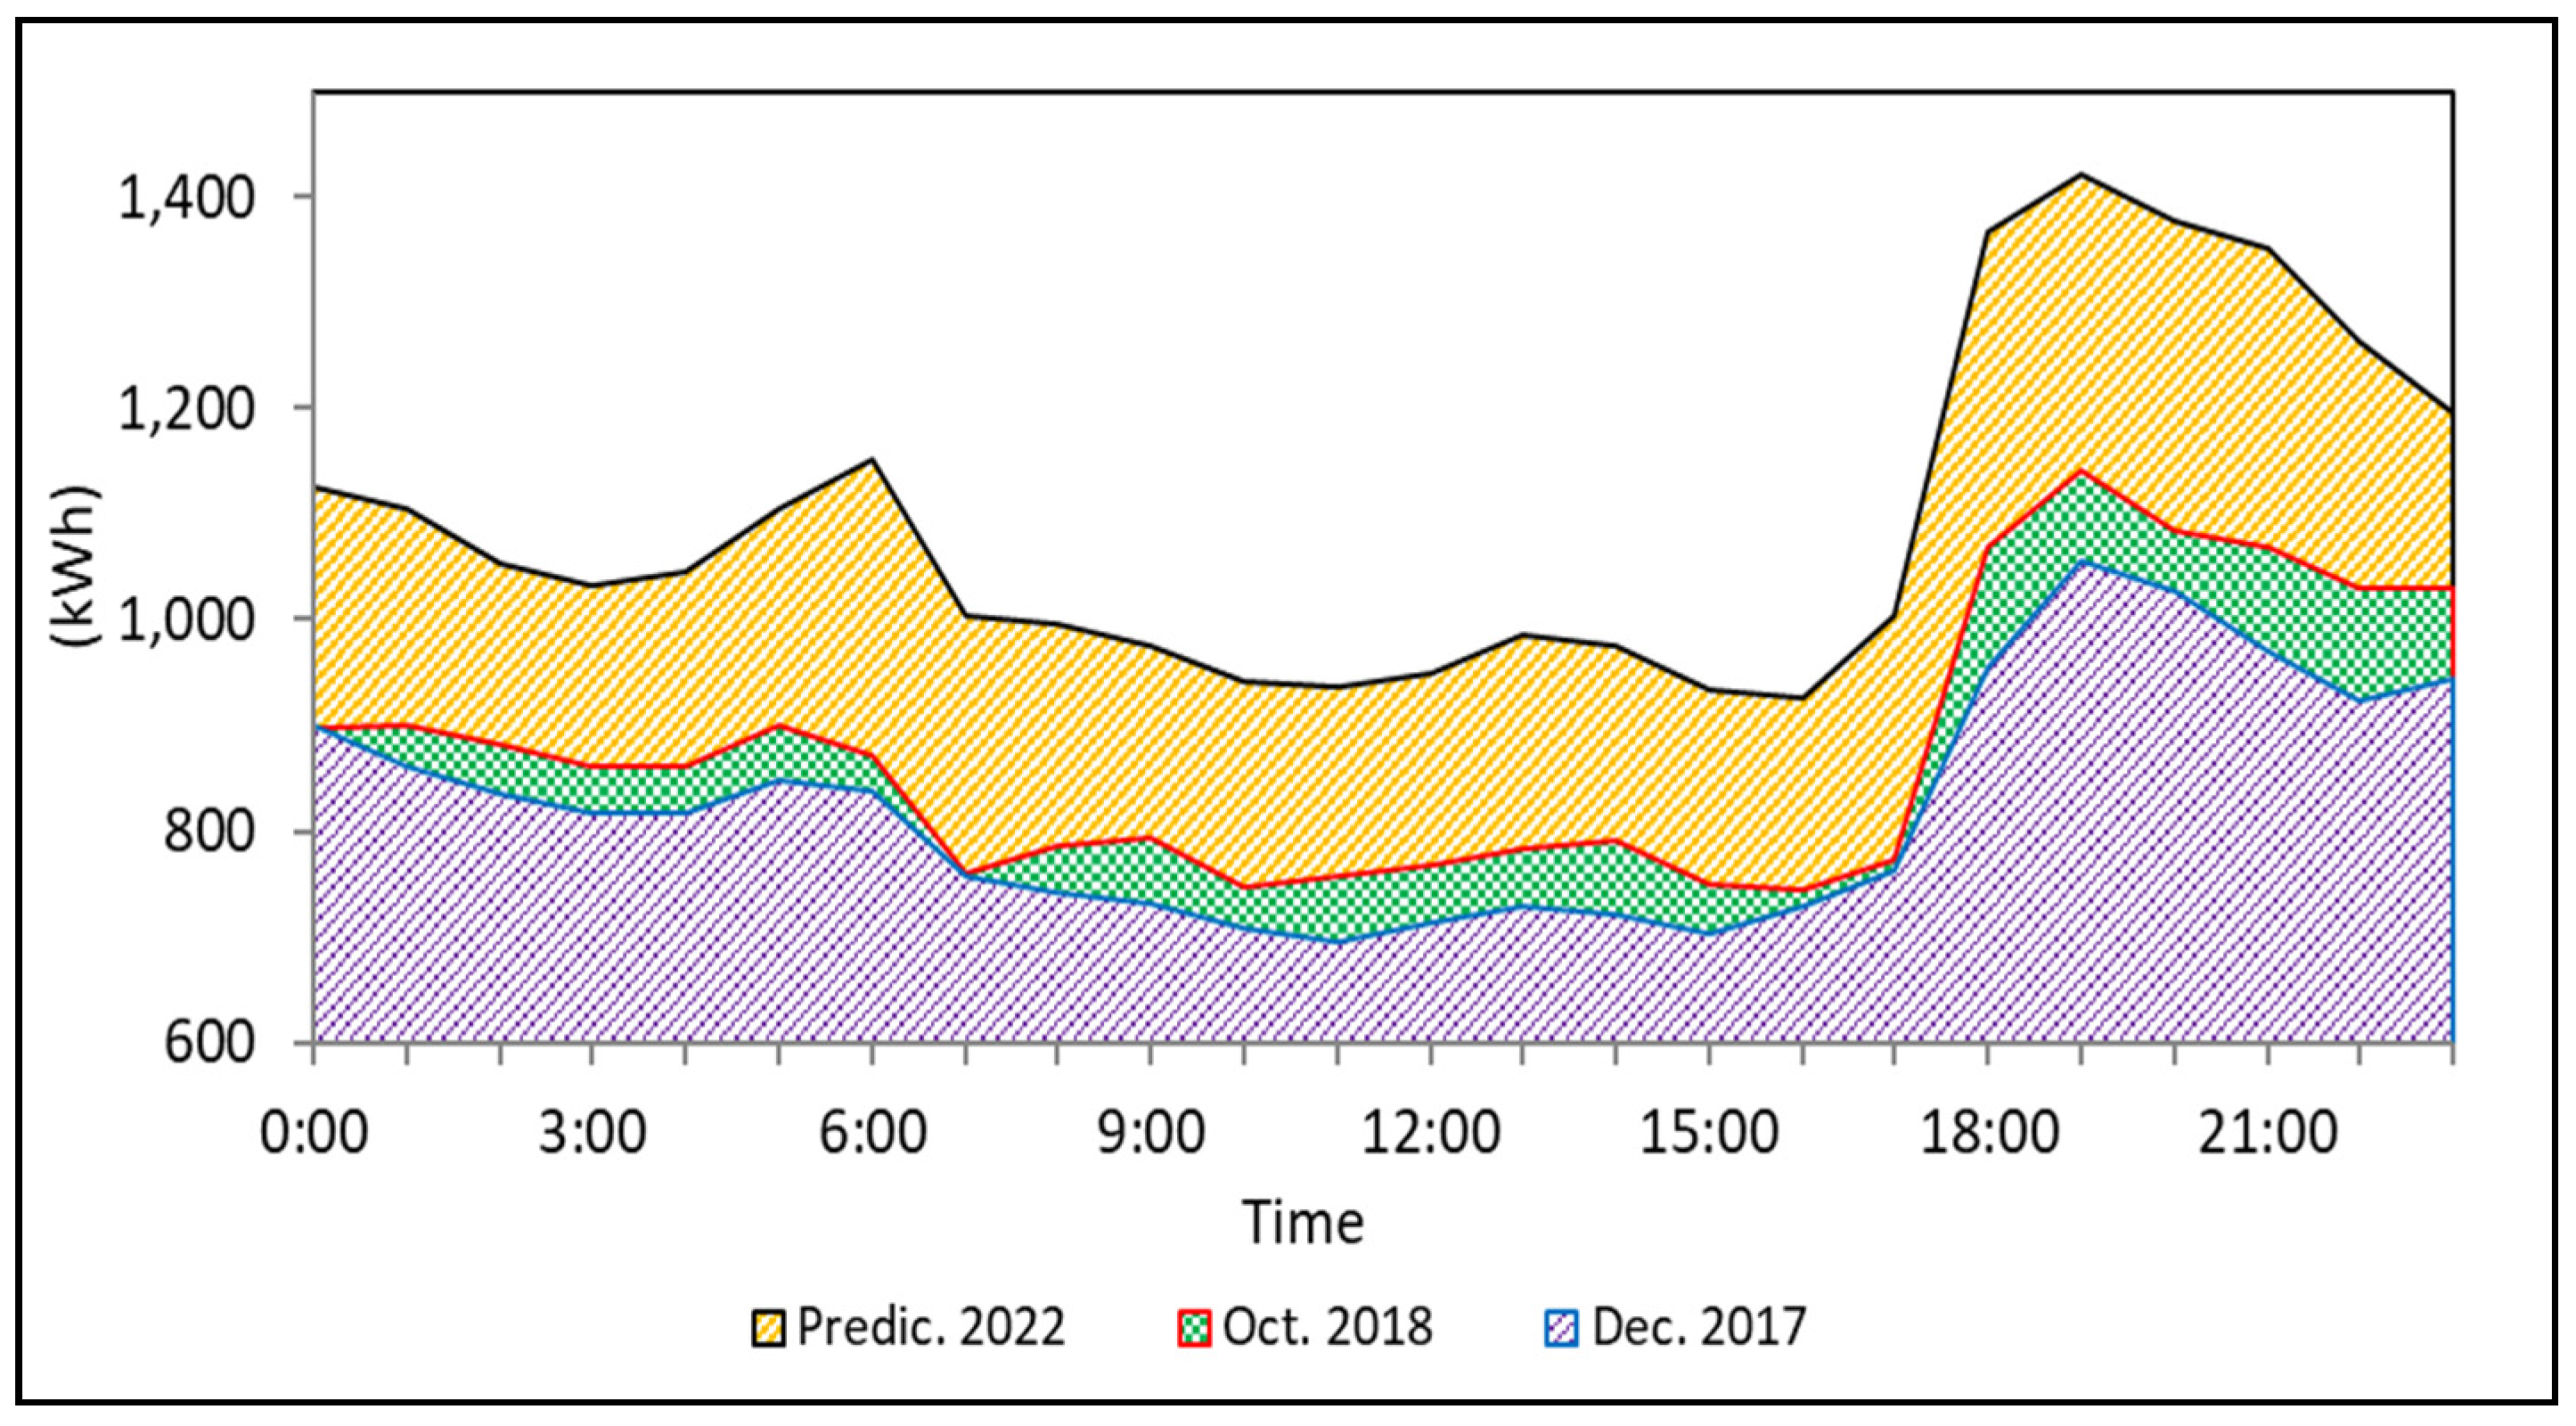
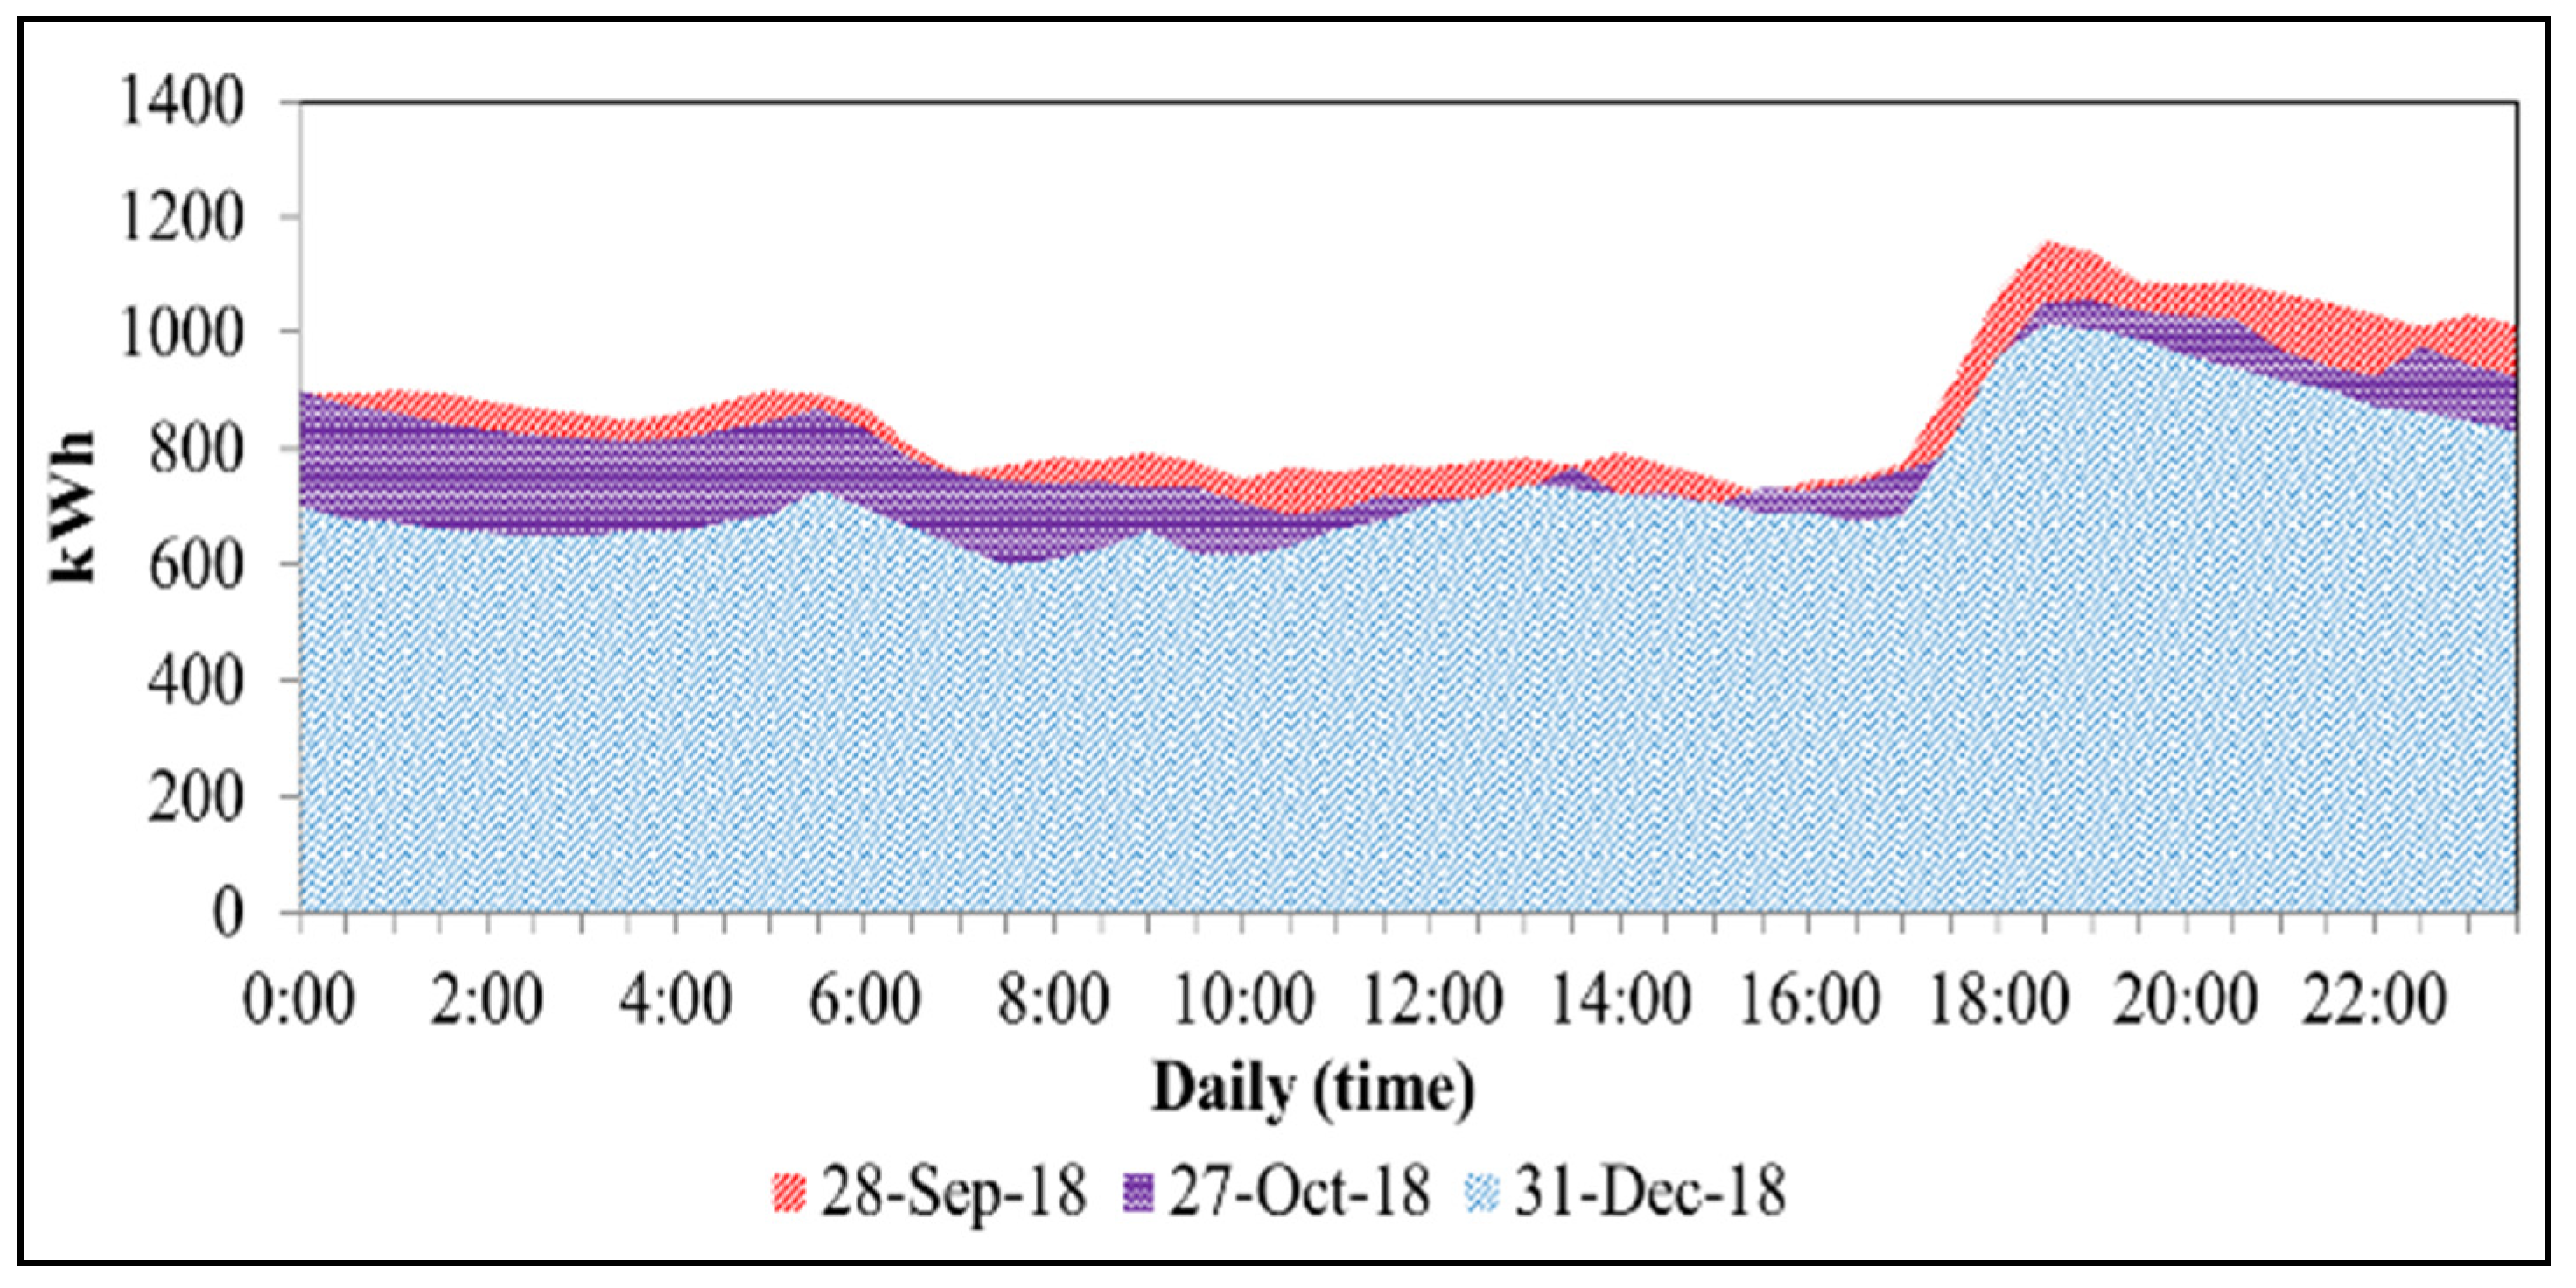
4.1. Daily Load Characteristic in Karimunjawa Island

Karimunjawa Island is a small tourist island with many annual visits, especially before the COVID-19 Pandemic (see Figure 4). Although with a relatively small area, around 71.2 km2, and a population of 9784 people in 2019, the island of Karimunjawa has stunning natural beauty and is a domestic and foreign tourist destination. The hospitality of the natives is support for tourism activities that will then impact improving the economy. In addition, tourism supporting facilities need to be improved, one of which is the diversification of electricity through natural resources.
Figure 6 shows the proposed the location of PV system near the DPP system existing. This decision was considered the operational cost in operation and maintenance for two different resources. We have successfully collected data on daily electrical energy usage through interviews with the DPP operator of the Legon Bajak system, as shown in Figure 7 shows the daily electricity load profile on Karimunjawa Island in 24 h. It appears that the highest electricity usage occurs in the afternoon until the evening, which is 1 8:00 to 23:00. From 00:00 to 16:00, electricity usage tends to decrease. The character of electricity consumption is because, on Karimunjawa Island, there are no large factory buildings or industrial buildings as in big cities, so in the morning until late afternoon, electricity is not widely used. Then from 15:00 to 23:00, there is an increase in electricity usage. The peak load occurs from 19:00 to 20:00 because the street lighting and entertainment and night tourism places are getting crowded with visitors. Figure 8 shows the forecasting the daily electricity demand in 2022.
The position allows the PV system to stay close to the DPP system and away from crowds. Utilizing the distribution network that is already available, so there is no need to build a new distribution, certainly saves operational costs. The schematic of the integration of the DPP system and the PV system is shown in Figure 9. It appears that the hybrid system that we proposed is the on-grid model. So the power storage is involved in the power system. The controller module functions as a unit for controlling charging and discharging decisions. When the power output from the PV system has been used enough by the load, the excess power output from the PV system will be used for battery charging. In case of the PV cannot serve the load, the power stored in the battery system is used to supply power to the load system. The energy from the PV system or the battery is converted from DC to AC by the converter module.
Profile of daily electricity demand on Karimunjawa Island based on observations of daily consumption usage. The average daily electricity demand on Karimunjawa Island was 0.8 MW. The range of electricity consumption in 2017 was 0.7 MW–1.0 MW, and in 2018 it was 0.7 MW–1.1 MW. It can be seen in Figure 10 from the character of electricity consumption from 2017 to 2018. Thus, linear regression can predict that the daily electricity demand in 2022 is 0.9 MW–1.4 MW. Therefore, we propose a PV system to handle the load of 1.4 MW, and the land area for the PV system is calculated using Equation (9). The PV system was planned to produce a power of 0.99 MW. The battery capacity was 3.3 Mah, computed using Equation (4), and Figure 10 also shows the prediction of electricity demand for Karimunjawa Island in 2022, assuming the characteristics of daily electricity use are the same and as planned by the central government, that the increase in electricity demand is targeted at least 11%.
PLTS penetration is assumed to take place in 2022. Based on the load curve in December 2018, it can be assumed that the load curve in the year of PLTS plant development is 2022, considering an increase in load of 3.48% per year. In this development, the Karimunjawa system reached a peak load of 1.4 MW. At low load conditions, no loading and stress limits are exceeded. For the value of losses from the low rate of load system, this system is 1.01%. In this system, only the DPP system operates. This power flow simulation shows that the power provided is 0.99 MW for a loading power of 0.98 MW.
The design of a hybrid-based power system on the island of Karimunjawa produces several favorable conditions compared to the states before implementing the hybrid system. We analyzed the system using the program computer Digsilent Power Factory. It appears that with the presence of a PV system with a capacity of 0.99 MW/20.09 kV (Figure 6), the performance of the power system in Karimunjawa has decreased losses. Loss reduction in conditions before PV system penetration was 1.01% to 1% after PV penetration (Figure 17a).
Considering the investment cost and the location which has a high level of clearness index [41,42], our proposed PV is polycrystalline type with Pmpp = 320 Wp, Vmpp = 37.1 V, Imp = 8.63 A, Voc, 45.8 V, Isc = 9.1 A, Efficiency = 16.51%. Using Equation (9). It is assumed that the input voltage on the inverter module for output of 0.4 kV ( V i d c ) is 587.9 V. Power on the AC system is 0.99 MW, assuming the power factor is 0.8. V then the number of PV modules ( N M o d u l ) is the ratio of Vidc/Vmp, and Vidc is calculated using Equation (10), then the value of Vidc is 587.9 volt, and the number of PV modules per PV string is 16 units/string. The value of N S t r i n g is calculated by Equation (12), where parameters such as the power generated by one PV array (PA) = 1 MW, and the power generated from the PV string ( P S t r i n g ) is 5120 Watt, then N S t r i n g ≈ 196 Strings. The number of PVs in the array ( N A r r a y ) is calculated using Equation (13), where Pplts = 0.99 ≈ 1 MW, and PA = 1.24 MWp, then N A r r a y = 1.24 array. Finally, we can calculate the total number of PV modules needed for solar fields is 16 × 196 × 1.24 = 3889 pieces of PV modules. We assumed that 0.25 m2 of land is required for PV maintenance needs for each PV module, and the area of PV modules ( A P V ) as according to the manufacture specifications is 1.92 m2, then through Equation (14), the required land area for solar fields is 1.41 ha.
A hybrid power plant with an EPC value is feasible when the hybrid power plant scenario has a lower EPC than the EPC before the penetration of the mixed power plant. So, the Karimunjawa system hybrid power plant’s solution uses the design as shown in Table 1. The battery specifications we propose are 12 VDC, capacity 1000 Ah, rated current was 10 A. Using Equation (4), where the energy requirement in one day is 26,479 MWh and with a power factor = 0.8, then the battery capacity is 3.3 Mah. The hybrid system recapitulation is presented in Table 1.

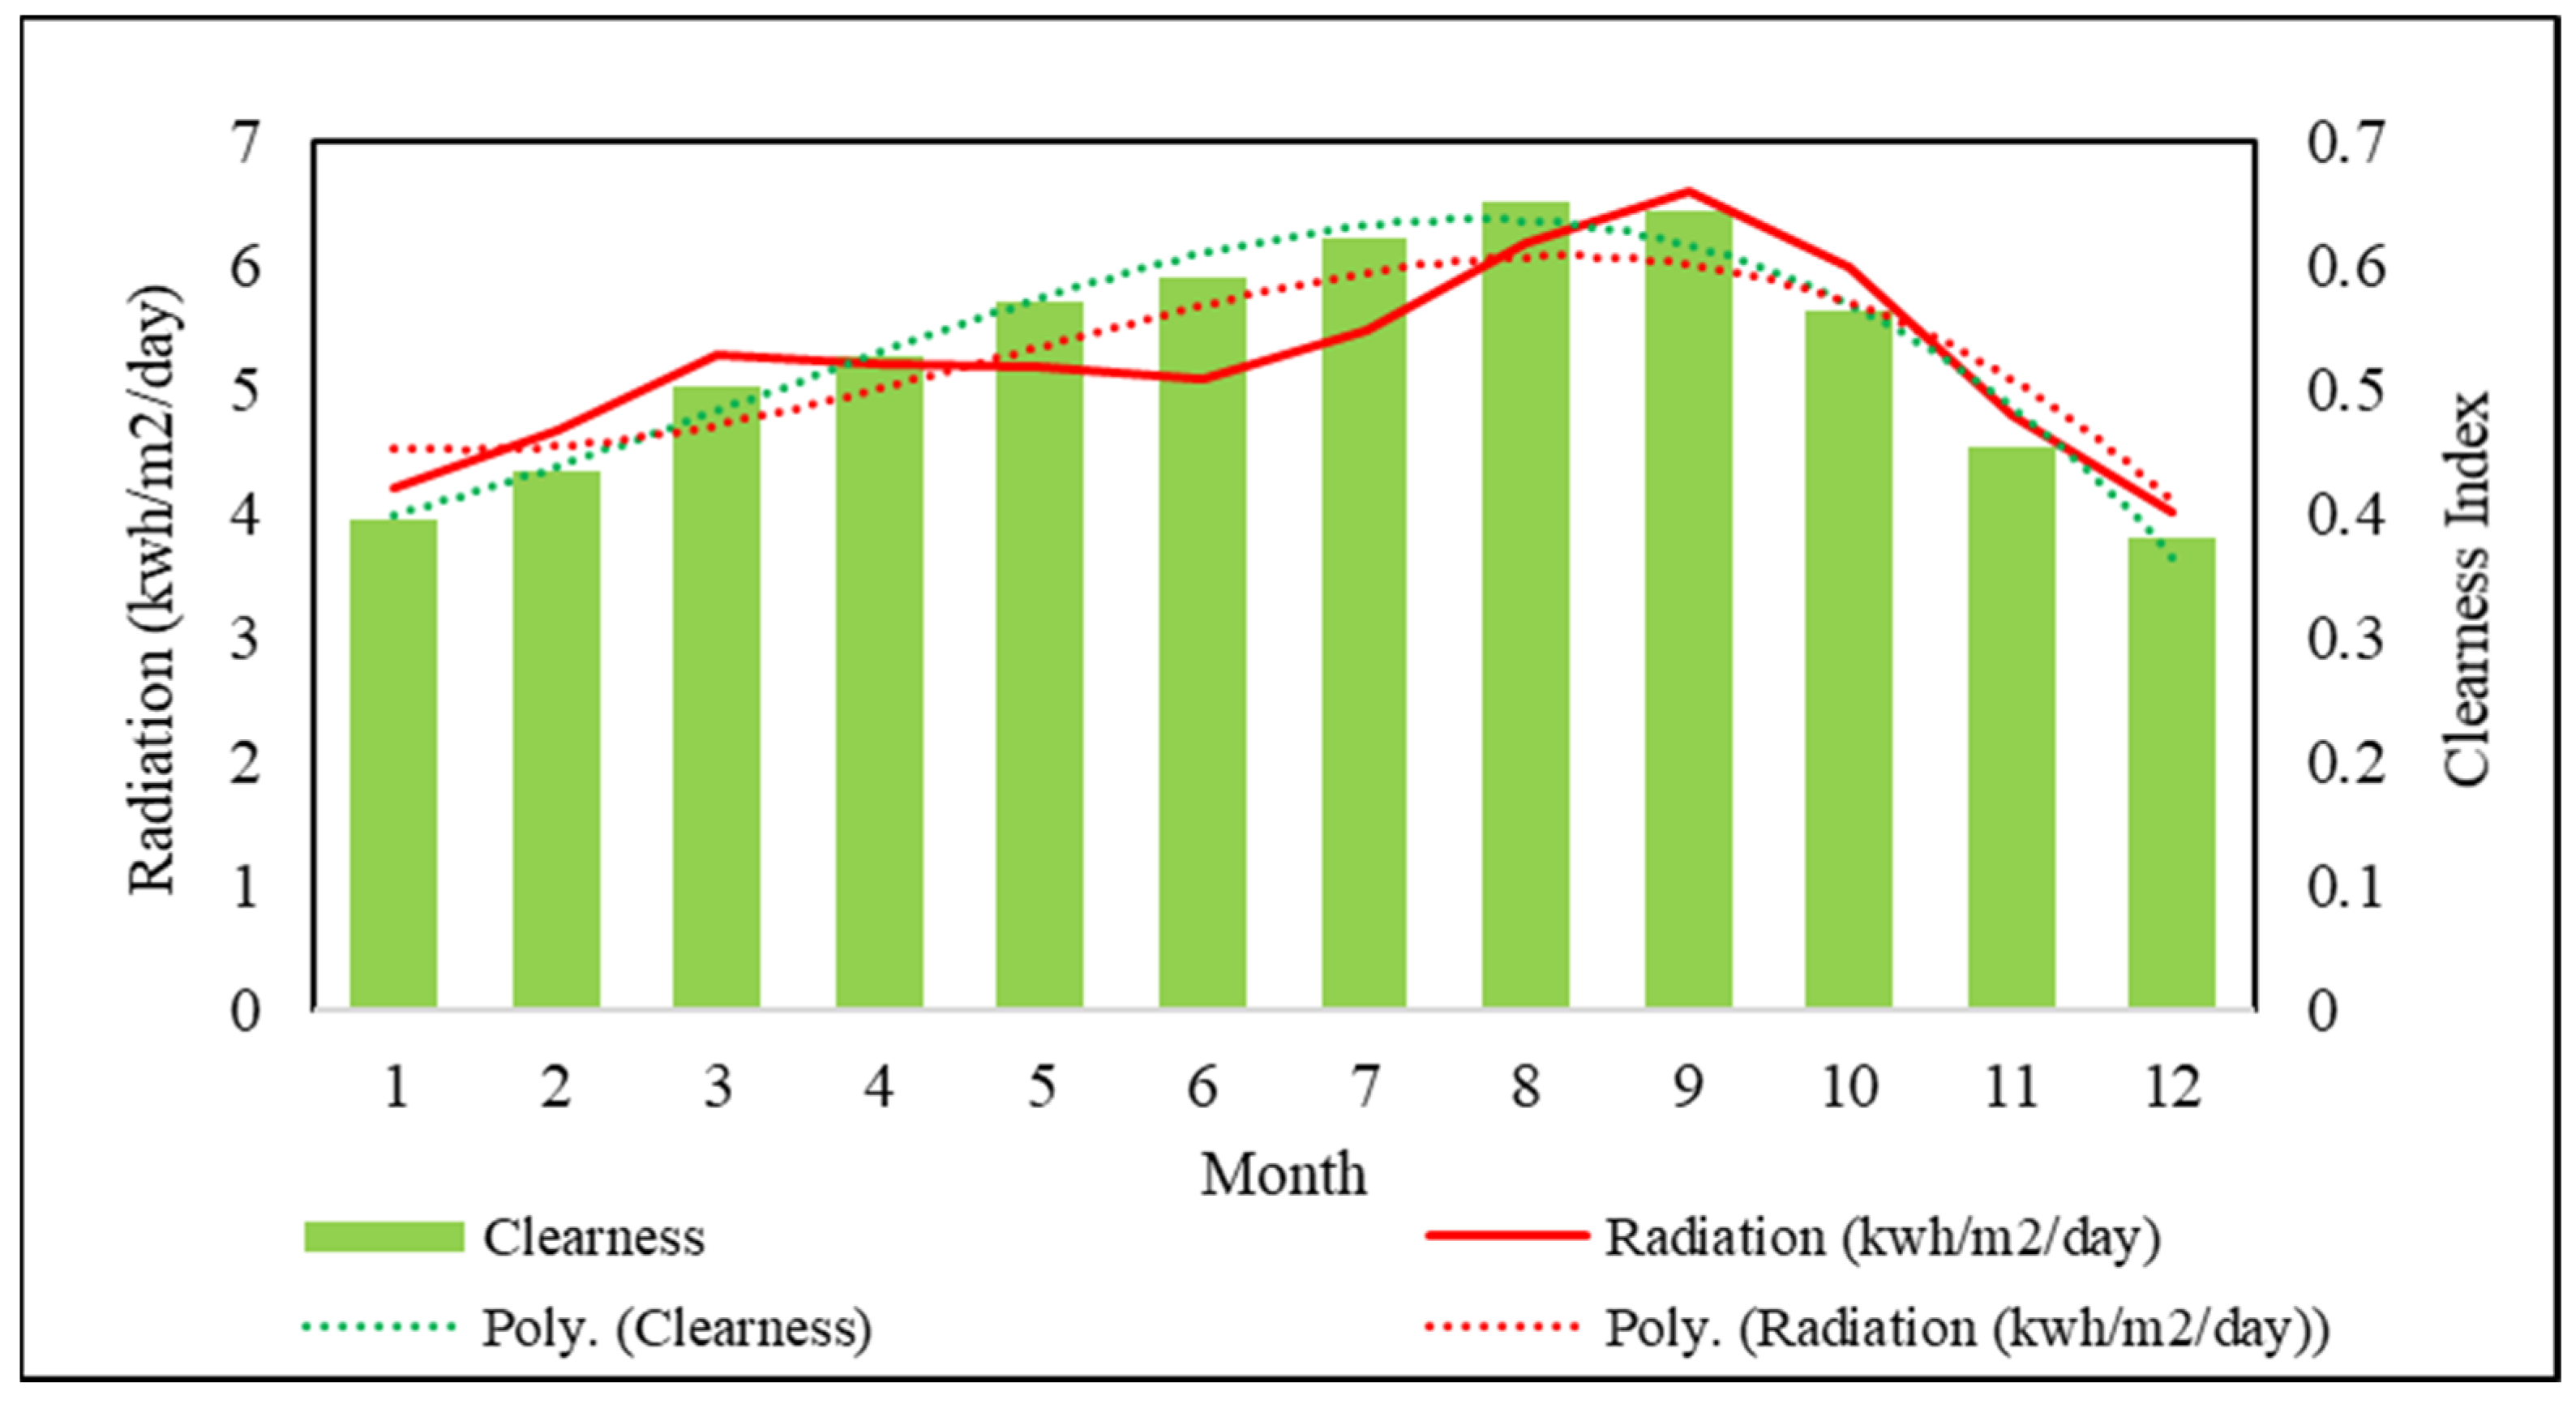
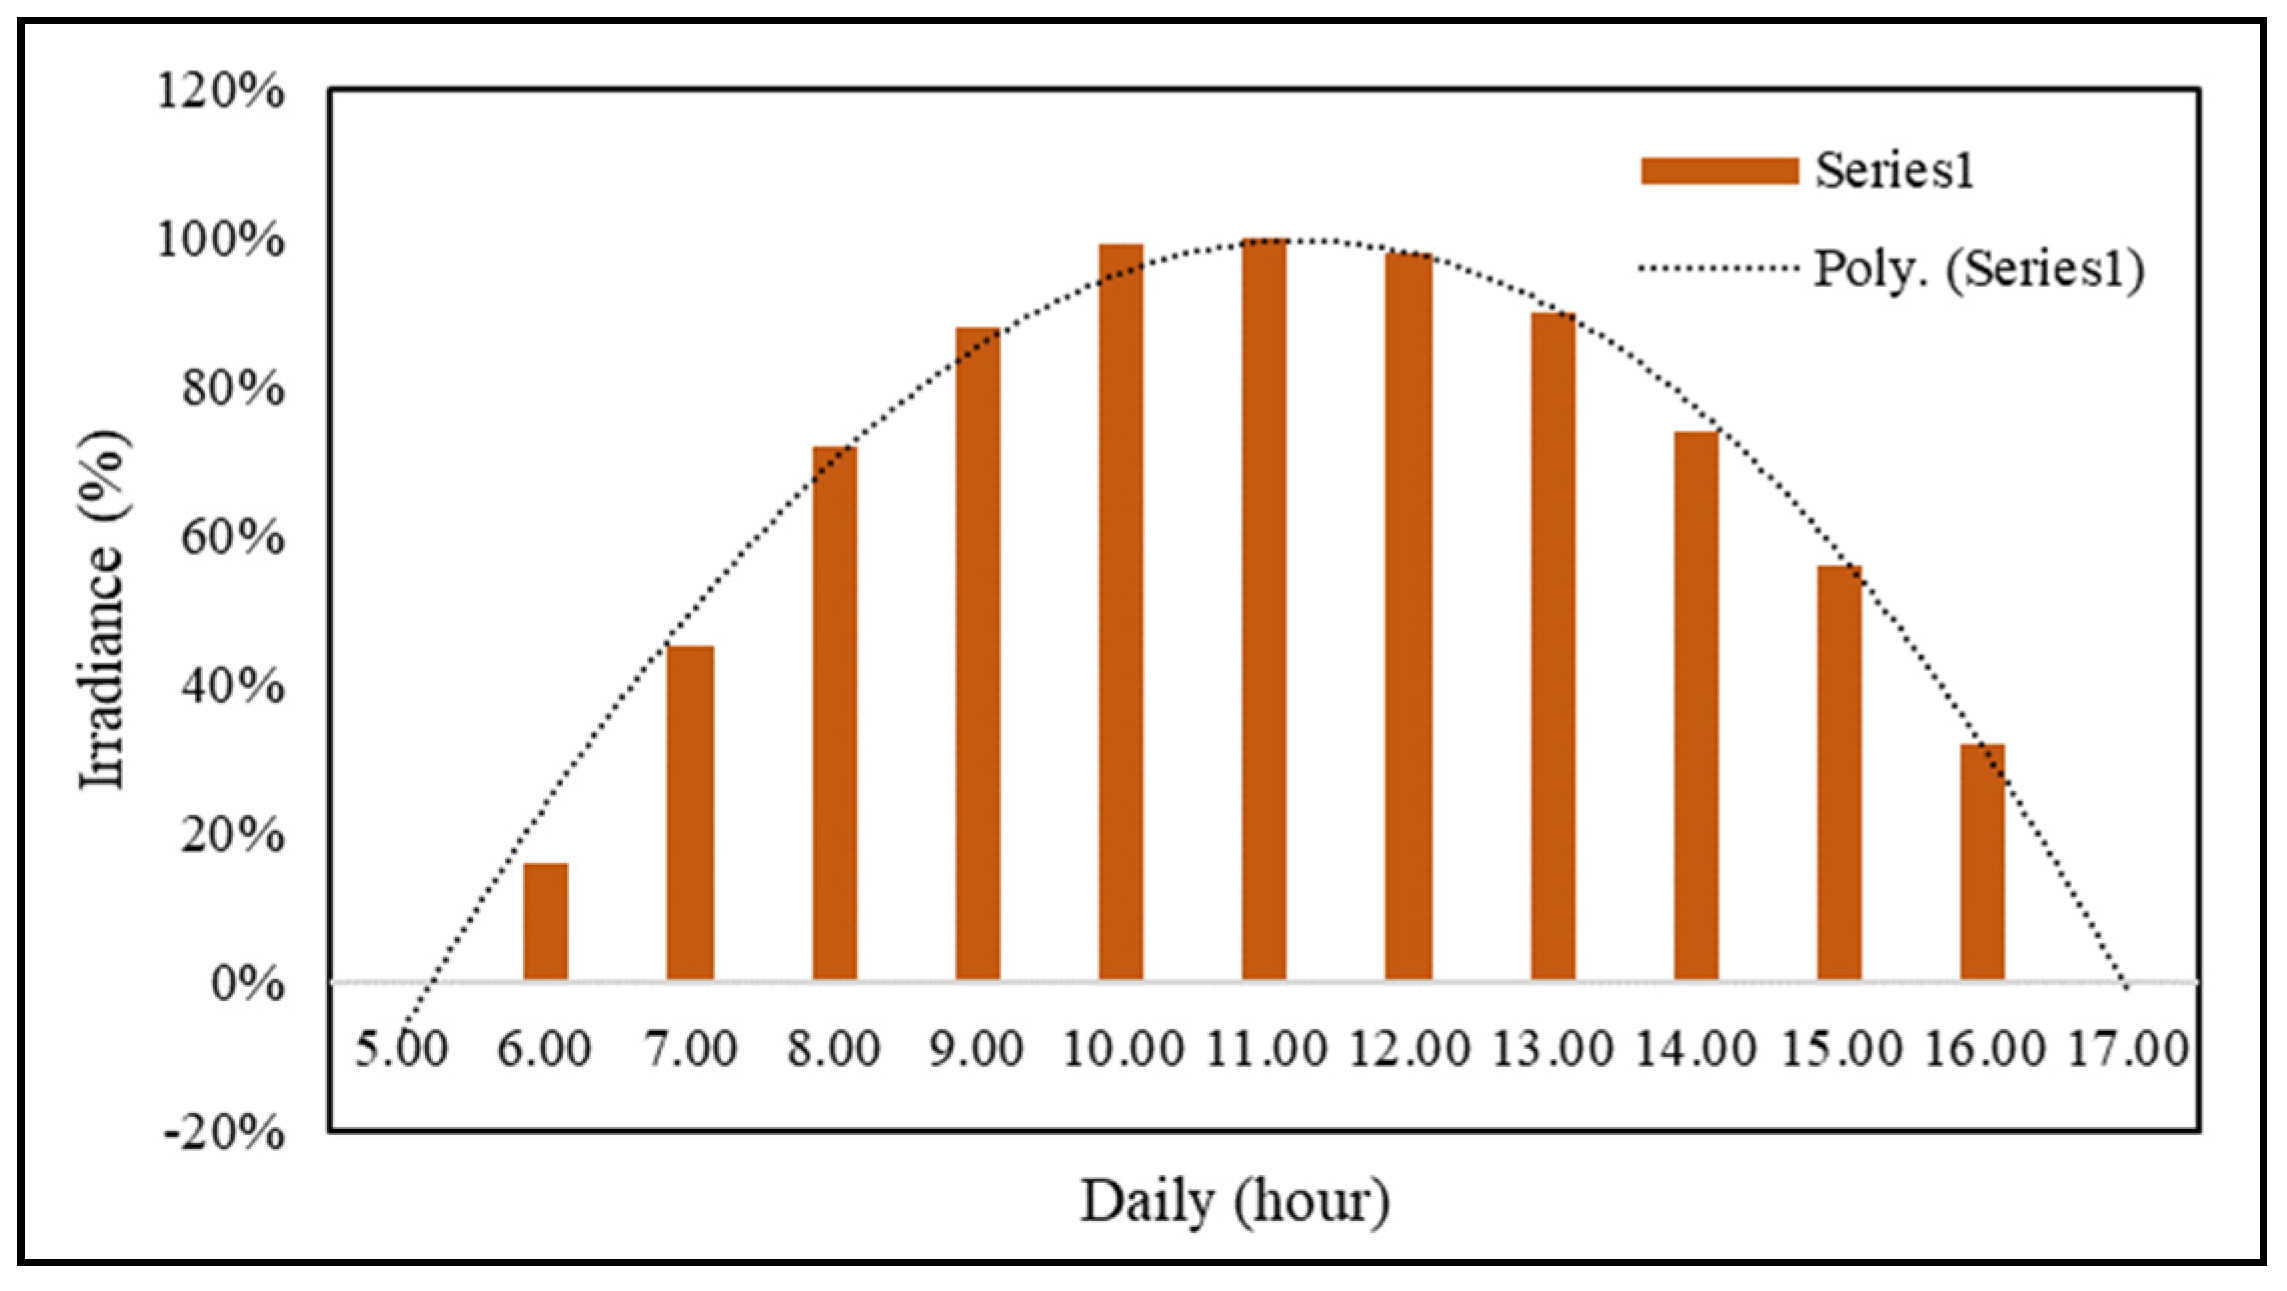
4.2. Solar Energy Potential in Karimunjawa Island

We have captured the irradiation for one year monthly, and solar irradiation data in the Karimunjawa Islands were obtained from satellites using the Homer Energy program. The data was collected 50 m above the surface for 22 years, from July 1983 to June 2003, as shown in Appendix A.
As Figure 10 shows, it appears that Karimunjawa Island gets quite a lot of irradiation for a whole year with an average of 5.23 kWh/m2/day and an average clearness index of 53%. This value means that the island of Karimunjawa is an island that is not too cloudy and tends to be sunny. In one year, the highest shading in PV due to clouds only occurs for four months, from May to August. The significant solar irradiation occurs monthly from March to October throughout the year.
The value of the clearness index (CI) and the radiation value in Figure 10 are displayed in the form of a numerical equation with a polynomial approach shown in Equation (17) with the coefficient of determination (R2) value of 0.967. Meanwhile, radiation is shown in Equation (22), with the coefficient of determination (R2) being 0.756. related to Equations (17) and (19), where the CI is clearness index (%) and Irr(monthly) is monthly solar irradiation (kWh/m2/day), and x is a month (January to December).
C I = 0.0008 x 3 + 0.0086 x 2 + 0.0180 x + 0.3746
R 2 = 0.967
I r r ( m o n t h l y ) = 0.0100 x 3 + 0.1460 x 2 0.3620 x + 4.7668
R 2 = 0.756
We also capture daily irradiation to determine the characteristics of daily irradiation on Karimunjawa Island in detail. This irradiation value was essential to know the maximum irradiation in one day and the average daily irradiation. Daily capture results from the irradiation from 6:00 to 17:00 are displayed in graphical form in Figure 11. In numerical form using polynomial, we have created the trend equation as shown as Equation (24), where the Irr(daily) is daily solar irradiation (%), and x is an hour with arranging from 5.00 to 17.00. Figure 11 shows that the maximum solar radiation occurs duration in three hours, from 10:00 to 12:00. The average rate from 6:00 to 16:00 was 70%, and this value indicates that the daily solar radiation in Karimunjawa Island.
I r r ( d a i l y ) = 0.003 x 3 0.0198 x 2 + 0.5476 x + 2.2734
R 2 = 0.999

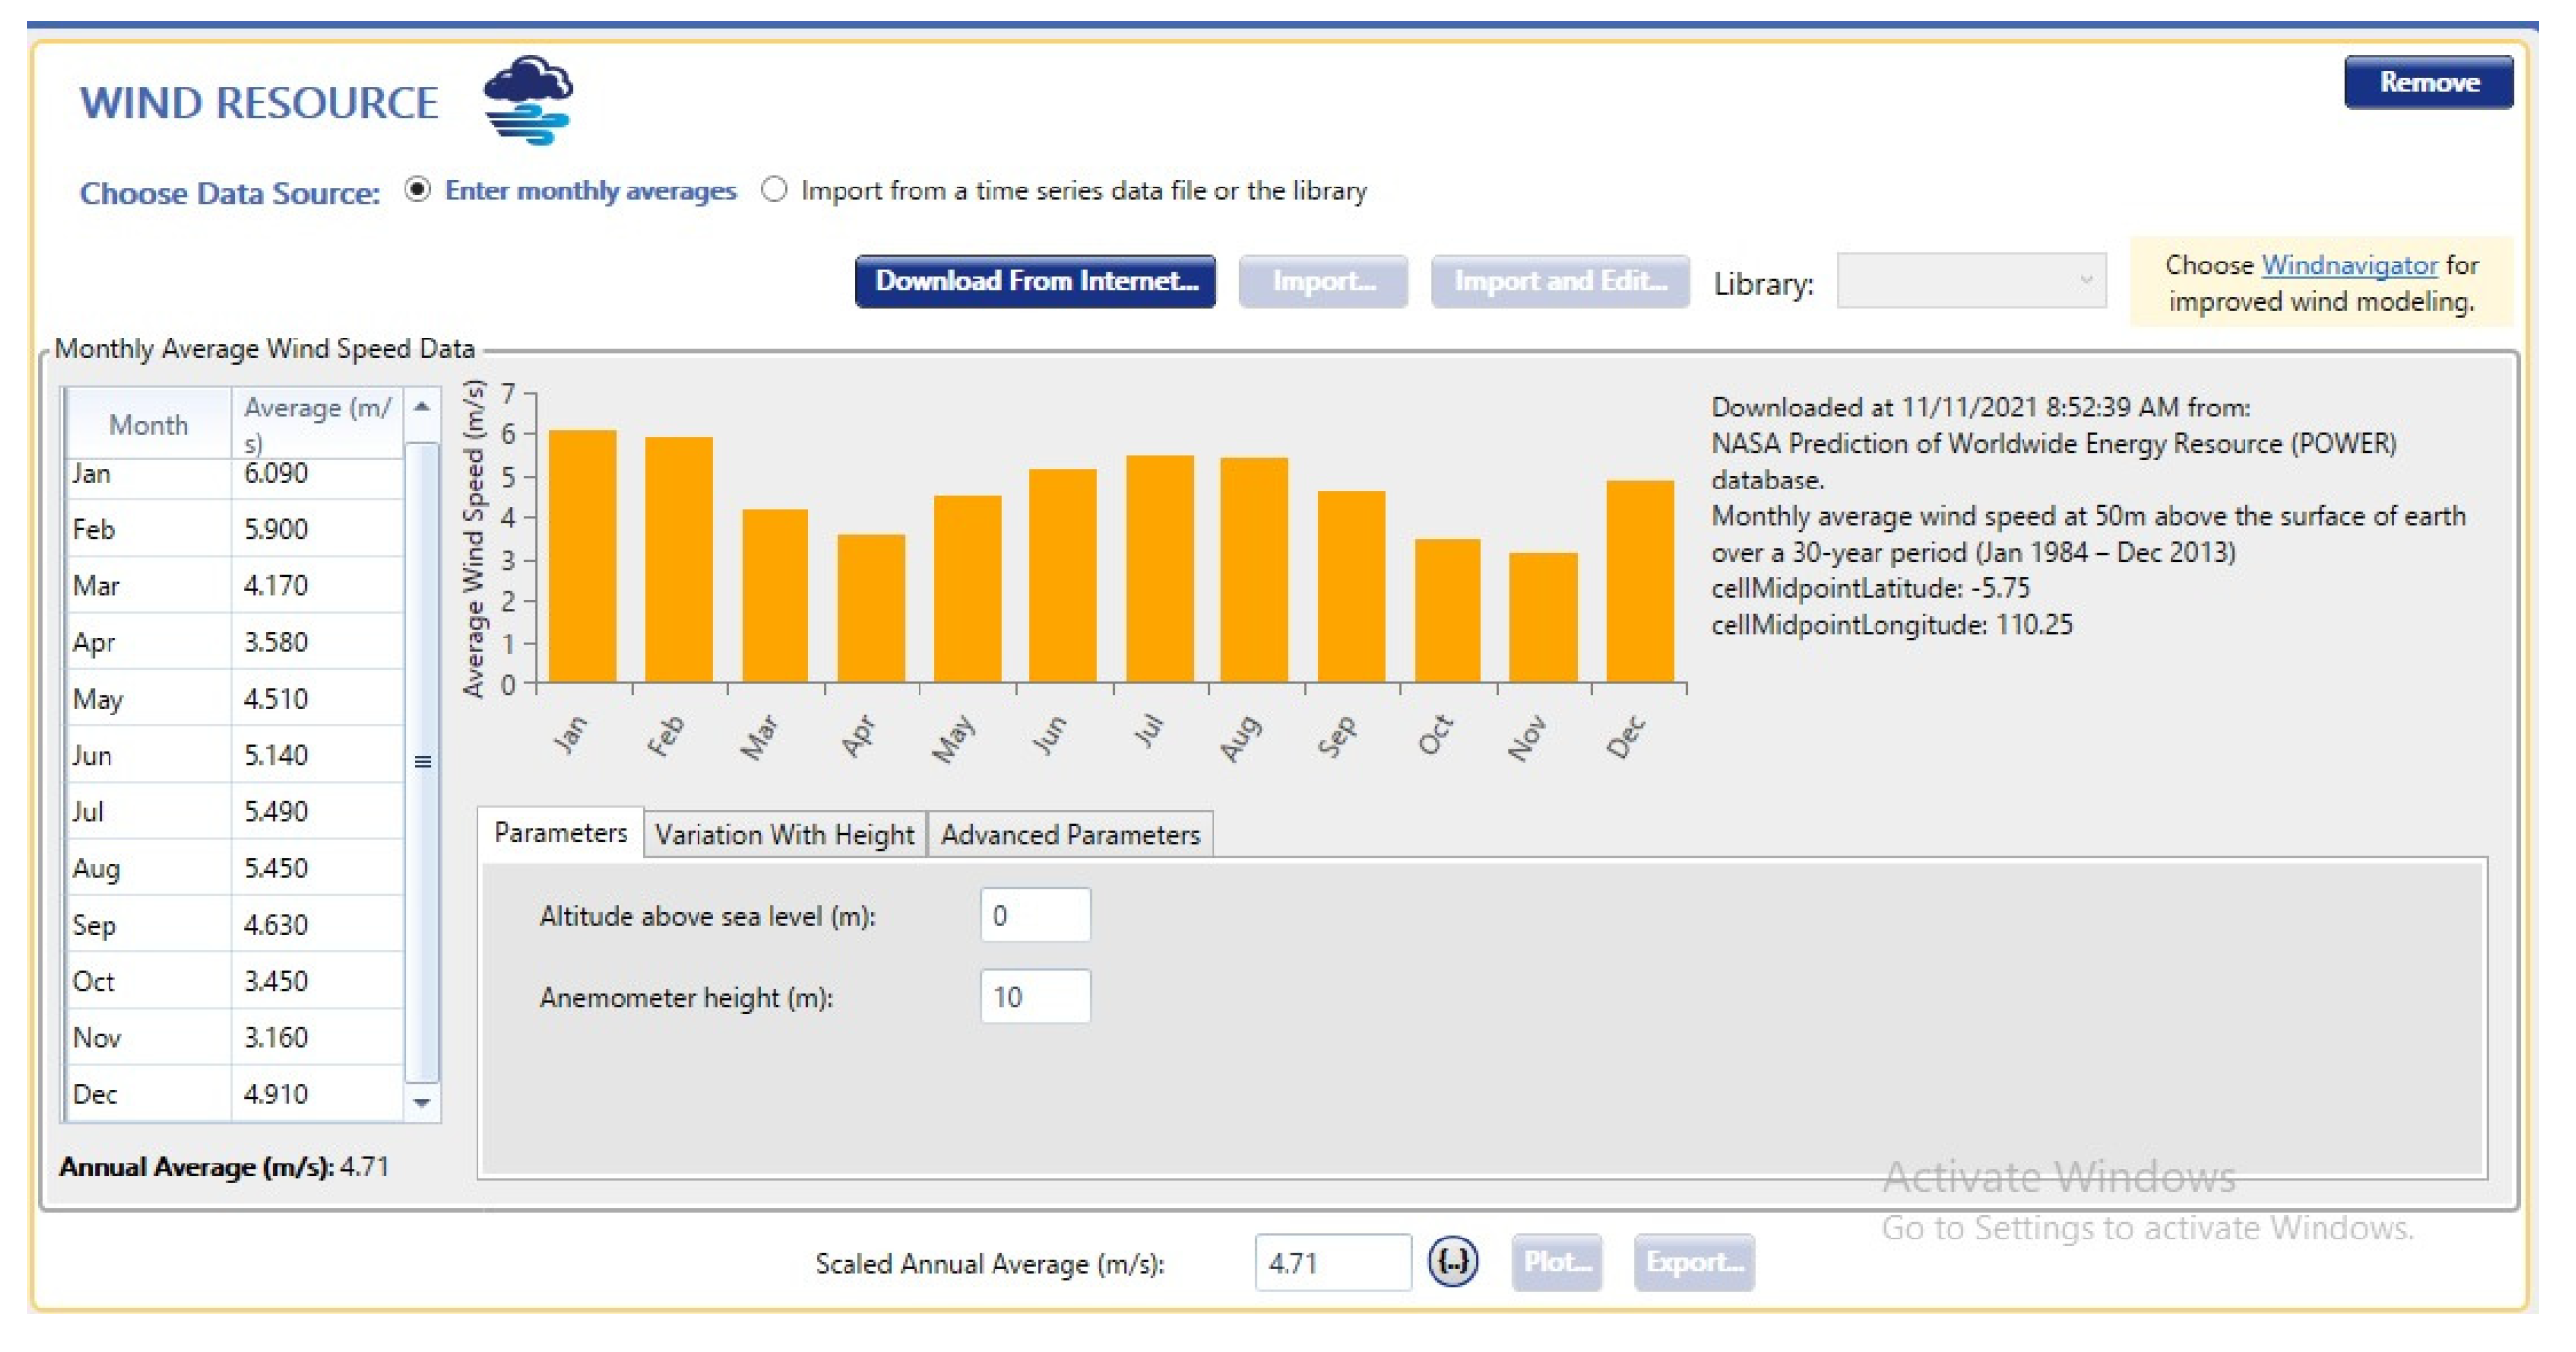
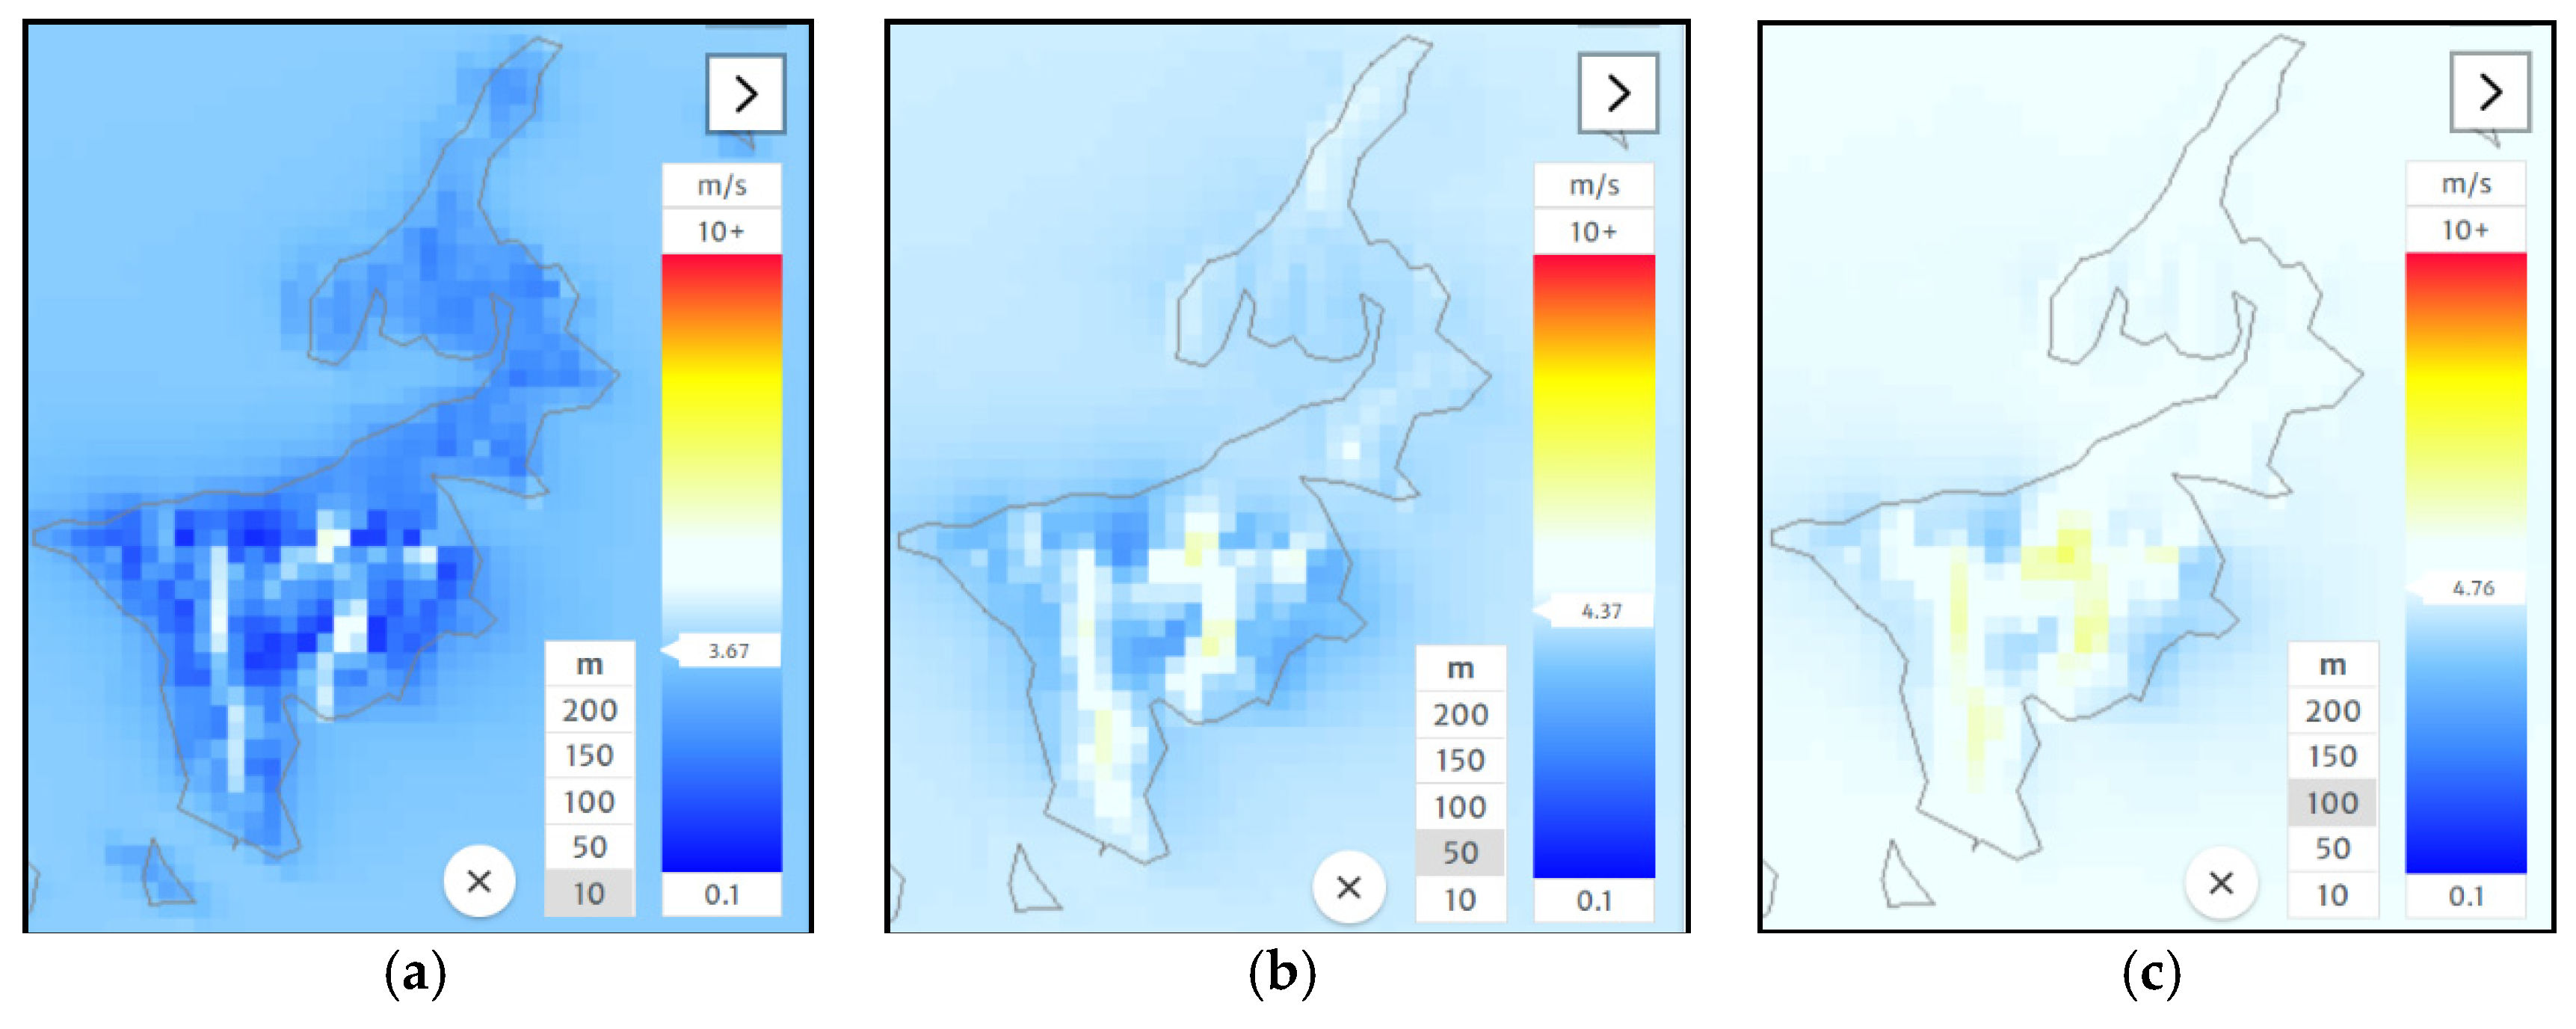
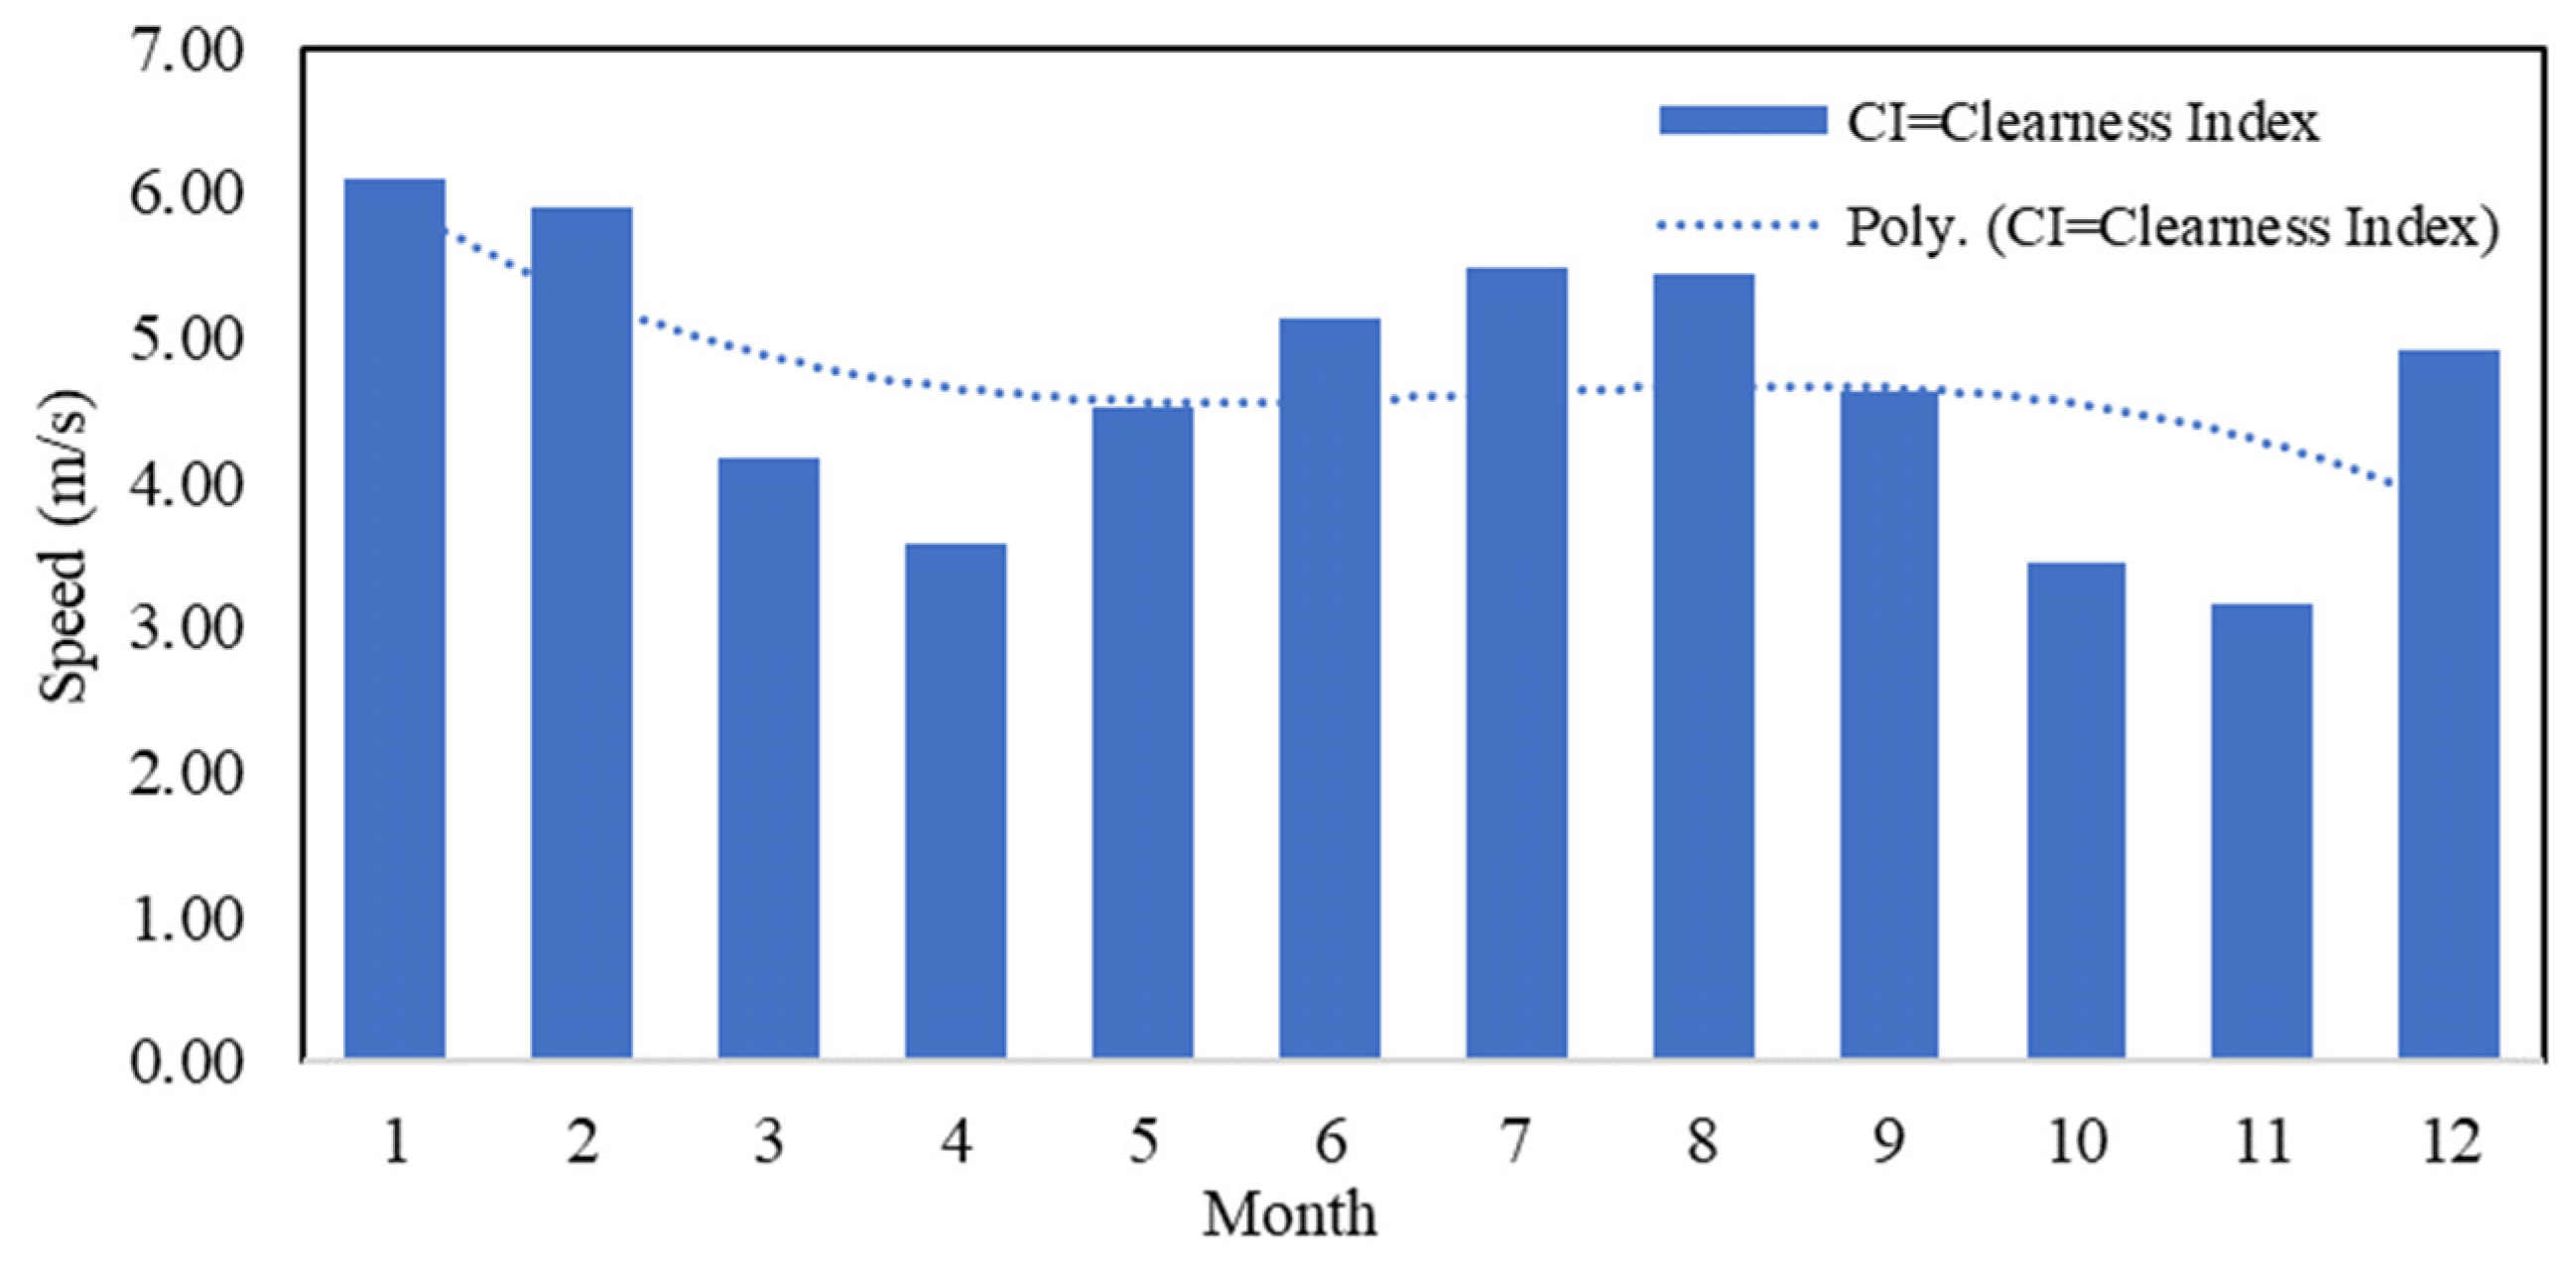
4.3. Wind Energy Potential in Karimunjawa Island

Indonesia is a country with low to medium wind speed relatively. From Figure 12, which is a wind capture in Indonesia from the Global Wind Altas website [43], from the wind map presented, the Karimun Island is an area with medium wind speeds compared to another location. Wind energy potential on the Karimunjawa Island has become a hot issue for researchers, as in paper [44]. Still, so far, only limited articles are discussing the wind energy feasibility on Karimunjawa Island. However, Jannis Langer et al. (2021), in a study on the potential of new and renewable energy in Indonesia, stated that at an average wind speed of 4 m/s to 6 m/s, every 100 kW of wind power requires an area of 0.25 km2 [45].
Then, the wind speed distribution was recorded from the land surface of Karimunjawa Island from the Global Wind Altas website [40]. The wind speed varies based on land elevation. At 10 m above of land surface, the average wind speed is 3.67 m/s (see Figure 13a), at 50 m above of land surface, the average wind speed is 4.37 (Figure 13b), and at 100 m above of land surface, the average wind speed is average 4.76 m/s (Figure 13c).
There are two approaches to capture wind speed on the island of Karimunjawa used in this research. Figure 14 shows that the first is based on the Homer Energy program, and the second is based on the Global Wind Altas website [40]. As shown in Appendix B, the Homer energy program measured 30-years (January 1984 to December 2013) and was taken from 50 m above the land surface. The result shows that the average wind speed was 4.71 m/s. The characteristics of the average wind speed trends for one full year are shown in Equation (26), with the coefficient of determination (R2) = 0.284. Where V W I N D is a rate of wind speed (m/s), x is a month.
For comprehensive results related to the feasibility of wind energy potential on Karimunjawa Island, there are three standard approaches for classifying wind energy potential; (1) According to the MIT Department of Earth, Atmospheric and Planetary Sciences (EAPS) [46], the wind speed of 4.37 m/s at an elevation of 50 m is classified as poor, meaning that it is not feasible to build wind power plants. (2) According to the wind class standard table from The International Electrotechnical Commission (IEC) shown in Table 2, the average wind speed on Karimunjawa Island does not even fall into the lowest class. This result means that the potential for wind energy on Karimunjawa Island is not feasible to build wind power plants. (3) Based on the findings in [45], which are the motivation to find out the relationship between the wind power generated based on the area requirement, it can be concluded that the Karimunjawa Island area is 71.2 km2 the wind energy density on Karimunjawa Island is 400 w/m2. This wind energy density is classified as “Good” [47] or ranked in the 4th [48,49], but the classification at the average wind speed is 7 m/s. On the other hand, the average wind speed on the island of Karimunjawa is 3.67–4.76 m/s, so it can be concluded that it is not feasible to build wind power plants.
Although the wind speed on Karimunjawa Island is relatively low, the possibility is still open to harvesting wind energy. The application of a wind turbine specifically designed for low rates is one of the solutions, including using a fish-ridge type VAWT turbine that has better energy conversion efficiency than the Savonius turbine [50,51].
V W i n d = 0.008 x 3 + 0.1666 x 2 1.0946 x 6.877
R 2 = 0.284
Table 2. IEC wind class standard [52].
IEC Wind ClassesI (High Wind)
(m/s)
II (Medium Wind)
(m/s)
III (Low Wind)
(m/s)
Reference Wind Speed5042.537.5
Annual Average Wind Speed (Max)108.57.5
50-year Return Gust7059.552.5
1-year Return Gust52.544.639.4

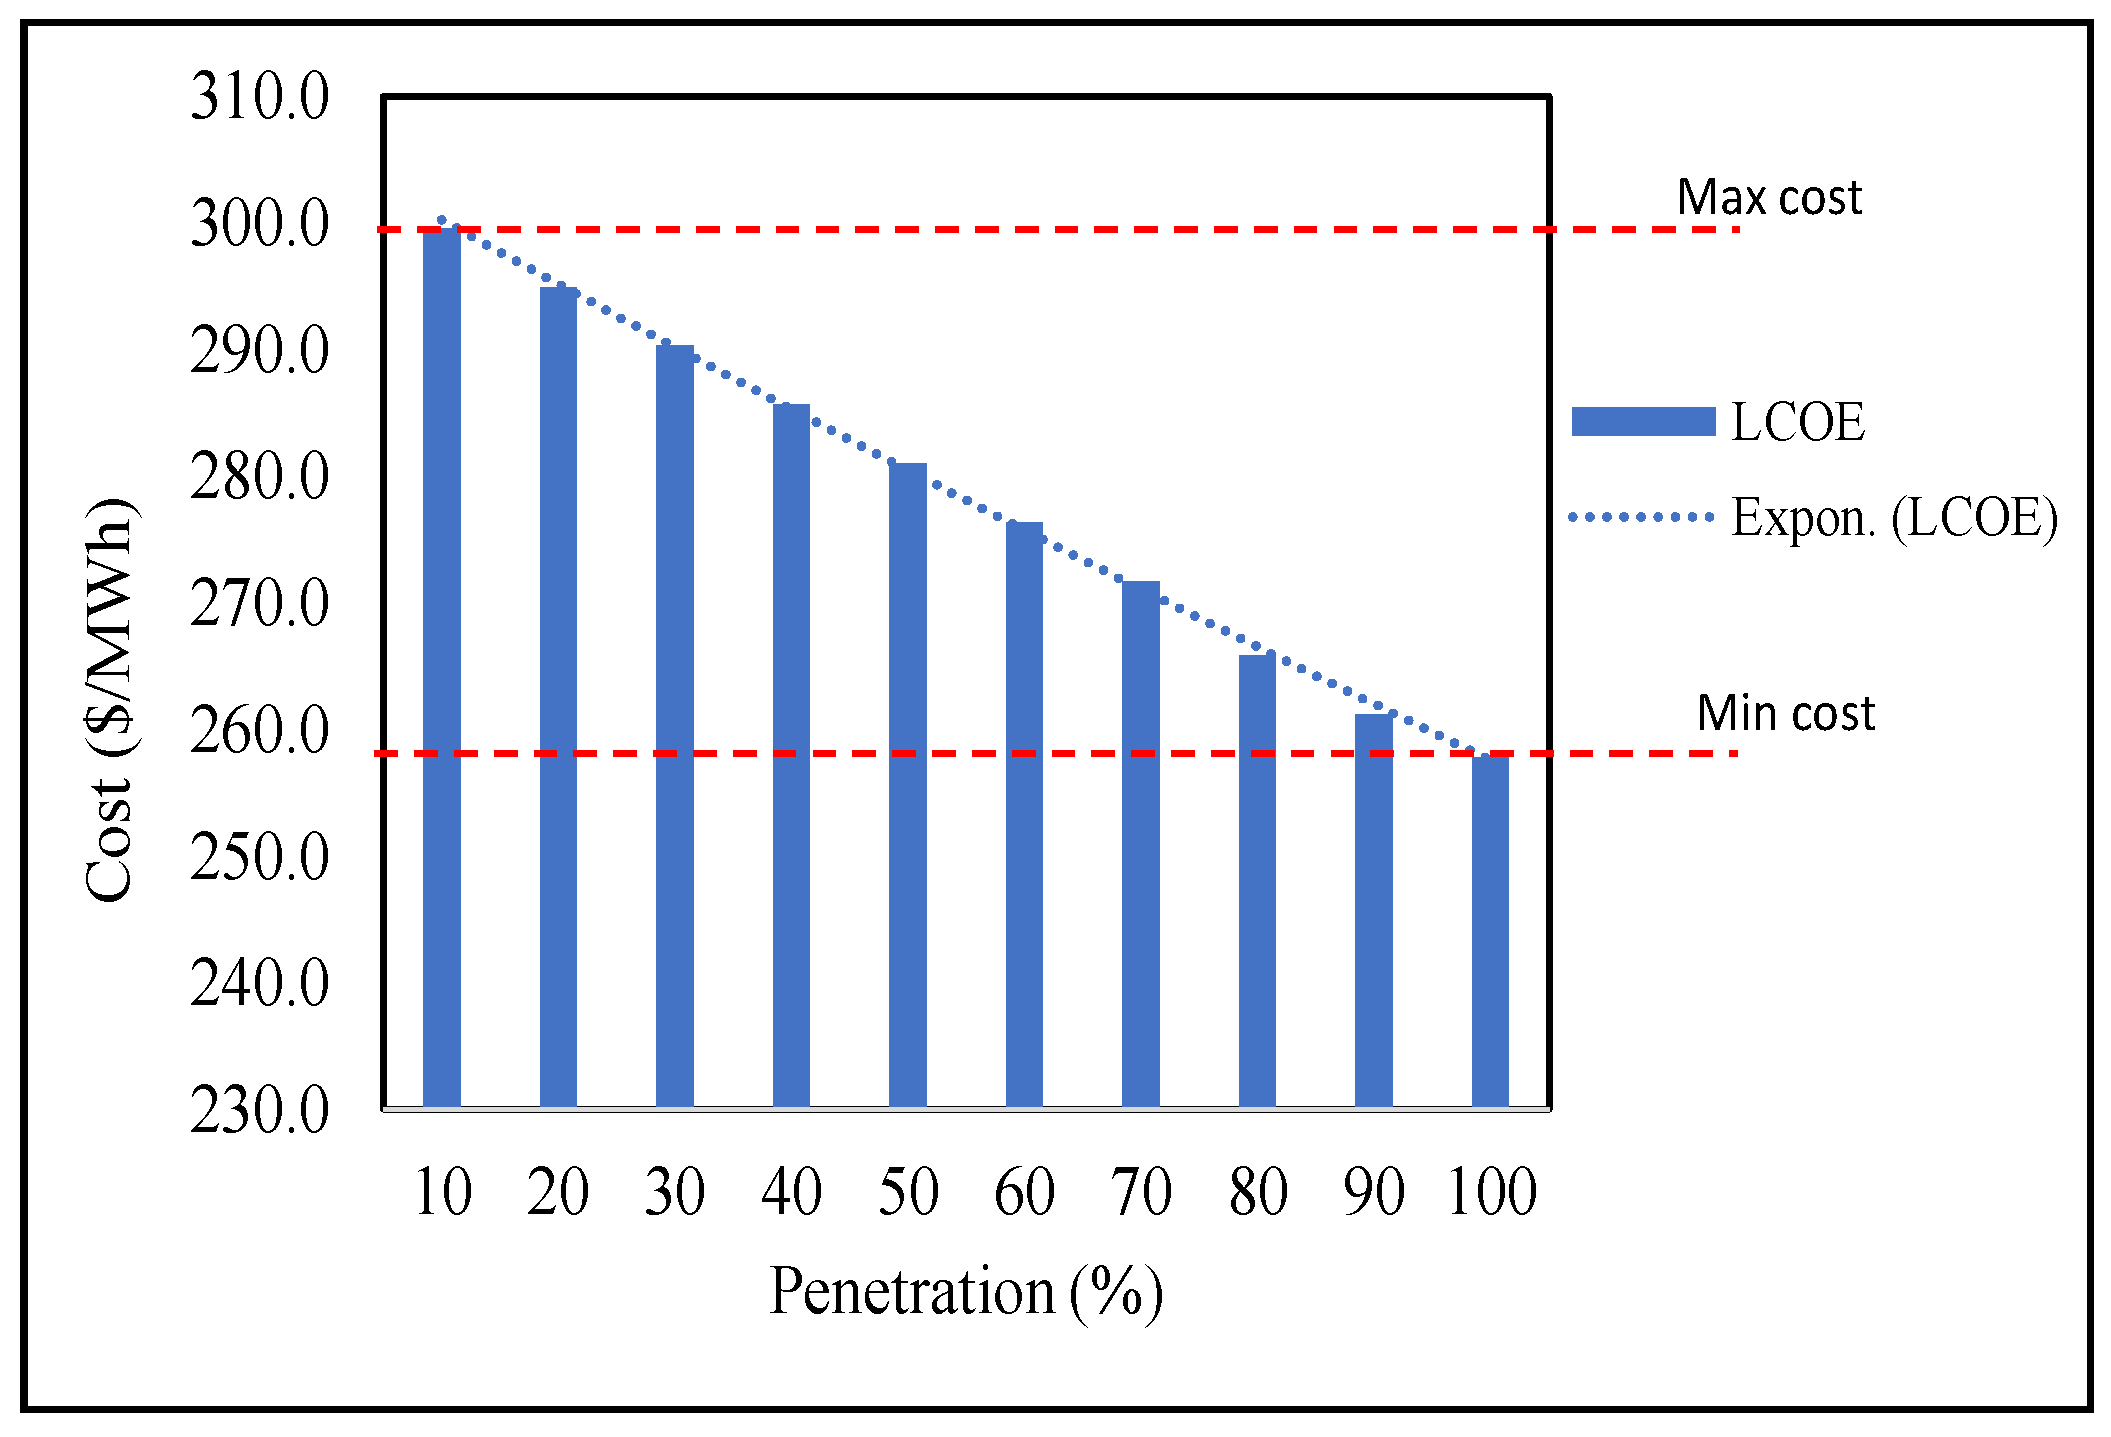
4.4. Levelized Cost of Electricity (LCOE) and Electric Production Cost (EPC) System

LCOE analysis and calculation are carried out with several penetration scenarios. This analysis aims to obtain the level of optimization of the power plant economically. Figure 15 shows the system power flow after penetration of PV system with PV system integrated with DPP. The LCOE and EPC values based on the PV penetration percentage are presented in Table 3 using Equation (10). Assumption the increase of 10.9%, the predicted electricity demand will increase with a peak value of 1.422 MW. Therefore, it can be concluded that the lowest LCOE value is at 100% penetration with an EPC value of 0.26601 USD/kWh and the highest EPC occurs at 10% PV penetration with a value of 0.309129 USD/kWh.
The total investment, operational, and maintenance costs for one year are 302,732 USD. In comparison, the total energy generated in 1 year at 100% penetration reaches 966,474 MWh. The cost contribution to the three main items in the LCOE is Investment (It) = 96.76%, OM Cost (Mt) = 3.22%, Fuel cost (Ft) = 0.02%. In contrast, the power generated from a hybrid system (DPP system and PV system) is 966,474 MWh, then the percentage contribution to the system can be assumed to be 100% (Table 1). LCOE is calculated using Equation (10). Table 4 shows the results of the calculation of LCOE and EPC values based on PV penetration. In the power supply system in Karimunjawa, there was only one type of power plant existing. Therefore the LCOE value is the same as EPC for each scenario penetration.
Based on the analysis results in Table 4, the highest LCOE occurs at 10% PV penetration, meaning that in conditions where 10% PV is active, then LCOE increases by 299,554 $/MWh. When the PV module is 100% was achieved, LCOE decreases to 257,770 $/MWh. Our observation of the LCOE results is that the ideal penetration considering the LCOE is 70% to 100%. This result means that the PV system becomes optimal at the penetration value between 271,697 $/MWh to 257,770 $/MWh.
Figure 16 shows the change in LCOE vs. PV penetration with data from Table 5. The trend equation for the relationship between LCOE vs. PV penetration is expressed in linear regression form as Equation (25). Y is the LCOE value, and x is the penetration value with the coefficient of determination (R2) = 99.9%. The maximum cost (299.554 $/MWh) occurred in penetration of 10%, and contras when penetration 100%, the energy production cost was filled the minimum value 260 $/MWh. So we conclude that the range of LCOE the system proposed is 260 $/MWh to 299.554 $/MWh.
Y = −0.4732 (x) + 304.44
Short-circuit analysis was carried out to determine the maximum short-circuit current that the system can accept before the penetration of the PV system. Short circuit analysis was carried out based on the symmetrical short-circuit breaking current (Ib) parameter. In this study, the fault analyzed is a three-phase short circuit. From the short circuit analysis results, it was known that the short circuit breaker capacity (Ib) for the system voltage at 20 kV that Ib was between a minimum of 12.5 kA and a maximum of 14 kA.
The results of the analysis of energy production costs in the hybrid system that we describe in Table 3 show that there are differences in the ratio of costs to population. If we compare with reference [13], that the cost of energy production to the population is 0.00006 MWh/person, while our results show a significant difference, namely 0.02635 MWh/person. This happens because the analysis aspect in reference [13] does not involve PV penetration, wind speed that affects the possibility of shading and the response system to PV penetration varies.

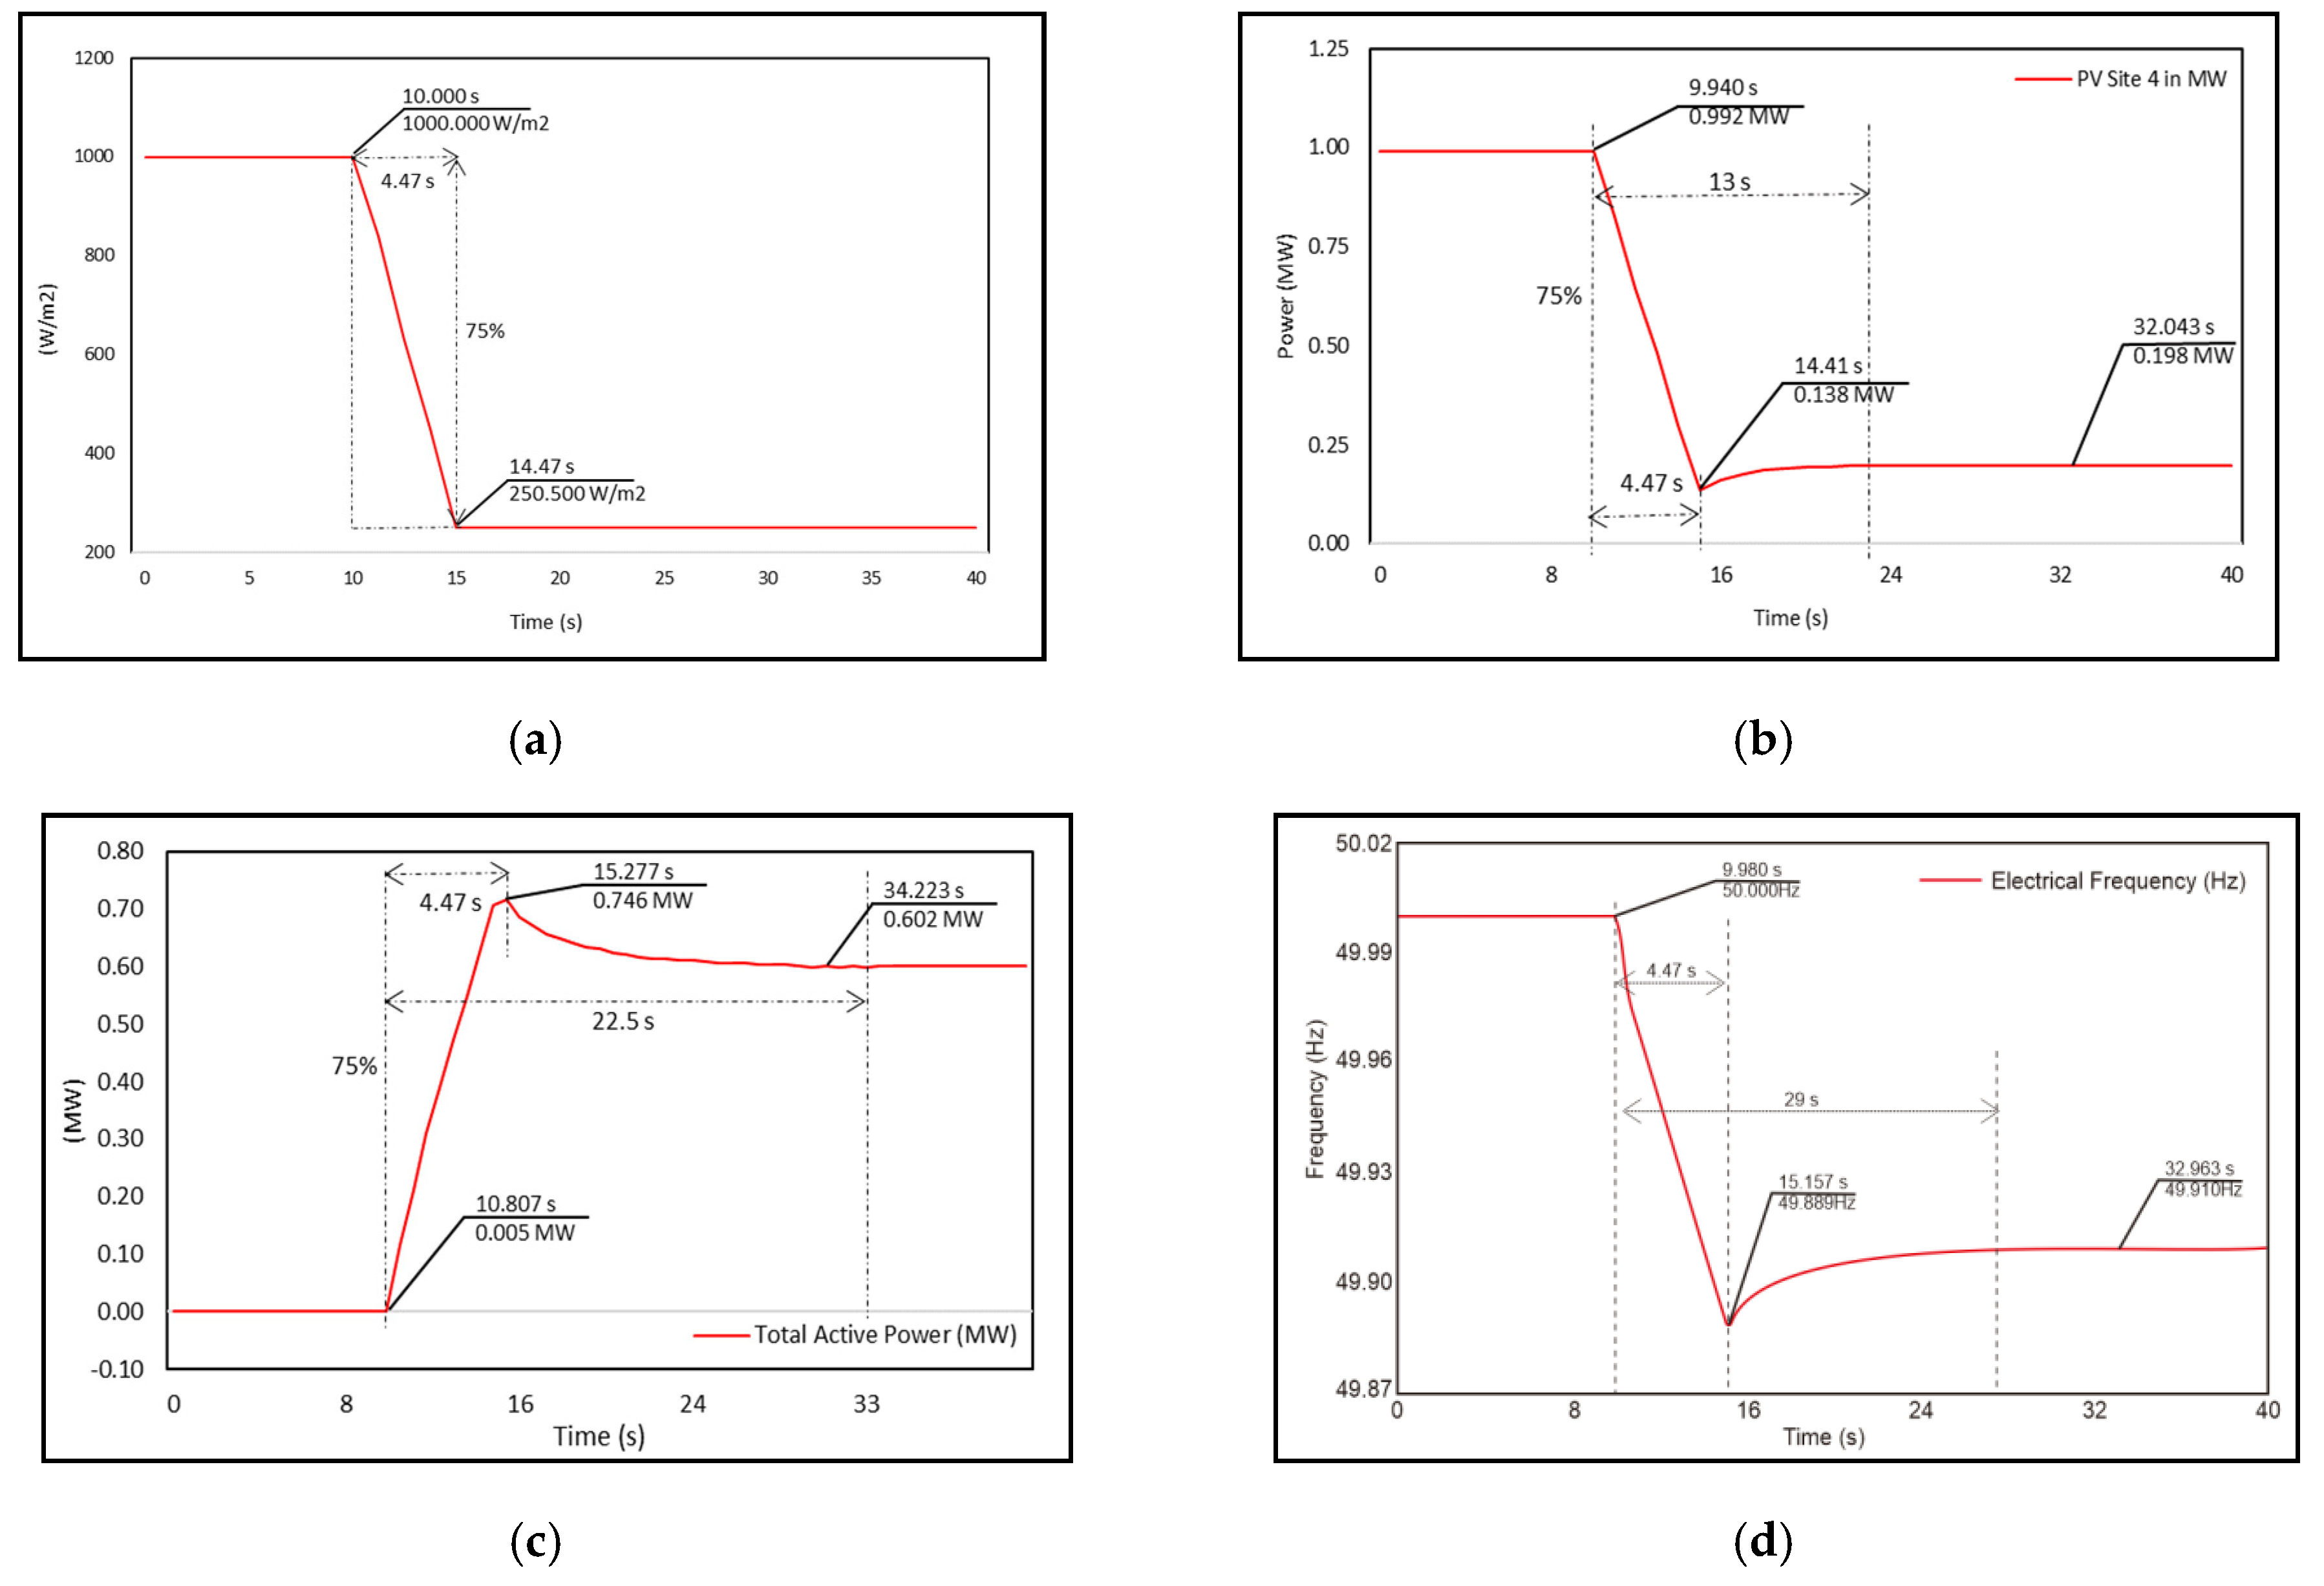
4.5. System Response Analysis vs. Irradiation Reduction

To ensure that the system can run properly, we simulate the system response to disturbances in the PV system. There is a decrease in electricity production performance in the PV system by up to 75%. Figure 17a–d shows the simulation results on the response of the PV system, active power, battery, and frequency.
This test also determines the system response in conditions where the PV suddenly loses irradiation due to blocking from the cloud. The scenario used here is a 75% decrease in irradiation or a reduction in the average solar irradiation power from 1000 W/m2 to 250 W/m2. Using Equation (18) and the data in Table 1 and the load power (PPV) is 0.99 MW, and then the performance degradation ( ζ ) is 75%, the average wind speed (Vw) in the PV field is 18 m/s, the land area (a) is 11.300 m2, then the delay (t) can be known as 4.47 s. We have proven this result through simulation with the DigSilent Power Factory program, as shown in Figure 17a. It appears that there is a significant decrease in solar irradiation from 1000 W/m2 to 250 W/m2. The total response time according to calculations using (18) is 4.47 s.
The decrease in PV penetration to 75% also impacts the active power output from 0.992 MW to 0.138 MW in 4.47 s and then steady at 0.198 MW. In Figure 17b, it appears that the total response time from when the system is disturbed until it reaches steady is 13 s. This transient time is quite good and acceptable. The battery system also exhibited the opposite behavior. Figure 17c shows that the power in the battery system increases significantly from 0 MW to 0.746 MW in 4.47 s, then slowly becomes steady at 0.602 MW. Figure 17c also shows the total response of the system since receiving the disturbance to a constant value is 22.5 s. The disruption in the form of a 75% decrease in irradiation also impacts the frequency provided by the system. Figure 17d shows the change in system frequency from 50 Hz to 49.89 Hz and then becomes steady at 49.91 Hz. Figure 17d also indicates that the total response of the system from receiving the disturbance to steady in 22.5 s. From the simulation results, it appears that the decrease in irradiation is up to 75%. And the power quality of the system is still entirely accepted because it seems that the lowest frequency occurs at 49,889 Hz. This frequency value is still acceptable. Besides that, the battery system also has an excellent response to the decrease in irradiation.
From the simulation results, the mapping of operational characteristics of the electricity load on the island of Karimunjawa has been successfully conducted. The loading system consists of a PV system, DPP system, and battery in a hybrid coordination chart, as shown in Figure 17a–d, using Table 5. The daily electrical load for 2022 is adopted as Figure 10.
Figure 18 shows the operational curve of a hybrid system involving three different systems, the PV system, DPP system, and battery system, during a 24-h operation. Three types of strategies to support the daily electricity load on the island of Karimunjawa. As the energy demand forecasting in Figure 8 shows, the peak load reaches 1.4 MW. The average daily electricity load is 0.9 MW, so from a general point of view, the 24-h operation of the system starts at 00:00 and ends at 23:00. It shows that in Figure 18, the energy consumption characteristic curve follows the characteristics shown in Figure 8. There are four transition sessions in the hybrid system operation (A1, A2, A3, and A4) as in Figure 18, the point in A1 is the switch over from DPP to the battery system, and A2 is the switch from battery to PV and A3 is the switch over from PV to batt system, and A4 is from batt to DPP. At 00:00, the system load is supplied from DPP until the state on A1 occurs at 5:00. A1 operates for 3 h, and then at 08:00, when the PV system begins to receive solar irradiation, the system switching (A2) occurs. The PV system operates for 7 h, then at 15:00, a system switch occurs, where the load supplied from the PV system switches to the battery system (A3). The battery system runs for 5 h, and then at 20:00, the system switches from battery to DPP. DPP operates for 9 h. The operational description above shows that for 24 h, the DPP system works for 9 h, the battery system operates for 8 h, and the PV system operates for 7 h. Solar irradiation with a value more excellent than the load occurs from 10:00 to 12:00. Table 6 shows the mapping hybrid operational schedule form time 00:00 to 23:00.
The simulations and observations show an interesting fact: there is great potential for supplying electrical energy from PV and DPP systems. However, DPP is a source of diesel fuel, which produces carbon emissions that can disrupt the ecosystem around the island of Karimunjawa. Therefore, in this article, we recommend replacing DPP with a low-carbon power source. Several low-carbon power sources are recommended, from the sea breeze, ocean waves, PV. The technology for converting ocean waves into electricity that can be applied is the oscillating water column (OWC) because, in addition to generating electricity, OWC can also protect a beach from abrasion [50,53]. Using low carbon sources is a real effort in the United Nations program on a sustainable, low carbon environment.

5. Conclusions

The load characteristics for Karimunjawa Island are concentrated from morning to evening. However, we have successfully designed a power system model based on a hybrid PV system and a DPP system on a densely populated tourist island. Our proposed power system model has been successfully tested using the Digsilent Power Factory program.
Although Karimunjawa Island is an offshore island, the average wind speed is minimal, so a wind power system with a turbine designed to operate at high speed is not feasible to implement.
In this study, the performance of the Karimunjawa electricity system before the PLTS penetration was quite good, with losses of 1.01%. However, because the essential cost of generation is relatively high, namely 0.445 USD/kWh, the solution to reduce EPC is carried out by penetrating the PV System. Based on the study results, it can be concluded that if penetration of hybrid power plants is to be carried out, the best composition for hybrid power plants is as shown in Table 1. The penetration of hybrid power plants with this composition indicates that the system EPC will decrease, power flow, short circuit current level, and transient when a decrease in irradiance from 100% to 25%. The number of PV modules is 3889 units, and the required land area is 1.41 ha. Type PV is polycrystalline, and battery capacity is 3.3 MAh.
The simulation results show the power system performance after PV penetration is 4.47 s. This response is acceptable, and even losses drop to 1.00%. Besides that, the simulation results also show satisfactory power flow quality, short circuit ratio, and the condition of intermittency when irradiation decreases from 100% to 25%, the frequency is still above the limit of 49.5 Hz.
The implementation of PV on Karimunjawa Island can guarantee the availability of extra energy. However, the use of PV systems still can produce high carbon emissions in the PV module production process. In addition, another fact is that PV waste is unrecycled. Considering sustainable low-carbon power generation, we propose further research on the technology of heat-collector or thermal collector systems for electricity sources as a low-carbon alternative.

Author Contributions

Conceptualization, N.H. and N.B; methodology, S.S. and N.N.; software, N.H. and A.S.; validation, N.B. and S.S.; formal analysis, N.N. and A.S.; writing—original draft, N.H., N.B. and A.S. All authors have read and agreed to the published version of the manuscript.

Funding

This research was funded by Universitas Siliwangi and the Ministry of Education, Culture, Research, and the Technology Republic of Indonesia.

Institutional Review Board Statement

Not applicable.

Informed Consent Statement

Not applicable.

Data Availability Statement

Not applicable.

Acknowledgments

The author thanks those who have supported this research. To the University of Siliwangi, to the regional government of the province of Central Java, especially DISPARBUD Jepara. Ministry of Education and Culture of Indonesia and other parties who have directly or indirectly supported this paper.

Conflicts of Interest

The authors declare no conflict of interest.

Nomenclature

SymbolDescriptionUnit
EDEGA diesel generator’s hourly energy outputWh
PDEGa rate of power output Watt
ηDEGthe diesel generator efficiency%
EPVGThe daily energy in hourly that produced from solar radiationWh
G(t)the hourly irradiance in kWh/m2
PPV penetration level factor
Athe surface aream2
ηPVGThe efficiency of PV generator%
λsolar radiation
cspeed of light = 299,792,458(m/s)
hConstanta Planck = 6.62607015×10⁻³⁴ J⋅sJoule. second
Ephoton energyJoule
EPVG-IN(t)the hourly energy output from the inverterkWh
EPVG(t)the hourly energy output of the PVkW
ηINVthe efficiency of the inverter%
EBAT-INV(t)the hourly energy output from the inverterkWh
EBAT(t − 1)the energy stored in a battery at hour t − 1kWh
ELOAD(t)the hourly energy consumed by the load sidekWh
η I N V the efficiency of the inverter%
η D C H G The battery discharging efficiency%
B c a p battery capacityAh
ICurrent capacityA
tduration of operation hour
Ekthe energy needed by consumersWatt
VNominal voltageVDC
c o s φ Power Factor
η D C H G the battery discharging efficiency%
η I N V the efficiency of the inverter%
I S C R max current limit on current breaker module responseA
S c Interconnect point apparent power capacityMVA
P g interconnect generator active power capacityMW
LCOELevelized Cost of Energy
EPCElectric Production Cost
Itinvestment in year tUSD
Mtoperating and maintenance costs in year tUSD
Ftfuel cost in year tUSD
Etthe electrical energy produced in year tWh
rdiscount rate
nsystem operational periodYear
P V T O T Total PV moduleUnit
N M o d u l Total number of PV moduleUnit
N S t r i n g Number of stringsUnit
N A r r a y Number of arraysUnit
V i d c converter output voltageVolt
V m p p maximum output voltage of the solar panelVolt
VuDC voltage to obtain AC voltageVolt
Maconstanta of inverter modulastio index%
PApower produced by one arrayWatt
Pstringstring powerWatt
PVAreaSolar field area requirementsWatt
APVarea of PV modulesm2
ζ PV performance drop%
PPVPV powerWatt
mpower drop gradientMW/s
Vwwind speed around PVm/s
aPV field aream2
C I clearness index%
R2coefficient of determination
Irr(monthly)monthly solar irradiationkWh/m2/day
I r r ( d a i l y ) daily solar irradiation%
VWINDrate of wind speedm/s

Appendix A

Energies 14 08311 i001

Appendix B

Energies 14 08311 i002

References

  1. RUPTL PLN. Rencana Usaha Penyediaan Tenaga Listrik PT. PLN (PERSERO) 2019–2028; State Electricity Enterprise, RUPTL PLN: Jakarta, Indonesia, 2019. [Google Scholar]
  2. Bagaskara, A. Skema Pola Operasi Pembangkit Listrik Hybrid, PLTS-PLTD-Baterai, Dengan Tingkat Penetrasi PLTS Tinggi; State Electricity Enterprise: Jakarta, Indonesia, 2018. [Google Scholar]
  3. Zulfakar, J.; Banartama, A. Sistem Tenaga Listrik Tenaga Hybrid (PLTH) Yang Dibuat Di Kedubes Austrian. Elektro. Undip. Ac. Id. 1953, 7. Available online: http://www.elektro.undip.ac.id/el_kpta/wp-content/uploads/2012/05/L2F606059_MKP.pdf (accessed on 9 September 2021).
  4. Moghaddam, S.; Bigdeli, M.; Moradlou, M.; Siano, P. Designing of stand-alone hybrid PV/wind/battery system using improved crow search algorithm considering reliability index. Int. J. Energy Environ. Eng. 2019, 10, 429–449. [Google Scholar] [CrossRef] [Green Version]
  5. Teleke, S.; Member, S.; Baran, M.E.; Member, S.; Bhattacharya, S.; Huang, A.Q. Rule-Based Control of Battery Energy Storage for Dispatching Intermittent Renewable Sources. IEEE Trans. Sustain. Energy 2010, 1, 117–124. [Google Scholar] [CrossRef]
  6. Hiron, N.; Andang, A.; Mubarok, H. Energy Information System (EIS) As Energy Mix Projections with Trend Analysis Approach for The Scenario Achievement of the National Energy Policy in 2025. In Proceedings of the 14 International Conference on QIR, 2015; pp. 679–763. Available online: https://qir.eng.ui.ac.id/wp-content/uploads/2016/08/Qir-Proceeding-2015.pdf (accessed on 9 September 2021).
  7. NREL. Life Cycle Greenhouse Gas Emissions from Solar Photovoltaics. Renew. Sustain. Energy Rev. 2012, 50, 80. [Google Scholar]
  8. Hu, A.H.; Huang, L.H.; Lou, S.; Kuo, C.H.; Huang, C.Y.; Chian, K.J.; Chien, H.T.; Hong, H.F. Assessment of the carbon footprint, social benefit of carbon reduction, and energy payback time of a high-concentration photovoltaic system. Sustainability 2017, 9, 27. [Google Scholar] [CrossRef] [Green Version]
  9. Khaboot, N.; Srithapon, C.; Siritaratiwat, A.; Khunkitti, P. Increasing Benefits in High PV Penetration Distribution System by Using Battery Enegy Storage and Capacitor Placement Based on Salp Swarm Algorithm. Energies 2019, 12, 4817. [Google Scholar] [CrossRef] [Green Version]
  10. Aleem, S.A.; Suhail Hussain, S.M.; Ustun, T.S. A review of strategies to increase PV penetration level in smart grids. Energies 2020, 13, 636. [Google Scholar] [CrossRef] [Green Version]
  11. Oladeji, A.S.; Akorede, M.F.; Aliyu, S.; Mohammed, A.A.; Salami, A.W. Simulation-based optimization of hybrid renewable energy system for off-grid rural electrification. Int. J. Renew. Energy Dev. 2021, 10, 667–686. [Google Scholar] [CrossRef]
  12. Sawle, Y.; Gupta, S.C.; Bohre, A.K. PV-wind hybrid system: A review with case study. Cogent Eng. 2016, 3, 1189305. [Google Scholar] [CrossRef]
  13. Susanto, I.; Sunanda, W.; Gusa, R.F.; Kurniawan, R.; Tiandho, Y. Hybrid of Photovoltaic and Diesel Power Plant in Celagen Island. In IOP Conference Series: Earth and Environmental Science; IOP Publishing: Bristol, UK, 2020; Volume 463. [Google Scholar] [CrossRef] [Green Version]
  14. Syahputra, R.; Soesanti, I. Planning of hybrid micro-hydro and solar photovoltaic systems for rural areas of central Java, Indonesia. J. Electr. Comput. Eng. 2020, 2020, 5972342. [Google Scholar] [CrossRef] [Green Version]
  15. Hiron, N.; Andang, A.; Busaeri, N. Investigation of NdFeB N52 Magnet Field as Advanced Material at Air Gap of Axial Electrical Generator. In IOP Conference Series: Materials Science and Engineering; IOP Publishing: Bristol, UK, 2019; Volume 550. [Google Scholar] [CrossRef]
  16. Jakhrani, A.Q.; Rigit, A.R.H.; Othman, A.K.; Samo, S.R.; Kamboh, S.A. Estimation of carbon footprints from diesel generator emissions. In Proceedings of the International Conference in Green and Ubiquitous Technology, Jakarta, Indonesia, 7–8 July 2012; pp. 78–81. [Google Scholar] [CrossRef]
  17. Roh, G.; Kim, H.; Jeon, H.; Yoon, K. Fuel consumption and CO2 emission reductions of ships powered by a fuel-cell-based hybrid power source. J. Mar. Sci. Eng. 2019, 7, 230. [Google Scholar] [CrossRef] [Green Version]
  18. Ghaderi, M.; Javadikia, H.; Naderloo, L.; Mostafaei, M.; Rabbani, H. An analysis of noise pollution emitted by moving MF285 Tractor using different mixtures of biodiesel, bioethanol and diesel through artificial intelligence. J. Low Freq. Noise Vib. Act. Control 2019, 38, 270–281. [Google Scholar] [CrossRef] [Green Version]
  19. Burke, B.J. A Record for Plant Efficiency. Diesel Gas Turbine Worldw. 2018. Available online: https://www.dieselgasturbine.com/news/a-record-for-plant-efficiency/7005451 (accessed on 9 September 2021).
  20. Benhamed, S.; Ibrahim, H.; Belmokhtar, K.; Hosni, H.; Ilinca, A.; Rousse, D.; Chandra, A.; Ramdenee, D. Dynamic modeling of diesel generator based on electrical and mechanical aspects. In Proceedings of the IEEE Electrical Power and Energy Conference EPEC, Ottawa, ON, Canada, 12–14 October 2016. [Google Scholar] [CrossRef]
  21. Hiron, N.; Andang, A.; Busaeri, N. Investigation of Wireless Communication from Under Seawater to Open Air with Xbee Pro S2B Based on IEEE 802.15.4 (Case Study: West Java Pangandaran Offshore Indonesia). Adv. Intell. Syst. Comput. 2019, 881, 672–681. [Google Scholar]
  22. Ani, V.A. Design of a Reliable Hybrid (PV/Diesel) Power System with Energy Storage in Batteries for Remote Residential Home. J. Energy 2016, 2016, 1–16. [Google Scholar] [CrossRef] [Green Version]
  23. Tambunan, H.B.; Hakam, D.F.; Prahastono, I.; Pharmatrisanti, A.; Purnomoadi, A.P.; Aisyah, S.; Wicaksono, Y.; Sandy, I. The challenges and opportunities of renewable energy source (RES) penetration in Indonesia: Case study of Java-Bali power system. Energies 2020, 13, 5903. [Google Scholar] [CrossRef]
  24. Nazara, S.; Amir, H. Kajian Analisis Dampak Insentif Fiskal terhadap Investasi dan Harga Listrik dan Energi Terbarukan. 2018. Available online: https://fiskal.kemenkeu.go.id/data/document/2019/kajian/KajianAnalisisDampakInsentifFiskal.pdf (accessed on 9 September 2021).
  25. Nurhayati, T. Pemodelan sistem pembangkit hybrid energi solar dan angin. Elektrika 2018, 10, 28–32. [Google Scholar]
  26. Wu, J.; Lan, Z.; Lin, J.; Huang, M.; Huang, Y.; Fan, L.; Luo, G.; Lin, Y.; Xie, Y.; Wei, Y. Counter electrodes in dye-sensitized solar cells. Chem. Soc. Rev. 2017, 46, 5975–6023. [Google Scholar] [CrossRef] [Green Version]
  27. Surindra, M.D. Analisis Karakteristik Electrical Modul Photovoltaic untuk Pembangkit Listrik Tenaga Surya Skala Laboratorium. Pros. SNST Fak. Tek. 2012, B.74, 74–78. [Google Scholar]
  28. Brigita, W. Studi Dampak Dan Respon Kestabilan Frekuensi Pada Sistem Kelistrikan Pulau Belitung Dengan Beberapa Jenis Konfigurasi Penetrasi Pembangkit Listrik Tenaga Surya; ITB: Surabaya City, Indonesia, 2013. [Google Scholar]
  29. Szott, M.; Wermiński, S.; Jarnut, M.; Kaniewski, J.; Benysek, G. Battery energy storage system for emergency supply and improved reliability of power networks. Energies 2021, 14, 720. [Google Scholar] [CrossRef]
  30. Szott, M.; Jarnut, M.; Kaniewski, J.; Pilimon, Ł.; Wermiński, S. Fault-tolerant control in a peak-power reduction system of a traction substation with multi-string battery energy storage system. Energies 2021, 14, 4565. [Google Scholar] [CrossRef]
  31. Nayak, C.K. Optimal Design of Battery Energy Storage System for Peak Load Shaving and Time of Use Pricing. In Proceedings of the Second International Conference on Electrical, Computer and Communication Technologies (ICECCT), Coimbatore, India, 22–24 February 2017. [Google Scholar] [CrossRef]
  32. Rozegnał, B.; Albrechtowicz, P.; Mamcarz, D.; Radwan-Pragłowska, N.; Cebula, A. The short-circuit protections in hybrid systems with low-power synchronous generators. Energies 2021, 14, 160. [Google Scholar] [CrossRef]
  33. Koseoglu, C.; Altin, N.; Zengin, F.; Kelebek, H.; Sefa, I. A hybrid overload current limiting and short circuit protection scheme for voltage mode inverters. Int. J. Renew. Energy Res. 2020, 10, 407–415. [Google Scholar]
  34. Ates, Y.; Gökçket, T.; Arabul, A.Y. Impact of hybrid power generation on voltage, losses, and electricity cost in distribution networks. Turkish J. Electr. Eng. Comput. Sci. 2021, 29, 1720–1735. [Google Scholar] [CrossRef]
  35. Marignetti, F.; Volpe, G.; Mirimani, S.M.; Cecati, C. Electromagnetic Design and Modeling of a Two-Phase Axial-Flux Printed Circuit Board Motor. IEEE Trans. Ind. Electron. 2018, 65, 67–76. [Google Scholar] [CrossRef]
  36. Wang, Y.; Zhou, S.; Huo, H. Cost and CO2 reductions of solar photovoltaic power generation in China: Perspectives for 2020. Renew. Sustain. Energy Rev. 2014, 39, 370–380. [Google Scholar] [CrossRef]
  37. Šimić, Z.; Topić, D.; Crnogorac, I.; Knežević, G. Method for sizing of a PV system for family home using economic indicators. Energies 2021, 14, 4529. [Google Scholar] [CrossRef]
  38. DISPARBUD. Statistik Kunjungan Wisatawan. 2021. Available online: https://disparbud.jepara.go.id/category/statistik/ (accessed on 19 September 2021).
  39. Setiawan, B.; Rijanta, R.; Baiquni, M. Sustainable Tourism Development: The Adaptation and Resilience of the Rural Communities in (the Tourist Villages of) Karimunjawa, Central Java. Forum Geogr. 2017, 31, 232–245. [Google Scholar] [CrossRef] [Green Version]
  40. Keyhani, A. Design of Smart Power Grid Renewable Energy Systems, 3rd ed.; Wiley-VCH: Weinheim, Germany, 2019. [Google Scholar]
  41. Engerer, N.A.; Mills, F.P. KPV: A clear-sky index for photovoltaics. Sol. Energy 2014, 105, 679–693. [Google Scholar] [CrossRef]
  42. Aldihani, A.; Mahmoud, S.; Al-Dadah, R.K.; Al-Qattan, A. Performance and cost assessment of three different crystalline silicon PV modules in Kuwait environments. Int. J. Renew. Energy Res. 2017, 7, 129–136. [Google Scholar]
  43. Ninla Elmawati Falabiba, “Tourist Visit Report 2017,” Jepara, Indonesia. 2019. Available online: https://disparbud.jepara.go.id/wp-content/uploads/sites/72/2020/01/Statistik-2019.pdf (accessed on 9 September 2021).
  44. Ismanto, A.; Ismunarti, D.H.; Sugianto, D.N.; Maisyarah, S.; Subardjo, P.; Suryoputro, A.A.D.; Siagian, H. The potential of ocean current as electrical power sources alternatives in Karimunjawa Islands Indonesia. Adv. Sci. Technol. Eng. Syst. 2019, 4, 126–133. [Google Scholar] [CrossRef] [Green Version]
  45. Langer, J.; Quist, J.; Blok, K. Review of renewable energy potentials in Indonesia and their contribution to a 100% renewable electricity system. Energies 2021, 14, 7033. [Google Scholar] [CrossRef]
  46. Kalmikov, A. Introduction to Wind Power; University of Wisconsin: Madison, WI, USA, 2014. [Google Scholar] [CrossRef]
  47. Filom, S.; Radfar, S.; Panahi, R.; Amini, E.; Neshat, M. Exploring wind energy potential as a driver of sustainable development in the southern coasts of iran: The importance of wind speed statistical distribution model. Sustainability 2021, 13, 7702. [Google Scholar] [CrossRef]
  48. Ibrahim, M.Z.; Yong, K.H.; Ismail, M.; Albani, A. Spatial analysis of wind potential for Malaysia. Int. J. Renew. Energy Res. 2015, 5, 201–209. [Google Scholar] [CrossRef]
  49. Baffoe, P.E.; Sarpong, D. Selecting Suitable Sites for Wind Energy Development in Ghana. Ghana Min. J. 2016, 16, 8. [Google Scholar] [CrossRef] [Green Version]
  50. Hiron, N.; Giriantari, I.A.D.; Jasa, L.; Kumara, I.N.S. Fish-ridge wind turbine aerodynamics characteristics in Oscillating Water Column (OWC) system. Ocean Syst. Eng. 2021, 11, 141–159. [Google Scholar] [CrossRef]
  51. Hiron, N.; Giriantari, I.A.D.; Jasa, L.; Kumara, I.N.S. The Performance of a Three-blades Fish-ridge Turbine in an Oscillating Water Column System for Low Waves. In Proceedings of the International Conference on Sustainable Engineering and Creative Computing (ICSECC), Bandug, Indonesia, 20–22 August 2019; pp. 30–35. [Google Scholar] [CrossRef]
  52. Gul, M.; Tai, N.; Huang, W.; Nadeem, M.H.; Yu, M. Assessment of wind power potential and economic analysis at Hyderabad in Pakistan: Powering to local communities using wind power. Sustainability 2019, 11, 1391. [Google Scholar] [CrossRef] [Green Version]
  53. Empung, N.H.; Chobir, A. Oscillating Water Column (OWC) Building Performance Analysis as Beach Abrasion Reducing. IIOAB J. 2016, 7, 515–520. [Google Scholar]
Figure 1. PV efficiency research developments of various types from 1975 to 2020 [26].
Energies 14 08311 g001
Figure 2. Karimunjawa Island maps.
Energies 14 08311 g002
Figure 3. The location of the DPP system and load distribution on the island of Karimunjawa.
Energies 14 08311 g003
Figure 4. Tourist visit to Karimunjawa Island 2014–2020.
Energies 14 08311 g004
Figure 5. Line diagram of the system proposed with DPP-PV.
Energies 14 08311 g005
Figure 6. Load distribution and PV, DPP system location.
Energies 14 08311 g006
Figure 7. Daily power consumption.
Energies 14 08311 g007
Figure 8. Forecasting the daily electricity demand in 2022.
Energies 14 08311 g008
Figure 9. Schematic hybrid system.
Energies 14 08311 g009
Figure 10. Daily characteristic irradiation on Karimunjawa Island.
Energies 14 08311 g010
Figure 11. Daily solar irradiance in Karimunjawa.
Energies 14 08311 g011
Figure 12. Wind velocity in Indonesia based on Global Wind Altas [43].
Energies 14 08311 g012
Figure 13. Wind velocity distribution in Karimunjawa Island with a variety of elevations based on global wind altas website (a) 10 m; (b) 50 m; (c) 100 m.
Energies 14 08311 g013
Figure 14. Rate monthly wind velocity in Karimunjawa Island form data base of Homer Energy.
Energies 14 08311 g014
Figure 15. System Power Flow after penetration of PV system.
Energies 14 08311 g015
Figure 16. Relationship of PV penetration (%) to LCOE.
Energies 14 08311 g016
Figure 17. Respons system analysis; (a) PV system response; (b) PV active power response; (c) Battery system response; (d) Frequency system response.
Energies 14 08311 g017
Figure 18. Hybrid system operational cycle.
Energies 14 08311 g018
Table 1. Hybrid system profile at 100% penetration.
Total Load (MW)PV Field Area (m2)PV System (MW)Battery (MAh)DPP System (MW)LCOE ($/kWh)V Wind (m/s)
1.4111.3000.994.12 × 2.7257.77018
Table 3. LCOE and EPC calculation variables.
NoItemValueContribution (%)
1It = Investation (USD)288.3396.76%
2Mt = OM Cost (USD)9.593.22%
3Ft = Fuel cost (USD)510.02%
4Et = Energy produced (MWh)966.47100%
Table 4. LCOE and EPC.
Penetration (%)LCOE = EPC ($/MWh)
10299.554
20294.911
30290.269
40285.626
50280.983
60276.340
70271.697
80265.827
90261.184
100257.770
Table 5. PV system short circuit analysis.
SubstationIb (kA)
Legon Bajak0.65173
Table 6. Mapping hybrid operational schedule.
TimeLoad (kW)PV (kW)DPP (kW)Batt Charge (kW)Batt Discharge (kW)
0:0011260112600
1:0011050110500
2:0010520105200
3:0010310103100
4:0010440104400
5:0011040110401104
6:001152310001178.8
7:001004846001027
8:0099599503531000
9:0097697607450
10:00942942010130
11:00936936010540
12:0094994909640
13:0098598507460
14:0097497404210
15:00934934011950
16:0092642300950
17:0010030001003
18:0013670001367
19:0014220001422
20:0013770137701390
21:0013510135100
22:0012640126400
23:0011950119500
Publisher’s Note: MDPI stays neutral with regard to jurisdictional claims in published maps and institutional affiliations.

