Article

A Systematic Study to Assess Displacement Performance of a Naturally-Derived Surfactant in Flow Porous Systems

1
Department of Petroleum Engineering, Amirkabir University of Technology (Tehran Polytechnic), Tehran 158754413, Iran
2
Department of Production Engineering, China National Petroleum Corporation International (CNPCI), Tehran 1549943404, Iran
3
Department of Petroleum Engineering, Petroleum University of Technology, Ahwaz 6318714317, Iran
4
Faculty of Engineering and Applied Science, Memorial University, St. John’s, NL A1B 3X7, Canada
5
School of Mining and Geosciences, Nazarbayev University, Nur Sultan 010000, Kazakhstan
*
Author to whom correspondence should be addressed.
Energies 2021, 14(24), 8310; https://doi.org/10.3390/en14248310
Submission received: 30 August 2021 / Revised: 13 November 2021 / Accepted: 17 November 2021 / Published: 9 December 2021

Abstract

:
For the first time, the present work assesses the feasibility of using Korean red ginseng root extract, a non-ionic surfactant, for the purposes of enhanced oil recovery (EOR). The surfactant is characterized by Fourier-transform infrared spectroscopy (FT-IR) analysis. Pendant drop and sessile drop techniques are employed to study the oil–water interfacial tension (IFT) and wettability nature of the sandstone rock, respectively. In addition, oil recovery enhancement is investigated using micromodel and core floods. In the salt-free system, IFT measurements indicate that the surfactant carries a critical micelle concentration of 5 g/L. In a saline medium (up to 50 g/L), the addition of a surfactant with different concentrations leads to an IFT reduction of 47.28–84.21%. In a constant surfactant concentration, a contact angle reduction is observed in the range of 5.61–9.30°, depending on salinity rate, revealing a wettability alteration toward more water-wet. Surfactant flooding in the glass micromodel provides a more uniform sweeping, which leads to an oil recovery enhancement of 3.02–11.19%, depending on the extent of salinity. An optimal salt concentration equal to 30 g/L can be recognized according to the results of previous tests. Surfactant flooding (10 g/L) in optimal salt concentration achieves an additional oil recovery of 7.52% after conventional water flooding.

Graphical Abstract

1. Introduction

The primary phase of oil recovery/production refers to the process that naturally brings oil to the surface. The second production phase, in contrast, utilizes an external energy, such as water or gas injection, to keep the reservoir pressure constant and move the oil from its resting place towards the production wells [1]. Although the daily oil production rate from the oilfields is millions of barrels, these two phases leave more than half of the original oil in place (OOIP) [2,3,4,5,6,7]. An effective strategy to recover the residual oil is enhanced oil recovery (EOR), a generic term for the techniques that aim to increase the oil production rate after the primary and secondary oil recovery phases [8,9,10].
In the chemical EOR techniques, some chemicals (e.g., surfactant, alkaline, and polymer) are injected into the reservoir to create favorable conditions to make the oil more mobile [11,12,13]. Surfactant flooding, a chemical EOR approach, is a process in which a reservoir is subjected to the injection of a slug of surfactants under a specific injection design [14]. With the help of surfactants, the oil recovery is enhanced by lowering the oil–water interfacial tension (IFT), the spontaneous emulsification and micro-emulsification of the trapped oil, the decrease in the interfacial rheological parameters at the oil–water interface, and the wettability alterations in the reservoir rock [15,16]. Surfactants are known as amphiphilic organic components, implying that they constitute hydrophilic heads and hydrophobic tails. The hydrophobic tails are frequently a branched or straight hydrocarbon or fluorocarbon chain, comprising from 8 to 18 carbon atoms [17,18].
Capillary forces are considered the main barriers during the primary and secondary production stages, which can be minimized by surfactant injection [19]. In EOR operations, the capillary number is an important factor that needs to be considered. The capillary number is a dimensionless quantity which shows the ratio of viscous to capillary forces [20]:
N c a = V μ σ cos θ
where V and μ refer to the velocity (m/s) and viscosity (Pa.s) of the displacing fluid, respectively; σ stands for the oil–water IFT (N/m); θ denotes the contact angle; Nca is the dimensionless capillary number.
In an EOR process, an increase in the capillary number by four to six orders of the magnitude is essential to attain a considerable reduction in the saturation of residual oil. Referring to Equation (1), the magnitude of the capillary number can be increased either by lowering the IFT or by changing the contact angle/altering the wettability of the reservoir rock [21]. These two goals can be achieved by using appropriate surfactants.
Several researchers have examined the applicability of surfactants as EOR chemical agents in the petroleum industry. For example, Madani et al. (2019) [20] synthesized an amino-acid-based surfactant (which is eco-friendly); they then performed a mechanistic examination of its applicability for chemical EOR purposes via wettability, IFT, and core flooding tests. Goodarzi and Zendehboudi (2019) [22] employed a mesoscale simulation approach to model water/oil IFT as a function of salt concentration and temperature when a nonionic surfactant was present (hexaethylene glycol monododecyl ether); there was an acceptable match between the modeling results and the experimental data. Hosseini et al. (2019) [23] scrutinized the IFT of crude oil/surfactant solution and surfactant adsorption behavior on calcite rocks in the presence of a magnetic field. Freitas et al. (2019) [24] investigated a combination of nonionic surfactant/mesoporous silica chemical agents to lower the surfactant loss during surfactant injection into reservoirs. Preux et al. (2020) [25] proposed a new numerical simulation-coupled model; they noticed changes in IFT and mobility ratio upon temperature and salinity variations throughout a typical surfactant injection. In addition, there are some experimental and modeling investigation in the literature that focus on IFT change and wettability alteration through various techniques with different energy and environment applications [26,27,28,29,30].
In addition to the technical aspects, the cost and environmental prospects of the surfactants need to be considered to plan (and design) a robust and economical surfactant flooding. As it is environmentally friendly and cost-effective, the application of biodegradable surfactants has recently received increasing attention in petroleum research centers. According to Pordel Shahri et al. [31], the use of Zizyphus Spina Christi leaf extract to improve oil recovery from carbonate reservoirs led to promising outcomes. Ahmadi and Shadizadeh [32,33,34,35,36,37] studied the adsorption behavior and sweep efficiency potential of this surfactant under various process conditions. Moslemizadeh et al. [38] also found that Zizyphus Spina Christi leaf extract is capable of increasing oil recovery from clay-rich reservoirs, as it can strongly inhibit the swelling potential of montmorillonite. Mulberry leaf extract is another biodegradable surfactant that was examined in various research investigations, and its successful performance in improving oil recovery was reported [39,40,41]. The literature also shows the application of Glycyrrhiza Glabora, Trigoonellafoenum-graceum, and Tribulus Terrestris for EOR [42,43,44]. In a recent study, Khayati et al. [45] reported the potential of saponin to reduce the oil–water IFT by 77%. Ghasemi et al. [46] utilized Korean red ginseng root extract as a biodegradable surfactant for inhibiting clay swelling in water-based drilling fluids. It was found that the proposed biosurfactant exhibits great clay swelling inhibition behavior when compared to other common inhibitors. Additionally, by checking the compatibility of the biosurfactant with other drilling mud components, the non-dependency of fluid properties on the biosurfactant was confirmed; however, no further studies are available in the open sources to examine this surfactant as an EOR agent.
In the present study, our plan is to assess the potential of Korean red ginseng root extract, denoted as a “surfactant” throughout the manuscript, in terms of oil–water IFT reduction, wettability alteration, and oil recovery. To achieve this objective, the pendant drop method is employed to measure oil–water IFT. The contact angle measurement technique is utilized to assess the dependency of wettability alterations in the reservoir rock on the surfactant. Finally, oil recovery enhancement is investigated through core and micromodel flooding experiments. According to the results, the proposed surfactant is capable of significantly reducing crude oil–water IFT, altering the wettability toward more water-wet, and improving oil recovery. The surfactant has the characteristic of salt-tolerant, and 30 g/L is recognized as the optimal salt concentration. In this study, using micromodel floods provides the possibility of observing microscopic sweeping behavior in the surfactant solution which, in turn, confirms the displacement efficiency obtained from core flooding experiments.

2. Materials and Methods

2.1. Materials

In this research work, Korean red ginseng root extract is purchased from the local market and utilized to investigate its feature as an EOR agent (or surfactant). It possesses surface-active properties owing to the presence of a considerable amount of ginsenosides [47,48,49]. Figure 1a–c depicts the chemical structures of Rg3, Rg5, and RK1 ginsenosides. The ginsenosides consist of both hydrophobic and hydrophilic groups, which make them favorable to act as surfactants.
A large sandstone plug is taken from the outcrop in south Iran and used for wettability and dynamic core flooding studies. The mineral composition of the sandstone is revealed through X-ray diffraction (XRD, XRD Lab Center, Amirkabir University of Technology, Tehran, Iran). The XRD pattern associated with the main mineral composition is presented in Figure 1d. The grain size of the sandstone sample is obtained by using a scanning electron microscope (SEM, SEM Lab Center, Amirkabir University of Technology, Tehran, Iran). According to the SEM image (see Figure 1d), the grain size is within the range of 150–200 μm, and the grain surface is relatively rough. Several core plugs and thin sections are obtained from the sandstone plug and turned into the oil-wet surface using crude oil. The crude oil is provided from an oilfield in southwest Iran. Table 1 lists the properties and compositions of the crude oil. For IFT and wettability tests, Kerosene is employed as the oleic phase. The density and viscosity of oil are 0.7868 g/cm3 and 1.083 cp at 25 °C and atmospheric pressure, respectively. The sodium chloride (NaCl), supplied from Merck (99.5%, Darmstadt, Germany), is used to make the brine solutions. All the aqueous solutions are obtained using deionized water (DI water) with a pH close to 7 and a conductivity of about 2 μS.

2.2. Methods

Figure 2 illustrates the main steps taken in the current research investigation. First, FT-IR analysis is carried out to characterize the surfactant sample. Then, four experiments are performed to evaluate the performance of the surfactant. The experimental procedures are briefly described in the next sections.

2.2.1. Fourier-Transform Infrared Spectroscopy (FT-IR)

The functional groups of the surfactant are confirmed through FT-IR analysis. A small quantity of the surfactant is mixed with KBr salt and compressed into a small pill. Then, the infrared spectrum under the wavenumber range of 400–4000 cm−1 and the resolution of 4 cm−1 are recorded by an FT-IR spectrometer.

2.2.2. Performance Evaluation of the Surfactant

The performance of the surfactant is assessed through four experiments, including IFT determination using the pendant drop method, contact angle measurements using the sessile drop technique, micromodel floods, and core floods. All experiments and their specifications are tabulated in Table 2.

IFT Measurements

The IFT measurements are conducted using the pendant drop method. Figure 3a demonstrates the pendant drop setup, with three essential parts, including a glass compartment for lighter fluid, an imaging system, and a precise syringe pump for injection of the heavier phase and/or the aqueous phase. For each run, a drop of the aqueous solution is slowly added to the bulk phase (e.g., kerosene), so that the release of the aqueous drop inside kerosene is only due to difference in the densities. After reaching an equilibrium condition, an image is captured using the imaging system. Finally, the IFT is determined by analyzing the images based on the Young–Laplace equation, as given below [50]:
σ = Δ ρ . g . D 2 H
1 H = B 4 S A + B 3 ( S ) 3 B 2 ( S ) 2 + B 1 ( S ) B 0
In Equations (2) and (3), σ symbolizes the IFT ( N m ); Δρ denotes the difference between the densities of the phases ( kg m 3 ); g stands for the acceleration owing to gravity ( m s 2 ); D represents the maximum equatorial diameter; S refers to the shape factor that is equal to d D ; d indicates the horizontal diameter at the distance D from the bottom of the drop (m); H introduces the shape-dependent factor; and A and B i ( i = 1 ,   2 ,   3 ,   4 ) are the empirical constants. The values of the empirical constants and more details about the determination of D and d parameters are presented in Table 3. All the IFT measurements are conducted at 25 °C and atmospheric pressure. The pendant drop method has an error of less than 3%. Based on Equation (2), the densities of both phases are required to calculate IFT. In this research, a densitometer apparatus named DMA-5000 (Anton Par Co., Seoul, Korea) is employed to measure the density of all solutions at atmospheric pressure and a temperature of 25 °C.

Sessile Drop Technique

The sessile drop technique (Figure 3a) is utilized to estimate the effect of surfactant on wettability of the sandstone sample. In this phase, several core plugs are prepared from the sandstone outcrop sample via the Diamond Coring machine (Hilti DD130, Los Angeles, CA, USA), and sliced into several pieces. Then, Ultra-Fine sandpaper is employed to polish the rock slices and reduce their surface roughness, followed by the removal of any salt and contamination using a Soxhlet extractor with methanol. In the next step, the wettability of the slices is altered to the oil-wet state by thermally aging the slices in the crude oil at 75 °C for 28 days (see Figure 3a). The slices are thoroughly washed by kerosene to avoid the slice dissolution. Then, they are dried and placed in the setup chamber, as depicted in Figure 3a. Finally, a drop containing the aqueous phase is placed on the rock slice surface in an environment filled with kerosene; subsequently, a camera captures a high-quality picture of the free drop to examine the contact angle at equilibrium conditions. It should be noted that a video is recorded as soon as the drop is placed on the rock slice and the condition at which the drop’s shape does not change is considered as an equilibrium condition. All measurements are conducted at atmospheric pressure and a temperature of 25 °C. Based on the test replicates, the procedure has an error of less than 4%.

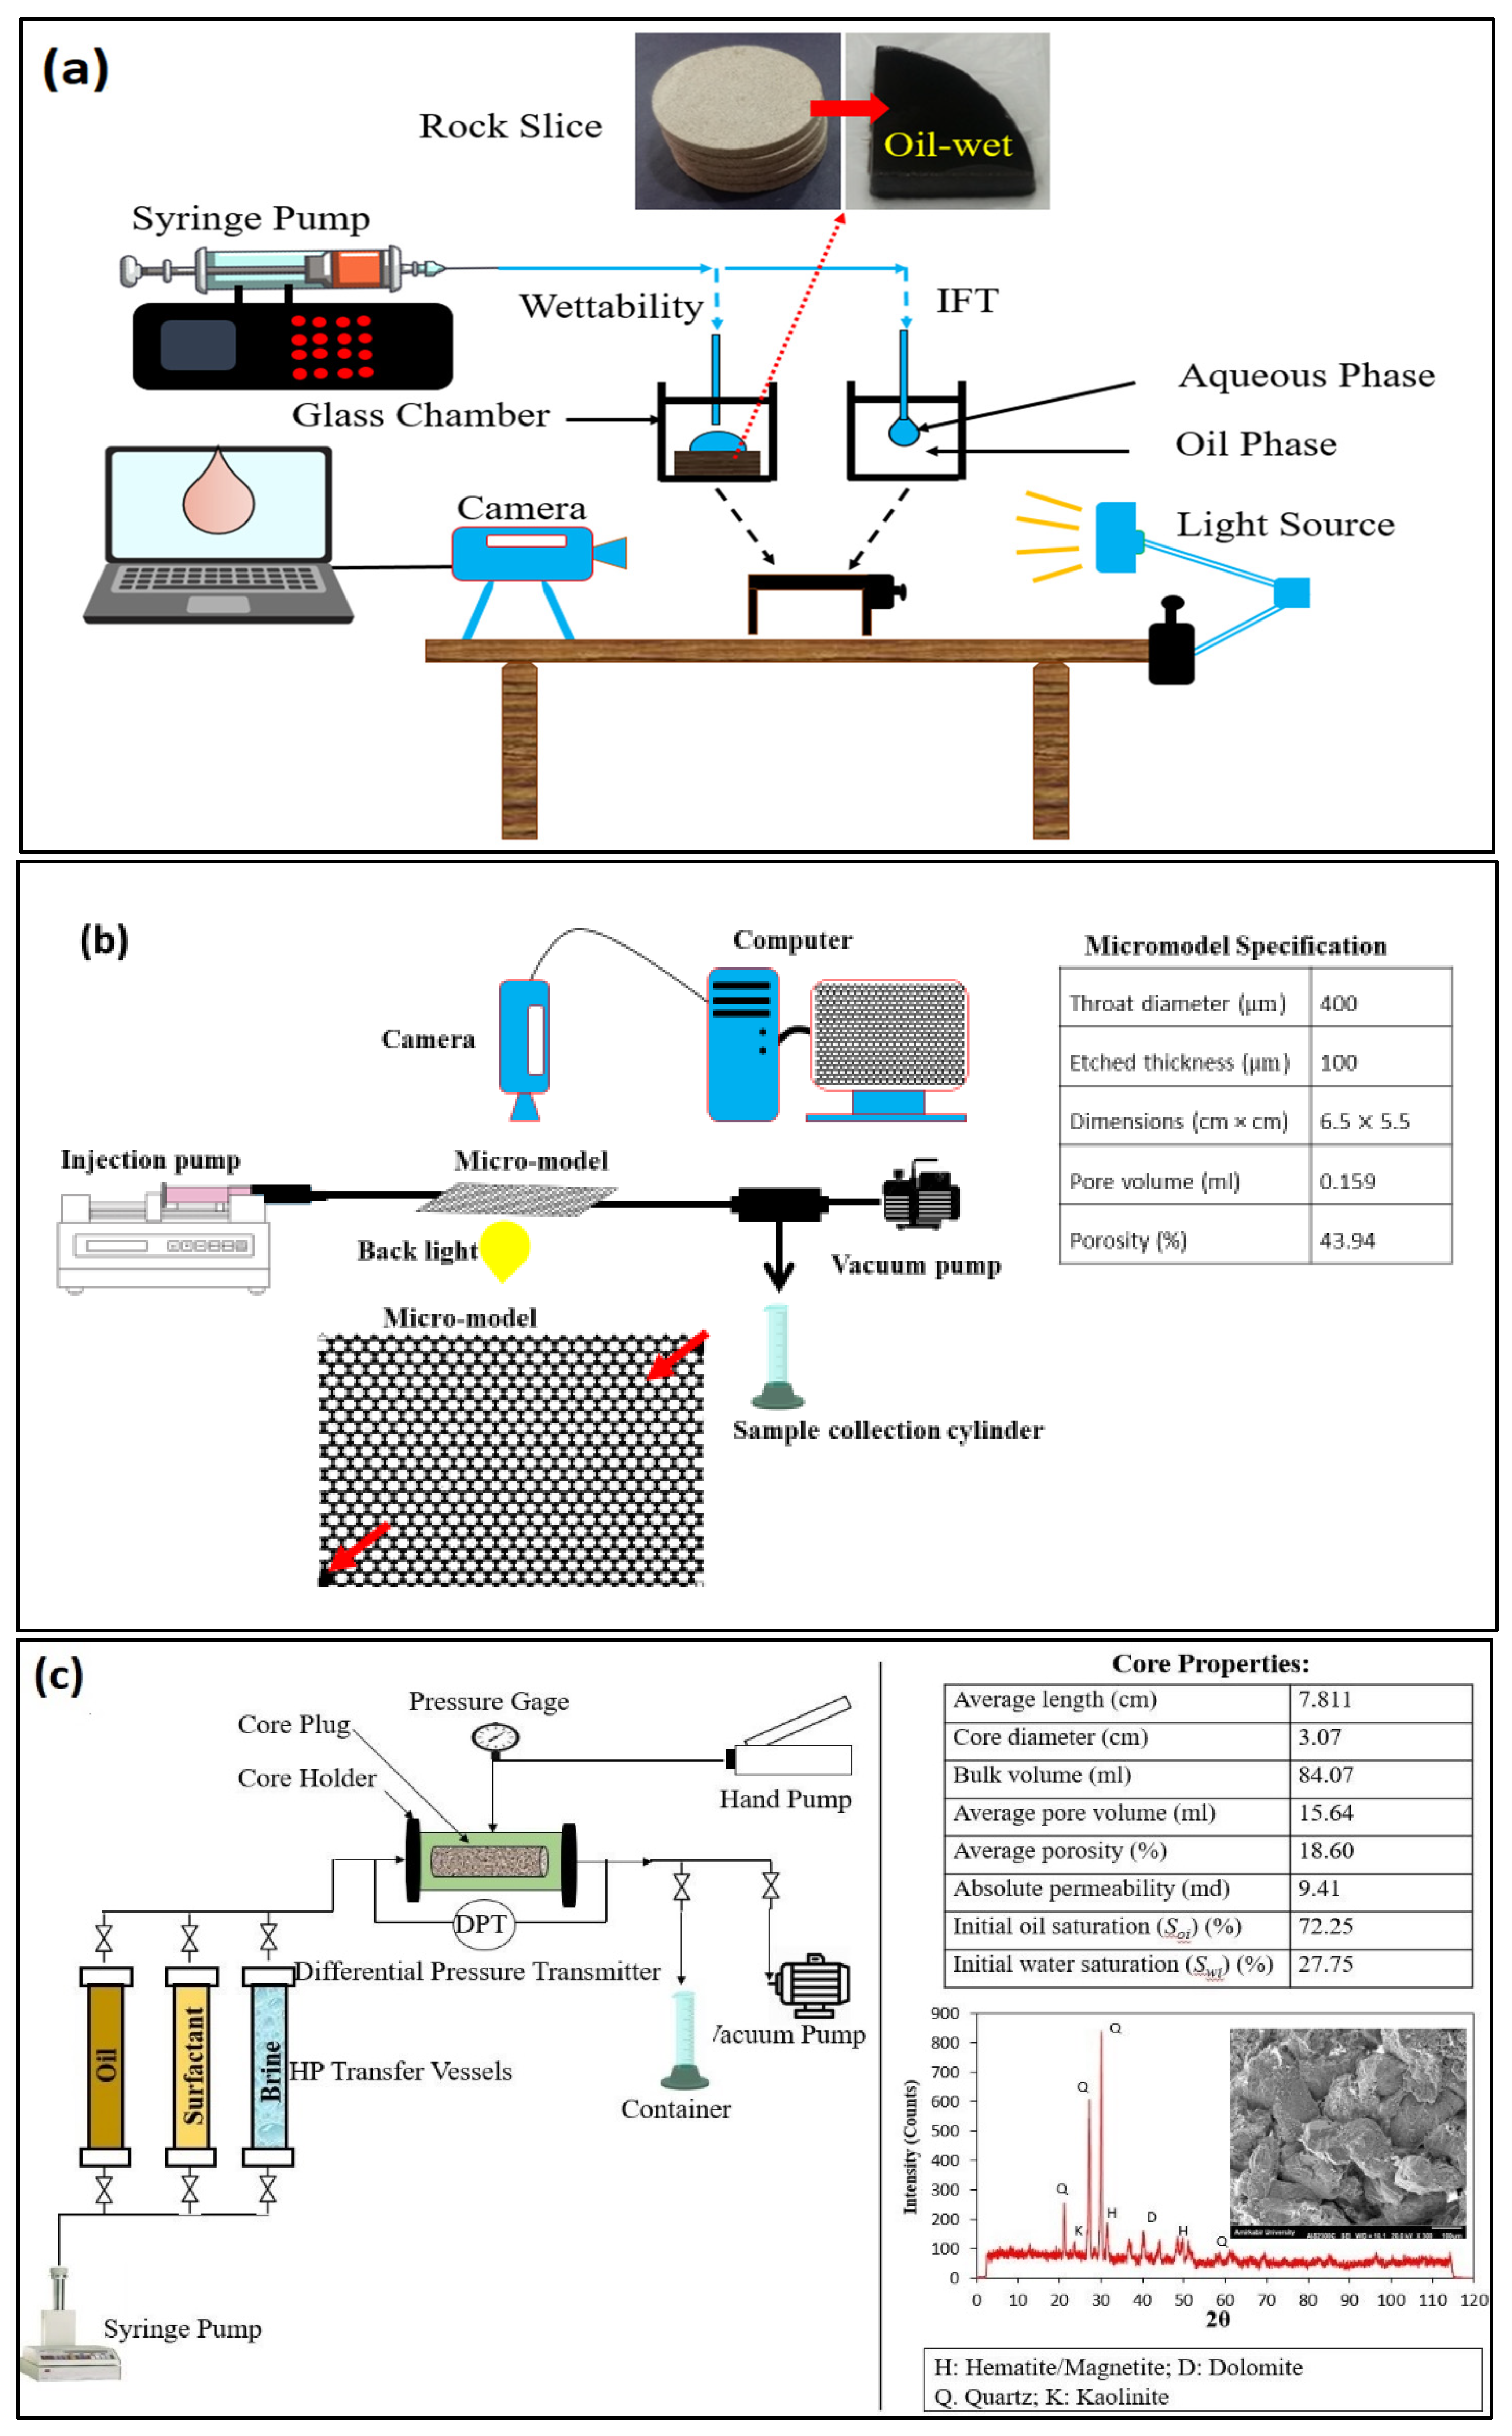
Micromodel Flooding Experiments

The micromodel flood experiments are performed to visually assess the influence of the surfactant on the water flooding sweep efficiency. As seen in Figure 3b, the main parts of the micromodel setup are a glass micromodel, an injection syringe pump, a vacuum pump, a light source beneath the micromodel, and an image-capturing system. For the micromodel construction, a pore network pattern (e.g., homogeneous type) is prepared using a core draw software. This is then engraved onto a glass plate and fused with another glass plate in a furnace under the temperature condition of 700 °C. Figure 3b also reports the specifications of the glass micromodel. The micromodel has two paths open to flow in the two opposite corners. For each run, the micromodel is saturated with the aqueous solutions (DI water, 3 g/L NaCl, 15 g/L NaCl, 30 g/L NaCl, and 50 g/L NaCl) at the injection rate of 0.1 cm3/h. It is then subjected to crude oil flooding to achieve the connate water saturation. After that, the aqueous solutions are re-injected into the micromodel to determine the oil recovery factor. Finally, surfactant flooding (10 g/L) is performed to investigate the possibility of improving oil recovery by the surfactant. The percentage of oil recovery is determined by capturing top-view images of the porous model at different pore volumes of injection and analyzing them using the Pixel analysis approach by considering the amount of the original oil that was place.

Core-Flood Experiments

Figure 3c shows the schematic setup for the core floods. In this phase of the study, the core flood experiments are performed, e.g., water flooding with and without the surfactant. The properties of the sandstone core are given in Figure 3c. The core flood experiments include the following sequences/steps:
  • Core cleaning: The core is washed by the Soxhlet extractor using methanol for 48 h to remove the salt contamination. It is then placed in the oven at 80 °C for 24 h and permitted to cool down under ambient conditions. Then, the core dimensions are measured.
  • Brine saturation: The core plug is placed in the core holder and vacuumed for about 5 h. In the next step, it is completely saturated with NaCl solution of 30 g/L for about 2 h at a constant injection pressure of 500 psi. In this step, the core bulk volume and the volume of the injected brine are obtained to calculate the effective porosity of the core sample. After achieving saturation, the permeability of the core sample is determined through injecting NaCl solution of 30 g/L into the core at different injection rates, according to Darcy’s law. The core properties are presented in Figure 3c.
  • Initial water saturation (Swi) establishment: Swi is maintained by injection of the crude oil into the core with a fixed rate of 0.2 cm3/min until no more brine solution is produced. In this step, the magnitude of Swi can be calculated using the volume of the injected crude oil and core pore volume.
  • Thermal aging: The core is taken out from the core holder and then put inside the crude oil under 75 °C for 28 days. It is then removed and located in the core holder to start the flooding process with and without the surfactant.
  • Flooding: After placing the core into the core holder, a controlling pressure of 2500 psi is employed. Two flooding tests are carried out using the core sample. For the first flood, the core is subjected to an injection of NaCl brine (30 g/L) at a constant injection rate of 0.2 cm3/min until no crude oil is produced. It should be noted that the magnitude of the pressure drop across the core is carefully recorded to determine the breakthrough time. For the second flood, the aqueous solution of the surfactant (10 g/L) containing 30 g/L NaCl is injected into the core. The volume of produced oil at different pore volumes is recorded versus time, and the oil recovery factor is determined as a percentage of OOIP.

3. Results and Discussion

In this section, the results of the performed experiments including FT-IR, IFT measurements, contact angle measurements, and micromodel and core flooding runs are discussed in detail.

3.1. FT-IR Analysis

In this study, the FT-IR spectroscopy result used to characterize the structure of the surfactant is depicted in Figure 4. As ginseng is a complex material, its spectroscopy reveals an overlap in each adsorption spectrum of several components. Each band embodies a total overlap of functional group adsorption peaks in the sample. For instance, the peak seen at 2928 cm−1 corresponds to the stretching vibration of -CH2- functional groups. The peaks in the range of 940–1100 cm−1 imply the C-O-C groups. The peak near 1045 cm−1 represents the C-O vibration peak in the alcohol hydroxyl group. A peak 3400 cm−1 is attributed to the stretching vibration of the O-H functional group.

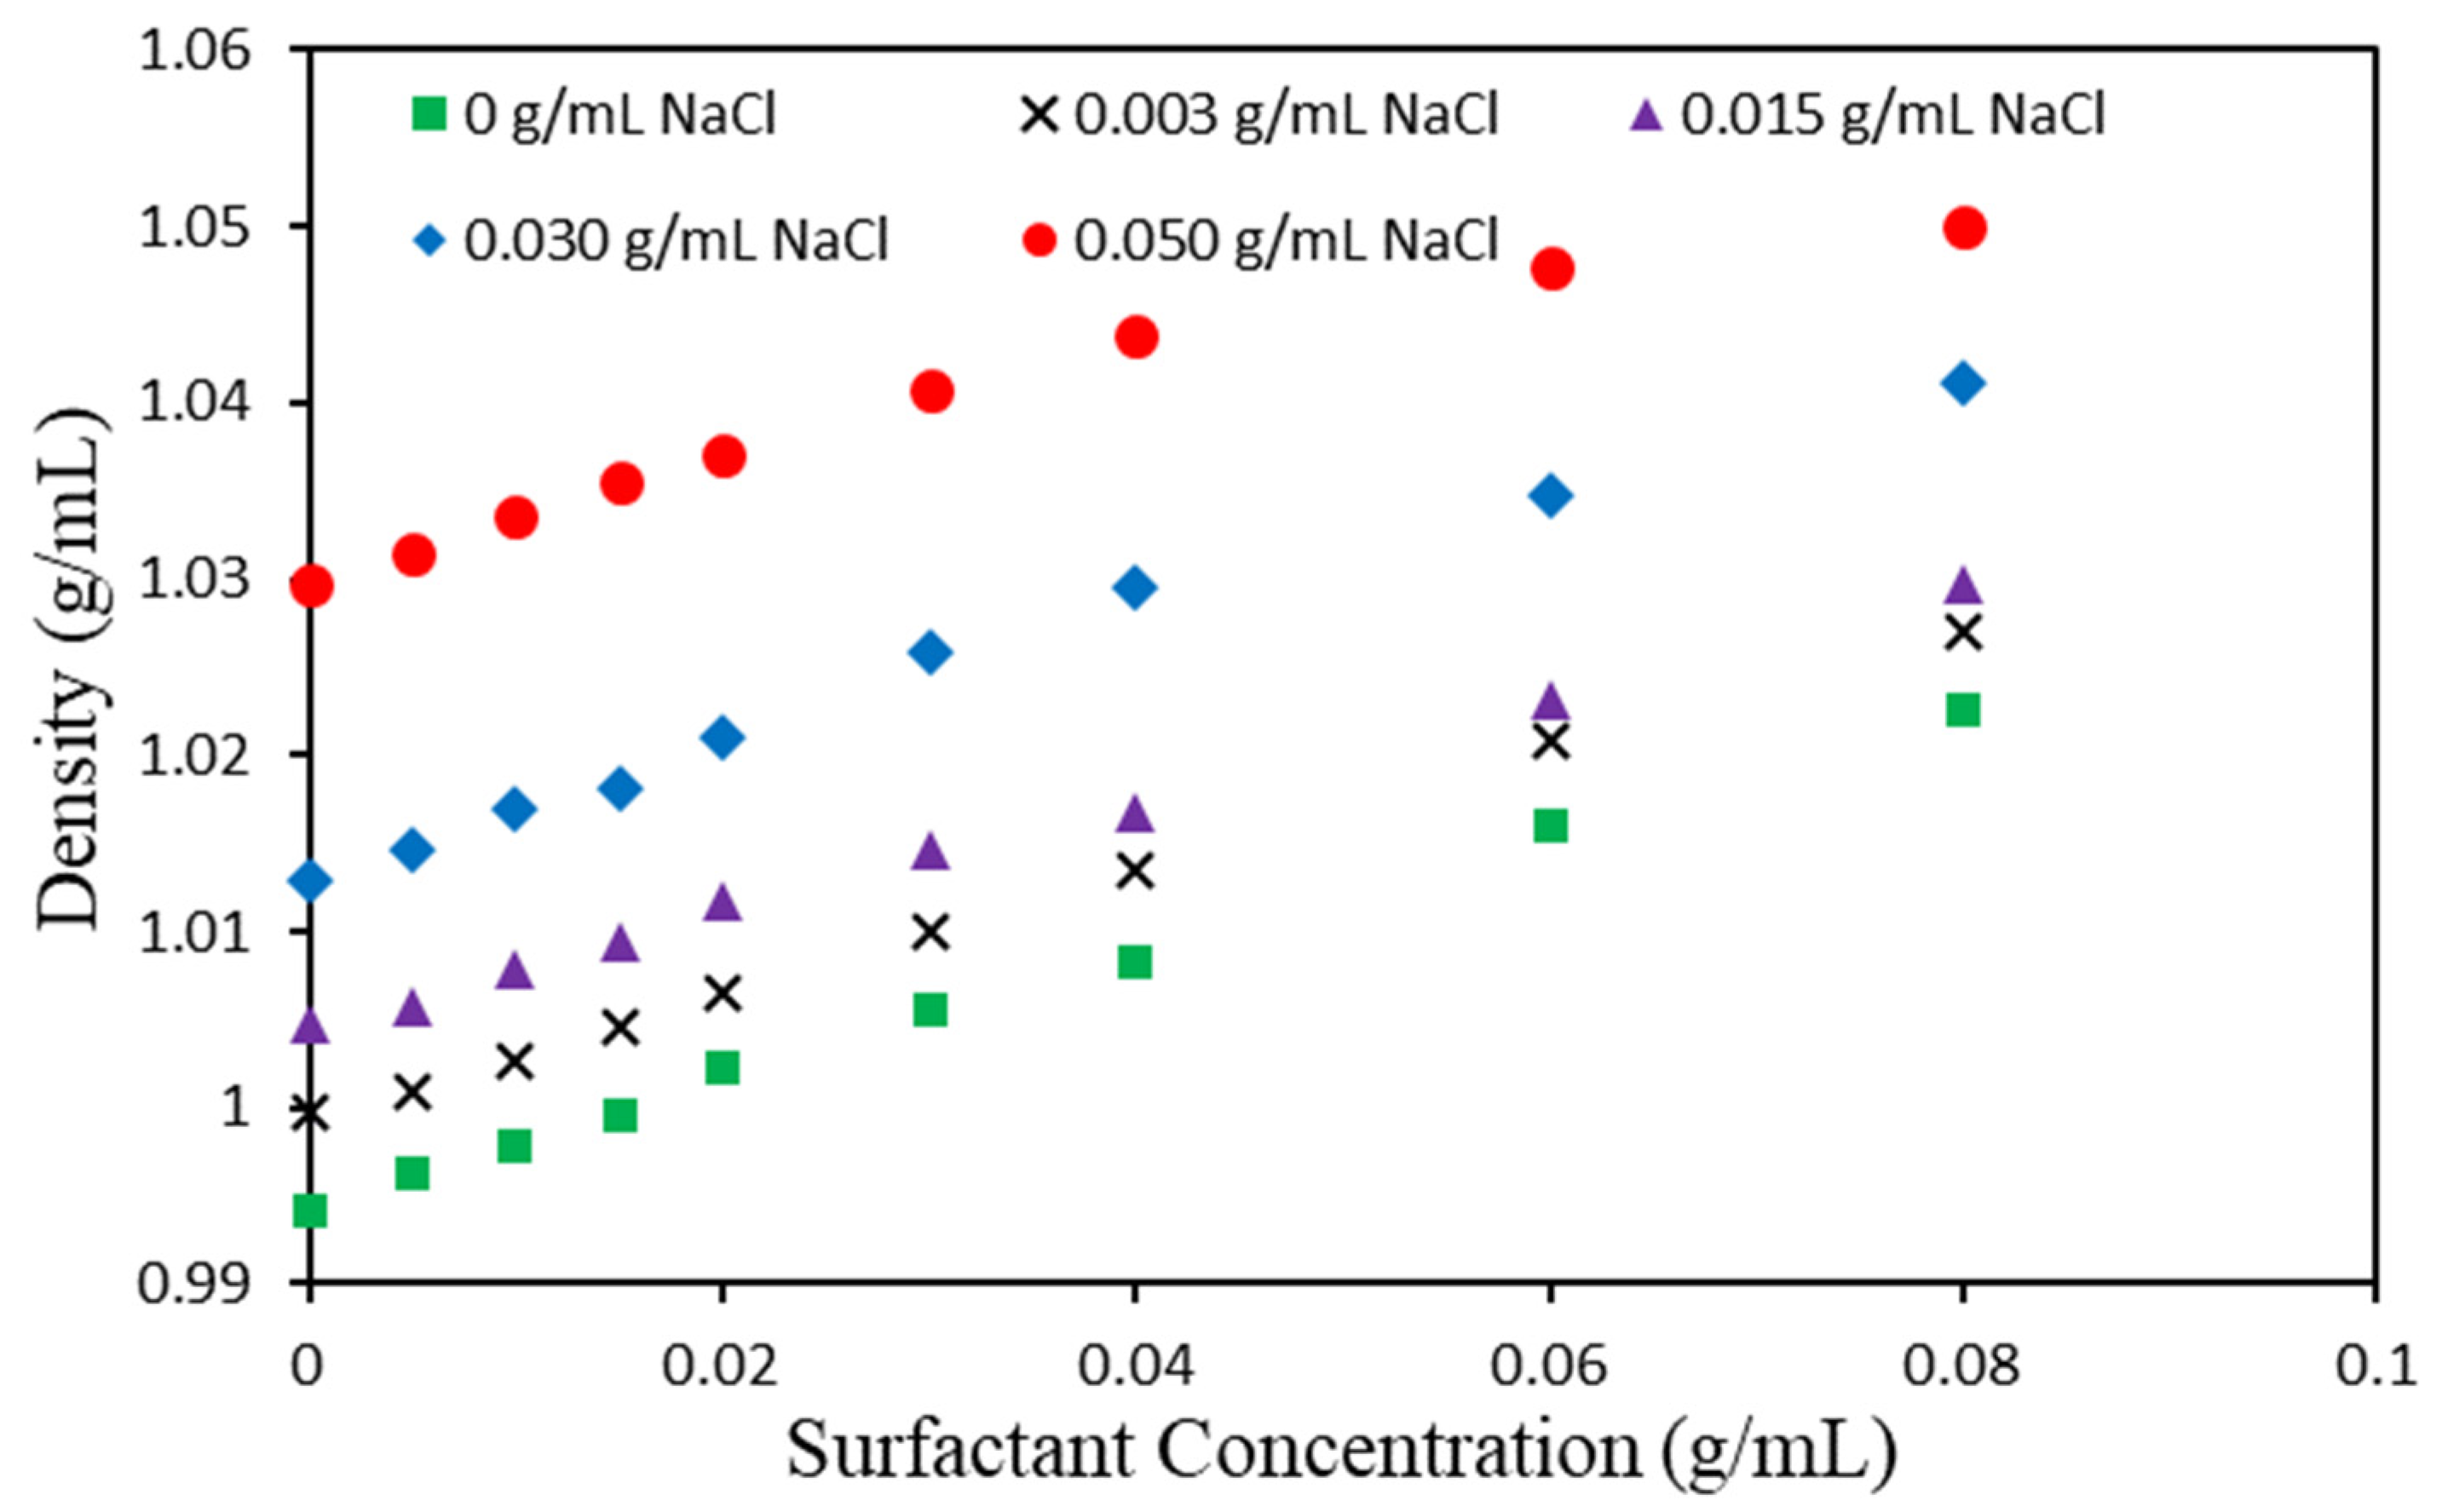
3.2. Determination of Critical Micelle Concentration

Given the fact that the solution density is required to estimate IFT, density values for all the solutions are experimentally measured. Figure 5 illustrates the solution density versus surfactant concentration at various salt concentrations (e.g., 0, 3, 15, 30, and 50 g/L NaCl). While keeping the surfactant concentration constant, increasing the salt dosage increases the solution density. It is also found that an increase in surfactant concentration at a constant salt concentration increases the solution density. This is because when comparing two samples of water with the same volume, the water sample with either an added surfactant and/or salt will have a larger mass, and will, therefore, become denser.
Figure 6 demonstrates the impact of surfactant concentration on the IFT of the oil–aqueous phase for salt-free (e.g., 0 g/L NaCl) surfactant solutions. A rapid reduction in the IFT can be observed at small surfactant concentrations, because of the rapid diffusion and surfactant monomers adsorbed on the aqueous solution–oil interface. The magnitude of IFT is changed from 32.27 mN/m at 0 g/L surfactant concentration to 9.23 mN/m at 5 g/L surfactant concentration with a sharp decrease, followed by a moderate reduction to 4.91 mN/m at 80 g/L surfactant concentration. In fact, the rapid IFT reduction trend is stopped beyond 5 g/L surfactant concentration, which is attributed to the creation of micelles aggregates of surfactant monomers. Upon increasing the surfactant concentration, the aggregation tendency of the adsorbed surfactant monomers increases, which subsequently leads to the formation of micelles. Hydrophobic interactions can occur between the adsorbed surfactant molecules, causing a considerable growth in the adsorption rate, which levels off at the critical micelle concentration (CMC). It can be concluded that the value of CMC for this surfactant is approximately 5 g/L.

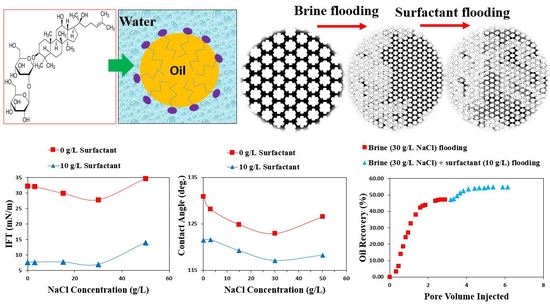
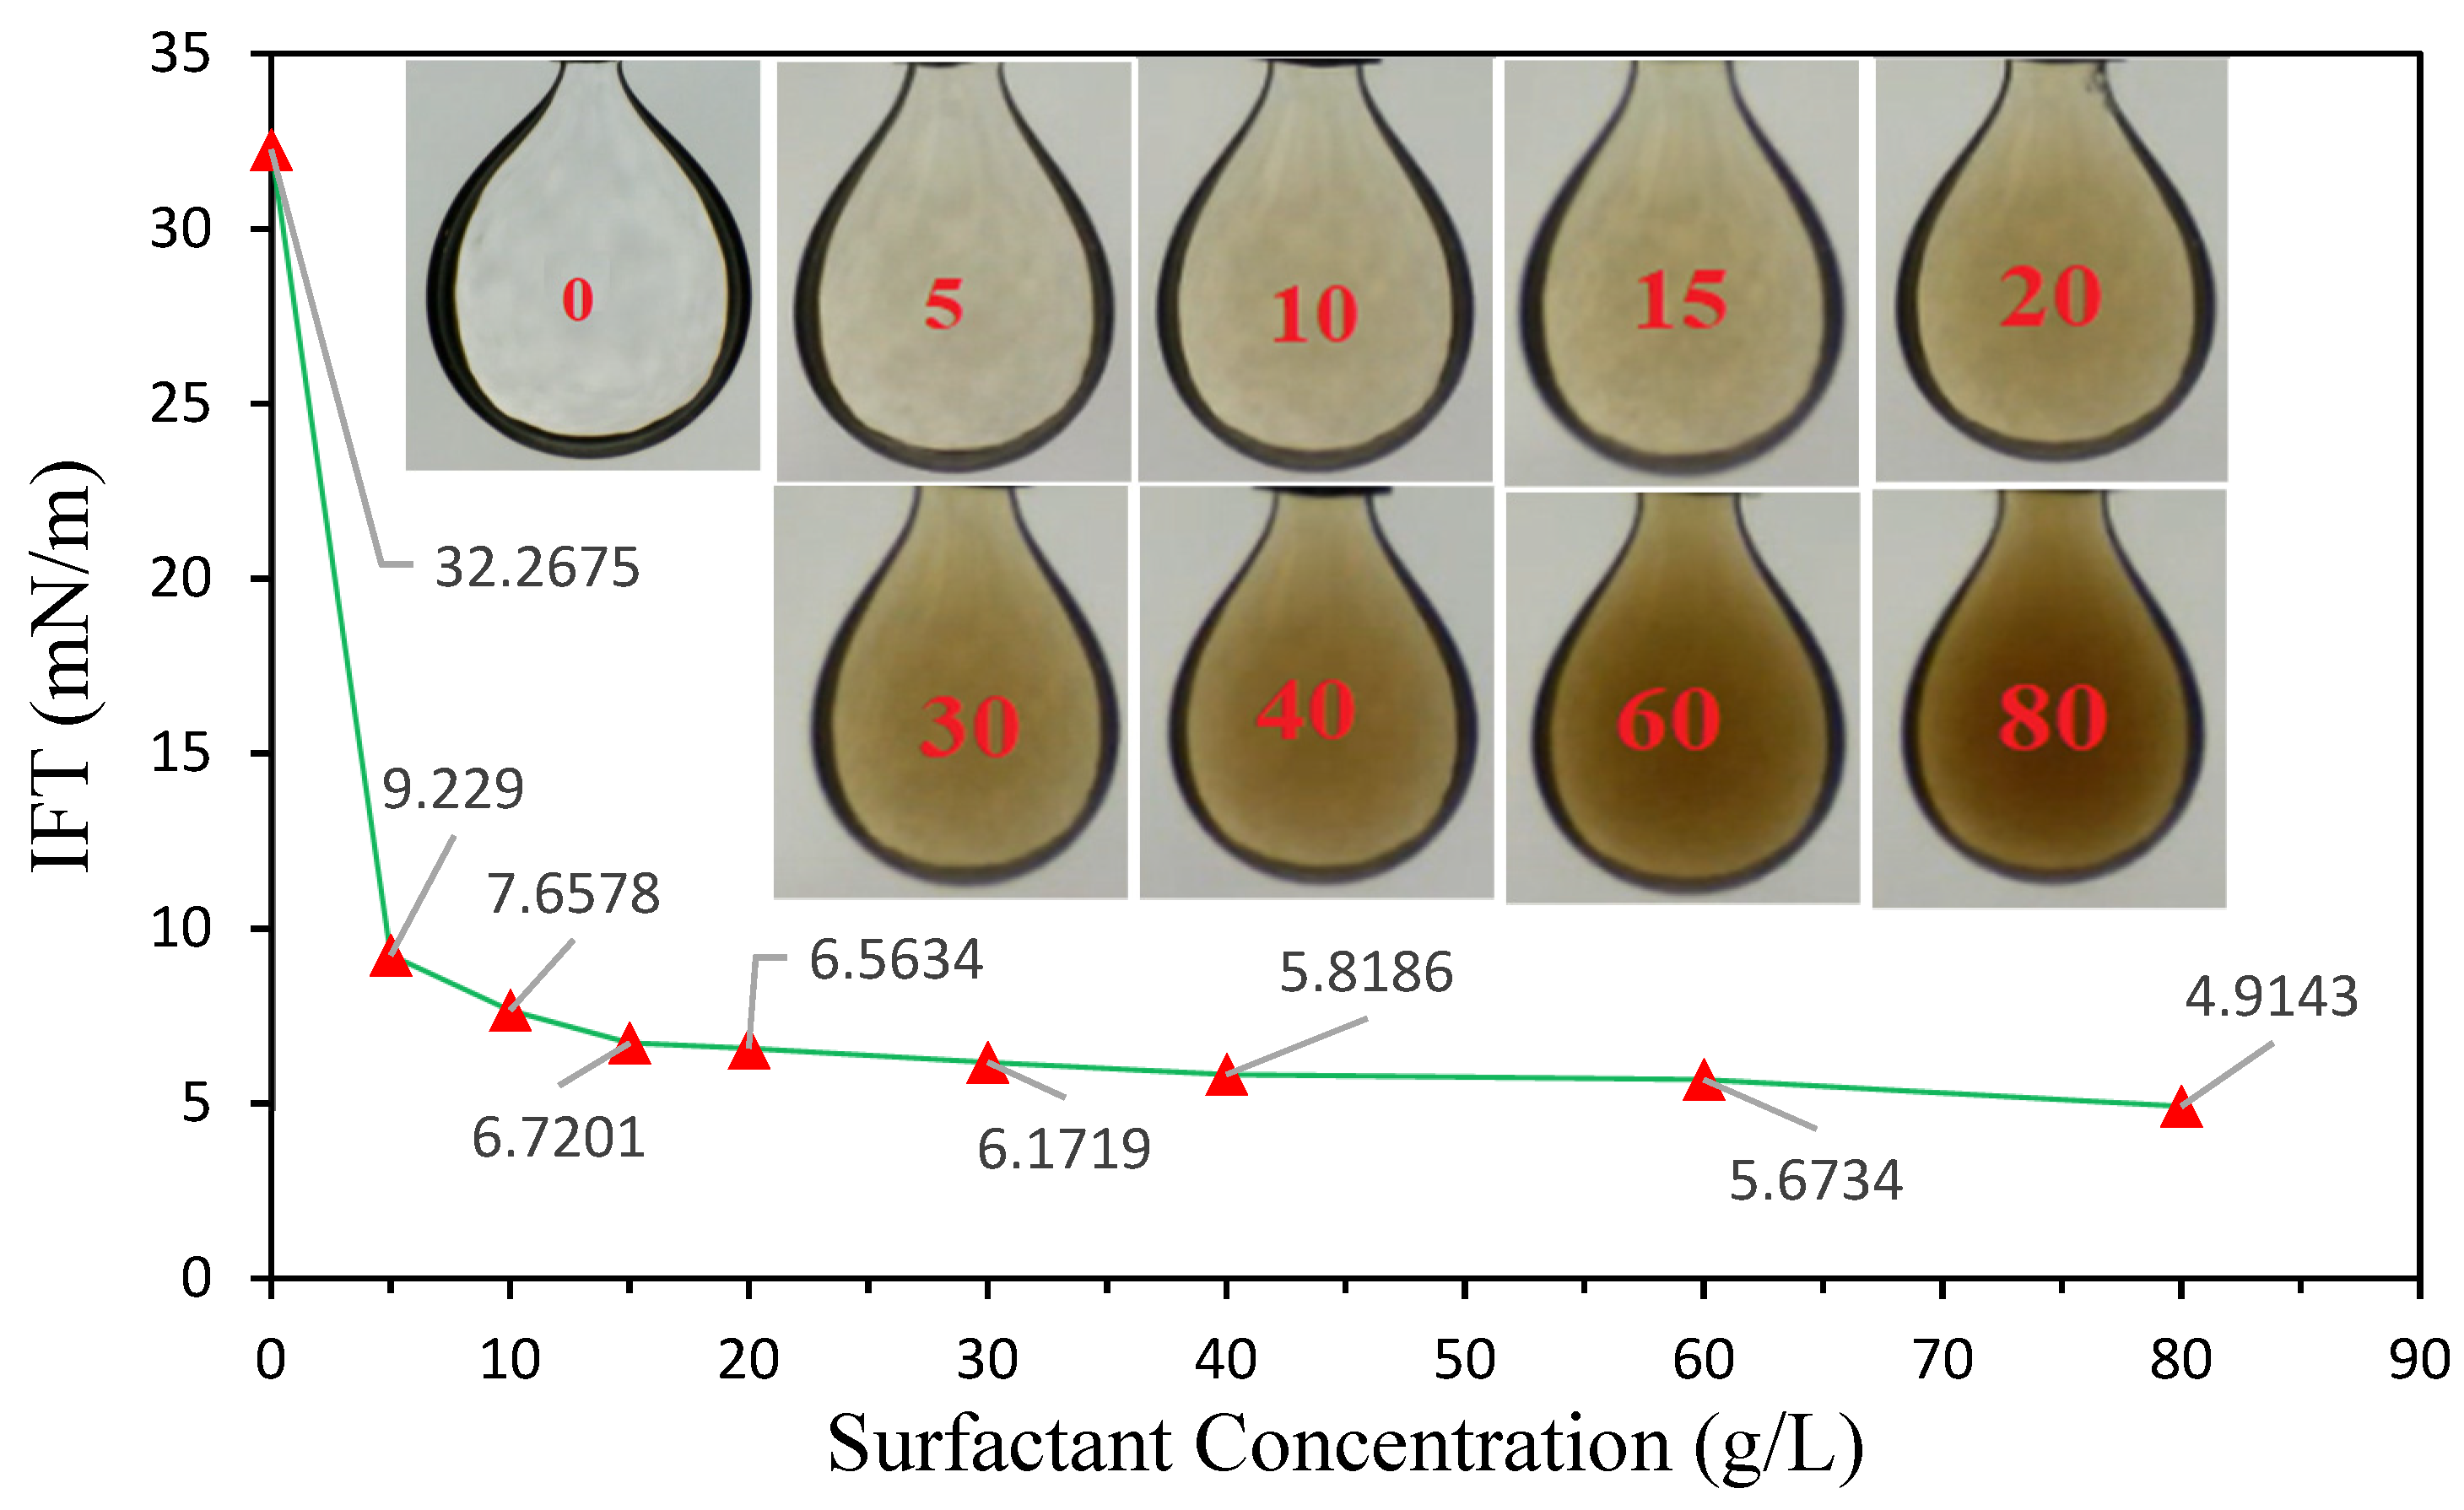
3.3. The Impact of Salinity on IFT

Figure 7 shows the oil–aqueous phase IFT versus salt concentration in different surfactant concentrations (0, 5, 10, 15, 20, 30, 40, 60, and 80 g/L). As depicted in Figure 7, for the aqueous solution without a surfactant, there is a decline and then an increase in the IFT with increasing salt concentration. In fact, the extent of IFT is lowered from 32.27 mN/m at 0 g/L to 27.85 mN/m at 30 g/L NaCl concentration; it then increases to 34.72 at 50 g/L salt concentration. This behavior can be justified by the Gibbs free energy equation (Equation (4)), as written below [51,52]:
σ = R T Γ i ln C i
where R is the universal gas constant; σ resembles the change in solution IFT; T denotes the absolute temperature; Γ i stands for the surface excess concentration of the ith component; and C i refers to the activity of the ith component. In Equation (4), the summation is carried out over all the solution components. In a pure water–hydrocarbon system without salt, the surface excess concentration is zero. Initially, the dissociated cations in the water phase attempt to locate themselves at or close to the water–hydrocarbon interface at low salt concentrations owing to the prevailing cation and hydrocarbon phase interactions. This causes an increase in the surface excess and, thus, a reduction in IFT. In this study, at salt concentrations up to 30 g/L, IFT reduces with an increase in the salt concentration. However, at higher salt concentrations, IFT increases as the salt concentration is increased. In fact, with the addition of more salt, the interface is saturated with cations; thus, cations are transferred to the bulk solution due to the high energy medium that prevails at an aqueous solution–oil system interface. Hence, the surface excess concentration of NaCl decreases and an increase in IFT is noticed according to Equation (4). It is worth noting that the obtained trend agrees with the research investigations reported in the literature [53].
One of the most influential parameters in the surfactant solutions is the salinity, which has been discussed by several investigators [54,55,56,57,58,59,60,61,62]. Generally, the addition of salt can neutralize the charges caused by head groups of the surfactant; thus, it might weaken the electrostatic repulsive forces amongst surfactant molecules, leading to a further decrease in IFT [63]. However, greater salt concentrations in the aqueous phase enhance the solubility of surfactant in the oil phase due to the salting-out phenomenon, and reduce the surfactant interfacial effects, leading to an increase in IFT [64]. In this study, the aforementioned behavior is observed for the surfactant/oil IFT versus salt concentration, as illustrated in Figure 7. Up to salt concentrations of about 30 g/L, the overall IFT trend is descending, while an ascending IFT trend is noticed beyond 30 g/L salt concentration. Hence, a salt concentration in the vicinity of 30 g/L can be identified as the optimal salt concentration. The results also reveal that the surfactant studied in this work provides a noticeable synergy with the variety of tested salt concentrations.

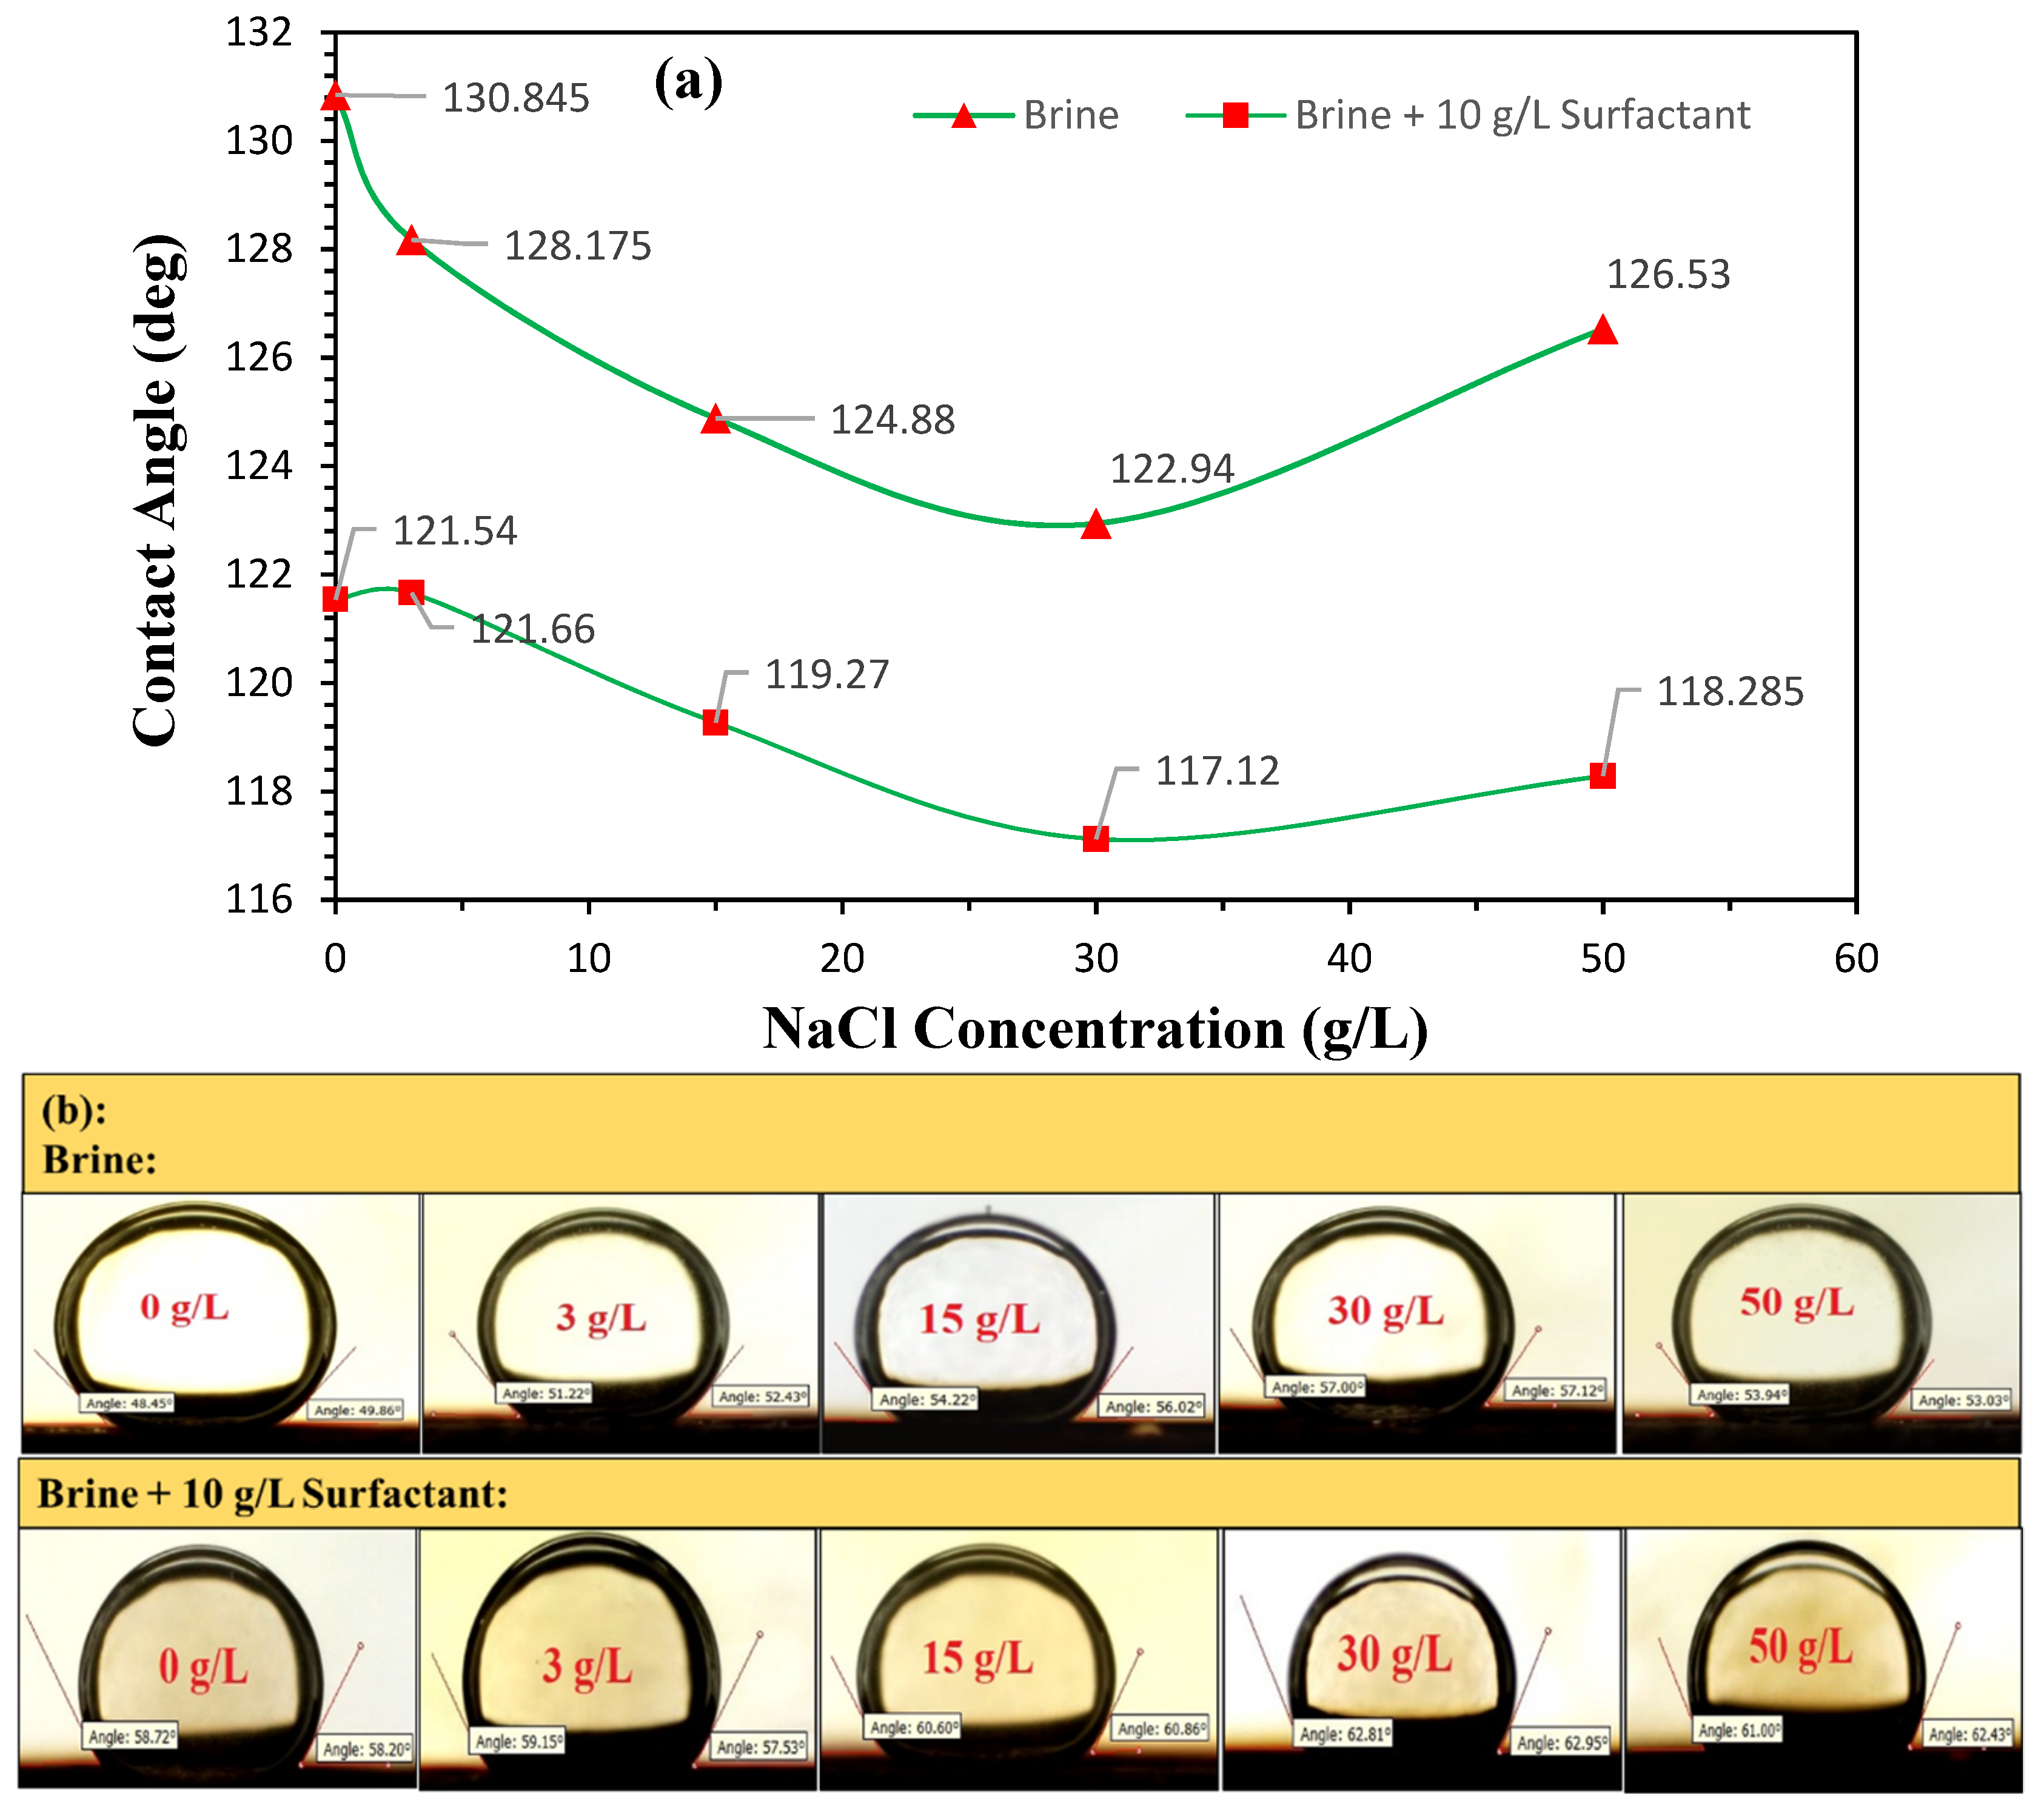
3.4. Contact Angle Measurement

Wettability, which shows the preference of a solid surface for one fluid over another, imposes a predominant impact on the interface movement of the fluid and, accordingly, oil displacement through porous media. Reservoir rocks are inherently oil-wet, and their wettability alteration to neutral wet or weakly water-wet wettability can considerably boost the oil recovery performance [20,65]. Measurement of the contact angle is a direct approach for analyzing the wettability alterations in reservoir rocks. According to the literature, the wettability state of a rock surface is mainly controlled by surfactant reagents [56,66,67,68]. Figure 8 illustrates the impact of salt concentration on the magnitude of the contact angle for the sandstone surface in the presence and absence of the surfactant (10 g/L). According to Figure 8, a particular trend is observed in terms of IFT behavior; below around 30 g/L of salt (NaCl) concentration, an overall descending trend is noticed in either the absence or presence of the surfactant, whereas the observed trend is ascending for NaCl concentrations beyond 30 g/L, implying that the rock surface has tendency to be more oil-wet. For the surfactant-free system, the contact angle decreases from 130.85° at 0 g/L to 122.94° at 30 g/L, and then increases to 126.53° at 50 g/L NaCl; this confirms a salt concentration of 30 g/L as the optimal salt concentration. This behavior may be justified by Young’s equation [68], since the contact angle has a direct relationship with oil–water IFT.
Referring to Figure 8, the rock surface is shown to be more water-wet at each salt concentration in the case of the surfactant-bearing system, which can be attributed to the role of surfactant. At a constant surfactant concentration of 10 g/L, the addition of salt causes the surfactant molecules to accumulate at the oil–water interface, altering the wettability at the salt concentrations up to 30 g/L [69]; the wettability changes toward water wetness, e.g., the contact angle changes from 121.54° at 0 g/L to 117.12° at 30 g/L salt concentration. This behavior was observed in the study conducted by Saxena et al. [70] while, at a constant surfactant concentration, the contact angle decreased with increasing salt concentration. This behavior is due to the salting-out of surfactant molecules in the aqueous phase with increasing salt concentration because water molecules are more attracted by ions than surfactant molecules in the bulk solution, leading to the faster diffusion of surfactant molecules from the bulk to the interface. However, increasing the salt concentration beyond 30 g/L causes an increase in the ion strength. Hence, water molecules are easily separated from the rock surface, which means that the oil is placed on the surface rather than water. As a result, the contact angle increases, and the rock surface becomes more oil-wet; the contact angle increases to 118.29° at a 50 g/L salt concentration. This behavior, in addition, follows Young’s equation.

3.5. Displacement Efficiency Analysis

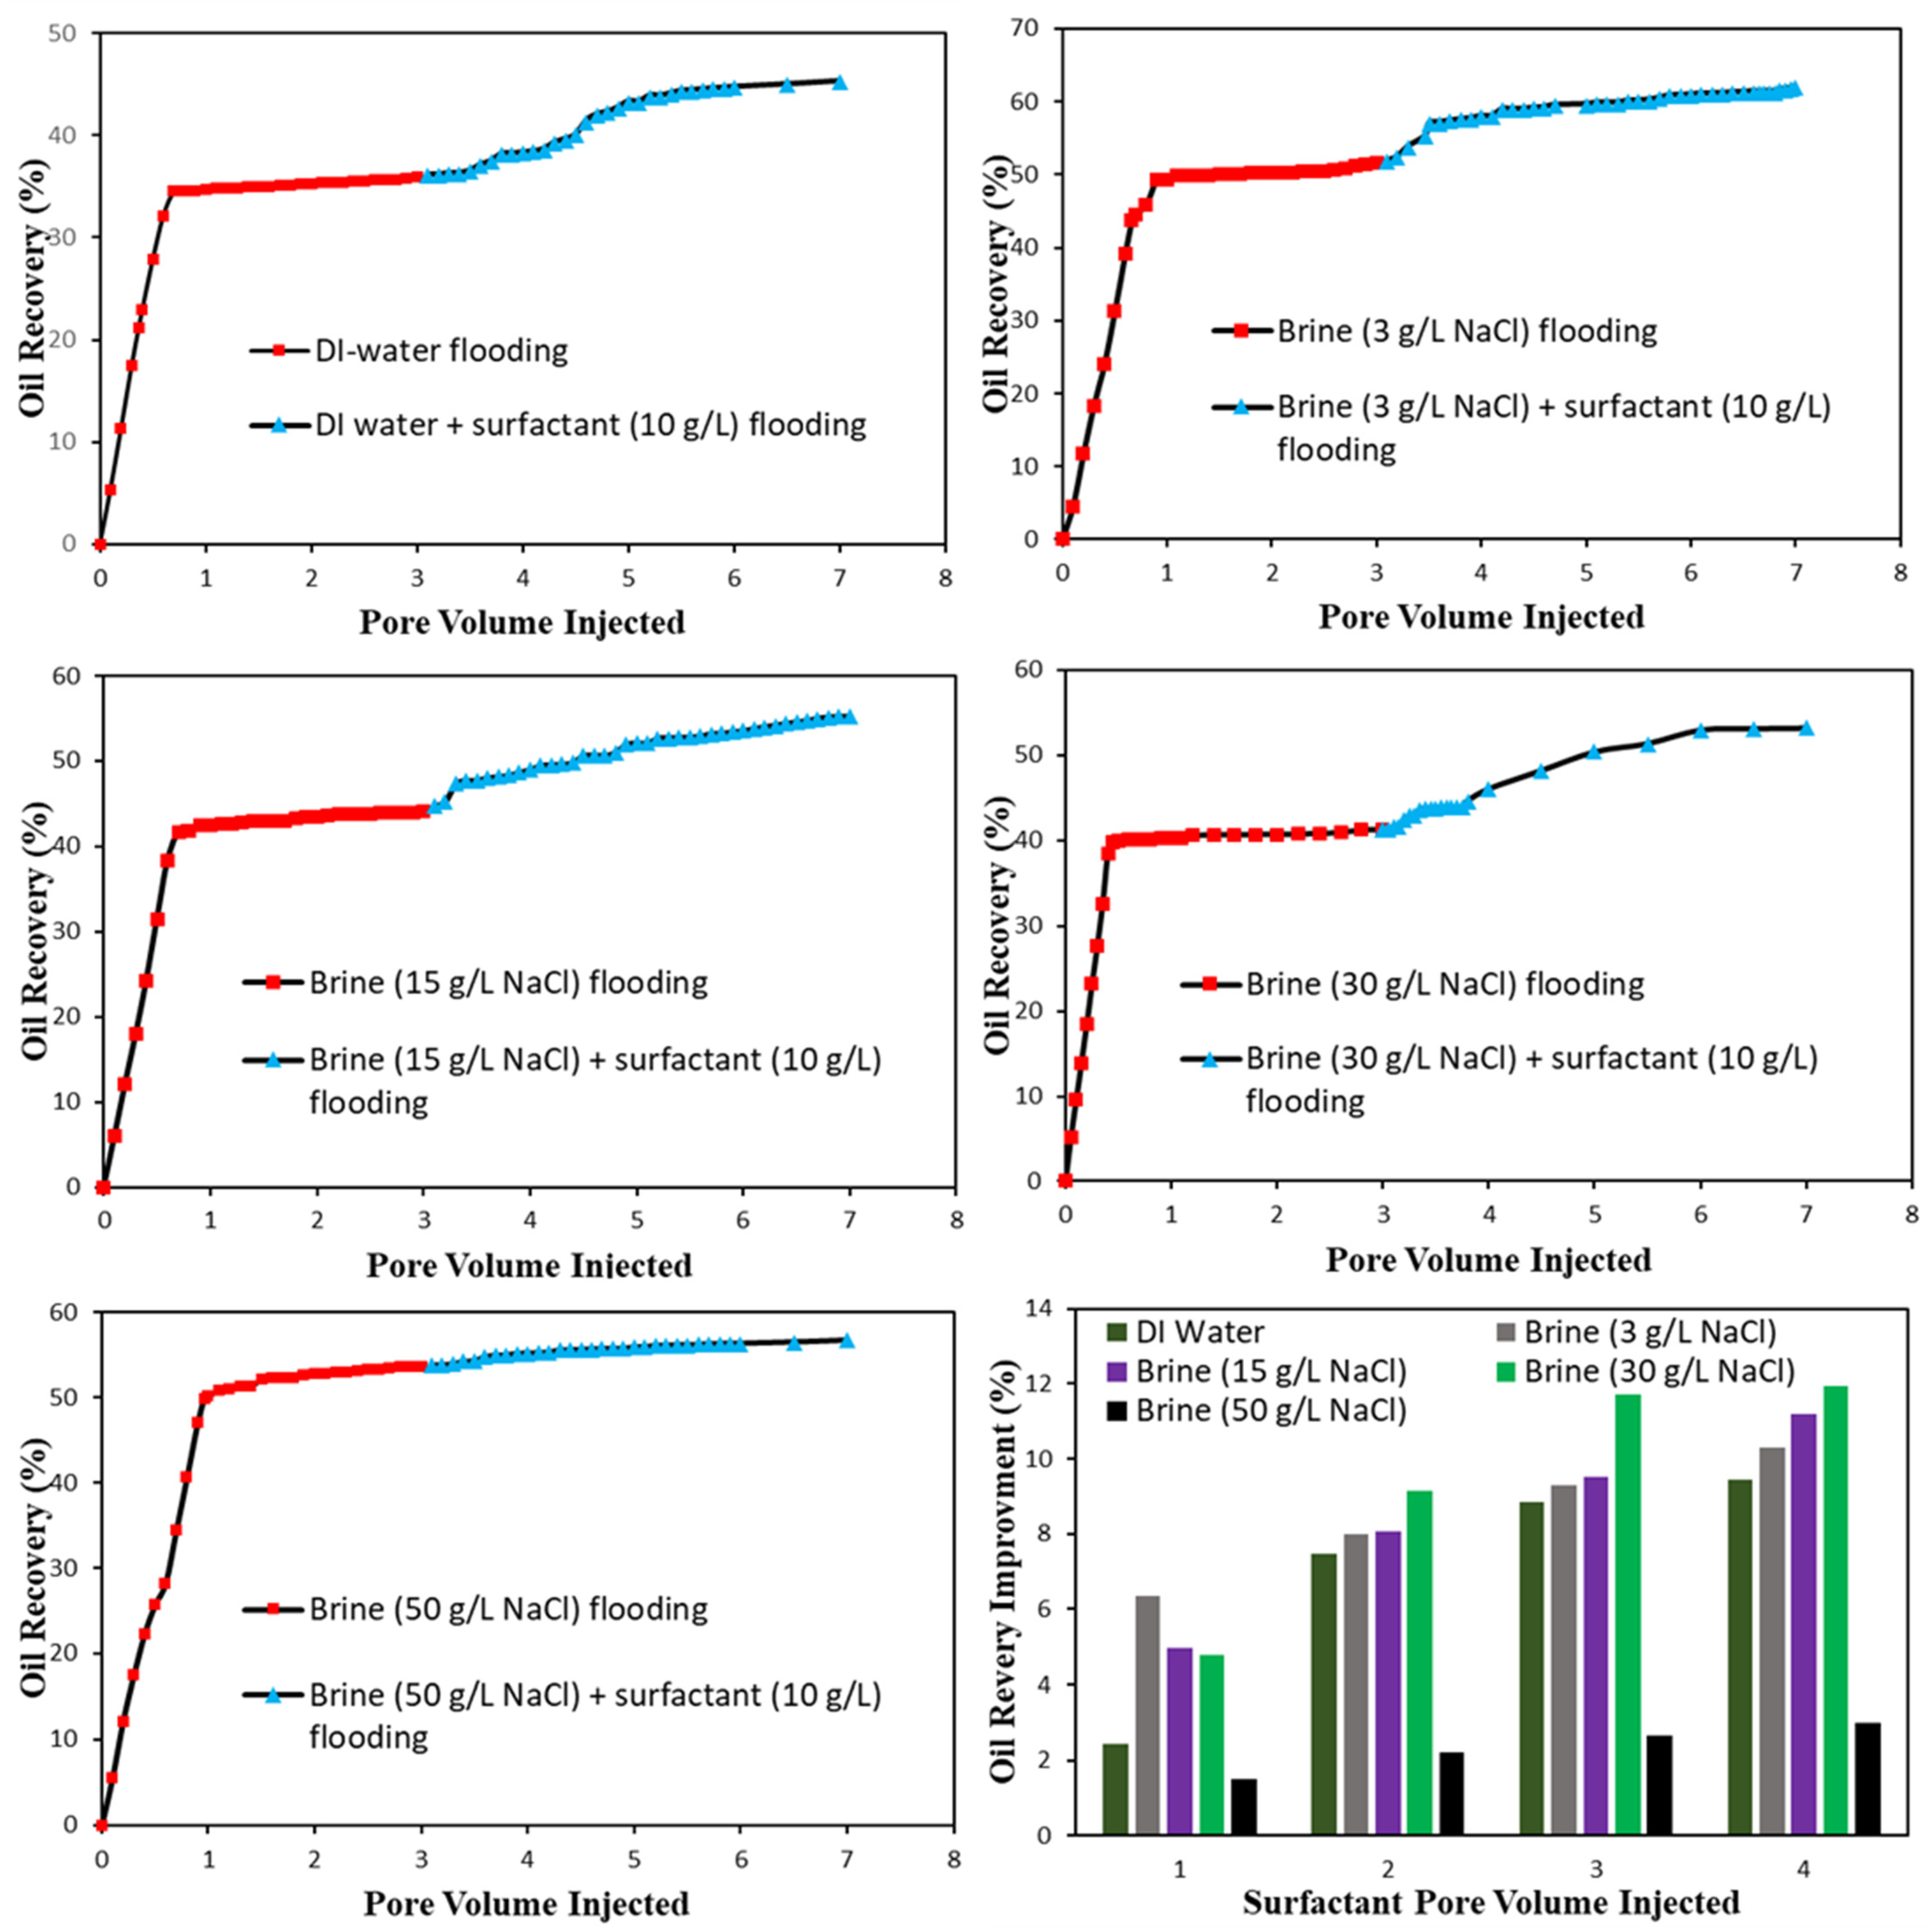
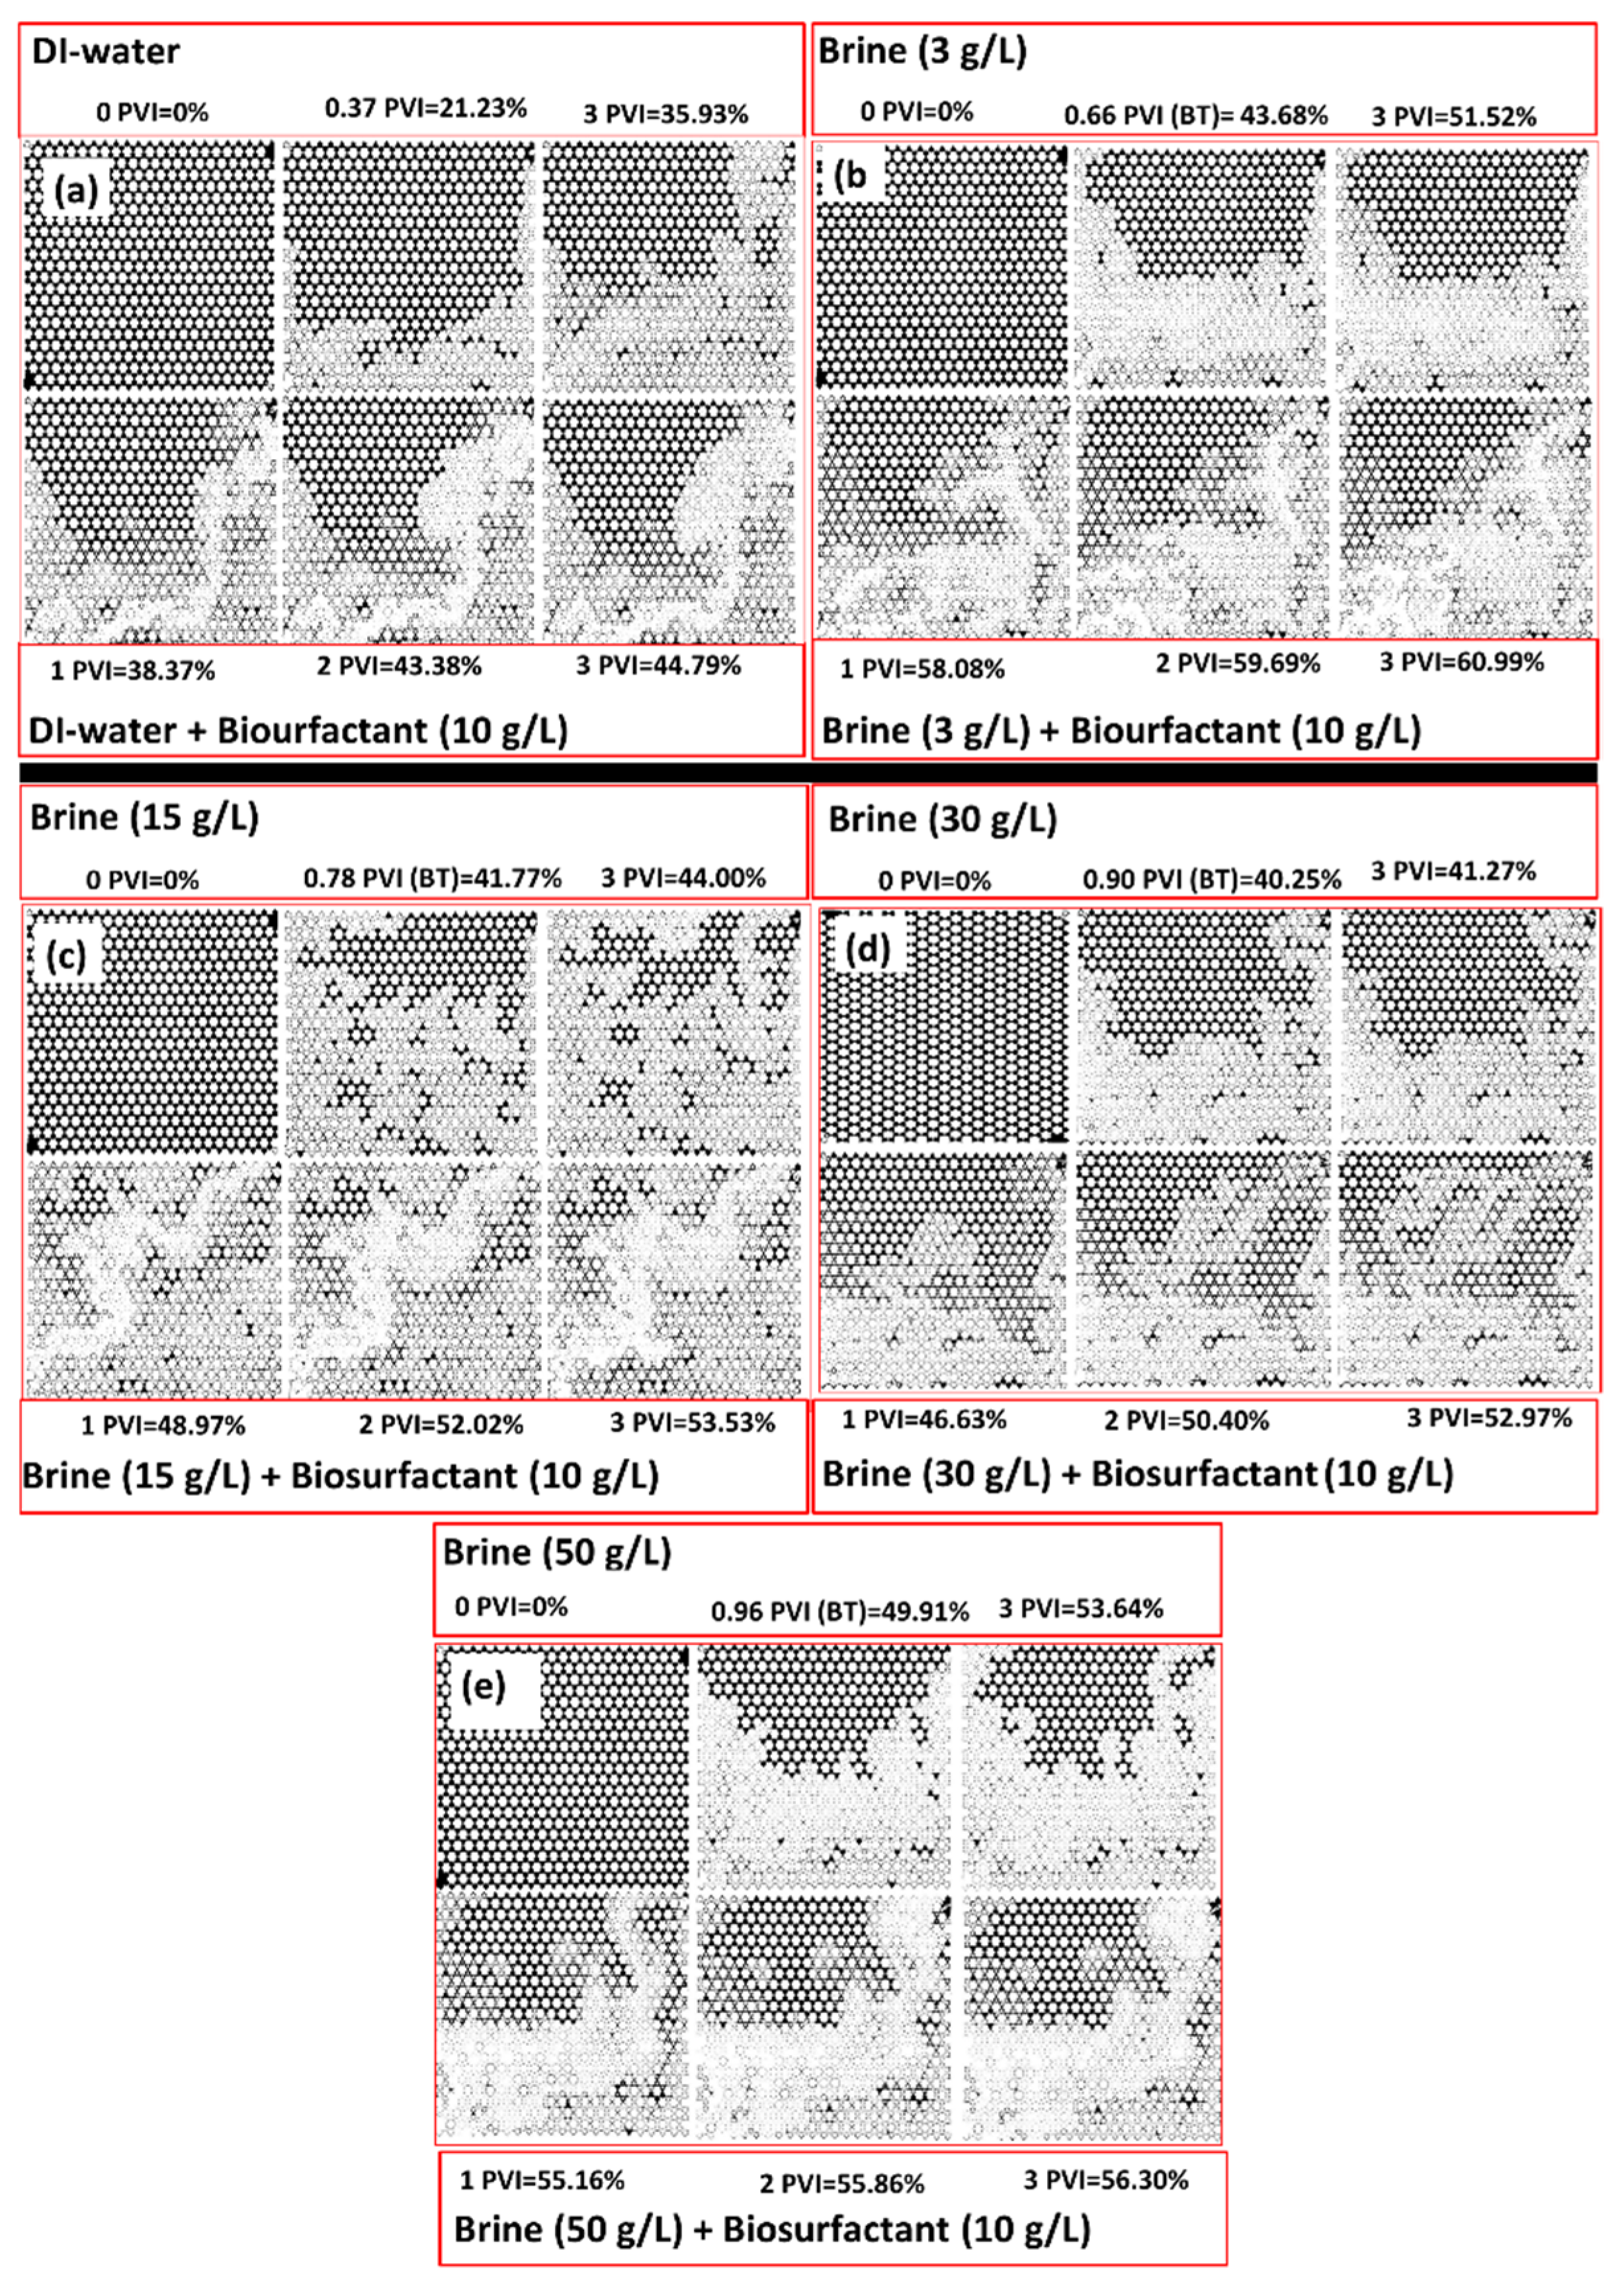
3.5.1. Micromodel Flood
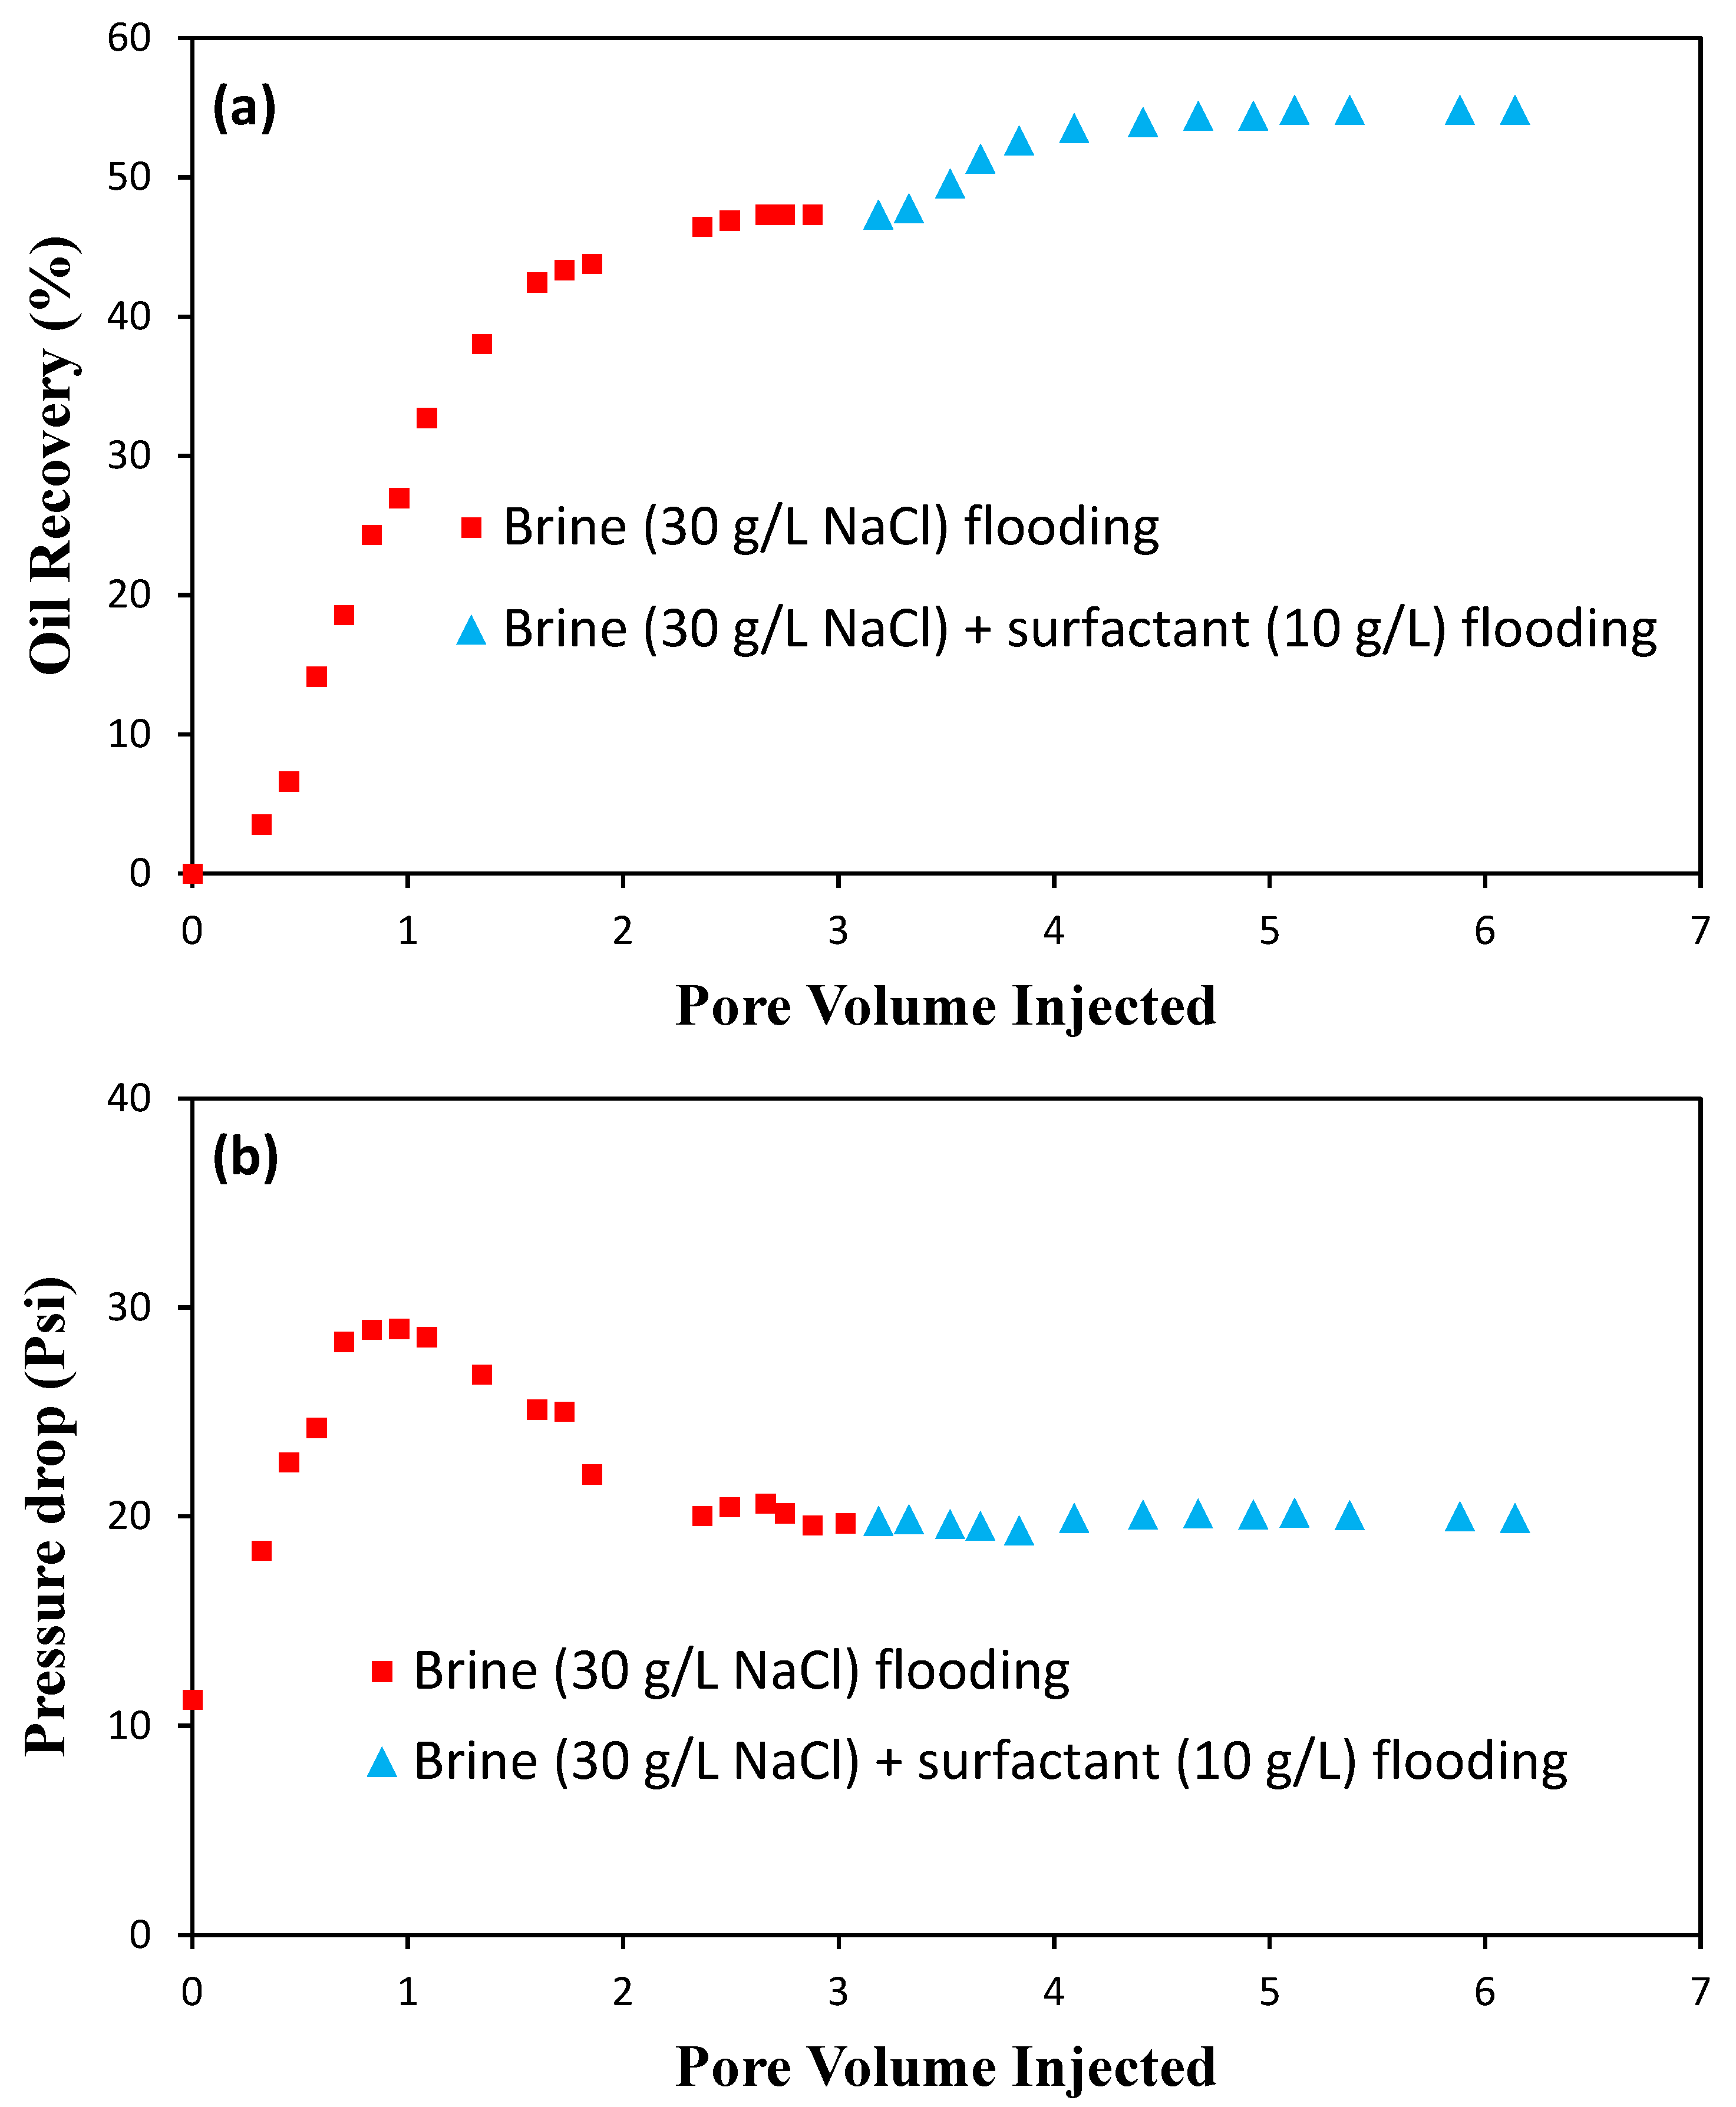
In this study, five micromodel flood experiments are carried out to explore the effect of salinity on the oil recovery factor. A typical surfactant concentration of 10 g/L is selected, where different salinities, including 0, 3, 15, 30, and 50 g/L of NaCl, are tested. First, a routine brine solution up to 3 pore volume (PV) is injected. The process is continued by injecting the surfactant solution with the same salinity concentration up to 7 PV.
Figure 9 shows the micromodel images at the initial condition, breakthrough time, and fluid PV injection at constant surfactant concentration and different salinities. After analyzing the captured images using Pixel analysis, the oil recovery factor is calculated in different fluid PV injection cases (Figure 10). According to the results, the breakthrough occurs at 0.37 PV, 0.66 PV, 0.78 PV, 0.90 PV, and 0.96 PV for DI water and NaCl aqueous solutions of 3 g/L, 15 g/L, 30 g/L, and 50 g/L, respectively. In other words, the breakthrough time shows an ascending trend with increasing salt concentration; this is because of the viscosity enhancement due to an increase in the salinity of NaCl solution [71], which leads to a decrease in the mobility ratio (e.g., mobility of the displacing fluid divided by the mobility of the displaced fluid) and, consequently, a longer breakthrough time. After the breakthrough event, water flooding continues up to 3 PV, but no considerable oil recovery is obtained. Therefore, a remarkable amount of oil remains inside the porous micromodel. However, the proposed surfactant is capable of increasing the oil recovery factor with respect to its previous surfactant-free water flooding case, mainly due to the IFT reduction mechanism. This enhancement is not the same for different salinities due to their different IFT and wettability states. Compared to the brine flooding, the aqueous solution of the surfactant is capable of reaching the majority of the locations in the micromodel porous medium, providing a more uniform sweep efficiency. The surfactant improves the ultimate oil recovery factor by 9.43%, 10.32%, 11.19%, 11.93%, and 3.02% at NaCl concentrations of 0 g/L, 3 g/L, 15 g/L, 30 g/L, and 50 g/L, respectively. It follows that the suggested surfactant can enhance the performance of water flooding, especially in the presence of 30 g/L NaCl, in agreement with the IFT and wettability tests.

3.5.2. Core Flood

According to the results obtained from the micromodel and the static tests of IFT and wettability, it is revealed that the optimal NaCl concentration is 30 g/L. Therefore, in this phase of the study, the core flood experiment is first conducted with a brine flooding of 30 g/L, and then the same brine solution containing 10 g/L surfactant is used in the test. The produced oil volume is plotted versus time to assess the recovery factor. The cumulative oil recovery factor and pressure drop along the core compared to those obtained with injected PV are displayed in Figure 11a,b. As depicted in Figure 11a, the ultimate recovery factor is about 47.5% for the brine flooding operation. The breakthrough time of the brine flooding can also be identified by plotting the pressure difference across the core against the injected PV (see Figure 11b). The breakthrough time, the time of the maximum pressure drop along the core, is obtained as 0.83 PV of the injected fluid. According to Figure 11a, a further injection of the aqueous surfactant solution increases the oil recovery up to 54.87%. The enhancement of oil recovery by 7.52% due to the implementation of the surfactant injection is mainly attributed to the IFT reduction at the surfactant solution–oil interface, which, accordingly, declines the capillary forces, approaching near-miscible conditions.

4. Conclusions

In this study, a new non-ionic surfactant named Korean red ginseng root extract is employed as an EOR agent. The proposed surfactant is characterized by FT-IR analysis. Three evaluation methods are implemented to examine the impact of the surfactant on oil recovery performance. The influence of the surfactant on oil–water IFT is explored using the pendant drop technique. The CMC value of the surfactant is about 5 g/L for the salt-free system. Different surfactant concentrations of up to 50 g/L are also examined in the saline medium. In comparison with the system without surfactant, adding a surfactant to the aqueous solution reduces the oil–water IFT by 47.28–84.01%, depending on the magnitude of salinity. The sessile drop technique is employed to evaluate the surfactant potential in wettability alterations in sandstone rock. At a constant surfactant concentration (10 g/L), a contact angle reduction within the range of 5.61–9.30° is observed, depending on salinity value (0–50 g/L). It follows that the use of the surfactant can decrease the sessile drop contact angle, implying that the rock becomes more water-wet. Micromodel flood experiments exhibit a more uniform sweeping with the surfactant (compared to the case without surfactant), leading to an oil recovery enhancement of 3.02–11.19% depending on the salt concentration. The results show that the optimal salt concentration is 30 g/L. The core flooding tests are conducted at a surfactant concentration of 10 g/L and optimal salt concentration. According to the core flooding results, the proposed surfactant enhances the oil recovery by 7.52%. This study reveals that the proposed surfactant can improve the oil recovery factor by lowering oil–water IFT and altering reservoir rock wettability.

Author Contributions

Conceptualization, A.M.; methodology, H.K.; investigation, A.M., H.K., S.Z. and M.M.; writing—original draft preparation, A.M., M.M. and M.Gh.; writing—review and editing, A.M., A.H.A. and S.Z.; supervision, K.S. and S.Z. All authors have read and agreed to the published version of the manuscript.

Funding

No funding was received for this study.

Institutional Review Board Statement

Not applicable.

Informed Consent Statement

Not applicable.

Data Availability Statement

All data are available in the manuscript.

Acknowledgments

We acknowledge Amirkabir University of Technology (AUT) and Petroleum University of Technology (PUT) for research support.

Conflicts of Interest

The authors declare no conflict of interest.

Nomenclature

Acronyms
CMCCritical Micelle Concentration
DIDeionized
EOREnhanced Oil Recovery
FT-IR Fourier-Transform Infrared Spectroscopy
IFT Interfacial Tension
KBr Potassium Bromide
NaCl Sodium Chloride
OOIP Original Oil in Place
PV Pore Volume
SEM Scanning Electron Microscope
XRD X-Ray Diffraction
Variables English Letters
Aempirical constant
B i ( i = 1 ,   2 ,   3 ,   4 ) empirical constant
C i the activity of the ith component
dhorizontal diameter just at the distance D from the bottom of the drop
Dmaximum equatorial diameter
g gravity acceleration
Hshape-dependent factor
Rgas constant ( J mol . K )
Sshape factor
Swiirreducible water saturation
TTemperature (K)
NcaCapillary Number (dimensionless)
Greek letters
σ IFT ( N m )
Δρdensity difference between heavy and light phases ( kg m 3 )
σ alteration in IFT
Γ i surface excess concentration of the ith component
μViscosity ( P a . s )
v Velocity ( m s )
θContact angle (°)

References

  1. Molnes, S.N.; Torrijos, I.P.; Strand, S.; Paso, K.G.; Syverud, K. Sandstone injectivity and salt stability of cellulose nanocrystals (CNC) dispersions—Premises for use of CNC in enhanced oil recovery. Ind. Crop. Prod. 2016, 93, 152–160. [Google Scholar] [CrossRef]
  2. Sedaghat, M.H.; Ghazanfari, M.H.; Parvazdavani, M.; Morshedi, S. Experimental Investigation of Microscopic/Macroscopic Efficiency of Polymer Flooding in Fractured Heavy Oil Five-Spot Systems. J. Energy Resour. Technol. 2013, 135, 032901. [Google Scholar] [CrossRef]
  3. Zhang, Z.; Li, Y.; Zhang, W.; Wang, J.; Soltanian, M.R.; Olabi, A.G. Effectiveness of amino acid salt solutions in capturing CO2: A review. Renew. Sustain. Energy Rev. 2018, 98, 179–188. [Google Scholar] [CrossRef]
  4. Gassara, F.; Suri, N.; Stanislav, P.; Voordouw, G. Microbially Enhanced Oil Recovery by Sequential Injection of Light Hydrocarbon and Nitrate in Low- And High-Pressure Bioreactors. Environ. Sci. Technol. 2015, 49, 12594–12601. [Google Scholar] [CrossRef]
  5. Trivedi, J.; Babadagli, T. Efficiency Analysis of Greenhouse Gas Sequestration during Miscible CO2 Injection in Fractured Oil Reservoirs. Environ. Sci. Technol. 2008, 42, 5473–5479. [Google Scholar] [CrossRef] [PubMed]
  6. Rui, Z.; Wang, X.; Zhang, Z.; Lu, J.; Chen, G.; Zhou, X.; Patil, S. A realistic and integrated model for evaluating oil sands development with Steam Assisted Gravity Drainage technology in Canada. Appl. Energy 2018, 213, 76–91. [Google Scholar] [CrossRef]
  7. Mirshahghassemi, S.; Lead, J.R. Oil Recovery from Water under Environmentally Relevant Conditions Using Magnetic Nanoparticles. Environ. Sci. Technol. 2015, 49, 11729–11736. [Google Scholar] [CrossRef] [PubMed]
  8. Ko, K.M.; Chon, B.H.; Jang, S.B.; Jang, H.Y. Surfactant flooding characteristics of dodecyl alkyl sulfate for enhanced oil recovery. J. Ind. Eng. Chem. 2014, 20, 228–233. [Google Scholar] [CrossRef]
  9. Khojastehmehr, M.; Madani, M.; Daryasafar, A. Screening of enhanced oil recovery techniques for Iranian oil reservoirs using TOPSIS algorithm. Energy Rep. 2019, 5, 529–544. [Google Scholar] [CrossRef]
  10. Youyi, Z.; Qingfeng, H.; Guoqing, J.; Desheng, M.; Zhe, W. Current development and application of chemical combination flooding technique. Pet. Explor. Dev. 2013, 40, 96–103. [Google Scholar]
  11. ShamsiJazeyi, H.; Verduzco, R.; Hirasaki, G.J. Reducing adsorption of anionic surfactant for enhanced oil recovery: Part I. Competitive adsorption mechanism. Colloids Surf. A: Physicochem. Eng. Asp. 2014, 453, 162–167. [Google Scholar] [CrossRef]
  12. Rosestolato, J.C.; Pérez-Gramatges, A.; Lachter, E.R.; Nascimento, R.S. Lipid nanostructures as surfactant carriers for enhanced oil recovery. Fuel 2018, 239, 403–412. [Google Scholar] [CrossRef]
  13. Hasankhani, G.M.; Madani, M.; Esmaeilzadeh, F.; Mowla, D. Experimental investigation of asphaltene-augmented gel polymer performance for water shut-off and enhancing oil recovery in fractured oil reservoirs. J. Mol. Liq. 2018, 275, 654–666. [Google Scholar] [CrossRef]
  14. Kamranfar, P.; Jamialahmadi, M. Effect of surfactant micelle shape transition on the microemulsion viscosity and its application in enhanced oil recovery processes. J. Mol. Liq. 2014, 198, 286–291. [Google Scholar] [CrossRef]
  15. Takassi, M.A.; Zargar, G.; Madani, M.; Zadehnazari, A. The preparation of an amino acid-based surfactant and its potential application as an EOR agent. Pet. Sci. Technol. 2017, 35, 385–391. [Google Scholar] [CrossRef]
  16. Ding, M.; Wang, Y.; Li, Z.; Zhong, D.; Yuan, F.; Zhu, Y. The role of IFT and emulsification in recovering heavy oil during S/SP flooding. J. Ind. Eng. Chem. 2019, 77, 198–208. [Google Scholar] [CrossRef]
  17. Heakal, F.E.; Elkholy, A.E. Gemini surfactants as corrosion inhibitors carbon steel. J. Mol. Liq. 2017, 230, 395–417. [Google Scholar] [CrossRef]
  18. Olajire, A.A. Review of ASP EOR (alkaline surfactant polymer enhanced oil recovery) technology in the petroleum industry: Prospects and challenges. Energy 2014, 77, 963–982. [Google Scholar] [CrossRef]
  19. Kazempour, M.; Manrique, E.J.; Alvaradov, V.; Zhang, J.; Lantz, M. Role of active clays on alkaline–surfactant–polymer formulation performance in sandstone formations. Fuel 2013, 104, 593–606. [Google Scholar] [CrossRef]
  20. Madani, M.; Zargar, G.; Takassi, M.A.; Daryasafar, A.; Wood, D.; Zhang, Z. Fundamental investigation of an environmentally-friendly surfactant agent for chemical enhanced oil recovery. Fuel 2018, 238, 186–197. [Google Scholar] [CrossRef]
  21. Subhash, C.A. Surfactant-Induced Relative Permeability Modifications for Oil Recovery Enhancement. Master Thesis, Louisiana State University, Agricultural and Mechanical College, Baton Rouge, LA, USA, 2002. [Google Scholar]
  22. Goodarzi, F.; Zendehboudi, S. Effects of Salt and Surfactant on Interfacial Characteristics of Water/Oil Systems: Molecular Dynamic Simulations and Dissipative Particle Dynamics. Ind. Eng. Chem. Res. 2019, 58, 8817–8834. [Google Scholar] [CrossRef] [Green Version]
  23. Hosseini, H.; Hosseini, H.; Jalili, M.; Apourvari, S.N.; Schaffie, M.; Ranjbar, M. Static adsorption and interfacial tension of Sodium dodecyl sulfate via magnetic field application. J. Pet. Sci. Eng. 2019, 178, 205–215. [Google Scholar] [CrossRef]
  24. De Freitas, F.A.; Keils, D.; Lachter, E.R.; Maia, C.E.; da Silva, M.I.P.; Nascimento, R.S.V. Synthesis and evaluation of the potential of nonionic surfactants/mesoporous silica systems as nanocarriers for surfactant controlled release in enhanced oil recovery. Fuel 2019, 241, 1184–1194. [Google Scholar] [CrossRef]
  25. Preux, C.; Malinouskaya, I.; Nguyen, Q.-L.; Flauraud, E.; Ayache, S. Reservoir-Simulation Model with Surfactant Flooding Including Salinity and Thermal Effect, Using Laboratory Experiments. SPE J. 2020, 25, 1761–1770. [Google Scholar] [CrossRef]
  26. Esene, C.; Onalo, D.; Zendehboudi, S.; James, L.; Aborig, A.; Butt, S. Modeling investigation of low salinity water injection in sandstones and carbonates: Effect of Na+ and SO42−. Fuel 2018, 232, 362–373. [Google Scholar] [CrossRef]
  27. Jalilian, M.; Tabzar, A.; Ghasemi, V.; Mohammadzadeh, O.; Pourafshary, P.; Rezaei, N.; Zendehboudi, S. An experimental investigation of nanoemulsion enhanced oil recovery: Use of unconsolidated porous systems. Fuel 2019, 251, 754–762. [Google Scholar] [CrossRef]
  28. Mohammadzadeh, O.; Sedaghat, M.H.; Kord, S.; Zendehboudi, S.; Giesy, J.P. Pore-level visual analysis of heavy oil recovery using chemical-assisted waterflooding process–use of a new chemical agent. Fuel 2019, 239, 202–218. [Google Scholar] [CrossRef]
  29. Dehdari, B.; Parsaei, R.; Riazi, M.; Rezaei, N.; Zendehboudi, S. New insight into foam stability enhancement mechanism, using polyvinyl alcohol (PVA) and nanoparticles. J. Mol. Liq. 2020, 307, 112755. [Google Scholar] [CrossRef]
  30. Goodarzi, F.; Kondori, J.; Rezaei, N.; Zendehboudi, S. Meso-and molecular-scale modeling to provide new insights into interfacial and structural properties of hydrocarbon/water/surfactant systems. J. Mol. Liq. 2019, 295, 111357. [Google Scholar] [CrossRef]
  31. Pordel Shahri, M.; Shadizadeh, S.R.; Jamialahmadi, M. Applicability test of new surfactant produced from Zizyphus spina-christi leaves for enhanced oil recovery in carbonate reservoirs. J. Jpn. Pet. Inst. 2012, 55, 27–32. [Google Scholar] [CrossRef] [Green Version]
  32. Ahmadi, M.A.; Shadizadeh, S.R. Experimental investigation of adsorption of a new nonionic surfactant on carbonate minerals. Fuel 2013, 104, 462–467. [Google Scholar] [CrossRef]
  33. Ahmadi, M.A.; Shadizadeh, S.R. Induced effect of adding nano silica on adsorption of a natural surfactant onto sandstone rock: Experimental and theoretical study. J. Pet. Sci. Eng. 2013, 112, 239–247. [Google Scholar] [CrossRef]
  34. Ahmadi, M.A.; Shadizadeh, S.R. Implementation of a high-performance surfactant for enhanced oil recovery from carbonate reservoirs. J. Pet. Sci. Eng. 2013, 110, 66–73. [Google Scholar] [CrossRef]
  35. Ahmadi, M.A.; Shadizadeh, S.R. Adsorption of Novel Nonionic Surfactant and Particles Mixture in Carbonates: Enhanced Oil Recovery Implication. Energy Fuels 2012, 26, 4655–4663. [Google Scholar] [CrossRef]
  36. Ahmadi, M.A.; Shadizadeh, S.R. Spotlight on the New Natural Surfactant Flooding in Carbonate Rock Samples in Low Salinity Condition. Sci. Rep. 2018, 8, 1–15. [Google Scholar] [CrossRef] [Green Version]
  37. Ahmadi, M.A.; Shadizadeh, S.R.; Chen, Z. Thermodynamic analysis of adsorption of a naturally derived surfactant onto shale sandstone reservoirs. Eur. Phys. J. Plus 2018, 133, 420. [Google Scholar] [CrossRef]
  38. Moslemizadeh, A.; Dezaki, A.S.; Shadizadeh, S.R. Mechanistic understanding of chemical flooding in swelling porous media using a bio-based nonionic surfactant. J. Mol. Liq. 2017, 229, 76–88. [Google Scholar] [CrossRef]
  39. Ahmadi, M.A.; Arabsahebi, Y.; Shadizadeh, S.R.; Behbahani, S.S. Preliminary evaluation of mulberry leaf-derived surfactant on interfacial tension in an oil-aqueous system: EOR application. Fuel 2014, 117, 749–755. [Google Scholar] [CrossRef]
  40. Ravi, S.G.; Shadizadeh, S.R.; Moghaddasi, J. Core Flooding Tests to Investigate the Effects of IFT Reduction and Wettability Alteration on Oil Recovery: Using Mulberry Leaf Extract. Pet. Sci. Technol. 2015, 33, 257–264. [Google Scholar] [CrossRef]
  41. Moslemizadeh, A.; Dehkordi, A.F.; Barnaji, M.J.; Naseri, M.; Ravi, S.G.; Jahromi, E.K. Novel bio-based surfactant for chemical enhanced oil recovery in montmorillonite rich reservoirs: Adsorption behavior, interaction impact, and oil recovery studies. Chem. Eng. Res. Des. 2016, 109, 18–31. [Google Scholar] [CrossRef]
  42. Arabloo, M.; Ghazanfari, M.H.; Rashtchian, D. Spotlight on kinetic and equilibrium adsorption of a new surfactant onto sandstone minerals: A comparative study. J. Taiwan Inst. Chem. Eng. 2015, 50, 12–23. [Google Scholar] [CrossRef]
  43. Barati, A.; Najafi, A.; Daryasafar, A.; Nadali, P.; Moslehi, H. Adsorption of a new nonionic surfactant on carbonate minerals in enhanced oil recovery: Experimental and modeling study. Chem. Eng. Res. Des. 2016, 105, 55–63. [Google Scholar] [CrossRef]
  44. Barati-Harooni, A.; Najafi-Marghmaleki, A.; Hosseini, S.M.; Moradi, S. Experimental Investigation of Dynamic Adsorption–Desorption of New Nonionic Surfactant on Carbonate Rock: Application to Enhanced Oil Recovery. J. Energy Resour. Technol. 2017, 139, 042202. [Google Scholar] [CrossRef]
  45. Khayati, H.; Moslemizadeh, A.; Shahbazi, K.; Moraveji, M.K.; Riazi, S.H. An experimental investigation on the use of saponin as a non-ionic surfactant for chemical enhanced oil recovery (EOR) in sandstone and carbonate oil reservoirs: IFT, wettability alteration, and oil recovery. Chem. Eng. Res. Des. 2020, 160, 417–425. [Google Scholar] [CrossRef]
  46. Ghasemi, M.; Moslemizadeh, A.; Shahbazi, K.; Mohammadzadeh, O.; Zendehboudi, S.; Jafari, S. Primary evaluation of a natural surfactant for inhibiting clay swelling. J. Pet. Sci. Eng. 2019, 178, 878–891. [Google Scholar] [CrossRef]
  47. Li, Z.; Ji, G.E. Ginseng and obesity. J. Ginseng Res. 2018, 42, 1–8. [Google Scholar] [CrossRef]
  48. Shin, B.-K.; Kwon, S.W.; Park, J.H. Chemical diversity of ginseng saponins from Panax ginseng. J. Ginseng Res. 2015, 39, 287–298. [Google Scholar] [CrossRef] [Green Version]
  49. Choi, K.-T. Botanical characteristics, pharmacological effects and medicinal components of Korean Panax ginseng CA Meyer. Acta Pharmacol. Sin. 2008, 29, 1109. [Google Scholar] [CrossRef] [PubMed] [Green Version]
  50. Drelich, J.; Fang, C.; White, C. Measurement of interfacial tension in fluid-fluid systems. Encycl. Surf. Colloid Sci. 2002, 3, 3158–3163. [Google Scholar]
  51. Barati-Harooni, A.; Najafi-Marghmaleki, A.; Tatar, A.; Mohammadi, A.H. Experimental and modeling studies on adsorption of a nonionic surfactant on sandstone minerals in enhanced oil recovery process with surfactant flooding. J. Mol. Liq. 2016, 220, 1022–1032. [Google Scholar] [CrossRef]
  52. Moeini, F.; Hemmati-Sarapardeh, A.; Ghazanfari, M.-H.; Masihi, M.; Ayatollahi, S. Toward mechanistic understanding of heavy crude oil/brine interfacial tension: The roles of salinity, temperature and pressure. Fluid Phase Equilibria 2014, 375, 191–200. [Google Scholar] [CrossRef]
  53. Kakati, A.; Sangwai, J. Effect of monovalent and divalent salts on the interfacial tension of pure hydrocarbon-brine systems relevant for low salinity water flooding. J. Pet. Sci. Eng. 2017, 157, 1106–1114. [Google Scholar] [CrossRef]
  54. Pillai, P.; Kumar, A.; Mandal, A. Mechanistic studies of enhanced oil recovery by imidazolium-based ionic liquids as novel surfactants. J. Ind. Eng. Chem. 2018, 63, 262–274. [Google Scholar] [CrossRef]
  55. Bera, A.; Mandal, A.; Guha, B.B. Synergistic Effect of Surfactant and Salt Mixture on Interfacial Tension Reduction between Crude Oil and Water in Enhanced Oil Recovery. J. Chem. Eng. Data 2013, 59, 89–96. [Google Scholar] [CrossRef]
  56. Babu, K.; Pal, N.; Bera, A.; Saxena, V.; Mandal, A. Studies on interfacial tension and contact angle of synthesized surfactant and polymeric from castor oil for enhanced oil recovery. Appl. Surf. Sci. 2015, 353, 1126–1136. [Google Scholar] [CrossRef]
  57. Pal, N.; Babu, K.; Mandal, A. Surface tension, dynamic light scattering and rheological studies of a new polymeric surfactant for application in enhanced oil recovery. J. Pet. Sci. Eng. 2016, 146, 591–600. [Google Scholar] [CrossRef]
  58. Babu, K.; Pal, N.; Saxena, V.K.; Mandal, A. Synthesis and characterization of a new polymeric surfactant for chemical enhanced oil recovery. Korean J. Chem. Eng. 2015, 33, 711–719. [Google Scholar] [CrossRef]
  59. Salager, J.-L.; Forgiarini, A.M.; Márquez, L.; Manchego, L.; Bullón, J. How to Attain an Ultralow Interfacial Tension and a Three-Phase Behavior with a Surfactant Formulation for Enhanced Oil Recovery: A Review. Part 2. Performance Improvement Trends from Winsor’s Premise to Currently Proposed Inter- and Intra-Molecular Mixtures. J. Surfactants Deterg. 2013, 16, 631–663. [Google Scholar] [CrossRef] [PubMed] [Green Version]
  60. Gaonkar, A.G. Effects of salt, temperature, and surfactants on the interfacial tension behavior of a vegetable oil/water system. J. Colloid Interface Sci. 1992, 149, 256–260. [Google Scholar] [CrossRef]
  61. Karnanda, W.; Benzagouta, M.S.; AlQuraishi, A.; Amro, M.M. Effect of temperature, pressure, salinity, and surfactant concentration on IFT for surfactant flooding optimization. Arab. J. Geosci. 2012, 6, 3535–3544. [Google Scholar] [CrossRef]
  62. Kumar, S.; Mandal, A. Studies on interfacial behavior and wettability change phenomena by ionic and nonionic surfactants in presence of alkalis and salt for enhanced oil recovery. Appl. Surf. Sci. 2016, 372, 42–51. [Google Scholar] [CrossRef]
  63. Tichelkamp, T.; Teigen, E.; Nourani, M.; Øye, G. Systematic study of the effect of electrolyte composition on interfacial tensions between surfactant solutions and crude oils. Chem. Eng. Sci. 2015, 132, 244–249. [Google Scholar] [CrossRef]
  64. Eftekhardadkhah, M.; Øye, G. Correlations between Crude Oil Composition and Produced Water Quality: A Multivariate Analysis Approach. Ind. Eng. Chem. Res. 2013, 52, 17315–17321. [Google Scholar] [CrossRef]
  65. Liu, F.; Wang, M. Review of low salinity waterflooding mechanisms: Wettability alteration and its impact on oil recovery. Fuel 2020, 267, 117112. [Google Scholar] [CrossRef]
  66. Jarrahian, K.; Seiedi, O.; Sheykhan, M.; Sefti, M.V.; Ayatollahi, S. Wettability alteration of carbonate rocks by surfactants: A mechanistic study. Colloids Surf. A Physicochem. Eng. Aspects 2012, 410, 1–10. [Google Scholar] [CrossRef]
  67. Zdziennicka, A.; Jańczuk, B. The relationship between the adhesion work, the wettability and composition of the surface layer in the systems polymer/aqueous solution of anionic surfactants and alcohol mixtures. Appl. Surf. Sci. 2010, 257, 1034–1042. [Google Scholar] [CrossRef]
  68. Bera, A.; Ojha, K.; Kumar, T.; Mandal, A. Mechanistic Study of Wettability Alteration of Quartz Surface Induced by Nonionic Surfactants and Interaction between Crude Oil and Quartz in the Presence of Sodium Chloride Salt. Energy Fuels 2012, 26, 3634–3643. [Google Scholar] [CrossRef]
  69. Standal, S.; Haavik, J.; Blokhus, A.; Skauge, A. Effect of polar organic components on wettability as studied by adsorption and contact angles. J. Pet. Sci. Eng. 1999, 24, 131–144. [Google Scholar] [CrossRef]
  70. Saxena, N.; Pal, N.; Dey, S.; Mandal, A. Characterizations of surfactant synthesized from palm oil and its application in enhanced oil recovery. J. Taiwan Inst. Chem. Eng. 2017, 81, 343–355. [Google Scholar] [CrossRef]
  71. Kestin, J.; Shankland, I.R. Viscosity of aqueous NaCl solutions in the temperature range 25–200 C and in the pressure range 0.1–30 MPa. Int. J. Thermophys. 1984, 5, 241–263. [Google Scholar] [CrossRef]
Figure 1. Molecular structure of ginsenosides: (a) Rg3, (b) Rg5, and (c) RK1 [48], and (d) XRD pattern of the sandstone sample associated with the description of mineral composition and SEM image.
Energies 14 08310 g001
Figure 2. Experimental flow chart.
Energies 14 08310 g002
Figure 3. Experimental apparatuses employed in this study: (a) experimental set-up for the pendant drop and sessile drop methods, (b) experimental set-up for the micromodel flooding, and (c) experimental set-up for the core flooding.
Energies 14 08310 g003
Figure 4. FT-IR spectrum of the surfactant.
Energies 14 08310 g004
Figure 5. Density versus surfactant concentration.
Energies 14 08310 g005
Figure 6. Change in IFT with surfactant concentration (CMC = 5 g/L).
Energies 14 08310 g006
Figure 7. IFT variations with NaCl concentration at different surfactant concentrations (associated with the data given in table).
Energies 14 08310 g007
Figure 8. (a) Effect of NaCl concentration on contact angle in the absence and presence of surfactant at 10 g/L; and (b) images of contact angles.
Energies 14 08310 g008
Figure 9. The image sequence of water flooding with and without surfactant: (a) 0 g/L NaCl, (b) 3 g/L NaCl, (c) 15 g/L NaCl, (d) 30 g/L NaCl, and (e) 50 g/L NaCl.
Energies 14 08310 g009
Figure 10. Recovery factor versus injected pore volume for water flooding with and without surfactant into the glass micromodel.
Energies 14 08310 g010
Figure 11. Water flooding injection into the sandstone core with and without surfactant: (a) oil recovery versus injected pore volume, and (b) pressure difference along the length of the sandstone core versus pore volume.
Energies 14 08310 g011
Table 1. The properties and compositions of crude oil used in this study [45].
PropertiesValueComponentMole %
Dynamic viscosity (cp) at 30 °C13.23C20.06
Dynamic viscosity (cp) at 40 °C9.73C30.13
API at 15.6 °C43.32iC40.15
Saturates (wt%)55.21nC44.69
Aromatics (wt%)17.81iC55.83
Resins (wt%)3.90nC59.01
Asphaltenes (wt%)0.2C610.02
Light fractions (wt%)22.88C79.53
--C88.25
--C96.73
--C105.16
--C119.40
--C12+31.04
Table 2. Performance evaluation experiments (e.g., specifications of tests).
ExperimentsQuantitySurfactant (g/L)NaCL (g/L)Pressure (atm)Temperature (°C)
IFT measurements100125
25
310
415
520
630
740
860
980
10–1303, 15, 30, 50
14–175
18–2110
22–2515
26–2920
30–3330
34–3740
38–4160
42–4580
Contact angle measurements1–500, 3, 15, 30, 50
6–10100, 3, 15, 30, 50
Micromodel flooding tests1–5100, 3, 15, 30, 50
Core flooding tests11030Injection: 2 Overburden:17625
Table 3. Empirical constants for Equation (3) [50].
SAB0B1B2B3B4
0.401–0.462.566510.180690.840590.9755300.3272
0.46–0.592.597250.132610.500590.4689800.31968
0.59–0.682.624350.052850.157560.1171400.31522
0.68–0.902.642670.058770.147010.0915500.31345
0.90–1.002.846360.2097−0.18341−1.08315−0.691160.30715
Publisher’s Note: MDPI stays neutral with regard to jurisdictional claims in published maps and institutional affiliations.

