1. Introduction
One of the priorities of the European Union is to significantly reduce the primary energy consumption in building stock. Two documents have been developed to achieve this goal: Energy Performance of Buildings Directive 2010/31/EU (EPBD) and the Energy Efficiency Directive 2012/27/EU. They suggest that one of the ways to improve the energy and environmental performance is to install thermal solar collectors and/or photovoltaic panels (PV). A lot of research on this topic can be found in the scientific literature.
Mora et al. [
1] considered the issues related to the thorough modernization of a historic building in Treviso (Italy). The building’s energy analysis was developed using numerical simulation and experimental measurements. As it turned out, it was possible to obtain 3300 kWh (175 kWh/m
2) from the photovoltaic system and 8500 kWh from solar collectors (425 kWh/m
2). The installation of a mechanical ventilation system with heat recovery and a solar domestic hot water (SDHW) system were the main elements that helped to achieve a high level of certification for this facility.
Fan and Xia [
2] were involved in the comprehensive retrofit of a 50-year-old building. The research facility was located in South Africa and consisted of 66 apartments. Five types of photovoltaic panels placed on the roof were analysed, the theoretical maximum efficiency of which ranged from 14.7 to 16.4%,. The multi-objective optimization method was used in order to select the most advantageous variant in terms of economy and energy efficiency in renovation. The authors of this study did not provide the area of the PV panels, so it is difficult to evaluate this analysis and compare it with other similar research results.
A five-storey building located in Nasr City (Egypt) and consisting of 10 apartments with 140 m
2 area each, served as a case study in a modernization analysis carried out by Albadrya et al. [
3]. One of the renovation actions was the use of 96 PV panels at an inclination of 30° and a space of 60 cm between each row, which were placed on the flat roof. As a result of computer simulations using the DesignBuilder software, a reduction in electricity consumption from 66,000 kWh to 44,000 kWh was obtained. As in the previous case [
2], the authors did not provide the total area of the panels, so their effectiveness cannot be assessed.
Different variants of placing PV panels on a renovated office building were theoretically investigated by Gindi et al. [
4]. One of the cases involved the installation of 168.9 m
2 of panels at a 30 degree slope on a flat roof. In this analysis, it was determined that the total electricity production from this PV generator (AC grid) would be 40,784.8 kWh/year assuming that global radiation at the module is 1986.1 kWh/m
2 for Cairo (Egypt). Thus, the solar energy conversion efficiency of this installation was around 12%.
Solar thermal collectors (STC) and multi-crystalline PV panels were analysed by Martinopoulo [
5] as one of the variants in the renovation of a detached house with a conditioned floor area of 120 m
2. TRNSYS software and typical meteorological year (TMY) for Athens (Greece) were used to carry out computer simulations. Flat plate solar collectors with a total area of 24 m
2 and a slope of 50 degrees were used to heat domestic water and covered 68% of the total required thermal load. The article did not mention the energy requirements for DHW preparation. Moreover, the very high inclination of the collectors was not optimal for this location. The calculation results showed that the 20 PV panels with a capacity of 4.7 kWp and a slope of 35° produced 7033 kWh of electricity. The average efficiency of the system was assumed at the level of 14.6%.
The analysis of the main scenarios for the renovation of an old and energy inefficient multi-apartment building was the goal of Fina et al. [
6]. Optimization using a mixed-integer linear programming model implemented in MATLAB was performed with the following assumptions: a PV module maximum efficiency of 17%, usable roof area for PV of 100 m
2, usable facade area for PV of 210 m
2 and roof pitch of 30°. Based on the results of a multivariate analysis, the authors concluded that building-attached and building-integrated PV systems are promising in terms of investment in the renovation of multi-apartment buildings located in Austria. The amount of electricity produced before the analysed systems was not found in this paper.
Couty and Simon [
7] investigated the possibility of cooperation of solar energy conversion systems with old 20th-century multi-family buildings located in western Switzerland. As a result of calculations, it was found that 112 PV panels mounted on a roof with an 18% slope facing west could produce 22,450 kWh of electricity over the year. However, 300 PV panels mounted on the west facade (84° azimuth) could provide only a little more, i.e., 24,137 kWh. In contrast, 24 solar collectors installed on the roof, oriented to the west and inclined at an angle of 18°, could provide 13,854 kWh per year of energy for DHW heating. Unfortunately, the authors of this analysis did not provide the technical data of the devices used for the calculations.
A very interesting and extensive literature review on the renovation of historic buildings in Italy with a view to reducing energy consumption was carried out by Galatioto et al. [
8]. The authors of this article paid particular attention to the long payback time for investments related to renewable energy sources and the many restrictions associated with the installation of solar energy conversion systems on such old buildings.
One of the technical solutions that enable the conversion of solar energy is solar thermal façade (BSTF). Gagliano et al. [
9] performed an analysis of this type of façade with integrated FPC and ETC collectors with an area of 4 m
2 for a reference single-family building located in four Italian cities. As these studies have shown, it is possible to obtain a coverage of energy for DHW heating in the range from 44% to 76%.
Unfortunately, the current research did not consider this solution. This was due to the fact that the Office for the Preservation of Historical Monuments did not allow any interference with the façades of the historic tenement house under analysis here.
As is well known, overheating of photovoltaic panels causes a decrease in their efficiency. To prevent this, a cooling system can be used provided by a heat exchanger located on the underside of the panel. Thus, photovoltaic thermal (PVT) technology is a combination of photovoltaic cells and a thermal solar collector. A very extensive review of the literature related to this issue was presented by Bandaru et al. [
10]. First of all, PVT devices take up much less space compared to separate solar systems. The authors listed not only the advantages of this technology but also its shortcomings related to control and operation. Working fluid circulating in the absorber loop heats up to a lower temperature than in thermal collectors, so it can only be used in low-temperature applications. In winter, PVT collectors do not perform as well as other solar energy technologies. In addition, the electrical efficiency of these systems drops due to the increased temperature of the circulating water in the summer period.
Energy simulations for different orientations of the façade equipped with an integrated PVT system were performed with the TRNSYS software by Gagliano et al. [
11]. It turned out that the southern orientation of the photovoltaic thermal façade was about 30% more effective than the western orientation.
The comparison of the two systems: a photovoltaic plant plus a solar thermal plant (PV + ST) and PVT plant was a prime focus of the research conducted by Gagliano et al. [
12]. A residential unit in three locations, Catania (Italy), Split (Croatia) and Freiburg (Germany), was analysed. The results of the energy simulation showed that the PVT system converts more energy than the PV + ST plant in all of the cities analysed in this article. However, it turned out that the PV plant would bring higher economic benefits due to the lower initial cost of this investment.
The market for PVT systems rises slowly, but, so far, this technology can still be called niche. Keizer et al. [
13] argues that the main barrier to the development of PVT systems is still its low cost-effectiveness and high initial investment costs. Probably due to low popularity, a module for simulating the operation of PVT systems has not been developed, so far, in the DesignBuilder software.
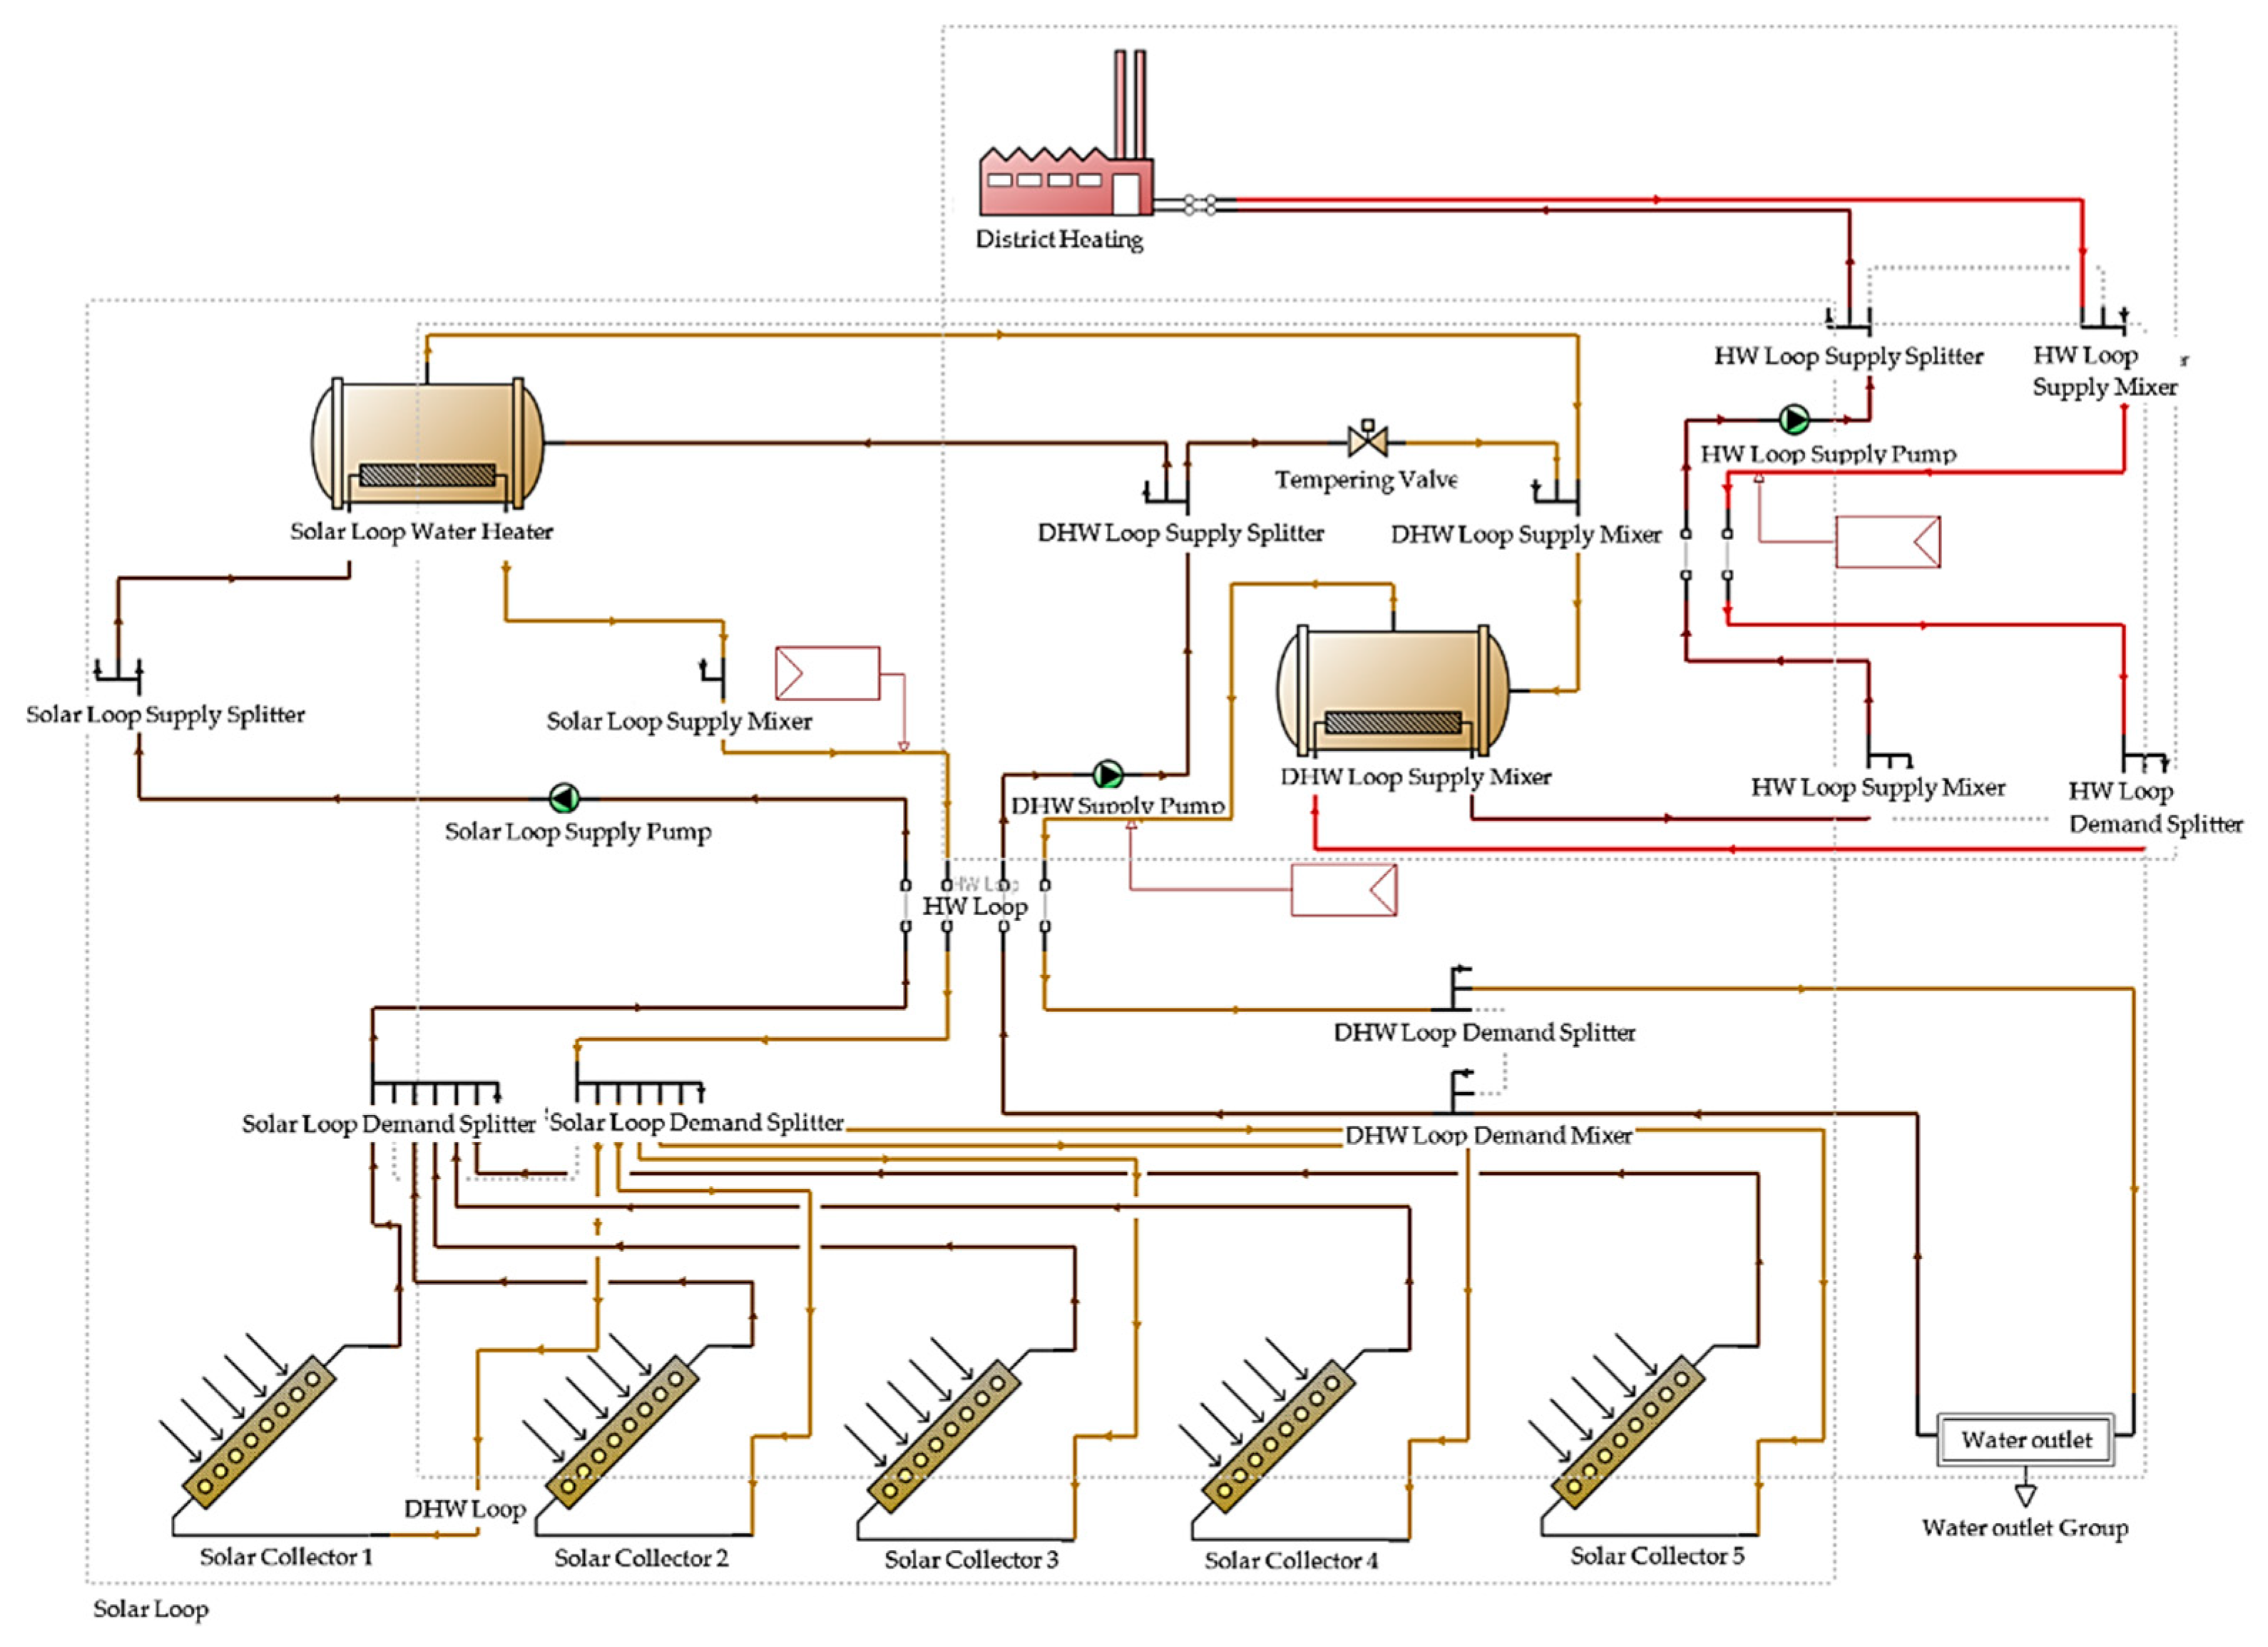
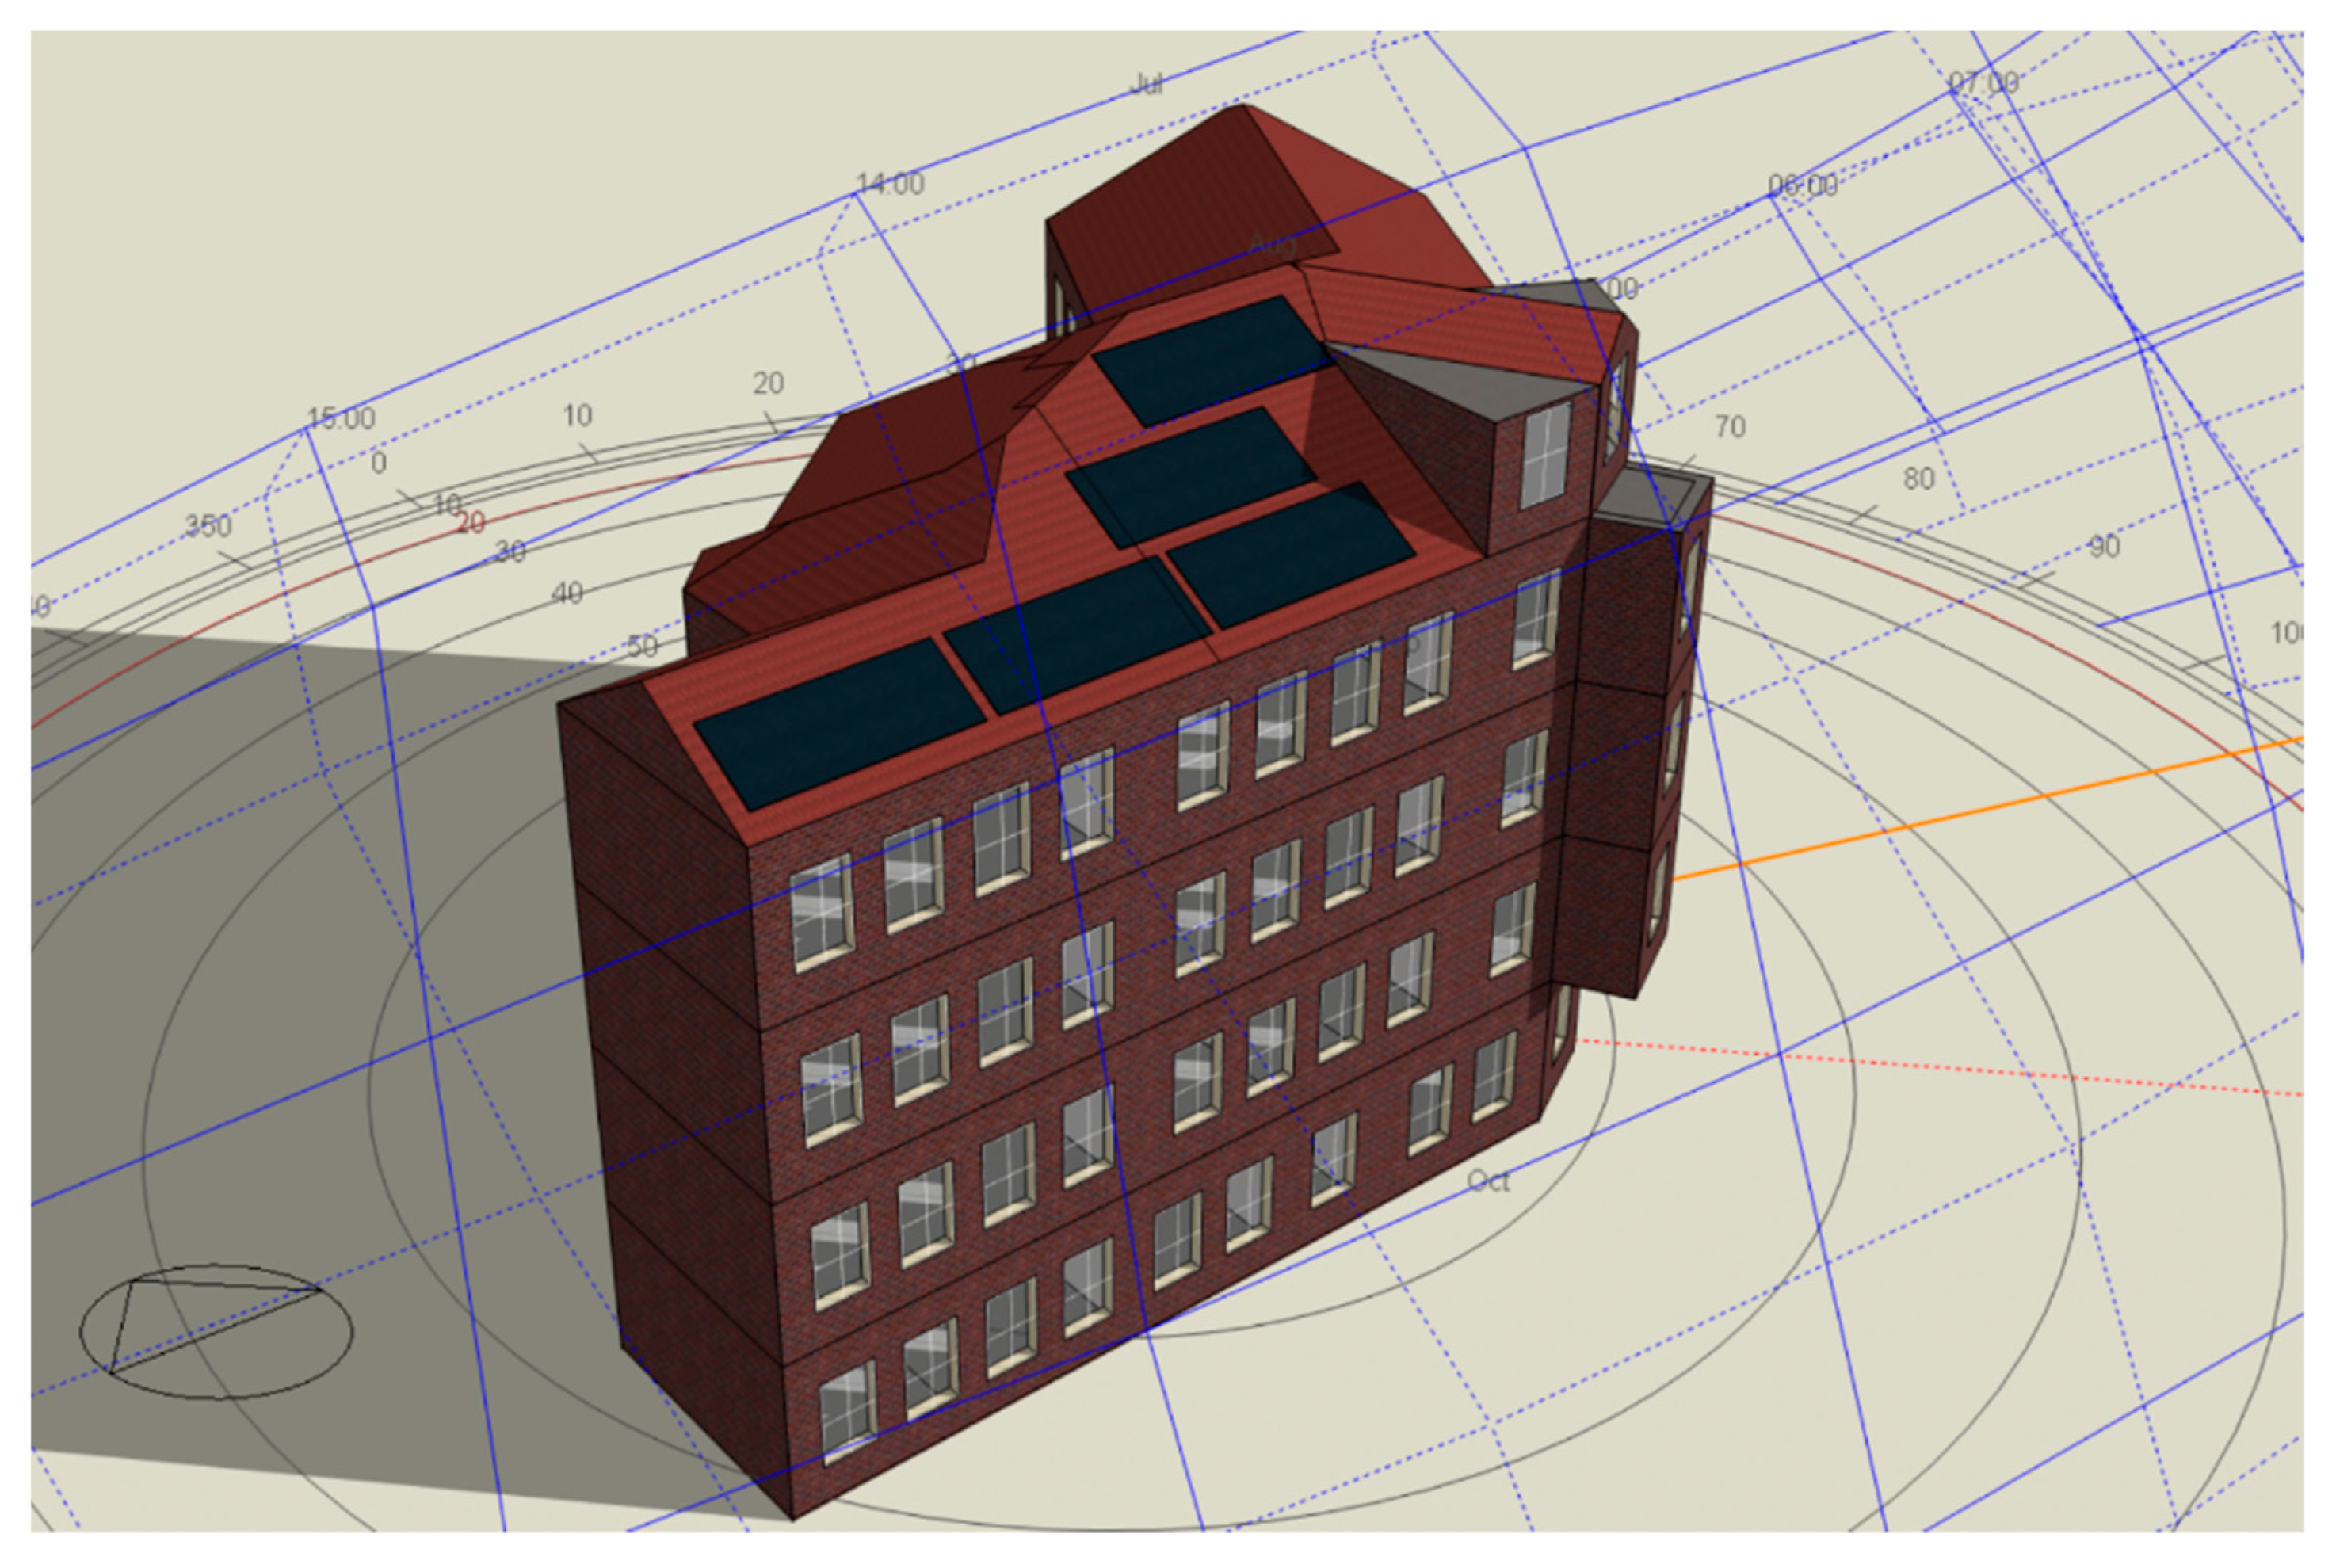
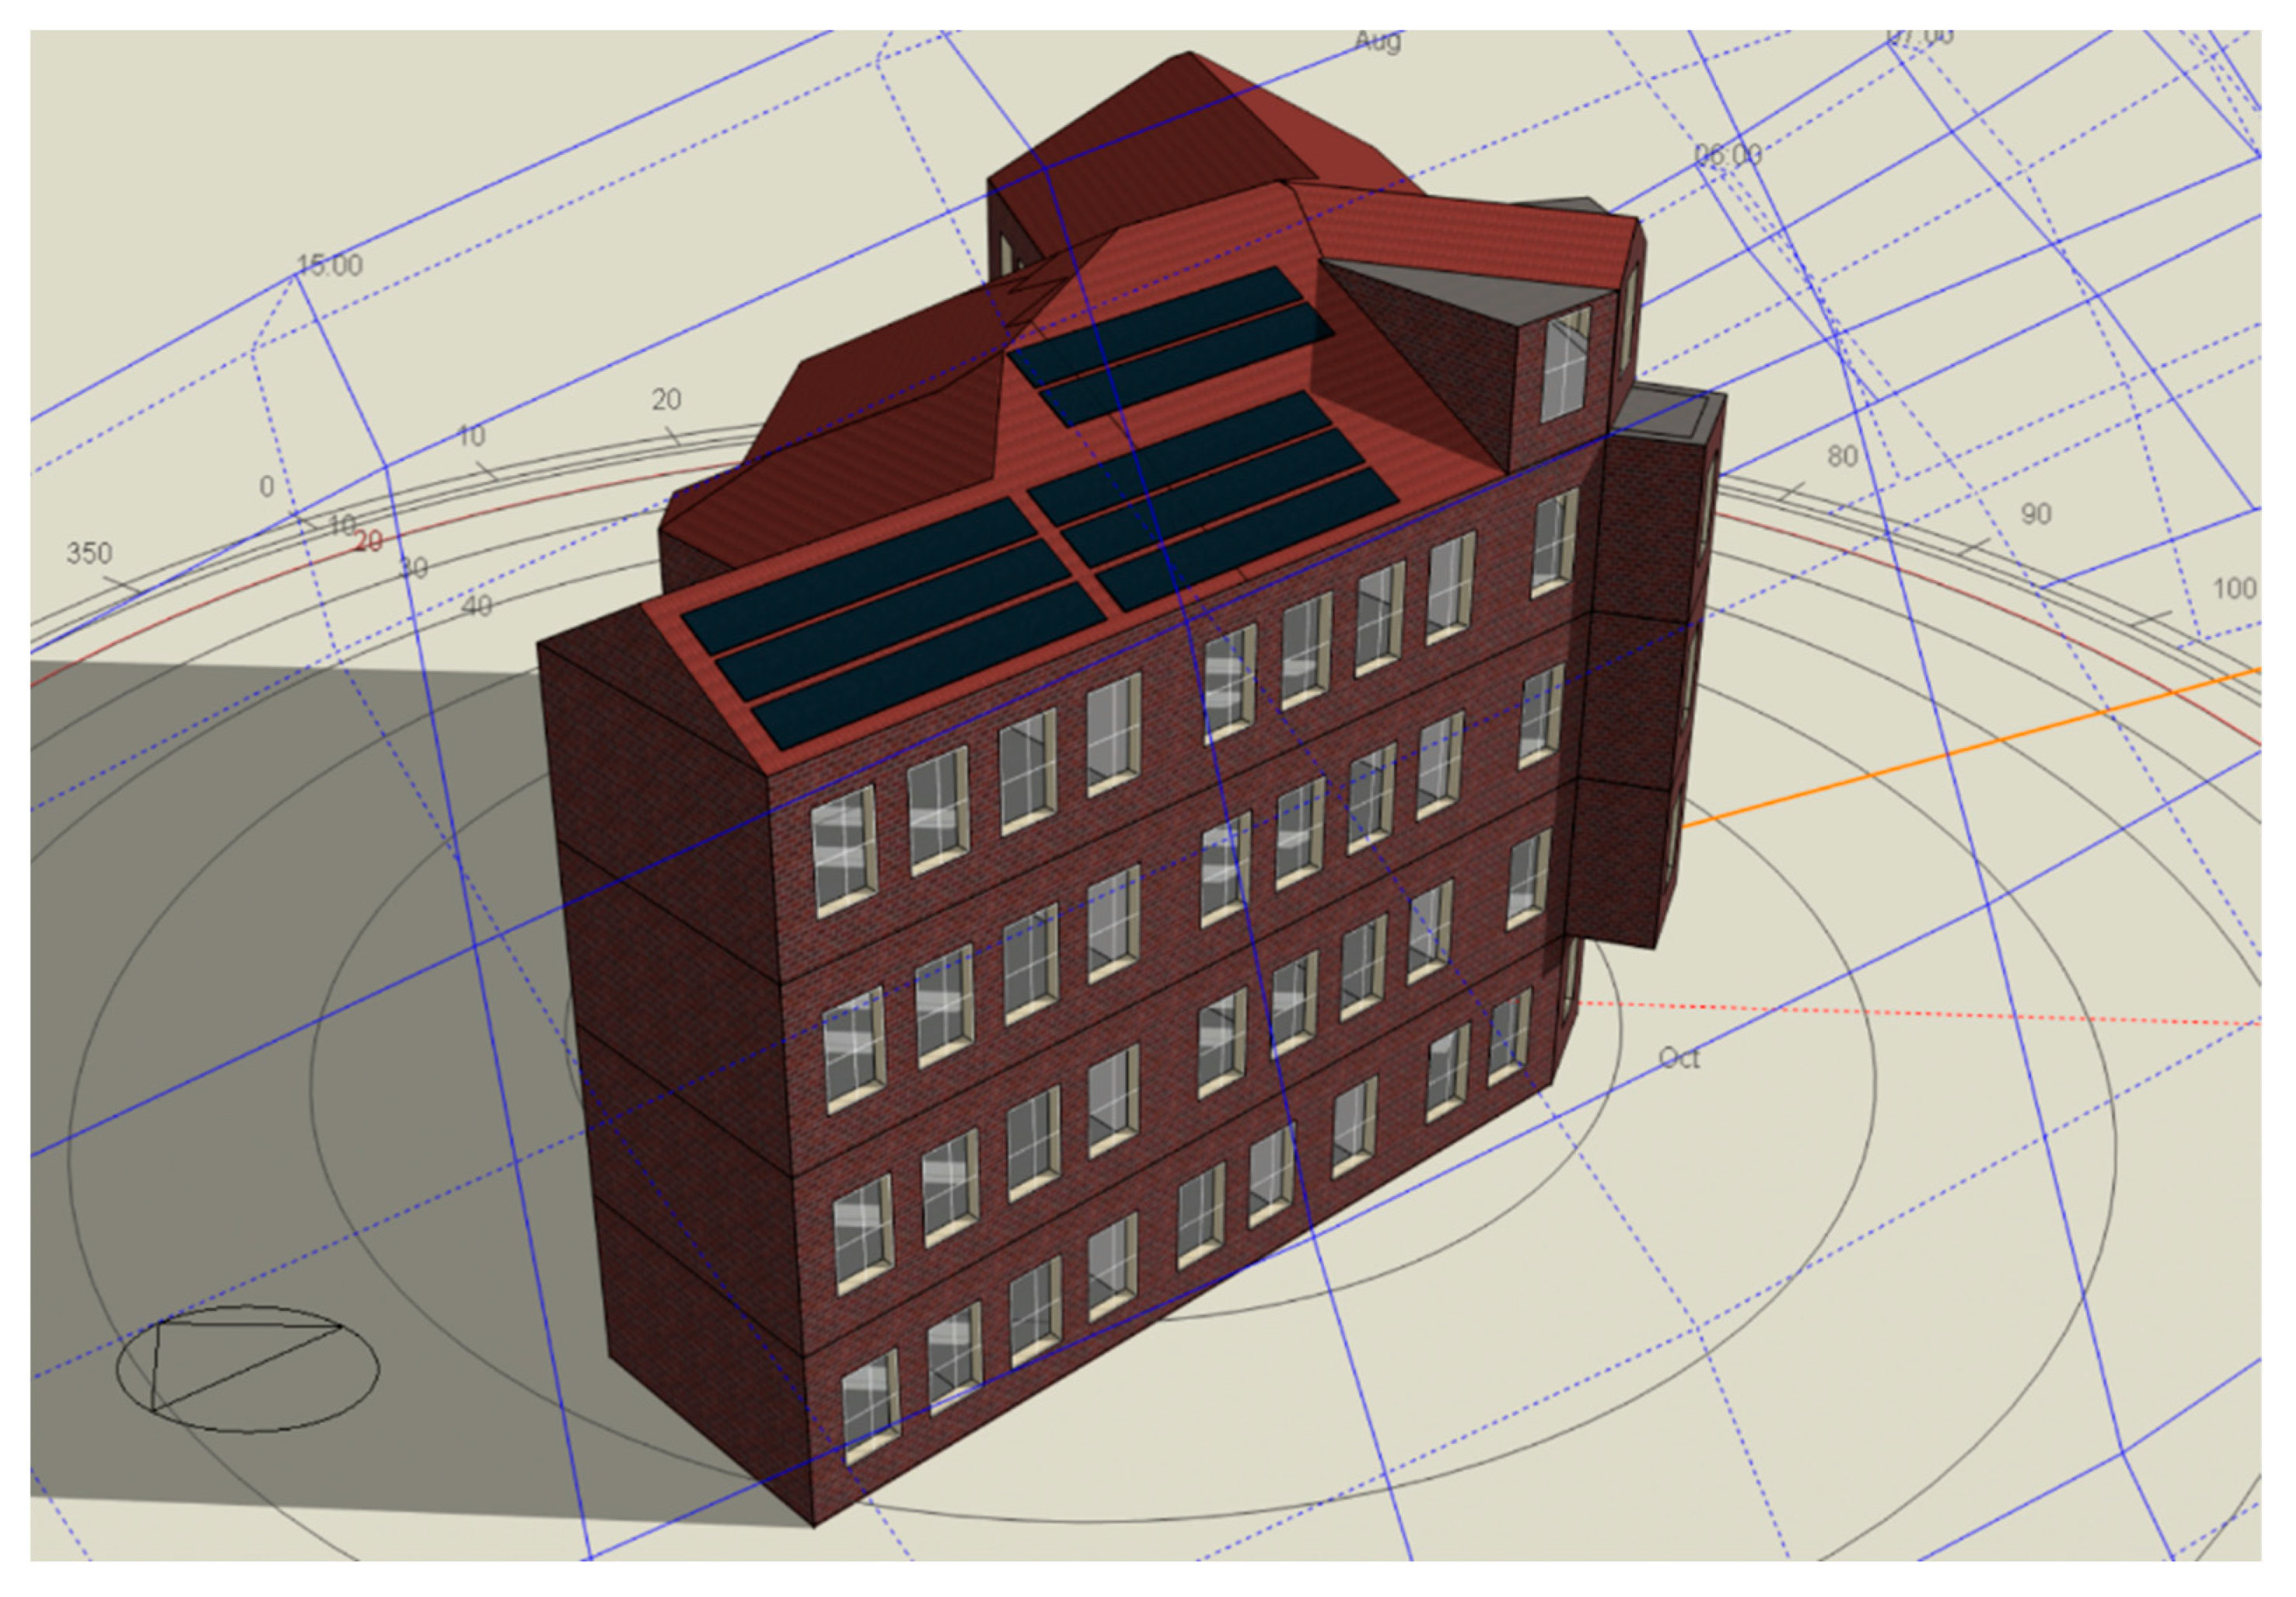
An increase in the energy efficiency of historic buildings under the care of the Monument Conservation Department is a major challenge for the designer. In the current paper, the subject of research is a historic tenement house located in Poznan (Poland) with a total area of 2021.29 m2. It is planned that it will undergo a complete renovation. One of the elements of this modernization is to replace the heat source. Currently, the tenement house is supplied with heat from the municipal district heating system. Renewable energy sources must be used to reduce primary energy consumption. The installation of thermal solar collectors and photovoltaic panels is under consideration. Only one part of the roof, facing south at an angle of 30°, can be used for this purpose. The requirements related to the protection of historic buildings has meant that the façade must not be covered with anything due to the architectural details placed on it. Due to the limited area of the roof, it is necessary to decide which type of thermal or photovoltaic collectors will be applied. The main purpose of this analysis is to determine the amount of energy that can be supplied by both types of devices under operating conditions. Another issue discussed in this article is the determination of the reduction in pollutants emitted to the atmosphere as a result of the use of devices for converting solar energy into heat and electricity. The conclusions of this work will be used in the development of a renovation scenario for this historic building. In addition, the results of this analysis can be used for the energy modernization of buildings located in a similar climate zone as Poznan.
3. Results and Discussion
3.1. Estimation of Energy Production
The amount of energy that can be delivered to the building as a result of solar radiation conversion and the rate of the heat loss was determined by these calculations. The total demand for thermal power of the tenement house at the design temperature (−18 °C) of the outside air is 43.61 kW. The individual components of the thermal power loss are shown in
Table 3. The following data concern the condition of the building after its internal insulation.
In the case of thermal solar collectors, the system provided around
ESC = 24,097 kWh (469.18 kWh per m
2 gross area) of thermal energy per year. The annual energy production by PV panels was much lower and amounted to
EPV = 6860 kWh (136.11 kWh per m
2 of active area), assuming 95% inverter efficiency. To determine the operational efficiency
η (Equations (1) and (2)) of solar energy conversion, the total amount of energy incident per m
2 of the plane inclined at the same angle as the collectors was calculated. This value was
ESOL = 1061 kWh/m
2 for the meteorological conditions of Poznan.
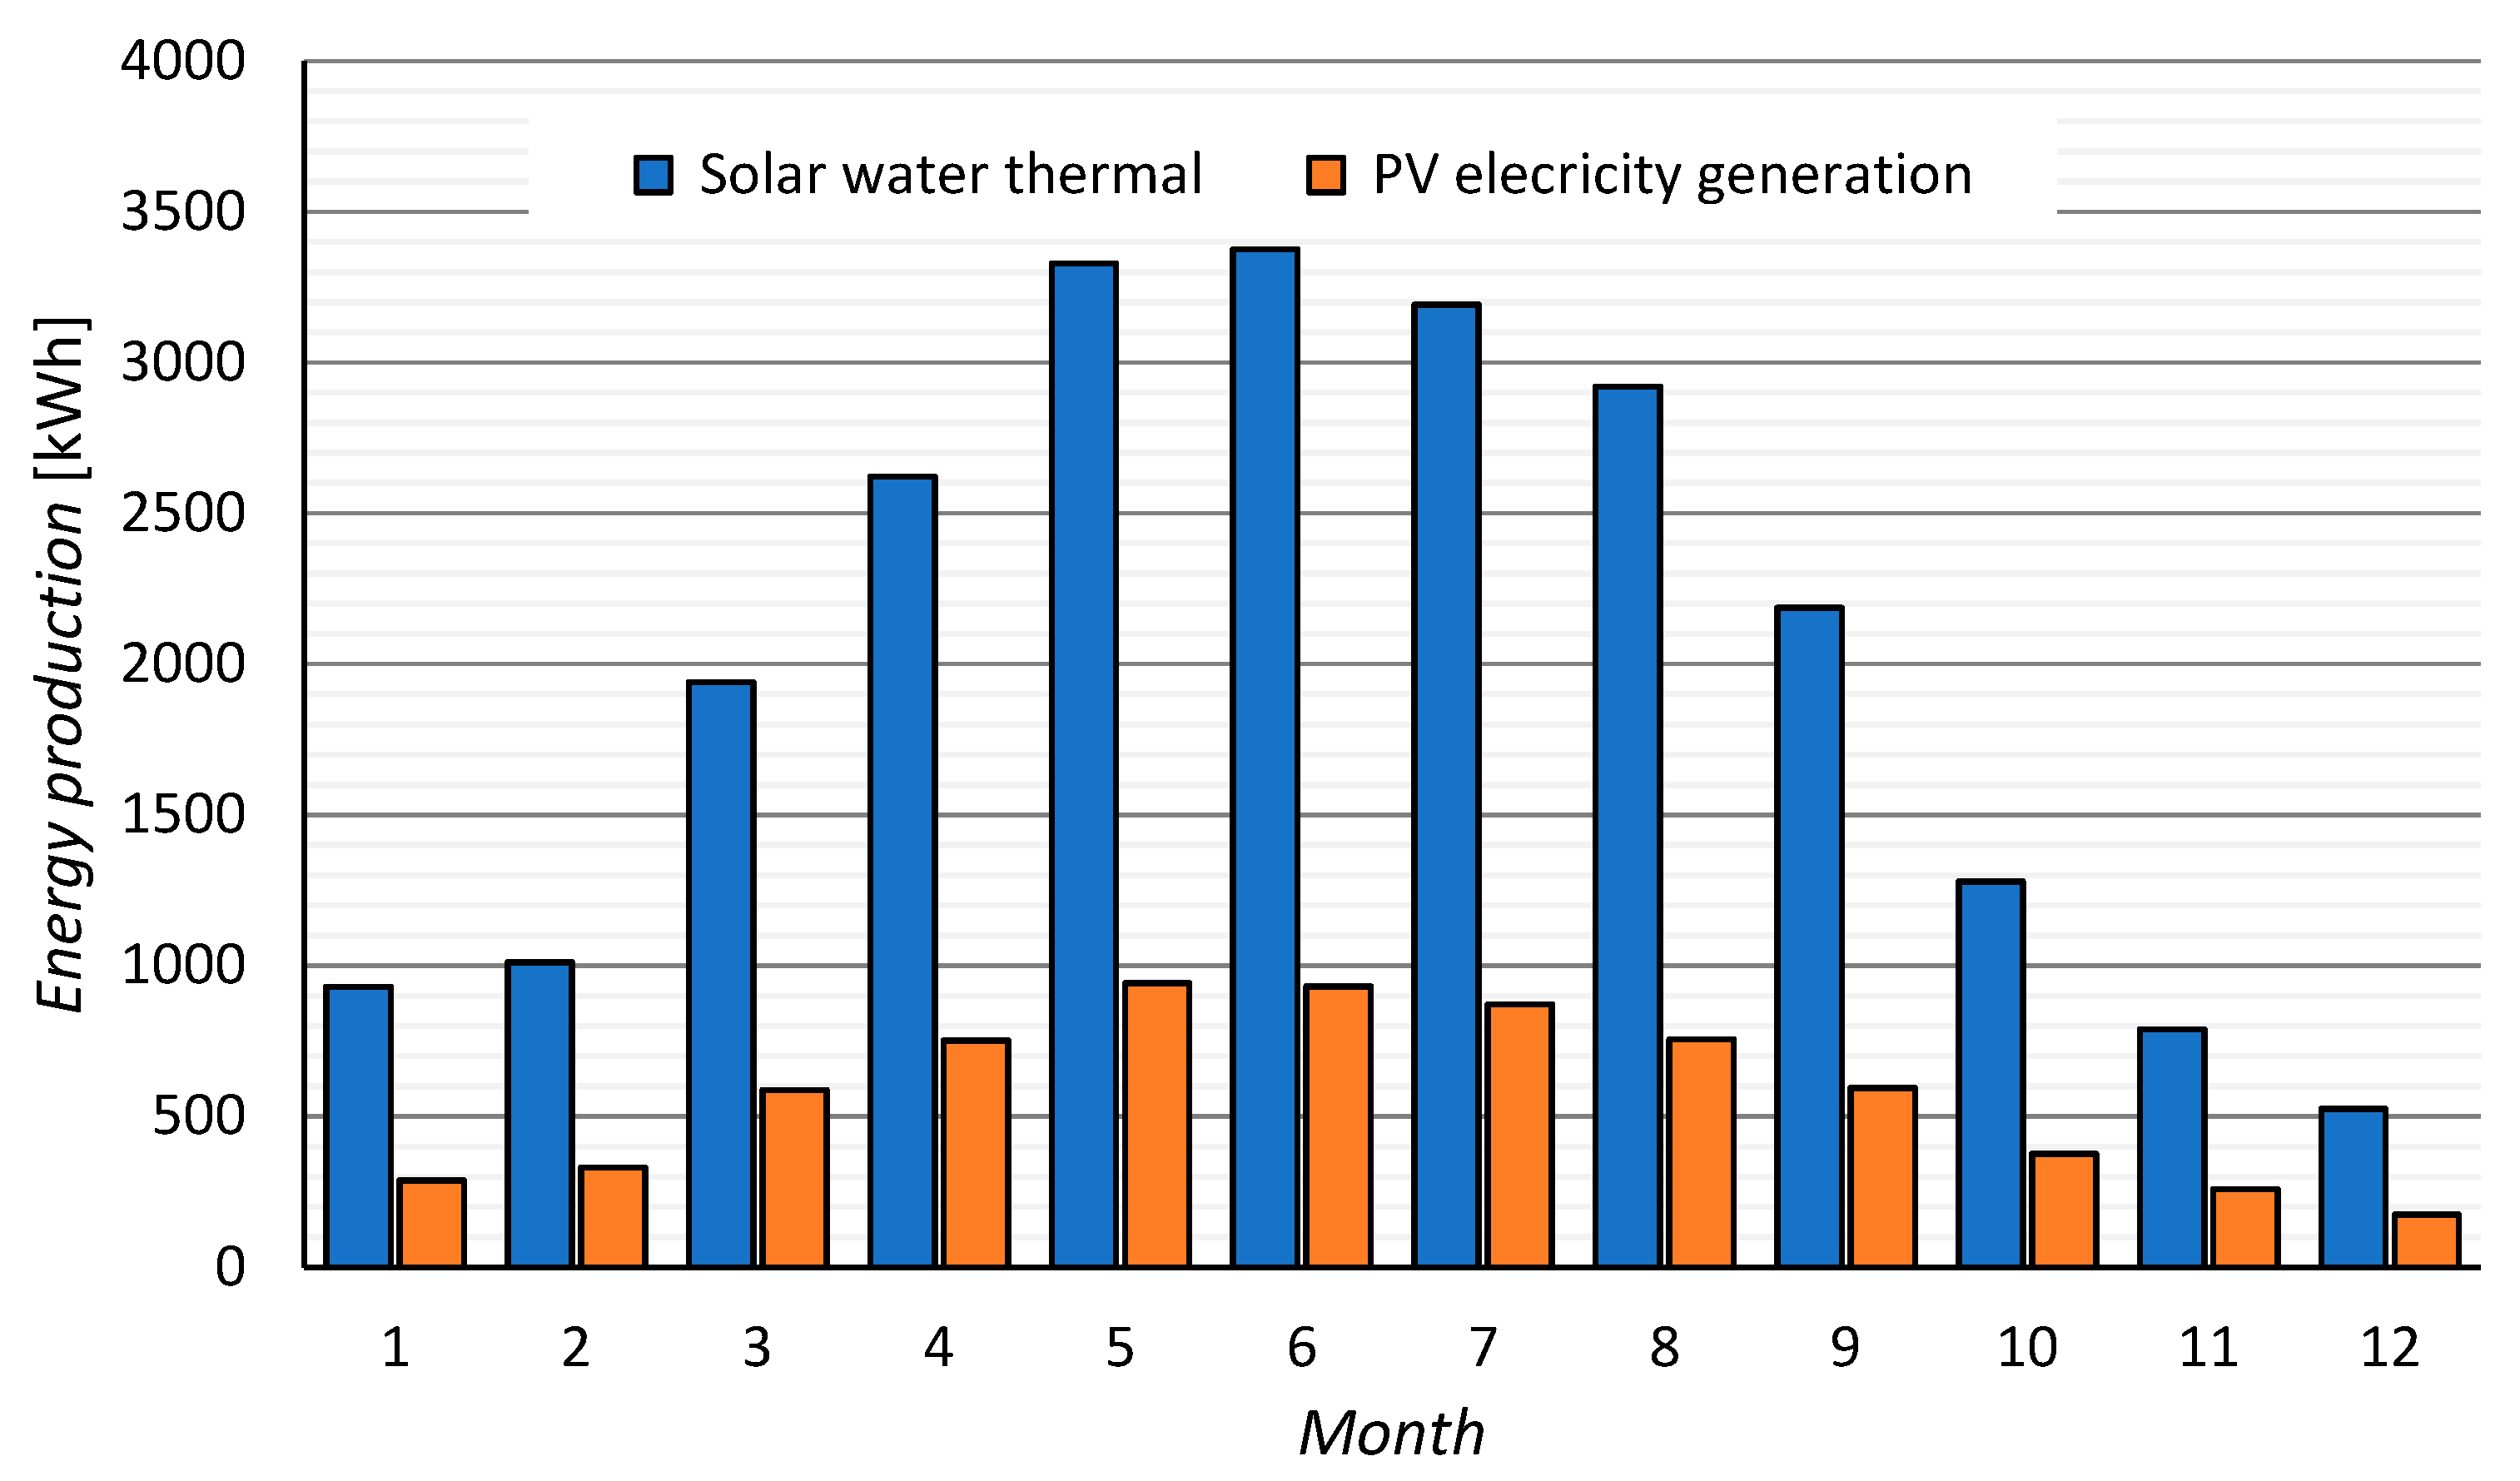
The efficiency of the entire SDHW system was equal to the average value for this type of renewable energy sources and was 44%. The highest value occurred in August, while the efficiency of PV panels turned out to be much lower and amounted to 13%. Their highest efficiency was in February. The annual distribution of energy produced by SDHW and PV systems is shown in
Figure 7. When analysing the change in the amount of converted energy, it can be concluded that in the winter months this value is about two times lower than the annual average. These two systems produce over one and a half times more energy than the average in summer.
In order to correctly compare these two systems, it was decided to determine how much primary energy is used to generate electricity and useable thermal energy. For this purpose, a Primary Energy Factor (PEF) was used.
According to the Regulation of the Minister of Energy of Poland [
15], the value of PEF for grid supplied electricity is 2.5. On the other hand, the PEF value is 1.3 [
16] for thermal energy from district heating and the coal fired cogeneration unit. In order to determine what amount of saved final energy corresponds to the primary energy, i.e., energy harvested directly from natural resources, we multiplied the PEF coefficient by
EPV and
ESC. As a result of this calculation we could save 17,150 kWh for the PV system and 31,326 kWh for the SDHW system of primary energy, i.e., the energy contained in the fossil fuel.
The annual electricity consumption of the building is 46,107 kWh. Thus, the energy supplied from the PV system covers only 14.8% of this demand. The situation is much better when it comes to providing additional energy from the system of thermal collectors for DHW heating. In this case, the annual solar fraction (SF) of the DHW system is approximately 39.8%. However, this is not enough, because in such climatic conditions the design value of SF should be around 50%. This proves that the roof area that can be used for renewable energy systems is too small. This is due to the following features of the building: it is L-shaped, relatively high and has a gable roof. For this reason, the variant involving the use of both solar energy conversion systems was not analysed.
In order to present the performance characteristics of both renewable energy systems in more detail, their operation on selected days in the winter (1–4 January) and summer (1–4 July) is shown in
Figure 8,
Figure 9,
Figure 10 and
Figure 11.
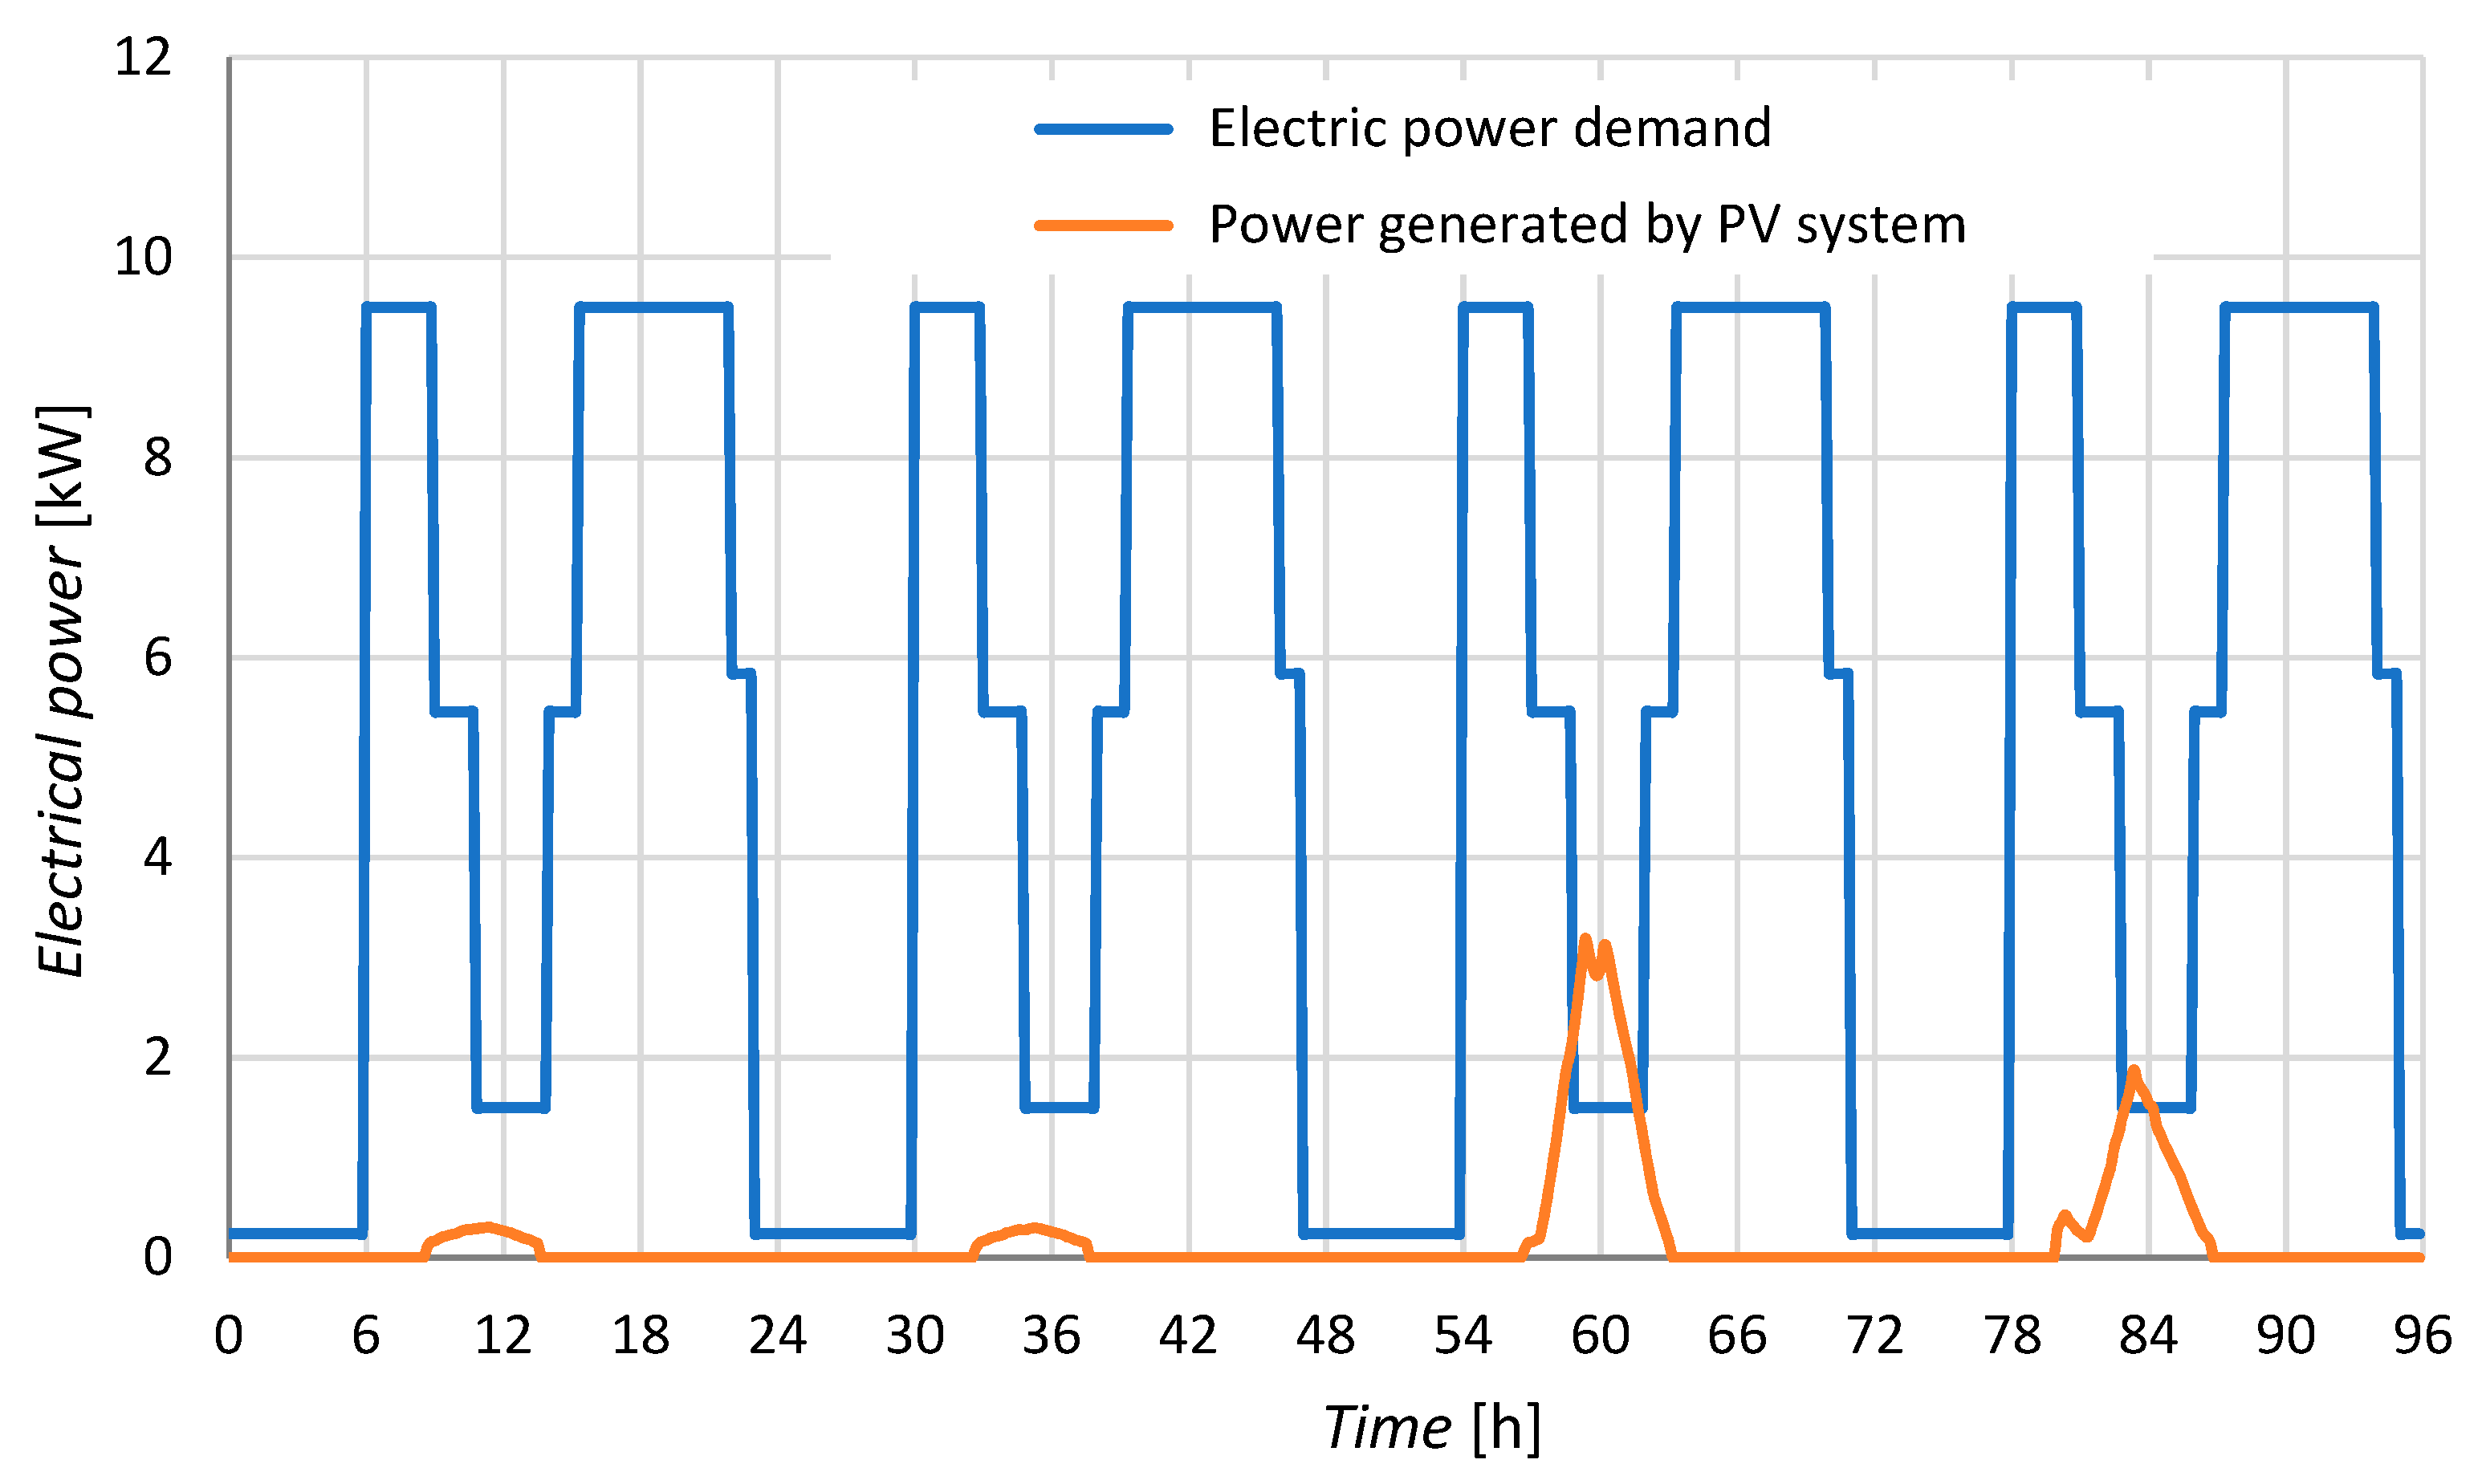
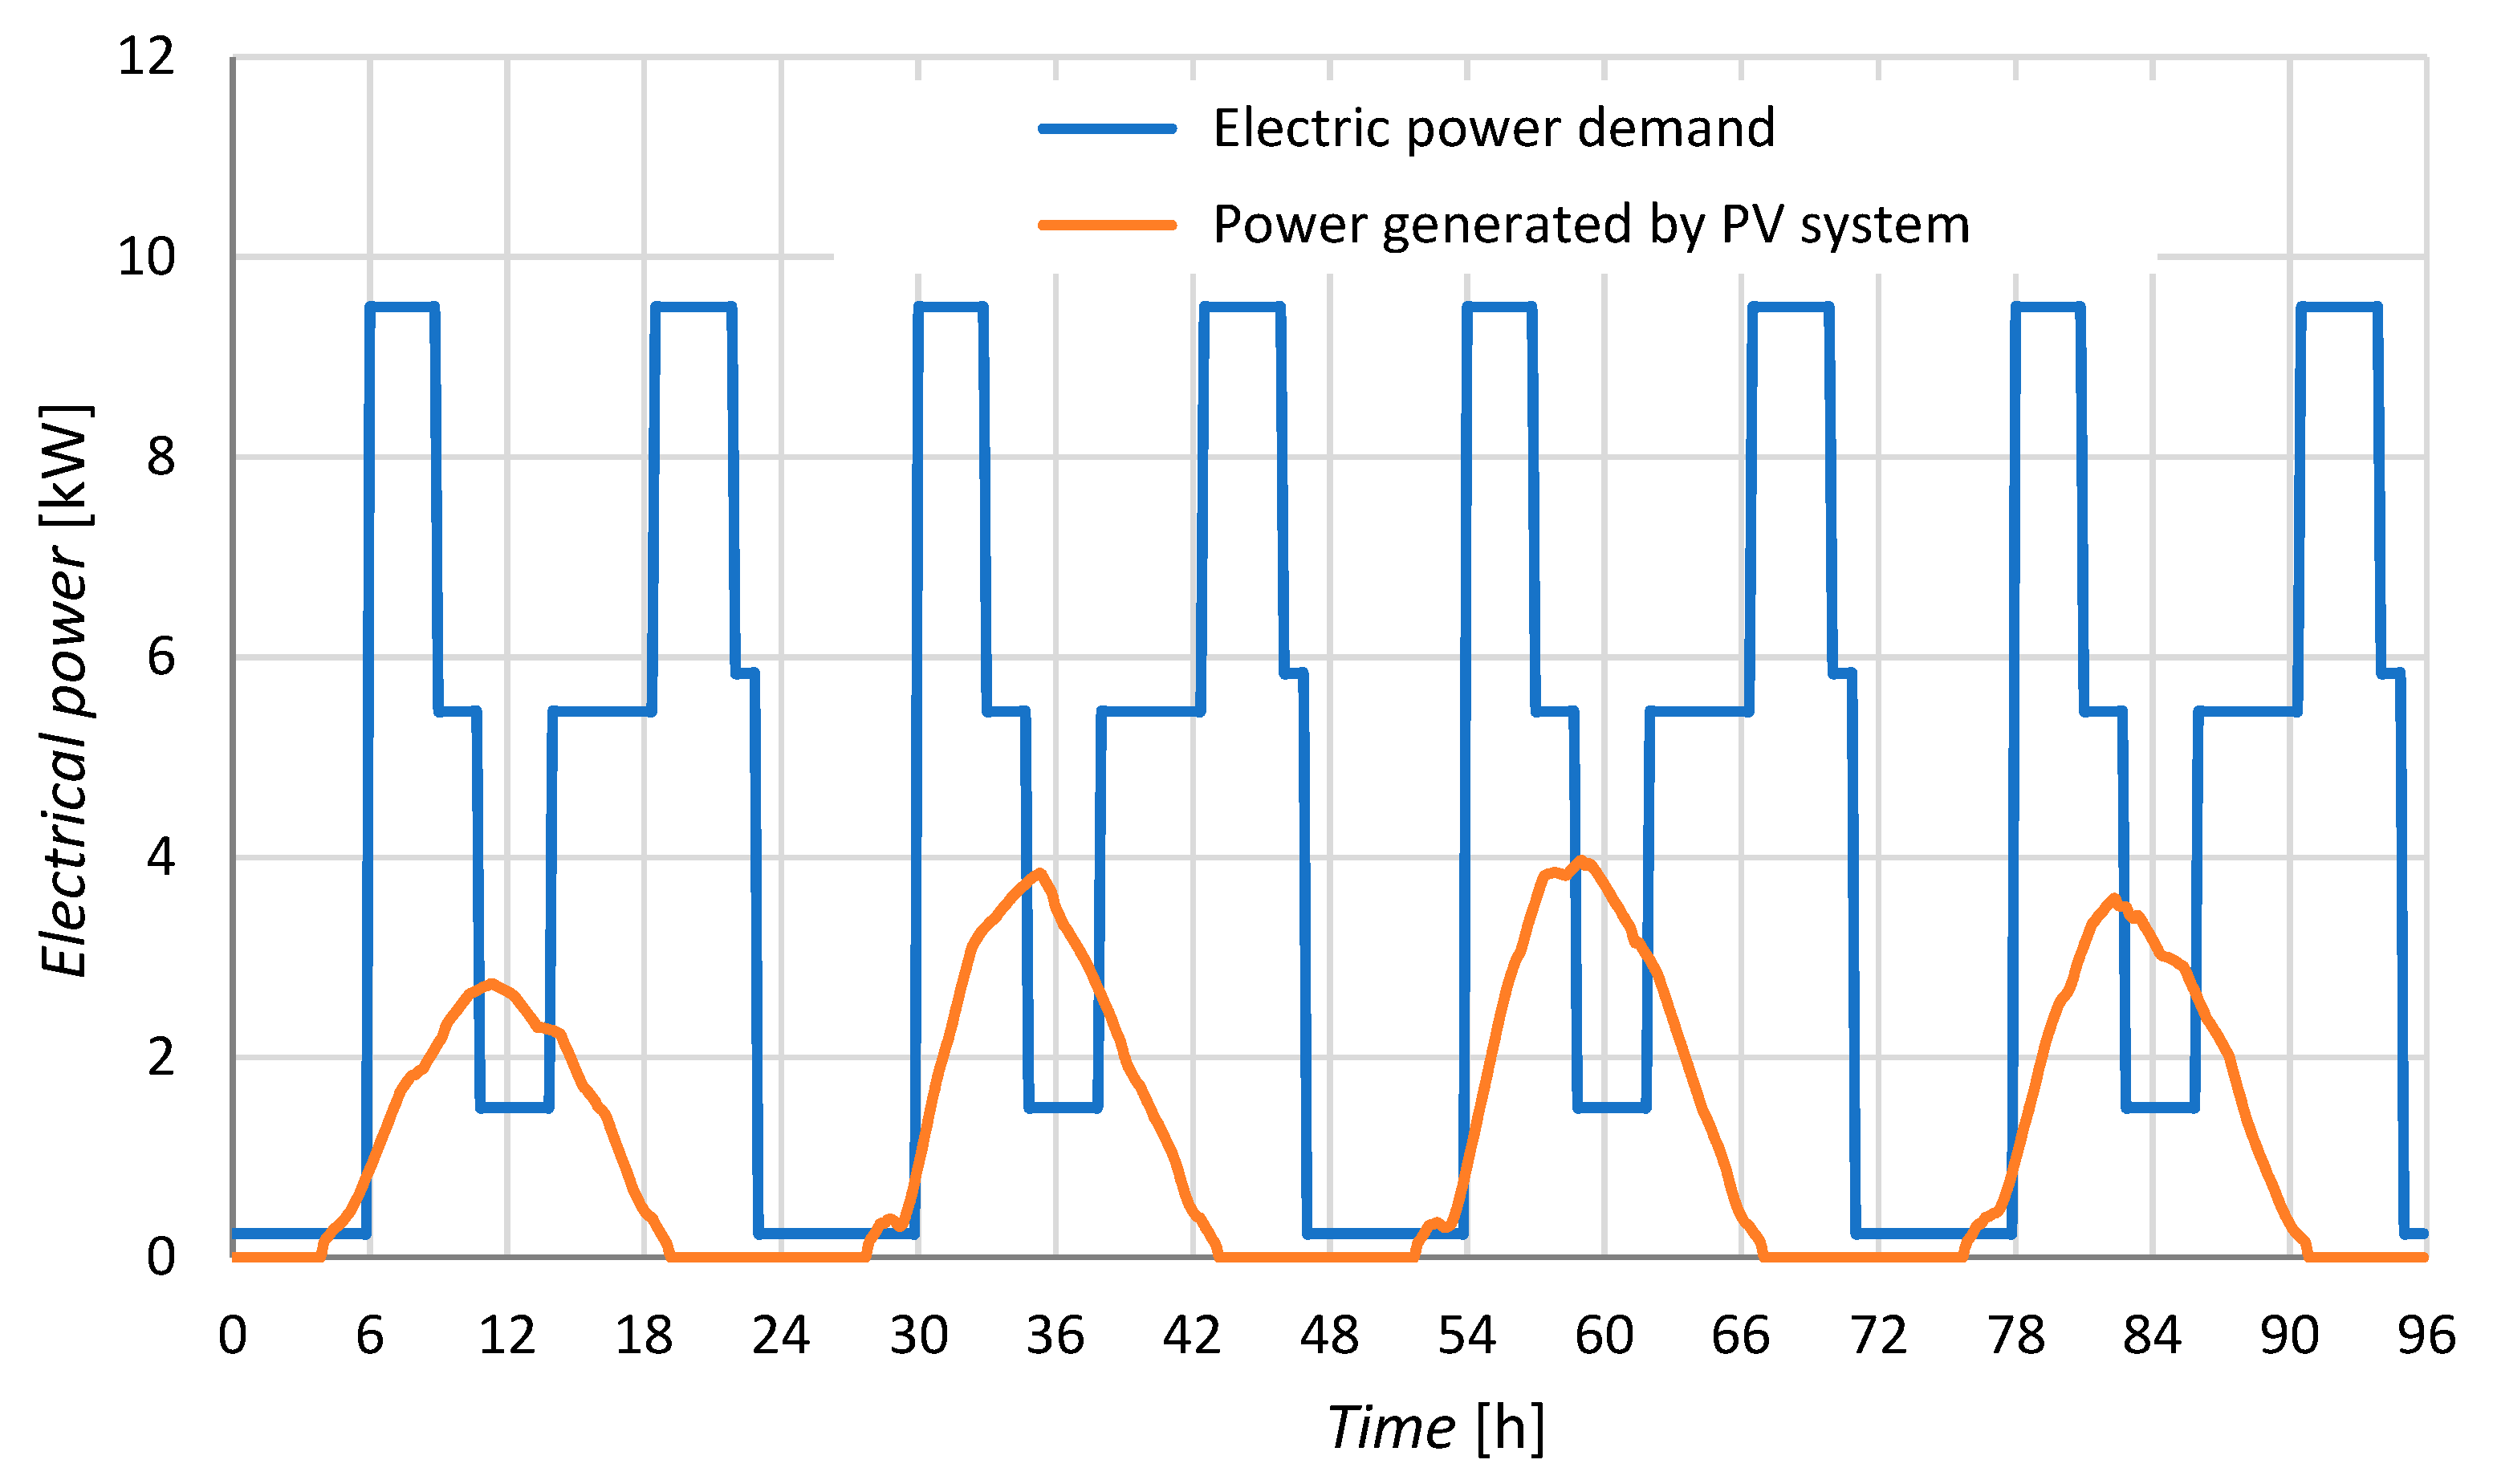
Both systems produce a small amount of energy during the winter season. This is obviously due to the short operating time of the sun and its low position above the horizon. From 1 to 4 January, the PV system covers only less than 4% of the electricity demand (
Figure 8). This situation changes radically in the summer when this value increases to 27% in the first four days of July (
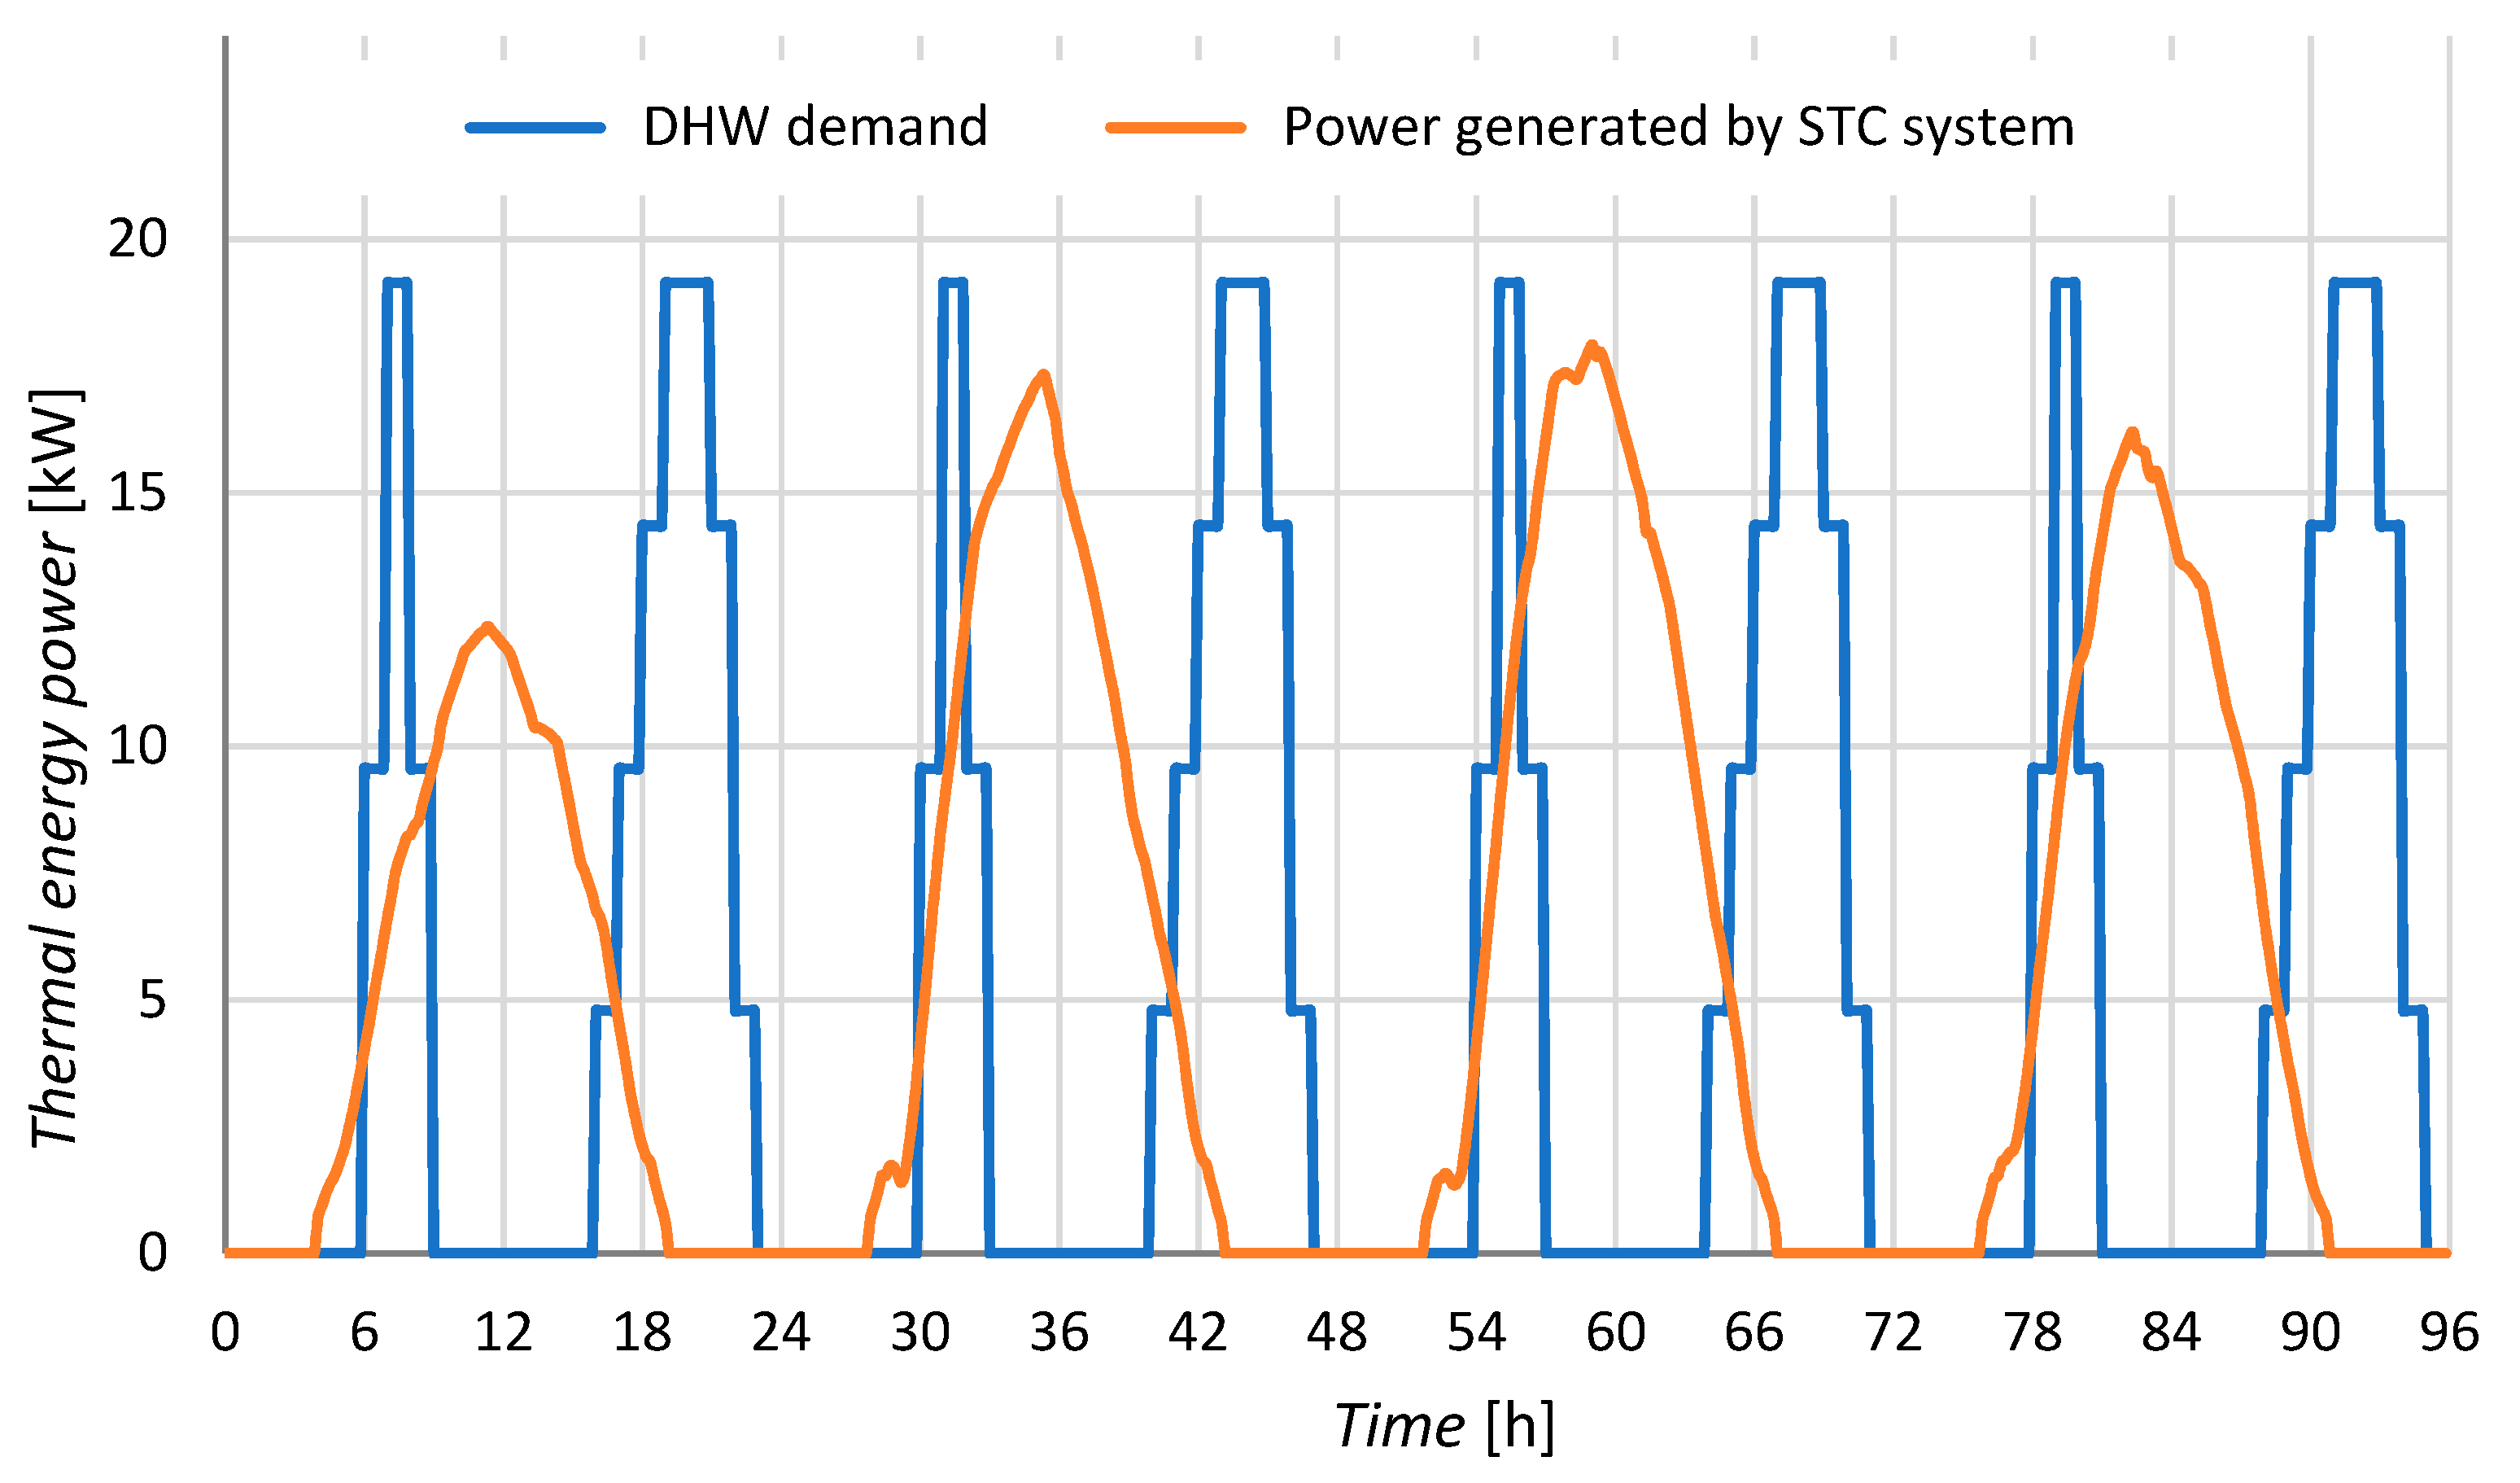
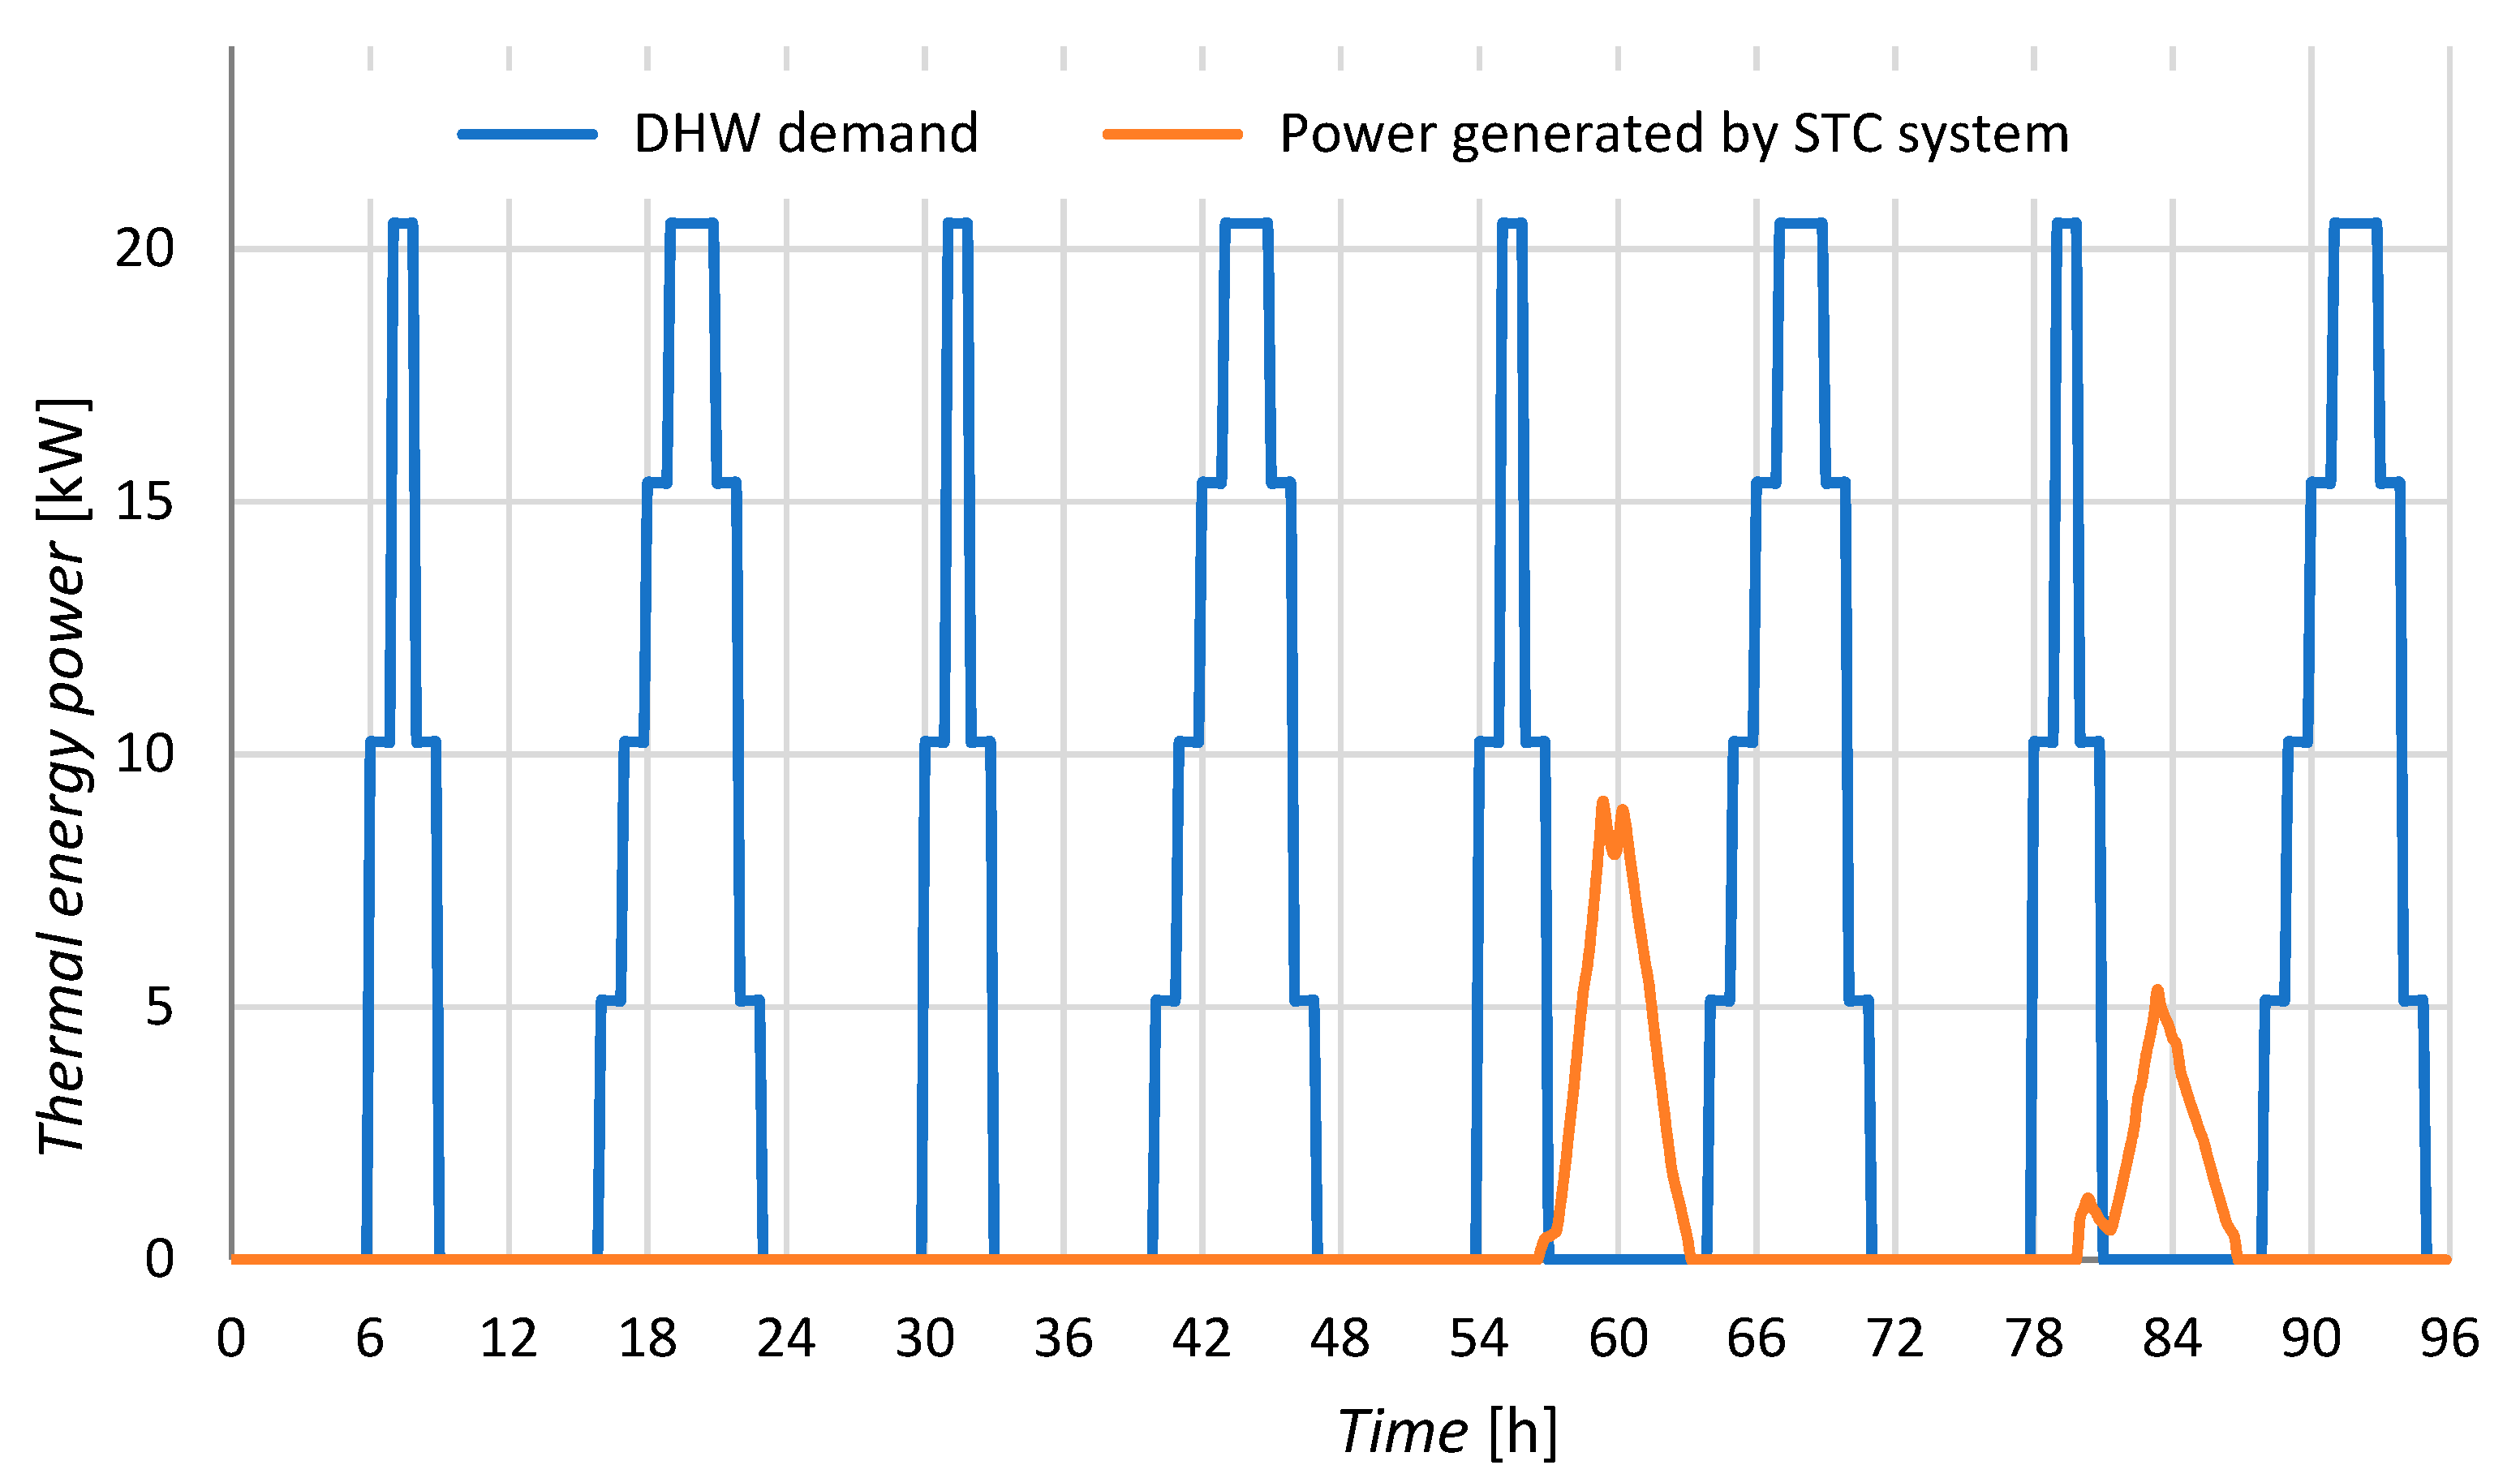
Figure 10). In the case of the STC system, in the first two days of January, the collectors do not turn on despite little solar radiation and due to high heat losses at low outside air temperature (
Figure 9). On the other hand, from 1 to 4 July, solar collectors produce 15% more heat energy than is consumed (
Figure 11). The excess heat is accumulated in the water storage tanks.
3.2. Estimation Energy Savings in Other Locations
It was decided to perform additional calculations for the analysed building in other locations in Europe. Two extreme cases in terms of the severity of the climate were selected: Madrid (Spain) and Kiruna (northern Sweden). According to the climatic data for building design contained in the ANSI/ASHRAE 169–2020 standard, the following numbers of climatic zones correspond to individual cities: 3C, Madrid; 5A, Poznan; 7, Kiruna. On this scale, 1 means a very hot climate and 8 means an arctic climate. The summary of the calculation results is presented in
Table 4.
As can be seen from the analysis of simulation results, the STC system generates much more energy than PV panels in all locations. The highest efficiency of thermal collectors is achieved in Madrid, of course due to the higher outside air temperature, which results in lower heat losses. The opposite phenomenon occurs in the case of photovoltaic systems. Lower ambient temperature increases efficiency, which is the result of better cooling of the panels.
3.3. Economic Assessment of Both Type of Renewable Energy Systems
Reducing the cost of energy is a very important issue from the point of view of the energy consumer. Thus, the real question is whether installing solar energy conversion systems will help achieve this goal. The price of electricity and heat from the district heating network in Poznan were assumed for this analysis. In the case of determining the price of electricity, the fixed and variable components should be adopted, i.e., cost of electricity consumption and distribution service fee. The current unit price of electricity in Poznan is 0.149 EUR/kWh. District heating prices also include a fixed and variable part of the tariff, which consists of the fee for the heat demand, the cost of consumed energy and its transport. Unfortunately, the energy consumer still has to pay part of the tariff for the ordered power when the DHW heating system is only partially supplied by thermal solar collectors. Thus, for further calculation, a lower price of 0.0313 EUR/kWh, only for reduced energy consumption, was assumed. This is a big problem in settlements between the producer and the energy consumer because it affects the lower profitability of SDHW systems in Poland.
Annual savings resulting from the use of both systems under consideration were estimated as a result of multiplying unit prices in EUR/kWh by the amount of final energy in kWh given in
Table 4. Using a PV system can bring its users a profit of around EUR 1022, while STC operations can save EUR 754 per year. These are rather small savings compared to the size of both systems and about 60 residents of this tenement house. The cost of the equipment and construction of both systems was estimated at EUR 20,652 for the PV system and EUR 15,870 for the SDHW system. Thus, as we can see, the simple payback period of these investments is almost the same and amounts to around 20 years. It should be noted that this is the most unfavourable option. The calculations presented here do not take into account all kinds of subsidies for the construction of such systems that can be obtained from government programs. However, they have to be assessed on a case-by-case basis.
At this time, as the energy crisis begins, it makes no sense to conduct a more detailed economic analysis as there will soon be a sharp change in energy prices. It should only be mentioned that one of the largest energy operators in Poland has already applied to the Energy Regulatory Office for an increase in tariffs for 2022 of 40%.
3.4. Estimating the Amount of Energy Produced by the PVT System
An additional simplified analysis regarding the use of an alternative solution as a solar hybrid photovoltaic thermal panel was performed. DesignBuilder does not have the option to simulate PVT collectors, therefore, an alternative software, TRNSYS 18, was used. Module 50 named “PV-Thermal Collector” was chosen to perform the energy simulation of this hybrid system [
17]. The input data that characterized the PVT collectors and its equipment are presented in
Table 5.
The results of the calculations performed for the three locations are presented in
Table 6 and, based on their analysis, several conclusions can be drawn.
The efficiency of the PVT system is about 4% higher than that of the STC collectors in Madrid, and in Poznan only by 1.3%. In the cold zone, i.e., in Kiruna, the efficiency of PVT collectors is about 3.9% lower in the same comparison. The use of a hybrid collector reduces the production of thermal energy compared to the STC system by approximately 32% in Madrid, 46% in Poznan and as much as 88% in Kiruna. A similar comparison of electricity production shows a decrease by about 21% in Madrid, and an increase by less than 12% in Poznan and only 0.3% in Kiruna. The low efficiency of hybrid collectors related to the photovoltaic conversion in a hot climate is, of course, related to the high temperature of the medium that should cool the PV cells. Thus, the general conclusion is that the PVT system analysed here can be used in this case when the roof surface is not too large and the RES system should provide both electricity and heat. The best efficiency of this system can be obtained in moderate climate conditions.
It should be noted that very similar conclusions appeared in the report on the tests of 100 m
2 of PVT collectors made by Matuska [
18]. Of course, a different, more efficient design of the PVT collector may lead to other conclusions.
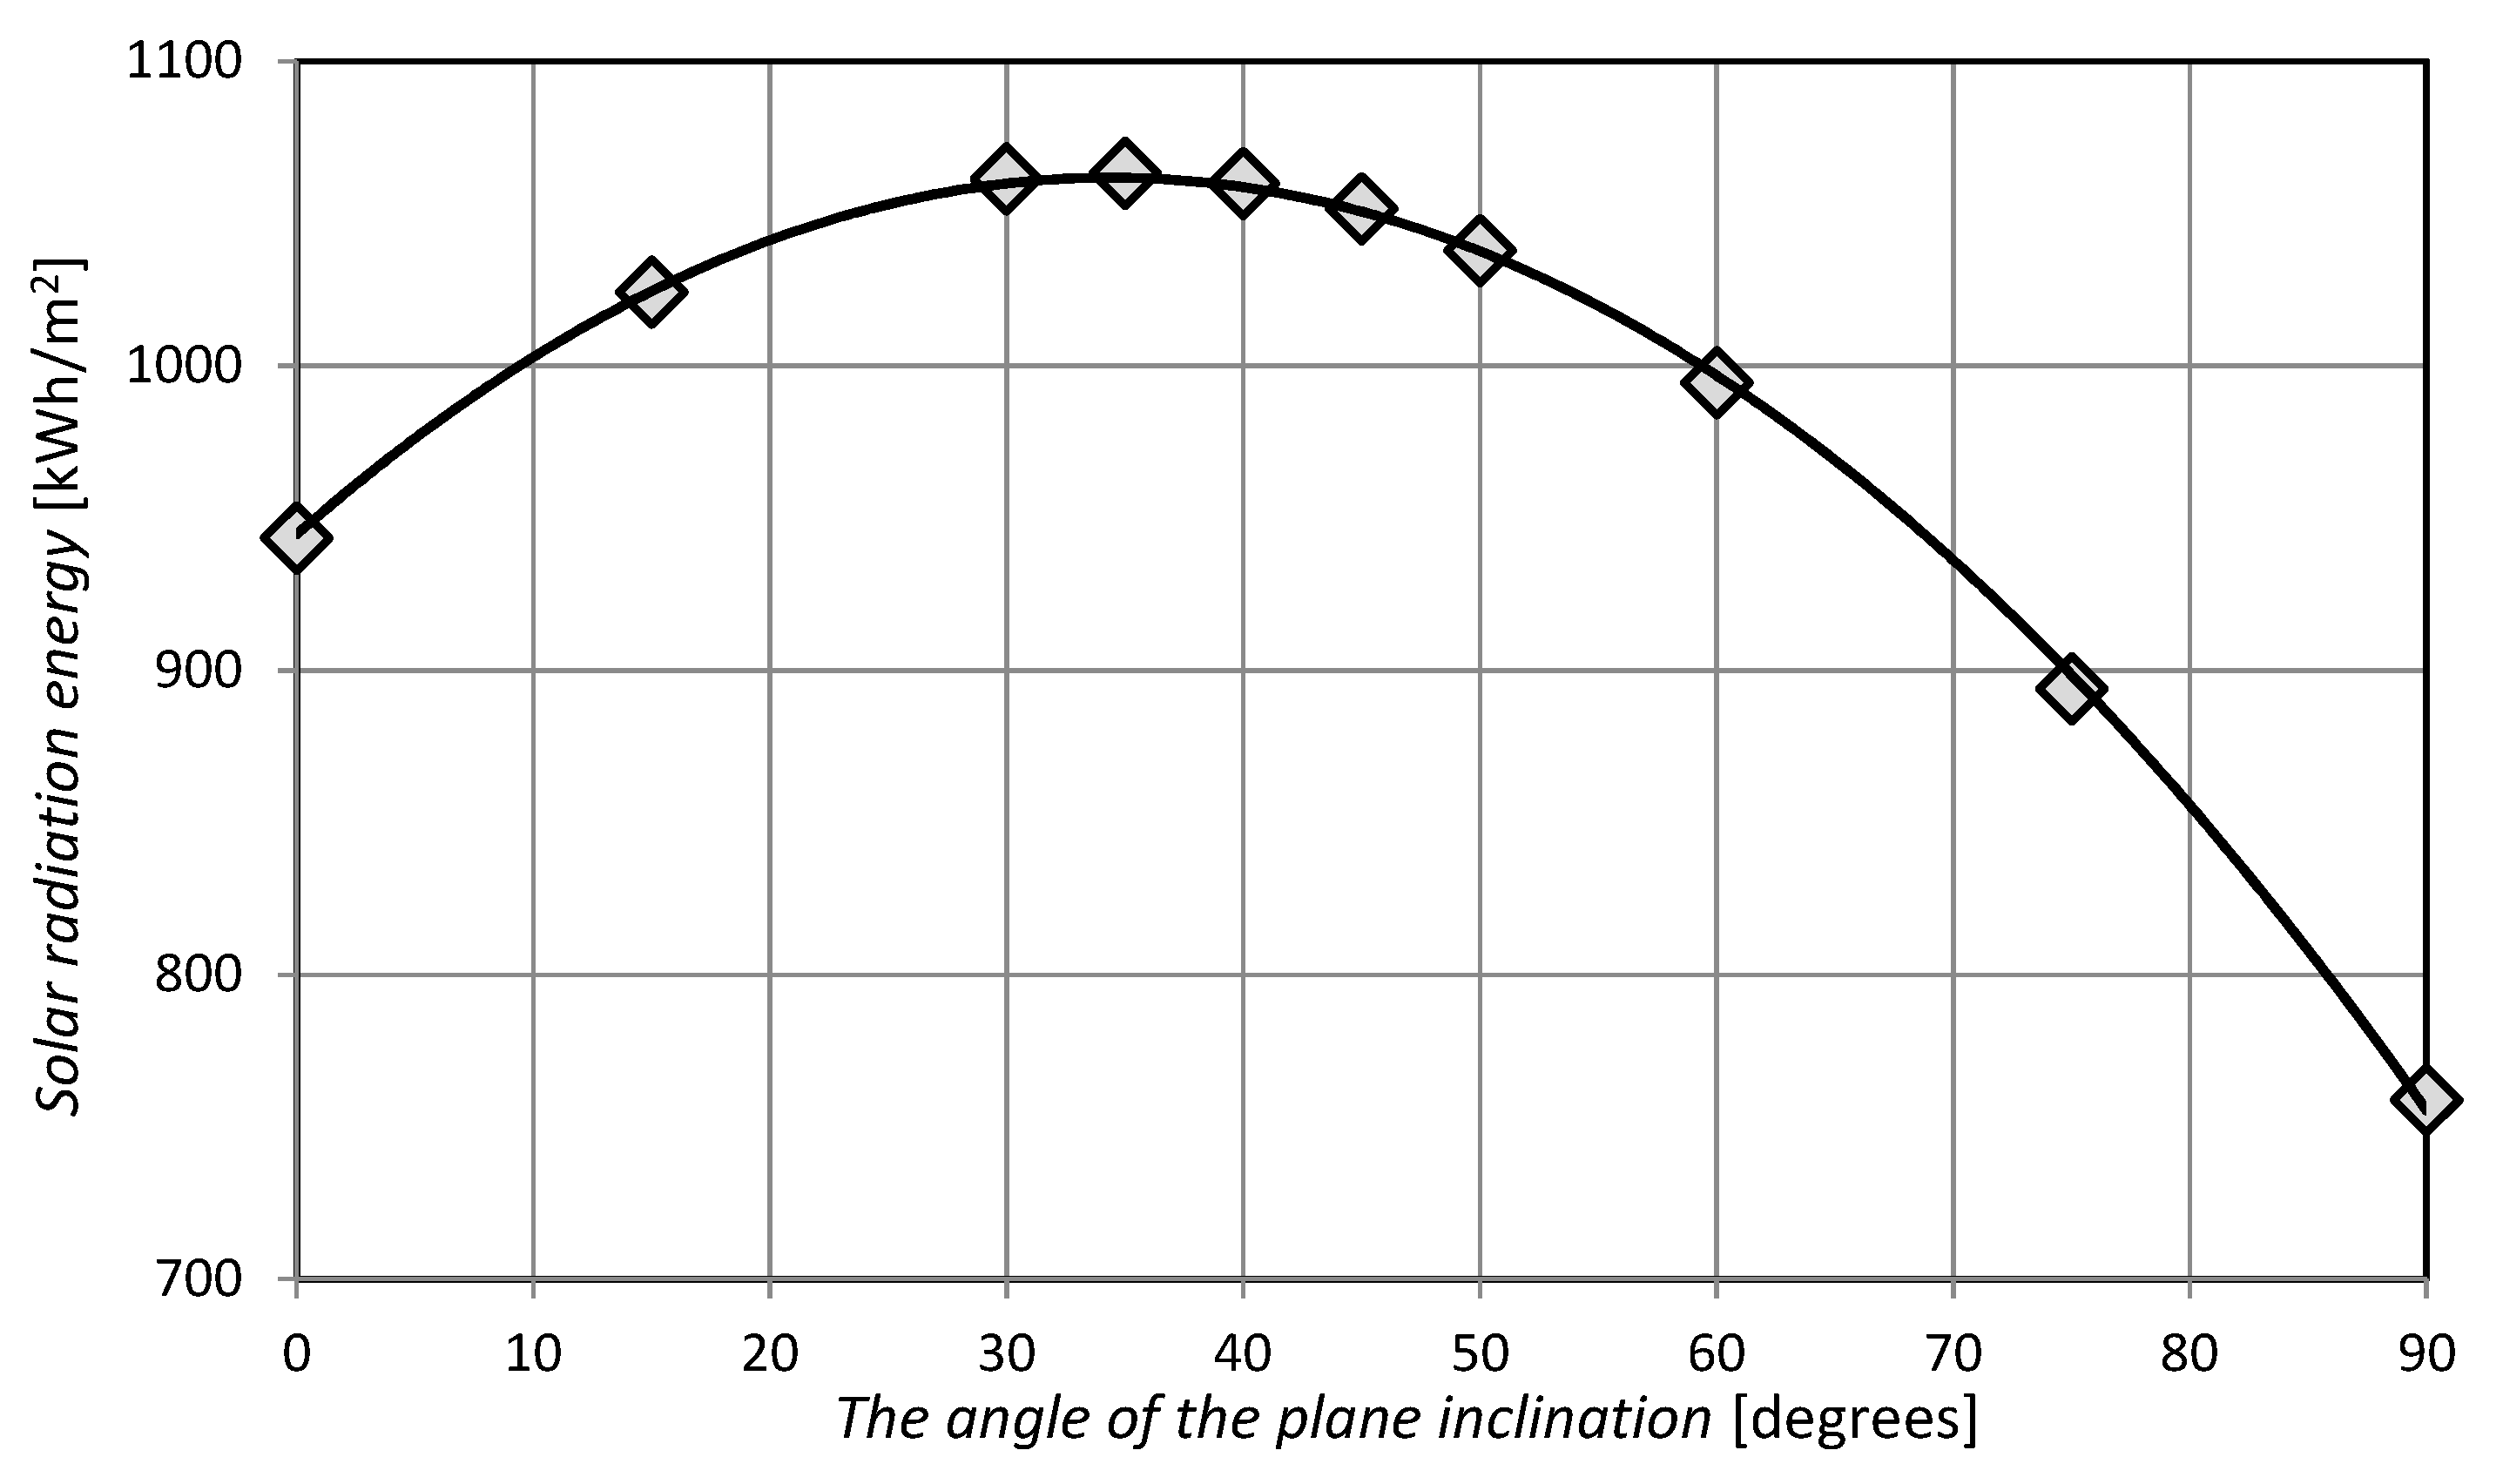
3.5. Determination of the Optimal Angle of Inclination of Solar Collectors
The optimal angle of inclination of solar collectors was determined on the basis of the method developed by Zukowski and Radzajewska [
19]. A series of calculations of the intensity of solar radiation incident on a plane with the inclination angle varying from 0° (horizontal surface) to 90° (vertical plane) was performed. The results of computer simulations made with the DesignBuilder software for Poznan are presented in
Figure 12.
As can be seen from the graph shown in
Figure 12, the optimal angle of inclination of the solar conversion devices is in the range of 30° to 40°. Therefore, the location of solar collectors on a selected part of the tenement’s roof with the slope of 30° turned out to be perfect.
The calculation results can be approximated by the second order polynomial (solid line) in
Figure 12. It is possible to determine the intensity of irradiation incident on the collector with any angle of inclination
α, with a very high accuracy (R
2 = 0.9995), by means of Equation (4)
The above equation is only correct for Poznan and the surrounding area within a radius of about 50 km.
3.6. Results and Discussion on Environmental Impact Assessment
The reduction in greenhouse gas emissions is becoming one of the most important goals of the European Union related to environmental protection. The Council of Europe decided to increase the reduction in CO2 emissions from 40% to at least 55% by 2030 in early December this year. One way of achieving this target is the increasing use of renewable energy. The reduction in the amount of pollutants emitted into the air as a result of the operation of thermal solar collectors and PV panels was determined in this part of the paper. The following pollutants were analysed: sulphur dioxide, nitrogen oxides, PM10 particles, carbon monoxide and dioxide.
The amount of pollutants released into the ambient air Δ
PP was determined by multiplying the reduced amount of energy obtained as a result of using a renewable energy source (RES) Δ
E by the emission factor of the pollutant
PFP [
20]. The measurement results conducted by Polish Energy Group S.A. (PGE) in 2020 were used to determine these emission factors [
21] separately for heat and electricity.
In order to estimate the reduction in the amount of pollutants emitted to the air, primary energy savings obtained as a result of the year-long operation of both systems were assumed. The results of the calculations based on Equation (5) are presented in
Table 7.
Despite a 1.8 times lower reduction in primary energy consumption achieved by PV panels compared to solar thermal collectors, the reduction in pollutant emissions is surprisingly higher: in the case of SO2 by over 190%, NOx by 200%, PM10 by 204%, CO by 154% and CO2 by over 186%. Thus, it can be concluded that the photovoltaic system reduces the negative impact on the environment by almost twice as much compared to the STC system.
4. Conclusions
The renovation of a historic tenement house in Poznan (Poland) is planned in the near future. One of the main assumptions of the project is the use of renewable energy sources in order to reduce the demand for primary energy. The objective of this analysis was to compare two solar radiation conversion systems, either of which could be installed on a selected part of the roof of this old building. The roof faced south and inclined at an angle of 30°. It was assumed that the first system consisting of thermal solar collectors with a gross area of 51.36 m2 was used to support DHW heating. Photovoltaic panels of a total active area of 50.4 m2 were the second system that was compared.
Analysis of the results of computer simulations made with the DesignBuilder software, showed that the use of solar panels allowed a saving of 24,097 kWh of thermal energy per year and 6860 kWh electricity in the case of PV panels. Final energy savings were referred to primary energy savings and we obtained the following values: 17,150 kWh for PV system and 31,326 kWh for SDHW system. The consumer can achieve an average of three times higher final energy savings from the use of solar thermal collectors than photovoltaic panels, and this is independent of location. This value is on average 1.6 times higher when analysing primary energy savings. However, it should be mentioned that electricity is definitely more universal than thermal energy when it comes to using it in all household applications. On the other hand, the advantage of thermal energy is its low cost of accumulation in water storage tanks.
A simplified economic analysis showed that the annual financial savings resulting from the operation of PV panels and STC system, would be EUR 1022 and EUR 754, respectively. These are not high values, but the upcoming surge in energy prices may significantly increase these profits.
The location, or rather the climatic conditions, have a great influence on the performance of RES systems. Based on the simulation results, it was confirmed that in a cold climatic zone, the efficiency of PV panels increases due to the lower ambient temperature, and a warm climatic zone increases the efficiency of thermal solar collectors because the heat losses of these devices are lower.
An alternative solution to the widespread photovoltaic and SDHW systems can be a hybrid solution that combines both constructions in one device. The simulation results showed that the PVT collector under consideration produces significantly less thermal energy than traditional thermal collectors. A positive feature of this solution is the increase in electricity production in a moderate climate zone.
The amount of energy converted by both systems was used to determine the potential reduction in pollutants released into the ambient air from the alternative combustion of fossil fuels. Despite such a high difference in energy savings the impacts on the environment were entirely different. The use of PV panels instead of thermal solar collectors allowed a reduction in emissions by an additional 190%, 200%, 204%, 154% and 186% in the case of SO
2, NO
x, PM10, CO and CO
2, respectively. This was due to a much higher emission factor of the pollutants for electricity generation determined by the main energy producer in Poland [
19] on the basis of annually updated measurements.
In conclusion, it should be stated that the use of thermal solar collectors is more profitable from an energy consumption point of view than PV panels. On the other hand, photovoltaic systems allow for an almost three times higher reduction in pollutants emitted to the atmosphere.
Additionally, the optimal angle of inclination of solar radiation conversion devices located near Poznan was determined. This slope angle for the plane oriented south should be in the range of 30 to 40 degrees.


