Article

Evaluation of Multiyear Weather Data Effects on Hygrothermal Building Energy Simulations Using WUFI Plus

Polytechnic Department of Engineering and Architecture, University of Udine, Via delle Scienze 206, 33100 Udine, Italy
*
Author to whom correspondence should be addressed.
Energies 2021, 14(21), 7157; https://doi.org/10.3390/en14217157
Submission received: 1 October 2021 / Revised: 21 October 2021 / Accepted: 25 October 2021 / Published: 1 November 2021
(This article belongs to the Special Issue Challenges and Research Trends of Building Energy Performance)

Abstract

:
Transient building energy simulations are powerful design tools that are used for the estimation of HVAC demands and internal hygrothermal conditions of buildings. These calculations are commonly performed using a (often dated) typical meteorological year, generated from past weather measurements excluding extreme weather conditions. In this paper the results of multiyear building simulations performed considering coupled Heat and Moisture Transfer (HMT) in building materials are presented. A simple building is simulated in the city of Udine (Italy) using a weather record of 25 years. Performing a multiyear simulation allows to obtain a distribution of results instead of a single number for each variable. The small therm climate change is shown to influence thermal demands and internal conditions with multiyear effects. From this results it is possible to conclude that weather records used as weather files have to be periodically updated and that moisture transfer is relevant in energy and comfort calculations. Moreover, the simulations are performed using the software WUFI Plus and it is shown that using a thermal model for the building envelope could be a non negligible simplification for the comfort related calculations.

1. Introduction

Climate change is having different effects on buildings, on one hand, requiring adaptation measures to avoid their deterioration [1], on the other hand, rapidly changing weather conditions are affecting the energy demands of buildings [2], meaning that increasing the energy efficiency of buildings is one of the strategies of mitigation of the greenhouse gasses emissions. This could be achieved with performing building envelopes or with more efficient HVAC systems, furthermore the occupants’ comfort should be ensured and health and safety requirements should be reached. In changing climate it is clear that the design procedures based simulations that use weather files as inputs for the boundary condition calculations could be improved considering more weather files, including extreme weather, future weather predictions for different scenarios and multiyear weather records. In the literature there are many examples of studies evaluating different weather files selection and generation procedures. The most common approach used by practitioners is to use representative weather files, that, in some cases, could be outdated. Lupato an Manzan showed in [3] the relevance of updating weather files database for 52 Italian locations. The general results showed that, when calculating the energy savings of a retrofitting, the outdated weather dataset presented an underestimation of cooling savings and an over estimation of heating savings. One approach including future weather file is presented by Crawley, in [4], which presents a methodology to generate future weather files based on future climate scenarios and to evaluate the effect of heat islands. Typical and extreme weather files are generated and used to perform whole building simulations to calculate the impact on energy use. This research found an overall increase in energy consumption, a reduction in the heating demand and an increase in the cooling demand. Low energy buildings are found to be the least affected. In the paper [5] Gaur et al. present future weather data for 11 Canadian cities based on the future scenarios with 2 and 3.5 °C, showing that the projections suggest higher temperatures and precipitations, with a reduction of the snow-cover and wind-speed for all cities. Nik and Arfvidsson presented in [6] a study on the generation of future extreme weather files, single years that are used to evaluate the impact of climate change on buildings. More recent research evaluated the effects of future climate on buildings with building energy simulations and risk assessments. The paper [1] presents an evaluation of the impact of climate change on energy retrofit of alpine historic buildings, obtaining retrofit guidelines for different building typologies. Tootkaboni et al. in [7] present the evaluation of three tools for the generation of future weather files, based on downscaling techniques on building energy simulations, while Lu et al. in [8] used future weather data of extreme and representative future years to perform moisture related risk assessments. Similarly, the use of extreme weather conditions to design reliable buildings has been investigated and different extreme weather file generation procedures have been presented. the paper [9] examines the near-extreme weather files used for the evaluation of sun-driven vapour diffusion, proposing an alternative distribution of climate files to be used for the risk assessment procedure. The authors of [10] presented the generation of two extreme weather file generation procedures based on the Finkelstein-Schafer statistic to be used for the building energy simulations, similarly in [11], a similar procedure is used to generate extreme weather files for moisture related risk assessments.
The present work follows the multiyear weather record analysis presented in [12]. The authors performed simplified moisture accumulation and mould growth risk assessment of a historical wall using the multiyear weather record recorded in Udine (Italy) in order to evaluate the validity of single year results. The research concluded that multiyear simulations could be used to search for multiyear effects caused by the incomplete drying of a wall at the end of the year, but that a single year simulation, performed with a small selection of reference years (not only one) could provide a reliable risk assessment. Pernigotto et al., in their work [13], evaluated the representativeness of the TRY representative years generated using the EN ISO 15927-4:2005 procedure for 5 Italian locations. The comparison is performed on 48 single zone simplified buildings, in terms of weather parameters, building energy performance and building performance rating, with the multiyear weather records being of 8 to 10 years. The authors observed that the representativeness and the variability of the evaluated parameters varies significantly with the location and that if a TRY is not representative of the multiyear, then misleading results could be obtained from the simulations. Cui et al. discussed the use of a multiyear weather record for the energy simulation o buildings in [14], showing that a single TRY (representative) weather file leads to an overestimation or a underestimation of the energy demands and peak demand. Cui et al. considered 10 locations, with 55-years long from different locations. Shorter weather records were considered by Libralato et al. in [15,16]. Here the authors used the weather files for heat and moisture transfer simulations of walls, showing that TRY generated from shorter weather records (up to 5 years) lead to results representative of the multiyear results, allowing to consider short-term climate change.
The objective of this research is to evaluate the multiyear effects connected to the coupled heat and moisture transfer in building envelopes when applied to whole building energy simulations. All the multiyear analysis found in literature consider dynamic envelope models that neglect moisture migration. With this simplification it is not possible to evaluate the multiyear effect of the presence of moisture in building structures, such as the drying process of the build-in moisture. In this paper the multiyear weather record of Udine (Italy) is used to perform building energy simulation of buildings with different features, evaluating the multiyear effects on heating, cooling, dehumidification and humidification requests and on comfort.

2. Materials and Methods
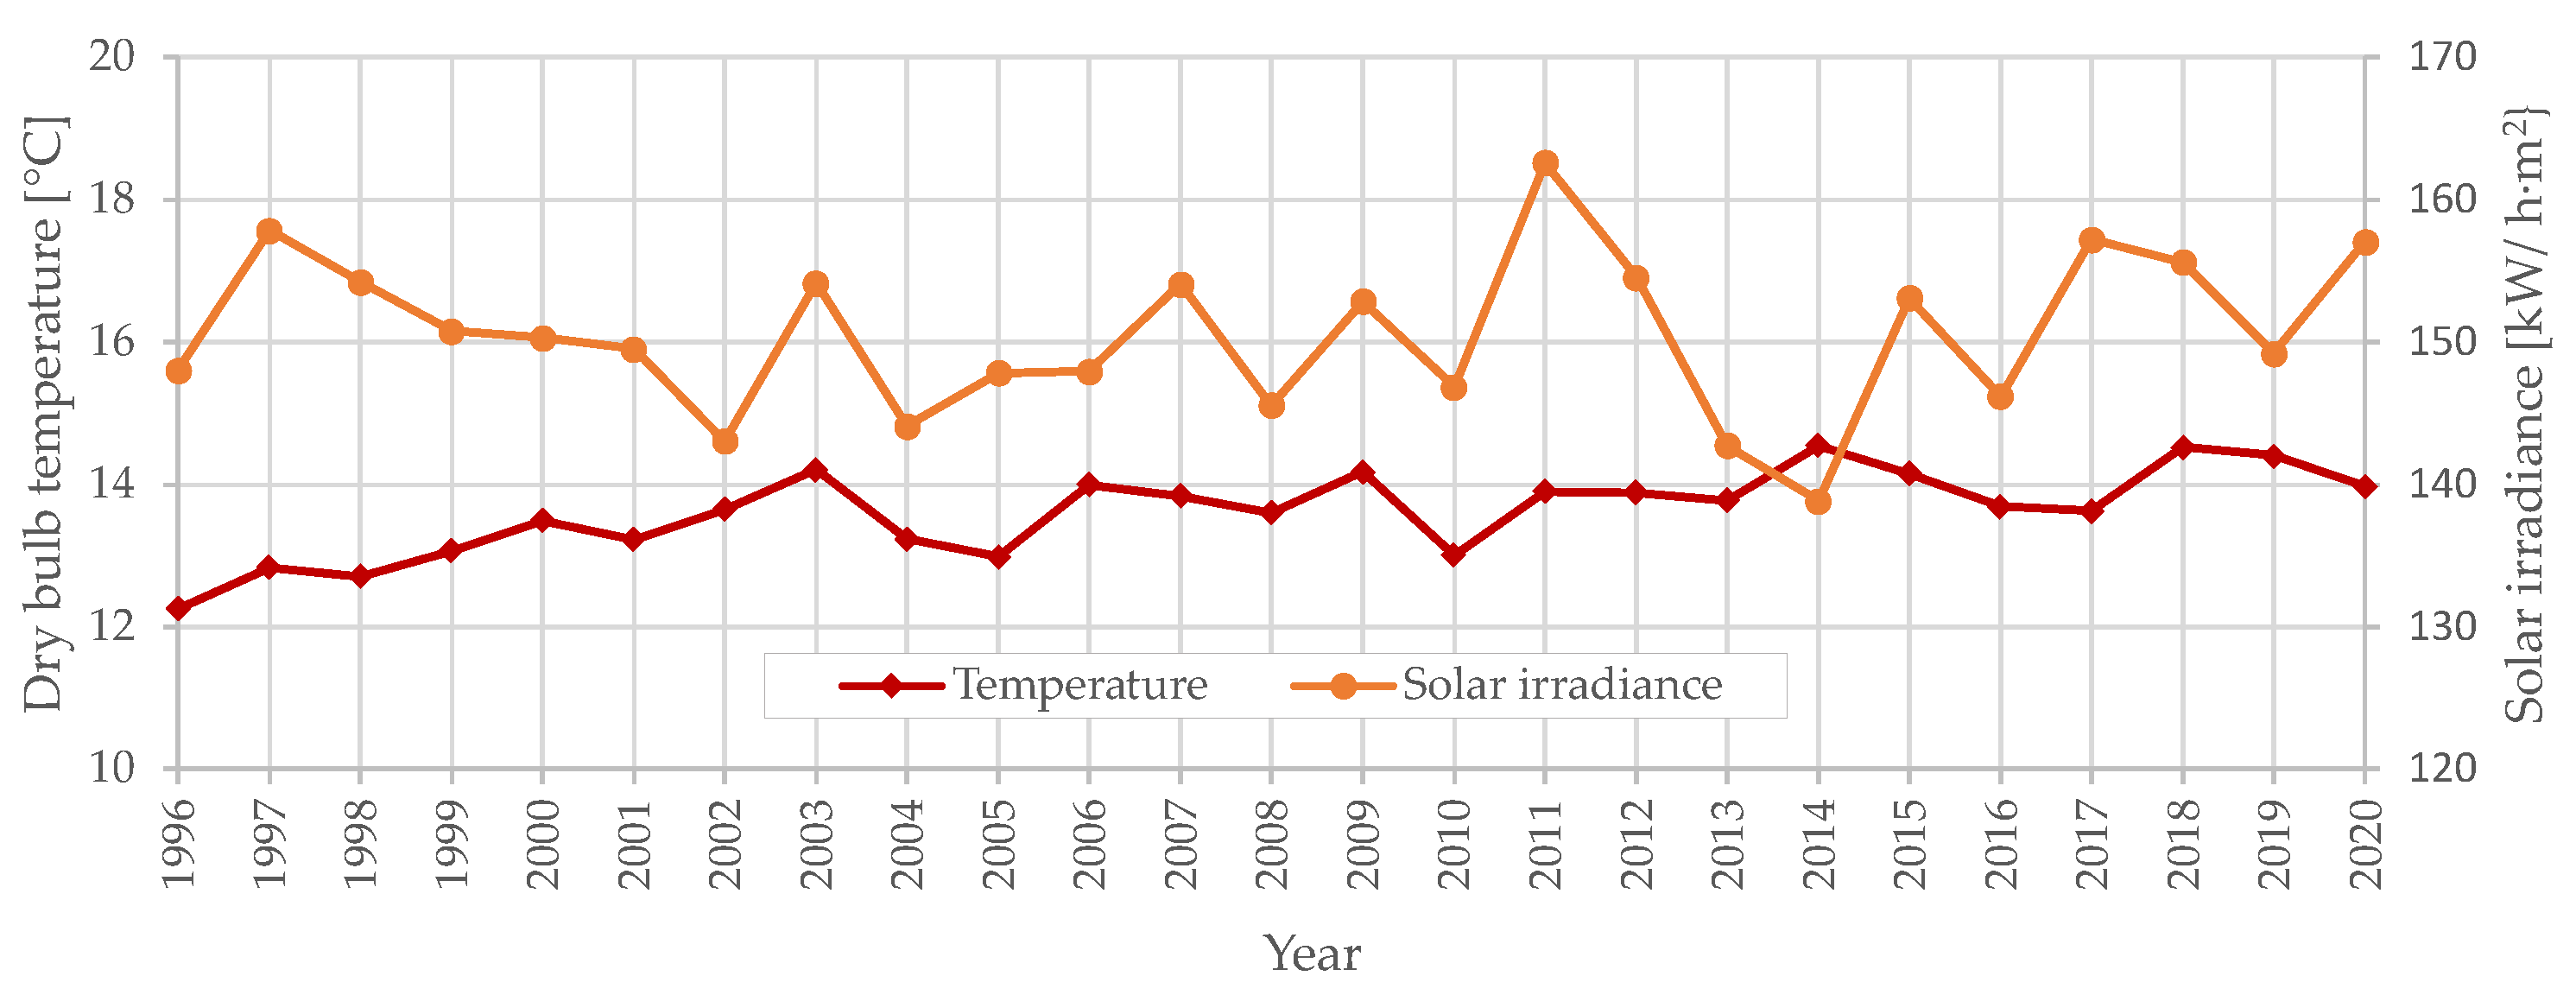
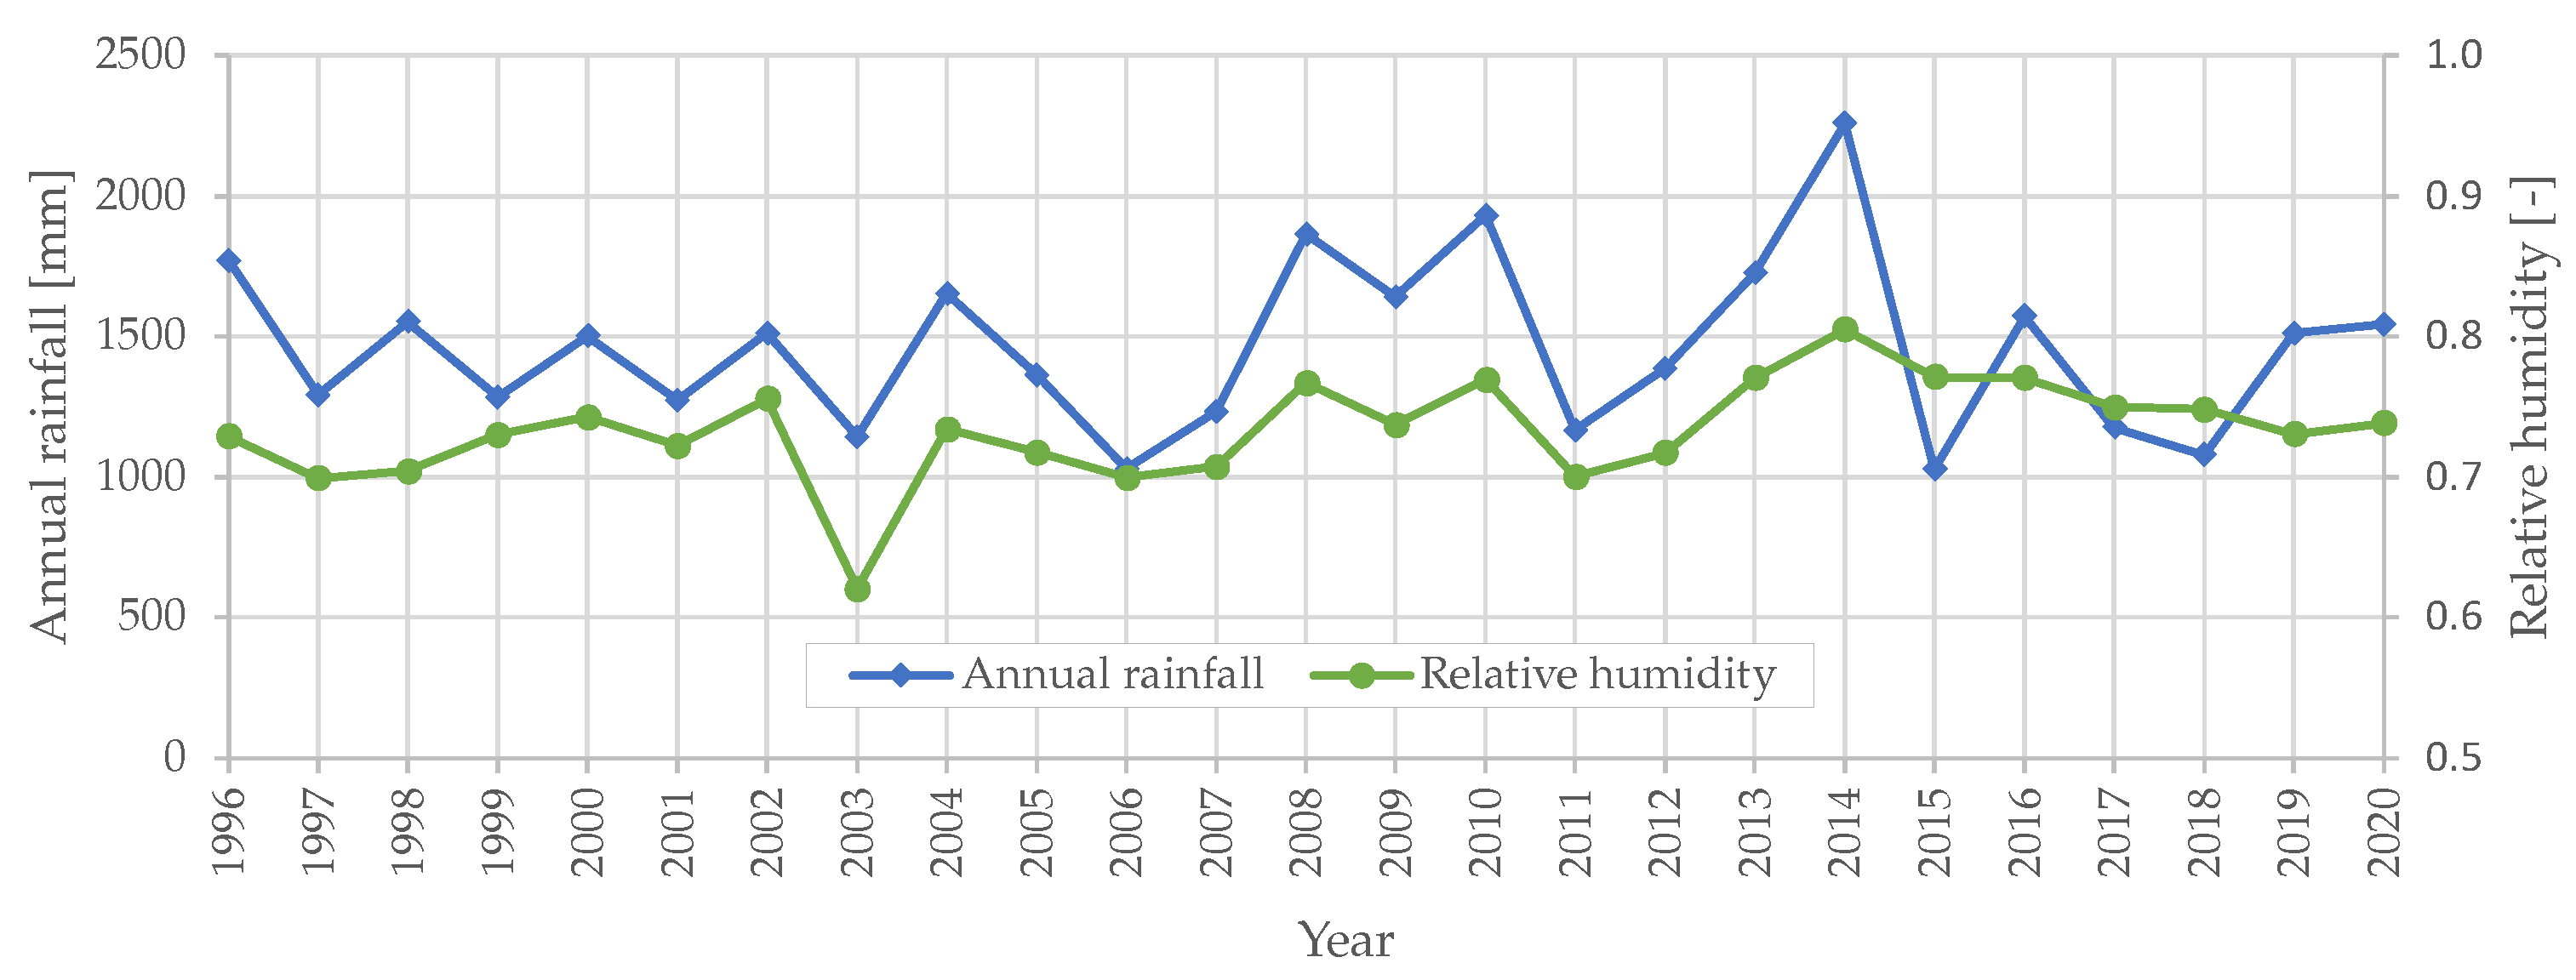
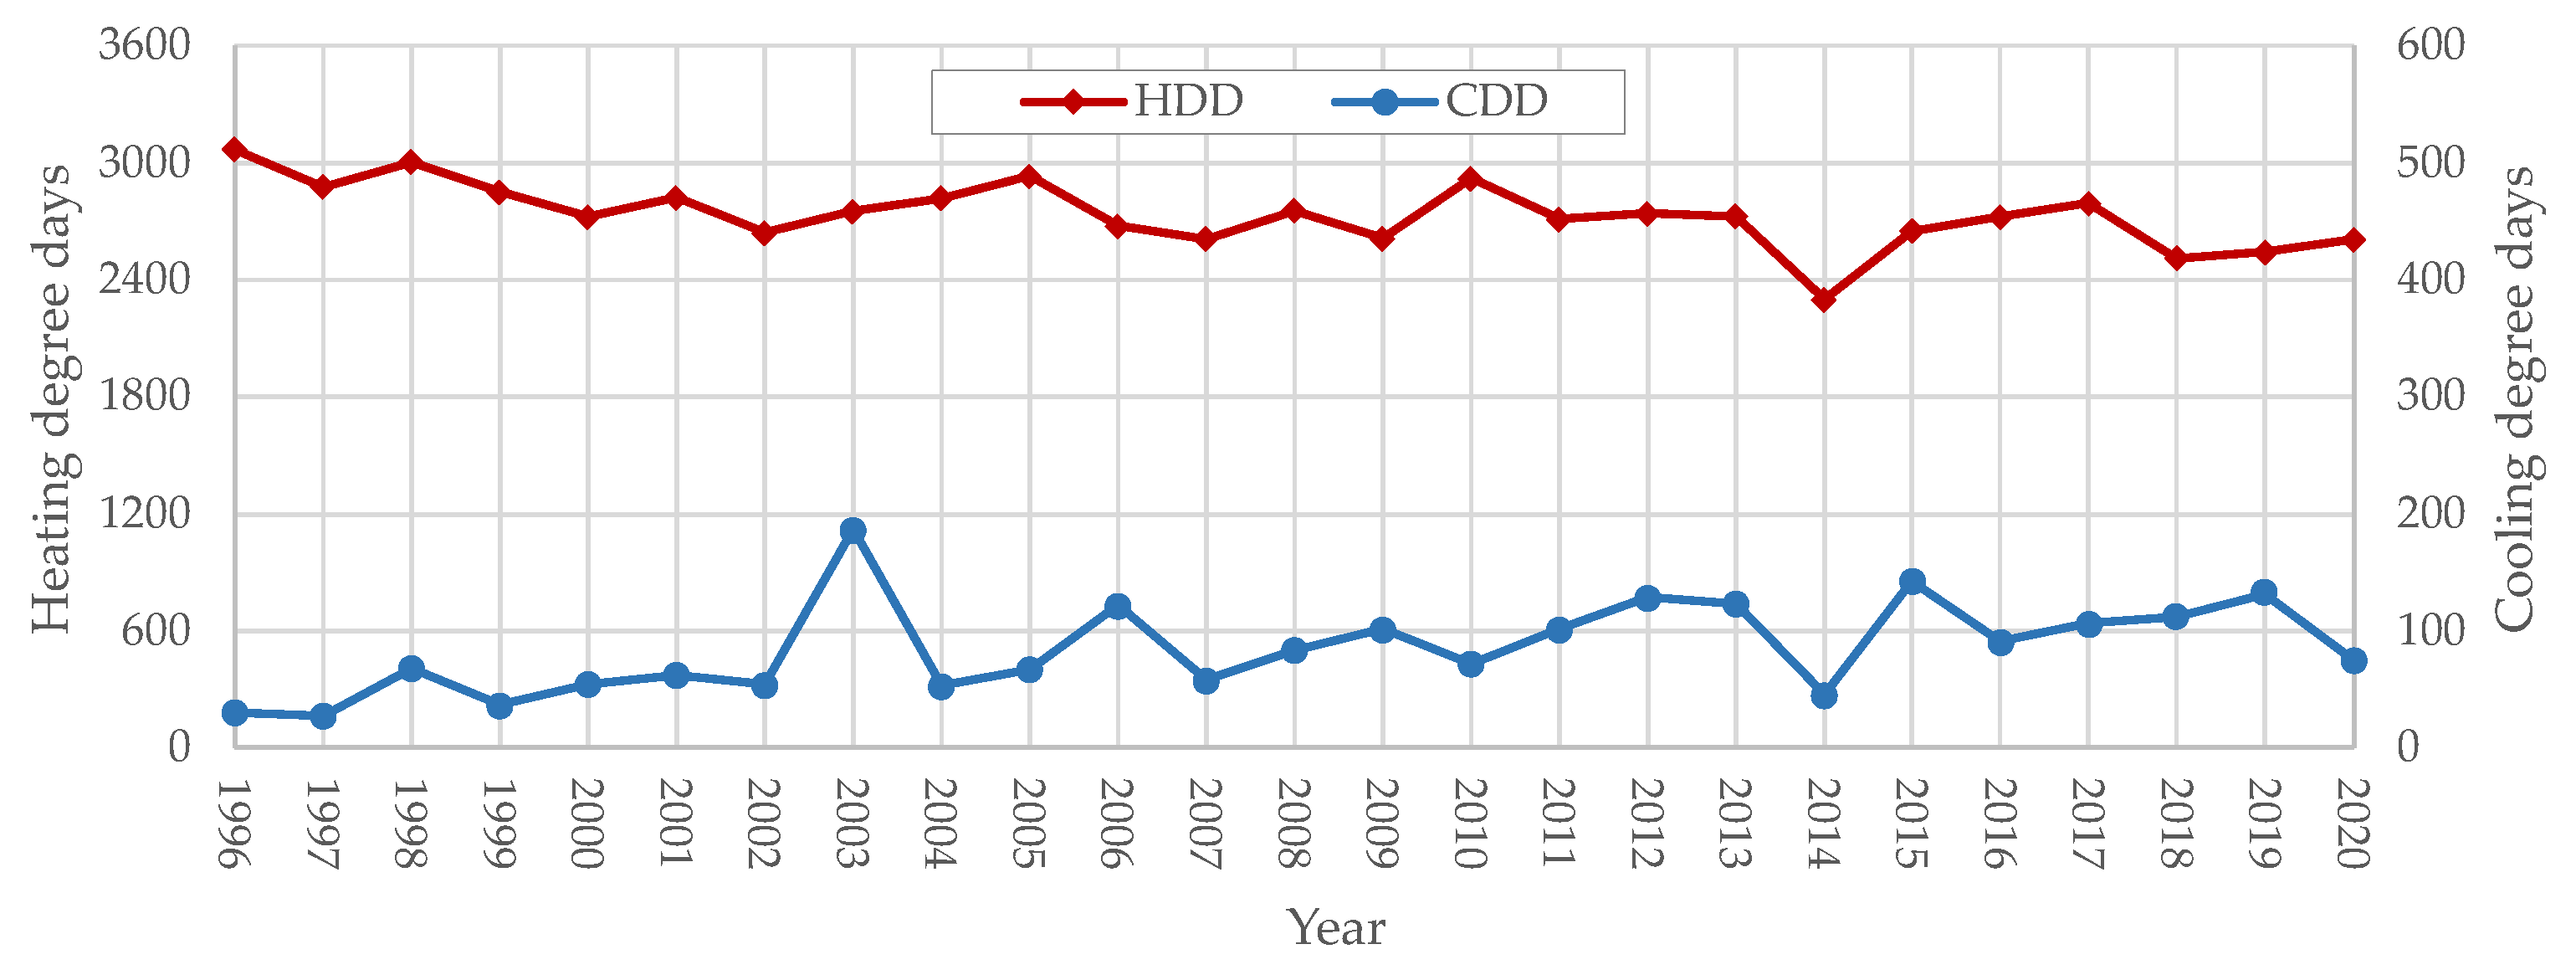
The software WUFI Plus version 3.2.0.1 is used for the whole building simulations, allowing to consider the coupled heat and moisture transfer in building envelopes. WUFI Plus, developed by Fraunhofer Institute for Building Physics, is based on the HMT model defined by Künzel in [17]. The whole building model has been validated several times [18,19], compared with other software tools [20,21] and accepted as a valid comparison tool to evaluate new materials [22] or simplified calculation methods [23]. The coupling of the wall HMT model and the building model allows to evaluate the effects of liquid water (driving rain or from other sources) and vapour concentration (from internal loads) on the energy balance of the whole building. The calculation scheme used to compute heat and moisture transfer in walls is the finite volume technique [17] and it requires more time with respect to the commonly used thermal models. Each wall is modelled as a 1-D wall exposed to internal or external boundary conditions and these models are coupled with the whole building model. For example, using WUFI Plus, the thermal simulation of a single room for 2 years on a computer equipped with a 3.10 GHz processor and 128 GB of RAM takes 16 s, while using the hygrothermal model it takes 4 min. The difference in computational effort between the two models also depends on the discretisation of the simulated walls. WUFI Plus allows to select indirectly the dimension of the calculation volumes. In this paper the calculation grid is set to “medium” and it generates a grid for the brick wall of 63 volumes, while the calculation accuracy is set to “low”. For the studied cases, using a more coarse grid or higher calculation accuracies did not produce relevant differences in the results.

2.1. Weather Record

The weather files measured in Udine from the 1996 to 2020 are considered. The measurements include dry bulb temperature, relative humidity, solar irradiation, wind speed and direction, rainfall intensity. The Weather Record is measured at the weather station of Udine Sant’Osvaldo (Italy), is kindly supplied by ARPA FVG (OSMER). The location of the weather station is Latitude 46.03°, Longitude 13.23°, Altitude above sea level 91 m. According the Köppen classification, Udine has a temperate climate and, depending on the considered year, it could be classified as Cfa “Humid subtropical climate” (for example in 1996) or Cfb “Temperate oceanic climate” (for example in 2020).
Temperatures and solar irradiation are the variables that mainly influence heating and cooling loads in buildings. The annual averages are presented in Figure 1. Relative humidity and rainfall intensity, on the other hand, influence moisture migration. Their annual averages are presented in Figure 2.
From the point of view of the building energy calculations it is convenient to consider the Heating Degree Days (HDD) or the Cooling Degree Days (CDD) presented in Figure 3. HDD and CDD are calculated using respectively the Equations (1) and (2) on the whole year period, considering hourly data. Commonly the high values of HDD are indicators of high heating loads, while high CDD values indicate high cooling loads.
H D D = h = 1 n Δ T H , h 24 Δ T H , h = T h T b if T h T b > 0 0 else
C D D = h = 1 n Δ T C , h 24 Δ T C , h = T b T h if T b T h > 0 0 else
where:
  • n is the total number of hours in the considered year,
  • T h is the air dry-bulb temperature at hour h,
  • T b is the base temperature, set to 20 °C for the heating period and to 26 °C for
  • the cooling period,
  • Δ T H , h is the positive temperature difference for the HDD calculation,
  • Δ T C , h is the positive temperature difference for the CDD calculation.
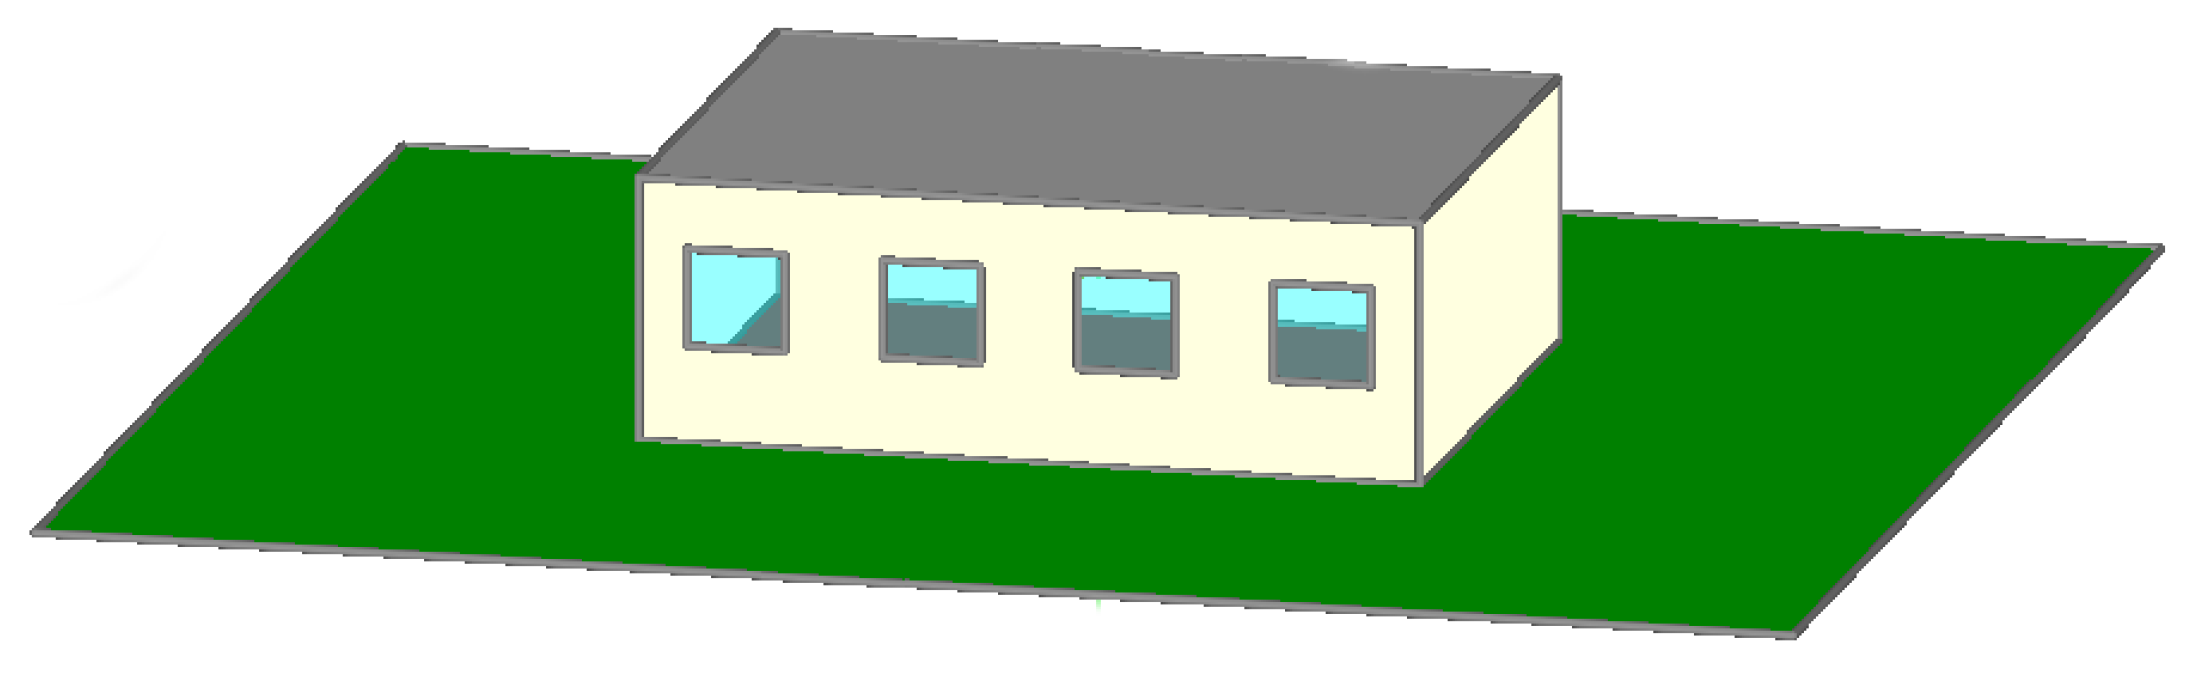
2.2. Study Cases

In order to quantify the effects of multiyear simulations, a simple building geometry is considered (Figure 4). The floor of the building is 48 m 2 (6 m × 8 m × 2.7 m) and the south facing wall has four 1 m × 1 m windows. The building envelope is composed by vertical walls (Table 1), roof (Table 2) and floor (Table 3). The vertical walls are brick walls with internal plaster without insulation (R = 3.06 m 2 K/W), while the windows have double pane glazing and wooden frames U w = 2.87 W/m2K. The roof is made of concrete and covered with plaster on the internal side (R = 0.56 m2K/W) and with a roof membrane on the outside, applied on a layer of wood separated from the concrete by an air gap of 5 cm. The floor is in concrete and covered by a layer of 2 cm of wood, with an air gap of 1 cm between them (R = 0.55 m2K/W). The material properties are taken from the WUFI Plus Material database. Thermal bridges are neglected.
The infiltration is set to 0.3 ACH during all the day, the internal loads are convective and radiant heat loads, both set to 2 W/m2 during all the day, while the moisture loads are set to 200 g/h from 9:00 to 17:00. To compute the heating and cooling demands and the humidification and dehumidification demands, the room is modelled with an ideal HVAC system with heating, cooling, humidification and dehumidification. These ideal systems are set to maintain the temperatures between 20 °C and 26 °C and the relative humidity between 40% and 60%. Two simulation settings of the software WUFI Plus are used, the thermal and the hygrothermal simulation; the first considers only the heat transfer through the walls, while the latter considers the coupled heat and moisture transport, allowing the modelling of moisture buffering effect of the building materials and the effect of driving rain; the wall HMT model is coupled with the room model. The hygrothermal approach, being subject to the liquid and vapour water transport, have slower responses to the environment. Initial conditions are then more relevant on the results than in the thermal only simulation.

3. Results

Different aspects of multiyear simulations have been evaluated in this research, first comparing the results of thermal simulations with hygrothermal simulations, then evaluating the long-term dynamic effects of weather on the building envelope that are not shown in single year simulations.

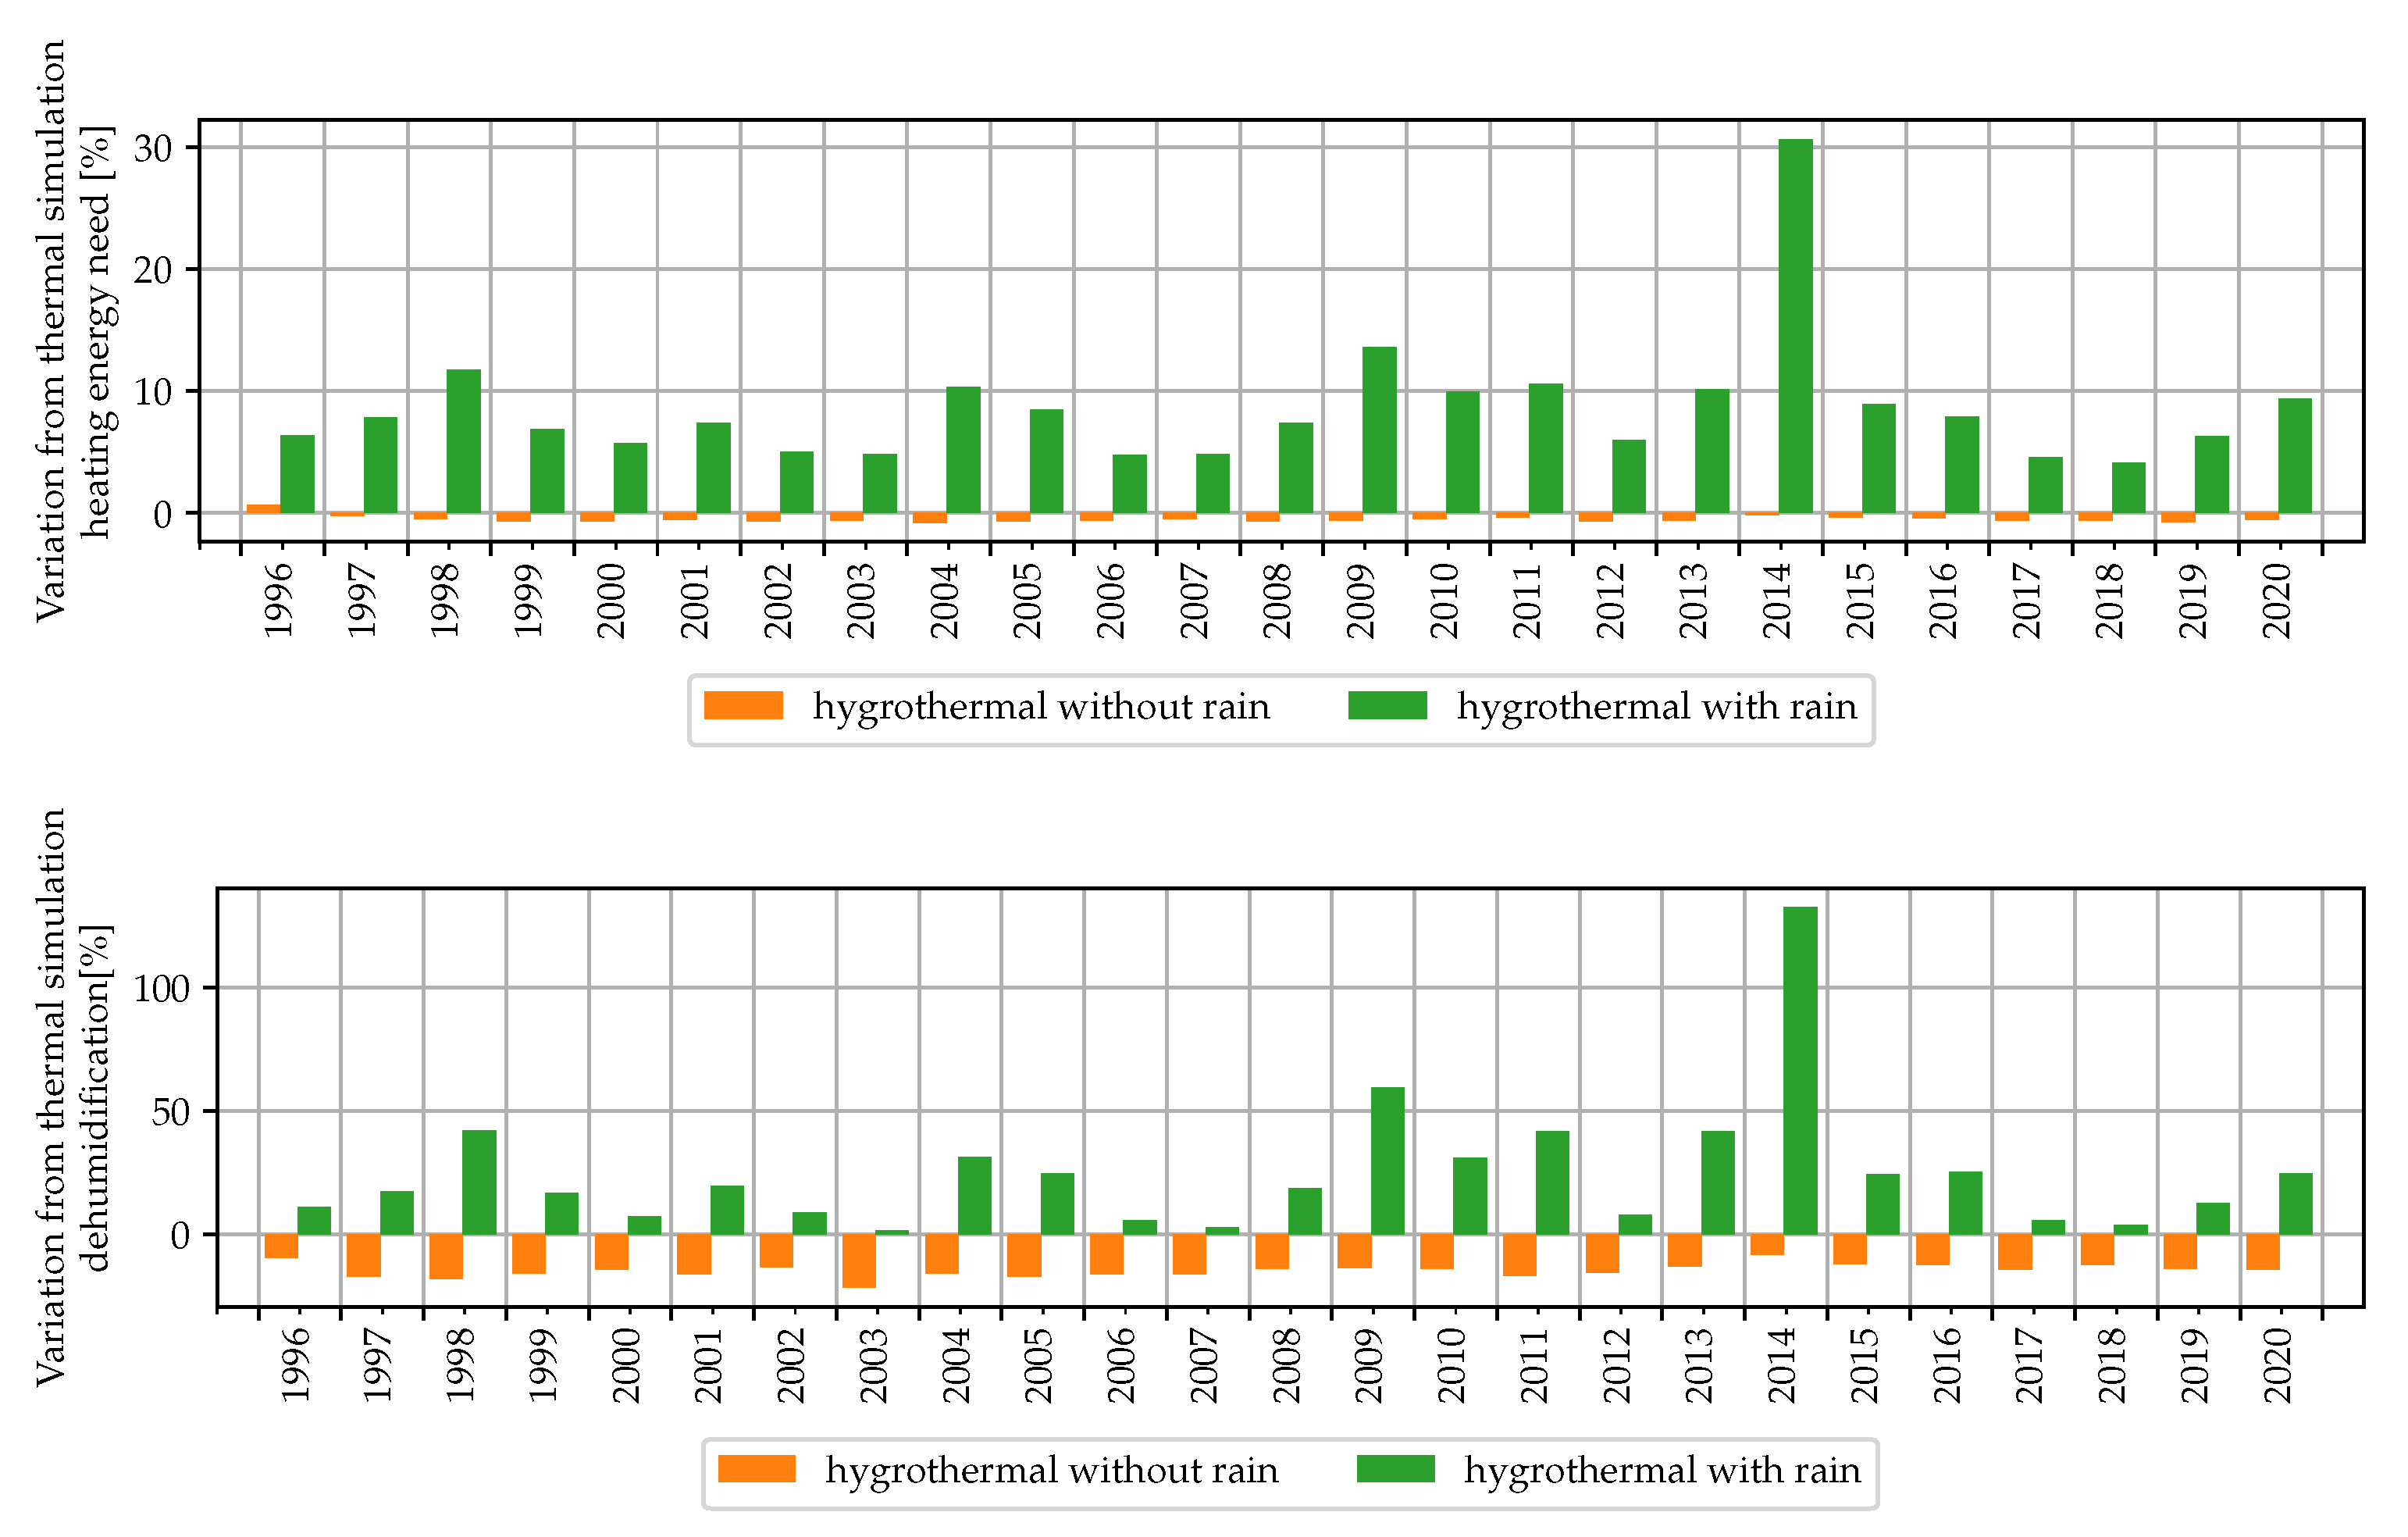
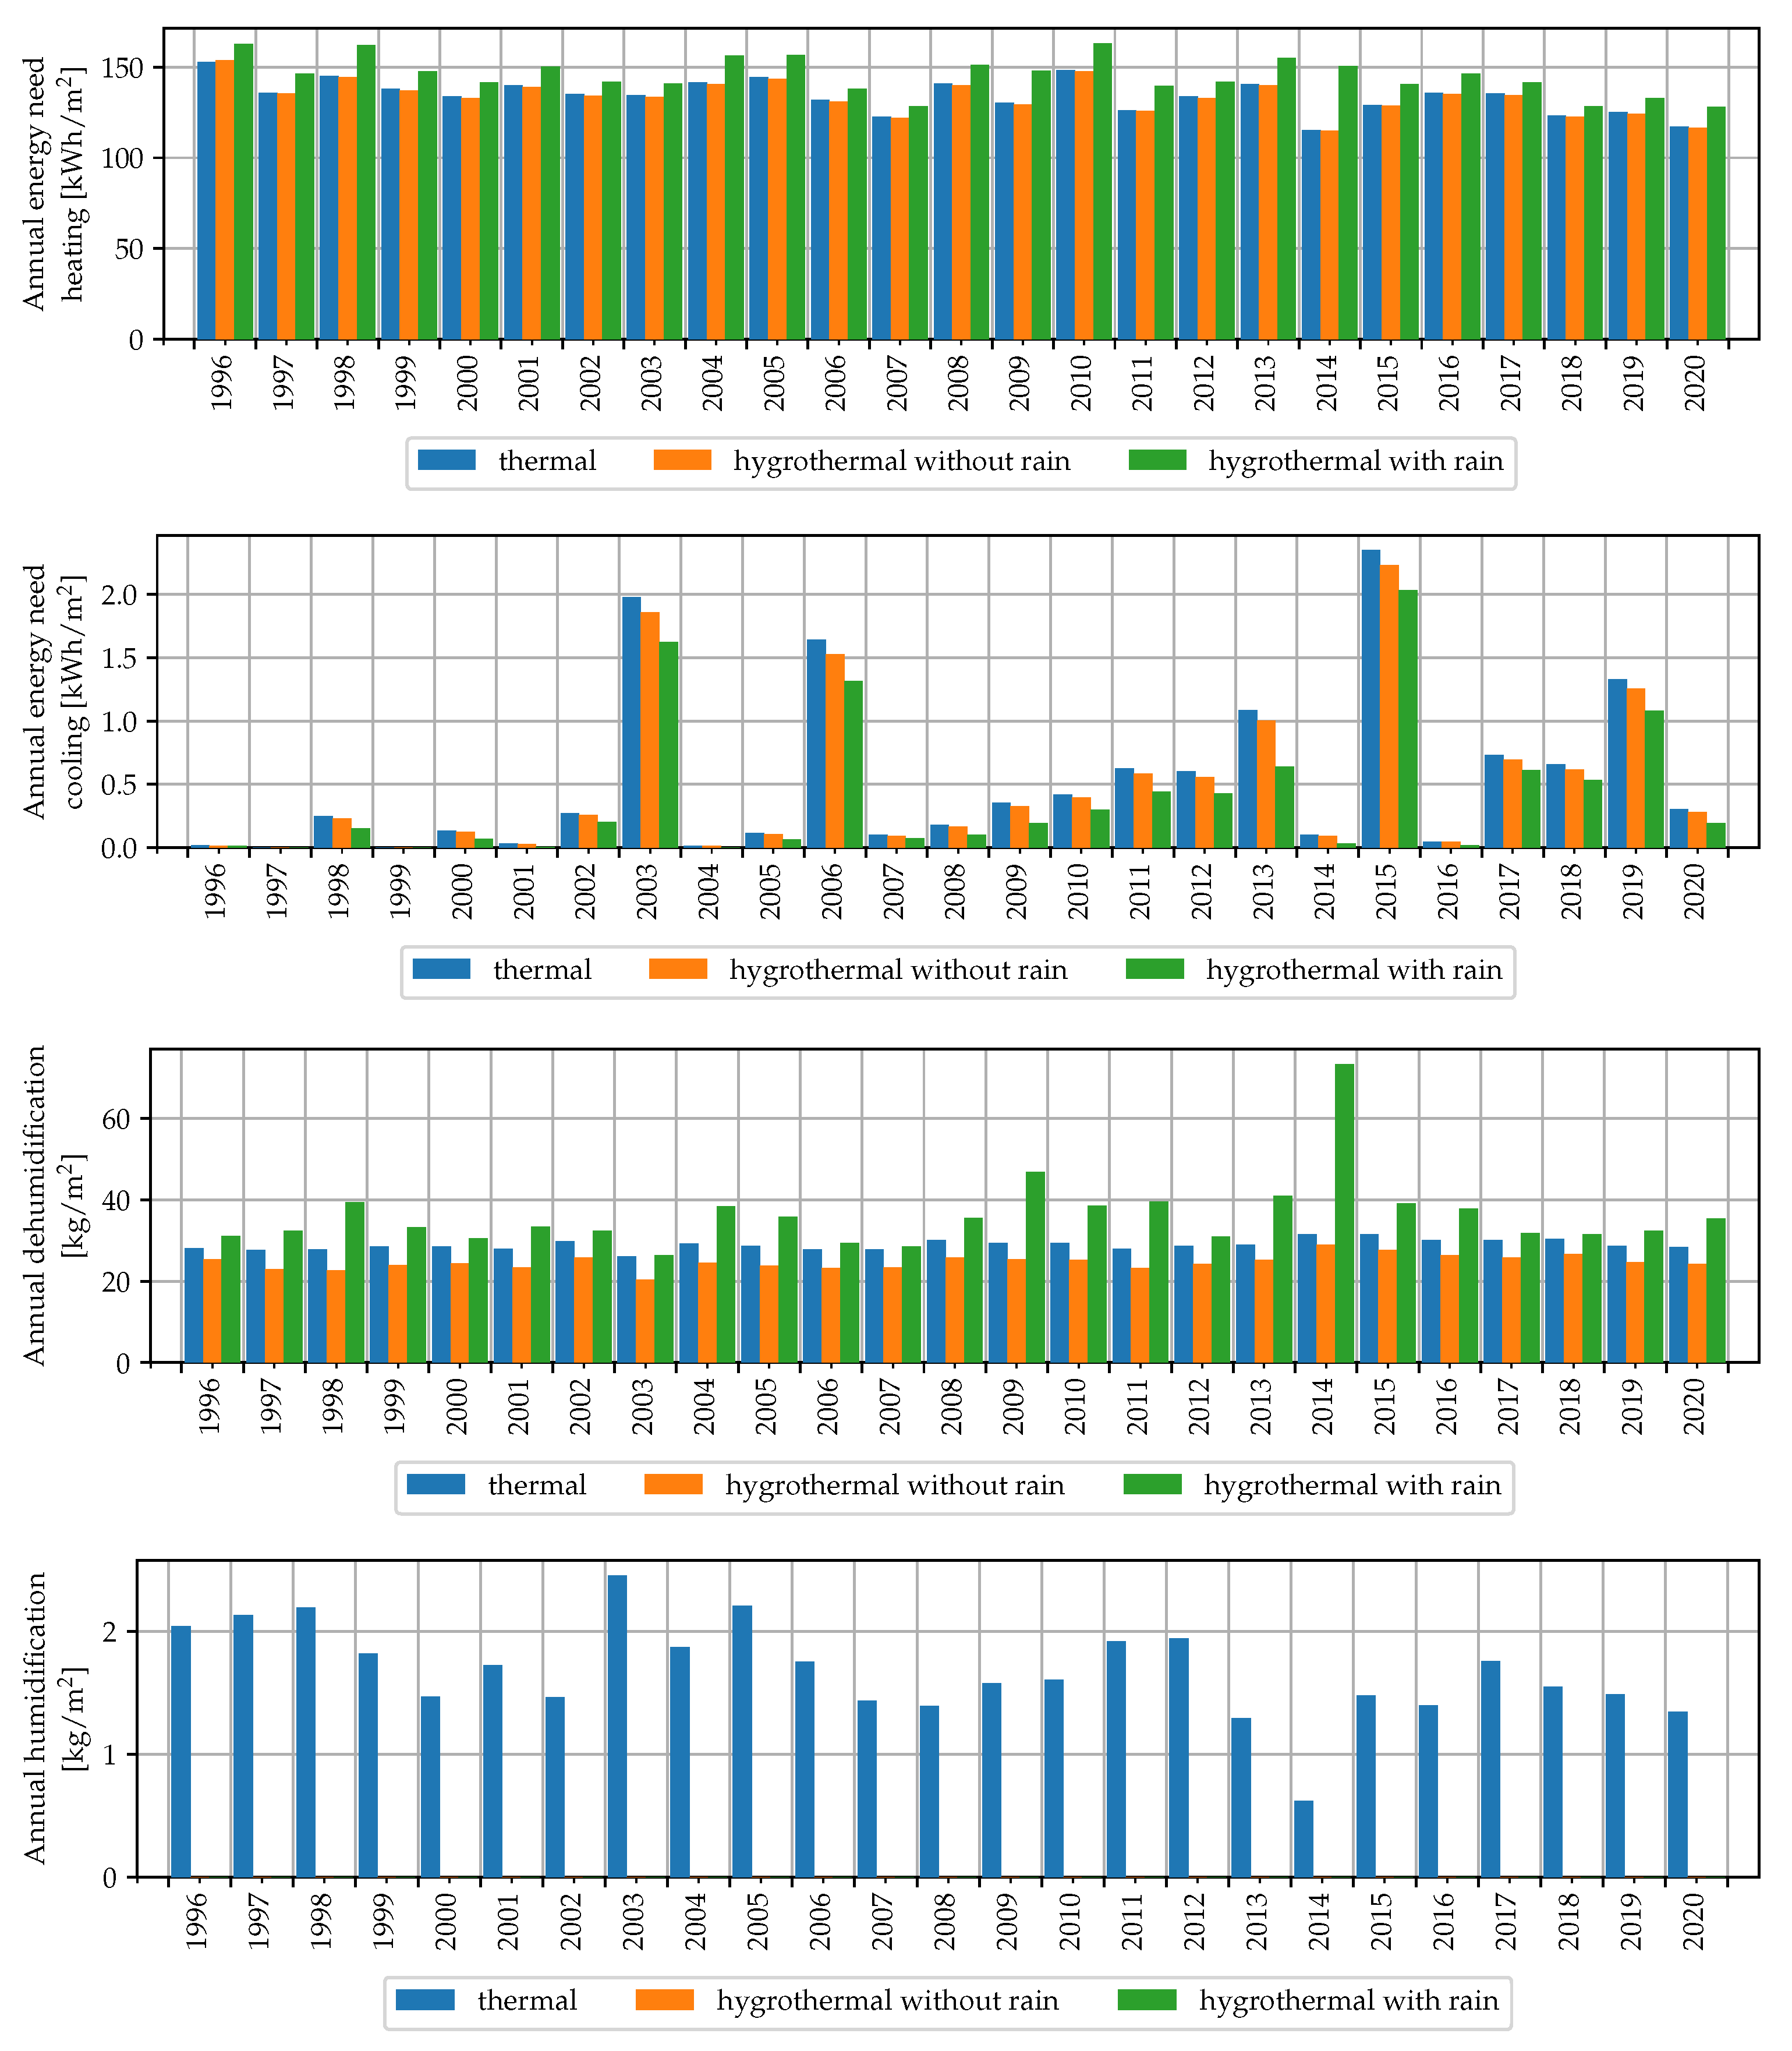
3.1. Moisture Transport

The multiyear simulations are performed using the thermal building and the hygrothermal building model. The initial conditions for the building materials are set to 20 °C and 80% RH. This setting for the thermal model implies that the material properties considered are the ones measured at 80% RH (higher thermal conductivities than dry state).
The choice of the model influences the internal conditions results and the heating and cooling demands. The first comparison, presented in Figure 5, shows the difference between the calculated heating energy, cooling energy, humidification and dehumidification demands. As expected from the climate of Udine, the cooling demands and the humidification demands are low with respect to the heating and the dehumidification demands.
Heating and cooling demands show clearly the effects of a short therm climate change. Considering the heating demands calculated with the thermal simulation, the years before 2000 have values above 150 kWh/m2 (mean 141 kWh/m2 ) and the cooling demand values are below 0.5 kWh/m2 until 2003. From the year 2014 the heating demands are below 135 kWh/m2, with a mean of 127 kWh/m2. The average value of the heating demand for the 25-year period is 134 kWh/m2, the minimum is 115 kWh/m2 and the maximum 152 kWh/m2. The maximum cooling demand is 2.3 kWh/m2, while the mean annual cooling demand is 0.5 kWh/m 2 .
As expected, heating demands calculated with the hygrothermal model considering rain (25-year-mean 145 kWh/m 2 ) are all larger than the ones calculated with the thermal (25-year-mean 134 kWh/m 2 ) and hygrothermal without rain model (25-year-mean 133 kWh/m 2 ) of the same year. This difference is higher during the year 2014, wich corresponds to the year with higher annual rainfall (Figure 2). Similarly, requests for cooling are larger when calculated by the thermal model and lower when the hygrothermal model is used, in this case, given the low cooling demands the differences between the mean values are negligible.
The dehumidification plot of Figure 5 shows that the hygrothermal model without rain calculates lower demands than the thermal model, due to the simulation of the moisture buffering effect of the plasters, while the hygrothermal model with rain requests larger demands than the other two models, due to the moisture loads given by the driving rain, again, with the largest difference on the 2014. The moisture buffering effect is also seen in the humidification plot, where the humidification demand calculated in the thermal model is fully satisfied by the moisture accumulated and released by the walls.
As shown in Figure 6 the variation of the heating demands considering hygrothermal model with rain could be relevant, up to 30% in the year 2014, with an average of 8% while dehumidification demand has higher variations, up to 132% for the year 2014, with an average of 25%. The negative value of the hygrothermal model without rain is due to the moisture buffering effect, while the positive increase of the model with rain is due to the high rain load.

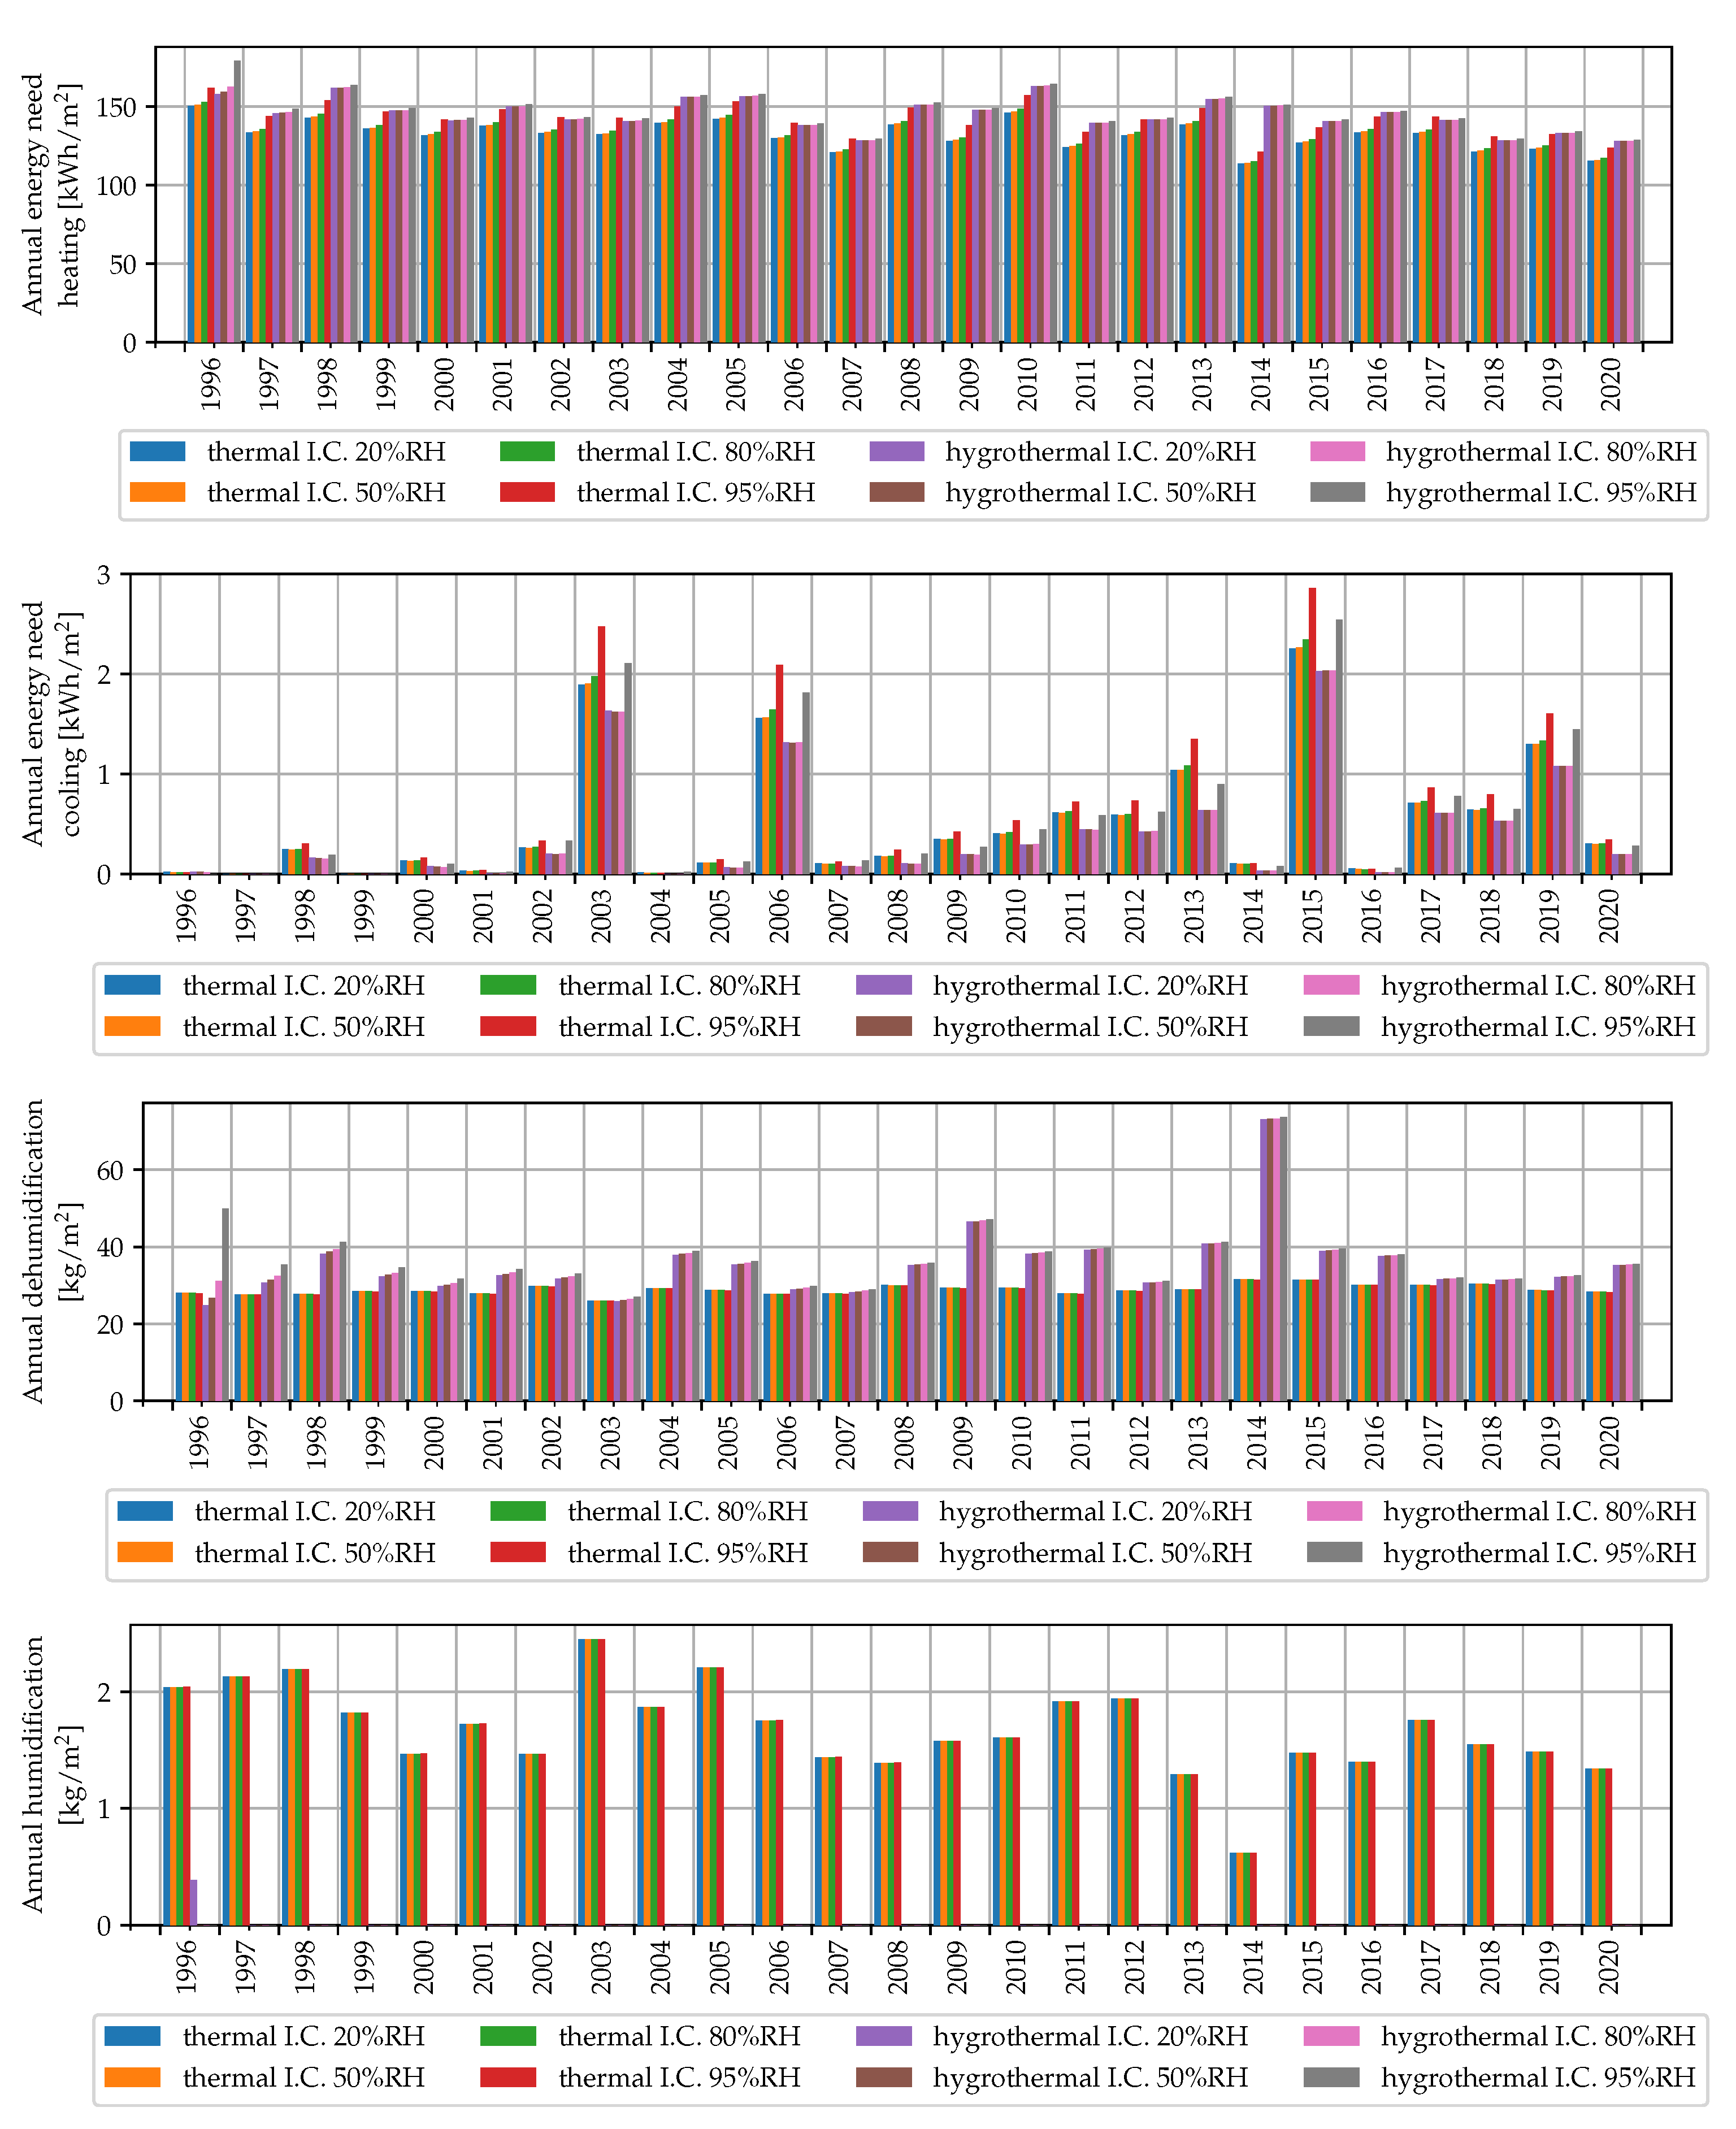
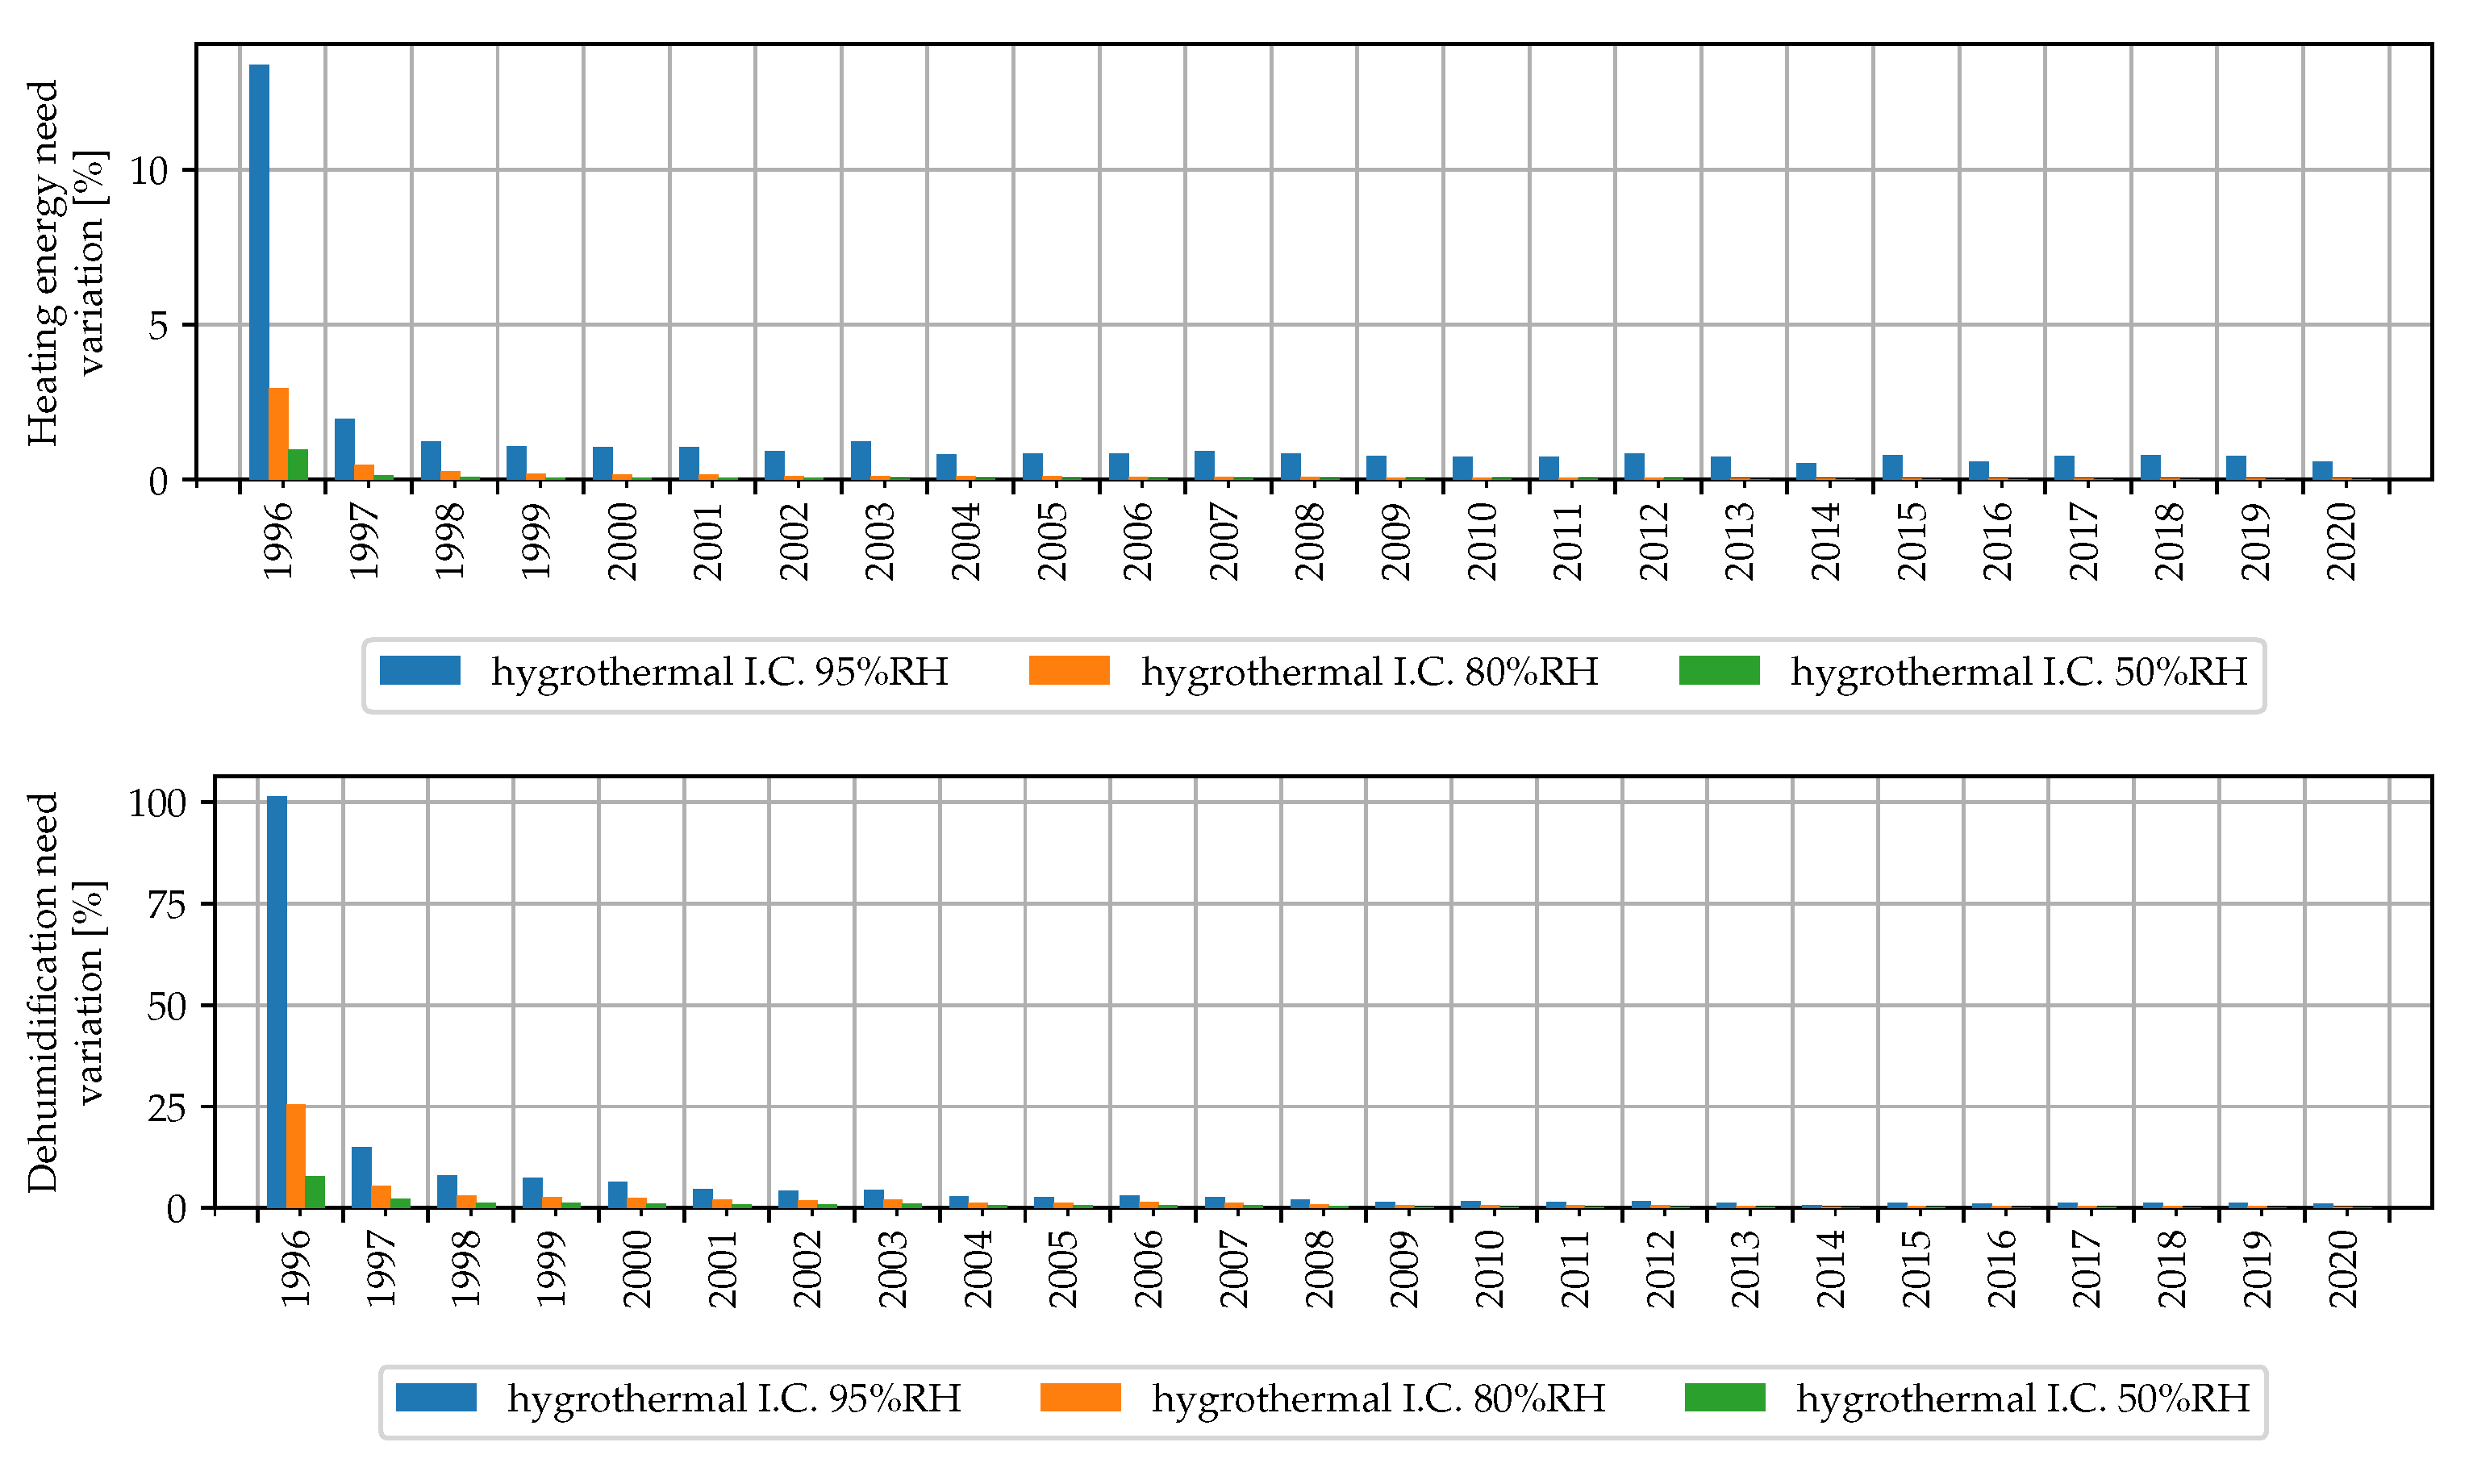
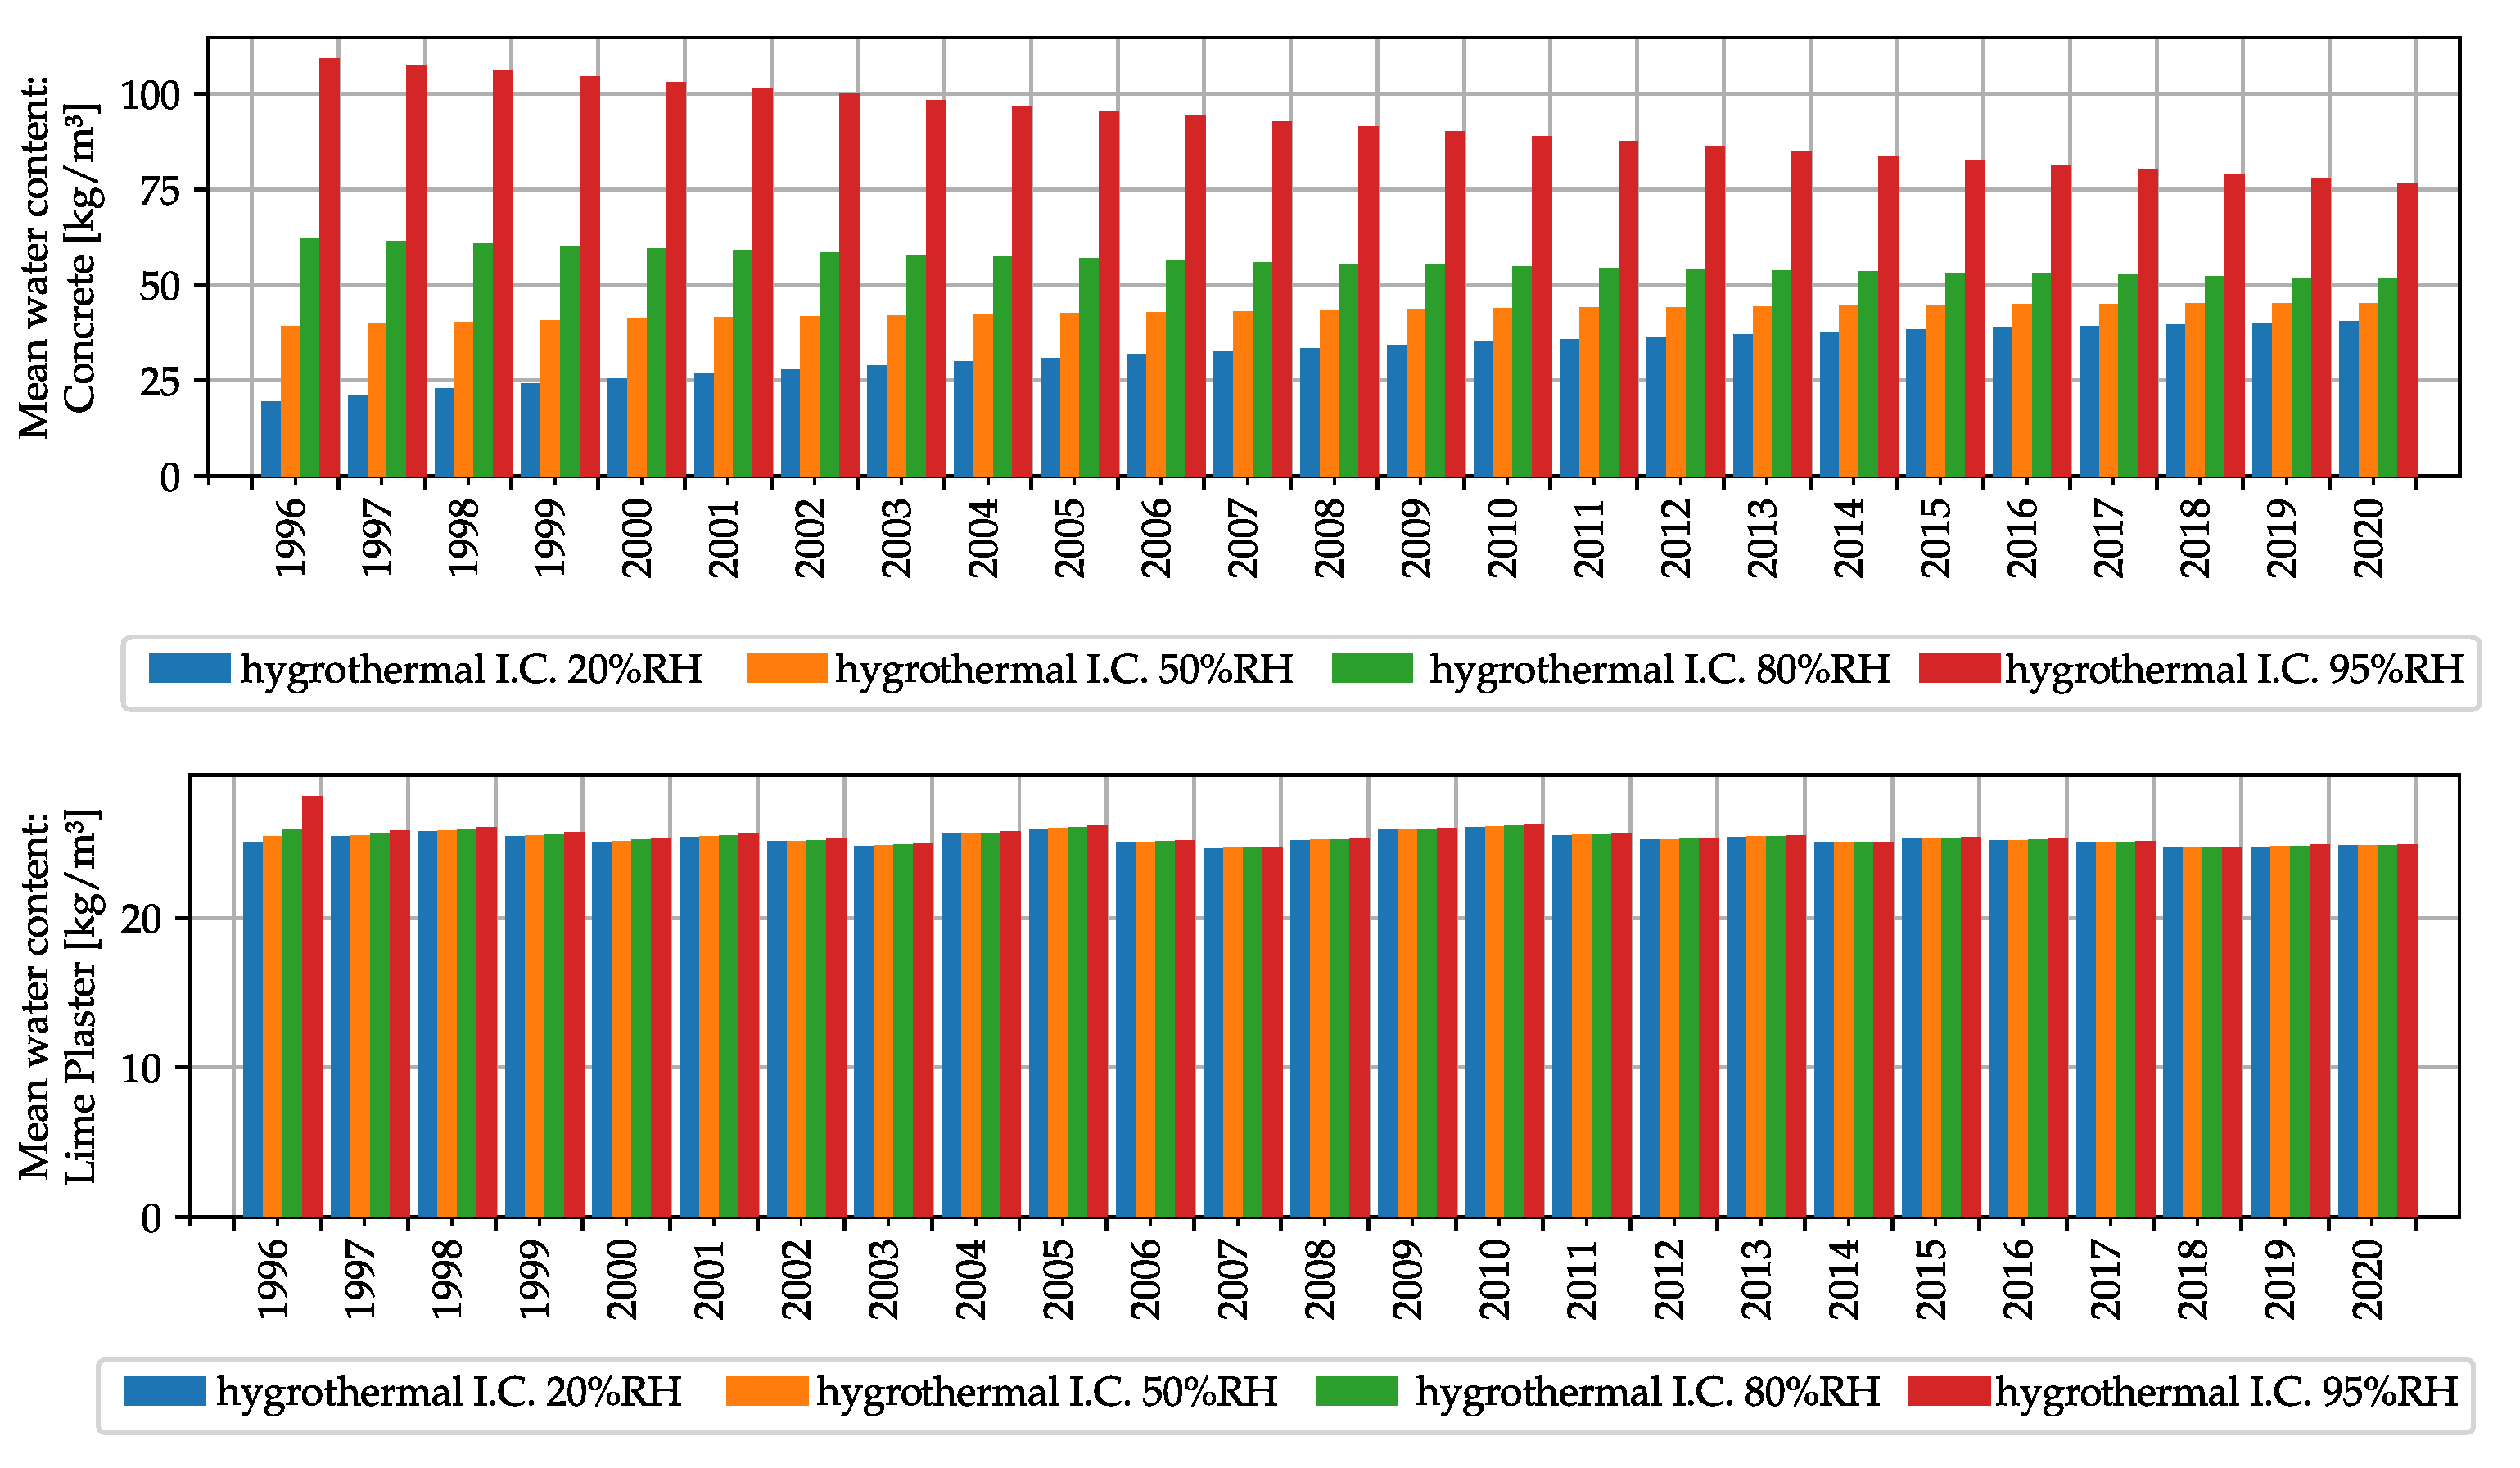
3.2. Initial Conditions

If different moisture contents are considered as initial conditions the demands are influenced. Figure 7 shows the results of eight simulations performed considering the hygrothermal model with rain and the thermal model for four initial conditions of the material of the walls (20% RH, 50% RH, 80% RH and 95% RH). The 20% RH is a low moisture content state that is rarely found and it represents a case close to the dry state at which the material properties are measured; the 50% is a low humidity state, that could be as a realistic condition; 80% RH is commonly used as initial condition in risk analysis as a conservative initial condition (high moisture content); 95% RH is used to represent a wet case, commonly found in new buildings or to buildings that have been left exposed to driving rain. Thermal simulations do not consider the moisture migration and the simulations are performed using the thermal properties of the materials at the relative humidity value set as initial conditions. As expected, Figure 7 shows that the thermal simulations have different values of heating and cooling demands every year, due to the different fixed properties. Contrary, the heat demands calculated with hygrothermal simulations with rain have relevant differences from each other only from 1996 to 1998, after this period the walls are in moisture equilibrium with the environment and have all similar behaviours. The cooling demands differences are more evident in the plot due to the scale, but they are of the same order of magnitude of the heating ones. The thermal simulation with the materials set at 50% RH has in average 0.6% higher heating demands than the one at 20% RH, while the ones set at 80% RH and 95% have higher heating demands of the 1.6% and 6% respectively.
To visualise the multiyear effects of the initial conditions, the percent variations of the demands from the hygrothermal 20% RH case are presented in Figure 8. Setting the initial conditions to 50% RH increases the heating need from the 20% RH simulation of the 0.9% on the first year, 0.15% on the second; at 80% RH the first year increase is of 3% and the second year 0.5%; When the initial RH is set to 95%, the first year heating need is 13% higher than the 20% RH case, 1.93% during the second year, above 1% until 2002 and for the rest of the years the percentage is above 0.5%. A similar behaviour is found calculating the dehumidification need, where the percentages are higher, due to the moisture released by the materials in the environment.
The mean moisture content variation of the layers of the ceiling is represented in Figure 9. In this figure it is possible to see how the moisture content of the concrete layer and of the plaster layer settles during the years. the plaster layer reaches the dynamic equilibrium content while the concrete does not reach equilibrium. The concrete layer is not exposed to the outdoors, while the plaster layer is facing indoors. The moisture transfer in the concrete layer is slow and it affects the thermal properties of the building for the whole multiyear explaining why the heating demand calculated with 95% RH as initial condition has a difference above the 0.5% for the whole multiyear.
Figure 10 shows the comparison between the previously presented multiyear hygrothermal simulation (Figure 5) and the single year simulation of every year in the record, thermal and hygrothermal. The single year simulations are performed using each year as weather file and with a year of initialization period, so that the year is repeated two times and only the second year is considered in the presented results; each year is obtained with a single simulation, while the multiyear simulations are calculated with a single simulation of 25 years without initialization periods. The larger differences are found for 2014, being the year with the highest rainfall; the difference is of about −20% for thermal single year simulation, while for the hygrothermal single year simulation the difference is above 10%. Single year hygrothermal simulations have absolute differences of 8% on average and the single year thermal simulations of 3.4%. The errors are smaller than the ones from the multiyear hygrothermal calculations of Figure 6, showing, for this specific case, that the moisture transport effect is more relevant.

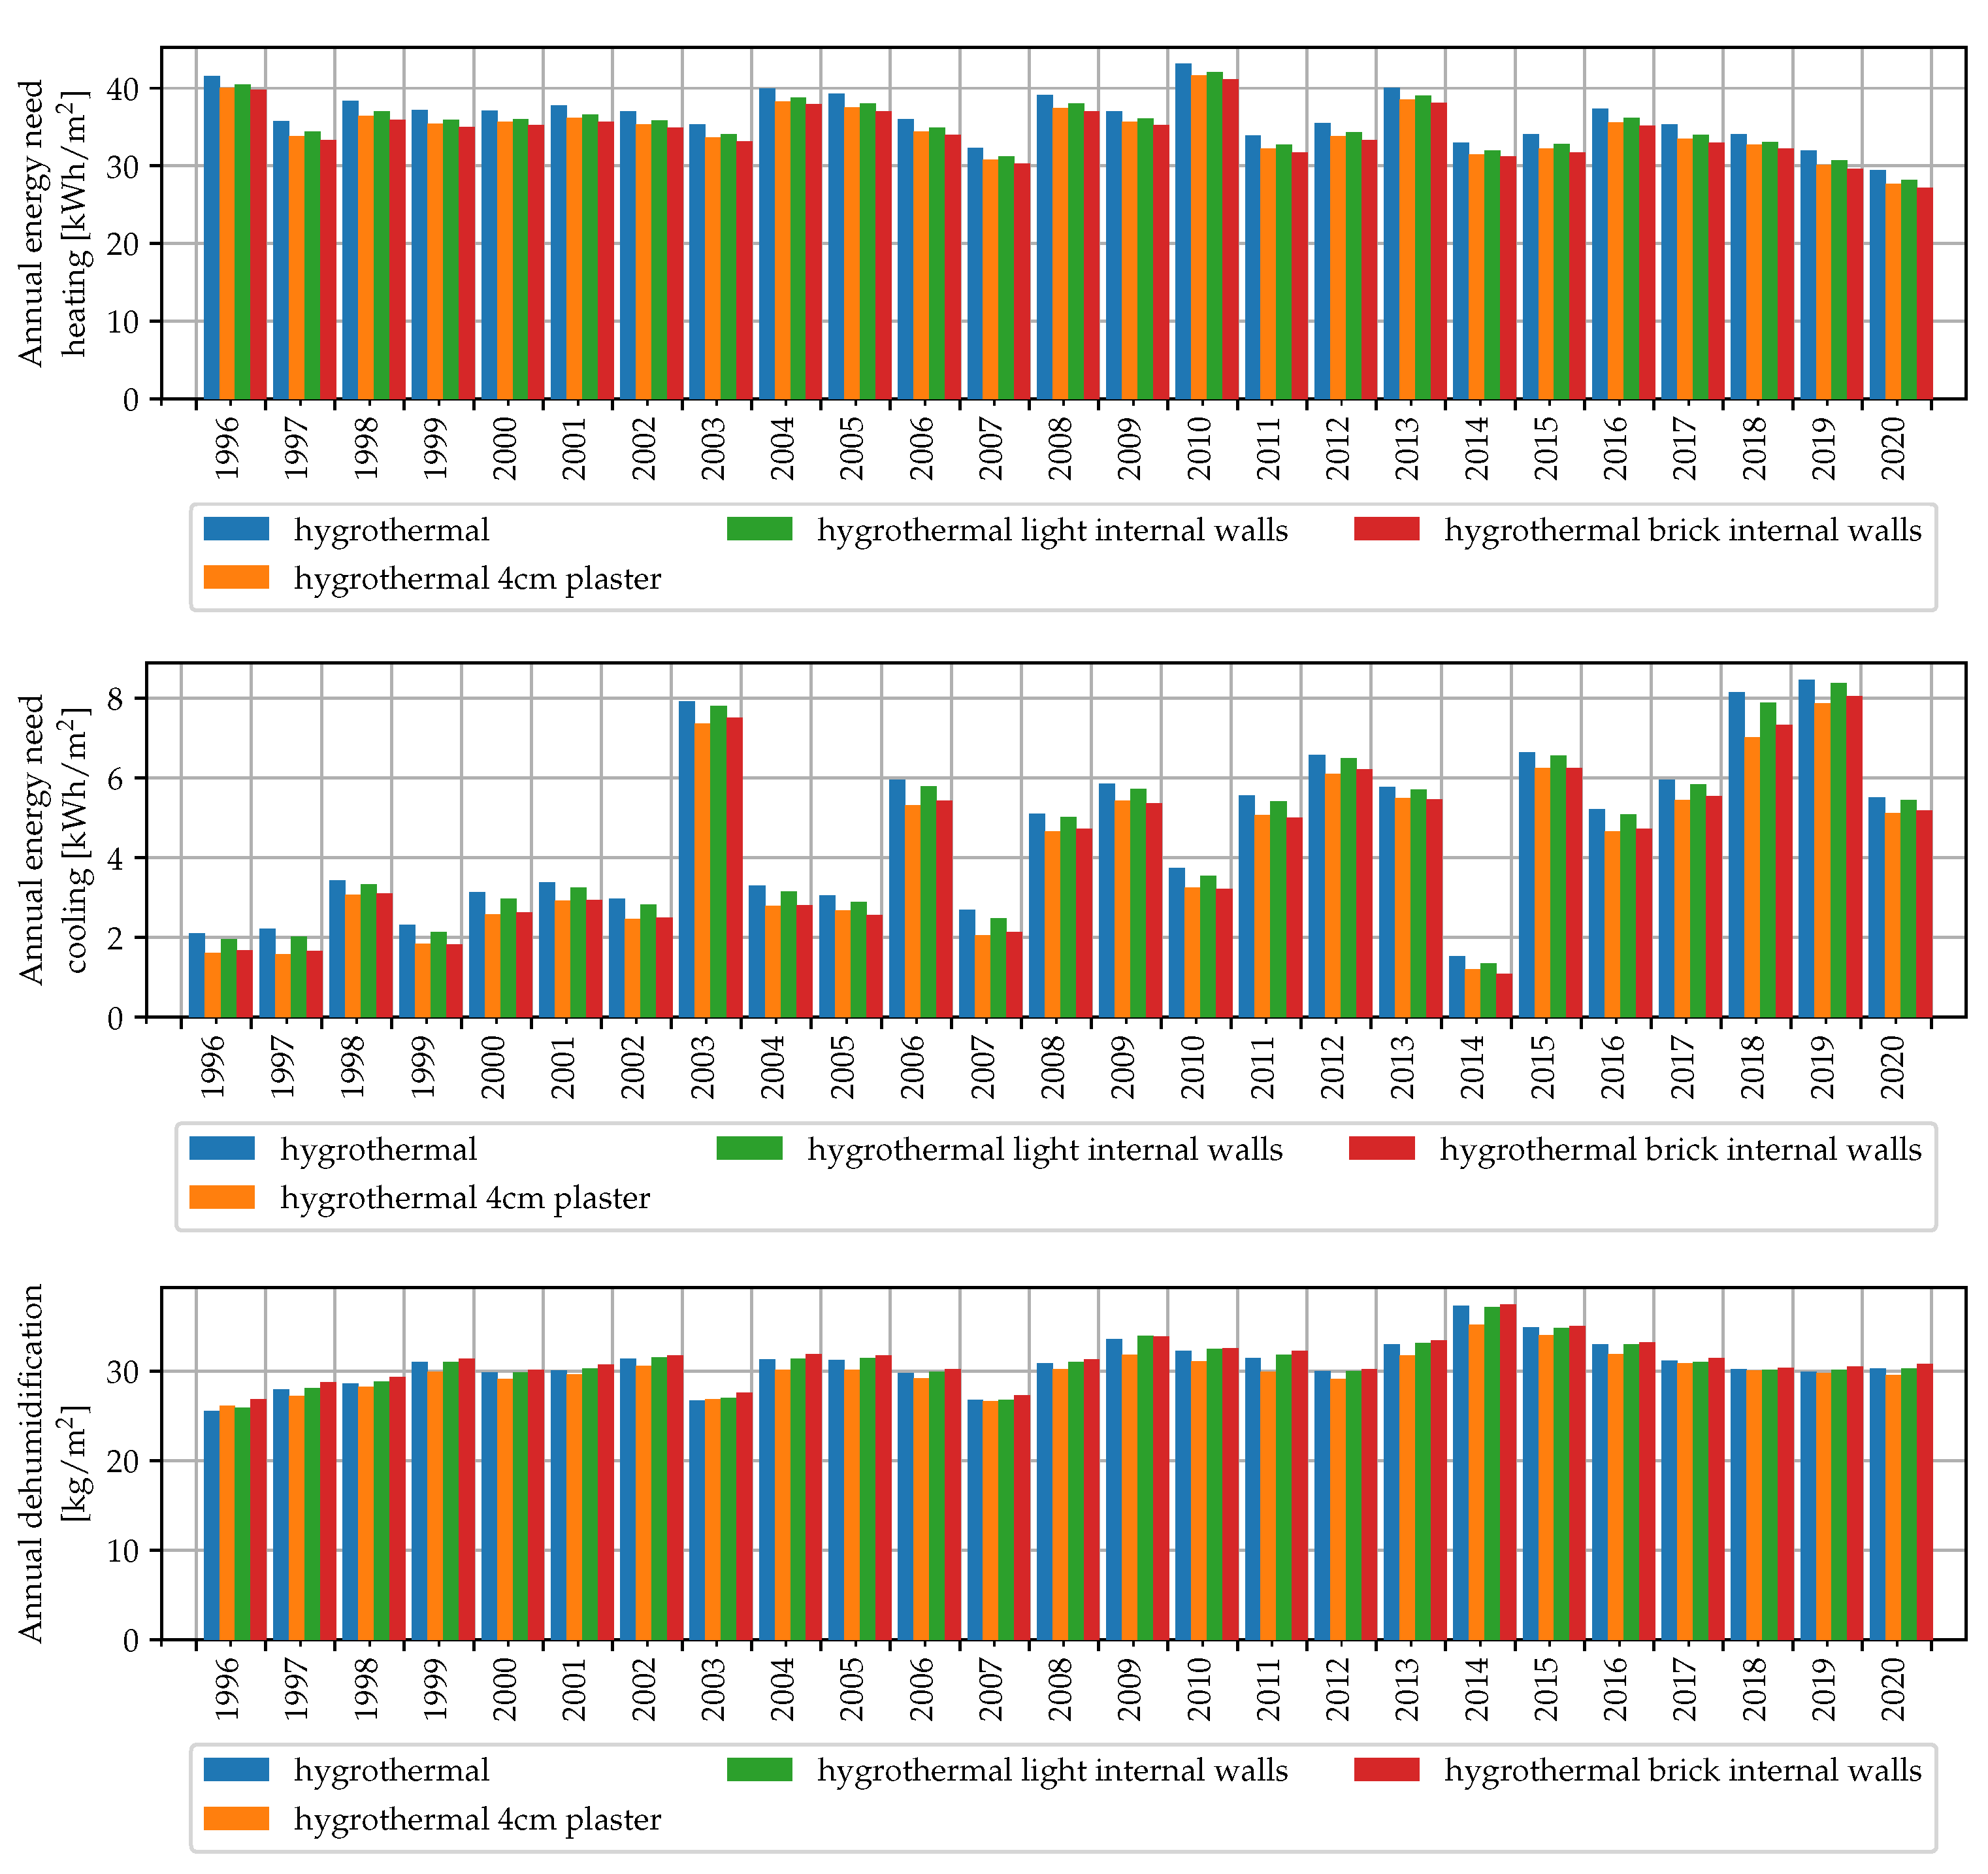
3.3. Influence of Building Envelope

In this section the same building is considered, but a layer of internal insulation (10 cm of Glass-Fiber board) is added to the assemblies. This resulted in lower heating loads and in higher cooling loads. Including the insulation layer, the cooling demand, as expected, is not zero for all the years, while the heating demand is lower. The results are presented in Figure 11.
To evaluate the influence of internal walls two simulations are performed considering additional internal masses. Two configurations with additional internal walls with a total surface of 40 m 2 , one considering a light wall of two gypsum panels with a 10 cm air layer and one solid brick wall (12 cm) covered with internal plaster (2 cm) on both sides and onw configuration with a layer of 4cm of plaster on the external walls. All simulations resulted with no humidification demand. As expected the heating demands have small variations between the cases, while the cooling demand is affected, with a reduction of the demand for the simulations with the additional mass. The case with the brick wall and the one with the additional plaster have lower demands than the gypsum board wall. All the additional mass configurations reduce the cooling demand and, due to the reduced thermal losses through the opaque envelope. no multiyear effects are found for these cases.

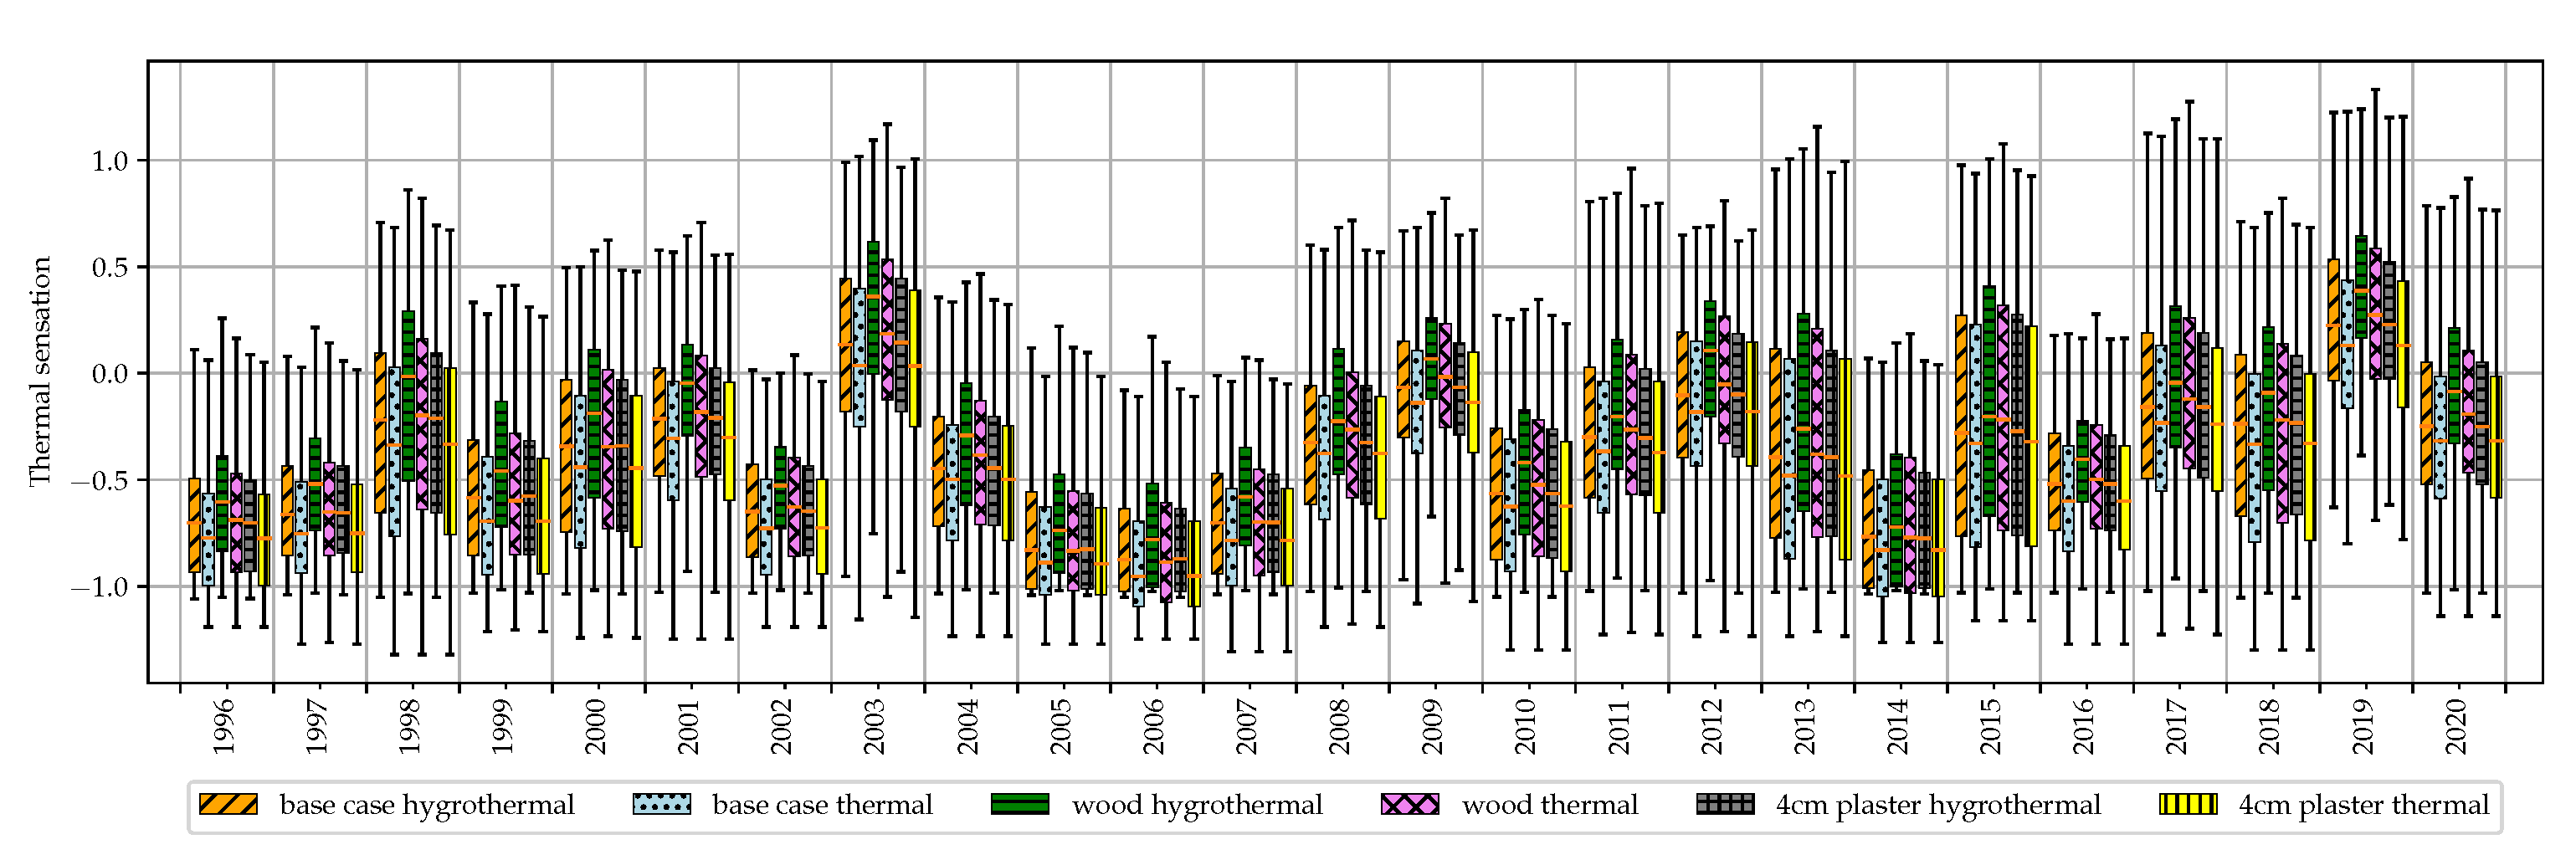
3.4. Comfort Calculations

To evaluate the effect of the hygrothermal multiyear simulation on comfort calculations the insulated case with different internal superficial layer is considered. This case represents a retrofit measure used for historic buildings that allows to maintain the façade aspect. The comfort calculations are performed using the ASHRAE thermal sensation model for both men and women, with exposure time of 1 h. The model result is a number between 3 and −3 to be interpreted using the ASHRAE sensation scale in Table 4. The thermal sensation scale calculation procedure is here used to consider also air humidity and to obtain a comparable indicator of the indoor environment independent of the occupants behaviour and level of clothing. The results of are shown in Figure 12. Only the month of August is considered for each year and the distribution of the thermal sensation is represented in box-plots. The simulations are performed on a building with insulation, with different internal layers. The cooling, dehumidification and humidification are turned off. Due to the hygroscopic properties of the internal layers there are no multiyear effects but the results are affected by the model used for the simulation and it is possible to evaluate which material could help to control in a passive way the internal conditions.

4. Discussion

WUFI Plus model is based on several simplifying assumptions, for example, when modelling the sorption equilibrium of the materials moisture hysteresis is neglected. It has been shown that moisture hysteresis is relevant in moisture damage analysis [24,25] and in energy or comfort calculations [26,27]. Nevertheless the HMT model is already demanding in terms of computational time: a 18 zone hygrothermal simulation (not presented in the paper) required 480 min, 45 min for the thermal simulation. In both cases the computational effort is to large to be used in optimization procedures or in statistical analyses. One solution could be the simplification of the hygrothermal model, like the one proposed in [23]. The here presented results confirmed that the buildings with low levels of insulation have larger variations in their results in the multiyear, as shown in [13], which concluded that using a single representative year could be misleading when calculating the buildings energy labelling. As shown in [14], using the multiyear approach provides a distribution of annual results instead, much more information than a single value calculated from the representative year. This allows to evaluate the behaviour of the building during extreme weather events.

5. Conclusions

This study presented the results of several multiyear hygrothermal hourly simulations performed on a simple building using WUFI Plus, considering different external walls and internal walls configurations. The 25 year long weather record of Udine has been used. The main focus of the study is the relevance of the multiyear simulation approach, showing that the influence of the initial conditions have effects on the results, even more if the simulations are performed with an hygrothermal model. The main conclusions of this work are:
  • Different initial conditions of wall materials, used to simulate in-built moisture, presented different influences over the multiyear results. Relative humidities in the structures up to 80% RH presented effects for three years, while the 95% RH initial condition influenced the moisture content of some materials and the thermal behaviour of the envelope for all the weather record;
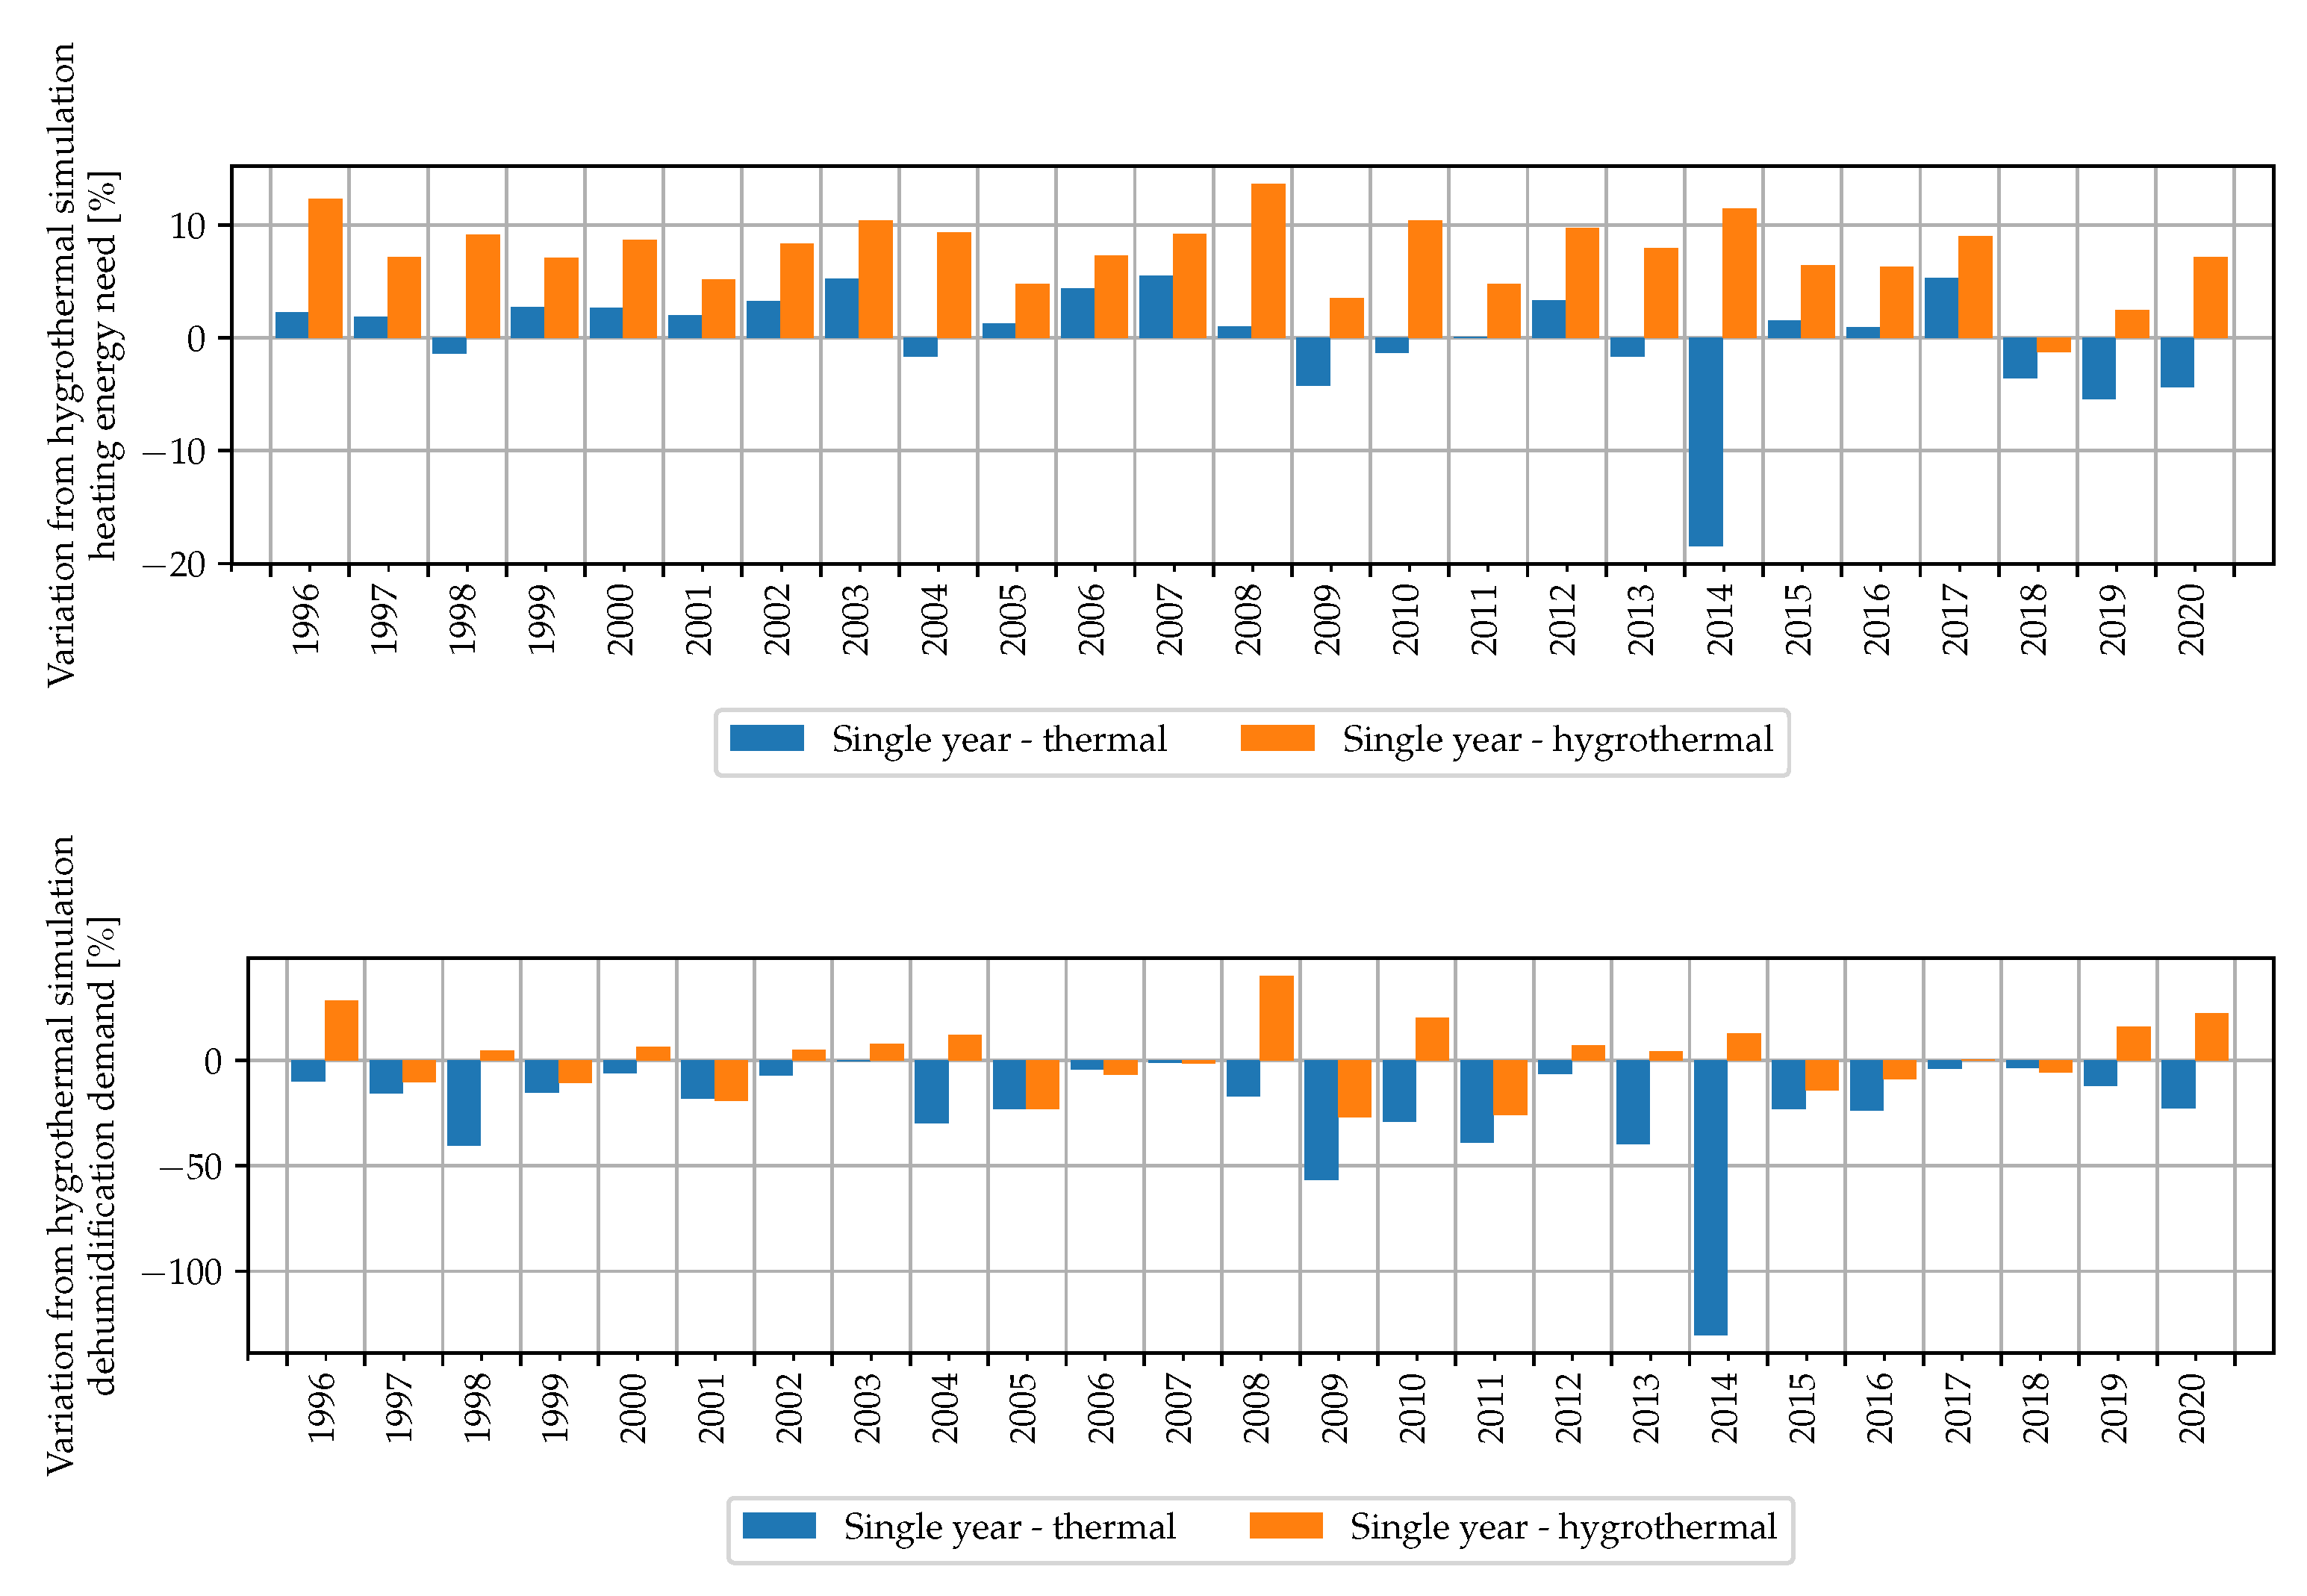
  • The effect of short-term climate change has been shown analysing the weather data and observing the results of the simulations. The decrease of the average of the heating demands and the increase of the cooling demands in the last years of the weather record are an effect that should be considered in building simulation. These results confirm the relevance of updating the weather data used for building simulations and eventually the use of extreme weather files or future weather files;
  • Multiyear effects on the cooling and heating needs depend on the opaque envelope that could accumulate moisture (not on ventilation and transparent envelope);
  • When considering moisture transfer in whole building simulations, using only one year of initialization could be not sufficient to obtain the dynamic equilibrium with the external environment;
  • Using multiyear simulations could be the most accurate approach to simulate the building behaviour but it is not practical in therms of computational effort. Other simplified calculation methods could be preferred to finite volume method, depending on the application.
These conclusions are relevant and should be considered when performing detailed simulations (for example in model calibration procedures). Future work will be addressed to evaluate different building geometries and building materials, evaluating also the comfort of occupants, considering also other weather records from other locations and future weather files.

Author Contributions

Conceptualization, M.L. and A.D.A.; resources, G.C. and P.D.; data curation, M.L. and G.T.; writing—original draft preparation, M.L.; writing—review and editing, A.D.A., G.C., O.S. and P.D.; supervision, G.C., O.S. and P.D.; funding acquisition, G.C. and P.D. All authors have read and agreed to the published version of the manuscript.

Funding

The research leading to these results has received funding from the MIUR of Italy within the framework of the PRIN2017 project “The energy flexibility of enhanced heat pumps for the next generation of sustainable buildings (FLEXHEAT)”, grant 2017KAAECT.

Acknowledgments

The authors would like to thank ARPA FVG (OSMER) for supplying the raw weather data, Fraunhofer Institute for Building Physics for providing WUFI Plus license.

Conflicts of Interest

The authors declare no conflict of interest.

References

  1. Hao, L.; Herrera, D.; Troi, A.; Petitta, M.; Matiu, M.; Pero, C.D. Assessing the impact of climate change on energy retrofit of alpine historic buildings: Consequences for the hygrothermal performance. IOP Conf. Ser. Earth Environ. Sci. 2020, 410, 012050. [Google Scholar] [CrossRef]
  2. Ciancio, V.; Salata, F.; Falasca, S.; Curci, G.; Golasi, I.; de Wilde, P. Energy demands of buildings in the framework of climate change: An investigation across Europe. Sustain. Cities Soc. 2020, 60, 102213. [Google Scholar] [CrossRef]
  3. Lupato, G.; Manzan, M. Italian TRYs: New weather data impact on building energy simulations. Energy Build. 2019, 185, 287–303. [Google Scholar] [CrossRef]
  4. Crawley, D.B. Estimating the impacts of climate change and urbanization on building performance. J. Build. Perform. Simul. 2008, 1, 91–115. [Google Scholar] [CrossRef]
  5. Gaur, A.; Lacasse, M.; Armstrong, M. Climate Data to Undertake Hygrothermal and Whole Building Simulations Under Projected Climate Change Influences for 11 Canadian Cities. Data 2019, 4, 72. [Google Scholar] [CrossRef] [Green Version]
  6. Nik, V.M.; Arfvidsson, J. Using Typical and Extreme Weather Files for Impact Assessment of Climate Change on Buildings. Energy Procedia 2017, 132, 616–621. [Google Scholar] [CrossRef]
  7. P. Tootkaboni, M.; Ballarini, I.; Zinzi, M.; Corrado, V. A Comparative Analysis of Different Future Weather Data for Building Energy Performance Simulation. Climate 2021, 9, 37. [Google Scholar] [CrossRef]
  8. Lu, J.; Marincioni, V.; Orr, S.A.; Altamirano-Medina, H. Climate Resilience of Internally-Insulated Historic Masonry Assemblies: Comparison of Moisture Risk under Current and Future Climate Scenarios. Minerals 2021, 11, 271. [Google Scholar] [CrossRef]
  9. Marincioni, V.; Altamirano-Medina, H. Identifying a suitable climate file for the moisture risk assessment of internally insulated walls exposed to solar-driven vapour diffusion. Build. Simul. 2017, 1, 304–309. [Google Scholar] [CrossRef]
  10. Pernigotto, G.; Prada, A.; Gasparella, A. Extreme reference years for building energy performance simulation. J. Build. Perform. Simul. 2020, 13, 152–166. [Google Scholar] [CrossRef]
  11. Libralato, M.; Pernigotto, G.; Prada, A.; de Angelis, A.; Saro, O.; Gasparella, A. Design and Evaluation of Extreme Moisture Reference Years for Moisture-Related Risk Assessments. In Proceedings of the 4th IBPSA-Italy Conference on Building Simulation Applications, BSA 2019, Bozen-Bolzano, Italy, 19–21 June 2020. [Google Scholar]
  12. Libralato, M.; De Angelis, A.; D’Agaro, P.; Cortella, G.; Saro, O. Multiyear Hygrothermal Performance Simulation of Historic Building Envelopes. In Proceedings of the SBE21 Sustainable Built Heritage, Bolzano-Bozen, Italy, 14–16 April 2021. [Google Scholar] [CrossRef]
  13. Pernigotto, G.; Prada, A.; Cóstola, D.; Gasparella, A.; Hensen, J.L. Multi-year and reference year weather data for building energy labelling in north Italy climates. Energy Build. 2014, 72, 62–72. [Google Scholar] [CrossRef] [Green Version]
  14. Cui, Y.; Yan, D.; Hong, T.; Xiao, C.; Luo, X.; Zhang, Q. Comparison of typical year and multiyear building simulations using a 55-year actual weather data set from China. Appl. Energy 2017, 195, 890–904. [Google Scholar] [CrossRef] [Green Version]
  15. Libralato, M.; Murano, G.; De Angelis, A.; Saro, O.; Corrado, V. Influence of the Meteorological Record Length on the Generation of Representative Weather Files. Energies 2020, 13, 2103. [Google Scholar] [CrossRef] [Green Version]
  16. Libralato, M.; Murano, G.; De Angelis, A.; Saro, O.; Corrado, V. Generation of Moisture Reference Years for Interstitial Condensation Risk Assessment: Influence of the Meteorological Record Length. In Proceedings of the 16th International Conference of the International Building Performance Simulation Association, Building Simulation 2019, Rome, Italy, 2–4 September 2019. [Google Scholar]
  17. Künzel, H.M. Simultaneous Heat and Moisture Transport in Building Components. Ph.D. Thesis, Fraunhofer Institute of Building Physics, Stuttgart, Germany, 1995. [Google Scholar]
  18. Rode, C.; Woloszyn, M. Whole-building hygrothermal modeling in IEA Annex 41. In Thermal Performance of the Exterior Envelopes of Whole Buildings: Buildings X; American Society of Heating, Refrigerating and Air-Conditioning Engineers: Atlanta, GA, USA, 2007; pp. 1–15. [Google Scholar]
  19. Antretter, F.; Sauer, F.; Schöpfer, T.; Holm, A. Validation of a hygrothermal whole building simulation software. In Proceedings of the Building Simulation 2011: 12th Conference of International Building Performance Simulation Association, Sydney, Australia, 14–16 November 2011; Volume 14, p. 16. [Google Scholar]
  20. Frasca, F.; Cornaro, C.; Siani, A. Performance assessment of a heat and moisture dynamic simulation model in IDA ICE by the comparison with WUFI Plus. In IOP Conference Series: Materials Science and Engineering; IOP Publishing: Bristol, UK, 2018; Volume 364, p. 012024. [Google Scholar]
  21. Frasca, F.; Verticchio, E.; Cornaro, C.; Siani, A.M. Performance assessment of hygrothermal modelling for diagnostics and conservation in an Italian historical church. Build. Environ. 2021, 193, 107672. [Google Scholar] [CrossRef]
  22. Sui Jiang, S.S.; Hao, J.L.; De Carli, J.N. Hygrothermal and mechanical performance of sustainable concrete: A simulated comparison of mix designs. J. Build. Eng. 2021, 34, 101859. [Google Scholar] [CrossRef]
  23. Zu, K.; Qin, M.; Rode, C.; Libralato, M. Development of a moisture buffer value model (MBM) for indoor moisture prediction. Appl. Therm. Eng. 2020, 171, 115096. [Google Scholar] [CrossRef]
  24. Libralato, M.; De Angelis, A.; Saro, O.; Qin, M.; Rode, C. Effects of considering moisture hysteresis on wood decay risk simulations of building envelopes. J. Build. Eng. 2021, 42, 102444. [Google Scholar] [CrossRef]
  25. Libralato, M.; De Angelis, A.; D’Agaro, P.; Cortella, G.; Qin, M.; Rode, C. Damage risk assessment of building materials with moisture hysteresis. In Proceedings of the 8th International Building Physics Conference, IBPC 2021, Copenhagen, Denmark, 25–27 August 2021. [Google Scholar]
  26. Lelièvre, D.; Colinart, T.; Glouannec, P. Modeling the Moisture Buffering Behavior of a Coated Biobased Building Material by Including Hysteresis. Energy Procedia 2015, 78, 255–260. [Google Scholar] [CrossRef] [Green Version]
  27. Costantine, G.; Maalouf, C.; Moussa, T.; Kinab, E.; Polidori, G. Hygrothermal evaluation of hemp concrete at wall and room scales: Impact of hysteresis and temperature dependency of sorption curves. J. Build. Phys. 2020, 44, 183–224. [Google Scholar] [CrossRef]
Figure 1. Annual mean temperature and annual mean solar irradiation measured at the station of Udine—S. Osvaldo, Italy.
Energies 14 07157 g001
Figure 2. Annual mean relative humidity and annual mean rainfall intensity measured at the station of Udine—S. Osvaldo, Italy.
Energies 14 07157 g002
Figure 3. Annual heating degree days and cooling degree days measured at the station of Udine—S. Osvaldo, Italy.
Energies 14 07157 g003
Figure 4. Building geometry modelled in WUFI Plus.
Energies 14 07157 g004
Figure 5. Annual building system demands calculated for the building, with the models thermal, hygrothermal with rain and hygrothermal without rain.
Energies 14 07157 g005
Figure 6. Percent difference from the thermal model of the annual building system demands calculated for the building, with the model hygrothermal with rain and hygrothermal without rain.
Energies 14 07157 g006
Figure 7. Annual building system demands calculated for the building, with the models thermal, hygrothermal with rain for different values of relative humidity set as initial conditions for the building walls.
Energies 14 07157 g007
Figure 8. Variation due to different initial moisture contents on building system demands calculated for the building, with the hygrothermal model with rain.
Energies 14 07157 g008
Figure 9. Moisture content of the concrete layer and plaster layer of the ceiling: comparison between different initial moisture contents. Simulation performed with hygrothermal model with rain.
Energies 14 07157 g009
Figure 10. Variation due to multiyear simulation on wall moisture content calculated for the building, south facing wall, from the hygrothermal model with rain.
Energies 14 07157 g010
Figure 11. Annual building system demands calculated for the building, with the hygrothermal model with rain with additions of thermal mass: a 4 cm layer of plaster, an internal partition wall made of gypsum panels and a brick wall.
Energies 14 07157 g011
Figure 12. Box-plots representing the distribution of the hourly values of Thermal sensation in the month of August of every year, obtained with the thermal and hygrothermal models, considering the base case and a base case with different internal surfaces.
Energies 14 07157 g012
Table 1. External wall build up and material properties.
Material/Layer
(from Outside to Inside)
ρ
[kg/m3]
c
[J/kgK]
λ
[W/mK]
Thickness
[m]
Brick7658500.1580.48
Lime Plaster16008500.70.02
Table 2. Roof build up and material properties.
Material/Layer
(from Outside to Inside)
ρ
[kg/m3]
c
[J/kgK]
λ
[W/mK]
Thickness
[m]
Roof Membrane240010000.50.0001
Spruce40018800.0860.02
Air Layer 50 mm1.310000.280.05
Concrete23228501.70.2
Lime Plaster16008500.70.02
Table 3. Floor build up and material properties.
Material/Layer
(from Outside to Inside)
ρ
[kg/m3]
c
[J/kgK]
λ
[W/mK]
Thickness
[m]
Concrete23228501.70.3
Air Layer 10 mm1.310000.0710.01
Spruce40018800.0860.02
Table 4. ASHRAE thermal sensation scale.
HotWarmSlightly
Warm
Neutral
Neutral
Slightly
Cool
CoolCold
Thermal sensation+3+2+10−1−2−3
Publisher’s Note: MDPI stays neutral with regard to jurisdictional claims in published maps and institutional affiliations.

