Article

Long-Term Performance Analysis Using TRNSYS Software of Hybrid Systems with PV-T

Faculty of Chemical Engineering and Technology, Cracow University of Technology, 31-155 Kraków, Poland
Energies 2021, 14(21), 6921; https://doi.org/10.3390/en14216921
Submission received: 30 September 2021 / Revised: 15 October 2021 / Accepted: 18 October 2021 / Published: 21 October 2021

Abstract

:
A hybrid photovoltaic-thermal collector (PV-T) with the capability to produce thermal energy and electrical energy simultaneously has attracted the attention of researchers, especially in terms of improving PV-T performance. This study analyses the work of four model installations with PV-T and other devices built in the transient systems simulation program. The novelty of this article lies in a long-term approach to the operation of PV-T panels under selected climatic conditions. Influence of the installation’s configuration on the obtained temperatures of solar cells, and, in consequence, on electric power generated by PV-T and the amount of heat produced during one year in a selected location is presented. Among others, the impact of the temperature coefficient of photovoltaic cells for long-term PV-T operation was analyzed in the paper. The results showed that the type of cell used may decrease the yearly electric energy production from PV-T even by 7%. On the other hand, intensification of the process of heat reception from PV-T using a heat pump increased this production by 6% in relation to the base model. The obtained research results indicate possible methods for improving the effectiveness of PV-T operation in a long-term aspect.

Graphical Abstract

1. Introduction

Issues such as climate changes and global warming in the face of what can be observed in the weather phenomena and environment pollution are still very relevant. There is a tremendous need for progress and development for a better human life connected with the depletion of conventional energy sources [1]. In this context, the betterment of systems using installations with renewable energy sources has become a key issue for researchers, manufacturers, and designers globally [2]. Technologies that use solar energy are mentioned as one of the methods that play a vital role in mitigating climate change and which, most importantly, can be exploited worldwide [3]. Solar technologies can also contribute to the improvement of a very dangerous situation related to water scarcity in many countries around the world, supporting water purification processes [4].
In most cases, solar energy is used to produce clean thermal or electrical energy in well-known dedicated devices, namely solar thermal collectors and photovoltaic panels (PV) [5]. By combining these two devices, a hybrid photovoltaic-thermal collector (PV-T) is obtained. Different designs of PV-T collectors are available to simultaneously produce thermal and electrical energy, each with its specific operating temperature ranges [6]. The greatest advantages of PV-T include, above all, the possibility of cooling the photovoltaic cell, and thereby enhancing PV efficiency, increasing the overall efficiency of solar radiation energy conversion into other forms of energy compared to self-operating devices, and savings in space available for installation of devices (e.g., of the building’s roof or its façade [5,6,7,8]).
Great interest in the subject of PV-T collector technology is confirmed in the literature and current articles [8]. In works [1,9,10] detailed and comprehensive reviews were made on PV-T technology which comprise the historical background, benefits, main applications, and classifications of this technology according to various manners. In article [11] the authors presented comprehensive performance results of experimental PV-T system using microencapsulated phase change material slurry as the cooling medium. The results showed that such a solution could enhance the performance of PV-T. The main research results presented in [12] about the stabilization of cell temperature in modified PV-T are promising; cells heats up to a lower temperature compared to the base PV panel. The optimal, time-invariant tilt angle of the absorber plane of PV-T in view of the actual characteristics of solar radiation and weather conditions was determined in the work [11]. A frequently discussed issue is the applications of nanofluids in PV-T systems and the impact of nanoparticle type, size, volume fraction, and concentration ratio on system performance [13,14]. In study [15] the authors presented a detailed energy and exergy analysis of the PV/T system utilizing mono, hybrid, and ternary nanofluids. Their findings revealed that ternary nanofluid performed better than the other nanofluids in PV/T systems [15].
The operation of various types of PV-T systems are readily analyzed in the software package Transient System Simulation Tool (TRNSYS) due to software flexibility and the large number of available components represented as black boxes called ‘Types’ that enable the creation of complex hybrid systems. Another big advantage of TRNSYS is that during the simulations, all component procedures are called and executed simultaneously, and the procedure itself moves to the next step after reaching an acceptable convergence [16]. Study [8] analyses the impact of the variability of selected thermal parameters on the electrical efficiency of PV-T. The results show that outlet flow, the size of the tank, and matching the profile of the consumer has the highest impact on the PV-T electrical efficiency [8]. The implementation, validation, and parameter identification procedure of the PV-T model using TRNSYS has been carried out by Jonas et al. [17]. The proposed procedure are suitable for modelling the electrical and thermal performance of PV-T [17]. In work [16], Sakellariou et al. presented the sensitivity analyses of an experimentally verified PV-T model which assisted the ground source heat pump system and the results of systematic parametric modelling across several key variables. Rezvanpour et al. investigated how phase change material can regulate the PV-T cells’ temperature in a cold environment [18]. The experimental results were validated in TRNSYS. A novel lumped parameter simulation model for PV-T using field measurements carried out at an experimental facility was proposed in [19]. As a result, the simulation model was implemented as a TYPE in TRNSYS software [19].
It is a well-known fact that the efficiency of PV depends on the temperature of their cells. Cooling the PV cells leads to an enhanced electrical performance of PV-T, and therefore this topic has become important [20,21]. PV-T must operate at a relatively low temperature, and for this reason it is well suited for residential buildings applications, swimming pools, and building integrated systems [5]. In addition, PV-T cooling lowers the risk of defects resulting from thermo-mechanical stress such as micro-cracks of cells [7]. In achieving this goal, it may be very helpful to implement an additional device or the entire system cooperating with PVT in a hybrid installation. In such systems, mutual compensation of the strengths and weaknesses of the individual devices occurs during supplying of electricity, heat or cold to the final recipient [22]. Currently, many scientific works concern the analysis of the functioning of various hybrid systems. In work [23] a multi-objective optimization method for the dimensioning of hybrid PV-wind-battery systems is proposed. The possible hybrid power system configuration modes for a remote island are discussed in [23]. The effects of the installed capacity on renewable penetration and levelized cost of electricity were analyzed [24]. The paper [25] presents a deep literature review of recent papers published in the hybrid renewable energy field.
The literature review presented above shows that little information can be found on the impact of various configurations of PV-T hybrid installations on the obtained solar cell temperatures, and thus on the electric power generated by these devices and the amount of heat produced. The researchers focused heavily on the short-term aspect of the operation of this type of device, dealing with modifying their construction or specific operating parameters. The main novelties and objectives of the present work can be summarized as long-term approach to operation of PV-T under selected climatic conditions. It makes the research results presented in the paper very important from the point of view of the practical application of PV-T in various types of installations. Four models of systems with PV-T and other devices are built-in TRNSYS software. In the paper, particular attention was paid to the influence of the temperature coefficient of photovoltaic cells on PV-T operation. The obtained research findings indicate methods for the improvement of the effectiveness of PV-T operation in a long-term aspect.
This paper is structured as follows: Section 2 gives information of the location and meteorological data used, analyses four models of hybrid transient systems, and details the PV-T parameters used in TRNSYS. The results for the considered models and various systems parameters are discussed in Section 3, while Section 4 provides the main conclusions of the study.

2. Materials and Methods

2.1. Location and Meteorological Data

An important element of the simulations was a climate database. The city of Kraków located in southern Poland was selected as the location of the installation. The climate of this city is described as a temperate oceanic climate. In the Köppen–Geiger climate classification system, Krakow’s climate is classified into a group D (continental/microthermal climates) and sub-group Dfb (warm summer continental or hemiboreal climates without a dry season) [19]. Basic climatic data were obtained from the Type 15-6 component implemented in the TRNSYS program, and more specifically from the Meteonorm Type 2 database for the PL-Krakow-Balice climate station. Figure 1 presents the dry bulb temperature changes and daily total horizontal radiation changes during one year. The lowest air temperatures are observed from December to February, and the highest ones are from May to August. As for the amount of usable energy from solar radiation, the situation is similar. The highest values of daily total horizontal radiation in the range of 5.0–7.5 kWh/m2 are recorded between the end of May and the beginning of September. On the other hand, from 1 April to 30 September, the amount of energy from solar radiation constitutes as much as 76% of 1041 kWh/m2 of total horizontal radiation available per year.

2.2. Transient Models with PV-T

In this study, four models of hybrid systems were analyzed, differing in their degree of complexity and the devices used in cooperation with PV-T. Schematic diagrams of the individual installation models together with the components used in the TRNSYS are shown in Figure 2. For more information about the components used, see Appendix A.
Model A simulates a long-term PV-T operation in a scenario where there is no heat reception from the solar fluid (i.e., it is possible to receive electrical power only from photovoltaic cells). In such a situation, the PV cell temperature is equal to the temperature of the solar fluid inside the PV-T. The obtained results of the simulation of this model’s operation are used for comparison with the other models.
Model B shows an installation in which the heat produced in the PV-T is transmitted to a domestic hot water (DHW) tank with a capacity of 300 l (Type 156). Daily DHW consumption from the tank, amounting to 150 l of water (50 l in the early morning hours and 100 l in the evening) is simulated by the Type 14b component. If the required temperature of 50 °C is not reached in the tank, a boiler (Type 122) is activated, supplying heat to the DHW tank via the inlet 1. The boiler power was set to 4 kW. Using the Type 14h component, the boiler operation was blocked between 6:00 a.m. and 7:00 p.m. in order to obtain PV-T priority during this time. PV-T operation is controlled by a differential controller (Type 2b), in which the default value of upper dead-band dT has been reduced to 5 K. In terms of heat production, this model is similar to typical heating installations with solar collectors and a gas boiler, which are installed in Poland.
In Model C, a water-to-water heat pump (Type 927) receives heat from the PV-T directly and transfers it to a DHW tank having the same parameters as that in Model B. Rated heating capacity per heat pump is 600 W, while rated heating power is set to 130 W. The heat pump may operate only between 6:00 a.m. and 7:00 p.m. and when the required temperature of 50 °C at outlet 1 is not reached in the DHW tank. In this model, there is no possibility to transfer heat from the PV-T to the DHW tank directly. The rated heating capacity of the heat pump is not high, since the application of a heat pump with higher parameters would result in shorter periods of operation of circulating pumps. The longer the circulation pumps operate, the longer the PV-T is cooled during possible electricity production during the day. Model D is the most extensive of the analyzed installations. In this model, the produced heat from the PV-T collector is stored in a tank with a capacity of 300 l (Type 156), from which energy for DHW preparation is retrieved by a heat pump. Rated heating capacity per heat pump amounts to 2 kW, while rated heating power is set to 430 W. The settings of the DHW tank are the same as in Model B. The heat pump retrieves heat from the Type 156 component if the required temperature of 50 °C at outlet 1 is not reached in the DHW tank (Type 156-2) and when the average liquid temperature in the Type 156 is higher than 10 °C. The second limitation protects the tank from the freezing of the water inside it as a result of a too-high heat retrieval by the heat pump.
In the analyzed models, a scenario in which the electricity produced from PV-T is stored and then consumed directly by electrical devices in the installation was not considered. It was assumed that the installation is of an on-grid type. The proposed methodology has numerous advantages. For instance, it allows for easier interpretation of results for installations that are simulated are similar to such systems which are currently installed most often in Poland due to the implemented government and regional support programs and the net-metering system. According to this system, electricity generated by a prosumer in his own micro-installation and supplied to the local distribution network is accounted for by subtracting it from the amount of energy consumed from the power grid. In the C and D Models, it is not possible to get the temperature in the DHW tank above the set value of the degree of overheating (set to 2 °C), since switching on/off the heat pump is controlled by the differential controller (Type 2b).

2.3. Parameters of PV-T

In all models, a Type 50d PV-T collector in mode 4 was used, adding a PV module to a standard flat-plate collector. The PV-T settings, mostly set as default, common for all analyzed models, are presented in Table 1.
The influence of the packing factor (corresponding to the ratio of PV cells surface area to the gross PV-T surface area) on the obtained operational parameters of the installation, was not analyzed in the paper. The higher the value of this coefficient, the larger part of the PV-T is occupied by photovoltaic cells. Studies on the impact of this coefficient on PV-T operation are described, among others, in papers [26,27,28,29], which confirm concordantly that when the packing factor increases, thermal efficiency decreases, and electrical efficiency increases to a lesser extent. In the analyzed simulations, a packing factor value of 0.6 was assumed similar to that in the paper [28].
The influence of the PV-T slope on its operational efficiency also was not analyzed in the present study, as this issue was described in paper [30]. In the long-term perspective, the collector’s performance is maximized when the PV-T is positioned towards the south at a slope angle of approximately 34° in Polish conditions [30]. Such a slope angle was also selected in the simulations carried out.
The key parameter determining the efficiency of a PV panel is the temperature coefficient β , the value of which depends mainly on the material of the cells [31,32,33,34,35]. Users of PV installations pay particular attention to it, as the cells rarely operate under Standard Test Conditions (STC) for which this parameter is specified. The large number of correlations expressing the temperature dependence of the PV module’s electrical efficiency have linear form. The most popular expression for the PV electrical efficiency is in the form [17,35]:
η = η T r e f [ 1 β ( T c e l l T r e f ) ]
In which η T r e f is the module’s electrical efficiency at the reference temperature T r e f , β is the temperature coefficient, and T c e l l is cell temperature. This coefficient plays an even greater role in the case of PV-T, since these devices are affected by the environment (outside temperature) and the solar fluid, the temperature of which depends on many factors (the first of which is the nature of the installation). β value for a PV-T may amount from 0.003 K−1 to even 0.0063 K−1 [35]. In this paper, changes of β value in a PV-T cell were analysed in the range of 0.003–0.006 K−1 with a 0.001 K−1 step.

3. Results and Discussion

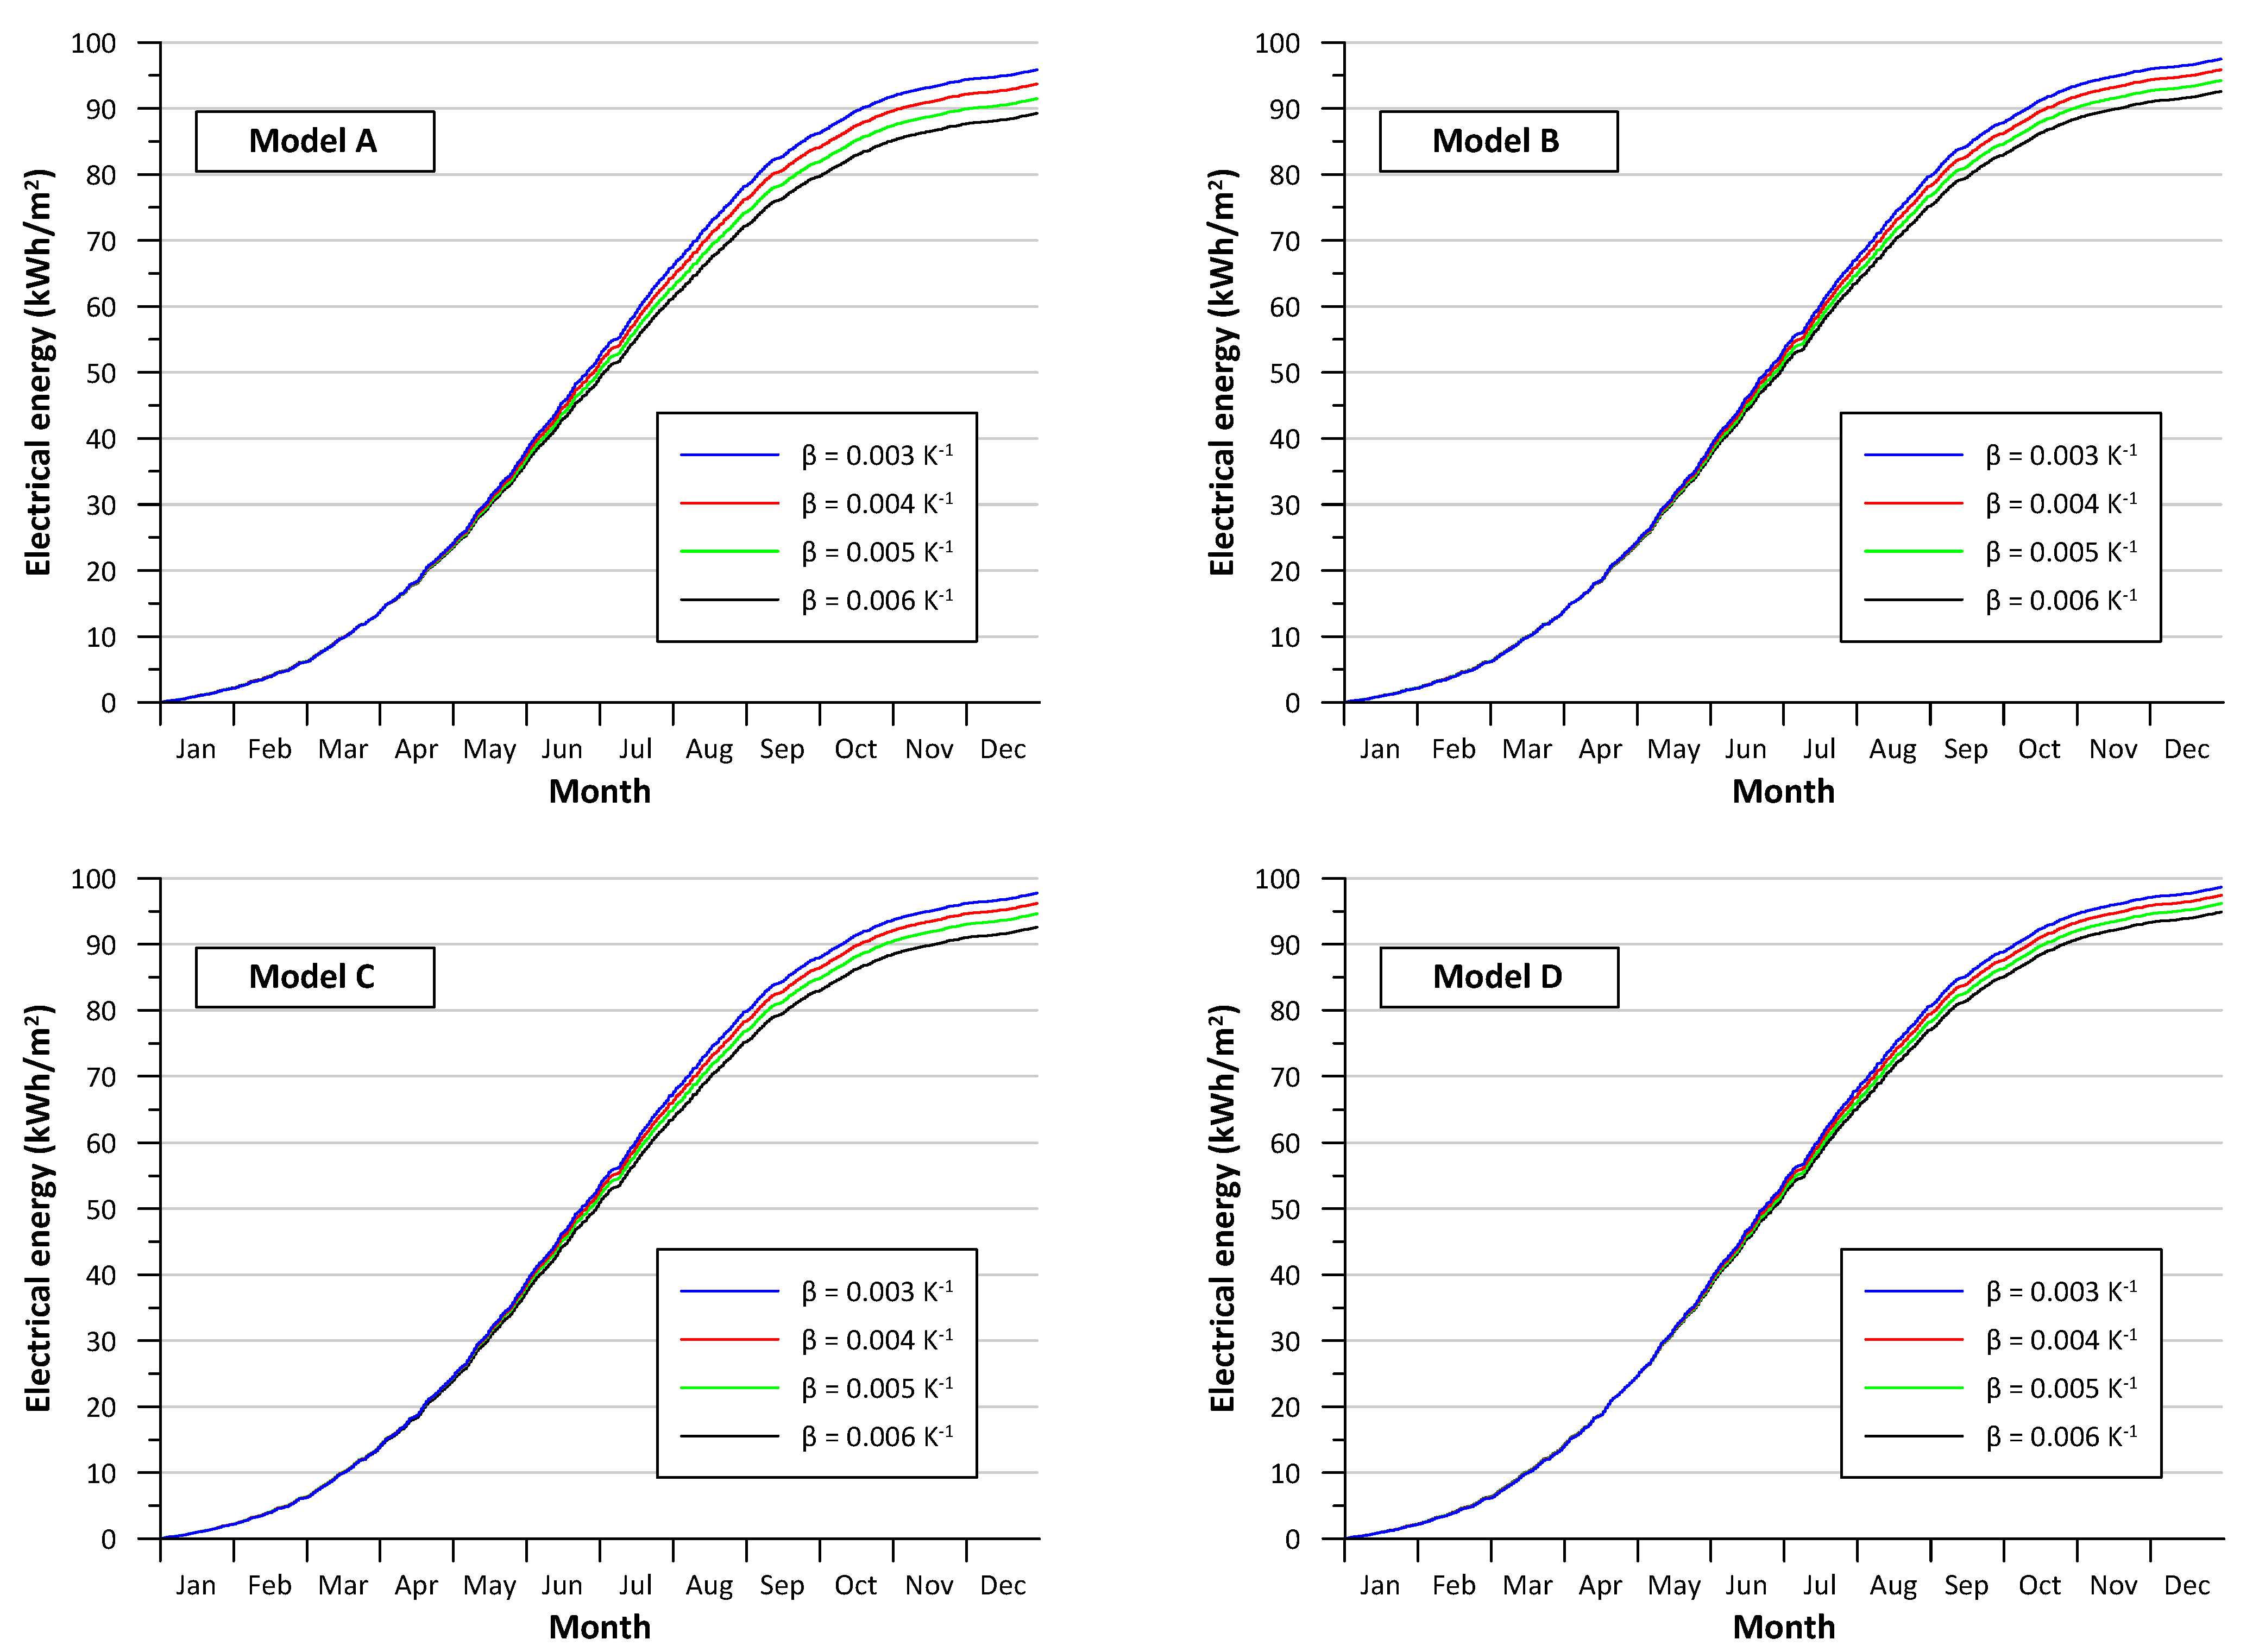
In Figure 3, the course of the annual electricity production per m2 of the PV-T surface area was shown for the discussed models and various β values. In each case, the highest values were obtained for β = 0.003 K−1, and the lowest—for β = 0.006 K−1. Application of a photovoltaic cell with a higher parameter β , in the absence of heat reception from the PV-T, can reduce the annual electricity production by up to 7%. Models B-D, in which heat reception from the PV-T was used, generated more electricity in comparison to the base Model A.
Model D of PV-T installations in each case achieved the highest values of annual electricity production, ranging from 95 to 99 kWh/m2 (Figure 3). Compared to Model A, Model D gives from 3–6% more electrical energy for the same β value. The highest impact of β on electricity production is visible in the months from May to September, i.e., during the highest daily total horizontal radiation achieved and the highest air temperatures (Figure 1). In other months, at ambient temperatures close to STC, the impact of   β is less important. It may be observed that the better the PV quality connected with a lower value of β parameter, the weaker the impact of the installation type on electricity production.
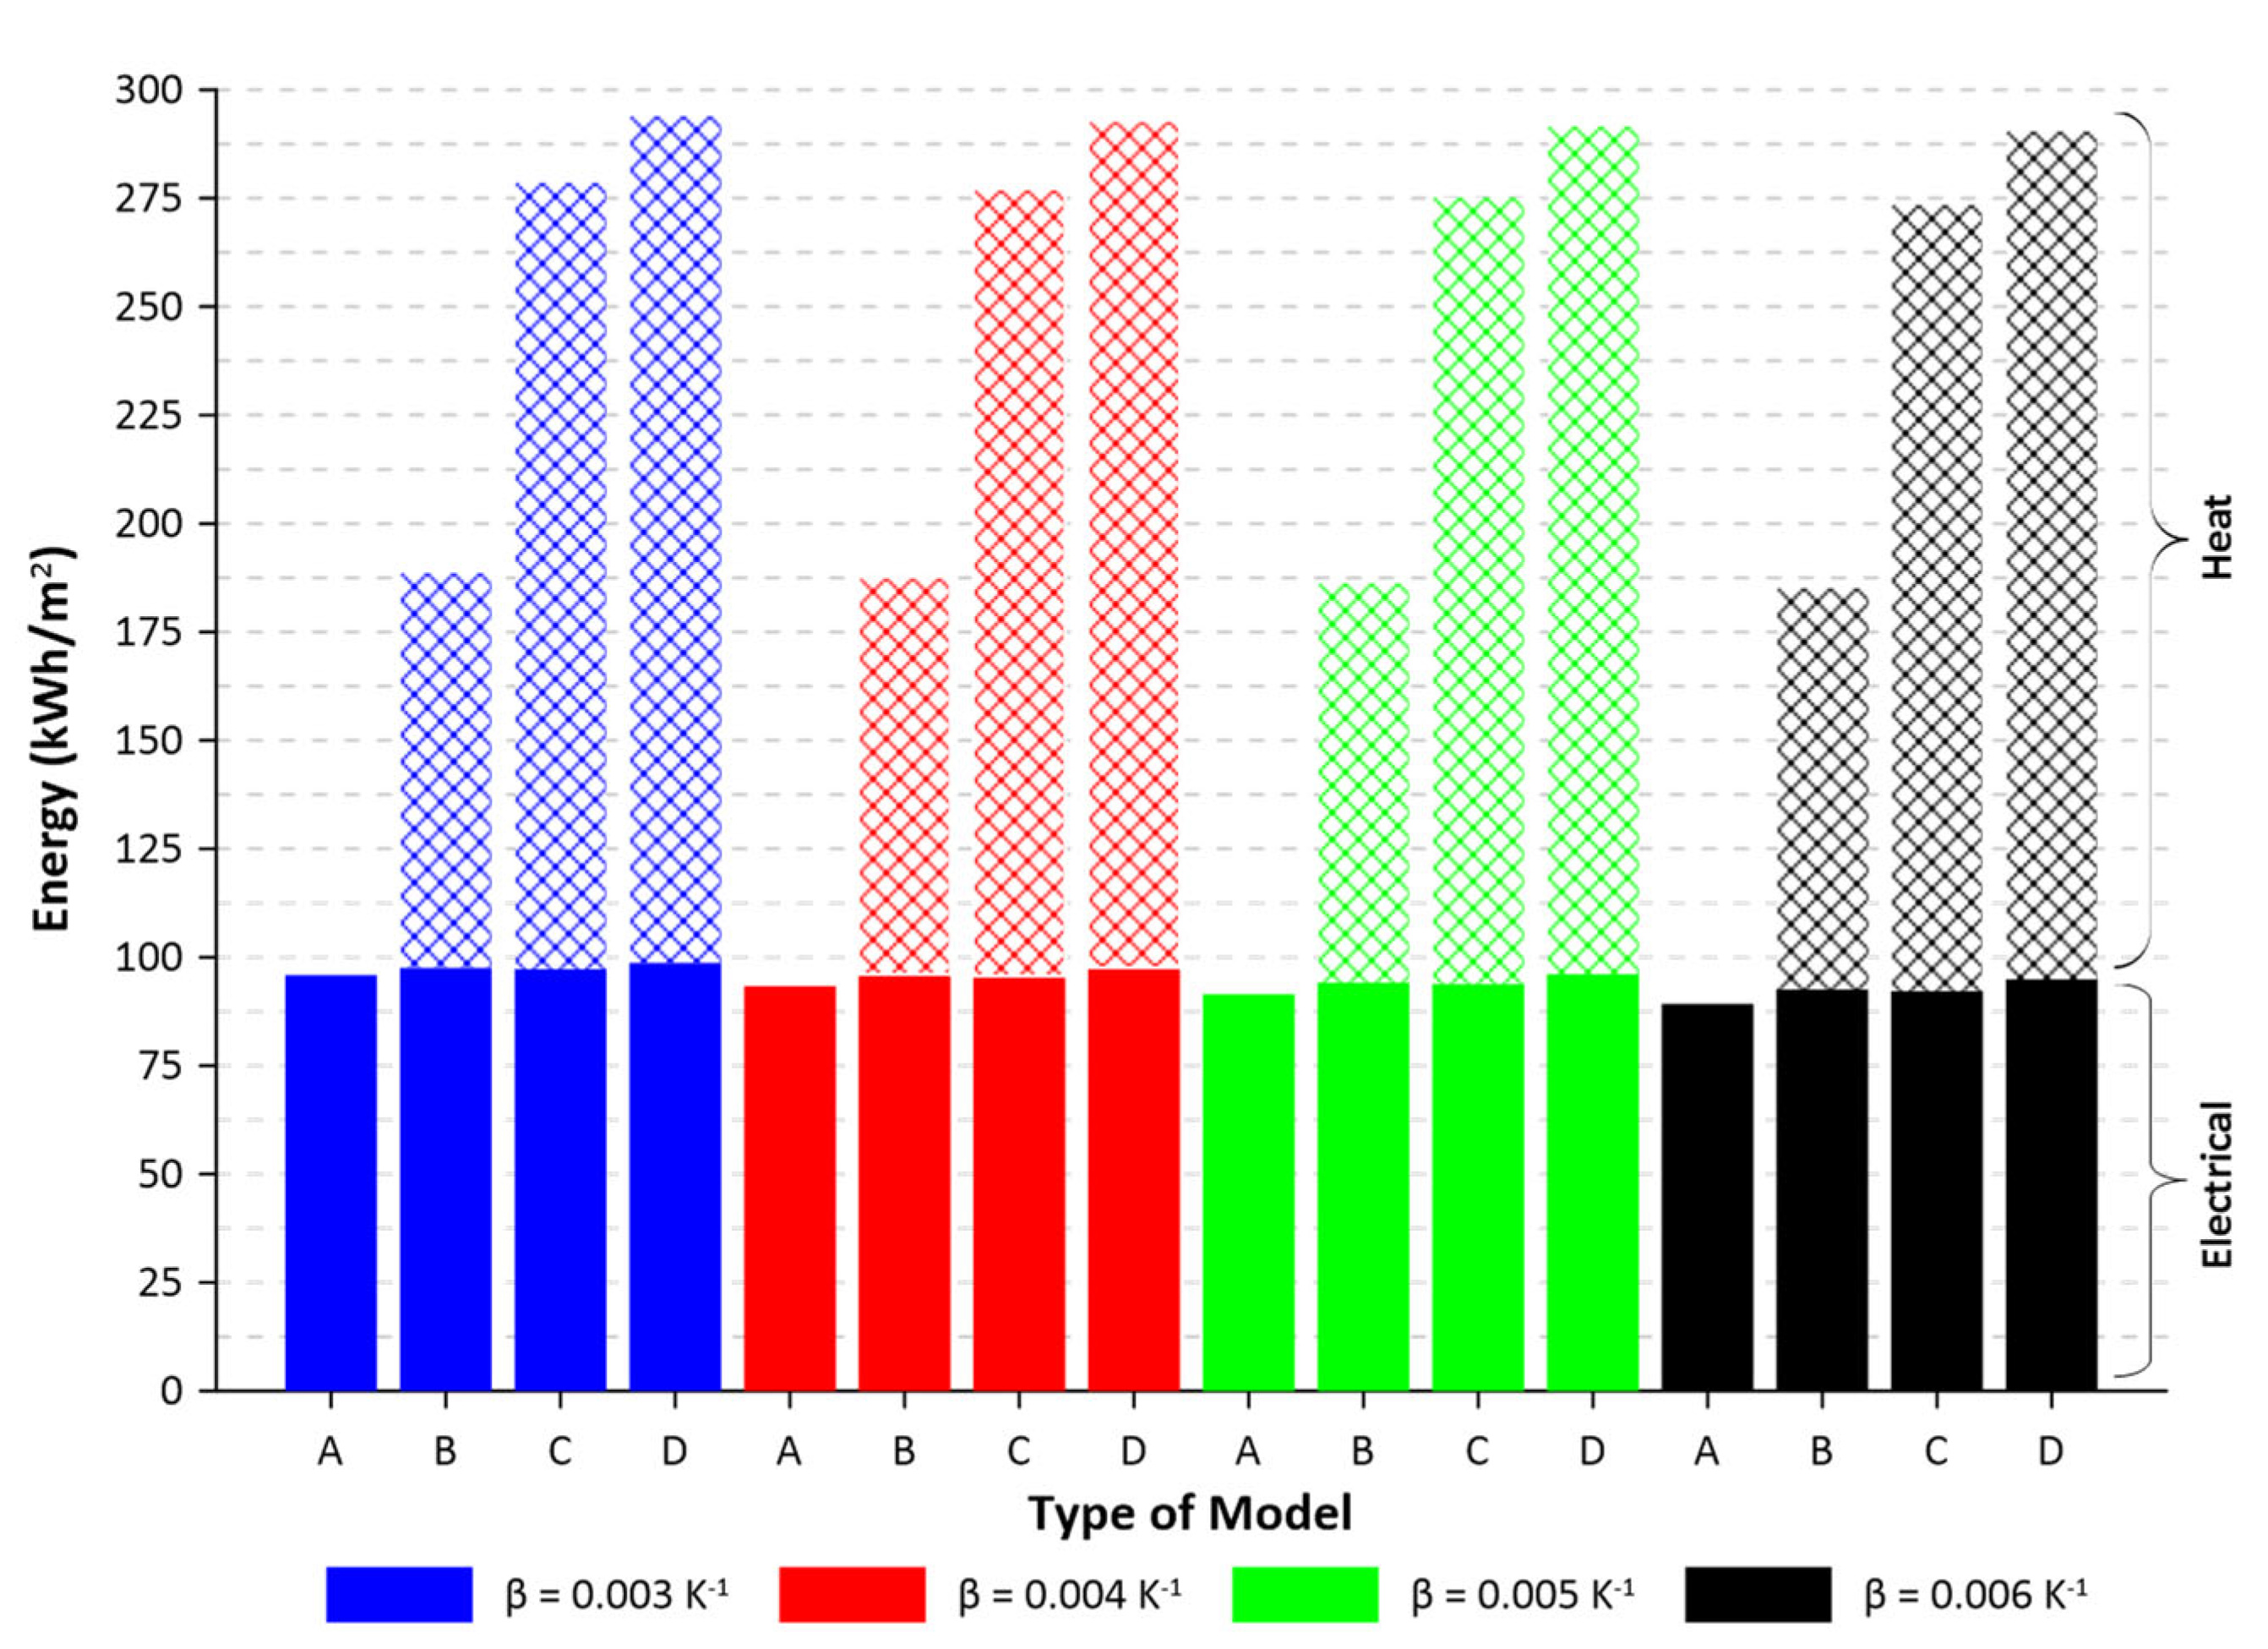
Important differences in heat energy production between the models are evident in Figure 4. Models C and D, during a long-term operation of the installation, allow for the acquisition of more heat than Model B since the boiler in the latter model maintained an appropriate DHW temperature in the tank in the given time intervals, preventing the use of potential low-temperature heat generated by the PV-T. Importantly, the β coefficient did not significantly affect the amount of energy obtained by the PV-T in the form of heat in the models under consideration. For Model B only it was recorded that heat generation was 1.4% higher for β = 0.006 K−1 than for β = 0.003 K−1. This should be explained by the fact that the solar fluid in Model B reached high temperatures in the summer, which resulted in an equally high temperature of the PV cell. At a higher temperature, the PV cells transformed a lesser amount of solar radiation into electrical energy, generating a larger amount of heat simultaneously. The highest average annual efficiency of solar radiation energy conversion was obtained for Model D for β = 0.003 K−1 and it amounted to 28.3% in relation to total horizontal radiation (i.e., 18.8% more than for Model A).
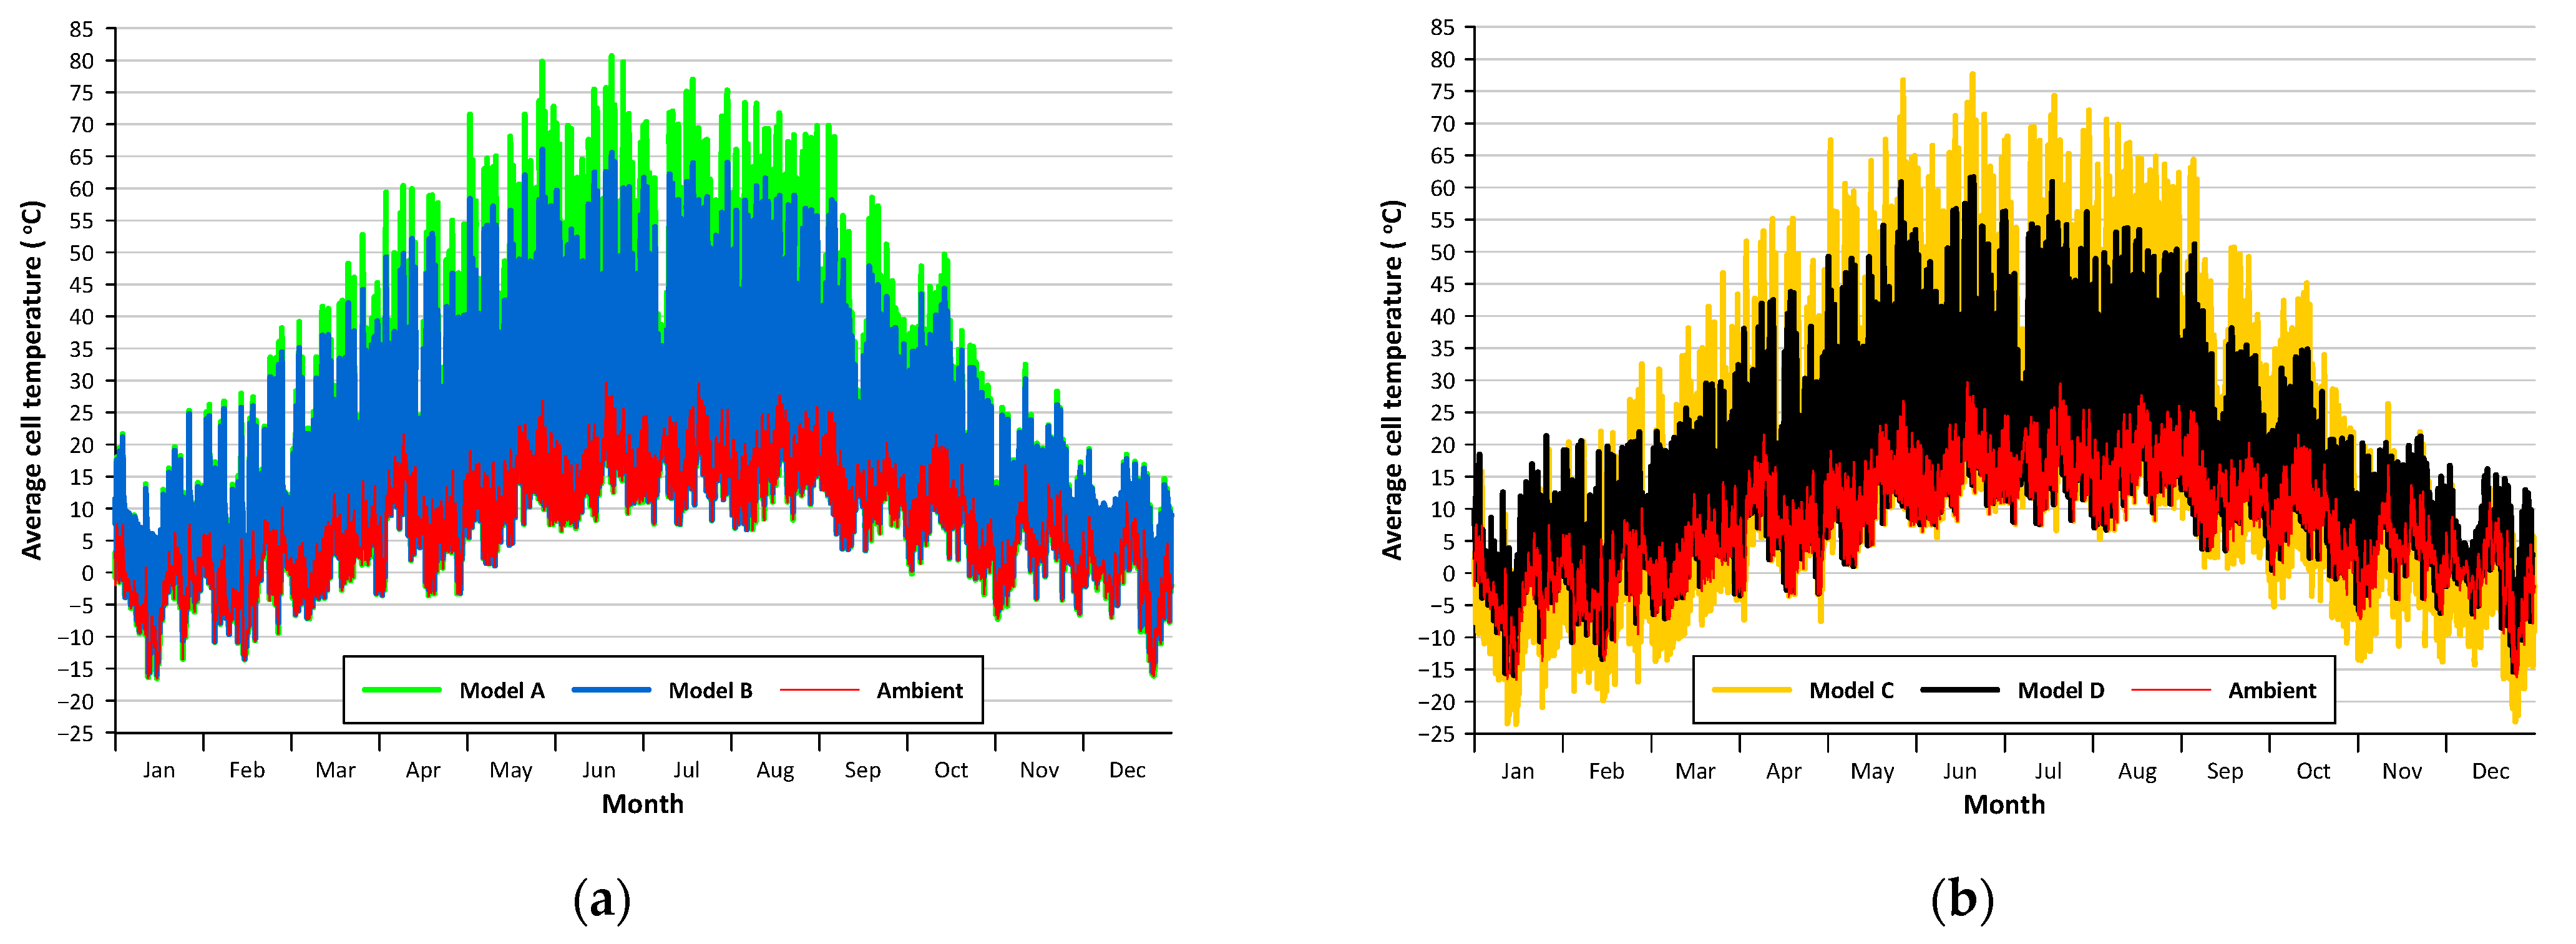
The differences in the operation of the individual models are most evident during an analysis of changes in the average temperature of the PV-T cells during the year (Figure 5). The absence of heat received from the solar fluid, particularly in the summer, leads to cell temperatures even several times higher than the outside temperature, reaching up to 80 °C (Model A). Operation of an installation according to Model B decreases the temperature of the cells by approximately a dozen per cent, but mainly in the period from March to September. In the remaining period of time, due to the high temperature of the liquid in the DHW tank, the heat reception from the PV-T is limited. Operation of an installation according to Model C, in the period of the highest daily total horizontal radiation (May-August), does not decrease the temperature of the PV-T cells effectively, due to low cooling power of the applied heat pump (470 W) in relation to the stream of heat generated by the collector. This fact is also evident in Figure 6. Outside of this period, much lower temperatures than in Model A are observed (even lower than the ambient temperature). Throughout the year, the temperature of the cells is most effectively reduced in the proposed Model D.
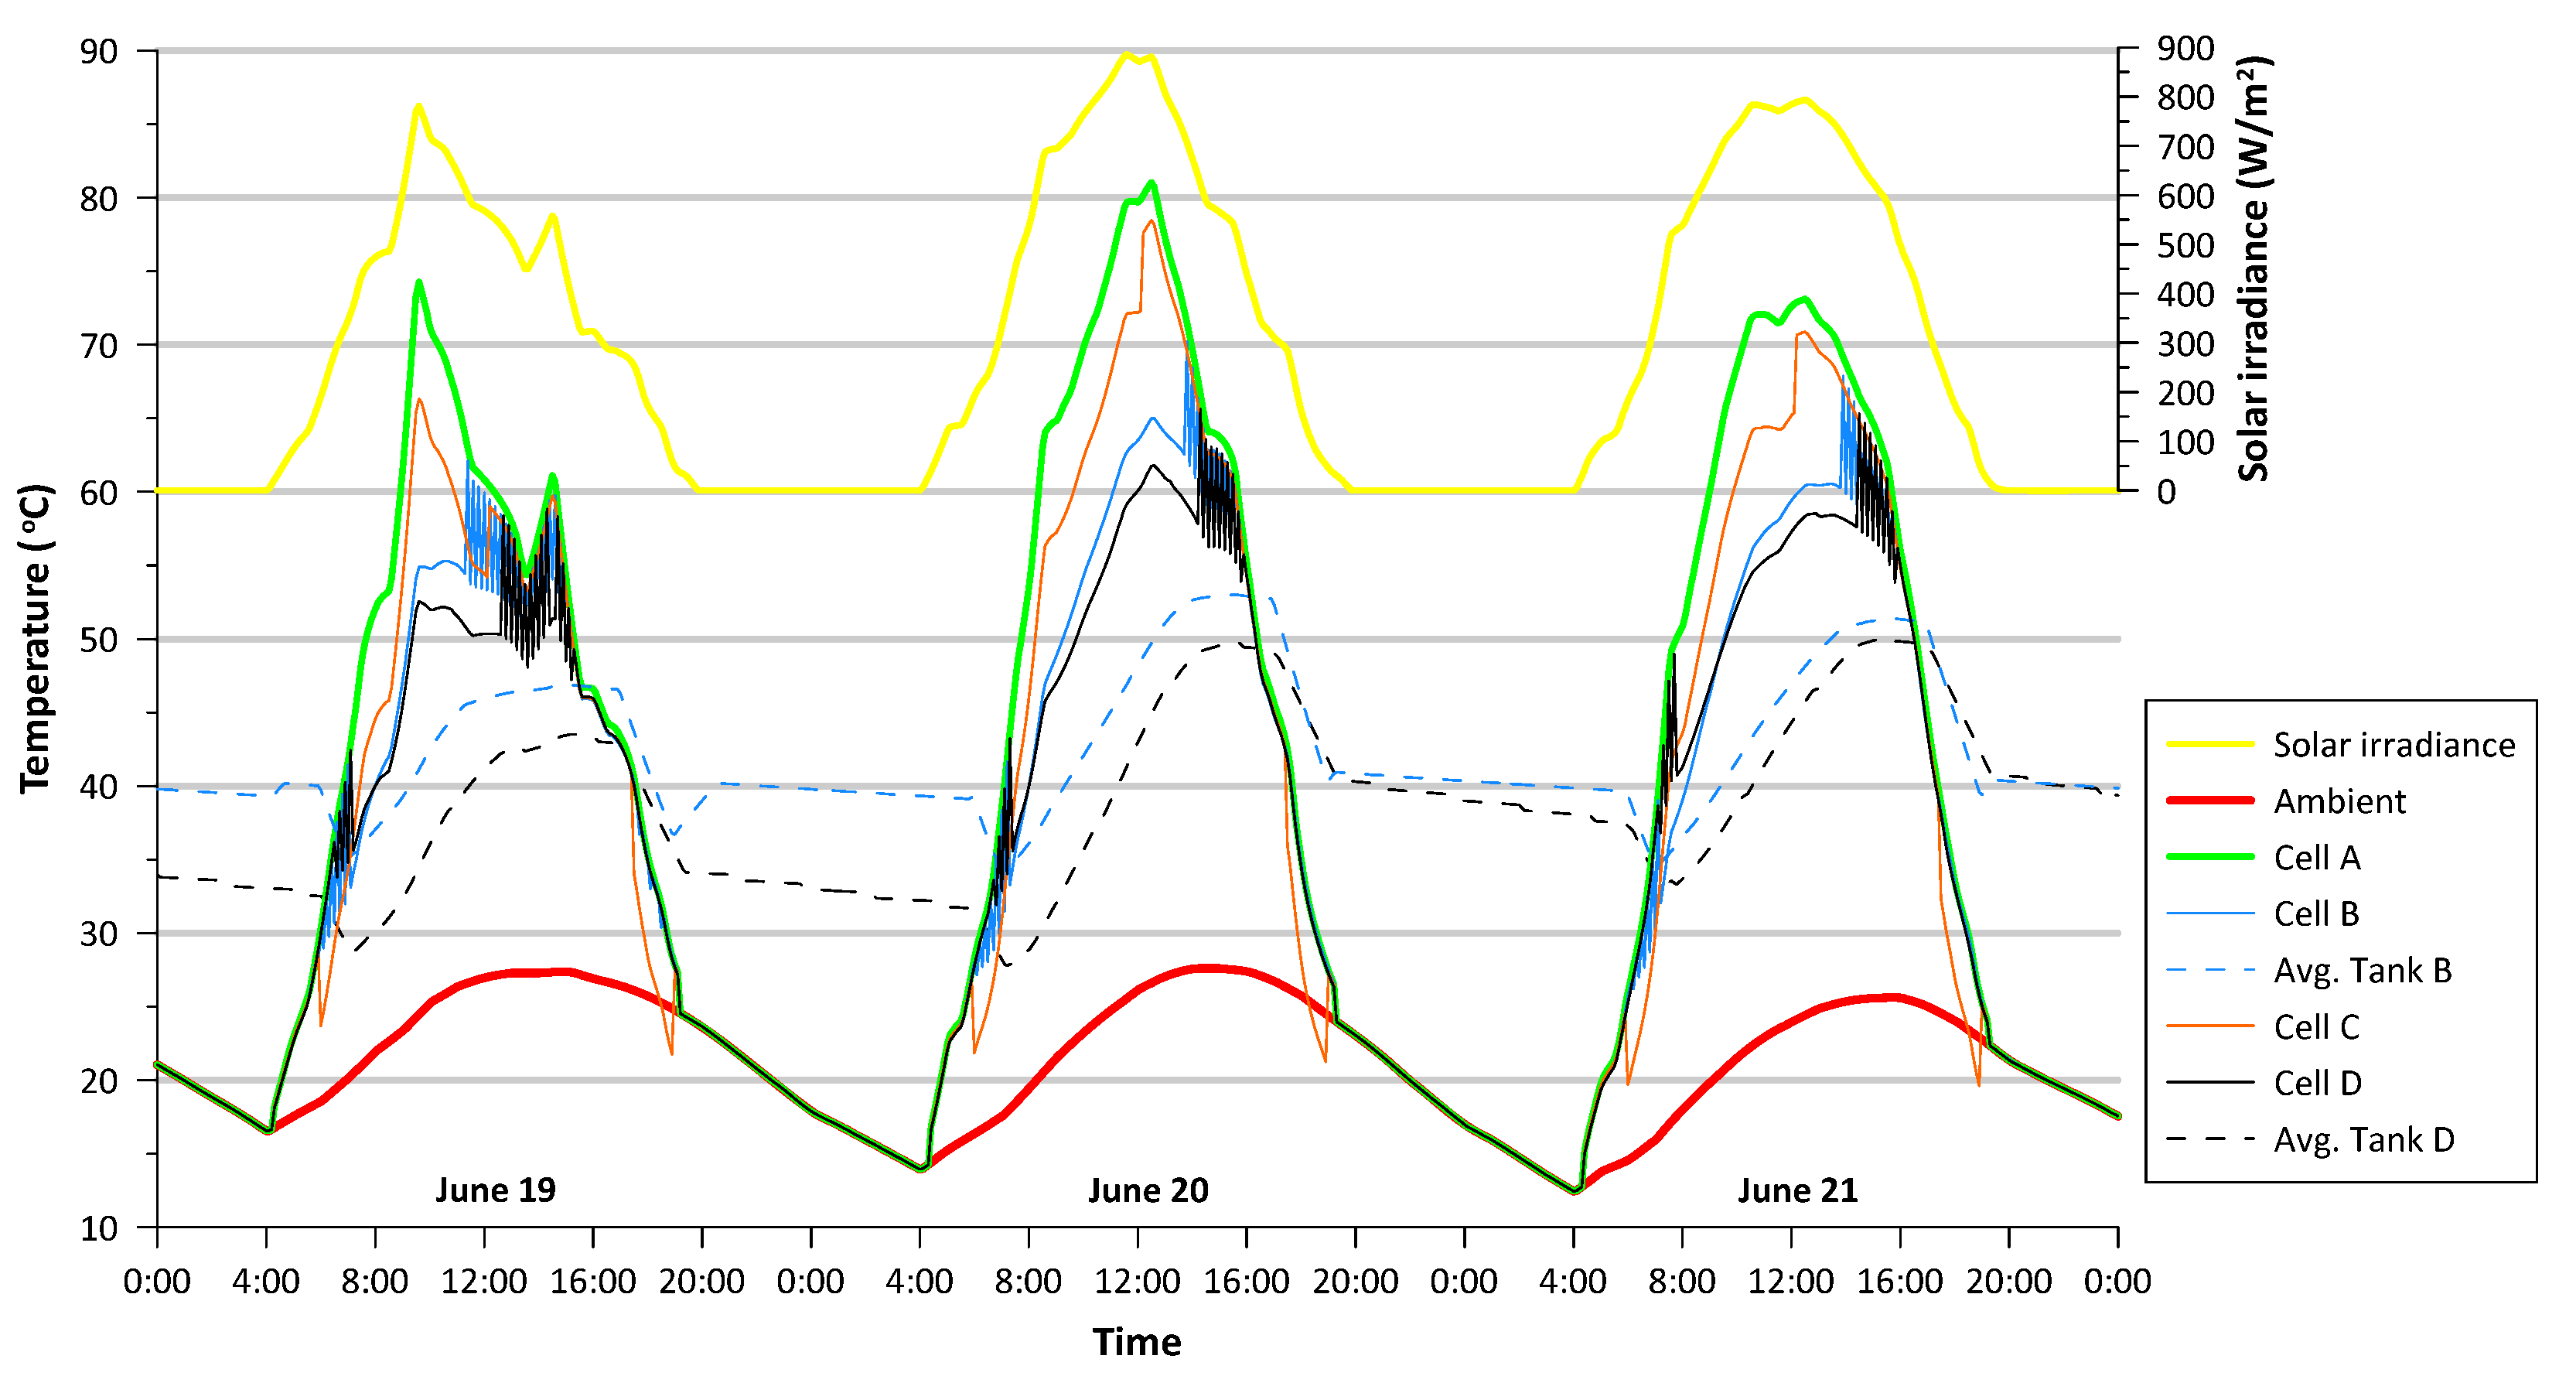
In Figure 6, changes in the average temperature of cells in the analyzed models on selected days 19–21 June are shown for β = 0.005 K−1 and other parameters enabling an easier interpretation of the presented simulation results. Cell temperatures in the PV-T for a solar irradiance value above 300 W/m2 were the lowest for Model D among all discussed models. It was achieved due to, among other things, a lower average fluid temperature in the tank (Avg. Tank D) in comparison to Model B. The reason for this is that the average temperature of the water in Tank D is controlled by a differential controller at a level not exceeding 50 °C. In Model B, there is no such limitation, therefore the temperature of the fluid is higher since each portion of the heat generated in PV-T is stored in the tank. Averaged temperature for Tank C is not included in Figure 6 since the tank is loaded with the energy produced by the heat pump. Including averaged temperature in Tank C in the graph could lead the reader to erroneous conclusions. The decrease in the average temperature in tanks B and D around 6:00 a.m. and 7:00 p.m. was caused by DHW consumption set in the Type 14b component. As was emphasized above, during high solar irradiance values, the temperature of the cells in the PV-T in Model C was slightly lower than in Model A, since the heat pump used in the installation was characterized by a constant cooling power. In future studies, a heat pump with power modulated in a broader range should be considered.
The data presented in Figure 4 are easier to interpret due to an analysis of the results shown in Figure 7. Annual variability of daily heat production in the considered models for β equal to 0.005 K−1 for Models B and D is similar to the daily total horizontal radiation distribution shown in Figure 1. Model B of the installation with PV-T makes much less use of the available solar radiation in the September–March period than Model D. On the other hand, in the April–August period, the heat generation values are lower by several kWh. The completely different nature of the installation in Model C is visible in the course of heat generation. In this installation, the heat pump runs continuously in the set time intervals, acquiring heat from the PV-T, which leads to a relatively constant amount of heat generation of approx. 3 kWh/day. During a lower daily total horizontal radiation, the obtained values of heat generation are lower. Noteworthy, in this model, is that heat can be obtained from the PV-T solar fluid even in a situation when solar radiation does not fall on the PV-T. During the winter period, it leads to a decrease in the temperature of the PV-T fluid, and in that of the photovoltaic cells, below the ambient temperature, which is evident in Figure 5 and Figure 6. Assuming that approx. 6.5 kWh of heat should be supplied daily to maintain the appropriate temperature in the DHW tank, the PV-T in the Model B installation was able to fully meet this demand for only five days a year. On the other hand, the Model D installation allowed for meeting this demand for 56 days.
In Models D and C, PV-Ts cooperated with heat pumps, for which the key parameter determining the efficiency of their operation is COP (coefficient of performance). It is calculated based on the ratio of the quantity of energy generated by the heat pump to the quantity of electrical energy consumed by it. In the simulations carried out, the annual average value of this parameter was approx. 2.41 for Model C and approx. 2.50 for Model D. The low COP value of the heat pumps is due to a mismatch between the heat pump’s heating power and PV-T power and using of a heat pump with constant cooling power.

4. Conclusions

In the presented paper, results of the operation of four model hybrid PV-T installations operating over a long period of time were analyzed. Its operation was simulated in the TRNSYS program for the selected location with the climatic conditions known as oceanic temperate. The influence of the installation’s configuration on the obtained temperatures of solar cells and, consequently, on the electric power produced by a PV-T and the amount of heat generated during one year was presented. The study also considered the influence of the cell temperature coefficient in the range 0.003–0.006 K−1 on the effectiveness of the PV-T.
The main conclusions of this research can be summarized as:
  • The absence of heat received from the solar fluid, particularly in the summer period, leads to cell temperatures even several times higher than the outside temperature;
  • Models C and D, in which the PV-T cooperated with a heat pump, allow for obtaining more heat and electricity from the PV-T in the long run than Model B, in which heat energy from the PV-T is transferred directly to the DHW tank;
  • Intensification of the heat collection process from the PV-T using a heat pump resulted in an increase in electricity production by 6% compared to the base model A.
  • For each installation model, the highest values of electricity production were obtained for β = 0.003 K−1, and the lowest—for β = 0.006 K−1.
  • The type of cell used may reduce the production of electricity from PV-T by up to 7% on an annual basis.
  • In temperate oceanic climate (Dfb sub-group in Köppen–Geiger climate classification system) the highest impact of β on electricity production in PV-T is visible in the months from May to September, i.e., during the highest daily total horizontal radiation achieved and the highest air temperatures.
  • A key element to improve the efficiency of the heat pump and increase the value of the seasonal COP is the appropriate adjustment of the devices in the hybrid installation.
The obtained research findings indicate possible methods for improving the effectiveness of PV-T operation in a long-term aspect. Further studies may concern a better adjustment of the heat pump operation to the PV-T collector in a hybrid system, modification of the heat pump’s heating power and, possibly, the use of a heat pump with modulated cooling power.

Funding

This research received no external funding.

Institutional Review Board Statement

Not applicable.

Informed Consent Statement

Not applicable.

Data Availability Statement

Data available on request.

Conflicts of Interest

The author declares no conflict of interest.

Nomenclature

β Temperature coefficient, K−1
COPCoefficient Of Performance
DHWDomestic Hot Water
η PV electrical efficiency
η T r e f is the module’s electrical efficiency at the reference temperature
PVPhotovoltaic Panels
PV-Thybrid PhotoVoltaic-Thermal collector
STCStandard Test Conditions
T c e l l PV cell temperature
T r e f reference temperature

Appendix A

Table A1. Short description of the components used in transient models based on [36,37].
ComponentShort Description
EquaThe equations statement allows variables to be defined as algebraic functions of constants, previously defined variables, and outputs.
Type 2bDifferential controller generates a control function (1 or 0) chosen as a function of the difference between upper and lower temperatures, compared with two dead band temperature differences.
Type14bThe time-dependent forcing function specifies the value of the water drawn at various times throughout one cycle.
Type14hTime-dependent forcing function has a behavior characterized by a repeated pattern. It is responsible for PV-T working priority during the day.
Type 15-6Weather data processor allows reading data at regular time intervals from an external weather data file and making it available to other TRNSYS components.
Type 24This component integrates a series of specified quantities over a period of time.
Type 50dIt simulates a PV-T with high complexity in the heat losses calculation.
Type 65aThe online graphics component displays chosen system variables during the simulation. Additionally, data sent to the online plotter are automatically once per time step saved in a defined external file.
Type 114These component models a single (constant) speed pump that is able to maintain a constant fluid outlet mass flow rate.
Type 122This component models a fluid boiler (auxiliary heater).
Type 156It simulates a fluid-filled, vertical, cylindrical, constant volume storage tank with an immersed coiled-tube heat exchanger.
Type 927These component models a single-stage water-to-water heat pump based on user-supplied data.

References

  1. Herez, A.; El Hage, H.; Lemenand, T.; Ramadan, M.; Khaled, M. Review on photovoltaic/thermal hybrid solar collectors: Classifications, applications and new systems. Sol. Energy 2020, 207, 1321–1347. [Google Scholar] [CrossRef]
  2. Pietrzak, M.B.; Igliński, B.; Kujawski, W.; Iwański, P. Energy Transition in Poland—Assessment of the Renewable Energy Sector. Energies 2021, 14, 2046. [Google Scholar] [CrossRef]
  3. Canales, F.A.; Jadwiszczak, P.; Jurasz, J.; Wdowikowski, M.; Ciapała, B.; Kaźmierczak, B. The impact of long-term changes in air temperature on renewable energy in Poland. Sci. Total Environ. 2020, 729, 138965. [Google Scholar] [CrossRef] [PubMed]
  4. Pounraj, P.; Prince Winston, D.; Kabeel, A.E.; Praveen Kumar, B.; Manokar, A.M.; Sathyamurthy, R.; Christabel, S.C. Experimental investigation on Peltier based hybrid PV/T active solar still for enhancing the overall performance. Energy Convers. Manag. 2018, 168, 371–381. [Google Scholar] [CrossRef]
  5. Calise, F.; Figaj, R.; Vanoli, L. Experimental and Numerical Analyses of a Flat Plate Photovoltaic/Thermal Solar Collector. Energies 2017, 10, 491. [Google Scholar] [CrossRef] [Green Version]
  6. Lämmle, M.; Hermann, M.; Kramer, K.; Panzer, C.; Piekarczyk, A.; Thoma, C.; Fahr, S. Development of highly efficient, glazed PVT collectors with overheating protection to increase reliability and enhance energy yields. Sol. Energy 2018, 176, 87–97. [Google Scholar] [CrossRef]
  7. Chow, T.T. Performance analysis of photovoltaic-thermal collector by explicit dynamic model. Sol. Energy 2003, 75, 143–152. [Google Scholar] [CrossRef]
  8. Barbu, M.; Darie, G.; Siroux, M. A Parametric Study of a Hybrid Photovoltaic Thermal (PVT) System Coupled with a Domestic Hot Water (DHW) Storage Tank. Energies 2020, 13, 6481. [Google Scholar] [CrossRef]
  9. Bandaru, S.H.; Becerra, V.; Khanna, S.; Radulovic, J.; Hutchinson, D.; Khusainov, R. A Review of Photovoltaic Thermal (PVT) Technology for Residential Applications: Performance Indicators, Progress, and Opportunities. Energies 2021, 14, 3853. [Google Scholar] [CrossRef]
  10. Ul Abdin, Z.; Rachid, A. A Survey on Applications of Hybrid PV/T Panels. Energies 2021, 14, 1205. [Google Scholar] [CrossRef]
  11. Fu, Z.; Li, Y.; Liang, X.; Lou, S.; Qiu, Z.; Cheng, Z.; Zhu, Q. Experimental investigation on the enhanced performance of a solar PVT system using micro-encapsulated PCMs. Energy 2021, 228, 120509. [Google Scholar] [CrossRef]
  12. Klugmann-Radziemska, E.; Wcisło-Kucharek, P. Photovoltaic module temperature stabilization with the use of phase change materials. Sol. Energy 2017, 150, 538–545. [Google Scholar] [CrossRef]
  13. Hemmat Esfe, M.; Kamyab, M.H.; Valadkhani, M. Application of nanofluids and fluids in photovoltaic thermal system: An updated review. Sol. Energy 2020, 199, 796–818. [Google Scholar] [CrossRef]
  14. Abbas, N.; Awan, M.B.; Amer, M.; Ammar, S.M.; Sajjad, U.; Ali, H.M.; Zahra, N.; Hussain, M.; Badshah, M.A.; Jafry, A.T. Applications of nanofluids in photovoltaic thermal systems: A review of recent advances. Phys. A Stat. Mech. Its Appl. 2019, 536, 122513. [Google Scholar] [CrossRef]
  15. Adun, H.; Mukhtar, M.; Adedeji, M.; Agwa, T.; Ibrahim, K.H.; Bamisile, O.; Dagbasi, M. Synthesis and application of ternary nanofluid for photovoltaic-thermal system: Comparative analysis of energy and exergy performance with single and hybrid nanofluids. Energies 2021, 14, 4434. [Google Scholar] [CrossRef]
  16. Sakellariou, E.I.; Wright, A.J.; Axaopoulos, P.; Oyinlola, M.A. PVT based solar assisted ground source heat pump system: Modelling approach and sensitivity analyses. Sol. Energy 2019, 193, 37–50. [Google Scholar] [CrossRef]
  17. Jonas, D.; Lämmle, M.; Theis, D.; Schneider, S.; Frey, G. Performance modeling of PVT collectors: Implementation, validation and parameter identification approach using TRNSYS. Sol. Energy 2019, 193, 51–64. [Google Scholar] [CrossRef]
  18. Rezvanpour, M.; Borooghani, D.; Torabi, F.; Pazoki, M. Using CaCl2·6H2O as a phase change material for thermo-regulation and enhancing photovoltaic panels’ conversion efficiency: Experimental study and TRNSYS validation. Renew. Energy 2020, 146, 1907–1921. [Google Scholar] [CrossRef]
  19. Zarrella, A.; Emmi, G.; Vivian, J.; Croci, L.; Besagni, G. The validation of a novel lumped parameter model for photovoltaic thermal hybrid solar collectors: A new TRNSYS type. Energy Convers. Manag. 2019, 188, 414–428. [Google Scholar] [CrossRef]
  20. Atmaca, M.; Pektemir, İ.Z. An Investigation on the Effect of the Total Efficiency of Water and Air Used Together as a Working Fluid in the Photovoltaic Thermal Systems. Processes 2019, 7, 516. [Google Scholar] [CrossRef] [Green Version]
  21. Khalili, N.N.W.; Othman, M.; Abu Bakar, M.N.; Abdullah, L. Modelling of a Single Passage Air PV/T Solar Collector: Experimental and Simulation Design. Processes 2020, 8, 763. [Google Scholar] [CrossRef]
  22. Pater, S. Field measurements and energy performance analysis of renewable energy source devices in a heating and cooling system in a residential building in southern Poland. Energy Build. 2019, 199, 115–125. [Google Scholar] [CrossRef]
  23. Mazzeo, D.; Oliveti, G.; Baglivo, C.; Congedo, P.M. Energy reliability-constrained method for the multi-objective optimization of a photovoltaic-wind hybrid system with battery storage. Energy 2018, 156, 688–708. [Google Scholar] [CrossRef]
  24. He, W.; Tao, L.; Han, L.; Sun, Y.; Campana, P.E.; Yan, J. Optimal analysis of a hybrid renewable power system for a remote island. Renew. Energy 2021, 179, 96–104. [Google Scholar] [CrossRef]
  25. Ammari, C.; Belatrache, D.; Touhami, B.; Makhloufi, S. Sizing, optimization, control and energy management of hybrid renewable energy system—A review. Energy Built Environ. 2021. [Google Scholar] [CrossRef]
  26. Tripathi, R.; Bhatti, T.S.; Tiwari, G.N. Effect of packing factor on electrical and overall energy generation through low concentrated photovoltaic thermal collector in composite climate condition. Mater. Today Proc. 2020, 31, 449–453. [Google Scholar] [CrossRef]
  27. Ji, J.; Han, J.; Chow, T.T.; Yi, H.; Lu, J.; He, W.; Sun, W. Effect of fluid flow and packing factor on energy performance of a wall-mounted hybrid photovoltaic/water-heating collector system. Energy Build. 2006, 38, 1380–1387. [Google Scholar] [CrossRef]
  28. Farghally, H.M.; Ahmed, N.M.; El-Madany, H.T.; Atia, D.M.; Fahmy, F.H. Design and Sensitivity Analysis of Photovoltaic/Thermal Solar Collector. Int. Energy J. 2015, 15, 21–32. [Google Scholar]
  29. Pokorny, N.; Matuška, T. Glazed photovoltaic-thermal (PVT) collectors for domestic hotwater preparation in multifamily building. Sustainability 2020, 12, 6071. [Google Scholar] [CrossRef]
  30. Myhan, R.; Szturo, K.; Panfil, M.; Szwejkowski, Z. The Influence of Weather Conditions on the Optimal Setting of Photovoltaic Thermal Hybrid Solar Collectors—A Case Study. Energies 2020, 13, 4612. [Google Scholar] [CrossRef]
  31. Piliougine, M.; Oukaja, A.; Sidrach-de-Cardona, M.; Spagnuolo, G. Temperature coefficients of degraded crystalline silicon photovoltaic modules at outdoor conditions. Prog. Photovolt. Res. Appl. 2021, 29, 558–570. [Google Scholar] [CrossRef]
  32. Kamkird, P.; Ketjoy, N.; Rakwichian, W.; Sukchai, S. Investigation on Temperature Coefficients of Three Types Photovoltaic Module Technologies under Thailand Operating Condition. Procedia Eng. 2012, 32, 376–383. [Google Scholar] [CrossRef] [Green Version]
  33. Dupré, O.; Vaillon, R.; Green, M.A. Physics of the temperature coefficients of solar cells. Sol. Energy Mater. Sol. Cells 2015, 140, 92–100. [Google Scholar] [CrossRef]
  34. Smith, P. Study of temperature coefficients for parameters of photovoltaic cells. Int. J. Photoenergy 2018, 2018, 77–86. [Google Scholar] [CrossRef] [Green Version]
  35. Dubey, S.; Sarvaiya, J.N.; Seshadri, B. Temperature Dependent Photovoltaic (PV) Efficiency and Its Effect on PV Production in the World—A Review. Energy Procedia 2013, 33, 311–321. [Google Scholar] [CrossRef] [Green Version]
  36. Solar Energy Laboratory. Volume 3 Component Library Overview. In Trnsys 18-a. TRaNsient SYstem Simulation Program; University of Wisconsin-Madison and Thermal Energy System Specialists: Madison, WI, USA, 2017. [Google Scholar]
  37. Solar Energy Laboratory. Volume 4 Mathematical Reference. In Trnsys 18-a. TRaNsient SYstem Simulation Program; University of Wisconsin-Madison and Thermal Energy System Specialists: Madison, WI, USA, 2017. [Google Scholar]
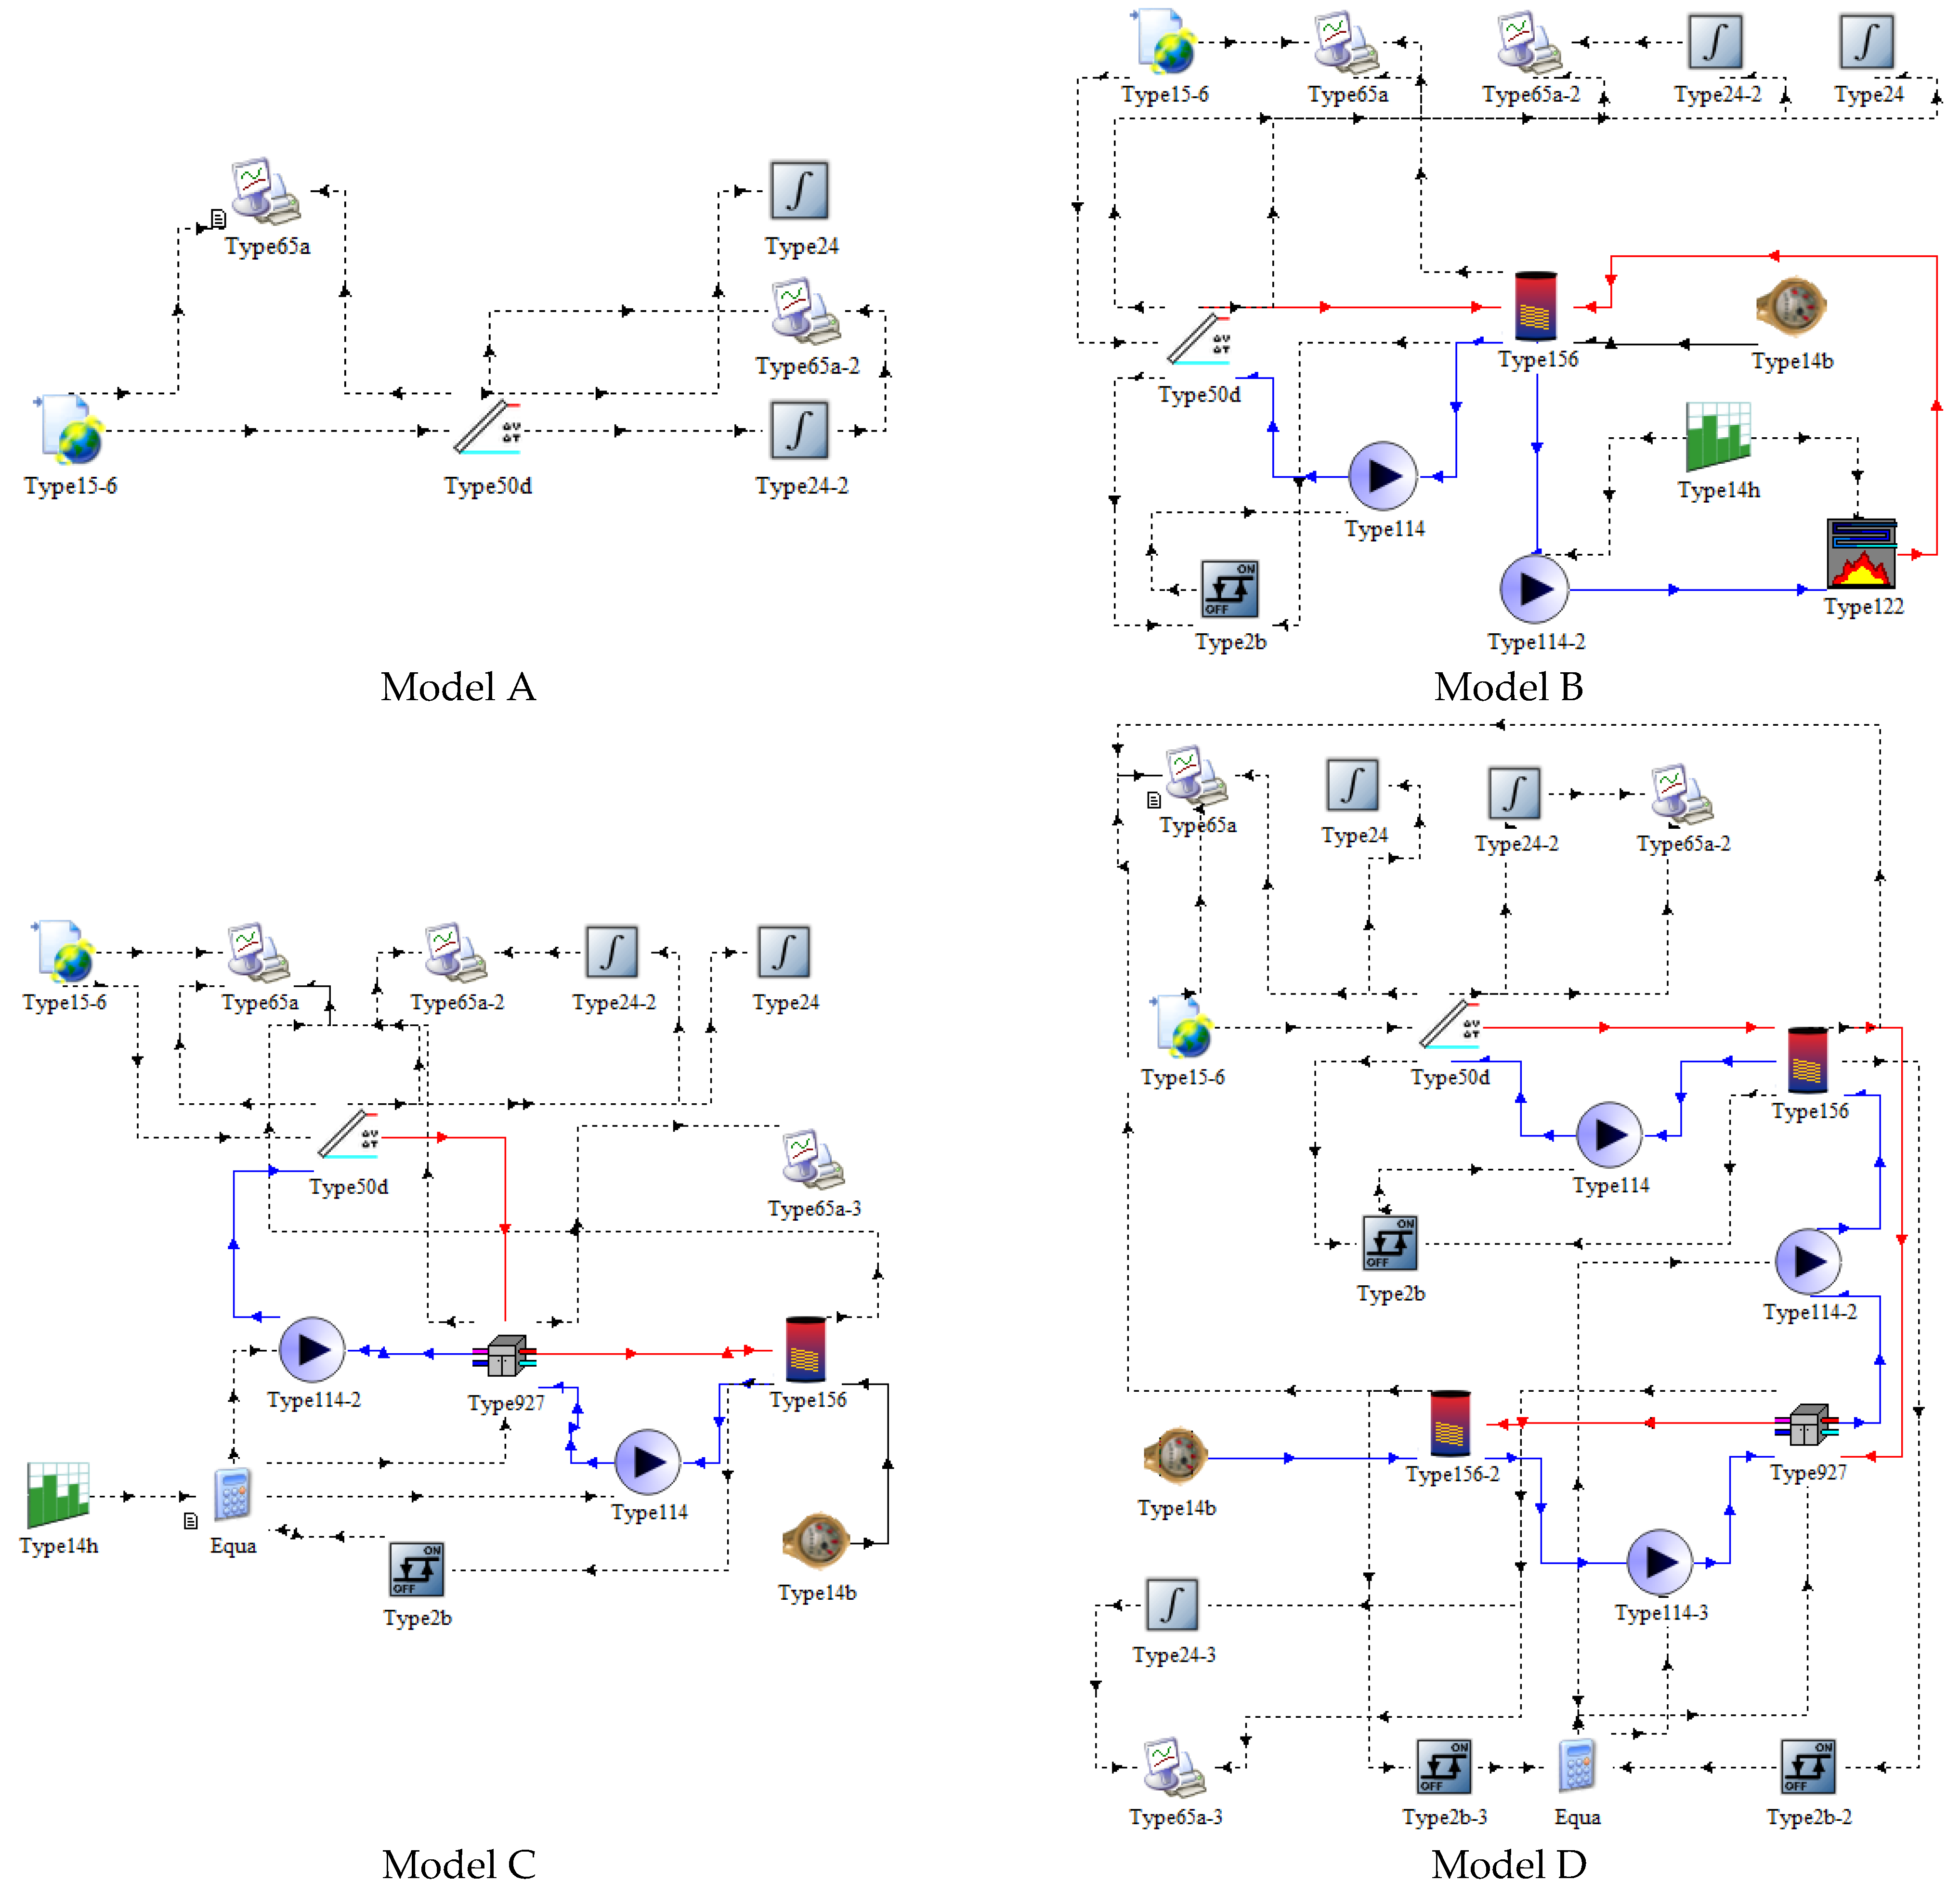
Figure 1. Meteorological data from Meteonorn TM2 database for a typical year in Krakow.
Energies 14 06921 g001
Figure 2. TRNSYS models of analyzed systems.
Energies 14 06921 g002
Figure 3. Electrical energy production in analyzed models of systems with PV-T.
Energies 14 06921 g003
Figure 4. Electricity and heat production in analyzed models.
Energies 14 06921 g004
Figure 5. Changes of average cell temperature for   β equal 0.005: (a) Models A and B; (b) Models C and D.
Energies 14 06921 g005
Figure 6. Average cell temperature changes in models on 19–21 June for   β equal 0.005 K−1.
Energies 14 06921 g006
Figure 7. Annual variability of daily heat production by PV-T in the considered models.
Energies 14 06921 g007
Table 1. PV-T main settings common to all models in TRNSYS.
ParametersValueUnit
Collector area6m2
Collector efficiency factor0.7-
Collector plate absorptance0.9-
Number of glass covers1-
Loss coefficient for bottom and edge losses5.56W/(m2·K)
Collector slope34°
Packing factor0.6-
Cell efficiency at reference conditions0.2-
Publisher’s Note: MDPI stays neutral with regard to jurisdictional claims in published maps and institutional affiliations.