Article

Old and Modern Wooden Buildings in the Context of Sustainable Development

by
Dariusz Bajno
1,
Agnieszka Grzybowska
1,* and
Łukasz Bednarz
2
1
Department of Building Structures, Faculty of Civil and Environmental Engineering and Architecture, Bydgoszcz University of Science and Technology, 85-796 Bydgoszcz, Poland
2
Department of Building Structures, Faculty of Civil Engineering, Wroclaw University of Science and Technology, 50-370 Wrocław, Poland
*
Author to whom correspondence should be addressed.
Energies 2021, 14(18), 5975; https://doi.org/10.3390/en14185975
Submission received: 12 August 2021 / Revised: 12 September 2021 / Accepted: 17 September 2021 / Published: 20 September 2021

Abstract

:
Construction is a powerful industry that is not indifferent to the environment. Neither the maintenance of buildings in a proper technical condition nor their eventual demolition is indifferent to the environment. The main threats to the environment are still the inefficient use of construction materials and energy needed for their production and installation, as well as the emission of harmful substances to the environment at the stage of operation of buildings and their demolition. This article discusses the importance of wood as a renewable material in terms of its physical and mechanical properties. The restoration of forest areas is of great importance to the global ecosystem and the sustainable development system, reducing the threat of global warming and the greenhouse effect by reducing CO2 levels. In addition, demolition wood can be reused in construction, can be safely recycled as it quickly decomposes, or can be used as a source of renewable energy. The preservation of existing timber-framed buildings in good condition contributes to a lower consumption of this raw material for repair, which already significantly reduces the energy required for their manufacture, transport, and assembly. This also reduces the amount of waste that would have to be disposed of in various ways. Both at the stage of design, execution, and then exploitation, one forgets about the physical processes taking place inside the partitions and about the external climatic influences of the environment (precipitation, water vapor, and temperature) on which the type, intensity, and extent of chemical and biological corrosion depend to a very high degree. This paper presents examples of the influence of such impacts on the operational safety of three selected objects: a feed storehouse and an officer casino building from the second half of the nineteenth century and an 18th century rural homestead building. The research carried out on wooden structures of the above-mentioned objects “in situ” was verified by means of simulation models, which presented their initial and current technical conditions in relation to the type and amount of impact they should safely absorb. Moreover, within the framework of this paper, artificial intelligence methods have been implemented to predict the biological corrosion of the structures studied. The aim of the paper was to draw attention to the timber already built into buildings, which may constitute waste even after several years of operation, requiring disposal and at the same time the production of a substitute. The purpose of the research carried out by the authors of the article was to examine the older and newer buildings in use, the structures of which, in whole or in part, were made of wood. On a global scale, there will be considerable demand for the energy required to thermally dispose of this waste or to deposit it in landfills with very limited capacity until its complete biological decomposition. These energy demands and greenhouse gas emissions can be prevented by effective diagnostics of such structures and the predictability of their behaviour over time, with respect to the conditions under which they are operated. The authors of the article, during each assessment of the technical condition of a building containing wooden elements, analysed the condition of their protection each time and predicted the period of their safe life without the need for additional reinforcements or replacement by others. As the later reality shows, it is a very effective method of saving money and energy.

1. Introduction

Wood is commonly regarded one of the least durable building materials. Very often, it does not show outward signs of biological degradation or other forms of excessive technical wear, regardless of its age, which is not an interpretation of its generally understood usefulness in terms of construction and use. Contrary to appearance, the problem is very wide and important, and its importance is increased by the social unawareness of the existence of the above-mentioned threats in our surroundings, mainly in buildings that appear massive and safe. The poor technical condition of wood is often the cause of construction disasters. Most often, the danger, which is not visible, concerns, e.g., ceiling joists that have lost their support on the walls due to corrosion of their ends. In these places, these elements are practically not examined, and these are the locations of the greatest threats to them, while the extent of the damage to the wood is usually revealed at the time of a building catastrophe or replacement of these structures with new ones (identical or different). Therefore, this problem should be considered a research problem that requires an urgent and comprehensive solution, not only because of the saving the historical value of some buildings and structures, but first of all because of the operational safety of the buildings and structures in use. The loss of secure support for beams in masonry practically entails their complete replacement, as well as the replacement of damaged adjacent beams and the bottom and top layers of floor finishes. Restricting oneself to the replacement of damaged sections runs the risk of underestimating the extent of the wood infestation. A proper diagnosis of these elements should ensure their safe operation and the savings associated with minimising the necessary reinforcement, replacement, or restoration of directly infested and adjacent elements. Therefore, the question should be asked whether prevention is preferable to salvage, replacement, or dismantling and disposal? In the opinion of the authors of the article, it is always preferable to make a thorough and detailed examination of the structure (especially in the most vulnerable places, although usually difficult to access) rather than to build in new elements, which must first be manufactured. It is undeniable that the prolonged and safe use of the structure (not only in terms of age and technology) contributes to a reduction in the need for new raw materials, which at the same time significantly reduces energy consumption, necessary in the process of transport, production, erection, repair, and recovery of entire buildings or their parts.
The operational efficiency of traditional timber structures, as well as their impact on ecology and the reduction in energy consumption, have been addressed in numerous studies, for example, refs. [1,2,3,4]. Research indicates the potential for reducing energy consumption and construction costs and confirms that low-energy wooden buildings are technically feasible and maintainable at affordable construction costs by using innovative design processes and procurement models that enable scalable and modular production. Energy efficiency solutions are also achieved through the appropriate choice of envelope insulation parameters (external and internal) and thickness based on relevant knowledge, specialist research, and analysis. Many researchers [5,6,7,8,9,10,11,12] agreed that to reduce the negative impact of buildings on excessive energy consumption and the environment, the implementation of efficient and already proven technologies, including those that use renewable energy sources, should be pursued through the careful development of detailed technical documentation [13,14]. Rey-Hernández et al. [15] analysed strategies for achieving nearly zero energy buildings (NZEB) in Spain and showed that the primary energy rate, renewable energy generation, and the renewable energy rate can be useful tools for the analysis of the energy of NZEB as required by European regulations. Garcia and Kranzl [16] analysed NZEB strategies in four EU countries and found that climate conditions, energy requirements, primary energy factors, ambition levels and calculation methodologies differ and are difficult to compare effectively.
The concept of sustainability emerged in the 1970s and is a complex relationship closely linked to environmental, economic, and social security [4,7,17,18,19,20,21,22,23]. As in other countries, EU legislation is being implemented in Poland to raise the profile of sustainable development as one of the most important objectives of the European Union [24,25,26,27,28].
The principle of sustainability in technological progress and the maintenance of existing resources means improving economic and social living conditions and preserving natural resources for future generations. Resource efficiency mainly involves the use of renewable energy sources and a high degree of recycling of demolition materials [29,30,31,32,33,34,35,36,37].
Sustainable construction is a movement that seeks to create energy-efficient buildings, in harmony with nature and the environment, and in efficient management of resources [35,36,37].
Global business models increasingly embrace social responsibility and sustainability. A sustainable renovation and investment process encompasses the creation of a complete life cycle of a building or structure—from the production, transport, and assembly of materials, to maintenance during operation, and then to the Life Cycle Assessment (LCA) group [18,19,20,21,38,39,40]. An essential aspect of sustainable development is the concept of sustainable energy, defined as an energy efficient way of producing and using energy that has less harmful effects on the environment [23,41,42,43,44,45,46,47,48].
Sustainable development meets the needs of the present without compromising the ability of future generations to achieve their goals. The building sector is responsible for the largest share of total energy consumption, and here are the greatest opportunities (reserves) to reduce energy consumption. Buildings account for more than 30% of total energy consumption. Due to rising energy prices and environmental pollution, energy savings has become one of the most important economic and political objectives since the late 1980s, so numerous efficiency-related regulations and support schemes have been introduced [23,37,40,44,46,48,49,50,51,52,53,54,55,56].
The possibility of using wood as one of the few ecologically renewable raw materials and, above all, its growing consumption place higher demands on its optimal use. The potential for European and global forest resources is steadily decreasing [57,58,59]. Wood has been a natural fuel that humans have used for thousands of years. The EU Green Book [28] “Towards a European strategy for the security of energy supply” states that “If appropriate measures are not taken, in the next 20 to 30 years approximately 70% of the Union’s energy needs, as opposed to the current 50%, will be met by imported products”. As an indigenous source of energy, wood can make a significant contribution to reducing it. The new, environmentally friendly approach is geared toward optimal forest management aimed at mitigating the effects of global climate change, including through appropriate stand regulation. Furthermore, the green economy increasingly emphasises the non-productive role of forests and the advantages of wood products in terms of carbon footprint [7,8,9,10,11,12]. Wood is one of the few building materials that is CO2 positive, which means that during its growth phase, wood absorbs more CO2 than is released during its preparation and use in actual construction processes. For this reason, wood as a renewable raw material resource will play an essential role in the sustainable economy sector. As the productive potential of forests will not increase at the expected rate, it will be inevitable to try to use the resources that are already embedded as long as possible. This approach will allow forests to be maintained as a natural carbon dioxide (CO2) reducer. The most common species of wood used in construction (in Europe) are spruce and pine, that is, coniferous species. Due to higher harvesting costs, difficulty in processing, and high susceptibility to cracking, deciduous wood is very rarely used for timber structures.
The authors of the article propose another form of raw material savings in the production of construction products and construction of entire buildings, closely related to energy savings and reduction in CO2 emissions through diagnostics and research prevention of wood-built materials (structures) and the creation of a secondary market of building materials (not only wood) intended for re-building after a prior determination of technical characteristics and degree of wear and tear [16,43,60,61,62,63,64,65,66,67,68,69,70,71,72,73,74,75,76,77]. The research in [39] has led to the development of general conclusions and recommendations for investors and designers of energy-efficient and environmentally friendly houses.
Former rural and low-rise urban buildings, or parts thereof (e.g., wall and ceiling structural elements), were based mainly on uniform timber structures. At present, they are still in use, although they are mostly only exhibits in open-air museums. Recently, a return to the construction of wooden buildings using the above-mentioned technology has been observed [1,39,40,70,78,79,80]. Many authors also focus on analysing the condition of historic buildings [81,82,83], in particular, timber structures [84,85], of cultural heritage. Innovative techniques and technologies are also proposed for diagnostic monitoring of the state of preservation [86,87].
The thermal mass of wood (Figure 1) is average compared to other materials commonly used in construction. The heat capacity of wood is more than twice that of concrete, but at the same time more than 10 times higher than insulating materials such as mineral wool and polystyrene, which is both an advantage and disadvantage. During warm and cold periods, it will be an ‘average’ heat regulator of the internal microclimate of rooms, accumulating it during warmer periods and giving it away during colder periods. Wood is also not a good heat insulator in light of the current requirements for building envelopes. Its thermal conductivity coefficient λ is in the range of 0.13 ÷ 0.22 W/(mK), which depends on the direction of heat flow, respectively, across and along the fibres. The thermal insulation properties of wood are 17 ÷ 11 times more favourable than those of concrete and 4 ÷ 6 times less favourable than those of mineral wool and foamed polystyrene. Wood is a good building material, but more as a structural element than as a thermal insulation layer of a partition.
The authors of the paper decided to assess the durability of exploitation and technical aspects of objects made in timber technology, taking buildings made at the turn of the 18th and 20th centuries as their research aim.
The aim s to draw attention to the timber already incorporated in building structures, which may constitute waste even after several years of operation, requiring disposal and at the same time the production of a replacement. The purpose of the research was to examine older and newer buildings in use, the structures of which are entirely or partly made of wood.

2. Materials and Methods

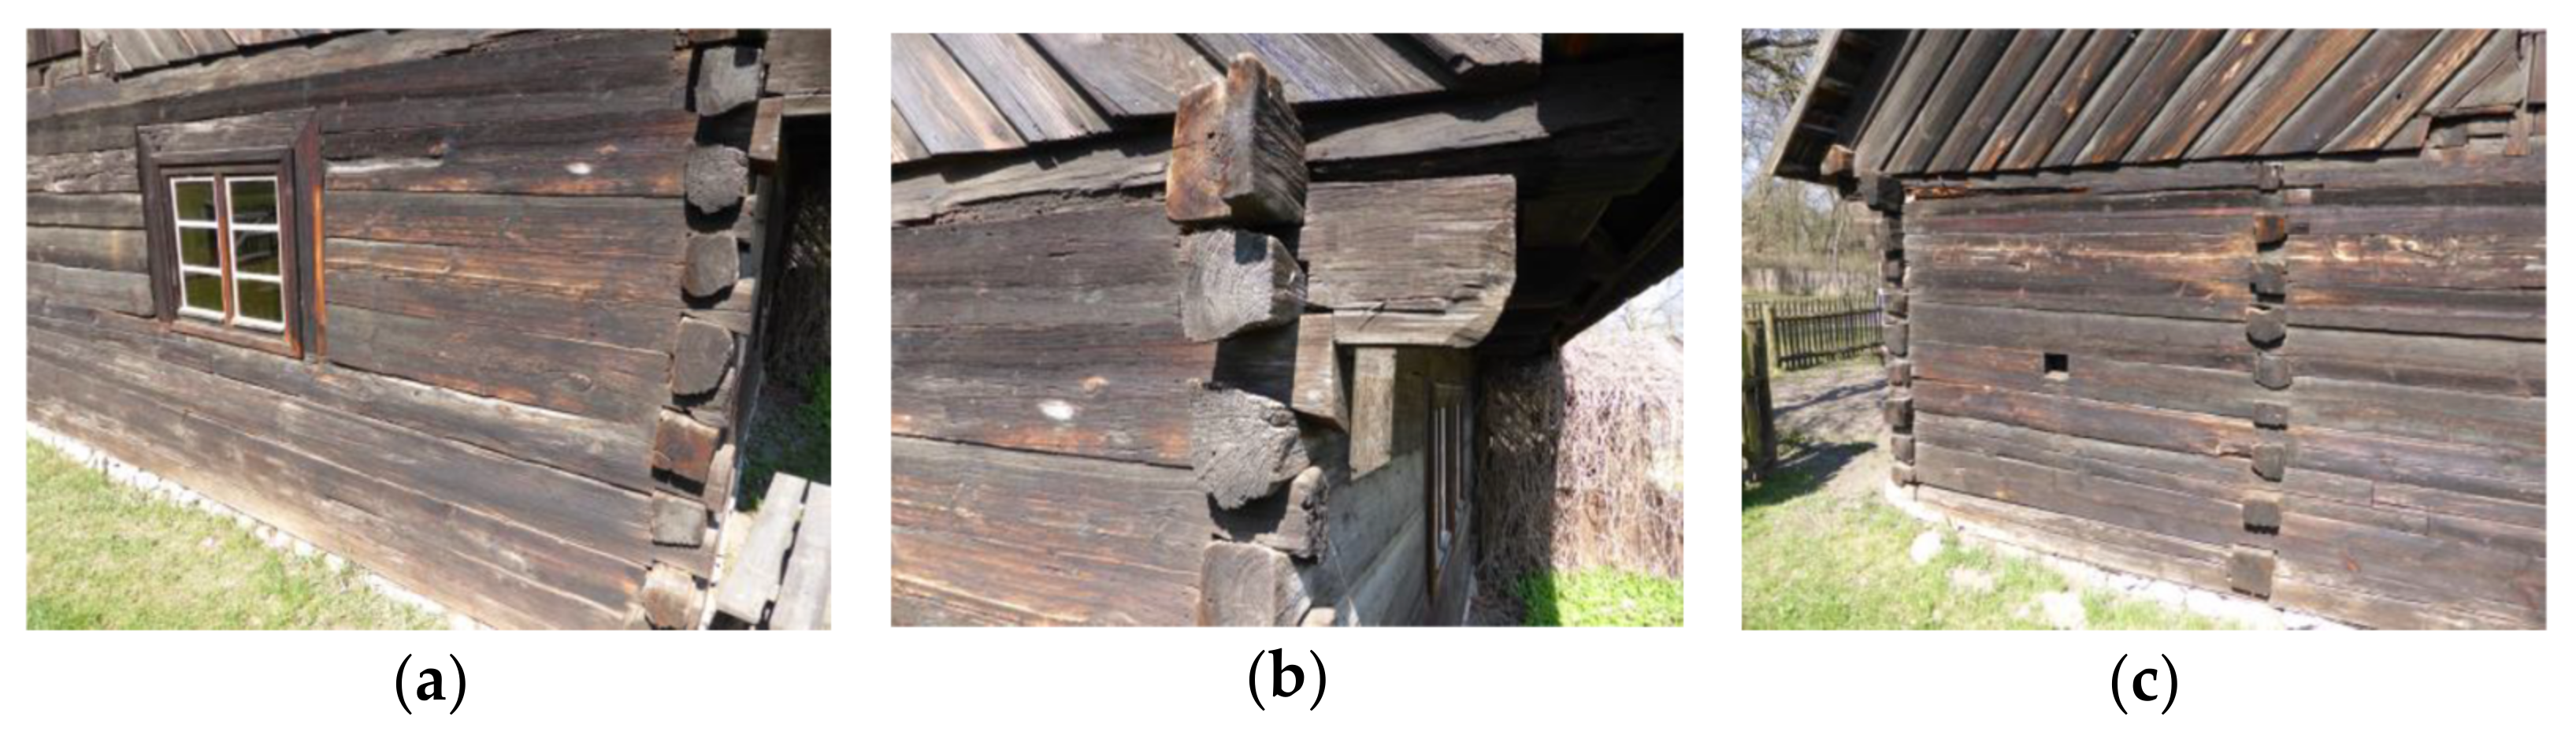
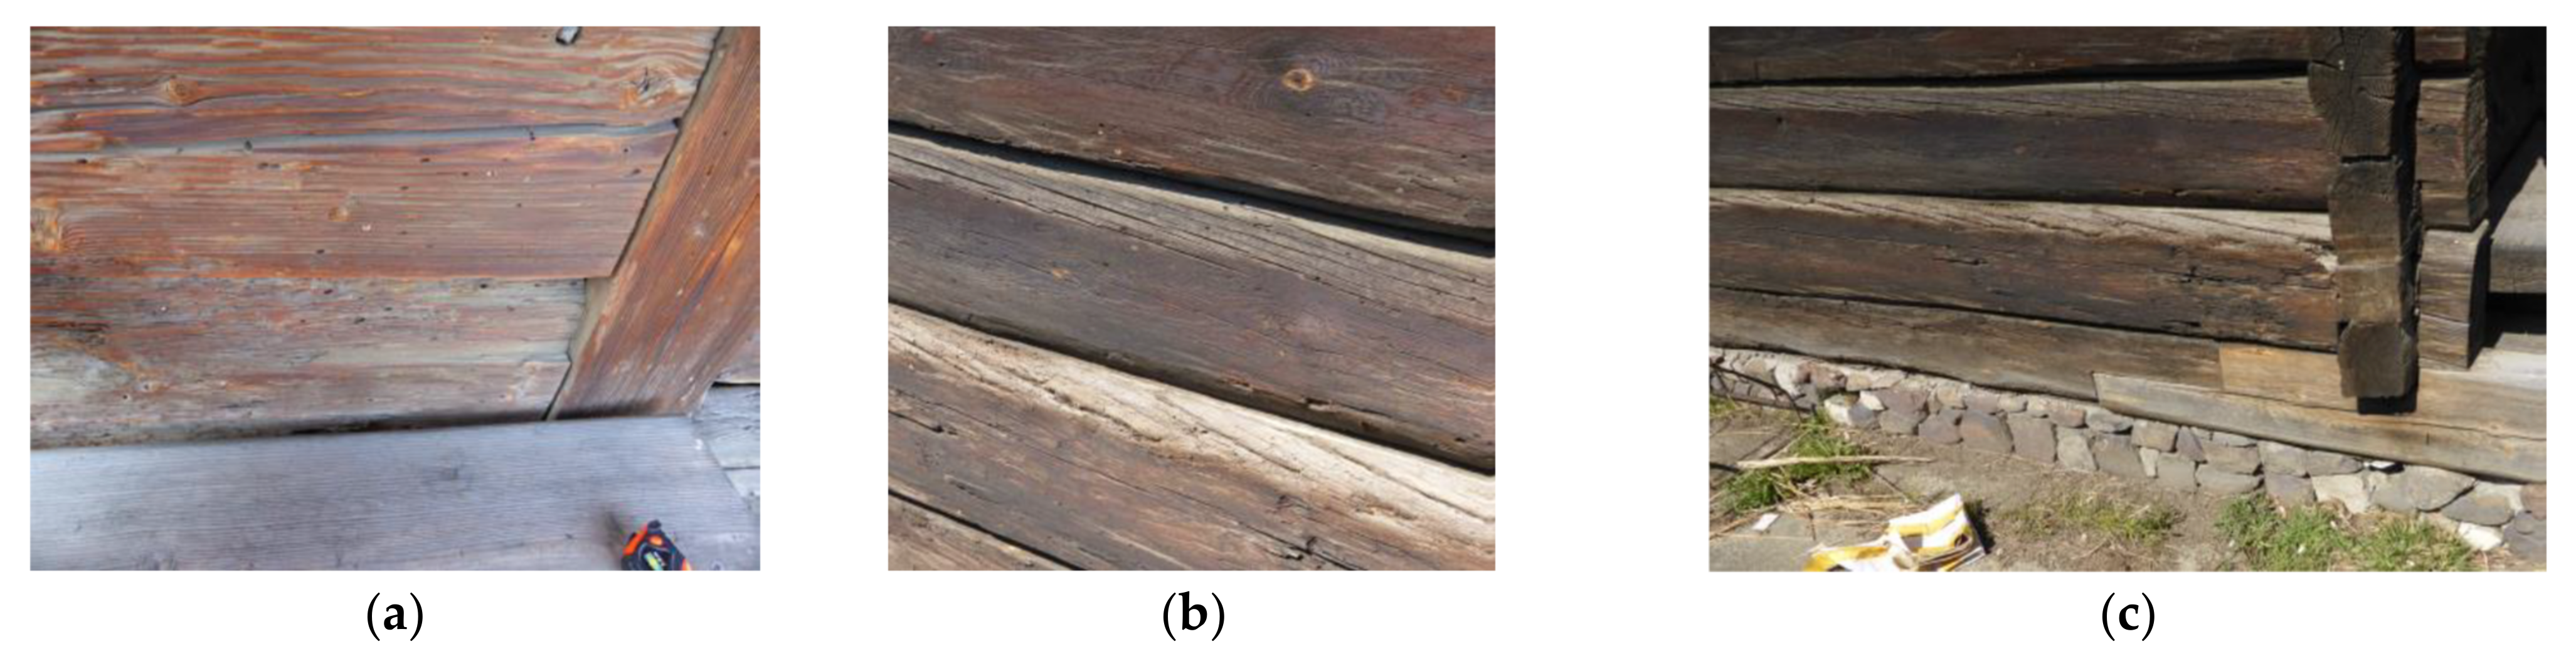
2.1. Most Common Damage to Structural Timber Members

The paper discusses an essential issue of unnoticed or even ignored phenomena related to the exploitation of heated buildings, including historic buildings. They are the result of heat- and moisture–exchange processes in external partitions in which building materials susceptible to biological corrosion (elements of floors and roofs) have been incorporated. These processes can be intensified, for example, by modernisation or just thermal modernisation of buildings. In fact, not every improvement in operating conditions may turn out to be the right one; in contrast, it can adversely affect the durability of these materials and, at the same time, the safety of the structure.
Figure 2 shows, based on [88], a typical wall and ceiling layout from the 19th and first half of the 20th century in residential and public buildings. Such buildings are now thermally modernised to reduce operating costs by limiting heat loss.
Historical buildings and monuments are constantly adapted to new needs and operating conditions. However, any ill-considered interference, even a seemingly insignificant one, such as thermal insulation of partitions (although monuments are not obliged to comply with the regulations concerning their thermal insulation), could, contrary to appearance, turn out to be irreversible if the physical processes taking place inside them are neglected, which could also lead to corrosion of the materials installed, locally increased heat losses, freezing, and moulds [70,89,90,91,92,93].
Many years of research and observation of the structures mentioned above have confirmed that irreversible damage was most often caused to the ends of the wooden ceiling joists embedded in the external walls (Figure 3). Most of the time, it only became apparent during a building disaster or when ceilings were replaced.
The durability of buildings, including historic structures, will depend primarily on the technical condition of the elements, protecting them from the impact of the external environment, the corrosion resistance of the materials used in their construction, and the effectiveness of the actions taken by those responsible for their maintenance. Not every remedial action may turn out to be correct, as it is not the momentary improvement of the parameters of an object and its elements that will prove their effectiveness, but their subsequent exploitation period. The article raises the issue of the possible effects of using certain thermomodernisation techniques in older buildings, and more specifically of insulating the envelope on its internal sides. In such (exceptional) situations, this will be the only way to improve the thermal performance of the envelope, although it will not be indifferent to which side the thermal insulation is located. For the majority of historic buildings, it will be impossible to obtain a conservator’s approval to carry out thermal upgrading of buildings from the external side, although this method should be considered reasonable and correct. To illustrate the problem, a model of the external wall described in Figure 2a was used, in which the ceiling beams of wooden (Figure 4) and iron (Steel—Figure 5) were embedded, i.e., made of materials used both today and in the past centuries.
In Figure 5(1b,2b), the temperature distribution fields bounded by the 0 °C isotherm are shown. The ends of the steel beams, being good conductors of heat, are located here in a temperature range of +10 °C in the uninsulated wall and +9 °C in the internally insulated wall. This isotherm configuration is very favourable for unprotected beams, although these areas generate considerable heat losses (Figure 6). The problem may be that the outer layer of masonry covering the ends of the beams is too thin and may not be sufficient to protect the iron (steel) from rainwater penetration and hence corrosion. However, leaving such buildings without adequate protection leads to significant and uncontrolled heat loss. There are still many such buildings in Central and Eastern Europe, which, due to their historical character, cannot be, e.g., insulated from the outside, while insulating the partitions in which they are located (from the inside) increases the problem of heat loss.
Figure 4 shows the temperature distribution in the cross-section of the facade wall of the 19th century with windows, in which the ends of the wooden ceiling joists were embedded for two variants: in the unaltered state and after internal insulation with a material with a thermal conductivity of λ ≤ 0.045 W/m2K and a thickness of 10 cm at an ambient temperature of tz = −10 °C and an internal air temperature of tw = +20 °C. Figure 7 shows the results of thermal imaging of an external wall, insulated inside with 10 cm thick mineral wool and finished with drywall, where its fixed steel frame is clearly visible (a model of the above wall is shown in Figure 4).
Figure 8 clearly shows the linear thermal bridge between two external walls, one insulated inside and the other outside. The temperature difference between the fully insulated surface and the corner (where the insulation is discontinuous) is approx. + 3.4 °C (the thermovision test was performed at tz = 0 °C, tw = +20 °C and φw = 50%).
Calculations carried out on a model of the envelope based on the standard [94] using Physibel Trisco v.12w software clearly indicated the possibility of cyclic loading of the ends of floor joists embedded in external walls with negative temperature (Figure 4(1a,b,2a,b)). The condensation of moisture within the envelope caused by the temperature difference on both sides during the autumn–winter period and its subsequent drying out during the spring–summer period will not be indifferent to the wood embedded in the masonry, which is at risk of biological corrosion. Furthermore, soggy timber in the low temperature zone of −6 °C (Figure 4(1a,b)) and −8 °C with an insulated wall (Figure 4(2a)) will be exposed to frost damage and its fluctuating moisture content causing swelling and shrinkage may permanently damage it. Wood may also undergo brown decay caused by basidiomycosis, followed by brown staining and spalting (Figure 3).
Temperature distribution and moisture migration within a building envelope will always be the determining factors for its serviceability and durability. Current European regulations require complete elimination of moisture, the probability of surface condensation of moisture in rooms, the moisture caused by condensation over the years, and corrosion of materials installed in partitions. Insulation of partitions on their internal sides will considerably improve their thermal insulation parameters and the microclimate of rooms, but an incompetent application of this method, without justification by appropriate thermal and moisture calculations, will lead to the opposite effect than expected, with a high probability of their damage and built-in materials with low resistance to biological corrosion. Physical phenomena occurring inside building envelopes, including historic buildings, should always be taken into account to protect them from partial or total degradation (Figure 3).

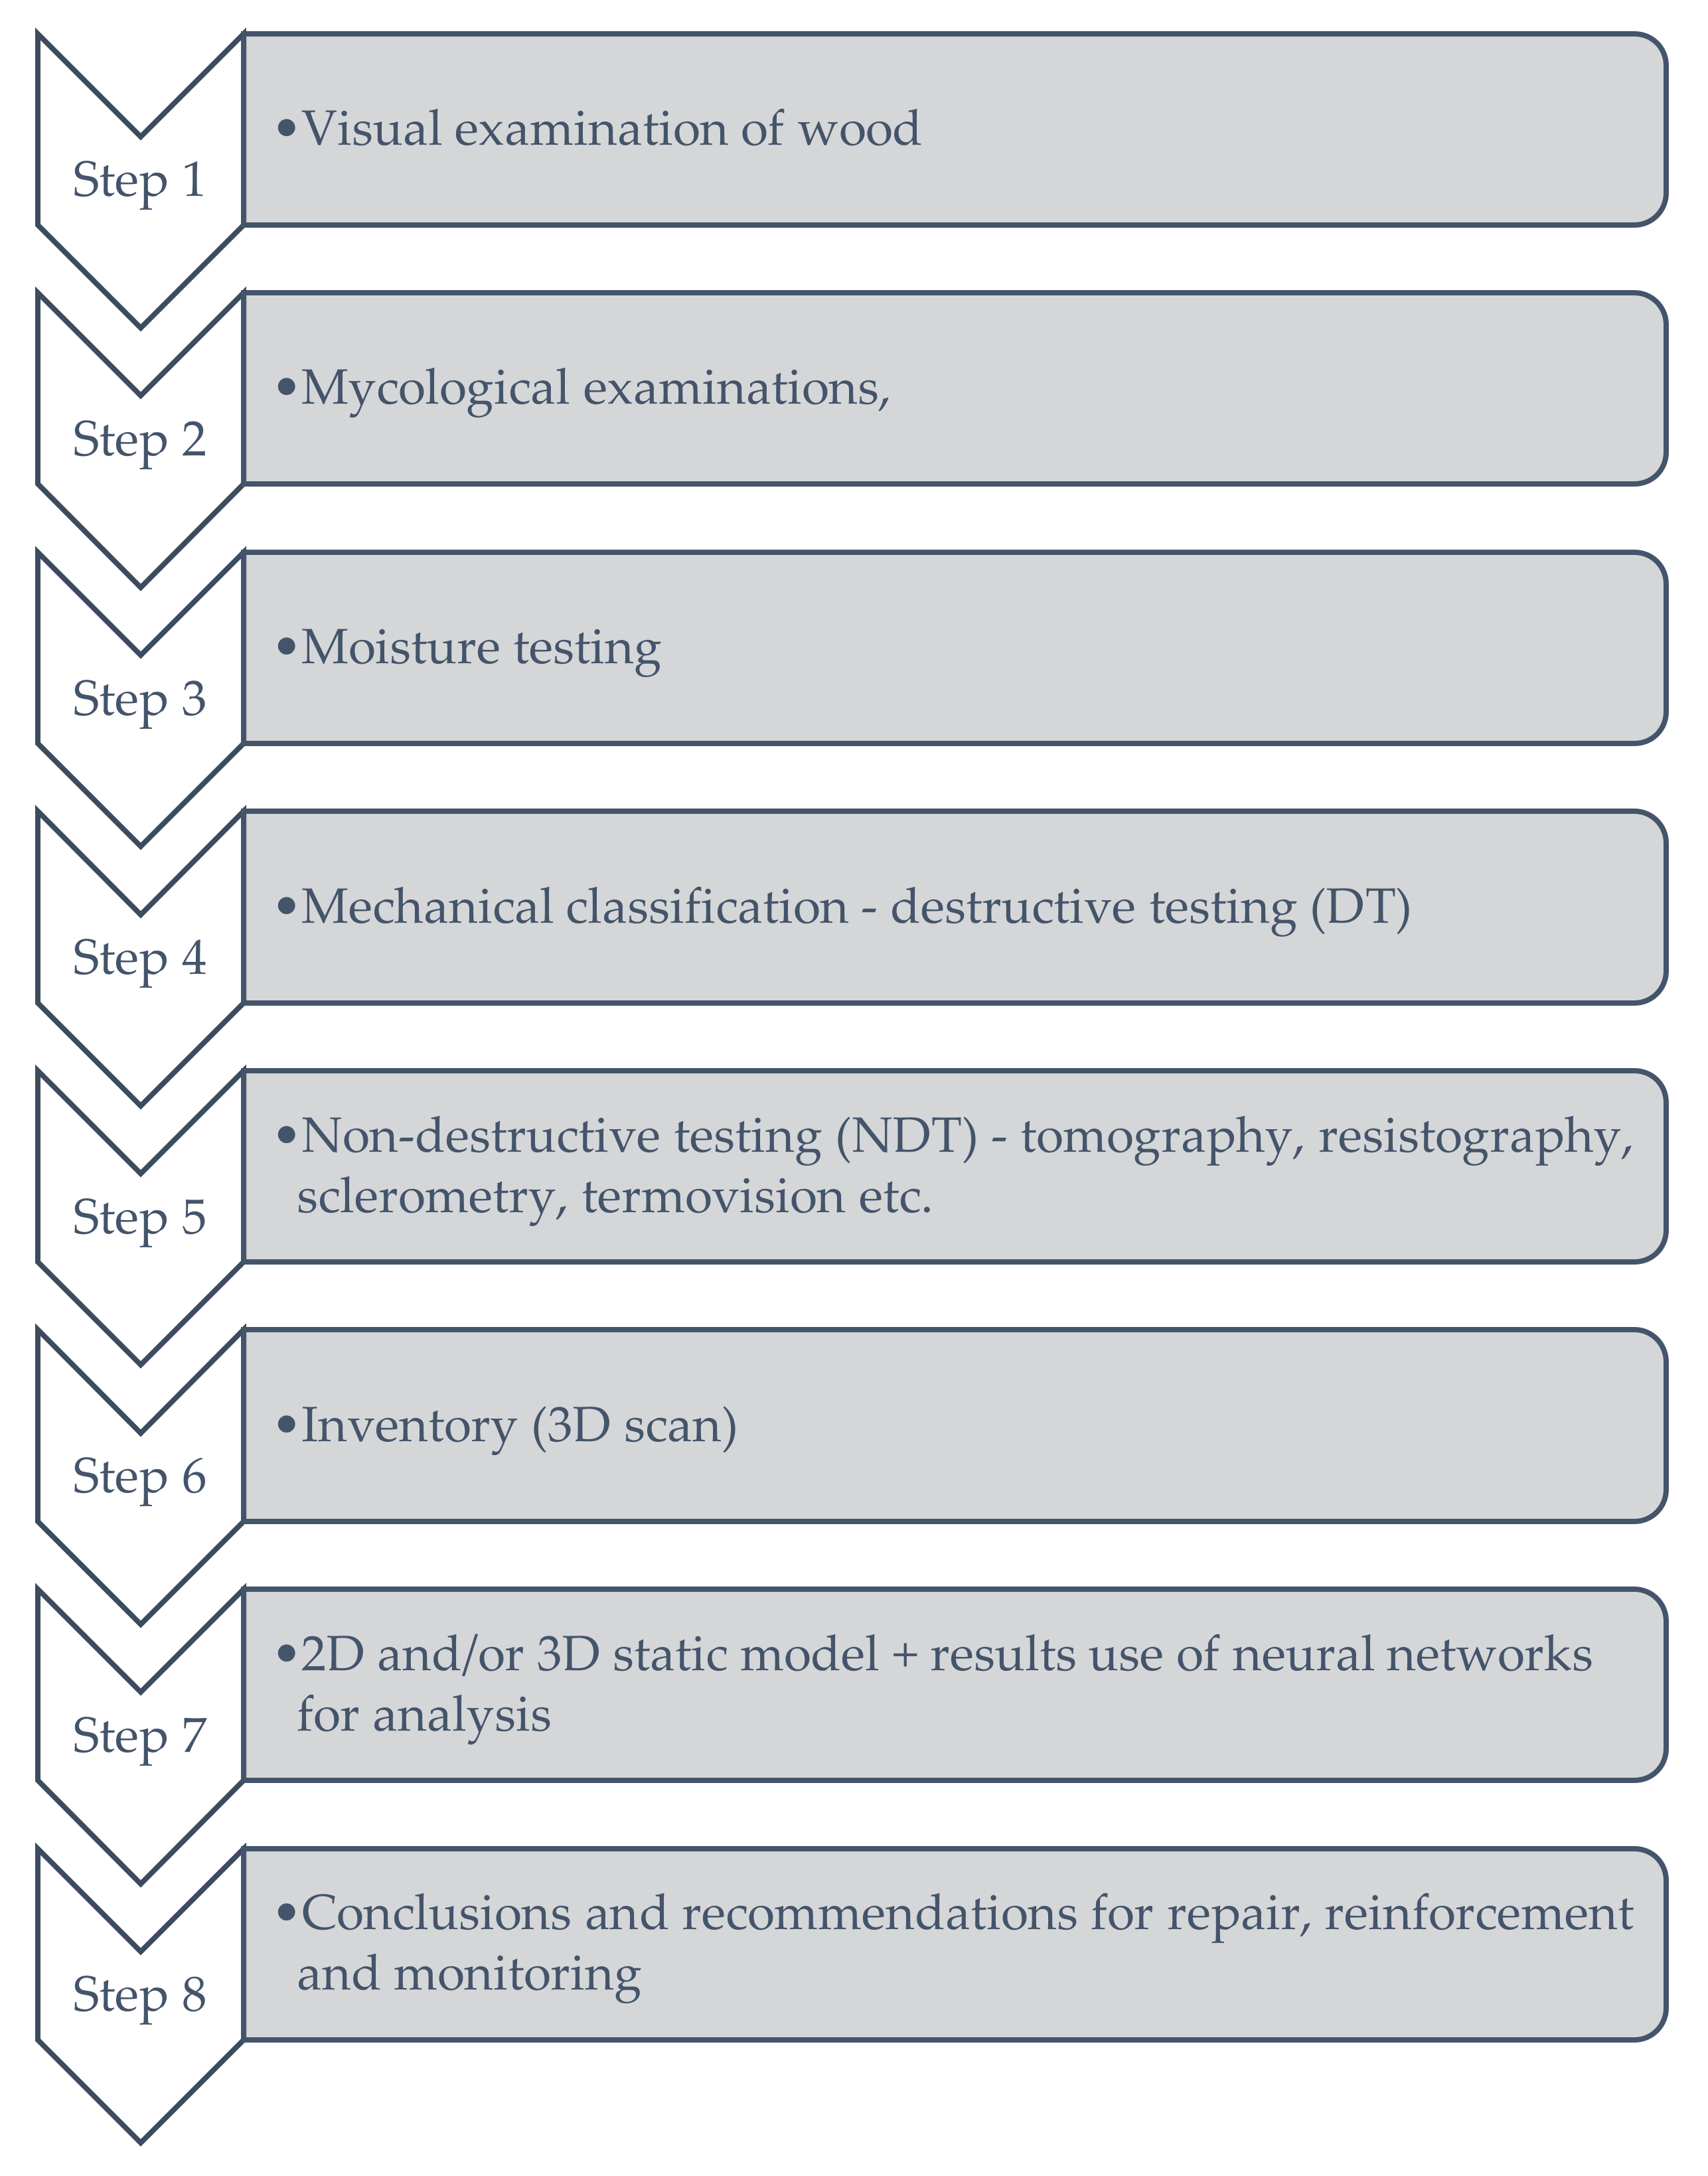
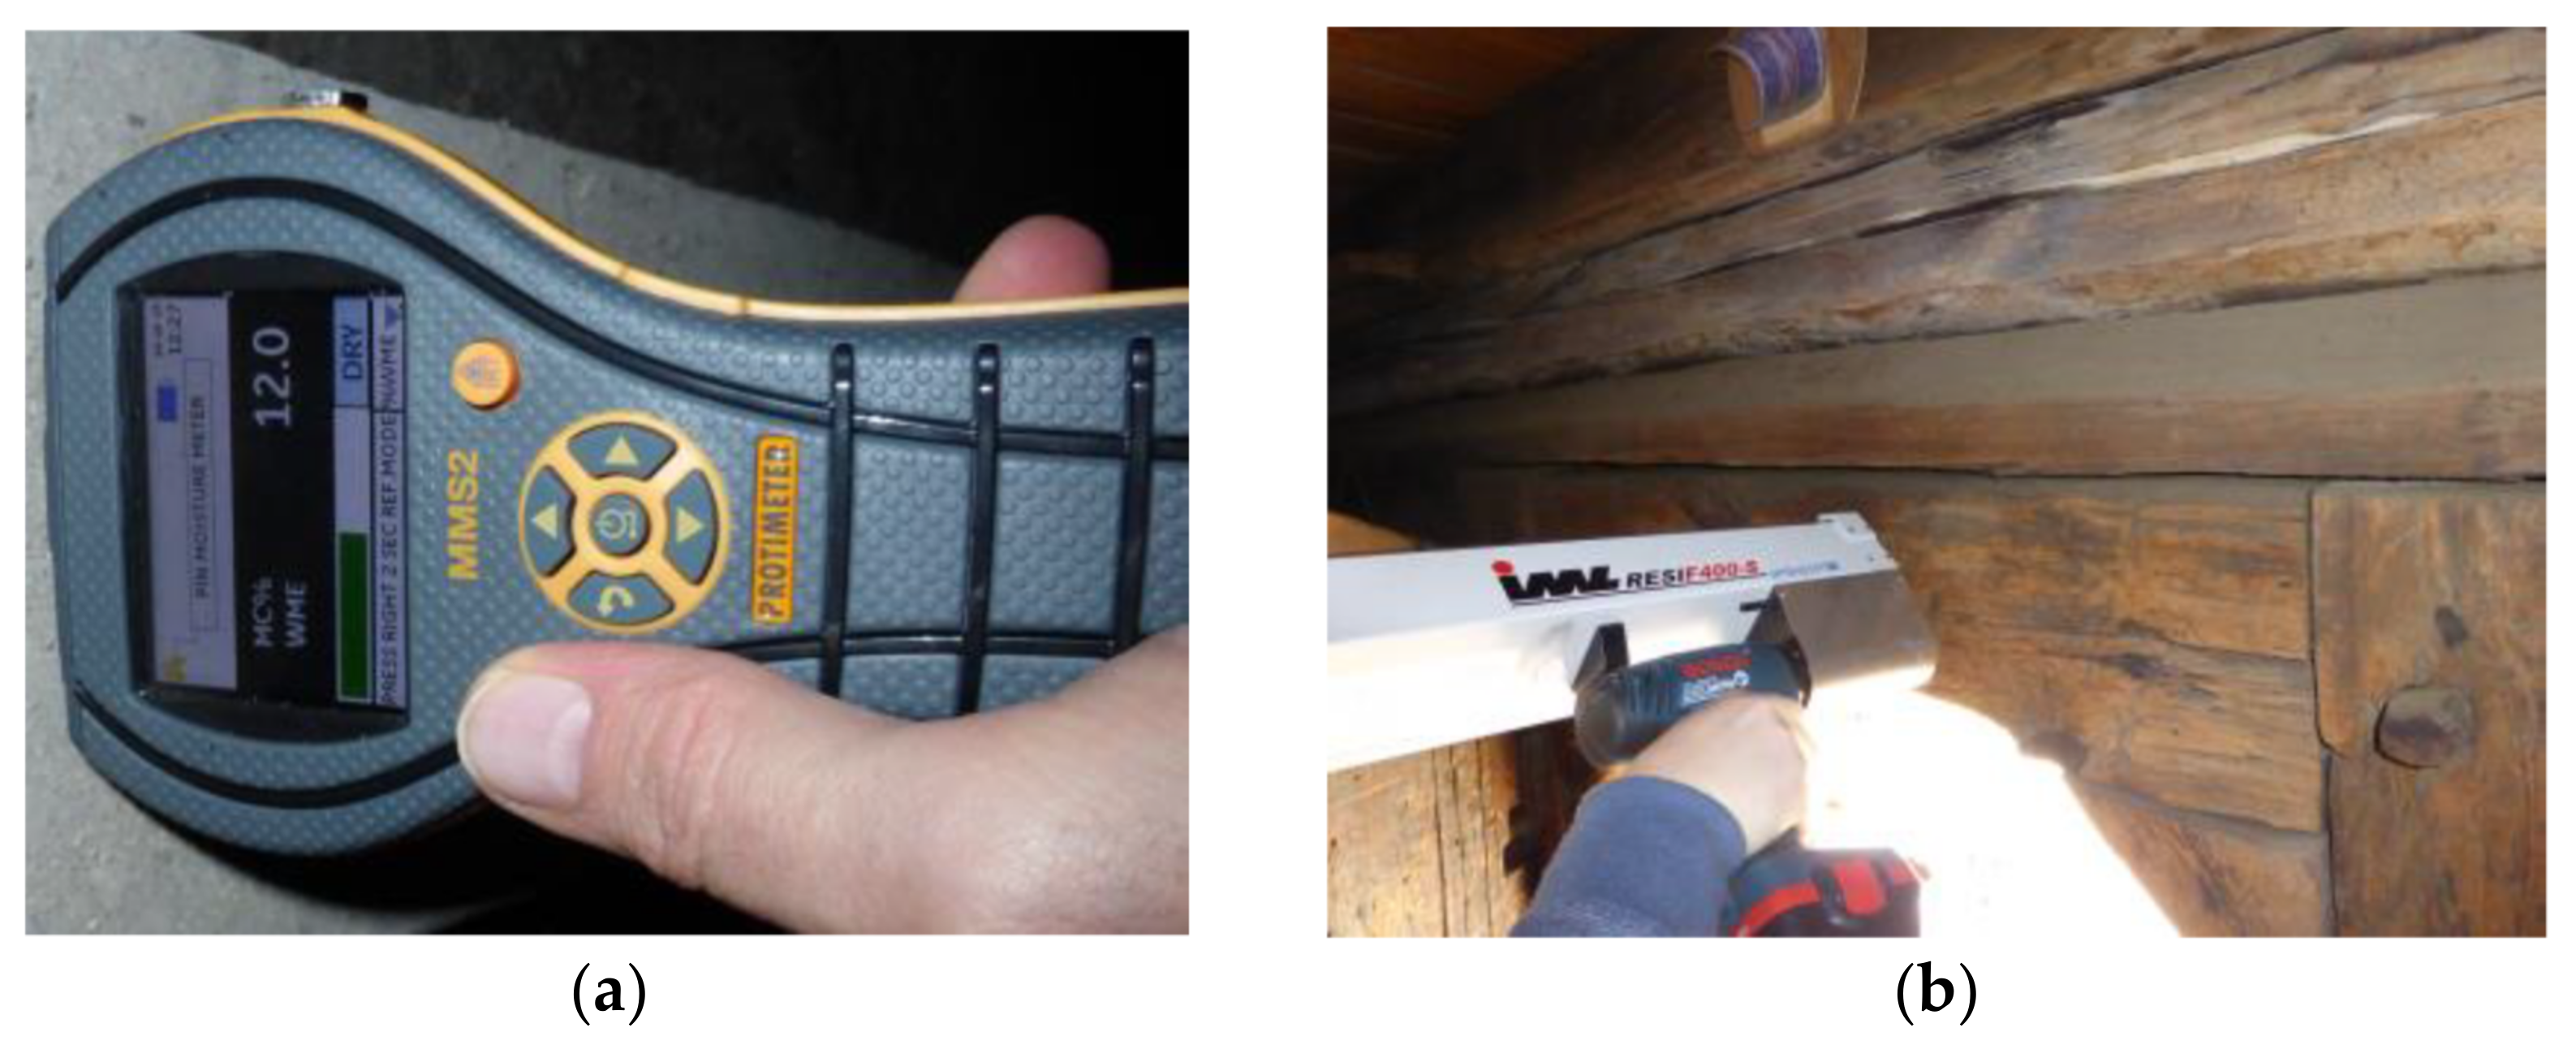
2.2. Structural Timber Testing—Condition Assessment

Visual examination of embedded wood by persons without adequate technical training may prove to be very unreliable. The situation described above (point 2.1.), which did not show excessive technical wear of the wood apart from the typical effects of the ageing processes, turned out to be very misleading in the evaluation, as evidenced by the excavations carried out. Such situations often occur in construction practice. Therefore, for buildings and structures, “maps” of their so-called “weak places” should be created with a special focus on vulnerable wooden structures.
Regarding the safety of buildings (both older and newer), structural building products should be characterised by guaranteed strength. The problem is already a reliable strength assessment of wood in sawmills (visual—direct and machine—direct method), while the assessment of already built structures will be a much bigger problem. According to [95] and the Polish Annex to Eurocode 5 [96], the visually graded sawn timber is described by the symbols KW, KS, KG, where:
KW—stands for election class;
KS—means the sorting class.
KG—indicates a lower quality class.
Visual classification is a non-destructive but not foolproof method of assessing the quality/strength class of the inspected timber, based on appearance characteristics (timber quality) and processing defects (processing quality).
Mechanical classification is based on the measurement of technical parameters and is often complemented by visual classification (ends of tested beam, specimens).
Sawn timber with a moisture content of not more than 20% and a defined shape should be classified.
The visual assessment concerns the concentration and size of knots (the so-called knot index), the twist (deviation) of the fibres in relation to the longitudinal axis of the element, tangential and radial shrinkage cracks, including frontal cracks passing through the entire cross-section of the element and those located in the plane of the examined element and not passing through its front. In addition, the width of the rings in the wood cross-section and the oblate (their total height and length), the perpendicular and transverse curvature in relation to the planes and sides, as well as the wurliness, should be examined. An essential element of the research is the type and extent of biological infestation of the wood.
Most of the above-mentioned tests can also be performed on already installed wooden structures. A prerequisite for the effectiveness of such tests is to see the exposed elements and to reach the infested fragments. In expert practice, these methods are not used, and the classification of wood is mostly done by the so-called “eye”. Therefore, the precision of such assessments may be very doubtful and may even lead to the risk of a construction disaster in the future.
To lend credibility to “in situ” surveys, including the aforementioned visual method, the use of equipment and techniques to support such surveys is proposed, including but not limited to
  • Tomograph,
  • Resistographs,
  • Pilodin (a device designed to evaluate the cutting resistance of wood),
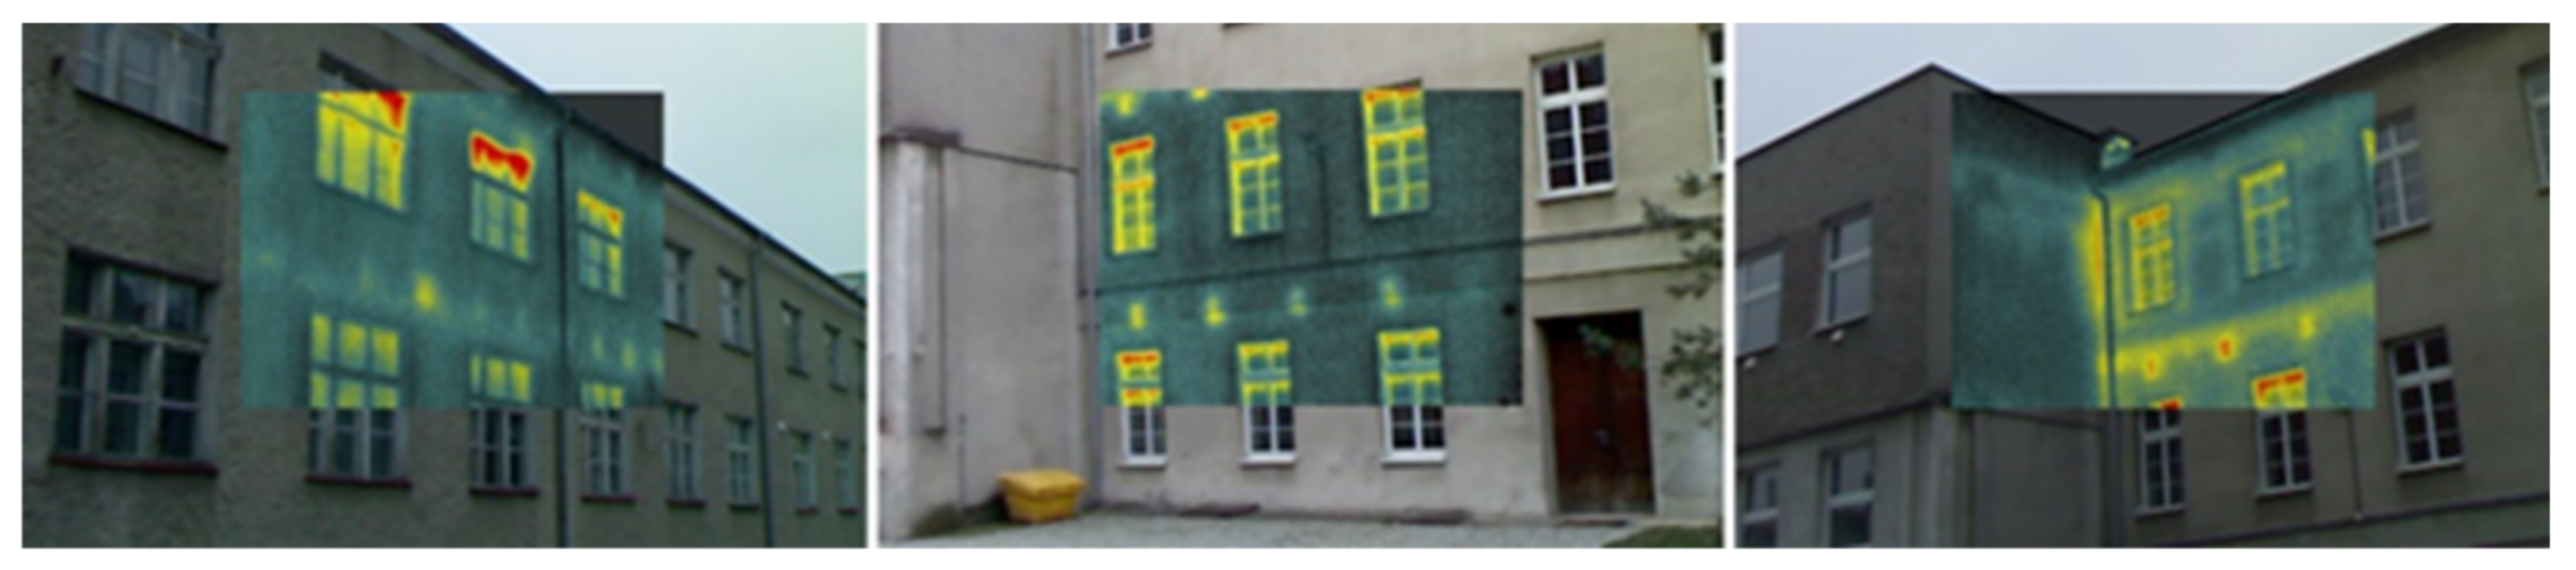
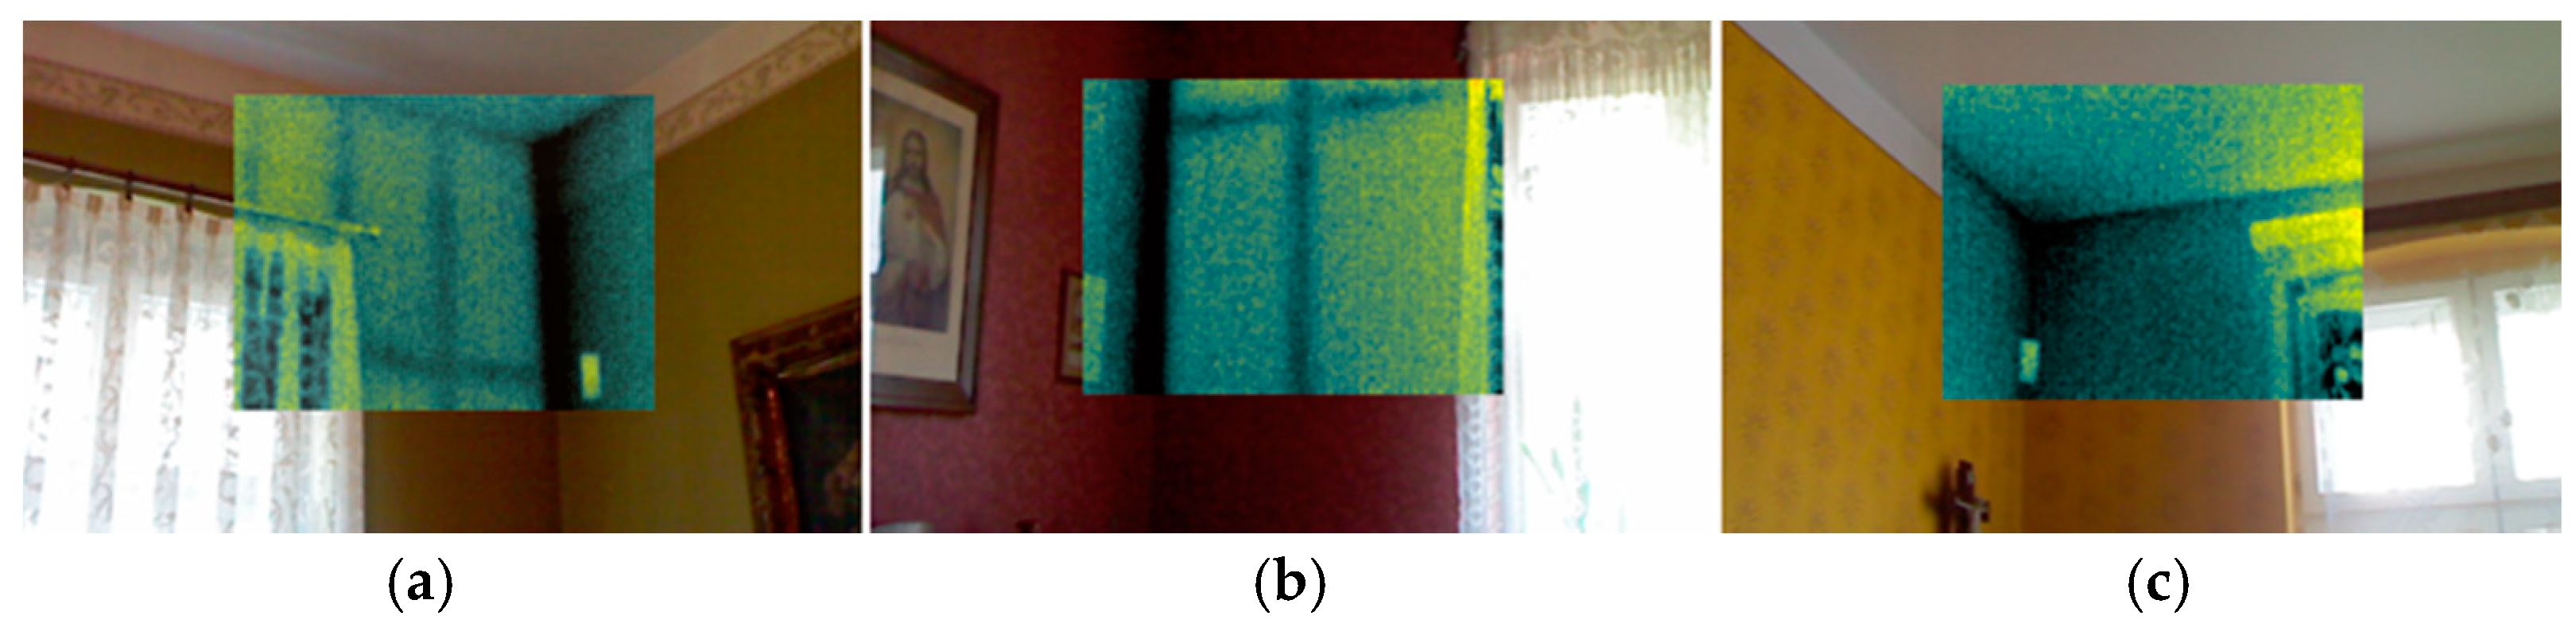
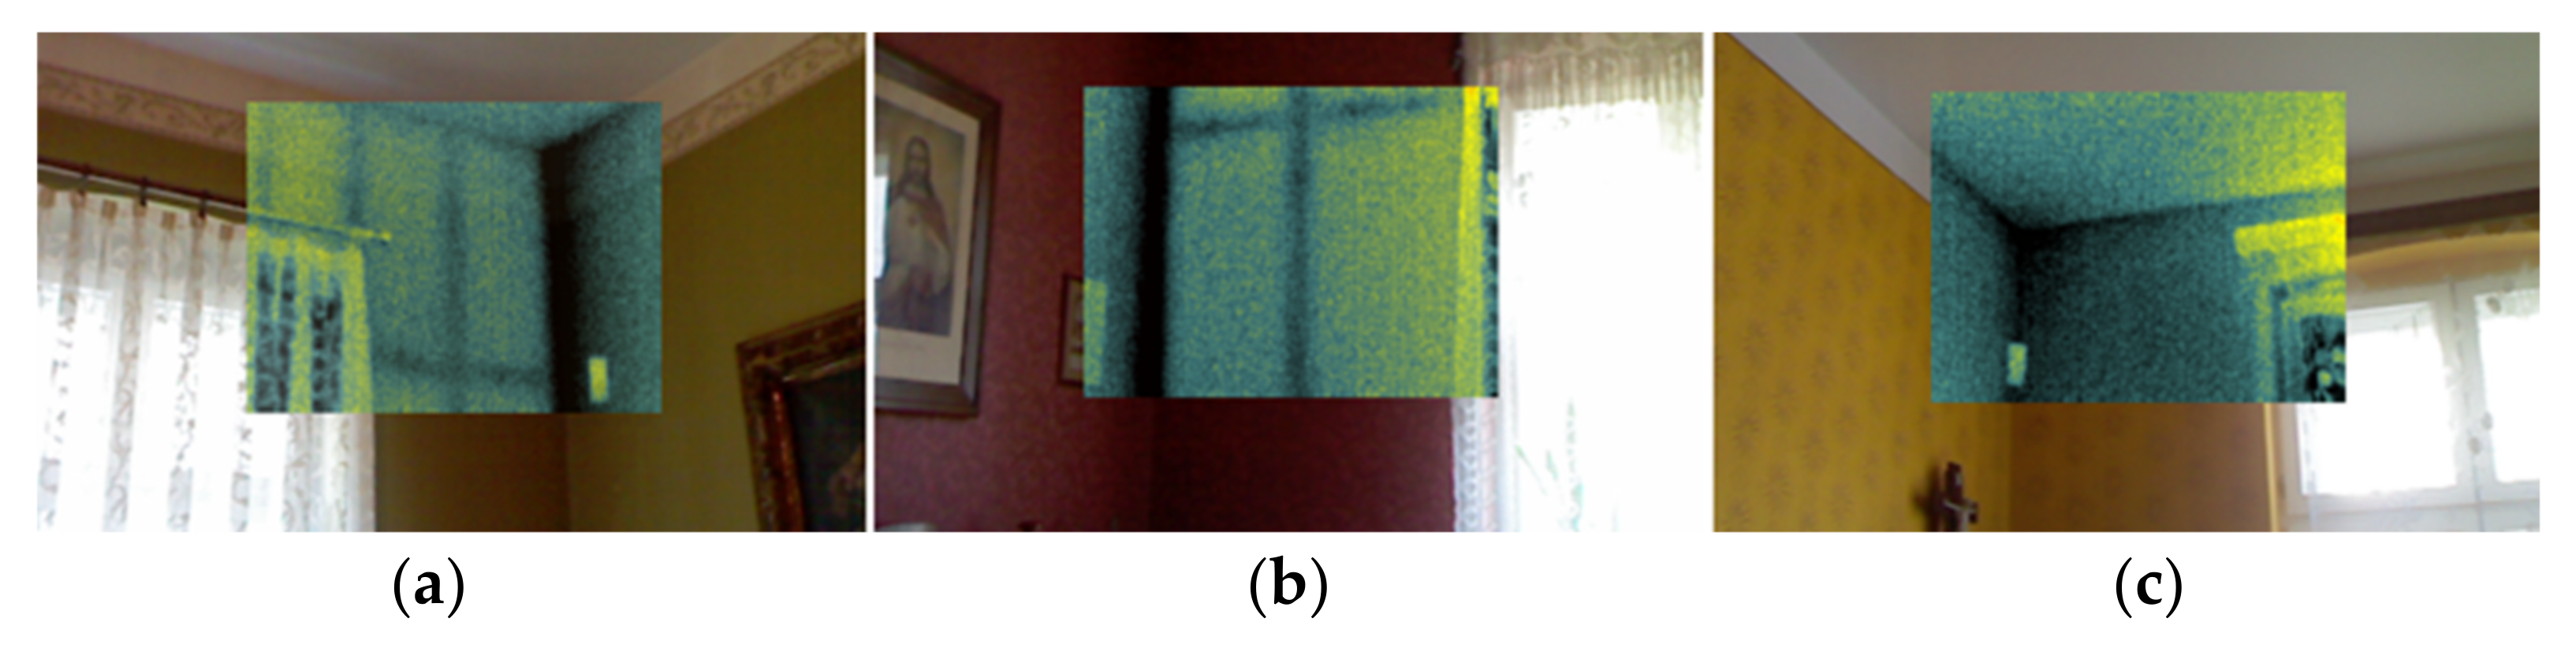
  • A thermal imaging camera.
The tomograph is a device designed to measure the propagation time of sound waves in wood, using the non-invasive method of sound waves for this purpose. It is used to detect the size and location of decay and loss of wood mass. This allows a reasonably reliable assessment of the condition of the timber and a possible scope of salvage work.
A resistorograph is a measuring device that measures the resistance of wood to cutting. It is particularly useful in detecting the location of biological corrosion foci and its extent. This test can be helpful in determining the mechanical parameters of wood.
The wood sclerometer (Pilodyn) is a wood density tester that is used to determine the density and strength of dead and live wood, while allowing for the quick and objective detection of invisible soft rot without destroying the structure of the material under test (product) and to assess loss of its strength.
When examining wood “in situ”, the presence of a mycologist is advisable.
A reliable assessment of the strength class of wood and its other mechanical parameters is necessary for the safety of the structure left in service. This must not be performed by conjecture, but by reliable assessments carried out by competent and qualified persons, which in construction practice is also possible but necessary from the point of view of structural safety.
These are not the methods indicated in the standards (including [96]) for already embedded wood. The European standards only address the design and protection of new structures with specific strength parameters. For this reason, the authors have proposed a pathway necessary for the analysis of this type of structures (Figure 9).
There are no generally understood methods for diagnosing structures, including wooden structures. The authors of this article have raised this problem as essential, not only for the reason of ensuring an appropriate level of reliability but also for the reason of extending their durability to the maximum. This will allow for the implementation of economical materials management, significantly complying with the idea of sustainable development, reducing energy consumption in all forms, and reducing emissions of harmful substances into the atmosphere.
The research described above significantly reduces interference with the valuable historical substance, which will preserve its authenticity.
Therefore, so far, no methods have been developed to monitor covered timber structures built in the building envelope of existing or new buildings.

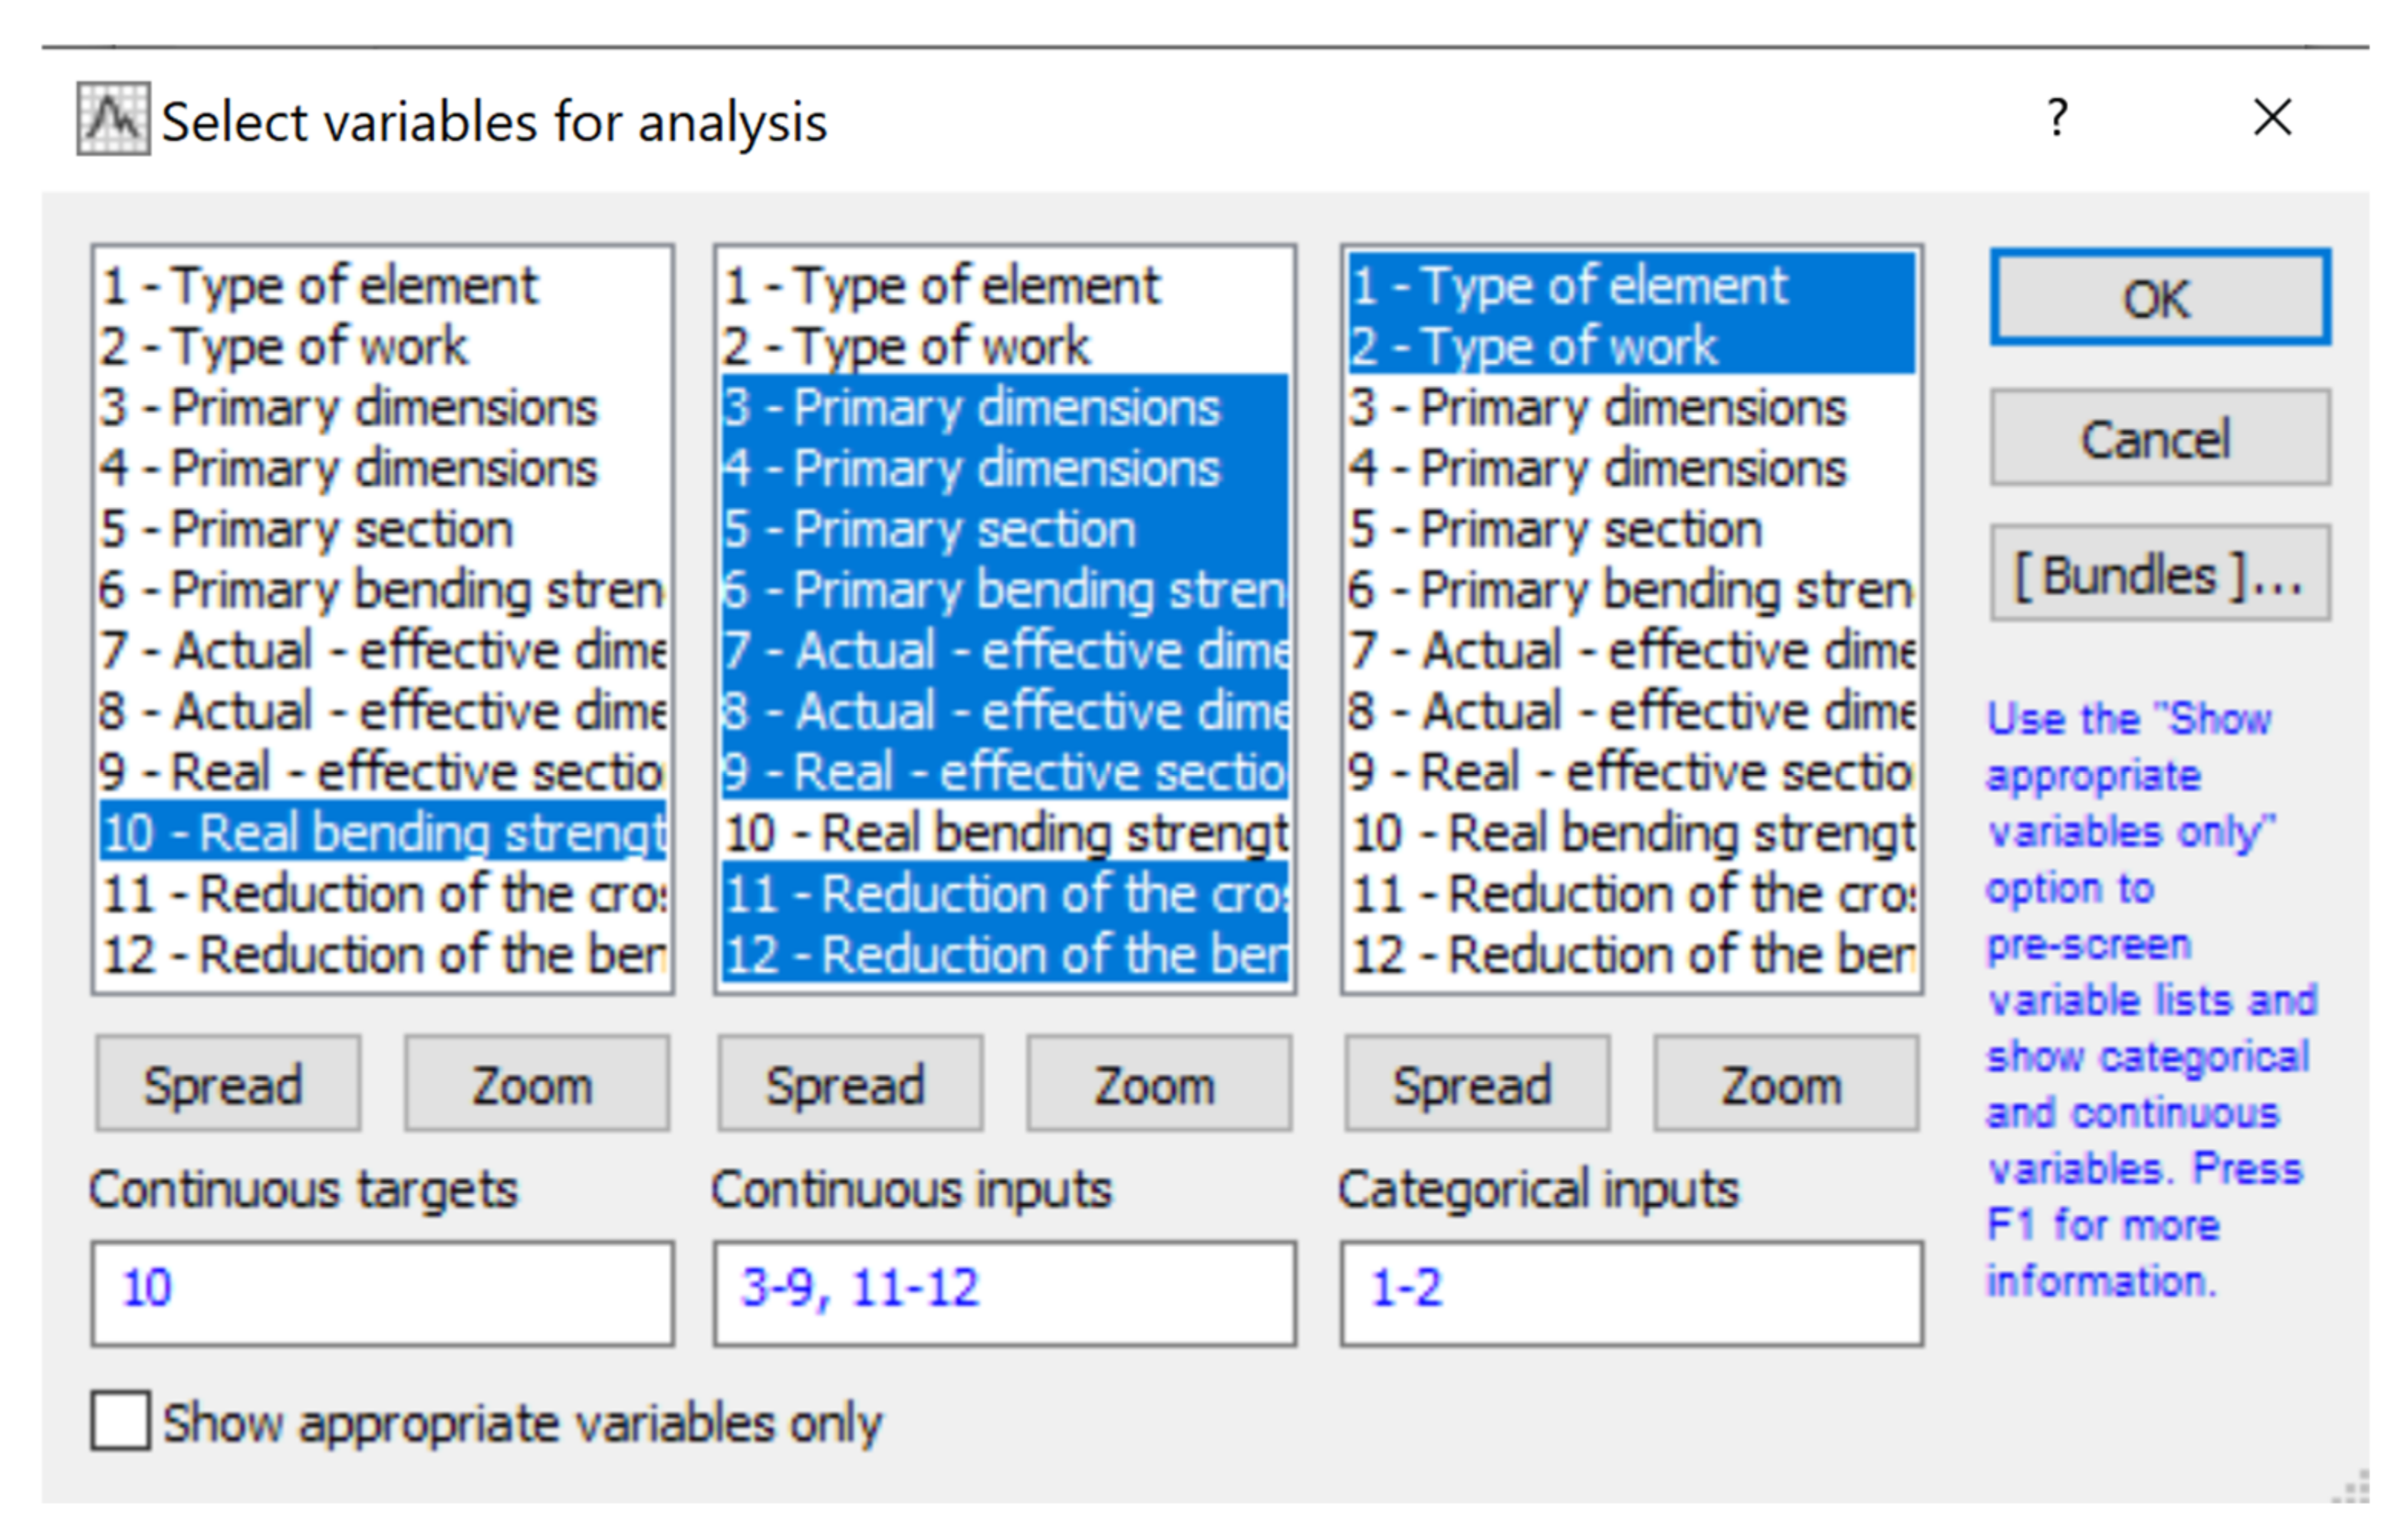
2.3. The Use of Neural Networks for the Prediction of Selected Wood Characteristics

The use of artificial intelligence methods, such as artificial neural network methods, requires the preparation of appropriate databases. In relation to wood, a database is selected and a structured set of information is provided on this material technology, its exploitation, and its characteristics and properties. The database can be presented as a matrix composed of rows and columns that are filled not only with numbers, but also with quality characteristics and names. It is important to properly define the structure of the database and to analyse the experimental data. The main task is to agree on a uniform form of data recording and transmission. Wood data consist of input data, which are information about what is known about the material and its performance, and output data on characteristics and properties, which will be further analysed and predicted. When describing different tasks, the same quantity may be recognised differently. An example is the compressive strength of wood. When predicting this feature of wood on the basis of visual sorting class operating conditions, this strength can be an output variable (i.e., searched for). In turn, when considering the mechanical properties of wood, after a certain time it can be defined as an input variable. In general, examples of the application of artificial neural networks in the field of technical sciences are as follows.
  • Approximation forecasts the prediction of outputs without having to explicitly define the relationship between these data;
  • Classification and pattern recognition;
  • Data association;
  • Analysis and processing of predictive data.
Artificial neural networks (SSN) are the general name for certain mathematical structures and their software or hardware models that perform computation or signal processing through rows of elements called artificial neurons (perceptrons). The inspiration for such a structure came from studying the structure of natural neurons and the synapses that connect them (memory carriers), as well as the entire neural circuit, which is, in fact, the domain of the brain. SSNs are sometimes also referred to as an interdisciplinary field of knowledge dealing with the construction, training (teaching), and testing of the capabilities of such artificial networks. SSNs created as computer programs (e.g., in Statistica software, neural networks are one of the available options) are generated to transform numerical data in a way that is modelled on the functioning of nerve cells in the brain. The basic building block of an artificial neural network is the processing element. It is a specific model of the actual cells that make up the nervous system, which is responsible for processing and analysing information in the human body. The actual nerve cell can be treated as a biological information processing system. The information introduced through the input (dendrites) is processed inside the cell. The processed signal is sent through the axon to subsequent cells. Each neural network consists of a large number of elements capable of processing information (neurons), which are associated with each other by connections with specific parameters (weights), which change during the learning process. The following principles of connecting neurons with each other are distinguished: connection of neurons with each other, connection between successive layers in layer networks, and connection of selected neurons, e.g., in a neighbourhood.
Today, neural networks have a layered structure with the following layers: input, output, and hidden layers [97,98,99,100,101,102]. The neuron has a certain number of inputs, to which the input data are introduced: x1, x2, …, xn, with combined weights: w1, w2, …, wn. The process initiated by the input data is reflected by two basic information that occurs inside the neuron. The first is the determination of the aggregated input value and is carried out using an aggregating function, also known as the “postsynaptic potential function” (PSP function). The second process consists of determining the output value of the neuron, for which the activation function (transition function) is responsible. The components of an artificial neuron are, thus:
  • n input signals xi with weight wi;
  • One output signal y;
  • The excitation e of the neuron, which is the sum of the weighted input signals, is expressed as:
e = i = 1 n w i · x i Θ
where
Θ —threshold;
  • activation (transition) function f(e).
The activation function is particularly important, as the aggregated input value of a neuron becomes a parameter of the activation function of a given neuron. There are basic types of these functions: linear and nonlinear, and popular ones include linear, logistic, hyperbolic, exponential, sinusoidal, and Gaussian equations [97,99,103]. It is also important to note that a common feature of any neural network is a structure consisting of neurons connected to each other by synapses. Furthermore, associated with synapses are weights, that is, certain numerical values, the selection and interpolation of which depend on the adopted SSN model.
The basic feature of neural networks is their ability to self-organise and adapt to changing conditions, which results directly from the possibility of selecting weights that can change in the learning process. SSN algorithms are a tool perceived as informative, although learning in time, as they have the ability to adapt the stock of knowledge they possess to the possibility of its dynamic change. This is a fundamental feature, as this ability determines the possibility of self-learning, which significantly speeds up the execution of computations. Learning consists here in changing the coordinates of neurons in such a way that they follow a pattern consistent with the structure of the analysed data. In view of this, the calibration of the phenomenological (abstract) model created by the network consists in an adequate selection of weights in the learning process. An important element of SSN is the process of learning the network. There are two basic ways of learning: supervised or unsupervised. During the learning process, some connections (weights between neurons) become more important, and some do not participate in solving the problem (this could be compared to the disappearance of connections in the brain), so it is possible to determine which variables are important to solve the existing problem [98,99,101,104,105,106,107,108,109,110]. The characteristics of a neural network depend to a large extent on how the neurons are connected, the so-called network architecture. Due to this characteristic, one can distinguish:
  • Unidirectional networks;
  • Recurrent networks;
  • Self-organising maps.
In unidirectional networks, there is only one direction of signal flow. The selected single signal passes in such a network through each neuron exactly once in its cycle. Such networks can be divided into single-layer, two-layer, and multilayer networks. The most effective networks are multilayer networks consisting of an input layer, hidden layer, and an output layer.
Recurrent networks and self-organising maps are in fact multidirectional networks characterised by feedback or learning by competition, among others. Selected types of neural networks are presented below:
  • Layered linear networks (Adaline/Madaline, Multilayer Perceptron).
  • Layered nonlinear networks.
    Networks learned by back-propagation (BP) algorithm.
    Networks with circular symmetry function (RBF).
  • Feedback networks.
    Hopfield networks.
    Networks with bidirectional associative memory (BAM).
  • Competition learning networks.
    Kohonen Network (LVQ).
    Self-organising network (SOM).
  • Resonance networks (ART).
  • Hybrid networks.
Wood structures and wood as an anisotropic material have thus far been analysed, among others, using the following software [111,112,113,114,115,116,117]:
  • Obtained through the implementation of the FuzzyARTMAP network;
  • Based on the BP back-propagation network concept;
  • Based on networks that use connections between neurons and other nearest neighbour neurons, the nearest neighbour method.
In the case of the Fuzzy ARTMAP (resonance network) solution, two systems based on the Adaptive Resonance Theory (ART) concept work together in the supervised learning mode. Individual ART systems are unsupervised systems. Consecutive observations are analysed in parallel and independently in the input and output layers. The Fuzzy ARTMAP system expands a separate memory block of links between input and output categories, thus recalling which data sets correspond to which material properties. As stated in [118], correct computational results have been obtained using this type of network for highly heterogeneous data (e.g., wood technology). This type of software is not available to the Statistica user.
An example of software based on the concept of back-propagation of error are one-way Multilayer Perceptron (MLP) networks, available as one of the options of the Statistica software. The operation of MLP network consists of input data, determination of the output values of hidden neurons, and determination of the output value of the output neuron. The result of the network depends on the value of the weights of hidden and output neurons and the structure of the network. Learning of unidirectional networks is performed by a “teacher”. This means that the values entered as input to the network together with the corresponding output values enter the learning set. Therefore, the aim of the learning process is to generate such values by determining the weights for which the network outputs will coincide with the real values. The learning process is expected to result in a reduction in network error, which is an aggregated measure of the differences between actual output values and calculated values [106,119,120]. Due to the direction of the flow of error information, the learning algorithm of this network is called the Back Propagation (BP) error propagation algorithm (i.e., each neuron locally reduces its error) and is the most common solution of artificial neural networks. This type of network learns rather slowly and tends to correctly reproduce relatively smooth representations devoid of discontinuities, i.e., with actual discontinuities these networks generate significant errors. In such a network, one can identify an information flow oriented from the input layer to the output layer, where the information necessary to calculate the output variables is transported and from the output layer to the input, the error information used during the learning process is sent.
A third type of software based on the nearest-neighbor method can be represented by Radial Basis Function (RBF) networks, available as one of the options of the Statistica software. RBF networks with radial basis functions have three layers: input (linear neurons), hidden (radial neurons), and output (linear neurons). The learning network with the radial basis function consists of three stages: determination of the radial centres, radial deviation, and lip values of the output layer neuron. The first stage is the selection of basis function centres by determining the values of weights for each radial neuron; these are the points for which the output value of the neuron will be maximum. The second stage comes down to the selection of the width of the activation function, a parameter that determines the shape of the activation function, stored as the threshold value of the radial neuron. The determination of the shape (width) of the activation function is performed using the nearest-neighbor method. It consists of taking the standard deviation of the distance between the weight vector of the considered neuron and the weight vectors of the nearest radial neurons. The number of neighbour neurons taken into account is specified in the edit box. Information about the width of the activation function is stored as a threshold value of the neuron [99,121]. The RBF network is characterised by a much simpler topology than the MLP network. Moreover, networks of this type may prove to be overly sensitive to even a few errors or anomalies in the learning data concerning quantitative and qualitative variables, e.g., mechanical parameters of wood.
The development of the database, discussed above, based on the parameters of the embedded wood, will be an element that will be further considered by the authors of this paper. After building the database, it will be possible to proceed to the determination of the neural network topology, i.e., to determine the number of input and output data, to determine the number and organisation of neurons in individual layers, and to specify the activation and error functions. The authors intend to use SSN for the prediction of physical and mechanical parameters of wood. Research will be carried out on the existing objects presented above.
Unidirectional multilayer MLP networks based on a back-propagation error propagation algorithm are selected for further analysis due to:
  • Availability of the Statistica software;
  • Global approximation of such networks;
  • More complex topology than RBF networks;
  • A backpropagation learning algorithm (more complex than nearest-neighbour networks).
Neural networks as a tool for the prediction and determination of physical parameters of wooden structures have been used, among others, in works [111,112,113,114,115,116,117], for example, for the prediction of the compressive strength of wood, which indicates the validity of the considerations undertaken.

3. Results

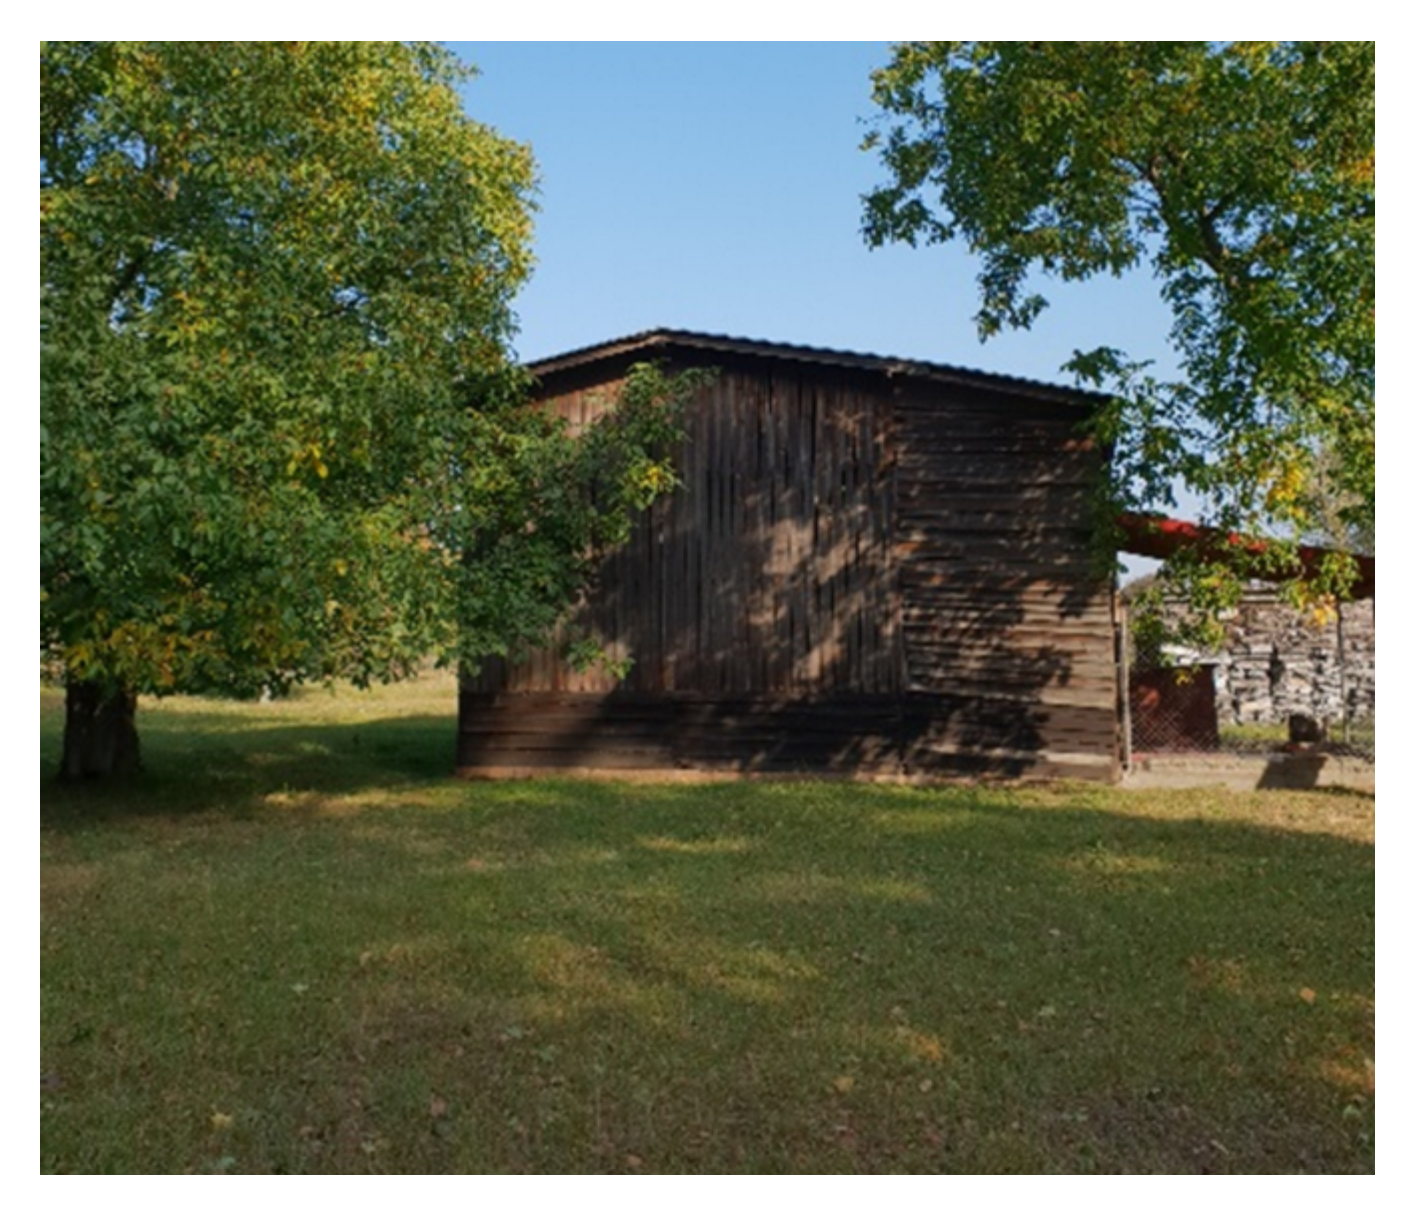
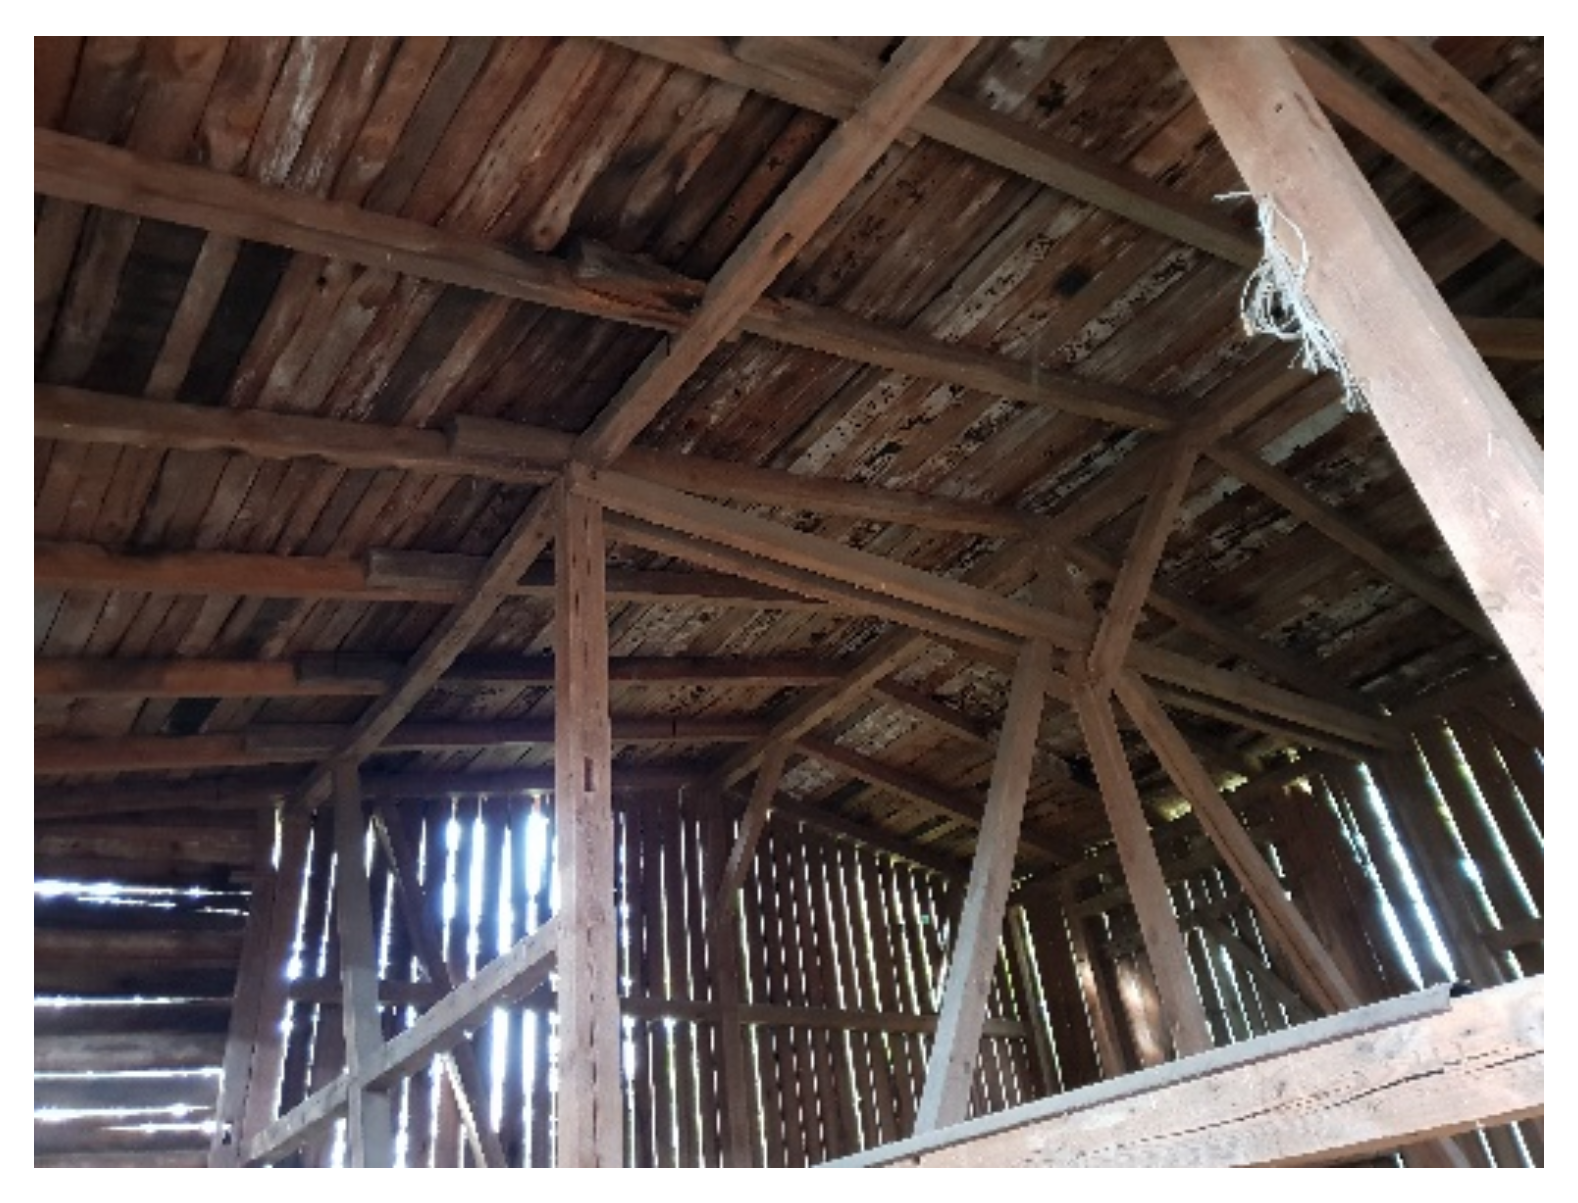
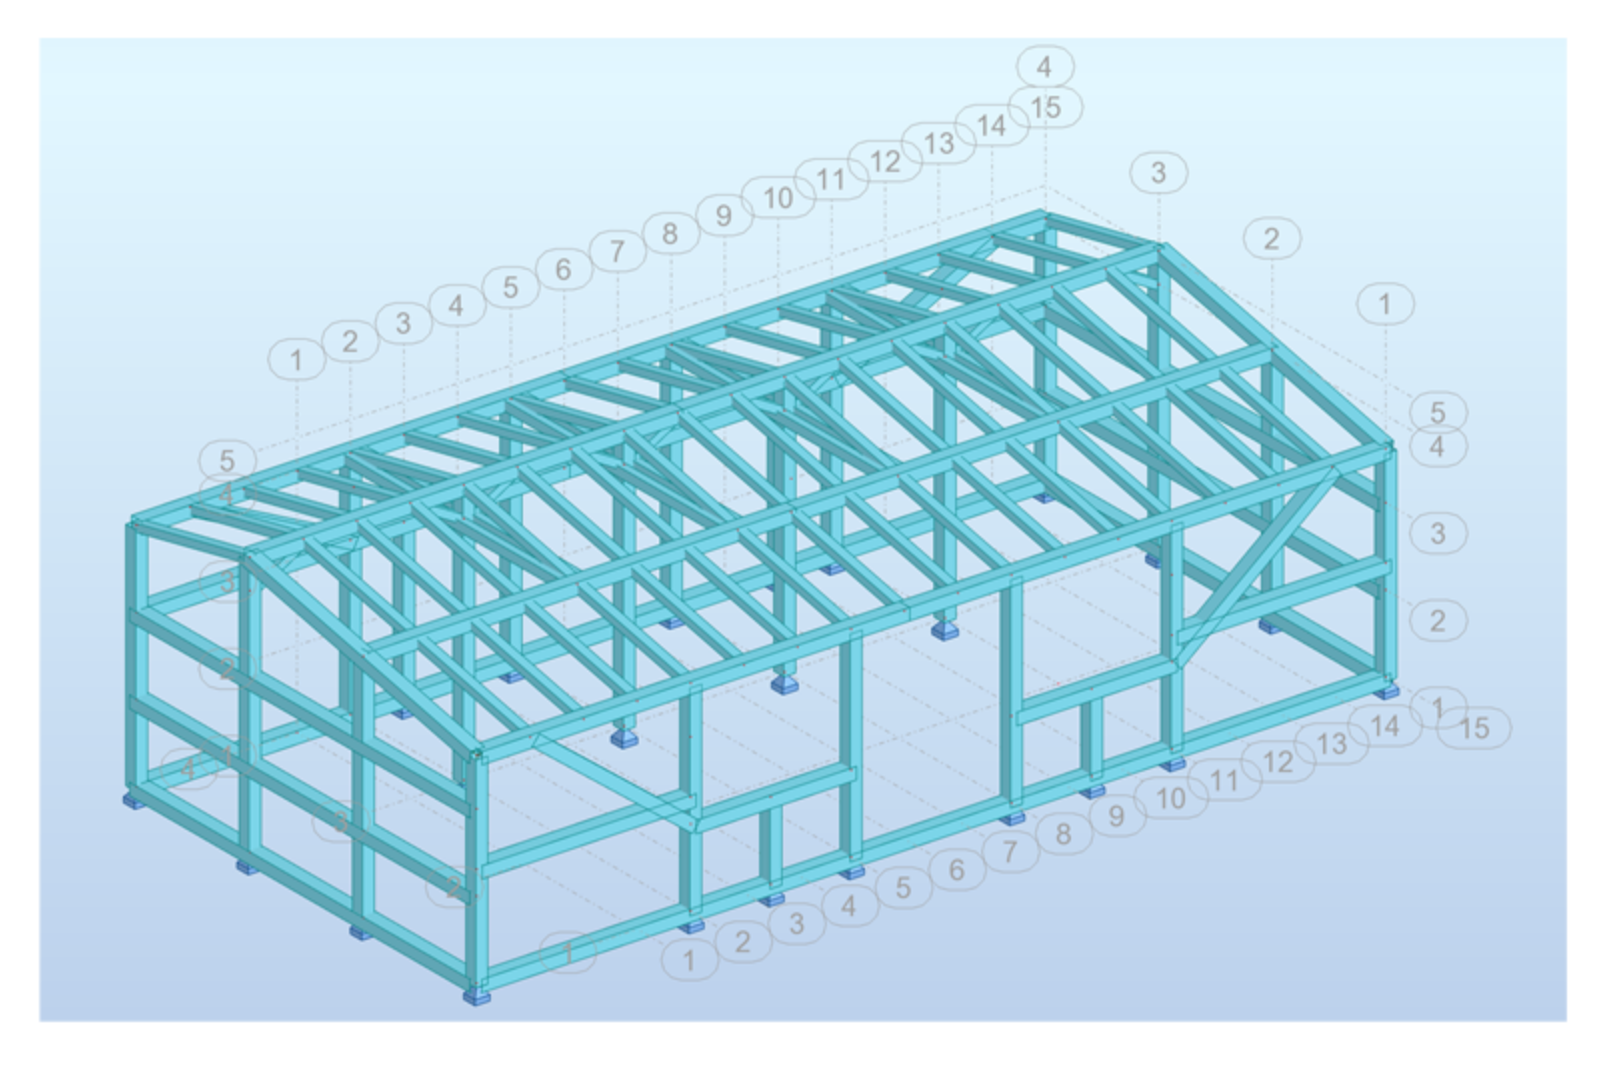
3.1. Results of “In Situ” Analyses

The “in situ” tests of the selected three buildings were aimed at determining the current structural stress of their load-bearing elements (responsible for safety), forecasting the period of their further operation, or indicating the required scope of their reinforcement, replacement, or supplementation. The selected buildings represent different types of wooden structures created in different historical periods. The buildings are located in southern Poland. The climate in this area is typical for this part of Europe. There is little precipitation, and the seasons are typical (cold winters and hot summers).
Since the end of the 18th century, the climate of southern Poland has shown a systematic tendency for an increase in air temperature, with a significant increase since 1989. Precipitation does not show unidirectional tendencies and is characterised by more or less humid periods. Instead, the pattern of precipitation has changed, mainly in the warm season; precipitation is more abrupt, short-lived, and destructive, causing increasingly frequent flash floods. At the same time, precipitation below 1 mm/day is disappearing. The consequences of a warming climate are an increase in dangerous weather phenomena.
The computational models of the buildings in question have been created on the basis of measurements “from nature” as well as on the basis of 3D laser scanning, and they have served as a starting material for discussion and formulation of final conclusions. It should be mentioned here that the authors of the article conducted successive observations and research of these objects, analysing their current technical conditions on an ongoing basis. The obtained results served as input material implemented into neural networks to determine the possible physical parameters of cross-sections of timber structures.

3.1.1. Storage of Dry Roughage

An example of the degradation of a timber structure is the 1900’s barn building shown in Figure 10. Biological corrosion processes have led to a significant weakening of the load-bearing capacity of sections, significantly affecting the load-bearing capacity of timber frames. Therefore, adequate static and strength analyses of the system were carried out. The actual view of the girders is shown in Figure 11, which shows the losses caused by biological corrosion.
The structure model (Figure 12) was created in Autodesk Structural Analysis Professional 2018 software, reflecting the connections between individual structures through redundancy in the bar joints, especially taking into account the cutoff points of the main columns of load-bearing structures, which were reflected by means of hinges and the introduction of claddings enabling the application of loads. The dimensions of the sections are presented and are in Table 1. Verification was carried out according to the set of PN-EN standards [96,122], which are generally considered up to date, but according to the authors, the set of PN standards [123,124,125] would be adequate.
The following loads were assumed in the analysis:
  • The dead weight of the structure was defined in the program by imposing on the individual members appropriate cross-sections and by defining the wood class as C24 in the first iteration and C20 in the second iteration, while reducing the cross-sectional dimensions to the real ones resulting from the in situ tests;
  • Snow was assumed as the first snow zone according to [126], so sk = 0.7 kN/m2, making it the standard load scheme as for a pitched roof;
  • Wind was assumed as for the first wind zone according to [127], so vb = 22 m/s was automatically generated in the wind tunnel. The load on the wind direction θ = 0° was omitted due to the connection with the neighboring building.
Class 3 use was adopted for the assignment of the relevant coefficients, and variable loads were assigned a medium-duration load duration class.
The static analysis (Figure 13) showed instability of the first type at the place of introduction of additional hinges, which means the presence of an element of zero value on the diagonal of the stiffness matrix. In the case under consideration, this type of instability is caused by the mechanical instability of the structure because part of the structure has become a mechanism—the parameters of the structure supports (number, type, and position of supports) are not sufficient.
Despite the reduction in the active sections of the building structure as a result of advanced biological corrosion, the calculations carried out for the most unfavourable load combination did not show any exceeding of the load capacity of the columns, while during the verification of the sections, they were assessed as incorrect as the nodes experienced excessive displacements and therefore the serviceability limit state conditions were not fulfilled. This was due to the instability described above caused by the introduction of additional hinges at the column cutoff points. In addition, the column structure doid not indicate a serious risk of exceeding the load-bearing capacity, but in the roof truss members, the load increased by about 140%, which led to exceeding the limit state. The fact that the serviceability limit states of the structure were exceeded is also evidenced by the roof deformation diagnosed during the on-site inspection, as well as considerable clearances in the joints. The roof truss of the building shows traces of alterations, reinforcement, and replacement of structural elements. Its previous repairs were made without a previously prepared project; therefore, they should be regarded as accidental, not improving the safety of the roof structure or the whole building.
In the case in question, under the influence of biological corrosion, the stress on the cross-sections increased considerably and caused the ultimate limit state to be exceeded, despite the fact that historical buildings of this type were not designed for high stress on the cross-sections (in the first iteration, only 10% was achieved here).

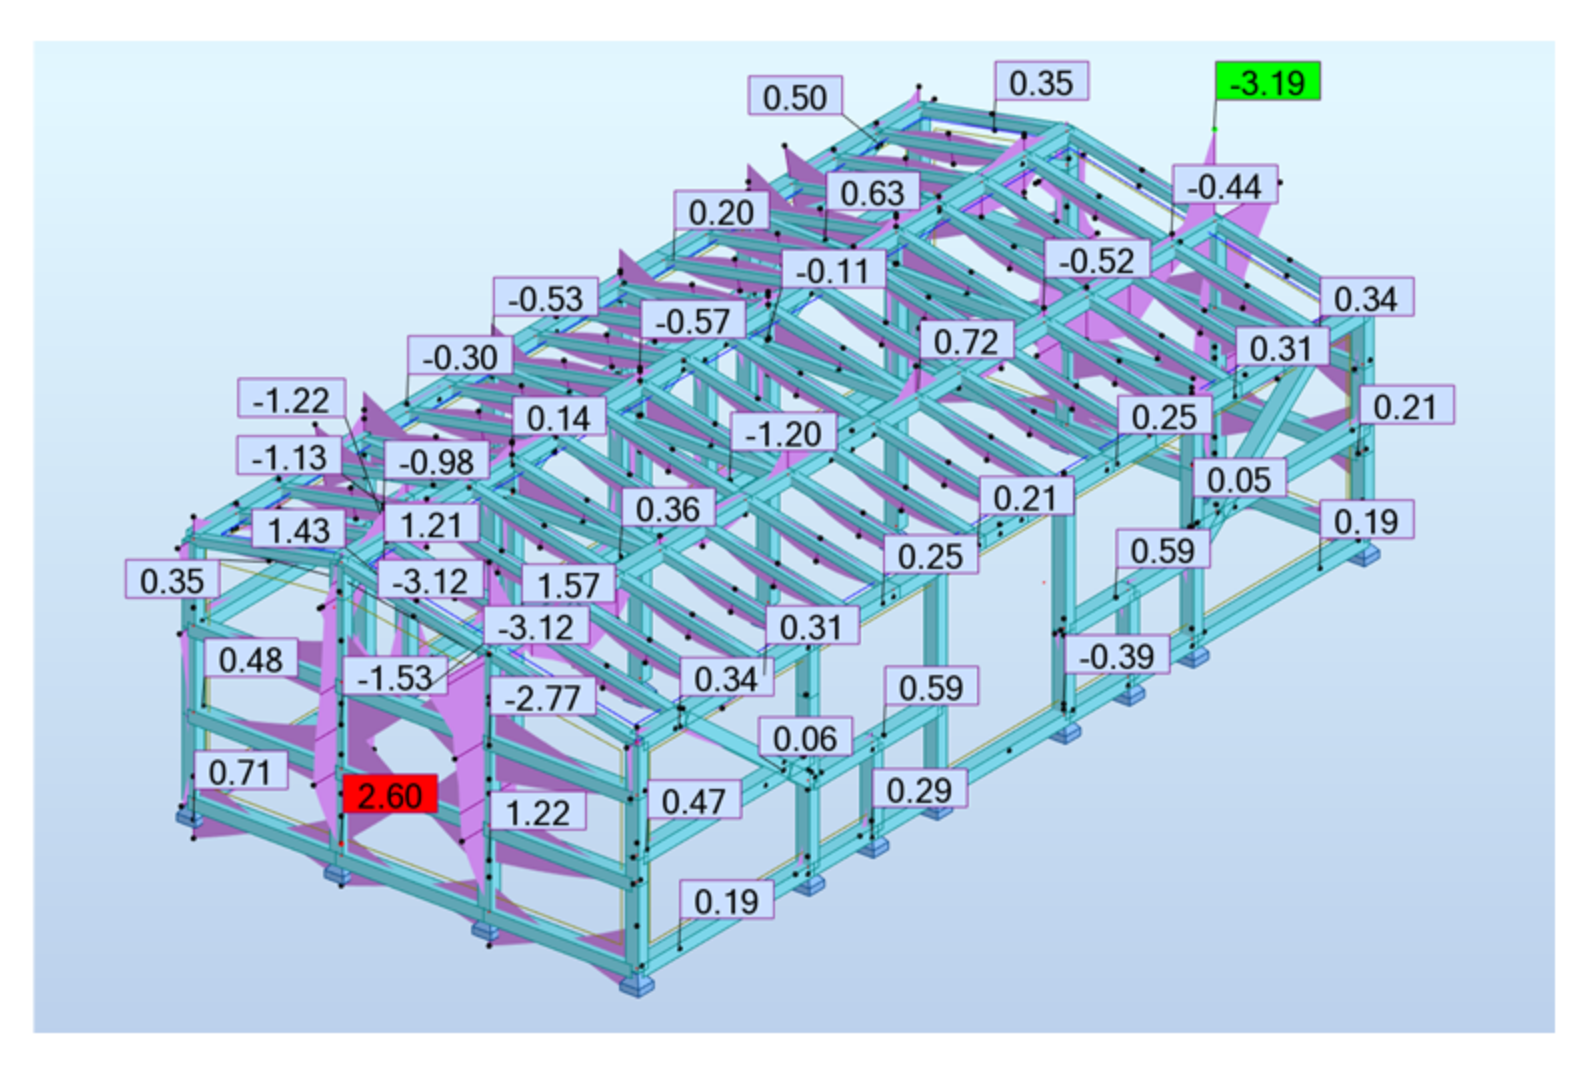
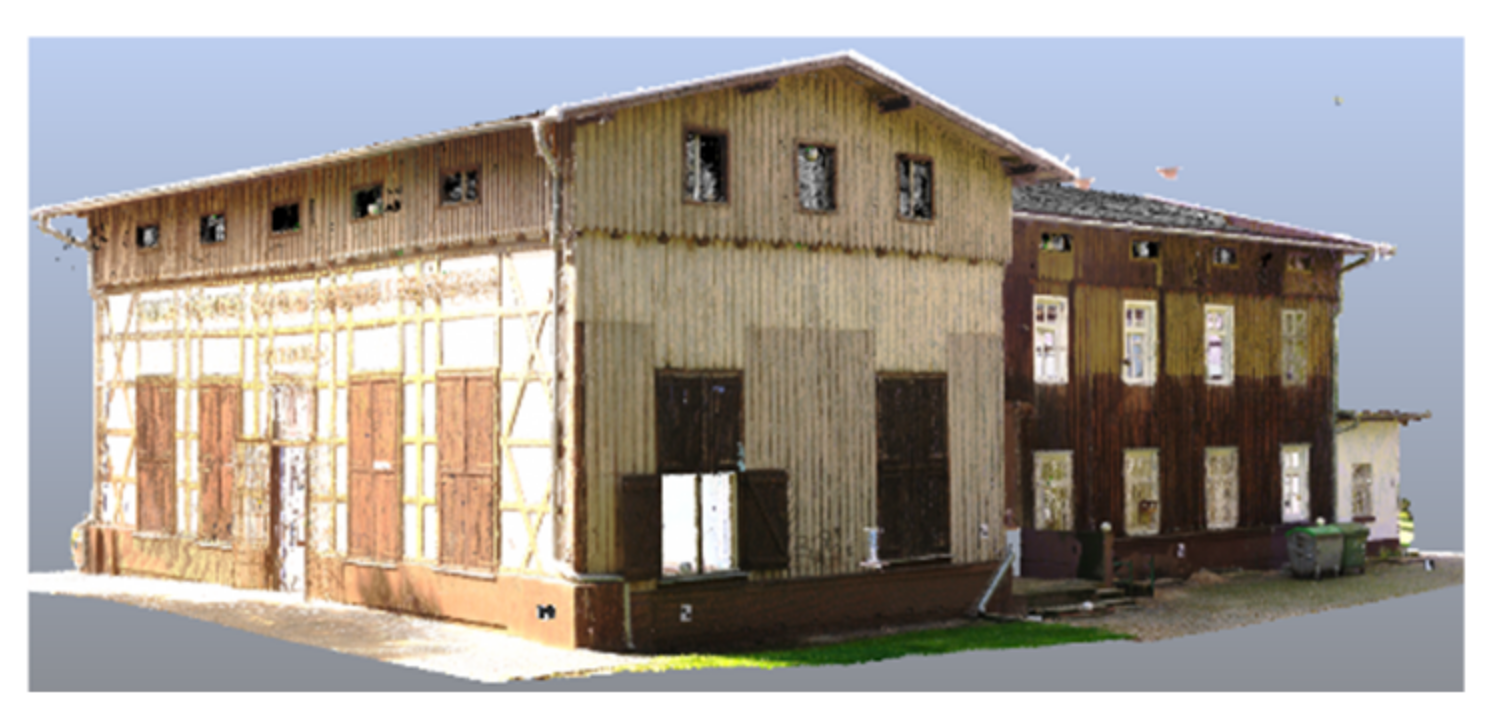
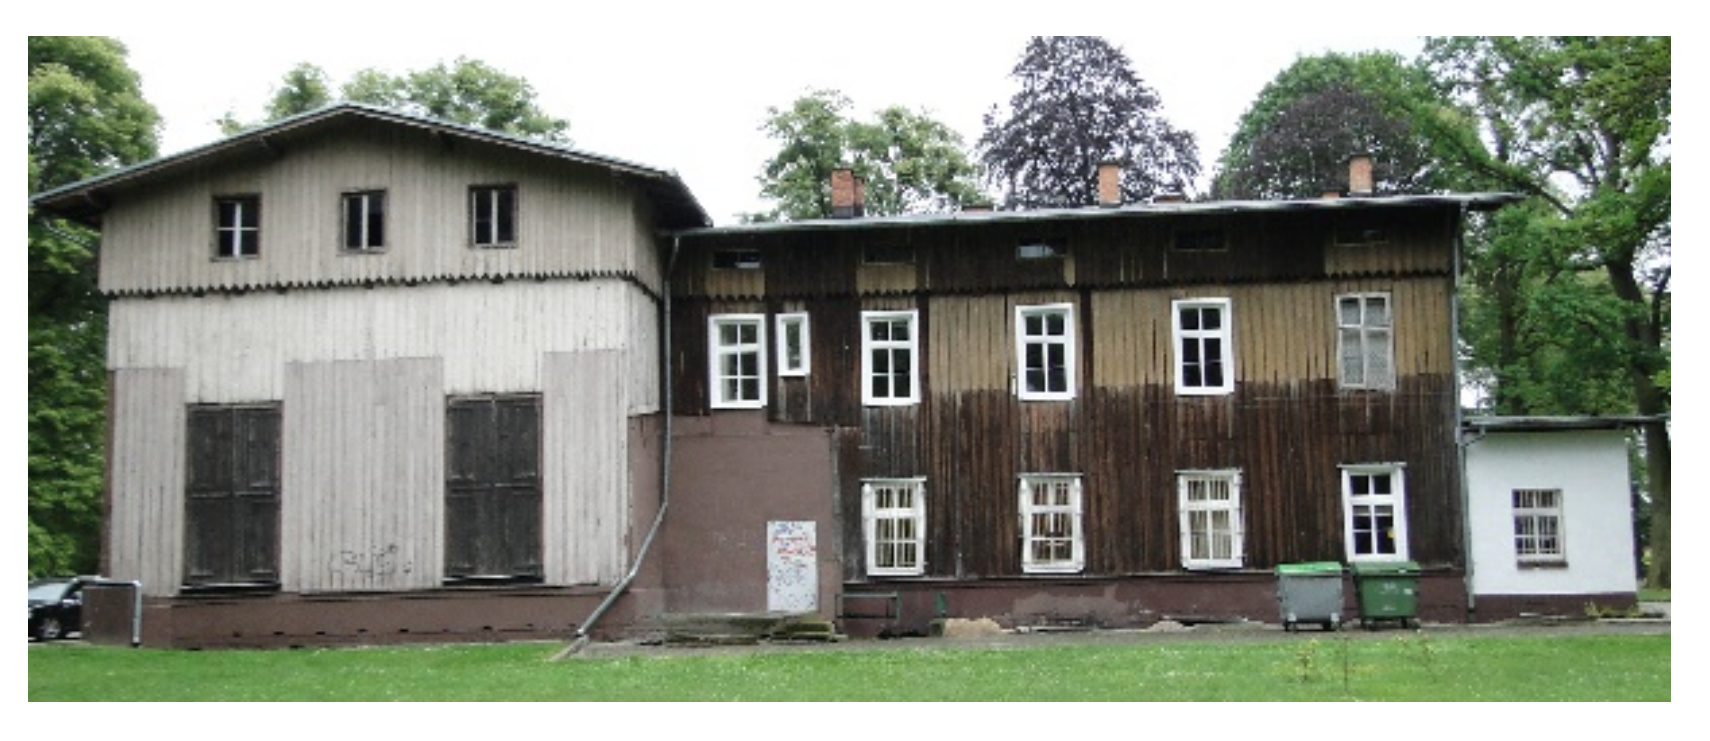
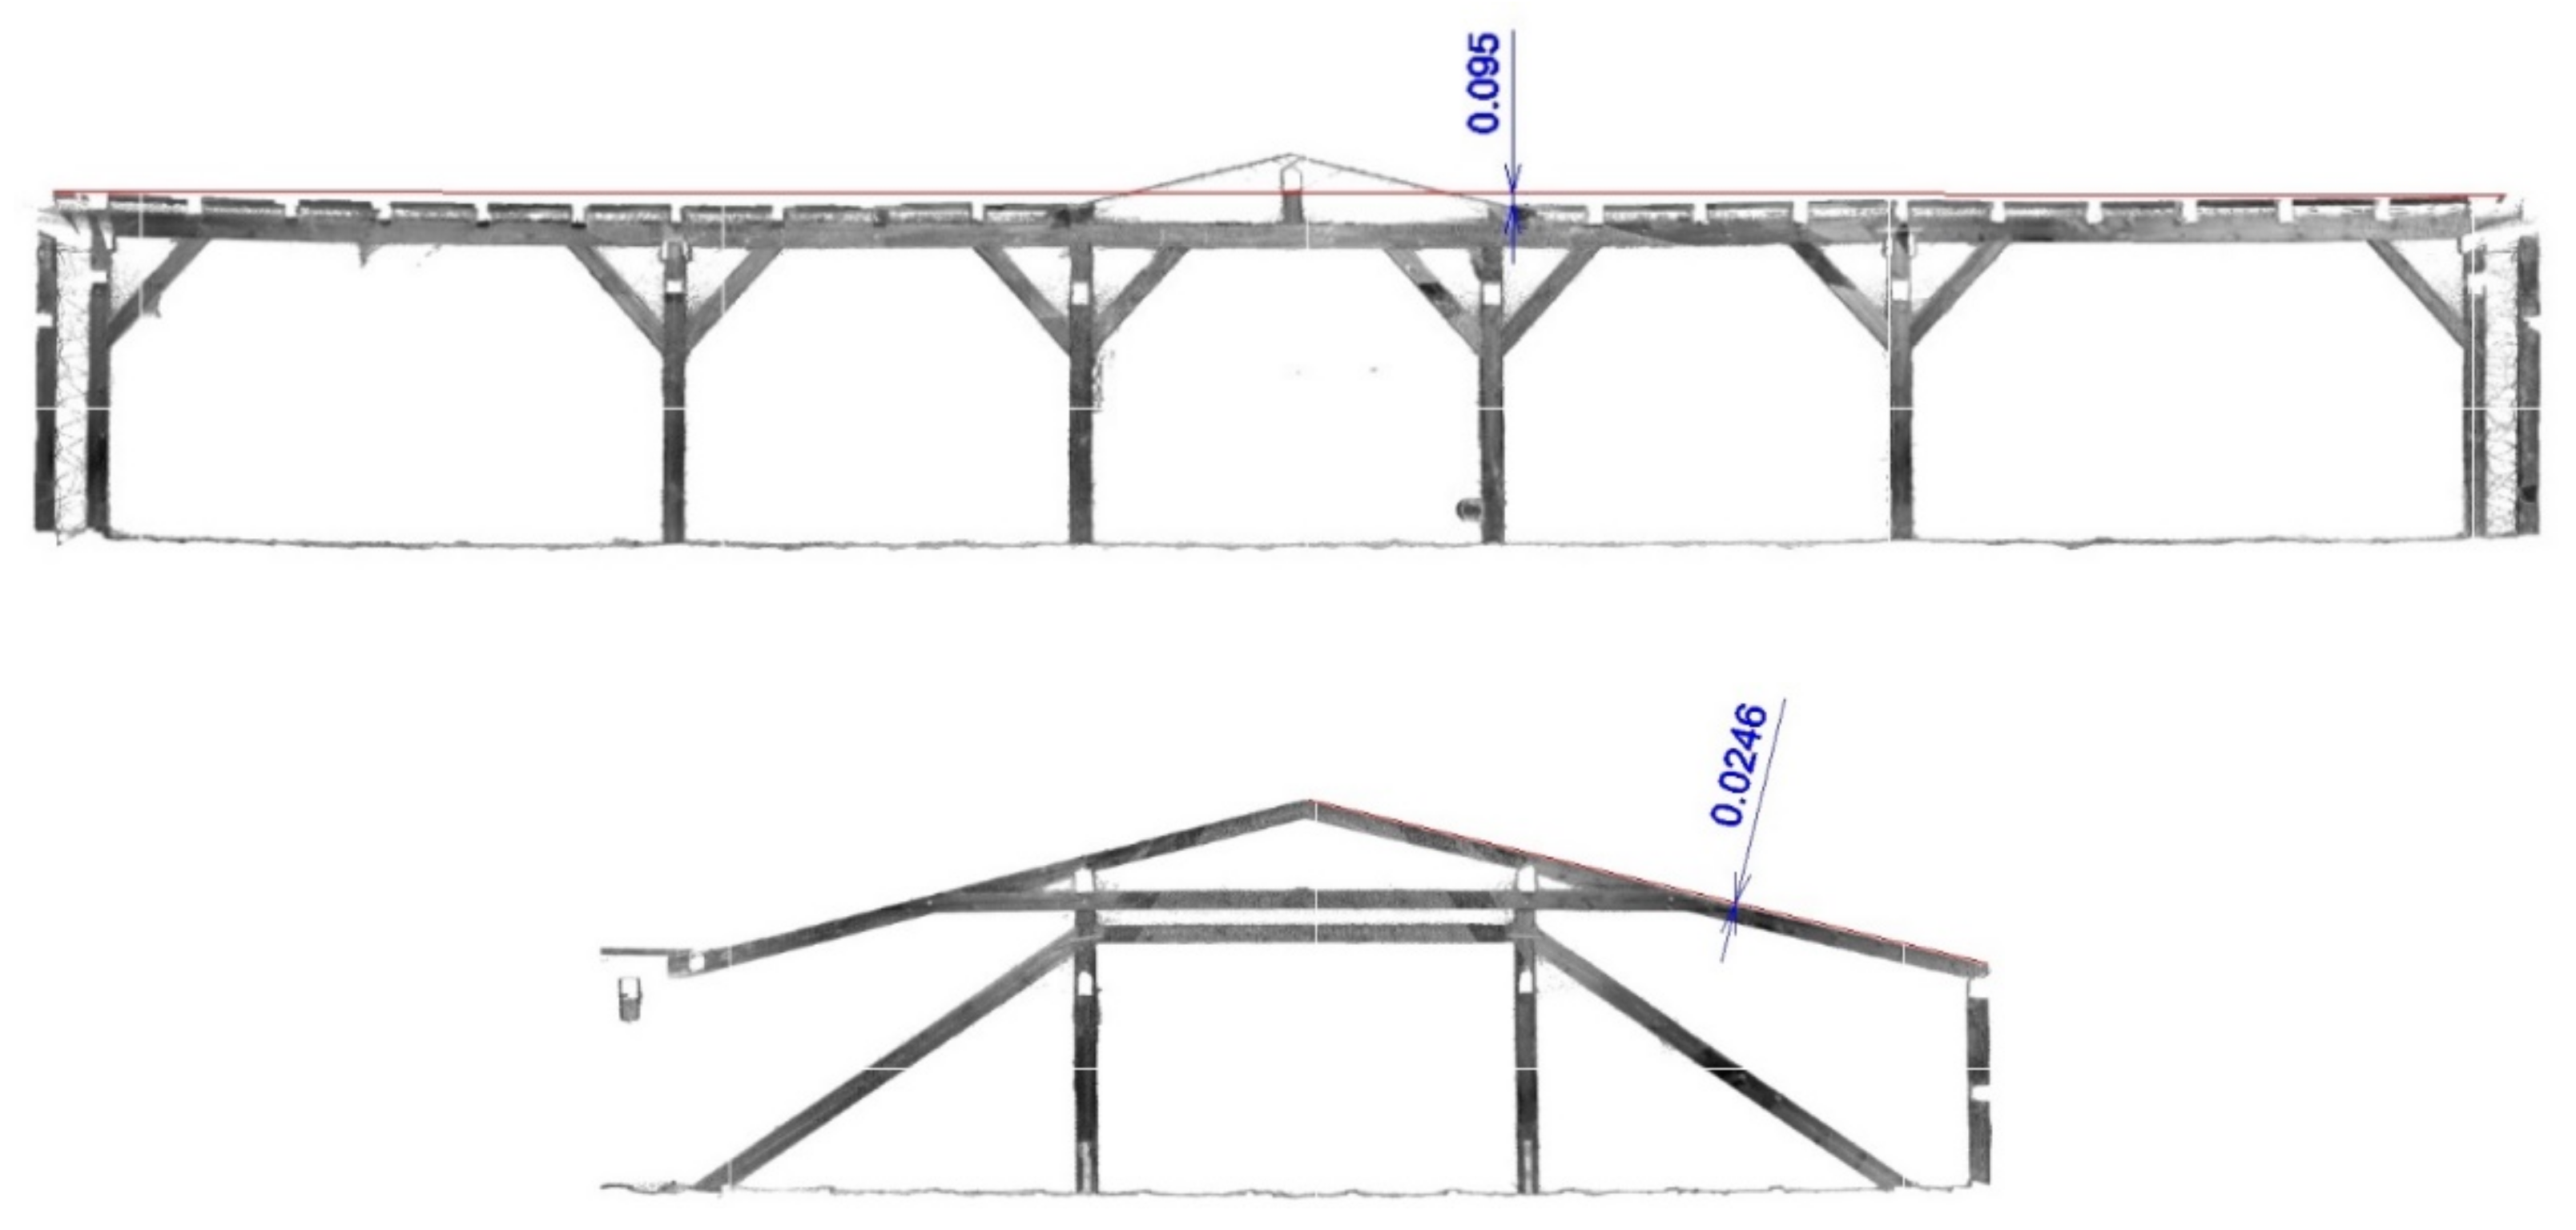
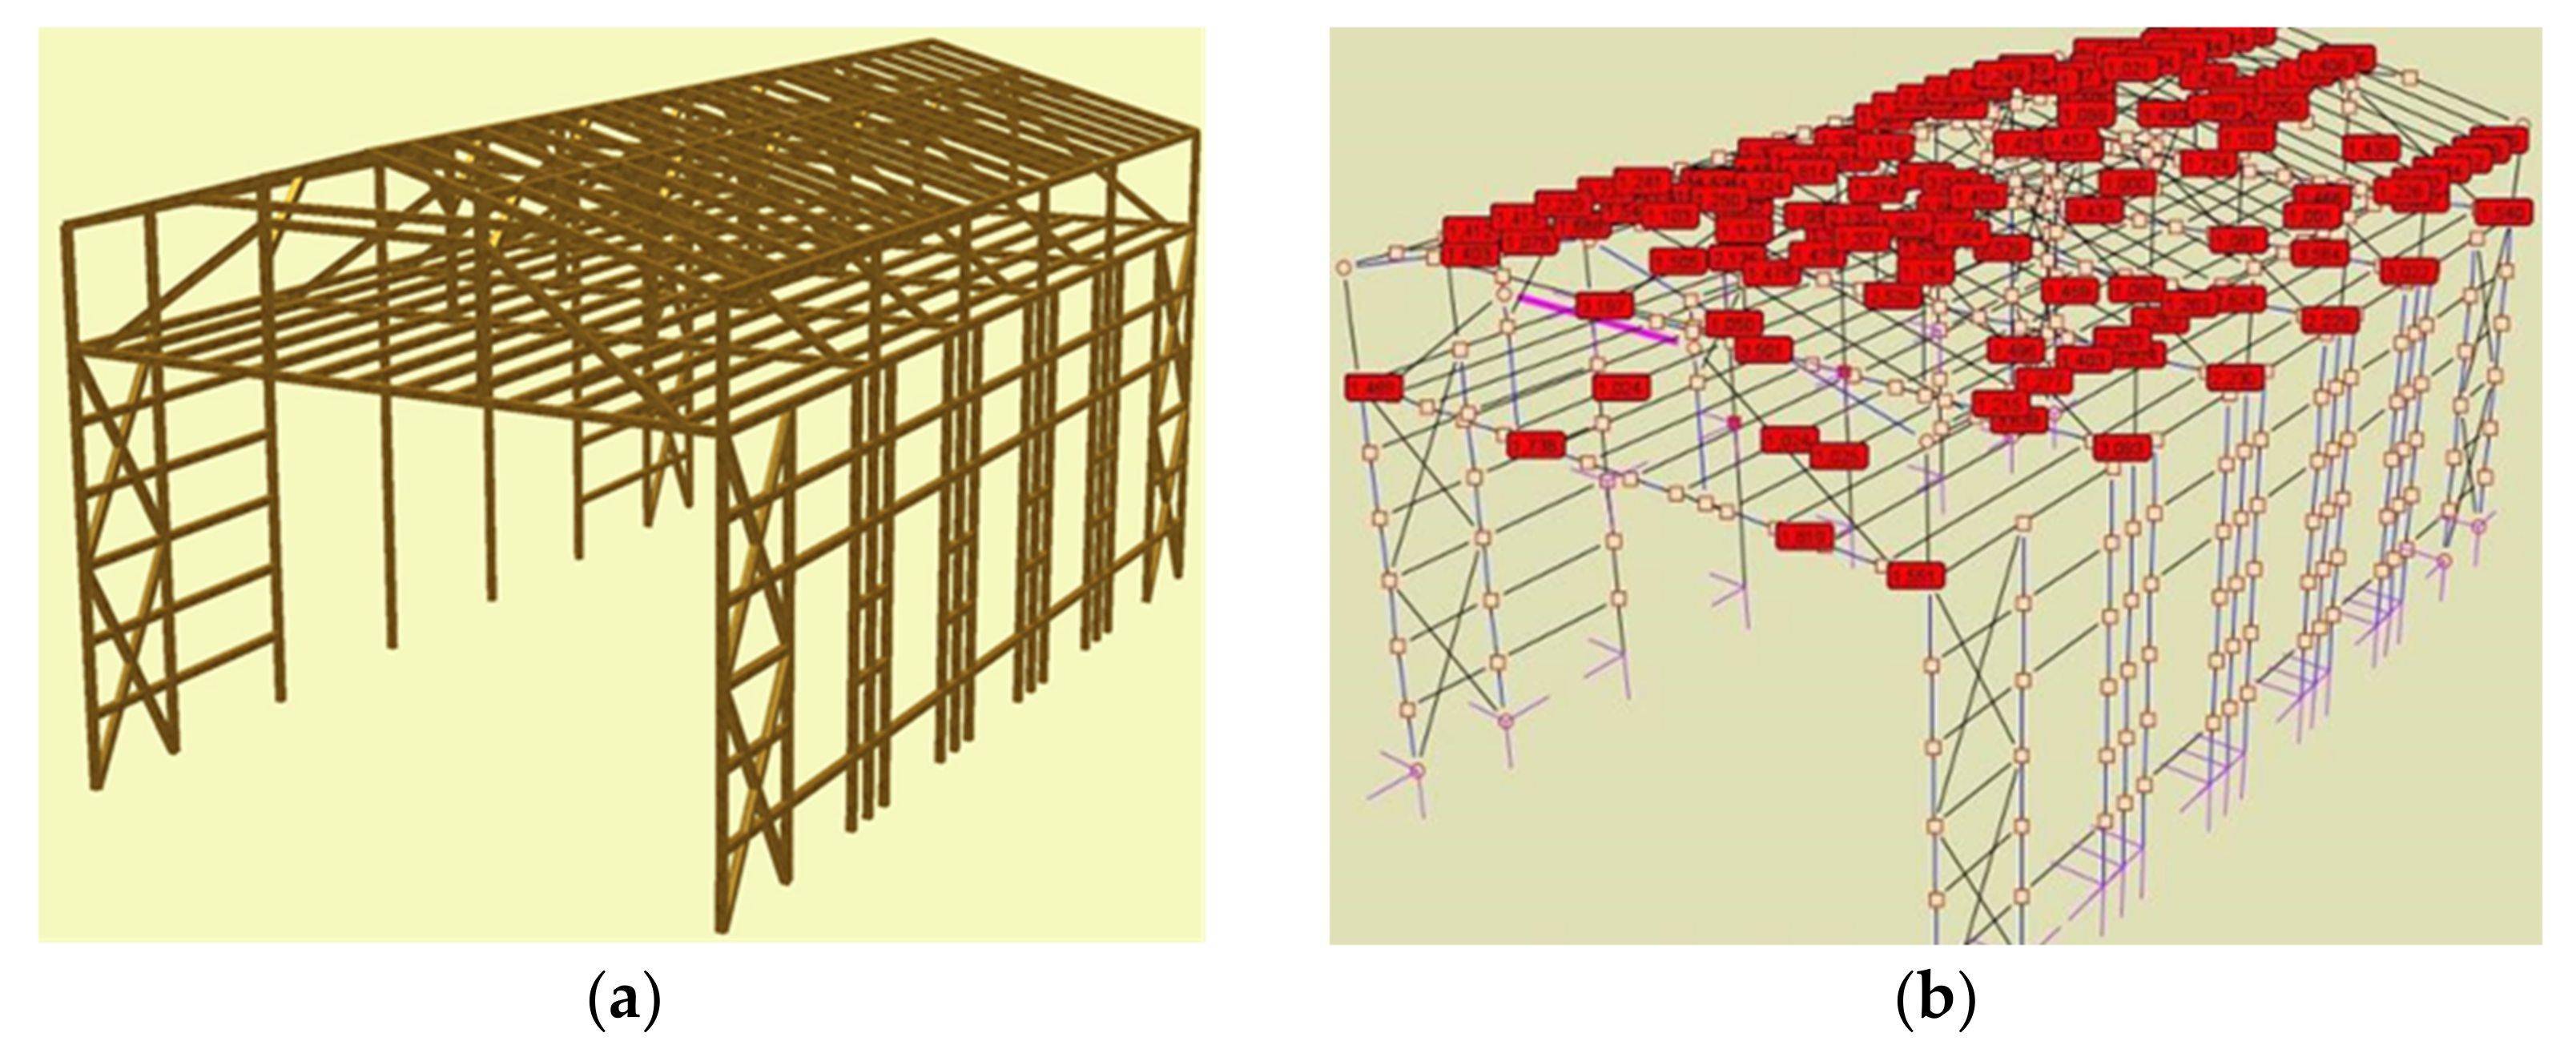
3.1.2. Military Casino
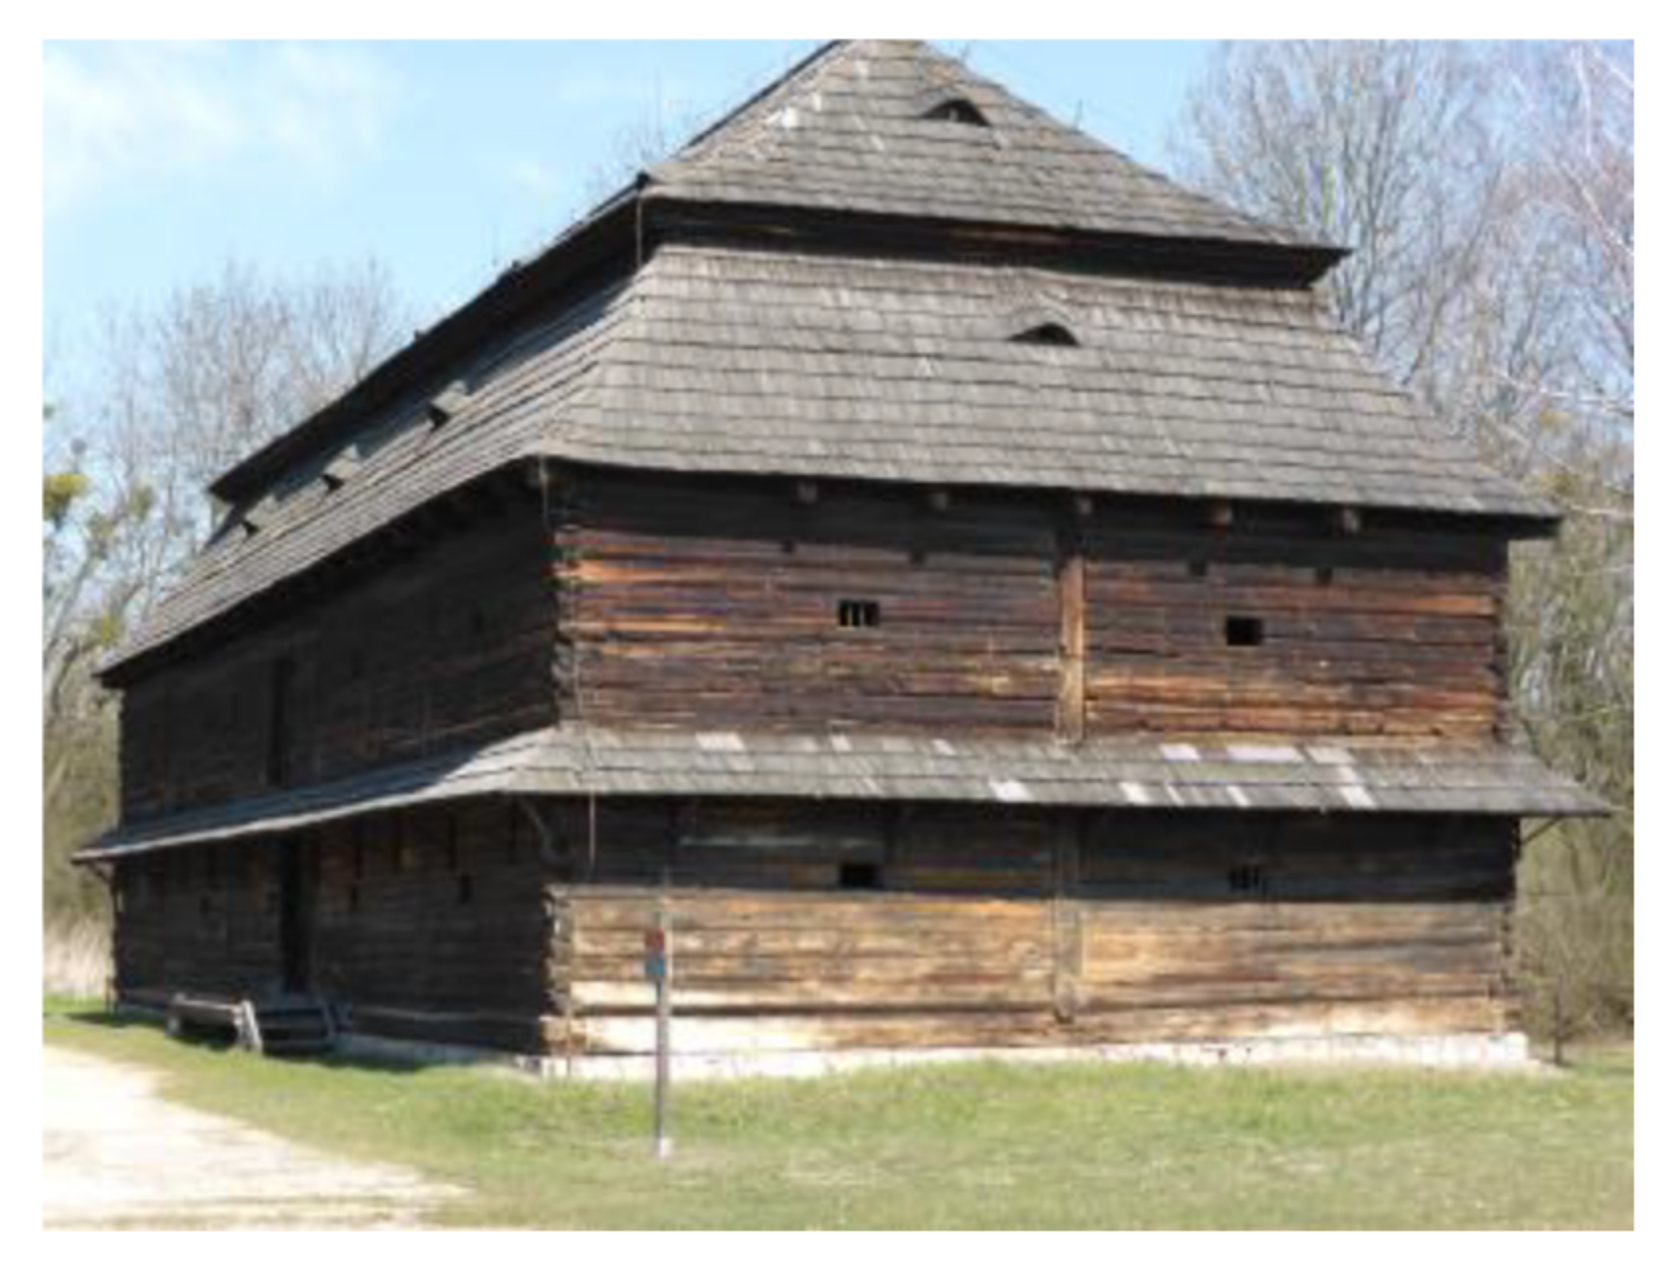
The casino building was constructed in 1885 for the purposes of the training ground headquarters and served as the officers’ casino (Figure 14 and Figure 15). It contained and still contains a hall (previously used as a dining hall) and facilities. It served various functions during the First and Second World Wars. Currently, it has a cultural and educational function, belonging to the Communal Culture, Sports and Recreation Centre in Łambinowice. It was built in light “half-timbered” technology with wooden ceilings and a wooden roof frame. It was founded on brick feet at a depth of approximately 0.80–1.0 m. The building has a segmental construction, one and two storeys. It has a partial basement.
All segments of the building have roofs with a slight slope (approximately 14°) covered with roofing paper on the boarding. Above the main segment (former consumption hall), a two-story wooden structure was built, based on brick and timber load-bearing walls of a “half-timbered” type. The remaining part (segments) of the building was constructed similarly, the only difference being that the roof was based on wooden rafters and purlin trusses. The bottom finish of the ceiling over the main hall of the building is a light suspended ceiling, insulated with mineral wool about 20 cm thick on a light wooden grid, finished with wood from below. In the rest of the rooms, there is a layer of top on the ceiling of the attic, which is finished with plaster underneath.
The 3D HDS scanner used proved to be an excellent tool for obtaining a detailed inventory of the object. The device created a point cloud, which, when processed, gave a very accurate, three-dimensional image of the object. The inventory made in this way was used for further work. The observed deflection (Figure 16) of the roof structure is caused by many years of use of the object.
Most of the elements showed signs of insect feeding, technical construction, wood pests, and mechanical damage (loose joints, defects in the elements, excessive sagging). These structures required bevelling and cleaning of the outer layers (insect-damaged) down to “healthy” wood, impregnation with an agent against fungi (mould), insects, and protection against fire. In addition, all damaged connections had to be reinforced without disturbing the geometry of the roof structure and without allowing the knots to become stiff. The lowest perimeter foundations were in the worst condition. The wear and tear of the foundations was estimated to be approximately 50%.
In Figure 17a, a structure calculation diagram is given, together with an indication of elements that may not meet the load-bearing capacity condition. Furthermore, the calculation results clearly show that the displacements are considerably exceeded, especially for the columns, but the ballast provided by the brick fill is not taken into account in the calculation model.
The conducted research has shown that despite the reduction in the active cross-sections of the building structure as a result of advanced biological corrosion (Table 2), based on the calculations carried out for the most unfavourable load combination, the exceeding of the load capacity was not found in the columns, while the exceeding of the load capacity may occur in the elements of the roof truss, in some cases even by 2.5 times. The exceeding of the limit states is also evidenced here by the roof deformation, shown in Figure 17b. The roof truss of the building shows traces of alterations, reinforcement, and replacement of structural elements. The repairs carried out thus far were made without any preliminary design, so they must be considered accidental and do not improve the safety of the roof structure or the whole building.

3.1.3. Granary

The walls of the buildings in question (Figure 18) (internal and external) were constructed in the rim technology without the use of nails, with horizontally positioned beams connected in the corners mainly by locks with or without the so-called extensions. Individual layers of beams (ring beams) were joined with oak dowels to prevent movement. The remaining gap between the beams (about 2 cm thick) was filled with straw, string bundles, dried moss, or the so-called tongue and groove joints.
Figure 19 shows the principle of creating wall connections on the beam. Particularly noteworthy here are the tightness of the connections of the individual beams and the uniformity of the partitions in the corners (nodes) of the buildings, even after 200 years of use. The walls made in this way constituted a uniform structure throughout their entire surface, with small thermal bridges at the horizontal joints of the beams (Figure 20).
The moisture of the wood mass was measured using a Protimeter MMS2 moisture meter (Figure 21a). The moisture mass content of the wood did not exceed 15% at any of the measurement locations. Examination of the wood using a resistograph did not show any loss in its structure greater than 10% of the active cross-section of the elements (Figure 21b).
Figure 22 shows the distribution of temperature and moisture in a homogeneous tie wall made of wooden logs. A homogeneous (parallel) adiabatic pattern of heat flux can be clearly seen, indicating the stability of the wall structure (Figure 22a). Furthermore, the moisture level in the interior of the wall and its internal surface showed small variations (Figure 22b). Simulation calculations were carried out for a wall approximately 20 cm thick using Physibel Trisco 13v software (temperature distribution) and WUFI 2D software (moisture content).
The described objects served only as “starting material” for the study of wooden structures. The parameters of the natural material used and the technology of erection of these objects confirm the durability of such structures, limiting the necessary scope of interference in their structure and thus the frequency of repair work, recycling of technically worn-out structures, and making new supplementary and replacement elements. The problem of lower thermal insulation of the partitions of wooden buildings can be solved in a very simple way by leaving their external façade unchanged and installing thermal insulation layers on the internal sides. In this case, the movement of low- and sometimes negative-temperature zones towards the layer of new thermal insulation should not cause any problems with maintaining the internal temperature of the room at a safe level and with the required microclimate. This can be proved by the described granary building in the open-air museum, which is not heated and in winter the whole cross-section of its envelope is in the range of low temperatures. Tests have confirmed the high durability and resistance of wood as a construction material to variations in temperature and humidity. Insulating partitions from the inside with low-density materials (foamed polystyrene, mineral wool, mineral thermal insulation panels) reduces the thermal inertia of building partitions but at the same time will reduce the energy consumption for space heating, such as such elements as preheating of the partitions themselves in winter, and their cooling in summer is eliminated. Thermal insulation materials and wood accumulate heat to a very low degree. The heat capacity of wood as a building material is 2.6 times less than that of concrete and twice as low as that of brick and silicates. Therefore, it can play an essential role in the rapid stabilisation of temperature and humidity in rooms; thus, these parameters can be maintained more easily by using, for example, recuperation. Wood construction based on tie beam wall structures should be considered as low energy consumption during production, exploitation, and recycling. Moreover, it can “guarantee” over two hundred years of safe technical life with full thermal and moisture stability and without the need for major repairs or replacements. Biological corrosion caused by fungi is not a problem in these buildings, except in their foundation parts. The walls of these buildings have smooth external surfaces and are protected from precipitation by properly extended eaves. In their lower parts, the corrosion was caused by splash water, which consequently led to the decomposition of brown wood (Figure 23c). In the so-called rests of the walls, there were numerous delaminations of fibres and locally an infestation of blue stain of wood, i.e., a much milder type of fungus than in brown decay. No fungal infestation was found on the elements and structures within these buildings. There are numerous now defunct insect feeding sites, including Common Furniture Beetle (Anobium punctatum) (Figure 23a) and House Longhorn Beetle (Hylotrupes bajulus) (Figure 23b), but due to the considerable weight of the timber used to make the partitions, no major damage or threats to the building structures were found here. The resistograph test showed small losses in the mass of the wood, up to a maximum of 10%. In conclusion, it should be considered that wood, in terms of durability and energy efficiency with full thermal stability, is a suitable material for wooden structures and entire buildings.

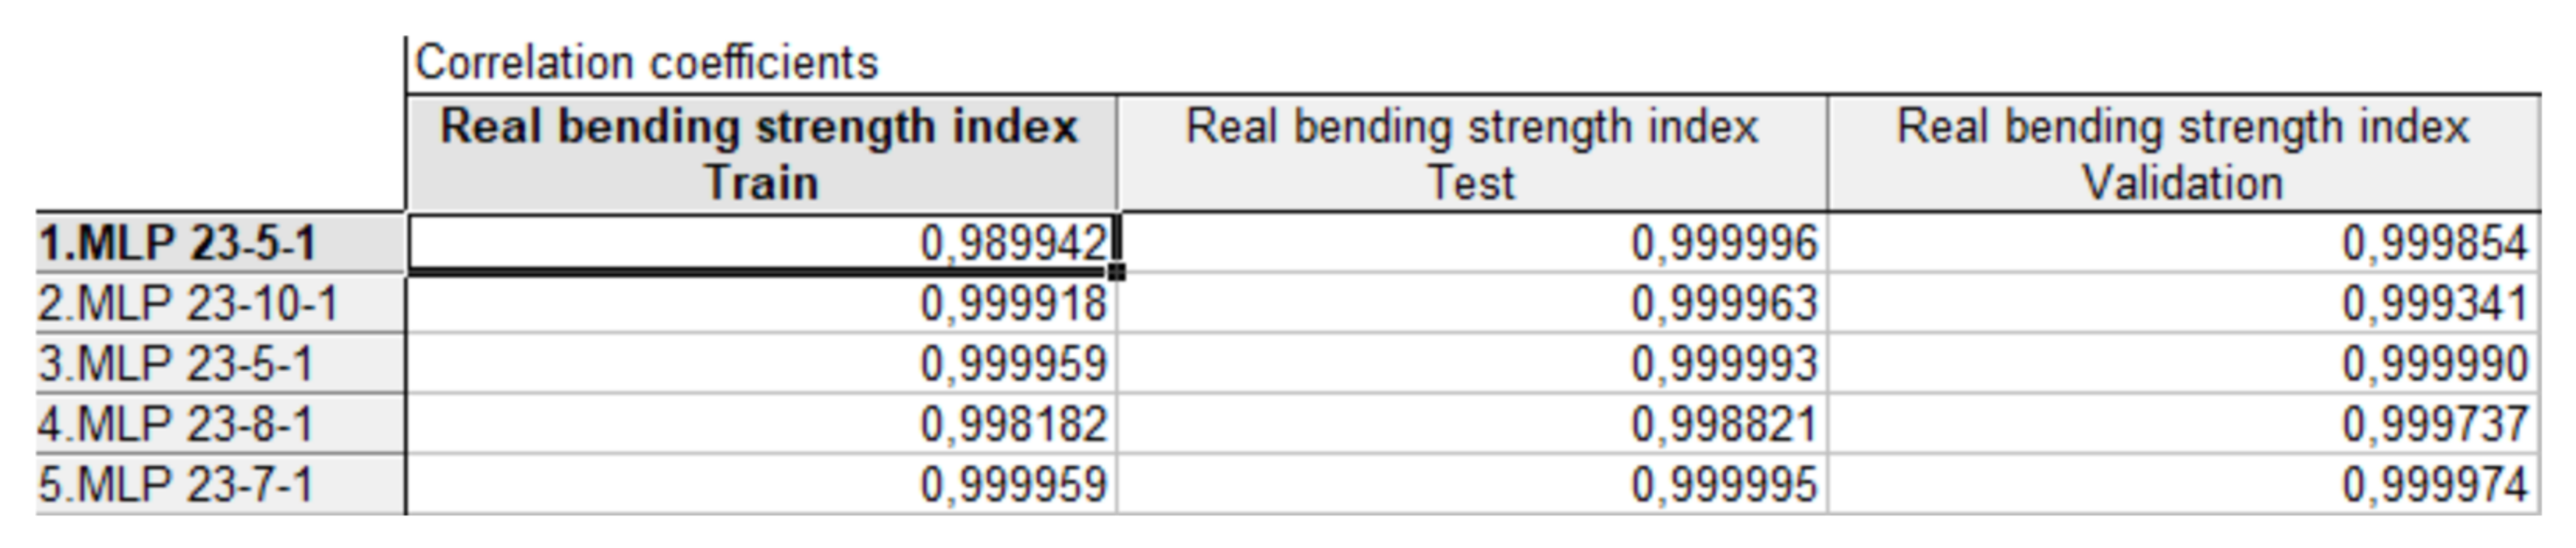
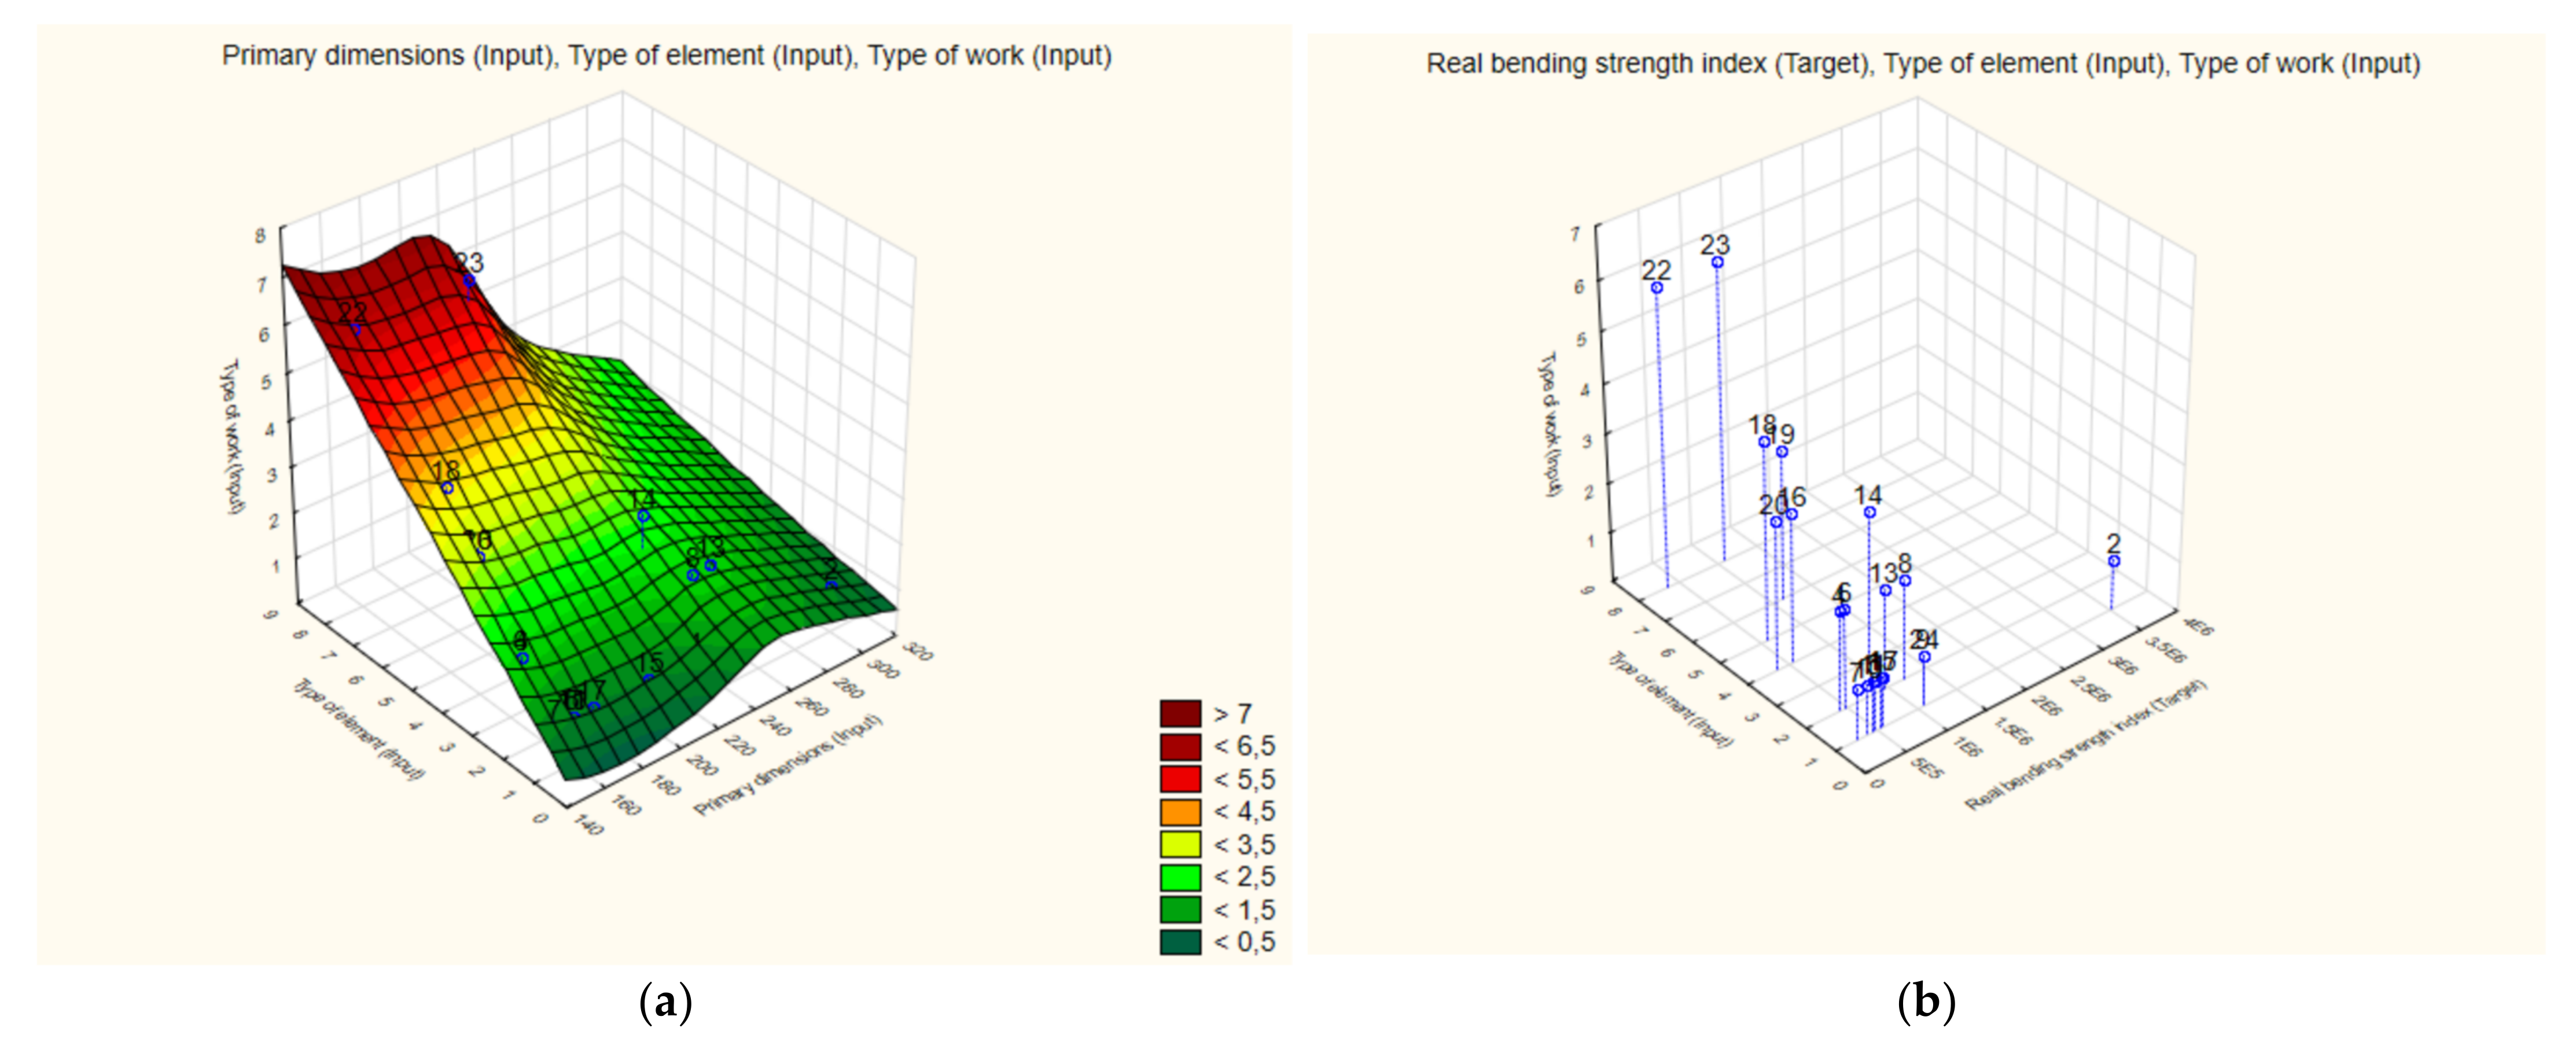
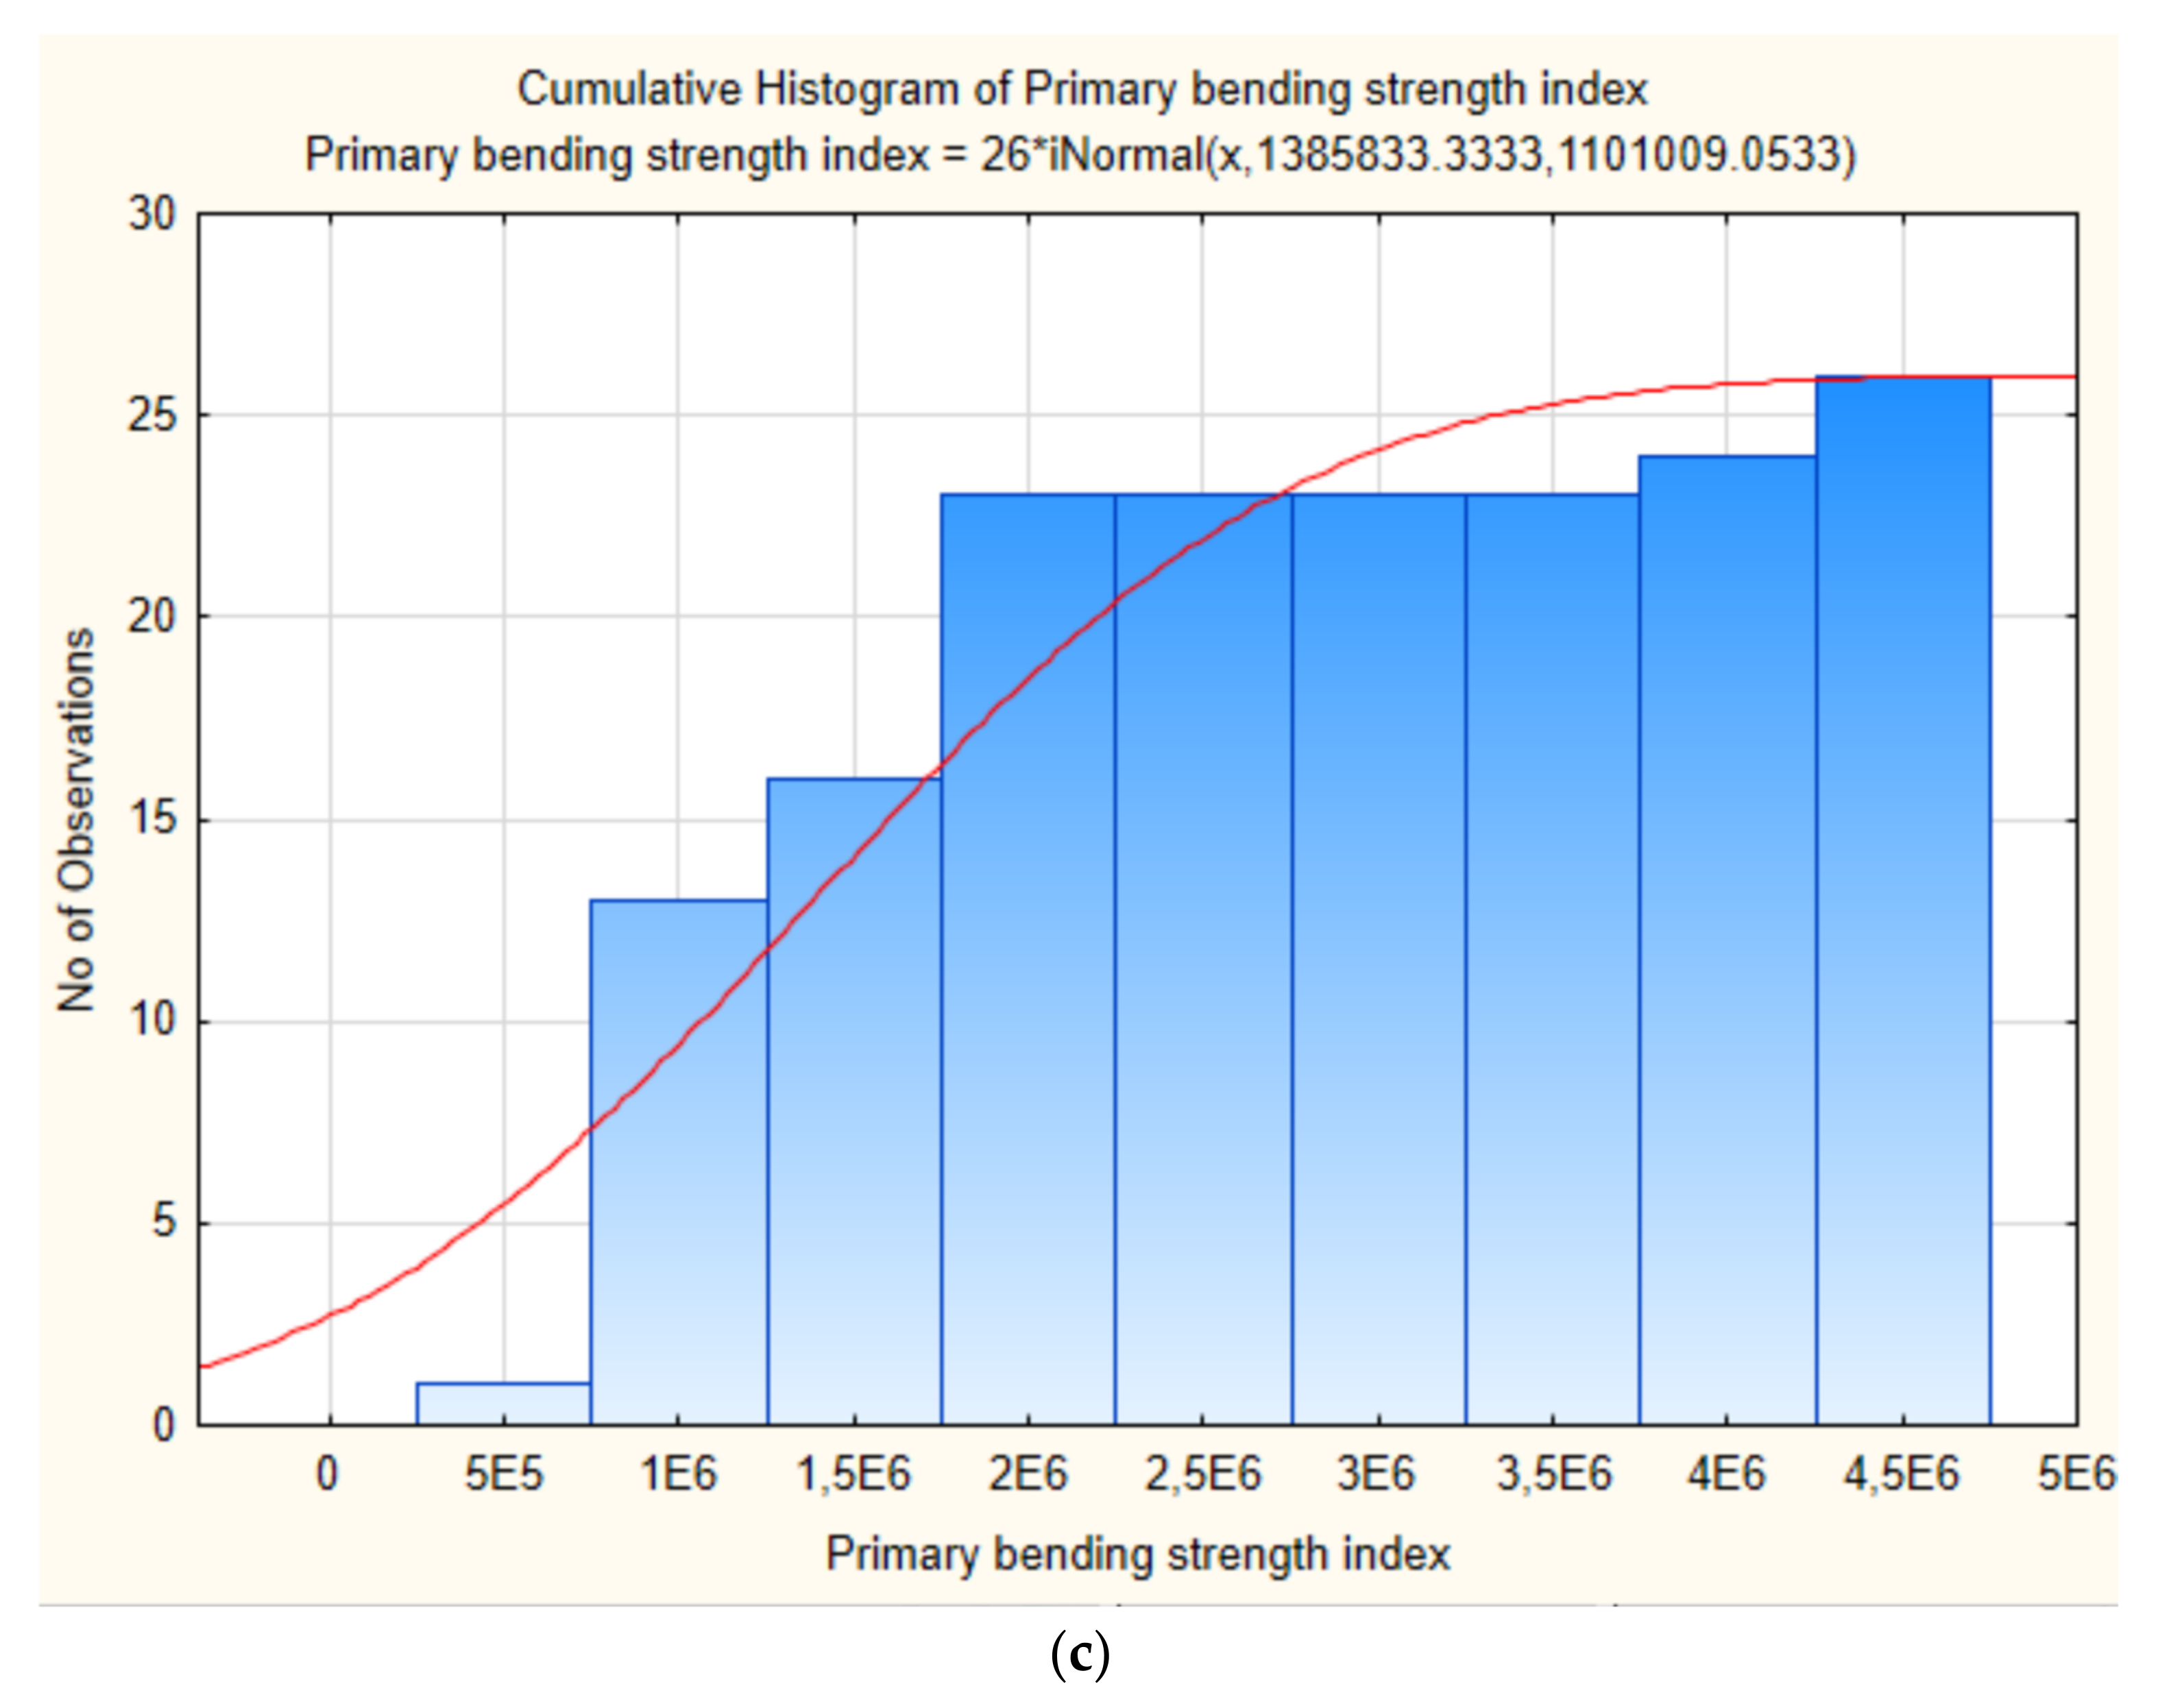
3.2. Prediction of Selected Characteristics of Biologically Corroded Wood

A distinguishing feature among other computer methods is that artificial neural networks specifically generate relationships between input information and output information in the form of a data matrix (Table 3). SSNs differ in an important way from conventional computer programs, which can be described as sequential; that is, to solve a computational problem, an algorithm must be created consisting of a given sequence of instructions. They are executed in a preset order, so in such a programme, all eventualities to which the programme is to react must be foreseen, e.g., how strong the relation between the degree of reduction in the actual cross-section and the compressive strength of the wood is, and they must be appropriately located in the preset instruction. In the operation of the neural network, we can distinguish the learning stage, when the network collects the information needed to determine what to do and how (this stage also includes validation), and the stage of normal operation during which, based on the acquired knowledge, the network solves specific tasks. The MLP network that was built for forecasting, for the problem under consideration, has the following topology:
  • Number of inputs: 5.
  • Network type: multilayer perceptron (unidirectional multilayer networks, MLP networks).
  • Learning algorithm—BFGS (variable metric method).
  • Number of neurons in the hidden layer: 4–6.
  • Error function: sum of squares.
  • Output function linear.
The characteristic of the problem for the network under consideration is regression. This description of the relationship is used to build models showing the actual relationship between the input data (explanatory) and the output variable (explained). Then, the events are performed in the following sequence: values of explanatory variables (type of element, nature of work of the element, primary dimensions, primary cross-section, primary flexural strength index, real effective dimensions, real effective cross-section)—neural network—value of the explained variable (real flexural strength index).
The characteristic problem of the network considered is regression. This description of the relationship is used to build models showing the actual relationship between the input (explanatory) data and the output (explanatory) variables. Then, the events are performed in the following sequence: values of explanatory variables (type of element, nature of work of the element, primary dimensions, primary cross-section, primary flexural strength index, real effective dimensions, real effective cross-section); neural network; value of the explained variable (real flexural strength index). The test results (Figure 24) were analysed according to the defined network topology. The results obtained as a result of the network operation explain the problem with high precision, as the validation (quality of prediction, understood as a comparison of the predicted value with the values from the validation set (Figure 25), i.e., the one on which the program did not learn or test) was 98 %, which should be considered as a correct result at this level of neural network creation. Example results of the prediction (for individual networks and for the set of the networks) of mechanical characteristics of wood are presented graphically in Figure 26.
Based on the above calculations, a code can be generated in Statistica software to predict the true strength index at a convergence level of 98% (compared to the presented data matrix, as SNS do not have extrapolation capability). On average, there was a 19% reduction in cross-section and a 26% reduction in strength index (Figure 27).
The simulation data subjected to the SNN section were validated (prognosis quality, understood as a comparison of the predicted value with the values of the validation set, i.e., the one on which the programme did not learn or test).
SSN algorithms (artificial neural networks) are a tool perceived as informative, although learning in time, as they have the ability to adapt the amount of knowledge they possess to the possibility of its dynamic change. This is a fundamental characteristic, as this ability determines the possibility of self-learning, which significantly speeds up the execution of calculations. Learning consists of changing the coordinates of neurons so that they follow a pattern consistent with the structure of the data analysed. Therefore, the calibration of the phenomenological (abstract) model created by the network consists of an adequate selection of weights in the learning process. During the learning process, some connections (weights between neurons) become more important and some do not participate in solving the problem, so it is possible to determine which variables are important in terms of solving the problem.

4. Discussion

This article discusses the subject of facilities that have been in operation for many years, as well as newer ones that are now being built using more modern technologies. The results obtained as a result of the network operation explain the problem with high precision because the validation (quality of forecasting, understood as a comparison of the forecasted value with the values from the validation set, i.e., the one on which the program did not learn or test) was 98%, which should be considered a correct result at this level of neural network creation. This means that it is possible to generate a code, which can then be implemented for the prediction of selected wood characteristics at the level of convergence of 98% compared to the presented data matrix, because SSNs do not have the possibility of extrapolation beyond the set interval. The prediction of wood properties is a difficult task (due to the structure of wood, anisotropy) and requires taking into account a number of factors (time, temperature, working conditions, etc.). The expansion of the database created by the authors to both quantitative and qualitative data may allow the development of a non-destructive diagnostic method for timber structures.
It should be emphasised that the average reduction in section size was 19% and in strength by 26%. The maximum cross-sectional reduction was 27%, where the cross-section decreased from 150 × 150 mm to 150 × 110 mm. The obtained results, subjected to visual inspection confirmed by optimisation performed with the use of neural networks, show that embedded wood materials can be successfully used as load bearing elements as well as thermal insulation and cladding elements in terms of environmental load throughout their life cycle. It was also confirmed that it is possible to use building components made of recycled materials in the construction of wooden buildings as a full substitute for standard building materials from nonrenewable sources. It must be said that wood, in terms of durability and energy efficiency with full thermal stability, is the right material for wooden structures and entire buildings.

5. Conclusions

The cases described in the article are very interesting from a structural and conservation point of view. The results of the investigation, mainly regarding wooden elements in objects in a pre-failure condition, whose external examination did not raise any objections, indicated the possibility of easy but significant mistakes in the assessment of the technical condition of buildings, which may have a significant impact on their future safe exploitation. This indicates that it is reasonable and even necessary to conduct a thorough examination of the technical condition of buildings before taking a final decision on the scope of the repair works planned for them. In technical assessment, their authors, especially those with a short professional experience, are too often based only on their own superficial visual inspections, while the whole conclusions are based on the results of calculations obtained with the use of universal computer programs. Such an assessment often does not reflect the actual technical condition of the object. Reliable assessment of technical conditions should be worked out on the basis of detailed object inventory (including material inventory), inventory and assessment of damages, and the degree of wear of building elements determining their safety and its causes. At the same time, it should take into account the significant influence of the physical processes that take place inside the partitions on the durability of the materials built in them. From the summary of conclusions from such studies and analyses, the experience and knowledge of the expert should aim to develop such repair methods which, supported by an appropriate calculation apparatus, can be implemented. The static strength calculation in the assessment of technical conditions of buildings should not be an end in itself, but only a tool to assist in the practice of construction and conservation.
A professional approach to carrying out technical inspections of buildings and structures will not only keep them in good technical condition and prolong their lifespan, but will also reduce the need to obtain and process new raw materials in this case construction timber, to replace damaged structures with new ones, to strengthen them locally, or to fill cavities. Such preventive measures will also significantly reduce the energy required to produce the replacement of materials and will certainly minimise the costs of their manufacture, transport, and installation. Wood, which is in constant decline in the natural environment, is an excellent and very effective filter for removing CO2 from the air. Acquiring new wood without simultaneous afforestation of areas degraded by logging may disturb the ecological system of the environment even beyond the region. Appropriate sorting of demolition timber (parts of which are damaged) will make it possible to recover some of it and rebuild it, which will reduce disposal costs and thus save space in landfill sites, which are already shrinking.
The authors of the paper based their observations and conclusions on several dozens of exploited buildings, mainly historic ones, whose structures were partly or fully made of wood. The basis for technical assessment was the analysis of the technical inspection protocols (expert opinions) of these buildings, in which experts, limiting themselves only to visual inspection of buildings and structures, did not detect the factors that cause their actual degradation. Corroded elements of pillars, ceilings, or roofs required their complete replacement, even if only partially; that is, they had to be removed from the building, used, and replaced with new ones. At the time of an energy and material crisis (progressing shortages of timber in Europe and Asia), it is already becoming a serious regional environmental problem on a large scale.

Author Contributions

Conceptualization, D.B., A.G. and Ł.B.; methodology, D.B., A.G. and Ł.B.; software, D.B., A.G. and Ł.B.; validation, D.B., A.G. and Ł.B.; formal analysis, D.B., A.G. and Ł.B.; investigation, D.B., A.G. and Ł.B.; resources, D.B., A.G. and Ł.B.; data curation, D.B., A.G. and Ł.B.; writing—original draft preparation, D.B., A.G. and Ł.B.; writing—review and editing, D.B., A.G. and Ł.B.; visualization, D.B., A.G. and Ł.B.; supervision, D.B., A.G. and Ł.B.; project administration, D.B., A.G. and Ł.B.; funding acquisition, D.B., A.G. and Ł.B. All authors have read and agreed to the published version of the manuscript.

Funding

This research received no external funding.

Institutional Review Board Statement

Not applicable.

Informed Consent Statement

Not applicable.

Conflicts of Interest

The authors declare no conflict of interest.

References

  1. Schmidt, J.; Kaliske, M. Models for numerical failure analysis of wooden structures. Eng. Struct. 2009, 31, 571–579. [Google Scholar] [CrossRef]
  2. Konopka, D.; Gebhardt, C.; Kaliske, M. Numerical modelling of wooden structures. J. Cult. Herit. 2017, 27, S93–S102. [Google Scholar] [CrossRef]
  3. Oudjene, M.; Khelifa, M. Finite element modelling of wooden structures with large deformations and brittle failure prediction. Mater. Des. 2009, 30, 4081–4087. [Google Scholar] [CrossRef]
  4. Marsili, R.; Rossi, G.; Speranzini, E. Fibre Bragg Gratings for the Monitoring of Wooden Structures. Materials 2017, 11, 7. [Google Scholar] [CrossRef] [PubMed] [Green Version]
  5. Harkouss, F.; Fardoun, F.; Biwole, P.H. Optimization approaches and climates investigations in NZEB—A review. Build. Simul. 2018, 11, 923–952. [Google Scholar] [CrossRef]
  6. Tabrizi, A.; Sanguinetti, P. Life-cycle cost assessment and energy performance evaluation of NZEB enhancement for LEED-rated educational facilities. Adv. Build. Energy Res. 2015, 9, 267–279. [Google Scholar] [CrossRef]
  7. Zheng, L.; Lai, J. Environmental and economic evaluations of building energy retrofits: Case study of a commercial building. Build. Environ. 2018, 145, 14–23. [Google Scholar] [CrossRef]
  8. Yan, Y.; Zhang, H.; Meng, J.; Long, Y.; Zhou, X.; Li, Z.; Wang, Y.; Liang, Y. Carbon footprint in building distributed energy system: An optimization-based feasibility analysis for potential emission reduction. J. Clean. Prod. 2019, 239, 117990. [Google Scholar] [CrossRef]
  9. Fenner, A.E.; Kibert, C.J.; Li, J.; Razkenari, M.A.; Hakim, H.; Lu, X.; Kouhirostami, M.; Sam, M. Embodied, operation, and commuting emissions: A case study comparing the carbon hotspots of an educational building. J. Clean. Prod. 2020, 268, 122081. [Google Scholar] [CrossRef]
  10. Yongtao, L.; Chao, H.; Xiuqin, M.; Fankun, W. Co-benefit Research on Energy Efficiency Reforming Project of District Heating System. Energy Procedia 2011, 5, 598–603. [Google Scholar] [CrossRef] [Green Version]
  11. Proszak-Miąsik, D.; Rabczak, S. Methods for reducing low emissions from heating devices in single- family housing. E3S Web Conf. 2018, 45, 00069. [Google Scholar] [CrossRef] [Green Version]
  12. Kaczmarczyk, M.; Sowiżdżał, A.; Tomaszewska, B. Energetic and Environmental Aspects of Individual Heat Generation for Sustainable Development at a Local Scale—A Case Study from Poland. Energies 2020, 13, 454. [Google Scholar] [CrossRef] [Green Version]
  13. Raczyński, M.; Rutkowski, R. How Pro-Environmental Legal Regulations Affect the Design Process and Management of Multi-Family Residential Buildings in Poland. Energies 2020, 13, 5449. [Google Scholar] [CrossRef]
  14. Borys, G. Selected directions of increasing efficiency in supporting thermomodernization in buildings from public funding. Pr. Nauk. Uniw. Ekon. We Wrocławiu 2015. [Google Scholar] [CrossRef]
  15. Rey-Hernández, J.; Velasco-Gómez, E.; Tejero-González, A.; Rey-Martínez, F. Energy Analysis at a Near Zero Energy Building. A Case-Study in Spain. Energies 2018, 11, 857. [Google Scholar] [CrossRef] [Green Version]
  16. Marrone, P.; Gori, P.; Asdrubali, F.; Evangelisti, L.; Calcagnini, L.; Grazieschi, G. Energy Benchmarking in Educational Buildings through Cluster Analysis of Energy Retrofitting. Energies 2018, 11, 649. [Google Scholar] [CrossRef] [Green Version]
  17. Guizzardi, M.; Carmeliet, J.; Derome, D. Risk analysis of biodeterioration of wooden beams embedded in internally insulated masonry walls. Constr. Build. Mater. 2015, 99, 159–168. [Google Scholar] [CrossRef]
  18. Dylewski, R. Optimal Thermal Insulation Thicknesses of External Walls Based on Economic and Ecological Heating Cost. Energies 2019, 12, 3415. [Google Scholar] [CrossRef] [Green Version]
  19. Dylewski, R.; Adamczyk, J. Impact of the Degree Days of the Heating Period on Economically and Ecologically Optimal Thermal Insulation Thickness. Energies 2020, 14, 97. [Google Scholar] [CrossRef]
  20. Oregi, X.; Hernández, R.J.; Hernandez, P. Environmental and Economic Prioritization of Building Energy Refurbishment Strategies with Life-Cycle Approach. Sustainability 2020, 12, 3914. [Google Scholar] [CrossRef]
  21. Dobrzycki, A.; Kurz, D.; Mikulski, S.; Wodnicki, G. Analysis of the Impact of Building Integrated Photovoltaics (BIPV) on Reducing the Demand for Electricity and Heat in Buildings Located in Poland. Energies 2020, 13, 2549. [Google Scholar] [CrossRef]
  22. Ramczyk, M. Legal bases and economic conditions of applying renewable energy resources in construction industry. MATEC Web Conf. 2018, 174, 04004. [Google Scholar] [CrossRef]
  23. Kozik, R.; Karasińska-Jaśkowiec, I. Green public procurement—legal base and instruments supporting sustainable development in the construction industry in Poland. E3S Web Conf. 2016, 10, 00044. [Google Scholar] [CrossRef] [Green Version]
  24. Dyrektywa 5 Parlamentu Europejskiego i Rady 2005/32/WE z Dnia 6 Lipca 2005. Available online: https://eur-lex.europa.eu/legal-content/PL/TXT/PDF/?uri=CELEX:32005L0032&from=en (accessed on 30 July 2021).
  25. Rozporządzenie Parlamentu Europejskiego i Rady (UE) nr 305/2011 z Dnia 9 Marca 2011 r. Ustanawiające Zharmonizowane Warunki Wprowadzania do Obrotu Wyrobów Budowlanych i Uchylające Dyrektywę Rady 89/106/EWG. Available online: https://eur-lex.europa.eu/legal-content/PL/TXT/PDF/?uri=CELEX:02011R0305-20140616&qid=1576663491684&from=EN (accessed on 30 July 2021).
  26. Dyrektywa Parlamentu Europejskiego i Rady 2009/125/WE z Dnia 21 Października 2009 r. Ustanawiająca Ogólne Zasady Ustalania Wymogów Dotyczących Ekoprojektu Dla Produktów Związanych z Energią. Available online: https://eur-lex.europa.eu/legal-content/PL/TXT/PDF/?uri=CELEX:32009L0125&from=ES (accessed on 30 July 2021).
  27. Dyrektywa Parlamentu Europejskiego i Rady 2010/30/UE z Dnia 19 Maja 2010 r. w Sprawie Wskazania Poprzez Etykietowanie Oraz Standardowe Informacje o Produkcie. Zużycia Energii Oraz Innych Zasobów Przez Produkty Związane z Energią. Available online: https://eur-lex.europa.eu/legal-content/PL/TXT/HTML/?uri=OJ:L:2010:153:FULL&from=NL (accessed on 30 July 2021).
  28. Commission of the European Communities. Green Paper—A European Strategy for Sustainable, Competitive and Secure Energy; Official Journal of the European Union: Brussels, Belgium, 2006. [Google Scholar]
  29. Życzyńska, A.; Cholewa, T. The Profitability Analysis Of Enhancement Of Parameters Of The Thermal Insulation Of Building Partitions. Arch. Civ. Eng. 2014, 60, 335–347. [Google Scholar] [CrossRef] [Green Version]
  30. Życzyńska, A.; Cholewa, T. The modifications to the requirements on energy savings and thermal insulation of buildings in Poland in the years 1974–2021. Bud. i Archit. 2015, 14, 145–154. [Google Scholar] [CrossRef]
  31. Basinska, M.; Koczyk, H.; Kosmowski, A. Assessment of Thermo Modernization Using the Global Cost Method. Energy Procedia 2015, 78, 2040–2045. [Google Scholar] [CrossRef] [Green Version]
  32. Basińska, M.; Kaczorek, D.; Koczyk, H. Building Thermo-Modernisation Solution Based on the Multi-Objective Optimisation Method. Energies 2020, 13, 1433. [Google Scholar] [CrossRef] [Green Version]
  33. Basińska, M.; Koczyk, H. Analysis of the possibilities to achieve the low energy residential buildings standards. Technol. Econ. Dev. Econ. 2016, 22, 830–849. [Google Scholar] [CrossRef]
  34. Sobczyk, W.; Sapa, K. Energy balance in a passive solar building. An attempt at economic assessment. E3S Web Conf. 2016, 10, 00086. [Google Scholar] [CrossRef] [Green Version]
  35. Sikora, M.; Siwek, K. Energy audit of the residential building. J. Mech. Energy Eng. 2018, 2, 317–328. [Google Scholar] [CrossRef] [Green Version]
  36. Hałacz, J.; Skotnicka-Siepsiak, A.; Neugebauer, M. Assessment of Reducing Pollutant Emissions in Selected Heating and Ventilation Systems in Single-Family Houses. Energies 2020, 13, 1224. [Google Scholar] [CrossRef] [Green Version]
  37. Nowak, R. Efektywność energetyczna w aspekcie innowacyjnych systemów kominowych. Gaz Woda I Tech. Sanit. 2020, 1, 20–23. [Google Scholar] [CrossRef]
  38. Dylewski, R.; Adamczyk, J. The environmental impacts of thermal insulation of buildings including the categories of damage: A Polish case study. J. Clean. Prod. 2016, 137, 878–887. [Google Scholar] [CrossRef]
  39. Grygierek, K.; Ferdyn-Grygierek, J.; Gumińska, A.; Baran, Ł.; Barwa, M.; Czerw, K.; Gowik, P.; Makselan, K.; Potyka, K.; Psikuta, A. Energy and Environmental Analysis of Single-Family Houses Located in Poland. Energies 2020, 13, 2740. [Google Scholar] [CrossRef]
  40. Michalak, P.; Szczotka, K.; Szymiczek, J. Energy Effectiveness or Economic Profitability? A Case Study of Thermal Modernization of a School Building. Energies 2021, 14, 1973. [Google Scholar] [CrossRef]
  41. Jędrzejuk, H.; Dybiński, O. The Influence of a Heating System Control Program and Thermal Mass of External Walls on the Internal Comfort in the Polish Climate. Energy Procedia 2015, 78, 1087–1092. [Google Scholar] [CrossRef] [Green Version]
  42. Lis, P. Estimated potential for energy savings in heating residential buildings in Poland. E3S Web Conf. 2018, 49, 00068. [Google Scholar] [CrossRef] [Green Version]
  43. Van Gulck, L.; Van de Putte, S.; Delghust, M.; Van Den Bossche, N.; Steeman, M. Environmental and financial assessment of façade renovations designed for change: Developing optimal scenarios for apartment buildings in Flanders. Build. Environ. 2020, 183, 107178. [Google Scholar] [CrossRef]
  44. Życzyńska, A.; Suchorab, Z.; Kočí, J.; Černý, R. Energy Effects of Retrofitting the Educational Facilities Located in South-Eastern Poland. Energies 2020, 13, 2449. [Google Scholar] [CrossRef]
  45. Dołęga, W. Selected aspects of national economy energy efficiency. Polityka Energ. Energy Policy J. 2019, 22, 19–32. [Google Scholar] [CrossRef]
  46. Jezierski, W.; Sadowska, B.; Pawłowski, K. Impact of Changes in the Required Thermal Insulation of Building Envelope on Energy Demand, Heating Costs, Emissions, and Temperature in Buildings. Energies 2020, 14, 56. [Google Scholar] [CrossRef]
  47. Firląg, S.; Piasecki, M. NZEB Renovation Definition in a Heating Dominated Climate: Case Study of Poland. Appl. Sci. 2018, 8, 1605. [Google Scholar] [CrossRef] [Green Version]
  48. Firląg, S. Cost-Optimal Plus Energy Building in a Cold Climate. Energies 2019, 12, 3841. [Google Scholar] [CrossRef] [Green Version]
  49. Blaszczok, M.; Baranowski, A. Thermal improvment in residental buildings in veiew of the indoor air quality–Case study for polish dwelling. Archit. Civ. Eng. Environ. 2018, 11, 121–130. [Google Scholar] [CrossRef] [Green Version]
  50. Gładyszewska-Fiedoruk, K.; Krawczyk, D.A. The possibilities of energy consumption reduction and a maintenance of indoor air quality in doctor’s offices located in north-eastern Poland. Energy Build. 2014, 85, 235–245. [Google Scholar] [CrossRef]
  51. Krawczyk, D.A. Analysis of Energy Consumption for Heating in a Residential House in Poland. Energy Procedia 2016, 95, 216–222. [Google Scholar] [CrossRef] [Green Version]
  52. Krawczyk, D.A. Theoretical and real effect of the school’s thermal modernization—A case study. Energy Build. 2014, 81, 30–37. [Google Scholar] [CrossRef]
  53. Michalak, P. The development and validation of the linear time varying Simulink-based model for the dynamic simulation of the thermal performance of buildings. Energy Build. 2017, 141, 333–340. [Google Scholar] [CrossRef]
  54. Chodkowska-Miszczuk, J.; Szymańska, D. Modernisation of Public Buildings in Polish Towns and the Concept of Sustainable Building. Quaest. Geogr. 2014, 33, 89–99. [Google Scholar] [CrossRef] [Green Version]
  55. Sadowska, B. Effects of Deep Thermal Modernization and Use of Renewable Energy in Public Buildings in North-Eastern Poland. In Proceedings of the 20th International Scientific Conference Engineering for Rural Development, Jelgava, Latvia, 26–28 May 2018. [Google Scholar]
  56. Orzechowski, T.; Orzechowski, M. Energy savings due to building insulation of different thickness. E3S Web Conf. 2017, 14, 01030. [Google Scholar] [CrossRef] [Green Version]
  57. Khanam, T.; Rahman, A.; Mola-Yudego, B. Renewable energy and wood fuel productions in the Nordic region: Can it be changed? J. Clean. Prod. 2020, 276, 123547. [Google Scholar] [CrossRef]
  58. Nilsson, L.J.; Johansson, B.; Åstrand, K.; Ericsson, K.; Svenningsson, P.; Börjesson, P.; Neij, L. Seeing the wood for the trees: 25 years of renewable energy policy in Sweden. Energy Sustain. Dev. 2004, 8, 67–81. [Google Scholar] [CrossRef]
  59. Aguilar, F.X.; Mabee, W. Wood: A renewable source of energy. Wood Energy Dev. Econ. Resour. Manag. Econ. Policy 2014, 21–51. [Google Scholar] [CrossRef]
  60. Maia, M.; Morais, R.; Silva, A. Application of the factor method to the service life prediction of window frames. Eng. Fail. Anal. 2020, 109, 104245. [Google Scholar] [CrossRef]
  61. Souviron, J.; van Moeseke, G.; Khan, A.Z. Analysing the environmental impact of windows: A review. Build. Environ. 2019, 161, 106268. [Google Scholar] [CrossRef]
  62. Woroniak, G.; Piotrowska-Woroniak, J. Effects of pollution reduction and energy consumption reduction in small churches in Drohiczyn community. Energy Build. 2014, 72, 51–61. [Google Scholar] [CrossRef]
  63. Alsabry, A. Possibilities of decreasing energy consumption through thermal upgrading in selected buildings in Poland case study: The town of Zielona Góra. Energy Build. 2016, 130, 811–820. [Google Scholar] [CrossRef]
  64. Sekki, T.; Airaksinen, M.; Saari, A. Effect of energy measures on the values of energy efficiency indicators in Finnish daycare and school buildings. Energy Build. 2017, 139, 124–132. [Google Scholar] [CrossRef]
  65. Dias Pereira, L.; Raimondo, D.; Corgnati, S.P.; Gameiro da Silva, M. Energy consumption in schools—A review paper. Renew. Sustain. Energy Rev. 2014, 40, 911–922. [Google Scholar] [CrossRef]
  66. Katsaprakakis, D.A.; Zidianakis, G. Upgrading Energy Efficiency For School BuildingsIn Greece. Procedia Environ. Sci. 2017, 38, 248–255. [Google Scholar] [CrossRef]
  67. Brandão de Vasconcelos, A.; Pinheiro, M.D.; Manso, A.; Cabaço, A. EPBD cost-optimal methodology: Application to the thermal rehabilitation of the building envelope of a Portuguese residential reference building. Energy Build. 2016, 111, 12–25. [Google Scholar] [CrossRef]
  68. Berardi, U.; Manca, M.; Casaldaliga, P.; Pich-Aguilera, F. From high-energy demands to nZEB: The retrofit of a school in Catalonia, Spain. Energy Procedia 2017, 140, 141–150. [Google Scholar] [CrossRef]
  69. Ferrari, S.; Romeo, C. Retrofitting under protection constraints according to the nearly Zero Energy Building (nZEB) target: The case of an Italian cultural heritage’s school building. Energy Procedia 2017, 140, 495–505. [Google Scholar] [CrossRef]
  70. Fedorczak-Cisak, M.; Radziszewska-Zielina, E.; Orlik-Kożdoń, B.; Steidl, T.; Tatara, T. Analysis of the Thermal Retrofitting Potential of the External Walls of Podhale’s Historical Timber Buildings in the Aspect of the Non-Deterioration of Their Technical Condition. Energies 2020, 13, 4610. [Google Scholar] [CrossRef]
  71. Fedorczak-Cisak, M. Efektywność energetyczna oraz niska emisja w krajowych i regionalnych uwarunkowaniach prawnych. Mater. Bud. 2016, 1, 22–24. [Google Scholar] [CrossRef]
  72. Garriga, S.M.; Dabbagh, M.; Krarti, M. Optimal carbon-neutral retrofit of residential communities in Barcelona, Spain. Energy Build. 2020, 208, 109651. [Google Scholar] [CrossRef]
  73. Ortiz, J.; Fonseca i Casas, A.; Salom, J.; Garrido Soriano, N.; Fonseca i Casas, P. Cost-effective analysis for selecting energy efficiency measures for refurbishment of residential buildings in Catalonia. Energy Build. 2016, 128, 442–457. [Google Scholar] [CrossRef] [Green Version]
  74. Mequignon, M.; Ait Haddou, H.; Thellier, F.; Bonhomme, M. Greenhouse gases and building lifetimes. Build. Environ. 2013, 68, 77–86. [Google Scholar] [CrossRef]
  75. Sartori, T.; Calmon, J.L. Analysis of the impacts of retrofit actions on the life cycle energy consumption of typical neighbourhood dwellings. J. Build. Eng. 2019, 21, 158–172. [Google Scholar] [CrossRef]
  76. Maslesa, E.; Jensen, P.A.; Birkved, M. Indicators for quantifying environmental building performance: A systematic literature review. J. Build. Eng. 2018, 19, 552–560. [Google Scholar] [CrossRef]
  77. Goggins, J.; Moran, P.; Armstrong, A.; Hajdukiewicz, M. Lifecycle environmental and economic performance of nearly zero energy buildings (NZEB) in Ireland. Energy Build. 2016, 116, 622–637. [Google Scholar] [CrossRef] [Green Version]
  78. Charvátová, H.; Procházka, A.; Zálešák, M. Computer Simulation of Passive Cooling of Wooden House Covered by Phase Change Material. Energies 2020, 13, 6065. [Google Scholar] [CrossRef]
  79. Arumägi, E.; Kalamees, T. Cost and Energy Reduction of a New nZEB Wooden Building. Energies 2020, 13, 3570. [Google Scholar] [CrossRef]
  80. Švajlenka, J.; Kozlovská, M.; Badida, M.; Moravec, M.; Dzuro, T.; Vranay, F. Analysis of the Characteristics of External Walls of Wooden Prefab Cross Laminated Timber. Energies 2020, 13, 5974. [Google Scholar] [CrossRef]
  81. Bednarz, Ł.; Opalka, P.; Górski, A.; Wojciechowska, G. Analysis of the Condition of Damaged Vaults after a Construction Disaster in a Historic Church. Key Eng. Mater. 2019, 817, 613–620. [Google Scholar] [CrossRef]
  82. Drygala, I.; Dulinska, J.; Bednarz, Ł.; Jasienko, J. Numerical evaluation of seismic-induced damages in masonry elements of historical arch viaduct. IOP Conf. Ser. Mater. Sci. Eng. 2018, 364, 012006. [Google Scholar] [CrossRef]
  83. Bednarz, Ł.; Jasieńko, J. The analysis of the strains and stresses of the reinforced brick vaults. In Structural Analysis of Historic Construction; Taylor & Francis Group: London, UK, 2008; pp. 357–367. [Google Scholar]
  84. Bajno, D.; Bednarz, Ł.; Nowak, T. Problems Relating to Assessment, Repair and Restoration of Wooden Roof Structures in Historic Buildings, as Exemplified by Two Case Studies in Southern Poland. Adv. Mater. Res. 2013, 778, 888–894. [Google Scholar] [CrossRef]
  85. Jasieńko, J.; Nowak, T.; Bednarz, Ł. Wrocław University’s Leopoldinum Auditorium—Tests of Its Ceiling and a Conservation and Strengthening Concept. Adv. Mater. Res. 2010, 133–134, 265–270. [Google Scholar] [CrossRef]
  86. Bednarz, Ł.J.; Jasieńko, J.; Nowak, T.P. Test Monitoring of the Centennial Hall’s Dome, Wroclaw (Poland). In Proceedings of the SPIE Optical Metrology, Munich, Germany, 1 July 2015; p. 5270C. [Google Scholar]
  87. Bednarz, L.; Bajno, D.; Matkowski, Z.; Skrzypczak, I.; Leśniak, A. Elements of Pathway for Quick and Reliable Health Monitoring of Concrete Behavior in Cable Post-Tensioned Concrete Girders. Materials 2021, 14, 1503. [Google Scholar] [CrossRef]
  88. Menzel, C.A.; Heinzerling, F. Der Steinbau. (Der Praktische Maurer). Handbuch für Architekten, Bauhandwerker und Bau-Schüler; Verlag von J.J.: Fulda und Leipzig, Arnd: Leipzig, Germany, 1893. [Google Scholar]
  89. Bajno, D.; Grzybowska, A.; Tews, R. Unconscious decisions causing a failure condition of the 19th century brick ceiling. In Proceedings of the MATEC Web of Conferences, Prague, Czech Republic, 26 June 2018; Volume 174. [Google Scholar]
  90. Bajno, D. Ventilation as a particular safety element in housing development. In Proceedings of the Monografia Rudolf Kania Opole, ; Polish Engineering Association (NOT): Vienna, Austria, 2011; pp. 173–180. [Google Scholar]
  91. Bajno, D.; Bednarz, L.; Matkowski, Z.; Raszczuk, K. Monitoring of Thermal and Moisture Processes in Various Types of External Historical Walls. Materials 2020, 13, 505. [Google Scholar] [CrossRef] [Green Version]
  92. Bajno, D.; Bednarz, Ł.; Grzybowska, A.; Tews, R. Analysis and Monitoring Methodology of the Wooden Structure—Historic Military Architecture; Rilem Bookseries; Springer: New York NY, USA, 2019; Volume 18. [Google Scholar]
  93. Bajno, D.; Grzybowska, A.; Tews, R.; Bednarz, Ł. Back to the Past—The History and Current Modernisations of Kleinische Decke Ceiling; Rilem Bookseries; Springer: New York, NY, USA, 2019; Volume 18. [Google Scholar]
  94. PN-EN ISO 13788:2003 Cieplno-Wilgotnościowe Właściwości Komponentów Budowlanych i Elementów Budynku. Temperatura Powierzchni Wewnętrznej Konieczna do Uniknięcia Krytycznej Wilgotności Powierzchni i Kondensacja Międzywarstwowa. Metody Obliczania 2003. Available online: https://sklep.pkn.pl/pn-en-iso-13788-2003p.html (accessed on 30 July 2021).
  95. PN-D-94021:2013-10 Tarcica Konstrukcyjna Iglasta Sortowana Metodami Wytrzymałościowymi 2013. Available online: http://normy.ekoinfonet.pl/ics.php?ic=79.040 (accessed on 30 July 2021).
  96. PN-EN 1995-1-1:2010 Eurokod 5-Projektowanie Konstrukcji Drewnianych—Część 1-1: Postanowienia ogólne—Reguły Ogólne i Reguły Dotyczące Budynków 2010. Available online: https://sklep.pkn.pl/pn-en-1995-1-1-2010p.html (accessed on 30 July 2021).
  97. Adamczak, R. Wykorzystanie inteligentnych baz danych w budownictwie mostowym. ACTA Sci. Pol.—Archit. Bud. 2017, 16, 129–135. [Google Scholar] [CrossRef]
  98. Żurada, J.; Barski, M.; Jędruch, W. Sztuczne Sieci Neuronowe; Wydawnictwo Naukowe PWN: Warsaw, Poland, 1996; Volume 1, pp. 16–19. [Google Scholar]
  99. Osowski, S. Sztuczne sieci neuronowe-Podstawowe struktury sieciowe i algorytmy ucza̧ce. Prz. Elektrotechniczny 2009, 85, 1–8. [Google Scholar]
  100. Ochmański, M.; Bzówka, J. Wybrane przykłady zastosowań sztucznych sieci neuronowych w geotechnice. Civ. Environ. Eng. 2013, 4, 287–294. [Google Scholar]
  101. Drobina, R.; Grecka, A.; Lewandowski, S. Sztuczne sieci neuronowe i kierunki ich zastosowań w przemyśle. Podstawowe rodzaje sztucznych sieci neuronowych. Przegląd Włókienniczy—Włókno Odzież Skóra 2016, 1, 28–33. [Google Scholar] [CrossRef]
  102. Korbicz, J. Sztuczne sieci neuronowe i ich zastosowanie w elektrotechnice i energetyce. Prz. Elektrotechniczny 2009, 85, 194–200. [Google Scholar]
  103. Yadollahi, A.; Nazemi, E.; Zolfaghari, A.; Ajorloo, A.M. Application of artificial neural network for predicting the optimal mixture of radiation shielding concrete. Prog. Nucl. Energy 2016, 89, 69–77. [Google Scholar] [CrossRef]
  104. Leśniak, A. Wspomaganie Decyzji Wykonawcy Budowlanego Z Zastosowaniem Sztucznej Inteligencji. J. Civ. Eng. Environ. Archit. 2017, 63, 189–196. [Google Scholar] [CrossRef] [Green Version]
  105. Lewandowski, S. Sztuczne sieci neuronowe i kierunki ich zastosowań w przemyśle. Kierunki zastosowań sztucznych sieci neuronowych we włókiennictwie wykorzystywane przy klasyfikacji błędów w płaskich wyrobach włókienniczych i użytkowaniu odzieży. Przegląd Włókienniczy—Włókno Odzież Skóra 2016, 1, 34–39. [Google Scholar] [CrossRef]
  106. Tadeusiewicz, R. Sieci neuronowe. Postępy Fiz. 1994, 45, 215–236. [Google Scholar]
  107. Krawiec, K.; Stefanowski, J. Uczenie Maszynowe i Sieci Neuronowe; Wydawnictwo Politechniki Poznańskiej: Poznań, Poland, 2003; Volume 3. [Google Scholar]
  108. Tadeusiewicz, R. O celowości zastosowania sieci neuronowych w problemach związanych z elektrotechniką. Prz. Elektrotechniczny 2009, 85, 200–211. [Google Scholar]
  109. Knyziak, P. Sztuczne sieci neuronowe w oszacowaniu zużycia technicznego bydynków mieszkalnych. In Theoretical Foundation of Civil Engineering; Oficyna Wydawnicza Politechniki Warszawskiej: Warszawa, Poland, 8 April 2008; Volume 16. [Google Scholar]
  110. Bajno, D.; Bednarz, Ł.; Grzybowska, A. The Role and Place of Traditional Chimney System Solutions in Environmental Progress and in Reducing Energy Consumption. Energies 2021, 14, 4720. [Google Scholar] [CrossRef]
  111. Szacowanie Współczynników Pochłaniania Dźwięku Perforowanych Paneli Drewnianych za Pomocą Sztucznych Sieci Neuronowych-ScienceDirect. Available online: https://www.sciencedirect.com/science/article/abs/pii/S0003682X08000467 (accessed on 3 August 2021).
  112. Lin, M.D.; Tsai, K.T.; Su, B.S. Estimating the sound absorption coefficients of perforated wooden panels by using artificial neural networks. Appl. Acoust. 2009, 70, 31–40. [Google Scholar] [CrossRef]
  113. Aliabadi, M.; Golmohammadi, R.; Mansoorizadeh, M.; Khotanlou, H.; Ohadi Hamadani, A. An empirical technique for predicting noise exposure level in the typical embroidery workrooms using artificial neural networks. Appl. Acoust. 2013, 74, 364–374. [Google Scholar] [CrossRef]
  114. Jeon, J.H.; Yang, S.S.; Kang, Y.J. Estimation of sound absorption coefficient of layered fibrous material using artificial neural networks. Appl. Acoust. 2020, 169, 107476. [Google Scholar] [CrossRef]
  115. Stack, J.R.; Harley, R.G.; Springer, P.; Mahaffey, J.A. Estimation of wooden cross-arm integrity using artificial neural networks and laser vibrometry. IEEE Trans. Power Deliv. 2003, 18, 1539–1544. [Google Scholar] [CrossRef]
  116. Cotana, F.; Pisello, A.L.; Moretti, E.; Buratti, C. Multipurpose characterization of glazing systems with silica aerogel: In-field experimental analysis of thermal-energy, lighting and acoustic performance. Build. Environ. 2014, 81, 92–102. [Google Scholar] [CrossRef]
  117. De Franca, C.A.; Gonzaga, A.; Slaets, A.F.F. Classification of wooden boards by neural networks and fuzzy rules. In Proceedings of the II Workshop on Cybernetic Vision, Sao Carlos, Brazil, 9–11 December 1996; pp. 190–195. [Google Scholar]
  118. Marks, M. Wykorzystanie metod uczenia maszynowego do rozpoznawania związków pomiędzy składem betonu modyfikowanego dodatkami popiołowymi a jego właściwościami. Drogi i Mosty 2010, 3, 39–54. [Google Scholar]
  119. Tadeusiewicz, R.; Szaleniec, M. Leksykon Sieci Neuronowych; Projekt Nauka: Wrocław, Poland, 2015; ISBN 9788363270100. [Google Scholar]
  120. Tadeusiewicz, R. Wprowadzenie do Sieci Neuronowych; StatSoft Polska: Kraków, Poland, 2001. [Google Scholar]
  121. Neeraja, D.; Swaroop, G. Prediction of compressive strength of concrete using artificial neural networks. Res. J. Pharm. Technol. 2017, 10, 35–40. [Google Scholar] [CrossRef]
  122. PN-EN 1995-1-2:2008 Eurokod 5: Projektowanie Konstrukcji Drewnianych—Część 1–2: Postanowienia Ogólne—Projektowanie Konstrukcji z Uwagi na Warunki Pożarowe 2008. Available online: https://sklep.pkn.pl/pn-en-1995-1-2-2008p.html (accessed on 30 July 2021).
  123. PN-B-03150:1964 Konstrukcje Drewniane—Obliczenia Statyczne i Projektowanie 1964. Available online: https://sklep.pkn.pl/pn-b-03150-1964p.html (accessed on 30 July 2021).
  124. PN-B-03150-02:1981 Konstrukcje z Drewna i Materiałów Drewnopochodnych-Obliczenia Statyczne i Projektowanie—Konstrukcje 1981. Available online: https://sklep.pkn.pl/pn-b-03150-02-1981p.html (accessed on 30 July 2021).
  125. PN-B-03150-00:1981 Konstrukcje z Drewna i Materiałów Drewnopochodnych. Obliczenia Statyczne i Projektowanie—Materiały 1981. Available online: https://sklep.pkn.pl/pn-b-03150-2000p.html (accessed on 30 July 2021).
  126. Eurokod 1-Oddziaływania na Konstrukcje—Część 1–3: Oddziaływania Ogólne—Obciążenie Śniegiem. Available online: https://sklep.pkn.pl/pn-en-1991-1-3-2005p.html (accessed on 30 July 2021).
  127. Eurokod 1: Oddziaływania na Konstrukcje—Część 1–4: Oddziaływania Ogólne—Oddziaływania Wiatru. Available online: https://sklep.pkn.pl/pn-en-1991-1-4-2005e.html (accessed on 30 July 2021).
Figure 1. Thermal mass—thermal capacity of building materials.
Energies 14 05975 g001
Figure 2. Principles of anchoring floor beams in the walls of 19th century buildings: (a) wall cross-section, (b) details of setting the wooden beams (c) details of setting the wooden beams, (d) central heating installation (19th century), based on [88].
Energies 14 05975 g002
Figure 3. Examples of a damaged floor in the support and buttress zones: (a) no externally visible damage, (b,c) advanced brown decay of wood inside the same beam.
Energies 14 05975 g003
Figure 4. Models of temperature distribution in the external wall in the place of the support of wooden ceiling beams: (1,2) model of the partition in its original state (after thermal insulation from the inside), (1a,2a) temperature distribution field, (1b,2b) temperature distribution field limited by an isotherm of 0 °C, (1c,2c) lines of density of heat fluxes in the zones of support of ceilings on the wall.
Energies 14 05975 g004
Figure 5. Models of temperature distribution in the external wall, in place of the support of iron or steel ceiling beams: (1,2) model of the partition in its original state (after insulation from the inside), (1a,2a) temperature distribution field, (1b,2b) temperature distribution field bounded by an isotherm of 0 °C, (1d,2d) lines of density of heat fluxes in the zones of support of ceilings on the wall.
Energies 14 05975 g005
Figure 6. Location of point thermal bridges where steel beams are embedded in the external wall—the ends of the beams are clearly visible.
Energies 14 05975 g006
Figure 7. Thermogram of half-temperature distribution in the external front wall, insulated from the inside with 10 cm mineral wool and finished with plasterboards, (a) south-west corner of the first floor, (b) south-east corner of the second floor, (c) north-west corner of the second floor with an attic ceiling insulated from the outside on both sides with a layer of 10 cm foamed polystyrene.
Energies 14 05975 g007
Figure 8. Diagram of the temperature distribution at the junction of the external walls of the building (Figure 5a), with the front wall insulated from the inside and the gable wall from the outside: (a) view of the wall, (b) thermal bridge system in the place of the grate and in the corner, (c) temperature diagram covering the corner—ΔT = 3.4 °C.
Energies 14 05975 g008
Figure 9. A pathway for the analysis of timber structures.
Energies 14 05975 g009
Figure 10. External view of the granary.
Energies 14 05975 g010
Figure 11. View of the bearing structure.
Energies 14 05975 g011
Figure 12. Construction model.
Energies 14 05975 g012
Figure 13. Static strength analyses, bending moment distribution.
Energies 14 05975 g013
Figure 14. Casino elevation 3D scan.
Energies 14 05975 g014
Figure 15. Casino south elevation.
Energies 14 05975 g015
Figure 16. Section through the roof with deflection measurements.
Energies 14 05975 g016
Figure 17. Skeletal structure model of the main segment (a), and elements with exceeded bearing capacity (b).
Energies 14 05975 g017
Figure 18. Old granary building.
Energies 14 05975 g018
Figure 19. Method of making wooden beam walls.
Energies 14 05975 g019
Figure 20. Wall beam connections in traditional construction: (a) north site, (b) south site, (c) east site.
Energies 14 05975 g020
Figure 21. Wood testing: (a) by moisture measure meter and (b) by resistograph.
Energies 14 05975 g021
Figure 22. Results of simulation calculations for an average wall made of wooden logs: (a) isotherms of temperature distribution from −20 °C on the external side to +20 °C on the internal side, (b) humidity distribution on the wall in summer and winter.
Energies 14 05975 g022
Figure 23. Biological infestation of wood: (a) exit hole of the insect, Common Furniture Beetle (Anobium punctatum); (b) exit holes of the insect, House Longhorn Beetle (Hylotrupes bajulus); (c) brown decay of the sill beam (part of which has been replaced with a new one) and the beam immediately above it.
Energies 14 05975 g023
Figure 24. Data selection.
Energies 14 05975 g024
Figure 25. Validation table.
Energies 14 05975 g025
Figure 26. Prediction results: (a) 3D plane distribution conditional on work type, element type and original dimensions, (b) 3D histogram conditional on work, type, element type and actual strength index.
Energies 14 05975 g026
Figure 27. Statistics of the dependence of the actual strength index on the original strength index: (a) scatterplot primary bending strength index, (b) correlations, (c) cumulative histogram of primary bending strength index.
Energies 14 05975 g027aEnergies 14 05975 g027b
Table 1. Cross-sectional dimensions adopted for static strength analyses in particular iterations.
No.Type of ElmentPrimary DimensionsPrimary Cross-SectionDimensions
Actual—Effective
Cross-Section
Actual—Effective
Reduction in the Field
Section
[mm × mm].[mm2].[mm × mm].[mm2].[%]
1beam 1230 × 20046,000210 × 18037,80018
2rafter160 × 13020,800150 × 12018,00013
3ticks160 × 13020,800150 × 12018,00013
4Bolt 1160 × 13020,800150 × 12018,00013
5Bolt 2220 × 20044,000200 × 18036,00018
6pole220 × 20044,000200 × 18036,00018
7foundation240 × 20048,000225 × 18040,50016
8beam 2240 × 20048,000225 × 18040,50016
Table 2. Original and real—effective dimensions of wooden elements, changes of cross-sectional area, and bending strength index.
Element
No
Type of ElementPrimary DimensionsPrimary Cross-sectionPrimary Flexural Strength IndexActual Dimensions—EffectiveEffective Cross-SectionActual Flexural Strength IndexChange in Cross-Sectional AreaChange in Flexural Strength Index
[–]-[mm × mm].[mm2].[mm3].[mm × mm].[mm2].[mm3].[%][%]
1pole280 × 30084,0004.20 × 106270 × 28075,6003.53 × 1069084
2pole300 × 28084,0003.92 × 106290 × 27078,3003.52 × 1069390
3pole280 × 30084,0004.20 × 106250 × 28070,0003.27 × 1068378
4foundation150 × 15022,5005.63 × 105110 × 15016,5004.13 × 1057373
5pole160 × 16025,6006.83 × 105145 × 14020,3004.74 × 1057969
6foundation150 × 15022,5005.63 × 105145 × 14020,3004.74 × 1059084
7 *---------
8pole150 × 15022,5005.63 × 105110 × 12013,2002.64 × 1055947
9foundation240 × 20048,0001.60 × 106225 × 18040,5001.22 × 1068476
10pole220 × 20044,0001.47 × 106200 × 18036,0001.08 × 1068274
11pole160 × 16025,6006.83 × 105120 × 14016,8003.92 × 1056657
12pole160 × 16025,6006.83 × 105140 × 14019,6004.57 × 1057767
13foundation250 × 20050,0001.67 × 106210 × 17035,7001.01 × 1067161
14foundation250 × 20050,0001.67 × 106200 × 17034,0009.63 × 1056858
15floor beam230 × 20046,0001.53 × 106210 × 18037,8001.13 × 1068274
16pole200 × 16032,0008.53 × 105170 × 14023,8005.55 × 1057465
17rafter160 × 13020,8004.51 × 105150 × 12018,0003.60 × 1058780
18pole170 × 15025,5006.38 × 105165 × 14523,9255.78 × 1059491
19purlin160 × 17027,2007.71 × 105145 × 15522,4755.81 × 1058375
Table 3. Prediction database.
Element No.Type of ElementType of WorkPrimary DimensionsPrimary Cross-SectionPrimary Flexural Strength IndexActual Dimensions-EffectiveEffective Cross-SectionActual Flexural Strength IndexReduction in the Cross-Sectional AreaReduction in Flexural Strength Index
[mm × mm][mm2][mm3][mm × mm][mm2][mm3][%][%]
1poleeccentric compression along fibres280 × 30084,0004,200,000270 × 28075,6003,528,0001016
2poleeccentric compression along fibres300 × 28084,0003,920,000290 × 27078,3003,523,500710
3poleeccentric compression along fibres280 × 30084,0004,200,000250 × 28070,0003,266,666.671722
4foundationeccentric compression across fibres150 × 15022,500562,500110 × 15016,500412,5002727
269shotgun compression with bending along fibres160 × 13020,800554,666.67150 × 12018,000360,0001335
270shotgun compression with bending along fibres220 × 20044,0001,466,666.67200 × 18036,0001,080,0001826
271poleeccentric compression along fibres220 × 20044,0001,466,666.67200 × 18036,0001,080,0001826
272foundationeccentric compression across fibres240 × 20048,0001,600,000225 × 18040,5001,215,0001624
273beam bending in compression240 × 20048,0001,600,000225 × 18040,5001,215,0001624
Publisher’s Note: MDPI stays neutral with regard to jurisdictional claims in published maps and institutional affiliations.

