
Impacts of Energy Efficiency and Economic Growth on Air Pollutant Emissions: Evidence from Angara–Yenisey Siberia


Abstract
:1. Introduction
2. Materials and Methods
2.1. Study Area
2.2. Data
2.3. Methods
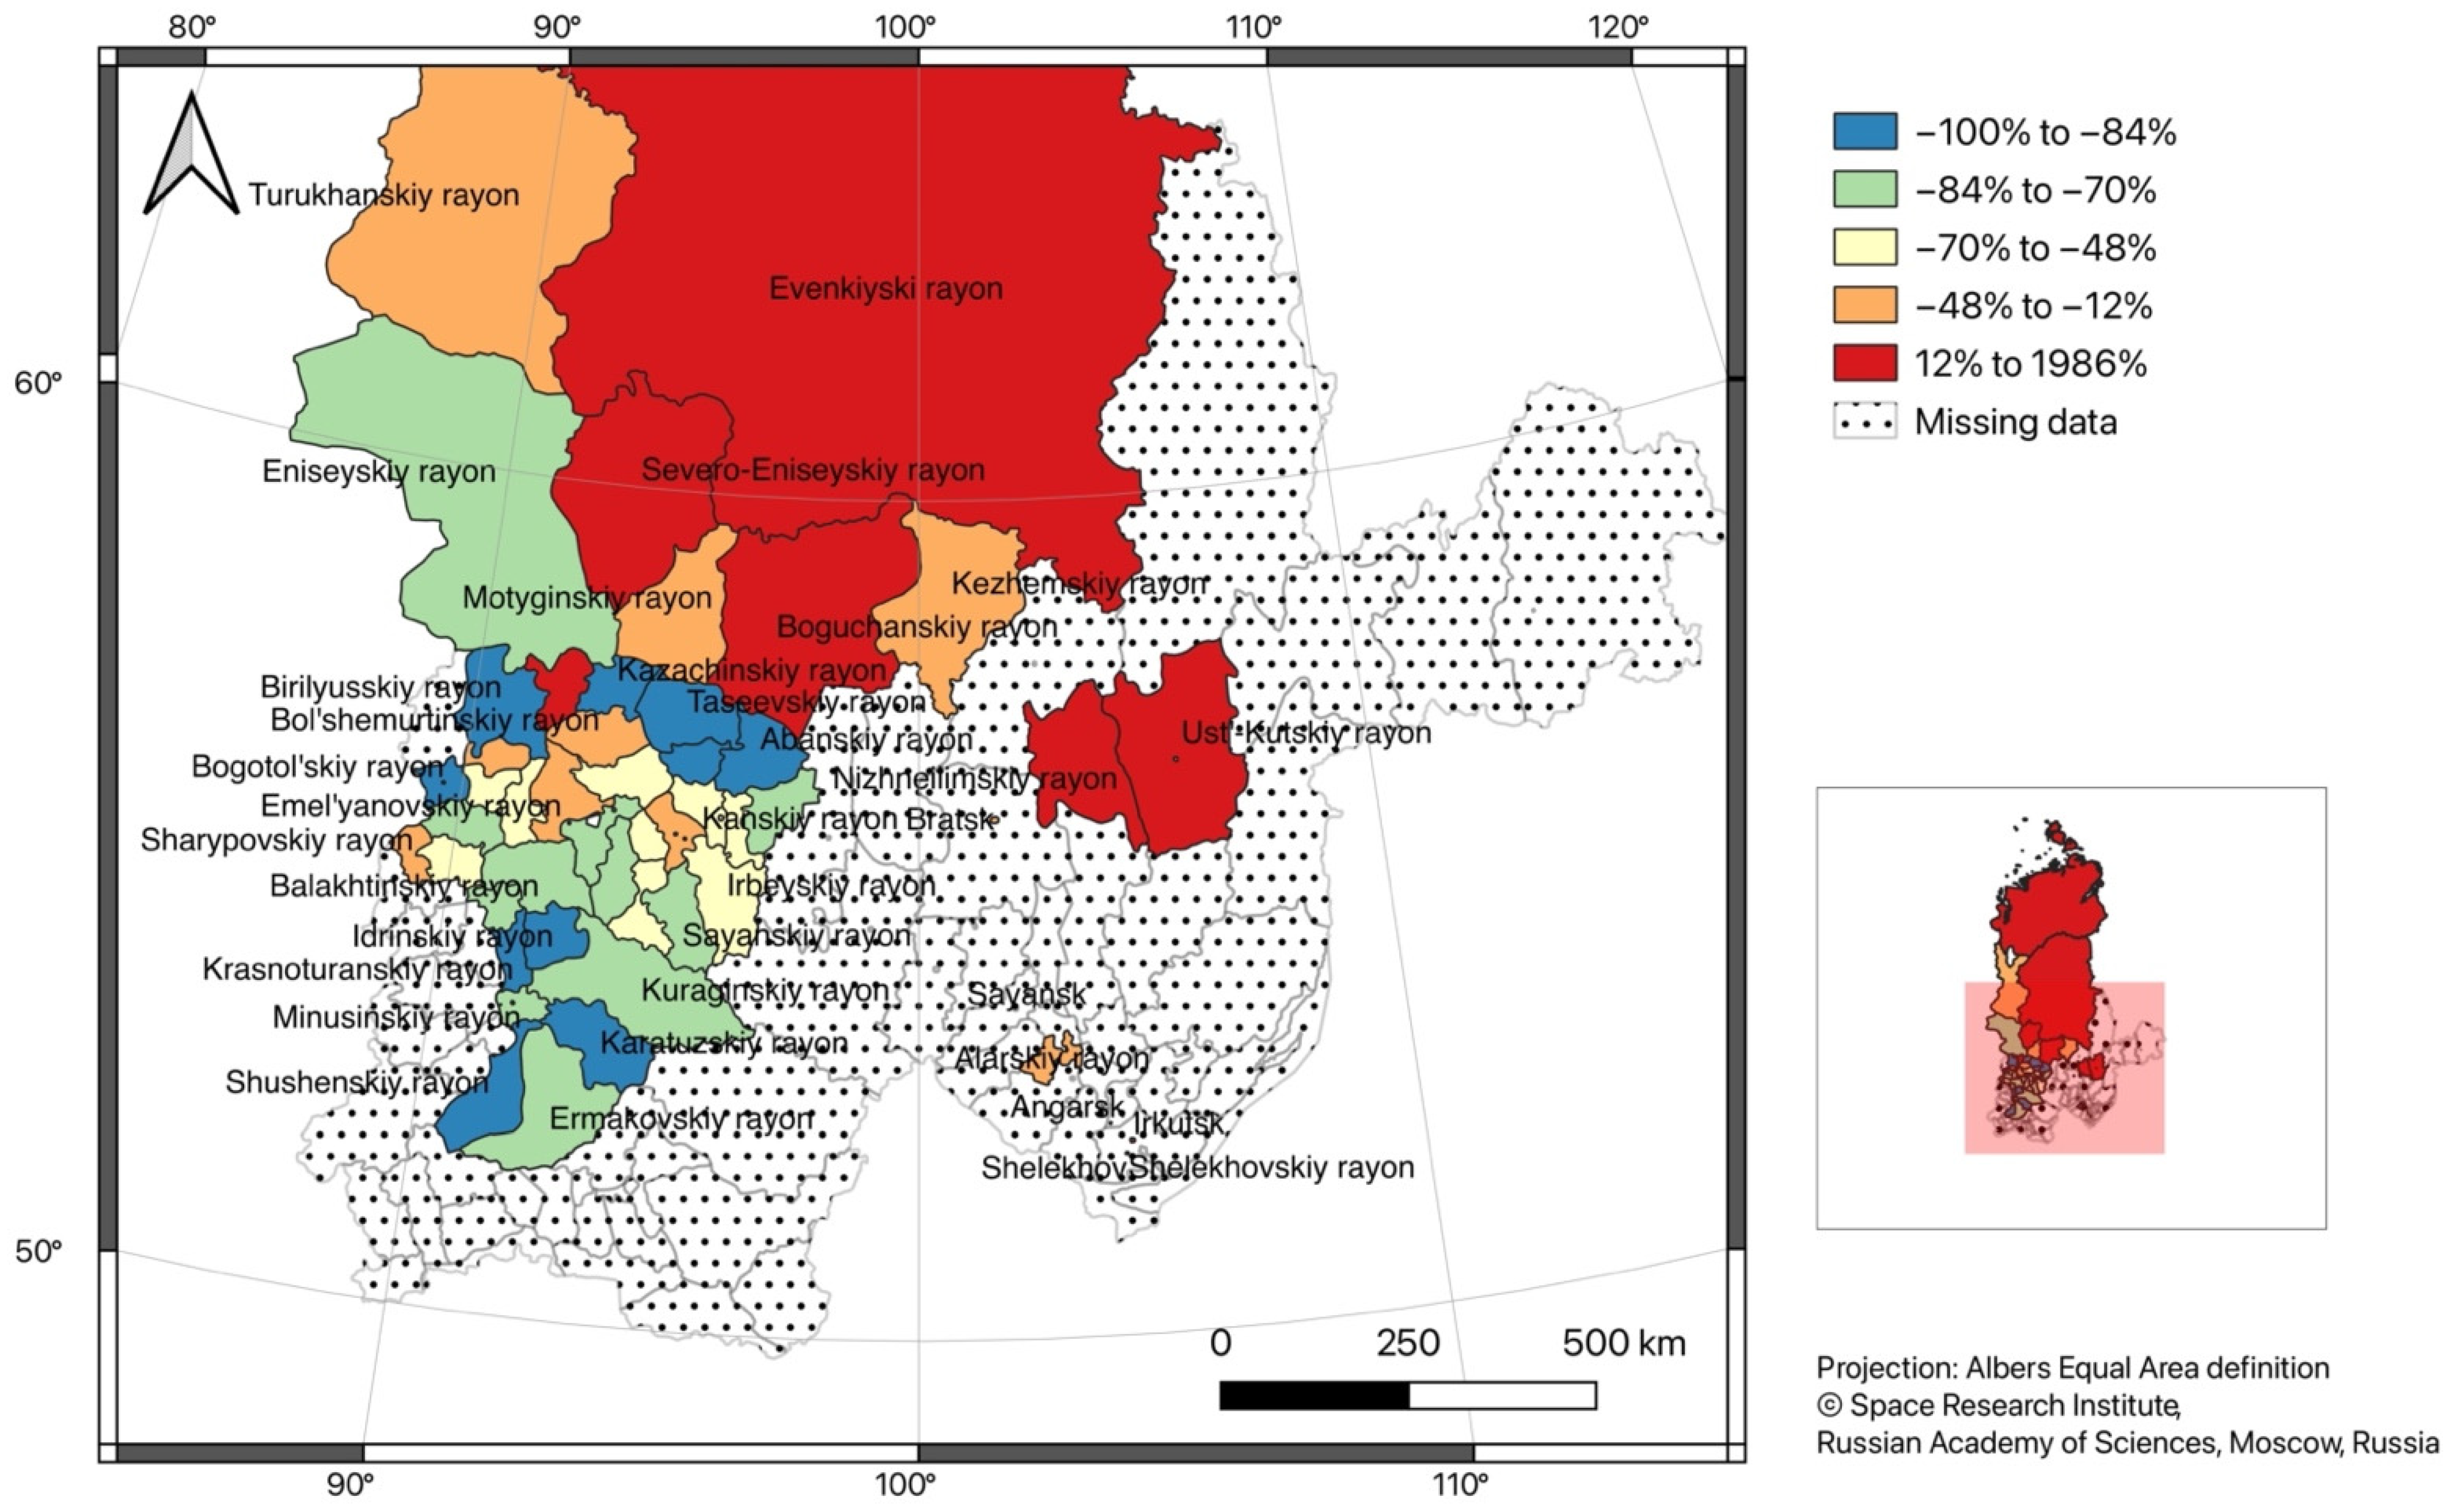
3. Results
4. Discussion
Author Contributions
Funding
Institutional Review Board Statement
Informed Consent Statement
Data Availability Statement
Acknowledgments
Conflicts of Interest
References
- Peng, X.; Tao, X.; Zhang, H.; Chen, J.; Feng, K. CO2 emissions from the electricity sector during China’s economic transition: From the production to the consumption perspective. Sustain. Prod. Consum. 2021, 27, 1010–1020. [Google Scholar] [CrossRef]
- Zhang, M.; Yang, Z.; Liu, L.; Zhou, D. Impact of renewable energy investment on carbon emissions in China-An empirical study using a nonparametric additive regression model. Sci. Total Environ. 2021, 785, 147109. [Google Scholar] [CrossRef] [PubMed]
- Zhang, Z.; Chen, Y.-H.; Wang, C.-M. Can CO2 emission reduction and economic growth be compatible? Evidence from China. Front. Energy Res. 2021, 9, 315. [Google Scholar] [CrossRef]
- Shan, S.; Genç, S.Y.; Kamran, H.W.; Dinca, G. Role of green technology innovation and renewable energy in carbon neutrality: A sustainable investigation from Turkey. J. Environ. Manag. 2021, 294, 113004. [Google Scholar] [CrossRef] [PubMed]
- Adedoyin, F.F.; Gumede, M.I.; Bekun, F.V.; Etokakpan, M.U.; Balsalobre-Lorente, D. Modelling coal rent, economic growth and CO2 emissions: Does regulatory quality matter in BRICS economies? Sci. Total Environ. 2020, 710, 136284. [Google Scholar] [CrossRef]
- Tokunaga, M. Environmental governance in Russia: The ‘closed’ pathway to ecological modernization. Environ. Plan. A 2010, 42, 1686–1704. [Google Scholar] [CrossRef]
- Glazyrina, I.P.; Zabelina, I.A. Jevons’ paradox revisited: Do Russian environmental institutions contribute to green growth? J. Sib. Fed. Univ. Humanit. Soc. Sci. 2020, 13, 496–506. [Google Scholar] [CrossRef]
- Glazyrina, I.P.; Zabelina, I.A. Socio- ecological inequality in the Russian federation and problems of its measurement. J. Sib. Fed. University. Humanit. Soc. Sci. 2021, 14, 1047–1062. [Google Scholar]
- Wang, H.; Hu, Y.; Zheng, H.; Shan, Y.; Qing, S.; Liang, X.; Feng, K.; Guan, D. Low-carbon development via greening global value chains: A case study of Belarus. Proc. R. Soc. A Math. Phys. Eng. Sci. 2020, 476, 20200024. [Google Scholar] [CrossRef]
- Zou, Y. Air pollution and housing prices across Chinese Cities. J. Urban Plan. Dev. 2019, 145, 04019012. [Google Scholar] [CrossRef]
- Hao, Y.; Zheng, S. Would environmental pollution affect home prices? An empirical study based on China’s key cities. Environ. Sci. Pollut. Res. 2017, 24, 24545–24561. [Google Scholar] [CrossRef] [PubMed]
- Liang, L.; Gong, P. Urban and air pollution: A multi-city study of long-term effects of urban landscape patterns on air quality trends. Sci. Rep. 2020, 10, 1–13. [Google Scholar] [CrossRef] [PubMed]
- Mou, Y.; Song, Y.; Xu, Q.; He, Q.; Hu, A. Influence of urban-growth pattern on air quality in China: A study of 338 cities. Int. J. Environ. Res. Public Health 2018, 15, 1805. [Google Scholar] [CrossRef] [PubMed] [Green Version]
- Fang, C.; Liu, H.; Li, G.; Sun, D.; Miao, Z. Estimating the impact of urbanization on air quality in China using spatial regression models. Sustainability 2015, 7, 15570–15592. [Google Scholar] [CrossRef] [Green Version]
- Khan, R. Beta decoupling relationship between CO2 emissions by GDP, energy consumption, electricity production, value-added industries, and population in China. PLoS ONE 2021, 16, e0249444. [Google Scholar] [CrossRef]
- Wang, Q.; Zhang, F. Does increasing investment in research and development promote economic growth decoupling from carbon emission growth? An empirical analysis of BRICS countries. J. Clean. Prod. 2019, 252, 119853. [Google Scholar] [CrossRef]
- Li, H.; Shahbaz, M.; Jiang, H.; Dong, K. Is natural gas consumption mitigating air pollution? Fresh evidence from national and regional analysis in China. Sustain. Prod. Consum. 2020, 27, 325–336. [Google Scholar] [CrossRef]
- Markandya, A.; Golub, A.; Pedroso-Galinato, S. Empirical analysis of national income and SO2 emissions in selected European countries. Environ. Resour. Econ. 2006, 35, 221–257. [Google Scholar] [CrossRef]
- Grossman, G.M.; Krueger, A.B. Environmental Impacts of a North American Free Trade Agreement; National Bureau of Economic Research, Inc.: Cambridge. MA, USA, 1991. [Google Scholar]
- Ansari, M.A.; Haider, S.; Khan, N. Environmental Kuznets curve revisited: An analysis using ecological and material footprint. Ecol. Indic. 2020, 115, 106416. [Google Scholar] [CrossRef]
- Maneejuk, N.; Ratchakom, S.; Maneejuk, P.; Yamaka, W. Does the environmental Kuznets curve exist? An international study. Sustainability 2020, 12, 9117. [Google Scholar] [CrossRef]
- Jin, L.; Duan, K.; Shi, C.; Ju, X. The impact of technological progress in the energy sector on carbon emissions: An empirical analysis from China. Int. J. Environ. Res. Public Health 2017, 14, 1505. [Google Scholar] [CrossRef] [Green Version]
- Danish; Baloch, M.A.; Mahmood, N.; Zhang, J.W. Effect of natural resources, renewable energy and economic development on CO2 emissions in BRICS countries. Sci. Total Environ. 2019, 678, 632–638. [Google Scholar] [CrossRef] [PubMed]
- Aruga, K. Investigating the energy-environmental Kuznets curve hypothesis for the Asia-Pacific region. Sustainability 2019, 11, 2395. [Google Scholar] [CrossRef] [Green Version]
- Commoner, B. The environmental cost of economic growth. Chem. Br. 1972, 8, 52–56. [Google Scholar]
- Ehrlich, P.R.; Holdren, J.P. Impact of population growth. Science 1971, 171, 1212–1217. [Google Scholar] [CrossRef] [PubMed]
- Dietz, T.; Rosa, E.A. Rethinking the environmental impacts of population, affluence and technology. Hum. Ecol. Rev. 1994, 1, 277–300. [Google Scholar]
- Wu, R.; Wang, J.; Wang, S.; Feng, K. The drivers of declining CO2 emissions trends in developed nations using an extended STIRPAT model: A historical and prospective analysis. Renew. Sustain. Energy Rev. 2021, 149, 111328. [Google Scholar] [CrossRef]
- Wei, T. What STIRPAT tells about effects of population and affluence on the environment? Ecol. Econ. 2011, 72, 70–74. [Google Scholar] [CrossRef]
- Long, X.; Ji, X.; Ulgiati, S. Is urbanization eco-friendly? An energy and land use cross-country analysis. Energy Policy 2017, 100, 387–396. [Google Scholar] [CrossRef]
- York, R.; A Rosa, E.; Dietz, T. STIRPAT, IPAT and ImPACT: Analytic tools for unpacking the driving forces of environmental impacts. Ecol. Econ. 2003, 46, 351–365. [Google Scholar] [CrossRef]
- Tang, D.; Zhang, Y.; Bethel, B.J. An analysis of disparities and driving factors of carbon emissions in the yangtze river economic belt. Sustainability 2019, 11, 2362. [Google Scholar] [CrossRef] [Green Version]
- Danish; Ozcan, B.; Ulucak, R. An empirical investigation of nuclear energy consumption and carbon dioxide (CO2) emission in India: Bridging IPAT and EKC hypotheses. Nucl. Eng. Technol. 2021, 53, 2056–2065. [Google Scholar] [CrossRef]
- Fischer-Kowalski, M.; Amann, C. Beyond ipat and Kuznets curves: Globalization as a vital factor in analysing the environmental impact of socio-economic metabolism. Popul. Environ. 2001, 23, 7–47. [Google Scholar] [CrossRef]
- Turiel, J.S.; Kaufmann, R.K. Evidence of air quality data misreporting in China: An impulse indicator saturation model comparison of local government-reported and U.S. embassy-reported PM2.5 concentrations (2015–2017). PLoS ONE 2021, 16, e0249063. [Google Scholar] [CrossRef] [PubMed]
- Feng, Y.; Wang, X.; Du, W.; Liu, J. Effects of air pollution control on urban development quality in Chinese cities based on spatial Durbin model. Int. J. Environ. Res. Public Health 2018, 15, 2822. [Google Scholar] [CrossRef] [Green Version]
- Gong, X.; Mi, J.; Wei, C.; Yang, R. Measuring environmental and economic performance of air pollution control for province-level areas in China. Int. J. Environ. Res. Public Health 2019, 16, 1378. [Google Scholar] [CrossRef] [Green Version]
- Li, W.; Huang, C. Acquiring air quality monitoring data through the hierarchy or the market: A case study of Shandong province, China. Sci. Total Environ. 2020, 723, 138089. [Google Scholar] [CrossRef]
- Moletsane, S.D.; Lindeque, F.; Nkosi, N.C.; Adesina, J.A.; Burger, R.P.; Mkhatshwa, G.; Piketh, S.J. Intra-urban variability of PM2.5 in a dense, low-income settlement on the South African Highveld. Clean Air J. 2021, 31, 1–9. [Google Scholar] [CrossRef]
- Ketenci, N. The environmental Kuznets curve in the case of Russia. Russ. J. Econ. 2018, 4, 249–265. [Google Scholar] [CrossRef]
- Pyzheva, Y.I.; Zander, E.V.; Pyzhev, A.I. Toward the sustainable development of russian regions: A comprehensive review of empirical research. J. Sib. Fed. Univ. Humanit. Soc. Sci. 2021, 14, 1063–1079. [Google Scholar]
- Porfiryev, B.N.; Bobylev, S.N. Cities and megalopolises: The problem of definitions and sustainable development indicators. Stud. Russ. Econ. Dev. 2018, 29, 116–123. [Google Scholar] [CrossRef]
- Pyzheva, Y.I.; Lapo, E.V.; Syrtsova, E.A.; Pyzhev, A.I. Evaluation of genuine savings in the Russia’s far East regions. Reg. Res. Russ. 2021, 11, 121–128. [Google Scholar] [CrossRef]
- Zabelina, I.A. Decoupling in environmental and economic development of regions-participants of cross-border cooperation. Econ. Soc. Chang. Facts Trends 2019, 12, 1. [Google Scholar] [CrossRef]
- Shirov, A.A. Statistics for the benefit of economics and society. Stud. Russ. Econ. Dev. 2020, 31, 3–6. [Google Scholar] [CrossRef]
- Pyzhev, A.; Gordeev, R.; Vaganov, E. Reliability and integrity of forest sector statistics—A major constraint to effective forest policy in russia. Sustainability 2020, 13, 86. [Google Scholar] [CrossRef]
- Kang, Y.-Q.; Zhao, T.; Yang, Y.-Y. Environmental Kuznets curve for CO 2 emissions in China: A spatial panel data approach. Ecol. Indic. 2016, 63, 231–239. [Google Scholar] [CrossRef]
- Chen, Q.; Taylor, D. Economic development and pollution emissions in Singapore: Evidence in support of the Environmental Kuznets Curve hypothesis and its implications for regional sustainability. J. Clean. Prod. 2019, 243, 118637. [Google Scholar] [CrossRef]
- Bibi, F.; Jamil, M. Testing environment Kuznets curve (EKC) hypothesis in different regions. Environ. Sci. Pollut. Res. 2020, 28, 13581–13594. [Google Scholar] [CrossRef]
- Fang, C.; Liu, H.; Li, G. International progress and evaluation on interactive coupling effects between urbanization and the eco-environment. J. Geogr. Sci. 2016, 26, 1081–1116. [Google Scholar] [CrossRef]
- Korytny, L.M. The basin concept: From hydrology to nature management. Geogr. Nat. Resour. 2017, 38, 111–121. [Google Scholar] [CrossRef]
- Kolomak, E.A. Evolution of spatial distribution of economic activity in Russia. Reg. Res. Russ. 2015, 5, 236–242. [Google Scholar] [CrossRef]
- Kolomak, E. Spatial development of the post-Soviet Russia: Tendencies and factors. Reg. Sci. Policy Pr. 2020, 12, 579–594. [Google Scholar] [CrossRef]
- QGIS Development Team. QGIS Geographic Information System; Open Source Geospatial Foundation: Chicago, IL, USA, 2009. [Google Scholar]
- Guan, D.; Liu, Z.; Geng, Y.; Lindner, S.; Hubacek, K. The gigatonne gap in China’s carbon dioxide inventories. Nat. Clim. Chang. 2012, 2, 672–675. [Google Scholar] [CrossRef]
- Liu, S.; Fan, F.; Zhang, J. Are Small Cities More Environmentally Friendly? An Empirical Study from China. Int. J. Environ. Res. Public Health 2019, 16, 727. [Google Scholar] [CrossRef] [PubMed] [Green Version]
- Rong, T.; Zhang, P.; Jing, W.; Zhang, Y.; Li, Y.; Yang, D.; Yang, J.; Chang, H.; Ge, L. Carbon dioxide emissions and their driving forces of land use change based on economic contributive coefficient (Ecc) and ecological support coefficient (Esc) in the lower yellow river region (1995–2018). Energies 2020, 13, 2600. [Google Scholar] [CrossRef]
- Ahmad, M.; Zhao, Z.-Y.; Irfan, M.; Mukeshimana, M.C.; Rehman, A.; Jabeen, G.; Li, H. Modeling heterogeneous dynamic interactions among energy investment, SO2 emissions and economic performance in regional China. Environ. Sci. Pollut. Res. 2019, 27, 2730–2744. [Google Scholar] [CrossRef]
- MacKinnon, J.G.; White, H. Some heteroskedasticity-consistent covariance matrix estimators with improved finite sample properties. J. Econ. 1985, 29, 305–325. [Google Scholar] [CrossRef] [Green Version]
- R Core Team R: A Language and Environment for Statistical Computing; R Core Team R: Vienna, Austria, 2020.
- Zeileis, A. Econometric computing with HC and HAC covariance matrix estimators. J. Stat. Softw. 2004, 11, 1–17. [Google Scholar] [CrossRef]
- Hlavac, M. Stargazer: Well-Formatted Regression and Summary Statistics Tables. 2018. Available online: https://cran.r-project.org/web/packages/stargazer/vignettes/stargazer.pdf (accessed on 21 September 2021).


| Region | Area, 1000 sq. km | Population, 1000 Persons | GRDP Per Capita, 1000 RUB | No. of Municipal Areas/Cities | Air Pollutant Emissions from Stationary Sources Per Capita, t |
|---|---|---|---|---|---|
| Krasnoyarsk Krai | 2366.8 | 2875.3 | 793.0 | 44/17 | 806.5 |
| Irkutsk Oblast | 774.8 | 2401.0 | 580.1 | 32/10 | 267.0 |
| Republic of Khakassia | 61.6 | 536.8 | 438.3 | 8/5 | 199.3 |
| Tyva Republic | 168.6 | 323.1 | 212.9 | 17/2 | 12.4 |
| STIRPAT Component | Designation | Variable | Unit |
|---|---|---|---|
| Human impact on the environment (I) | Emissions: Total | Pollutants emitted into the atmosphere from stationary sources—total | 1000 t |
| Emissions: PM | Pollutants emitted into the atmosphere from stationary sources—solid substances (particulate matter) | 1000 t | |
| Emissions: Gas and liquid | Pollutants emitted into the atmosphere from stationary sources—gaseous and liquid substances | 1000 t | |
| Emissions: SO2 | Pollutants emitted into the atmosphere from stationary sources—sulfur dioxide | 1000 t | |
| Emissions: CO | Pollutants emitted into the atmosphere from stationary sources—carbon monoxide | 1000 t | |
| Emissions: NOx | Pollutants emitted into the atmosphere from stationary sources—nitrogen oxides | 1000 t | |
| Emissions: CxHy | Pollutants emitted into the atmosphere from stationary sources—hydrocarbons | 1000 t | |
| Emissions: VOCs | Pollutants emitted into the atmosphere from stationary sources—volatile organic compounds | 1000 t | |
| Population (P) | Population | Average annual permanent population | 1000 persons |
| Affluence (A) | Gross municipal product | Self-produced goods shipped, works performed, and services rendered using own resources | 1,000,000 RUB |
| Technology (T) | Energy intensity of GMP | Self-produced goods shipped, works performed, and services rendered using own resources (section D: electricity, gas and steam supply; air conditioning) | 1,000,000 RUB |
| Variable | Mean | S.D. | Median | Min | Max | Skew | Kurtosis |
|---|---|---|---|---|---|---|---|
| Emissions: Total | 11.32 | 27.00 | 1.56 | 0.00 | 193.96 | 3.89 | 17.29 |
| Emissions: PM | 1.78 | 3.75 | 0.78 | 0.00 | 22.04 | 3.18 | 0.34 |
| Emissions: Gas and liquid | 9.54 | 24.68 | 1.19 | 0.00 | 171.93 | 3.98 | 17.88 |
| Emissions: SO2 | 16.32 | 151.84 | 0.13 | 0.00 | 1675.0 | 10.70 | 113.97 |
| Emissions: CO | 4.66 | 13.70 | 0.73 | 0.00 | 77.46 | 4.02 | 15.74 |
| Emissions: NOx | 1.65 | 5.54 | 0.10 | 0.00 | 53.27 | 6.99 | 59.23 |
| Emissions: CxHy | 0.57 | 2.46 | 0.02 | 0.00 | 15.63 | 5.63 | 31.22 |
| Emissions: VOCs | 384.44 | 1499.94 | 33.03 | 0.02 | 13,123.44 | 6.75 | 49.37 |
| Population | 46,122.02 | 114,045.18 | 20,061.00 | 3355.00 | 1,087,714.00 | 7.16 | 57.58 |
| Gross municipal product | 28,860.99 | 89,310.00 | 2541.0 | 70.33 | 555,920.86 | 4.55 | 21.37 |
| Energy production | 2818.57 | 11,458.25 | 133.86 | 0.00 | 101,520.32 | 6.33 | 46.53 |
| Variable | Total | PM | Gas and Liquid | SO2 | CO | NOx | CxHy | VOCs |
|---|---|---|---|---|---|---|---|---|
| Constant | −6.313 *** | −10.430 *** | −6.633 *** | −15.937 *** | −4.985 *** | −9.972 *** | −12.274 *** | −5.137 *** |
| (1.264) | (1.351) | (1.284) | (1.836) | (1.710) | (1.848) | (4.311) | (1.896) | |
| Population (P) | 0.817 *** | 1.014 *** | 0.830 *** | 1.505 *** | 0.586 *** | 0.953*** | 0.977 ** | 1.011 *** |
| (0.116) | (0.124) | (0.118) | (0.168) | (0.157) | (0.170) | (0.393) | (0.174) | |
| Gross municipal product per capita (A) | 0.678 *** | 0.476 *** | 0.703 *** | 0.559 *** | 0.706 *** | 0.917 *** | 1.038 *** | 0.869 *** |
| (0.065) | (0.070) | (0.066) | (0.095) | (0.088) | (0.095) | (0.254) | (0.099) | |
| Energy intensity of GMP (T) | −0.042 | −0.063 | −0.033 | −0.067 | −0.049 | −0.064 | 0.191 | 0.006 |
| (0.044) | (0.047) | (0.044) | (0.064) | (0.059) | (0.064) | (0.191) | (0.065) | |
| Observations | 113 | 113 | 114 | 113 | 114 | 114 | 76 | 107 |
| R2 | 0.664 | 0.573 | 0.672 | 0.576 | 0.485 | 0.603 | 0.334 | 0.594 |
| AIC | 346.9 | 361.8 | 353.3 | 431.2 | 418.6 | 436.4 | 404.2 | 411.5 |
Publisher’s Note: MDPI stays neutral with regard to jurisdictional claims in published maps and institutional affiliations. |
© 2021 by the authors. Licensee MDPI, Basel, Switzerland. This article is an open access article distributed under the terms and conditions of the Creative Commons Attribution (CC BY) license (https://creativecommons.org/licenses/by/4.0/).
Share and Cite
Pyzheva, Y.I.; Zander, E.V.; Pyzhev, A.I. Impacts of Energy Efficiency and Economic Growth on Air Pollutant Emissions: Evidence from Angara–Yenisey Siberia. Energies 2021, 14, 6138. https://doi.org/10.3390/en14196138
Pyzheva YI, Zander EV, Pyzhev AI. Impacts of Energy Efficiency and Economic Growth on Air Pollutant Emissions: Evidence from Angara–Yenisey Siberia. Energies. 2021; 14(19):6138. https://doi.org/10.3390/en14196138
Chicago/Turabian StylePyzheva, Yulia I., Evgeniya V. Zander, and Anton I. Pyzhev. 2021. "Impacts of Energy Efficiency and Economic Growth on Air Pollutant Emissions: Evidence from Angara–Yenisey Siberia" Energies 14, no. 19: 6138. https://doi.org/10.3390/en14196138
APA StylePyzheva, Y. I., Zander, E. V., & Pyzhev, A. I. (2021). Impacts of Energy Efficiency and Economic Growth on Air Pollutant Emissions: Evidence from Angara–Yenisey Siberia. Energies, 14(19), 6138. https://doi.org/10.3390/en14196138