1. Introduction
The world’s energy needs have risen because of rapid industrialization in the contemporary era. While renewable energies were recently suggested, the key contributors to energy supply remain the traditional non-renewable energy sources, with hydrocarbons being the most heavily relied on. The oil fields throughout major oil-producing regions are nearing the end of their useful life and unconventional reservoirs like shale requiring sophisticated techniques are still out of question at such low crude prices [
1]. The vast mature fields are on the verge of being abandoned, with almost half of the original oil in place (OOIP) left unrecovered [
2]. As mature fields deplete and higher capital costs halt new projects, professionals’ emphasis has turned to enhance the ultimate recoveries of developed fields to meet the needs of the market. Enhanced oil recovery (EOR), also known as tertiary recovery, is a process that aids in the recovery increment by enhancing recovery (by altering the fluid–fluid and fluid–rock interactions inside the reservoir). Existing EOR methods can recover 30–60% or more of the hydrocarbons, compared to 20–40% recovered by primary and secondary recovery methods [
3]. EOR application in conventional and unconventional reservoirs is carried out using different techniques, whereby simple flooding by gas or water is carried out or a combination of methods, such as water alternating gas (WAG) or foam assisted water alternating gas, are used [
4].
The advancement and application of nanotechnology has shifted the focus of EOR research toward the shortcoming of existing technology by applying nano-assisted EOR techniques [
5,
6]. Recent advancements in technology have focused on the enhancement of particle properties, from millimeter to micrometer material properties, enhancing desired attributes. Ultimately, this optimized the properties of the materials which are supposed to have a major impact on the application as the material research is being carried out on nanoscale level [
7]. Nanoscience is the study of materials and phenomena to the nanoscale [
8,
9]. While the design, characterization, application, and formation of nanomaterials are called nanotechnology [
10].
Due to this, such nanoparticles are embedded in substances to achieve the desired output of the final product with desired properties; such substances are termed nanomaterials. Nanomaterials have found their way into many industries, ranging from electronics to medicine. These materials are also applied in the oil and gas industry mainly as nanofluids. Nanofluids are fluids that have diluted liquid suspensions of nanoparticles with at least one of their dimensions smaller than 100 nm [
11]. Formations of nanofluids have enabled the use of nanotechnology in the oil and gas industry.
1.1. Nano-Fluids EOR Mechanism
Nano-EOR allows modifications of the properties of displacing fluid at the nanoscale. Consequently, the microscopic recovery enhancing parameters are optimized. Nanofluids were found to enhance recoveries in sandstone and carbonate reservoirs at the lab scale [
6,
7,
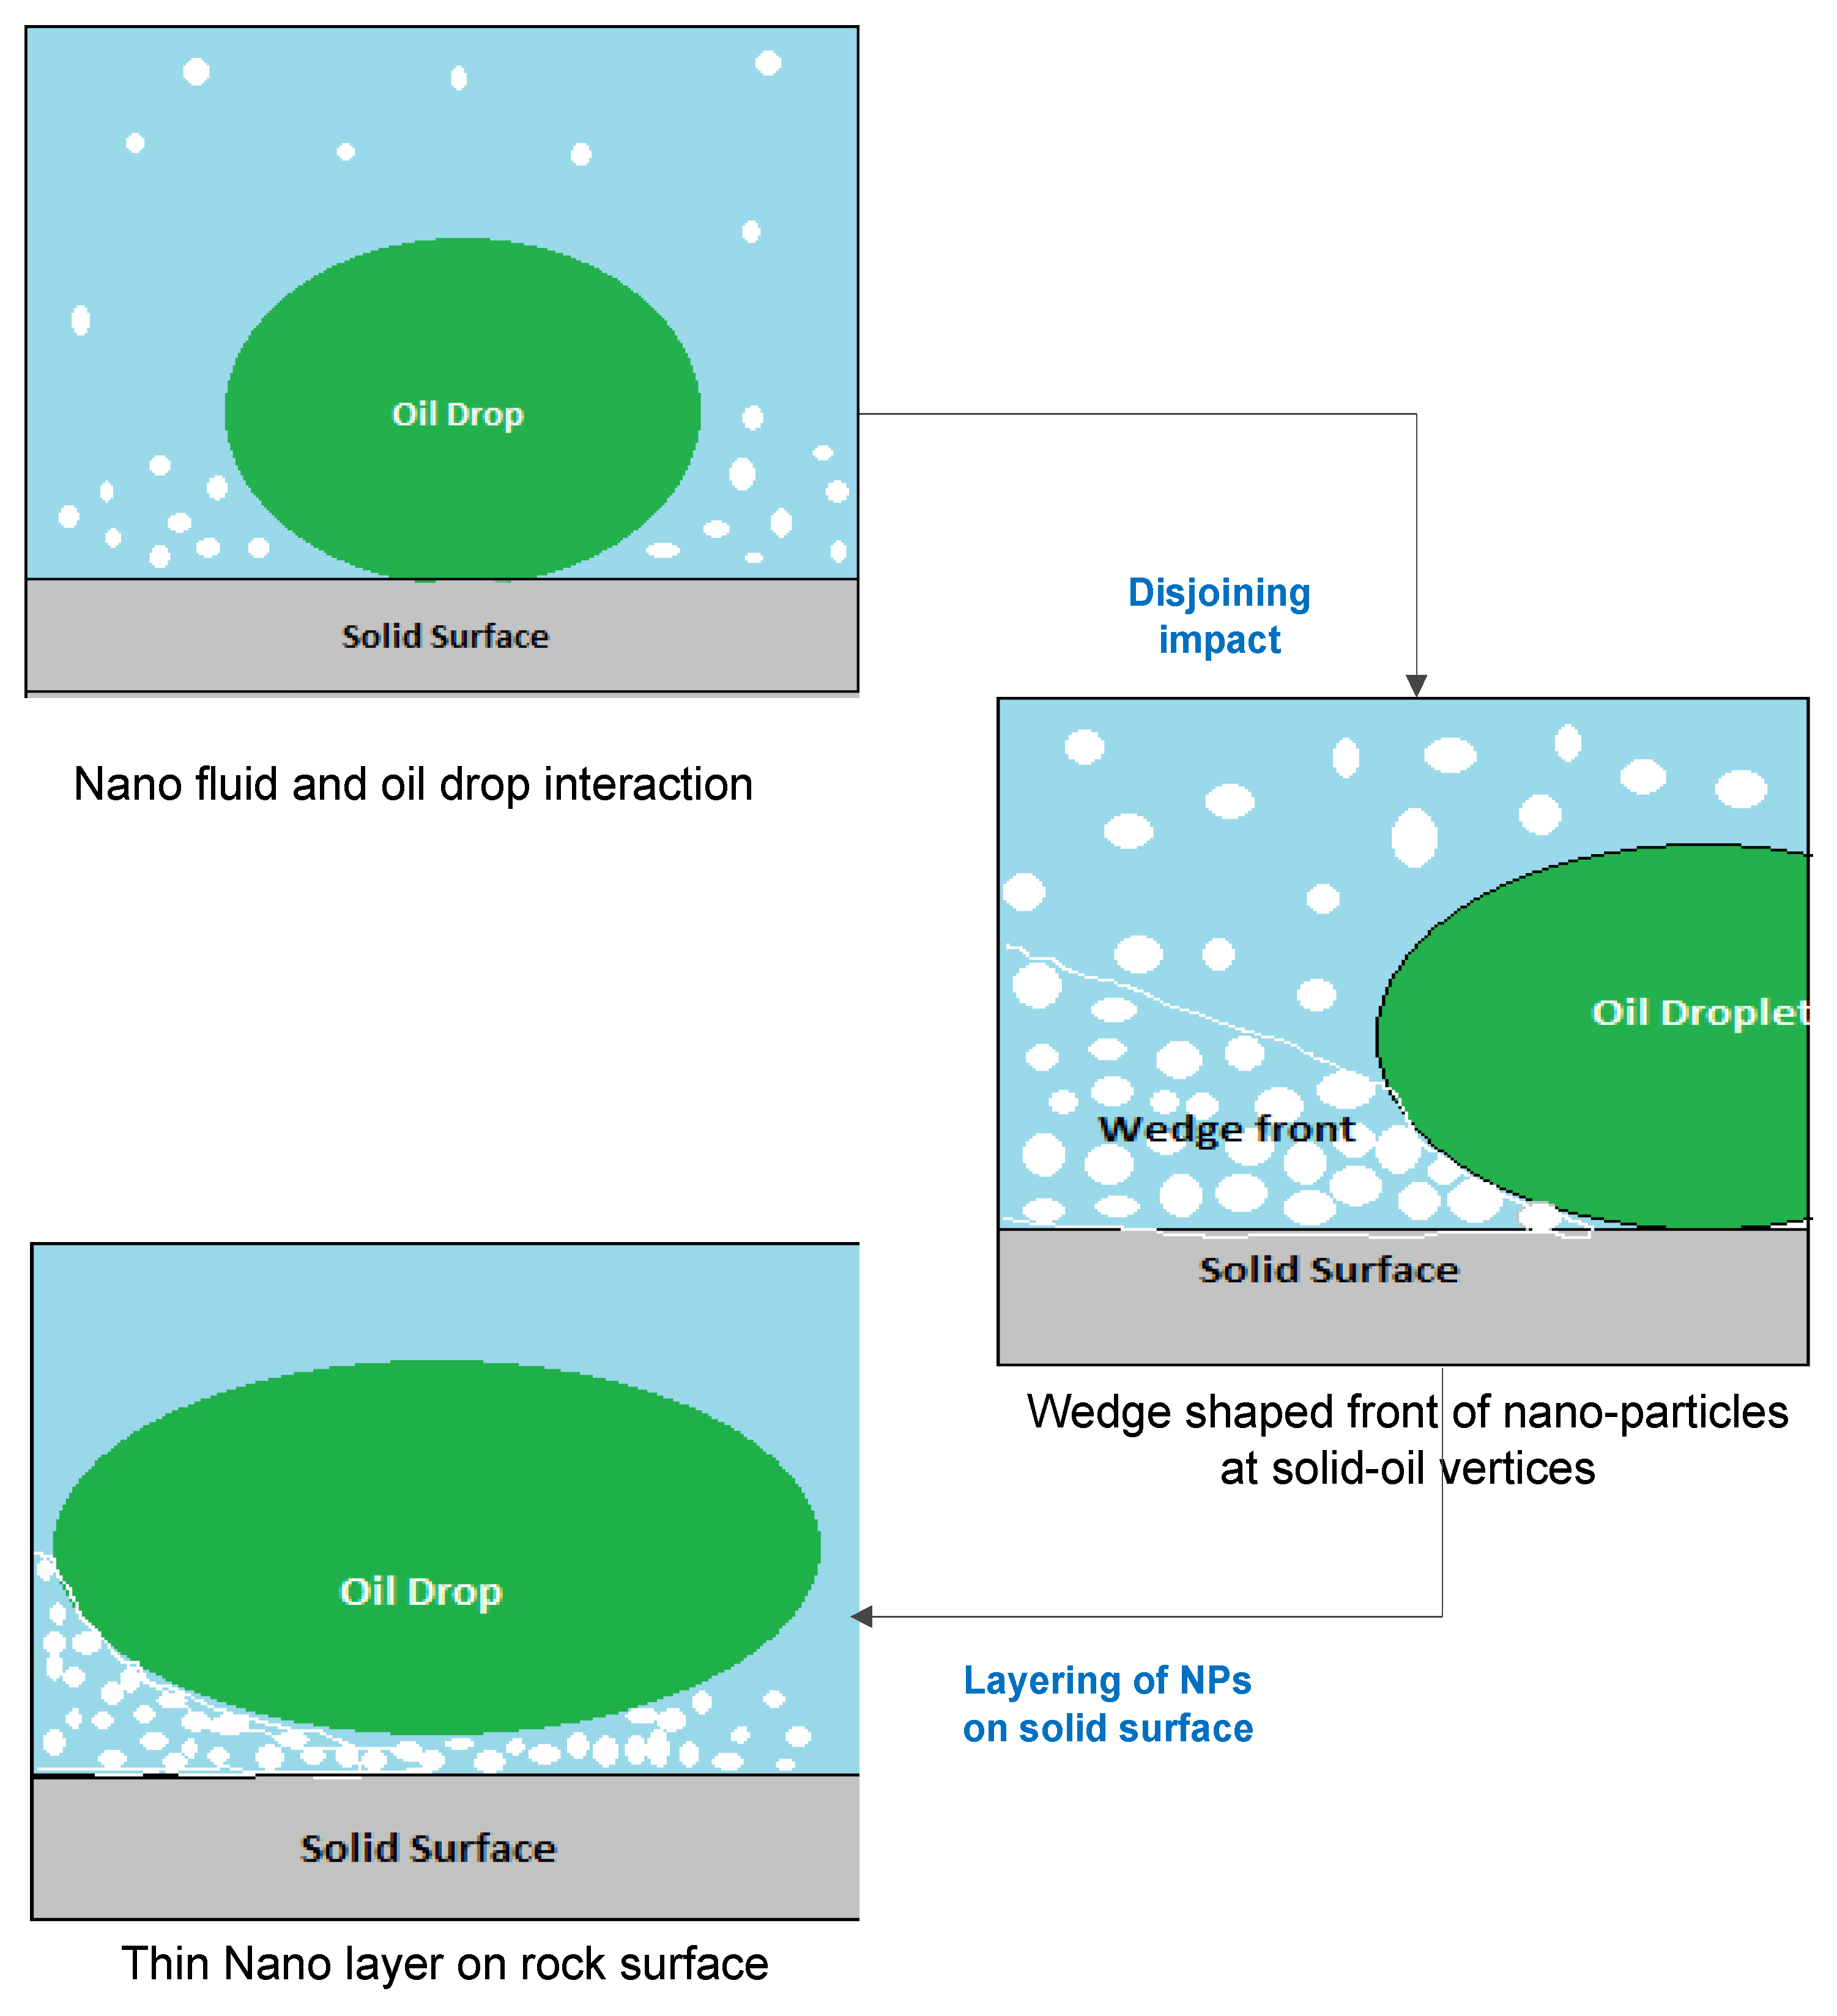
12]. The detailed investigation concludes that as the EOR additives were replaced with nanomaterials in displacing fluid, their impact was higher compared to previously used CEORS additives, as the major increment in recovery was contributed to by the smaller pores that were not impacted previously with larger sized additives. Owing to their hydrophilic attribute, they enhance recoveries by changing wettability to water-wet. The smaller size of these particles sticks around the rock-pore surface which enhances recovery by the disjoining mechanism. The smaller the size of the nanomaterial, the larger the impact due to this disjoining impact of the nanofluids, as can be seen in
Figure 1. They also serve as viscosity enhancers and improve recovery by improving mobility. It was observed that the lower particle size of nano-fluids (<100 nm) when compared to conventional methods easily impacts higher depths by passing through pore throats and impacting dynamically [
13,
14].
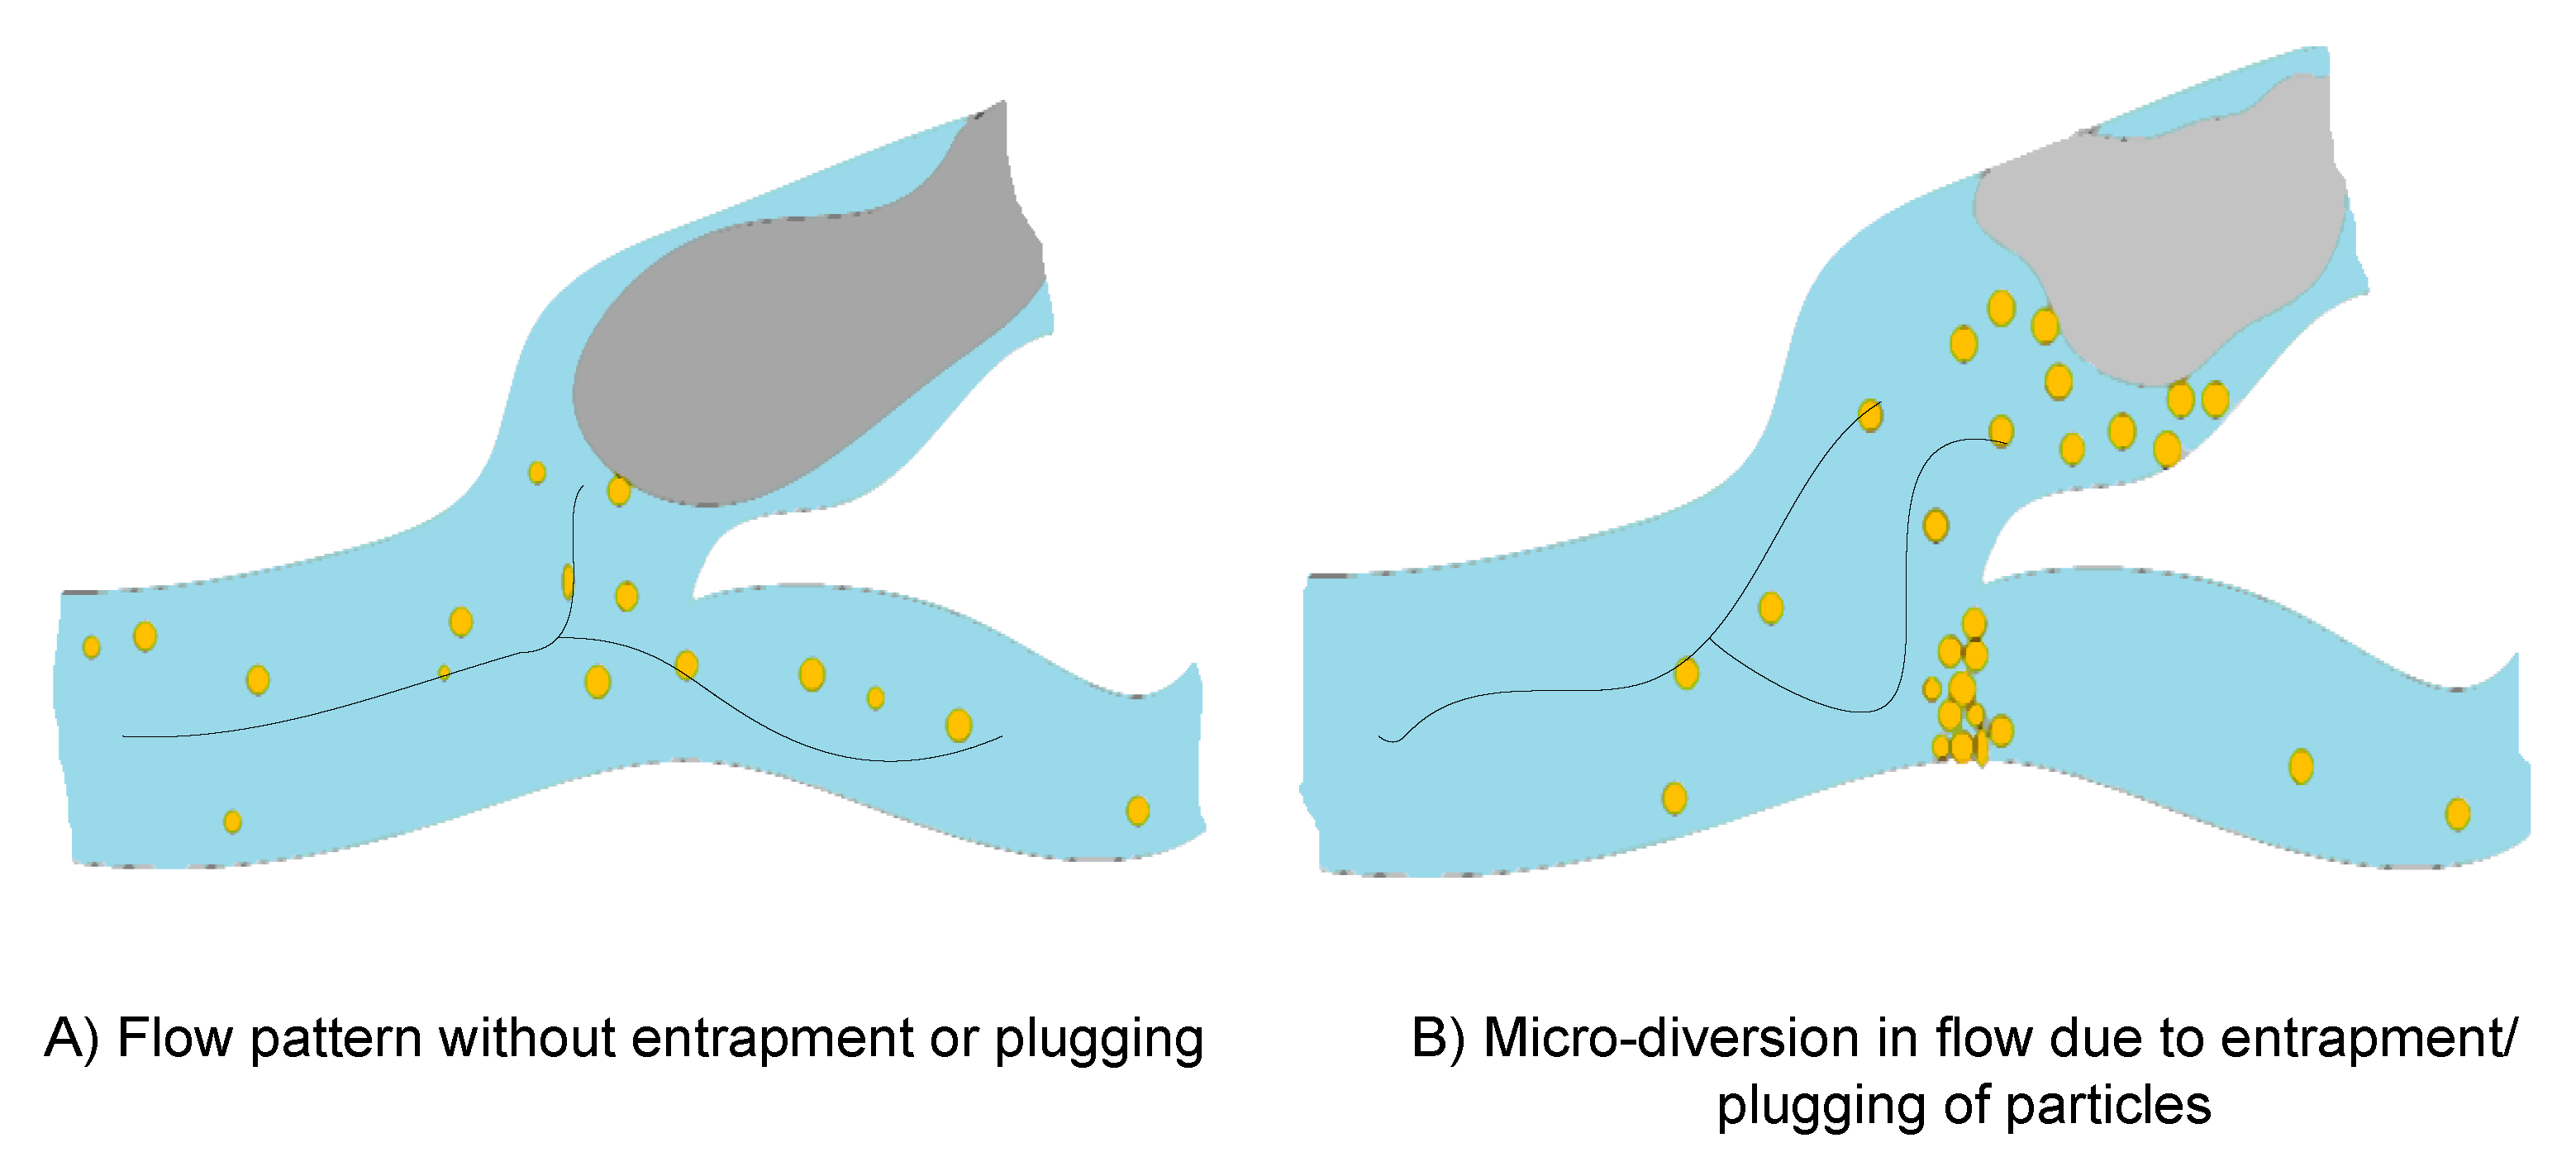
Other mechanisms, such as the log jamming effect [
15] (as shown in
Figure 2), clogging at the pore throat, and IFT reduction [
6,
16], all play an important role in contributing to incremental recovery [
17,
18,
19]. In any scenario, either one, two, or all the above mechanisms [
20] may contribute to recovery but normally one mechanism remains most dominant. All these mechanisms are impacted by various factors such as particle concentration, particle size, injection rate, salinity, and stability [
21,
22] of the fluid system.
Xu et al., in their work in 2018, outlined the interactions between nanofluids and crude oil that contribute toward incremental recovery. According to their study, oil tends to swell, change its wettability from oil-wet to water-wet, which ultimately disjoins the oil. The swelling ratio was seen increasing at lower salinities. They also outlined flow resistance in the swept region, which causes fluid flow improvements in the untapped region, hence the sweeping efficiencies are improved which ultimately improves recoveries [
23].
Nanoparticles such as silica are not environmentally hazardous compared to chemical EOR additives that are believed to have a harsher environmental impact. Nanomaterial usage as an EOR agent enhances recovery through different mechanisms, including the disjoining mechanism [
24,
25], viscosity increase of injection fluids, preventing asphaltene precipitation, wettability alteration, adsorption, pore throat plugging, log jamming, and interfacial tension reduction [
6,
26,
27].
1.2. Challenges
Nanofluids, despite being an efficient agent to enhance recoveries, were rarely evaluated in pilot or field tests. The reasons for this slow process are more than one and a few among them are economics, environmental constraints in a few countries, and the contradiction of recovery output results [
16]. Irreproducibility [
28] of recovery results is due to many uncertainties, such as the lack of detailed evaluation studies of rock properties, concentrations, retention ability, and stability that were not integrated. Even though it was established that the nanofluids are, comparatively, more feasible than many current CEOR methods, the above-mentioned hurdles have delayed utilizing the true potential of nanomaterials in the field of EOR.
Many metallic [
29,
30,
31] and non-metallic nanoparticles were utilized at lab scales but, among them, silica nanoparticles [
32] are considered the most suitable nanomaterial to be applied in sandstone cores because of their technical, environmental, and economical advantages. Due to their hydrophilic attribute, they tend to change wettability from oil-wet to water-wet [
33] and reduce the interfacial tensions.
However, as discussed above, the two-fold impact of the above parameters is hypothetically considered as the main cause of contradictions in recovery output in different studies. Theoretically, one parameter may enhance any mechanism positively but, at the same time, it has an adverse effect on the second property which aids in enhancing nano-based recoveries. For instance, the higher the concentration, the more the system will shift toward more water-wet conditions, but the higher concentration will also result in more nanoparticles in the system which may destabilize the solution. Ultimately, this will reduce the recovery potential of the nanofluid [
28] and result in retention and reduction of the flow capability of the reservoir.
Recently, the major focus of researchers is on stability by adding stabilizers in the nanofluid solution and experimenting with new solvents. Yet, an understanding of the optimum parameters would remain an important area of concern and requires understanding regarding recovery mechanism changes that may occur with changes in the parameters. It becomes necessary to create understanding regarding optimized conditions in which the recovery becomes the highest, and stability remains intact. Factors such as particle size [
34] and injection rate should also be considered as they were reported to impact the potential of nanomaterials used in flooding [
35].
The goal of this research is to evaluate the recovery potential of various concentrations in various salinity environments in a systematic manner. Changes in mechanisms are assessed for their impact on recovery in relation to parameter changes. This research also outlines recovery in the event of instability, as well as the mechanisms involved in recovery by unstable fluids. Though much recent research has focused on stabilizing nanofluids, the impact of degraded stability and processes is rarely examined.
2. Materials and Methods
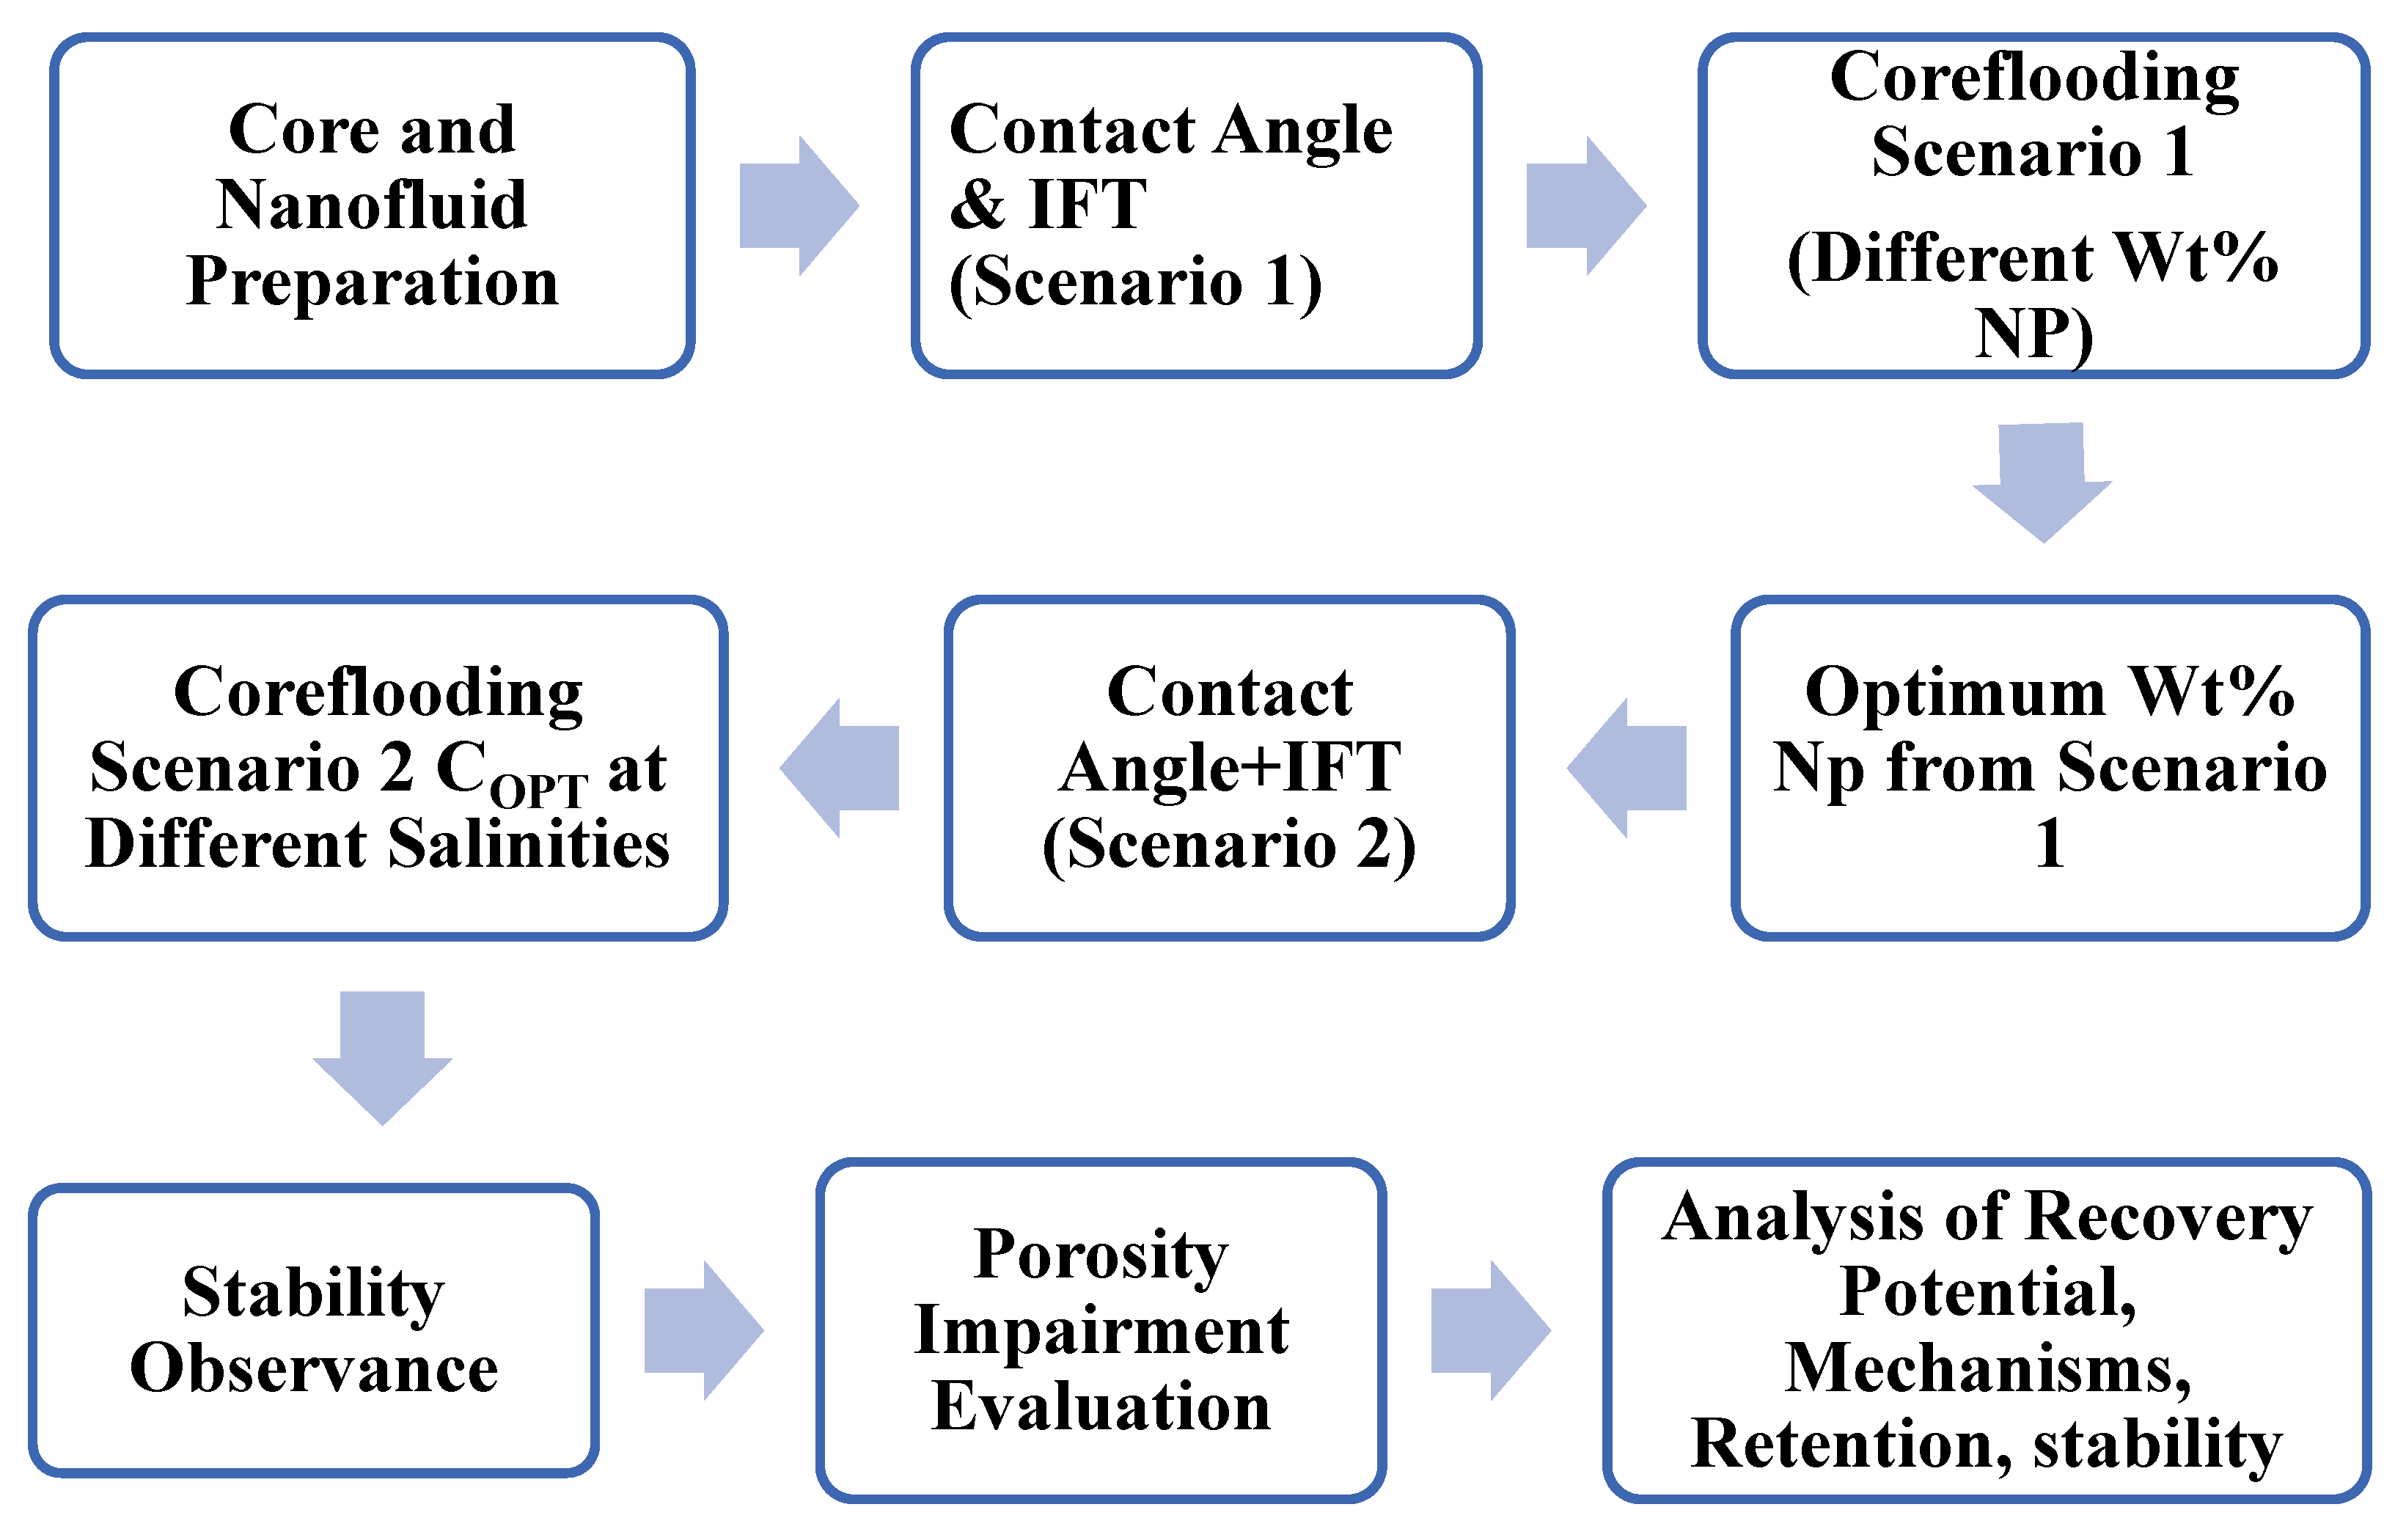
For evaluating the recovery potential of the nanofluid, six sandstone cores were utilized, and aerosol 200 hydrophilic silica nanomaterials were acquired commercially. Brine was prepared in distilled water with industrial sodium bicarbonate. Once all the nanofluids were prepared, nanofluids were visually observed for stability changes from preparation to 24 h. Interfacial tension measurements were taken of the prepared flooding fluids with paraffin (oleic phase). Contact angle measurements were carried out between the paraffin droplet and glass substrate submerged in nanofluids for all the fluids, which was followed by nano flooding as a tertiary recovery mechanism for different scenarios. Finally, porosity measurements were carried out to evaluate retention and impairment in the system. In scenario 1, different concentrations of nanoparticles were used to prepare nanofluids in a brine solution of 20,000 ppm. The major aim of scenario 1 was to evaluate the impact of changing concentrations on recovery and identifying recovery mechanisms associated with the concentration change at lower salinity. Salinity is an important parameter when nanofluid application in the reservoir is considered. Hence, in the second scenario, the concentration was kept constant at an optimum concentration from scenario 1, whereas salinity was increased to 30,000 ppm in case 5, and 40,000 ppm in case 6. The concentration was enhanced to at least 40,000 ppm, as expected salinity in reservoirs locally was considered as similar to average seawater salinity, i.e., 35,000 ppm. The experimental design flow is shown in
Figure 3 below:
2.1. Materials
Six sandstone cores were utilized in the study, among which four cores were of Castlegate origin, and two Barea sandstone cores were used. Castlegate sandstone is a late Cretaceous geological formation in the United States with stated average porosities above 20% and stated permeability of 800–1200 millidarcy. Barea sandstone is a widely applied core on a lab-scale, as it represents one of the active oil and gas formations in the United States. Both the cores used are considered clean due to lower clay content and hence less impact of clay swelling is assumed during flooding. The cores were cleaned using Soxhlet extraction utilizing toluene and were dried in the oven for 24 h. Core properties were manually measured for physical dimension by a Vernier caliper, whereas porosity was measured by a saturation method and ascertained by helium porosimeter, and the liquid brine permeability was measured by LiquidPerm equipment. The properties of the cores are given in
Table 1 below:
Hydrophilic silica nanoparticles are acquired from Evonik Industries, with an average particle size of 12 nm and a surface area of 200 +/− m
2/g. Silica nanomaterial contains silica dioxide (SiO
2) beyond 99%. This makes it environmentally and economically feasible to be applied in larger quantities. Nanofluids were prepared by mixing and stirring the nanoparticle with a laboratory stirrer at higher rpm and then were placed in an ultrasonic bath for 1 h for homogenous mixing.
Table 2 shows the details of nanofluids used in the study along with the cores used.
As can be seen in
Table 2 above, four different SiO
2-based nanofluids were prepared for nano flooding with varying silica concentrations. Four Castlegate-type sandstones were used with porosities in the range of 18–22% for scenario 1. Whereas, in the second scenario as given in
Table 2, the concentration that gave the highest recovery along with optimum contact angle and IFT changes was utilized as the optimum concentration. The salinity of the fluid is increased from 20,000 ppm to 40,000 ppm in the latter scenario. The acquired results are compared to case 2 from the previous scenario, as it had the highest concentration and optimum mechanisms which are discussed in the results section.
Laboratory grade paraffin oil was used in the study as oil phase, as its properties resemble local Malaysian light crude oil. The density of paraffin oil was 0.842 g/cm3 and the viscosity was 32 cp at 25 °C. The brine was prepared by mixing sodium chloride (NaCl) in distilled water. The low salinity was set at 20,000 ppm, whereas at 30,000 ppm and 40,000 ppm for high salinity evaluation, as the average local seawater salinity is 35,000 ppm.
2.2. Methods
2.2.1. Nanofluid Preparation
Nanofluids are prepared as discussed in the materials section with predesigned parameters for different concentrations and salinities. Nanofluids are prepared by mixing silica nanomaterial in the required wt. %, then the solution is electronically stirred at 500 rpm for 30 min and then ultrasonicated for 1 h. The appearance of the nanofluid solution will turn more whitish with increasing wt. %. The concern in nanofluid applications is its stability, and so physical observation of the solution will serve as a key indicator for stability over time.
2.2.2. Contact Angle Measurement
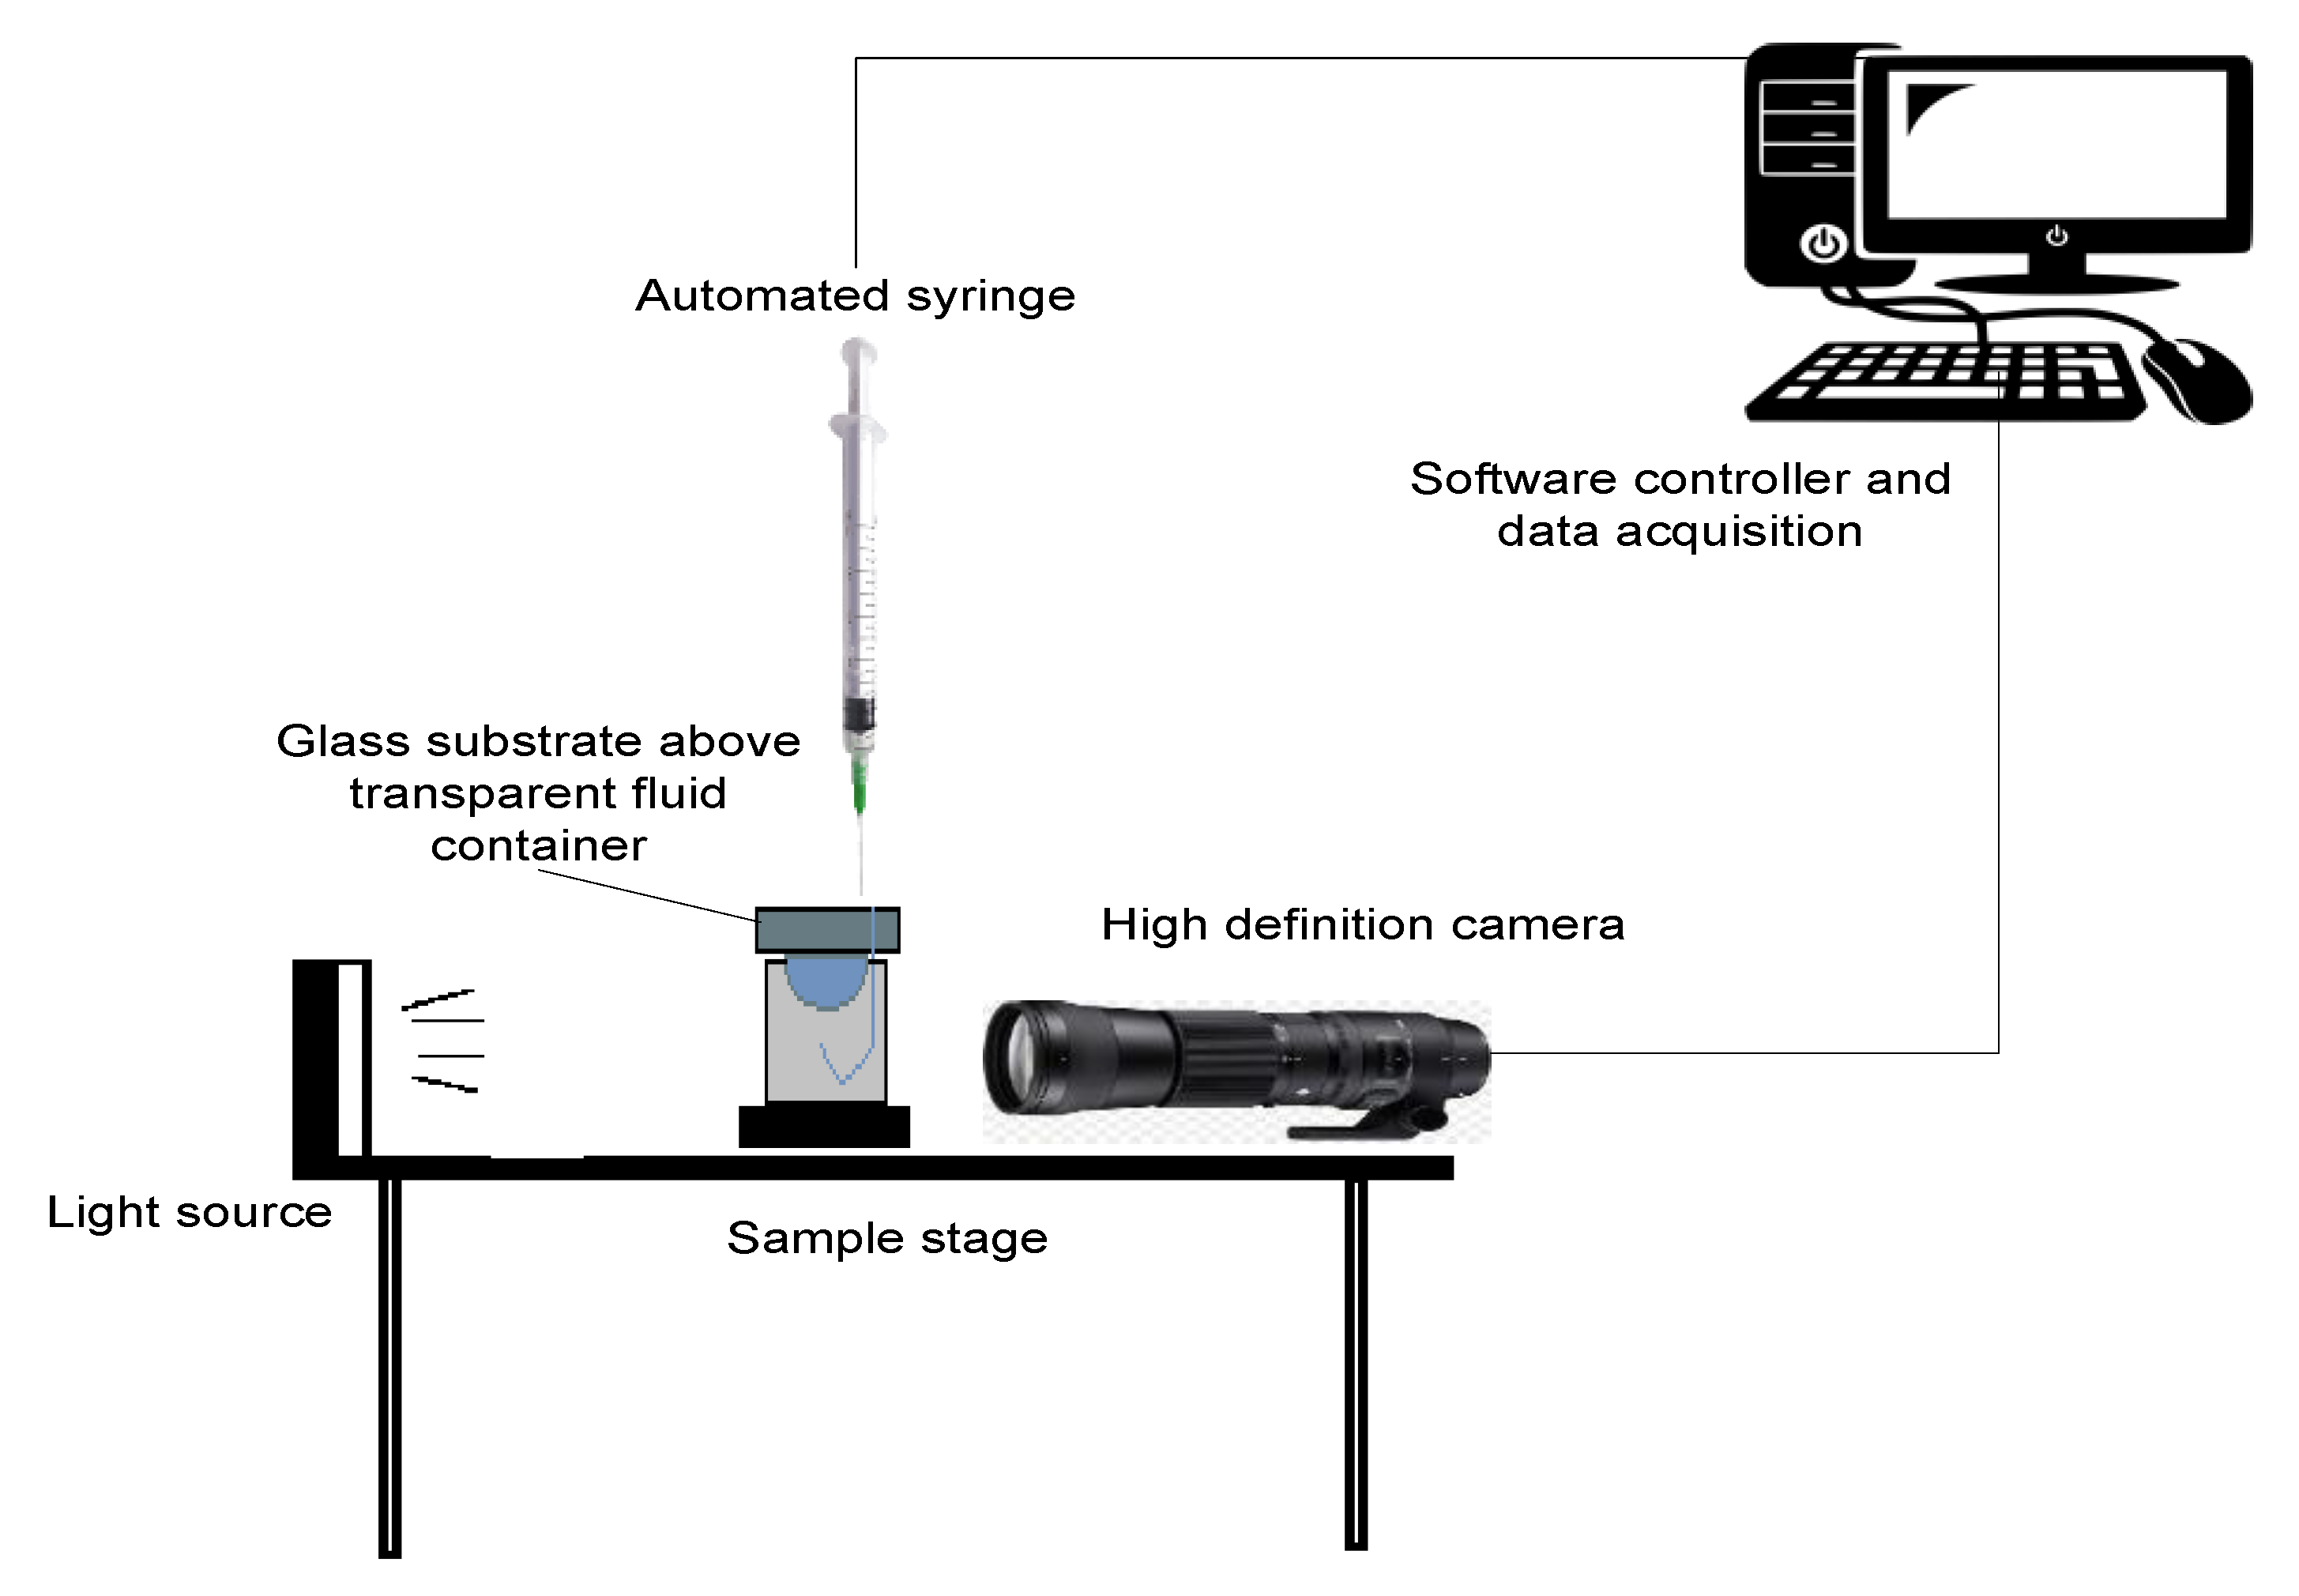
Contact angle measurements are carried out using the KRUSS drop shape analyzer (DSA25E) for the nanofluid-oil-solid system. The setup for measuring the contact angle in our case was modified to evaluate the contact angle of paraffin oil dropped beneath a solid glass substrate by the sessile drop method using a modified u-shape syringe.
The setup included a sample stage which was replaced by a transparent glass container that was filled with nanofluid, and a glass substrate was placed on top, surrounded by nanofluid, and a drop of 1 micro-liter volume was generated beneath the substrate. At one end, a light source produces highly focused light and, on the other end, a high-definition camera was placed that captured the images, which was connected to the computer system used for data acquisition, as shown in schematic
Figure 4 below. The complete functioning of the equipment is controlled for precision by using software, and acquired images are all analyzed in real time by the same program.
As explained above, the stage in our scenario was modified to analyze the contact angle in the nanofluid-oil-solid system, hence the image quality was impacted by the reflections from the glass container used, due to which the angles were not measured in real time. Resultantly, an image processing tool called as ImageJ was used for measuring contact angles from acquired images.
2.2.3. Interfacial Tension Measurements
Interfacial tension measurements were carried out between the oleic phase and nanofluids at room temperature using the Kruss tensiometer (K20), using the standard Wilhelmy plate method. As given in the materials section, the oil phase in the study was paraffin oil, hence the IFT measurements were carried out between paraffin oil and nanofluids at various concentrations at room temperature.
2.2.4. Core Flooding as a Tertiary Recovery Mechanism
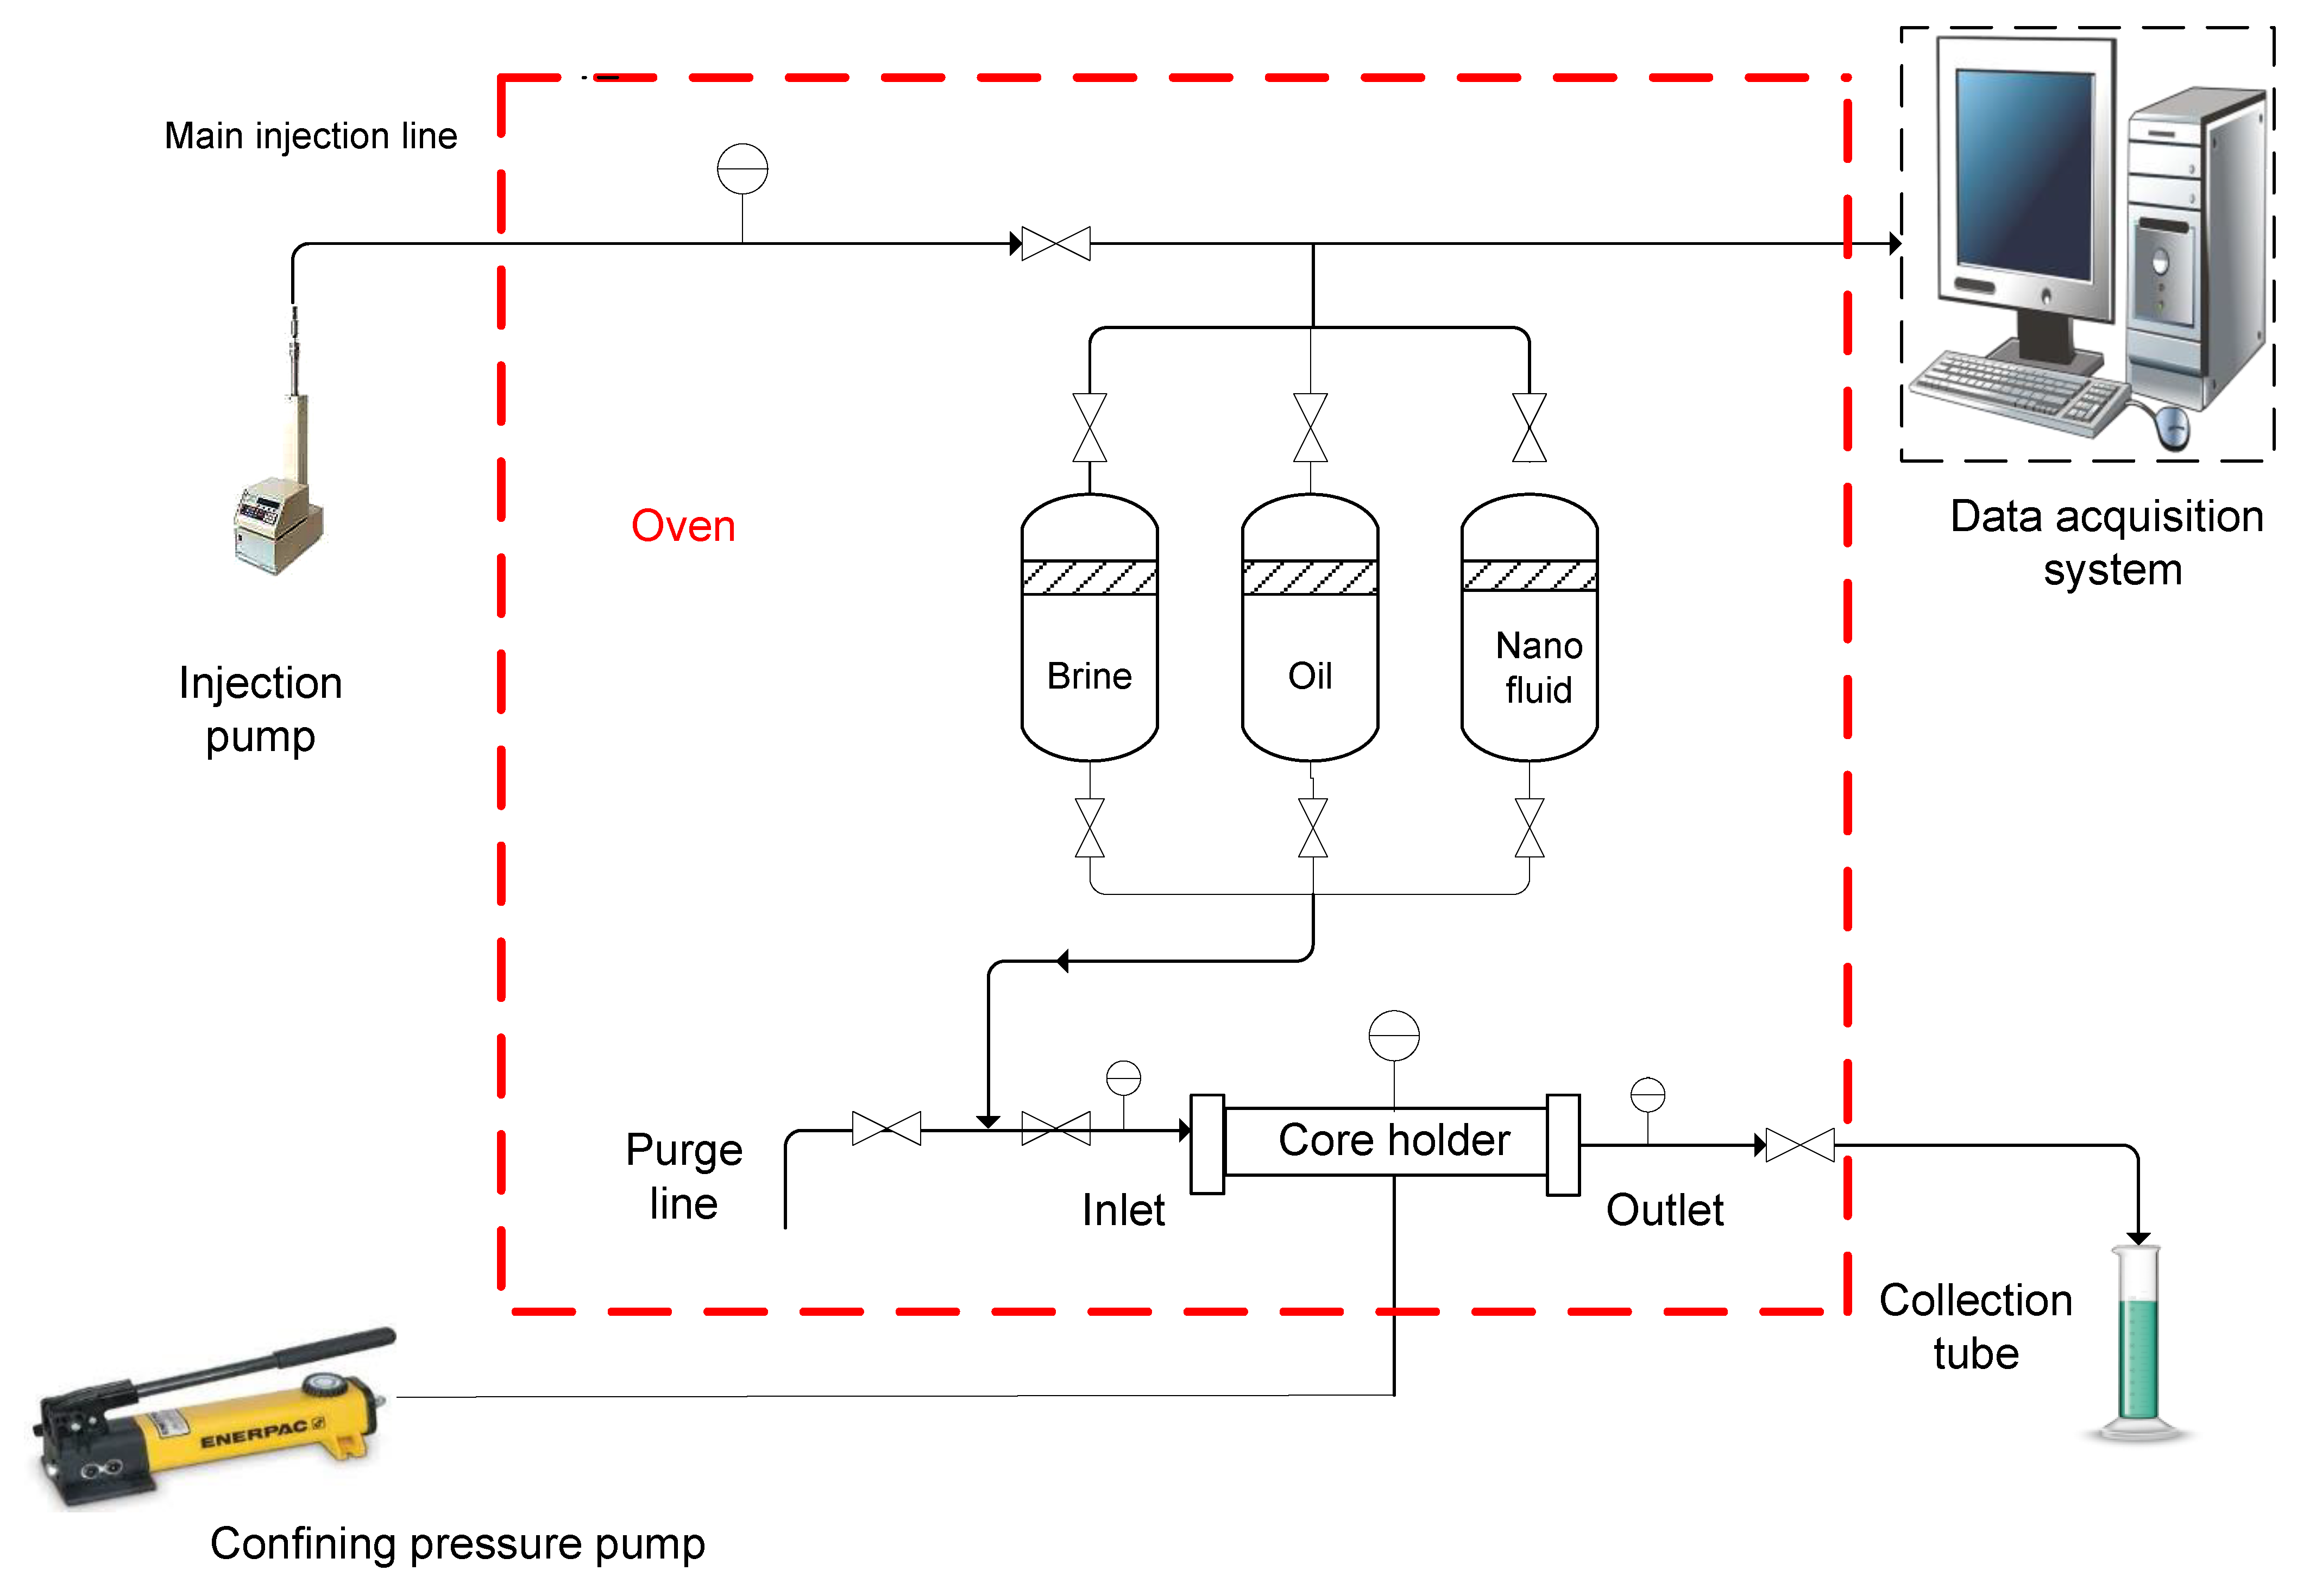
Core flooding was carried out using the high-pressure low-temperature HPLT flooding apparatus. FARS-EOR was the core flooding setup used in our work.
Figure 5 below, shows a basic schematic of the three accumulators-based core flood experimental setup, with the labeled components.
In scenario 1, core flooding was used to investigate the recovery potential of secondary water flooding and tertiary nano flooding for concentrations of 0.02, 0.05, 0.07, and 0.10 wt. % of nanomaterials at a salinity of 20,000 ppm. In scenario 2, the optimal concentration from scenario 1 was utilized to assess the influence of increased salinity at 30,000 and 40,000 ppm on tertiary flooding. The recovery mechanisms will be investigated with changes in salinity at a constant concentration. The HPLT flooding equipment was used to carry out the core flooding, as shown in
Figure 5. During core flooding, the confining pressure was set at 1000 psi. A pressure transducer was used for recording the pressure differential. All the experiments were conducted at room temperature. To investigate the effect of silica nanoparticles on incremental recovery, the following steps were be carried out:
- (a)
To attain initial water saturation, a core plug was saturated with brine at a 1 cc/min flow rate (equivalent to 5 ft/day velocity in actual reservoir rock).
- (b)
Then 3–4 PV of oil was injected to ensure that the core plug is completely saturated; the produced water was then measured to ascertain the oil and water saturations. To determine irreducible water saturation, water was collected at the outflow.
- (c)
As a waterflooding mechanism, brine was flooded to accomplish initial recovery. The produced oil was collected in the beaker at the outflow to determine the percentage of oil produced vs. time and injection volume.
- (d)
Then different nanofluid regimes were flooded to achieve tertiary recovery.
- (e)
Oil production values were recorded versus time, based on the amount of oil produced.
- (f)
Additionally, recovery versus the injected oil volume was recorded.
- (g)
The pressure differential data against time and pore volume injected was acquired from the system.
2.2.5. Porosity Impairment
Porosities of all the above-used cores in core flooding were measured after removing any leftover fluids in the core using toluene by Soxhlet extraction apparatus for 24 h and then cores were oven-dried for 24 h at 100 degrees centigrade. Once the cores are cleaned and dried, porosities were measured using a helium porosimeter to measure changes in the porosity post nano flooding. This assumption was considered because the sandstones used were considered clean with lower clay content hence there would be no impact of clay swelling on porosity reduction.
3. Results
The above study’s findings are divided into two scenarios. In scenario 1, concentration was a variable parameter that had to be optimized based on recovery, stability, and impact on mechanisms. While salinities in scenario 2 were changed, the optimum concentration from scenario 1 was used as a constant parameter. With changes in salinity from lower to higher ranges, this scenario explains the impact of salinities on recovery, stability, and mechanisms. The retention of nanomaterials was also assessed, with the presumption that the lower the porosity, the higher the retention of nanomaterials.
3.1. Scenario 1: Different Concentrations
In scenario 1, tertiary nano flooding was performed at concentrations of 0.02, 0.05, 0.07, and 0.10 wt. % at a lower (NaCl) brine salinity of 20,000 ppm. To compare recovery profiles, an equal volume of nanofluids was injected in each of the four cases.
Table 3 (below) enlists all the measurements carried out for the above cases.
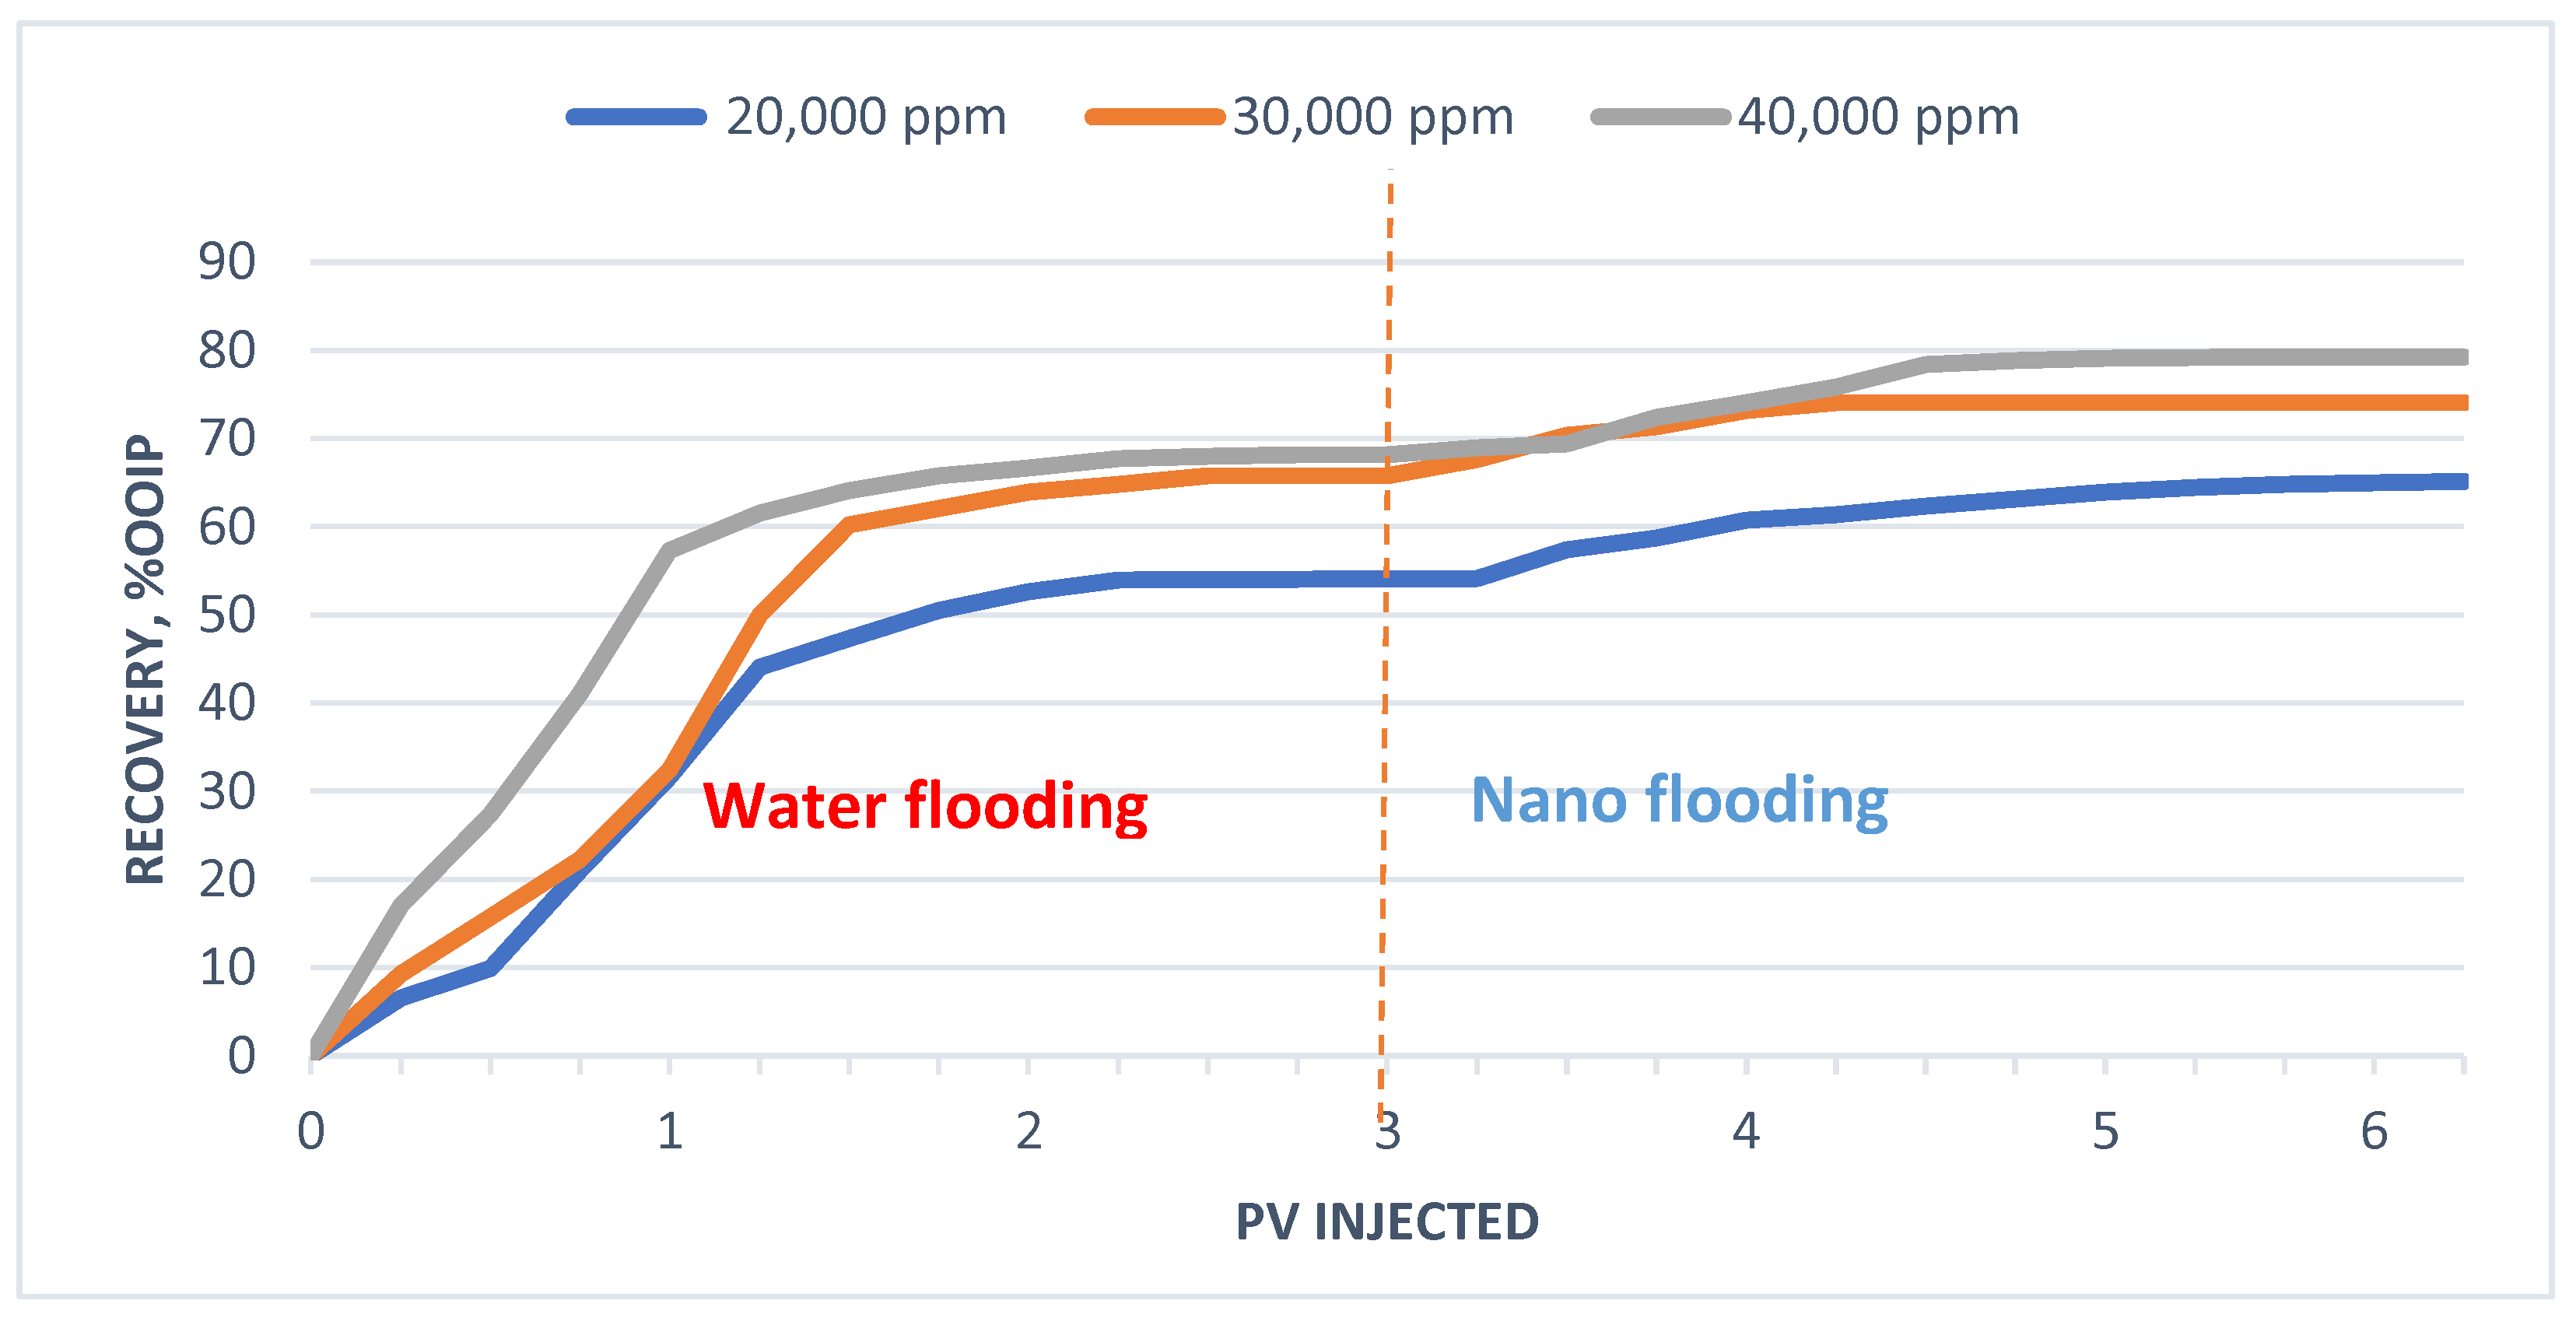
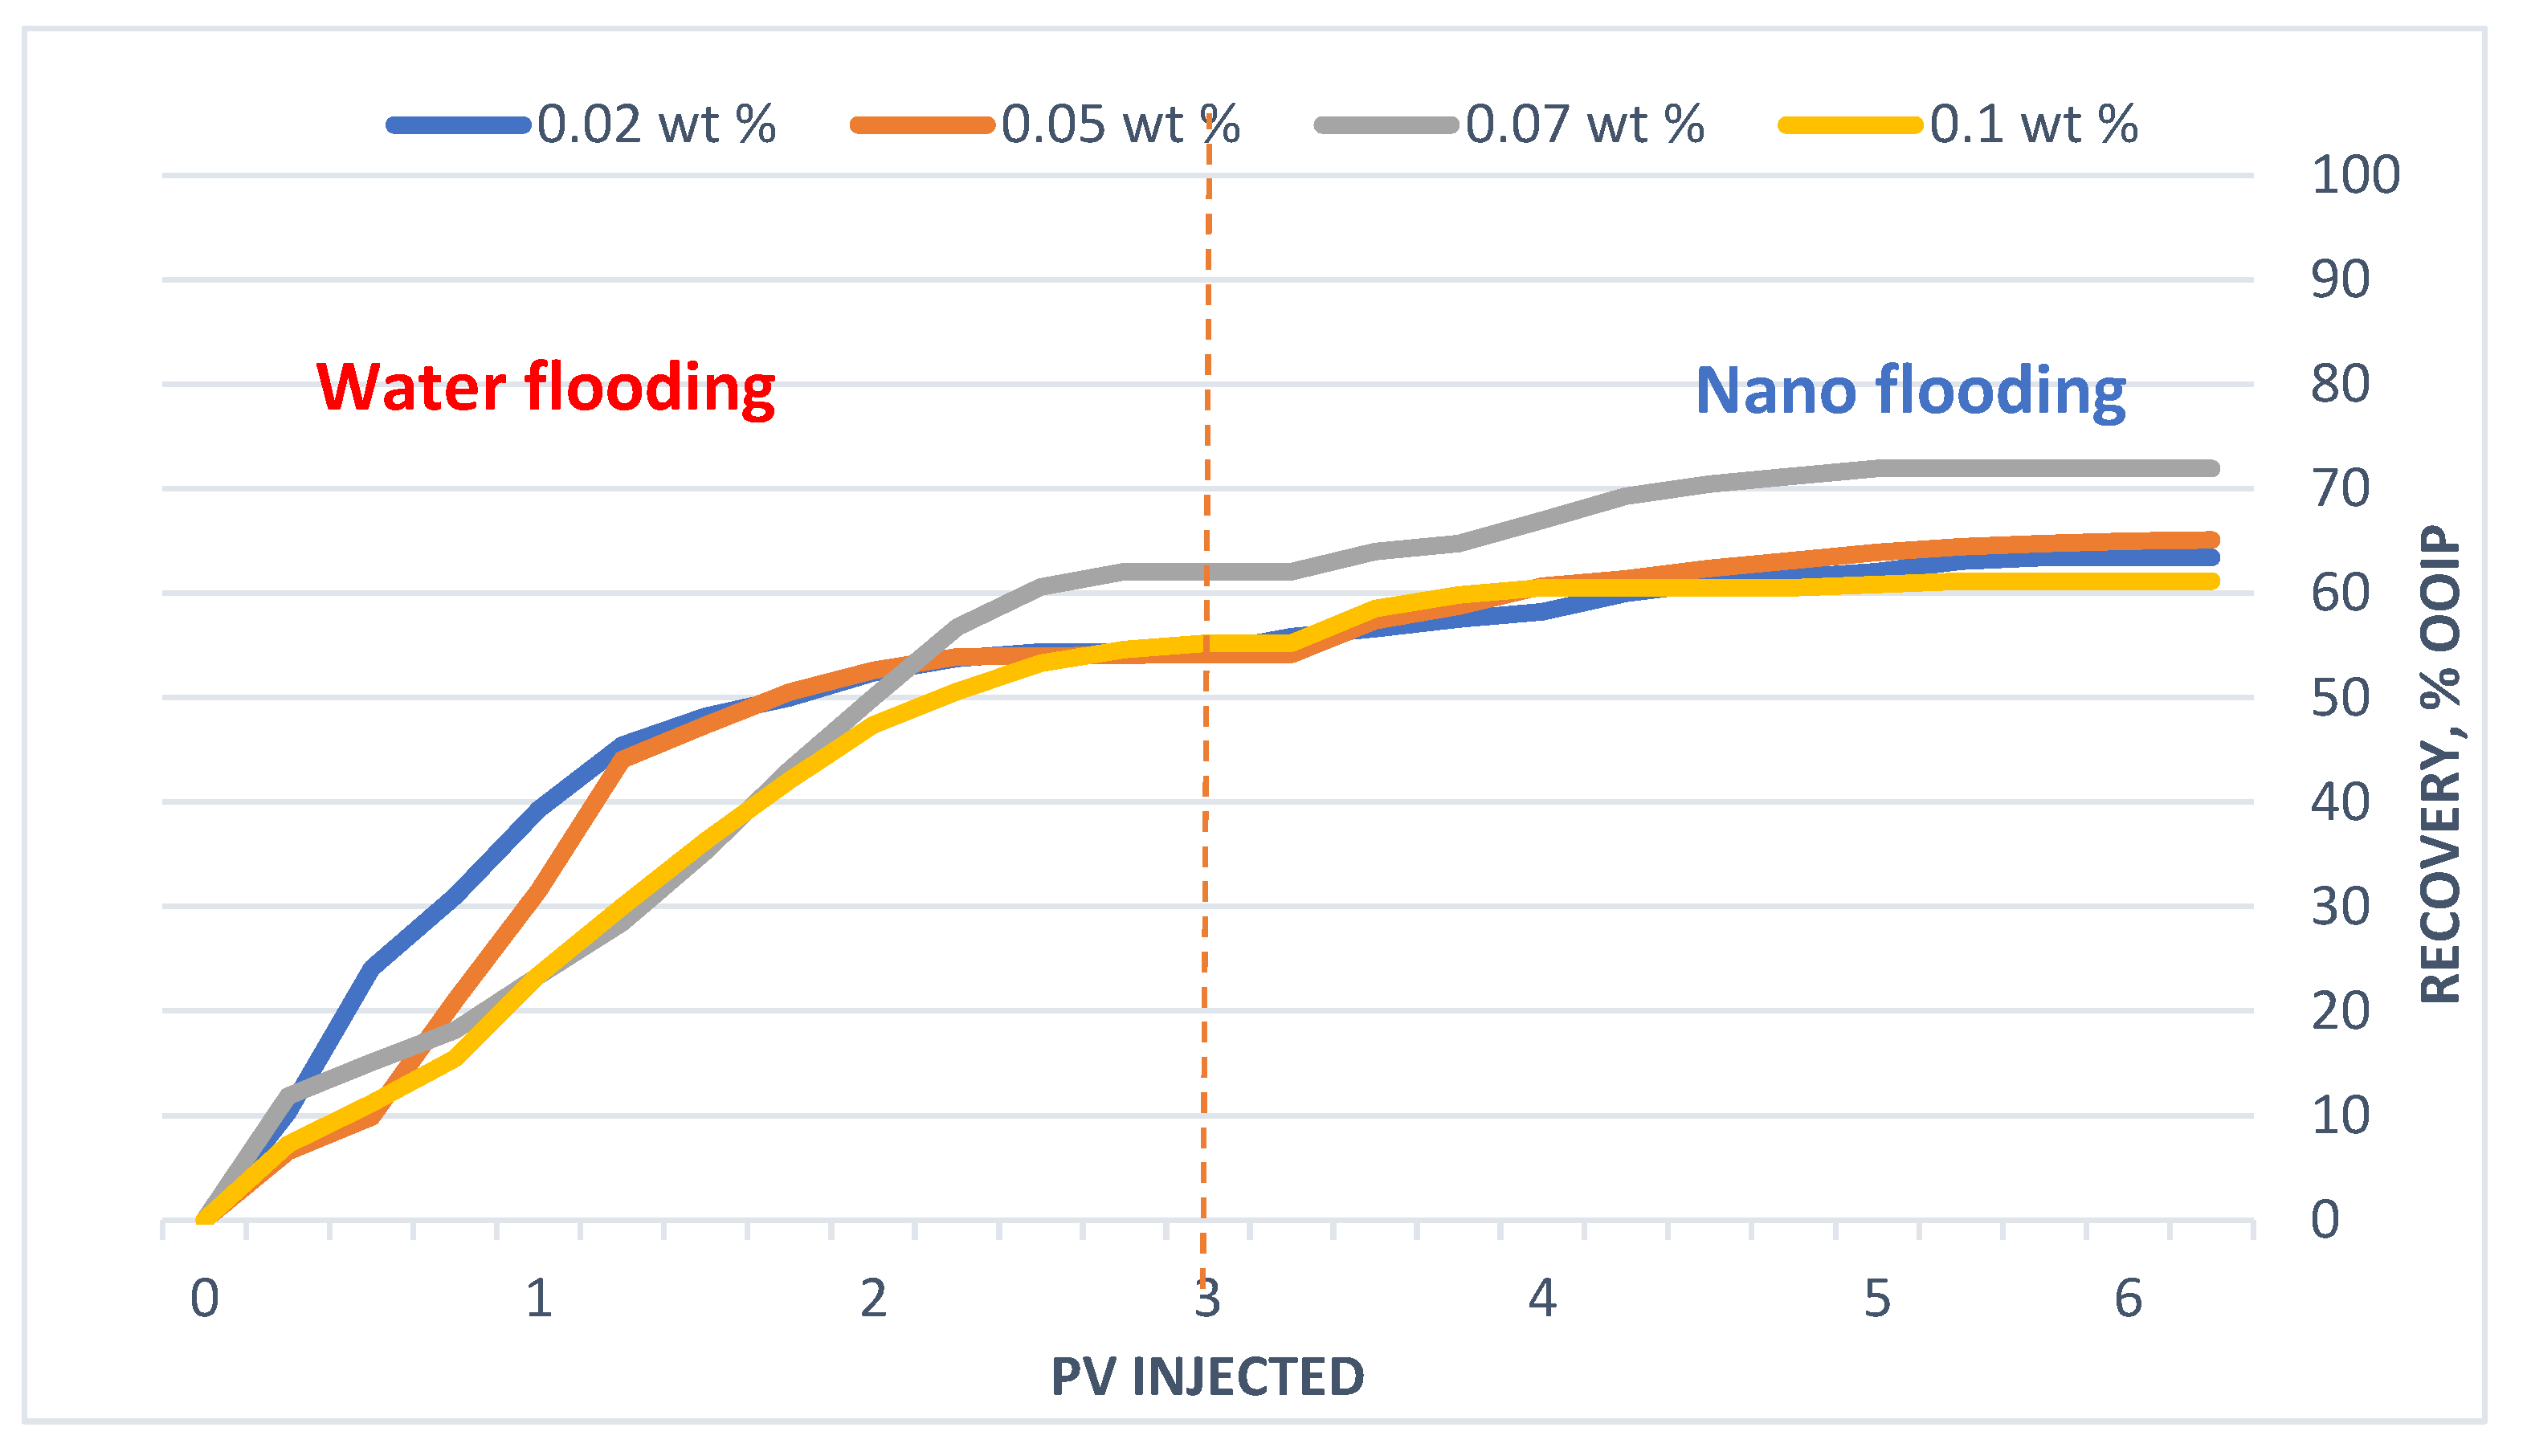
For scenario 1, the oil recovery output was manually gathered and plotted against the pore volumes injected. For all four cases,
Figure 6 shows the trend of oil recovery by waterflooding for the first three pore volumes (PV) and nano flooding for the next three pore volumes (PV). It is implied from the figure below that nano flooding as a tertiary recovery mechanism enhanced recoveries further, but it is also observed that each concentration has a different incremental profile. The increase in the concentration of nanomaterial from 0.02 wt. % to 0.05 wt. %, increased tertiary recovery because wettability change and IFT reduction were at their peak. The recovery impact of concentrations begins to decline after 0.05 wt. %, with 0.10 wt. % producing the lowest recovery. With increasing concentrations, the fluids’ stability was also seen to decline, implying that the decline in recovery can be attributed to the instability of nanofluids and a shift in mechanisms from chemical to mechanical plugging.
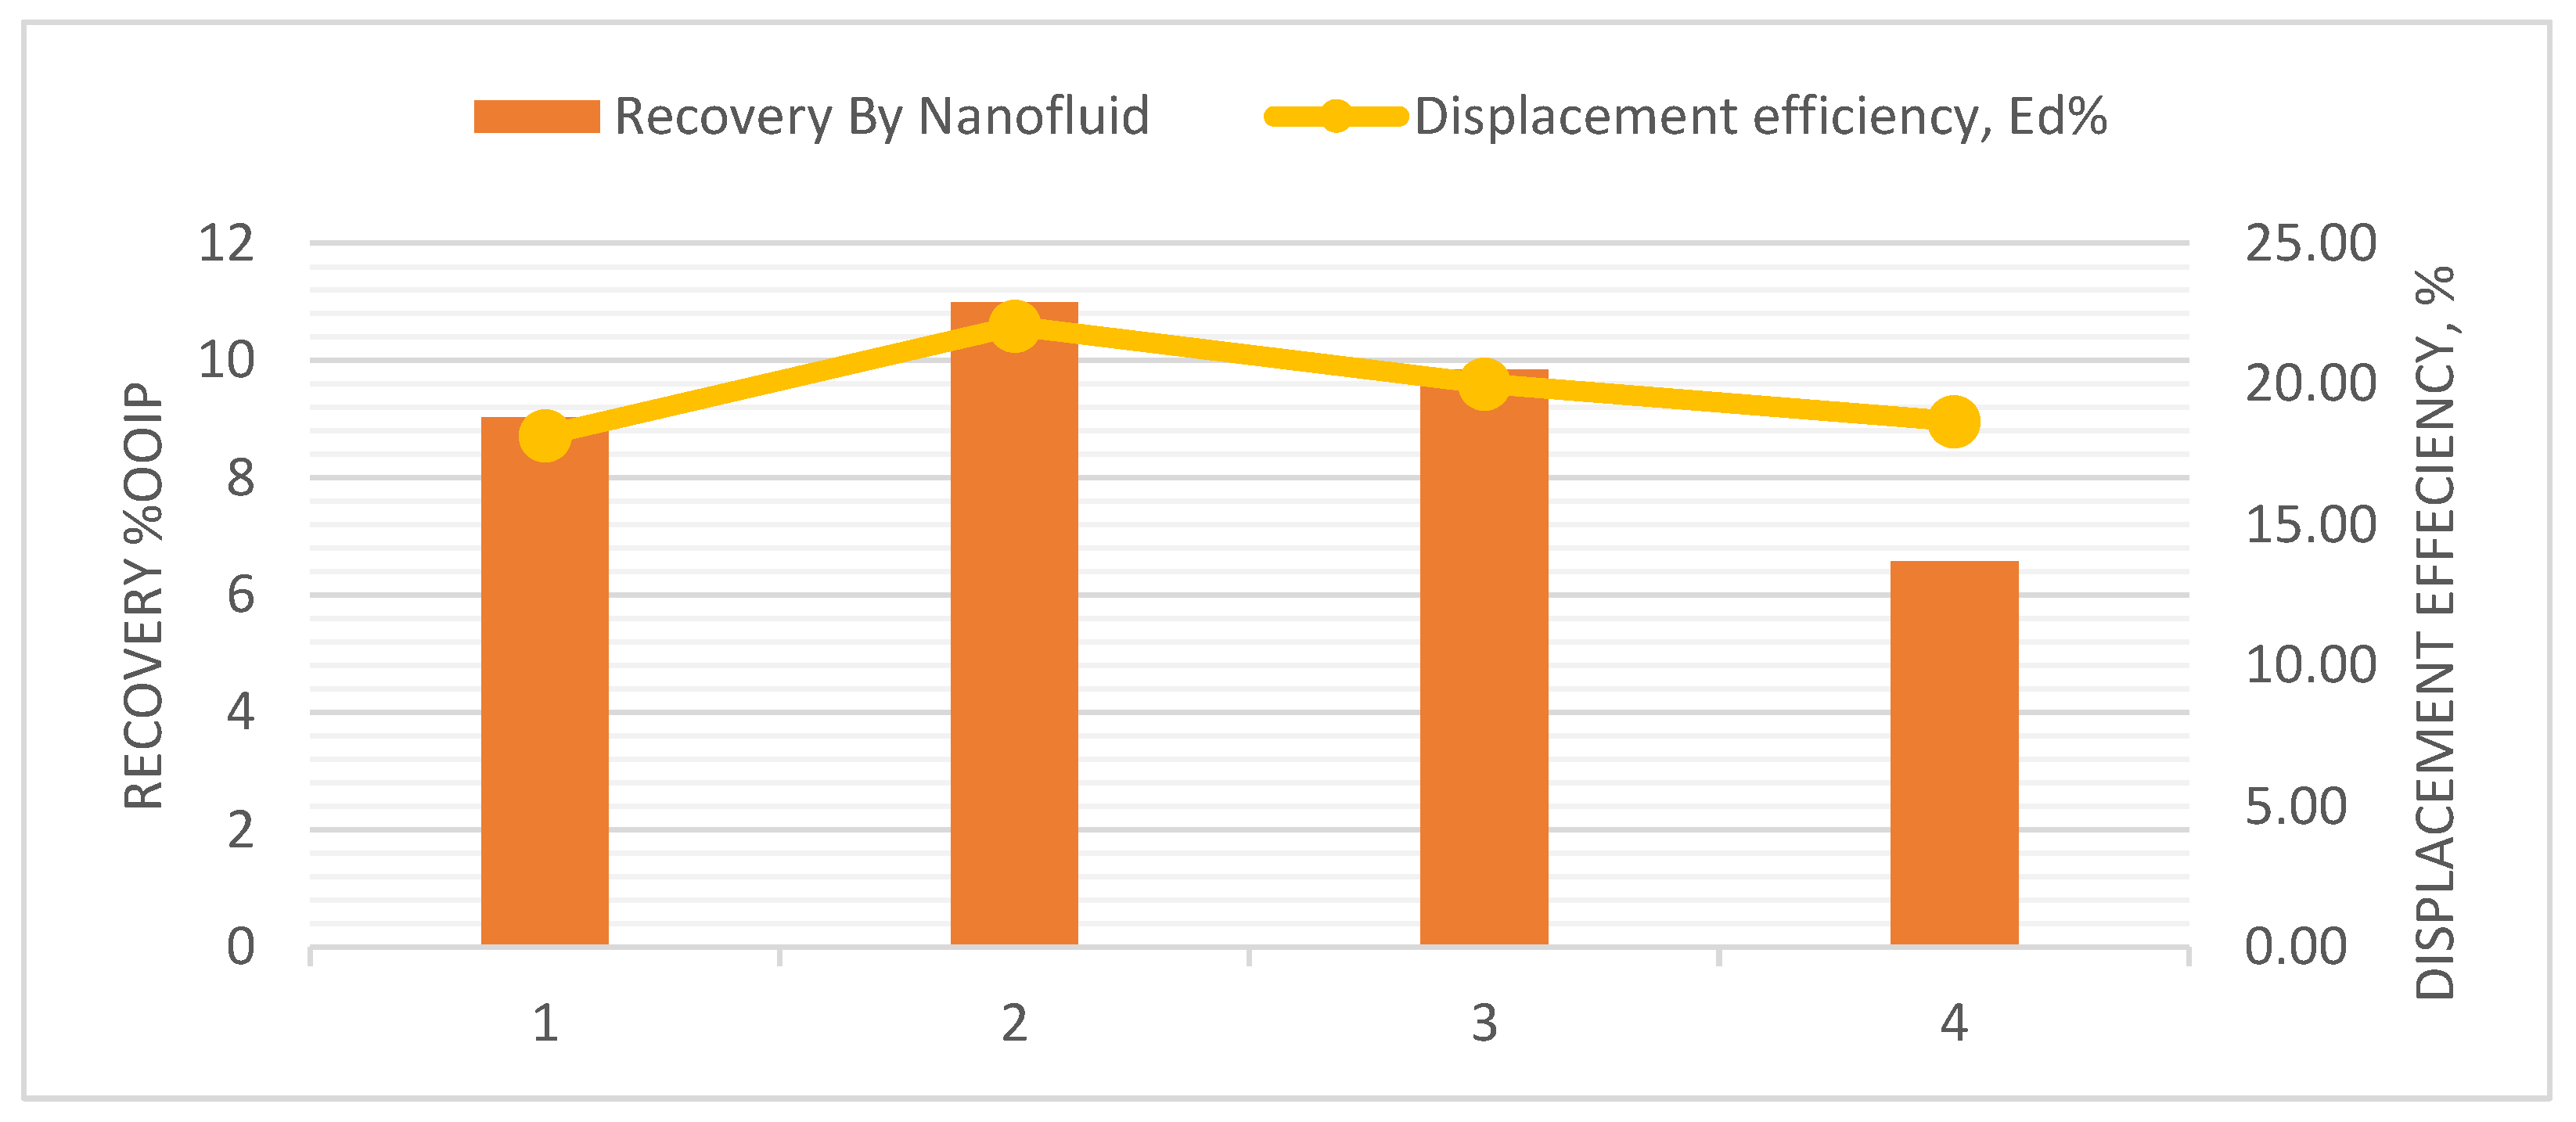
The results from core flooding imply that the highest recovery potential was achieved by flooding with 0.05 wt. % as the displacement efficiency and incremental recovery by nano flooding was highest in this case. On the basis of incremental recovery and displacement efficiency, it is implied that the recovery trend was seen rising when nanoparticle concentration was increased from 0.02 wt. % to 0.05 wt. %, whereas when the concentration was increased further, it impacted negatively on the recovery potential of the nanofluid, as shown in
Figure 7 below. The highest incremental recovery and displacement efficiency was achieved when 0.05 wt. % nanoparticles were implied. Whereas a further increase in concentrations (i.e., case 3 and case 4) reduced the incremental recovery, and displacement efficiency was decreased likewise.
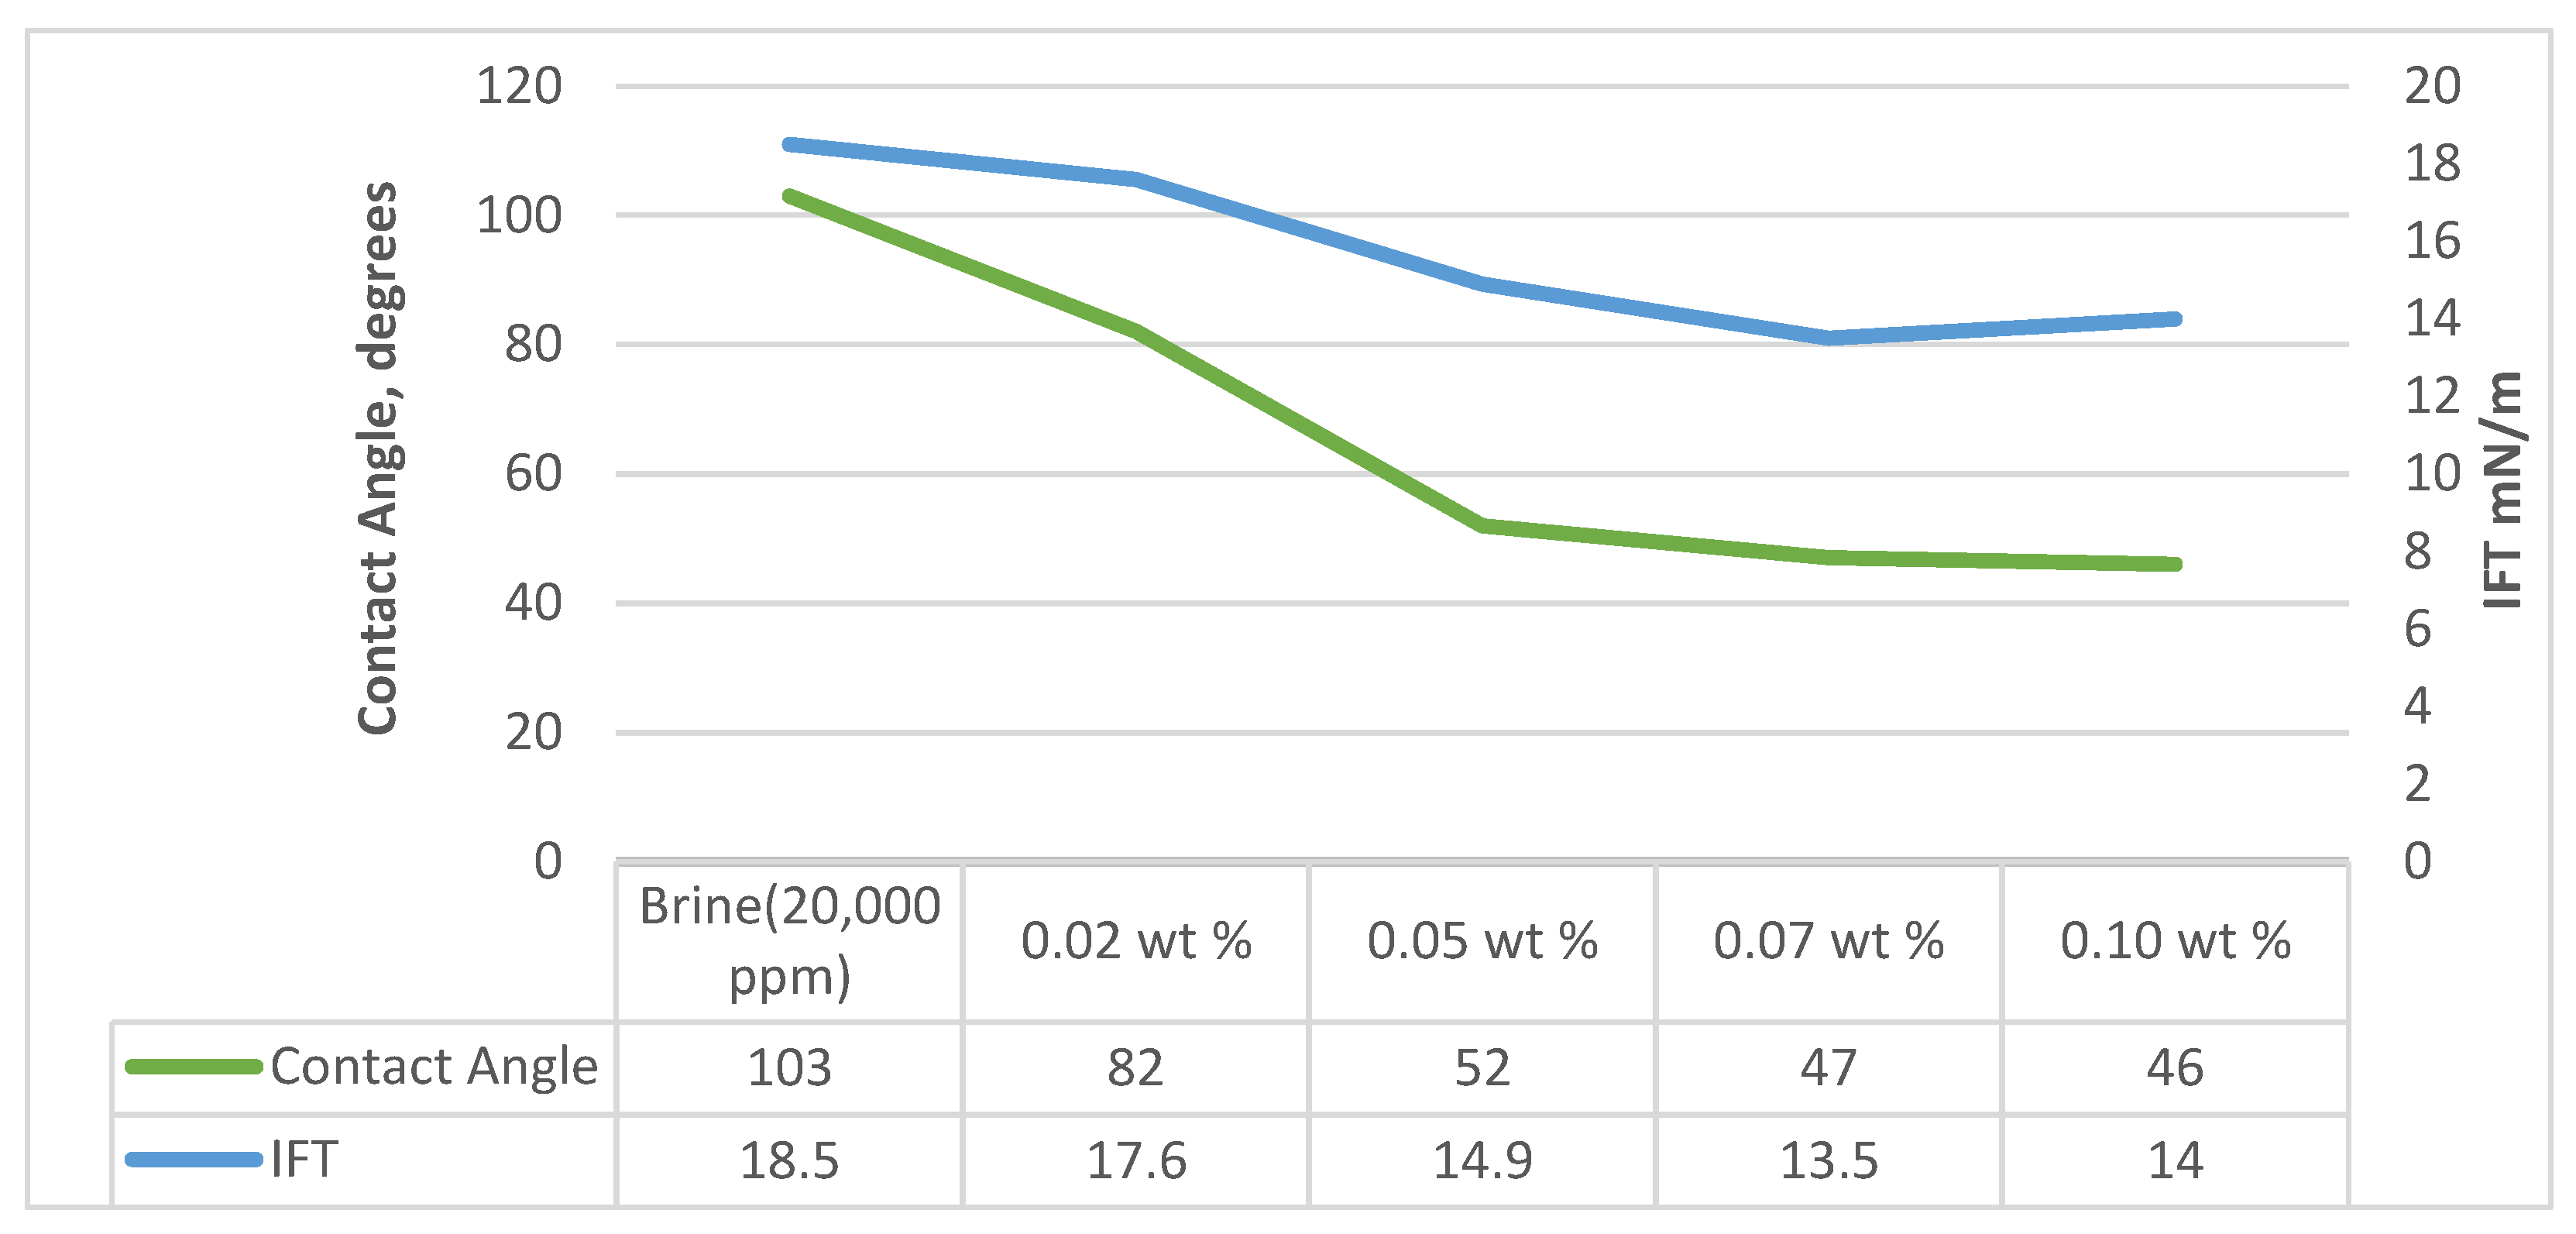
The changes in IFT and contact angle due to concentration changes in the nanofluids are summarized in
Figure 8. As can be seen in the figure below, a rise in nanomaterial concentration in nanofluids causes contact angle reduction and IFT alterations. When the fluid was changed from brine to 0.02 wt. % nanofluid, the contact angle was reduced to 82 degrees. The greatest reduction in contact angle was measured when the concentration was adjusted to 0.05 wt. %; the angle was 52 degrees. This rise is due to disjoining mechanisms caused by wedge structured impact on fluid and rock vertices. The contact angle between the oil and the rock is reduced due to the smaller size of nanomaterials and the disjoining mechanism, as shown in
Figure 1. A concentration increase of more than 0.05 wt. % had no influence on contact angle changes. In the case of IFT, the behavior was similar to contact angle changes for the first two concentrations, although substantial changes were still detected at the third concentration of 0.07 wt. %, and IFT began to climb again for 0.10 wt. %. Alterations in the IFT and contact angle indicate mechanism changes, which can be related to each nanofluid application’s subsequent recovery profile.
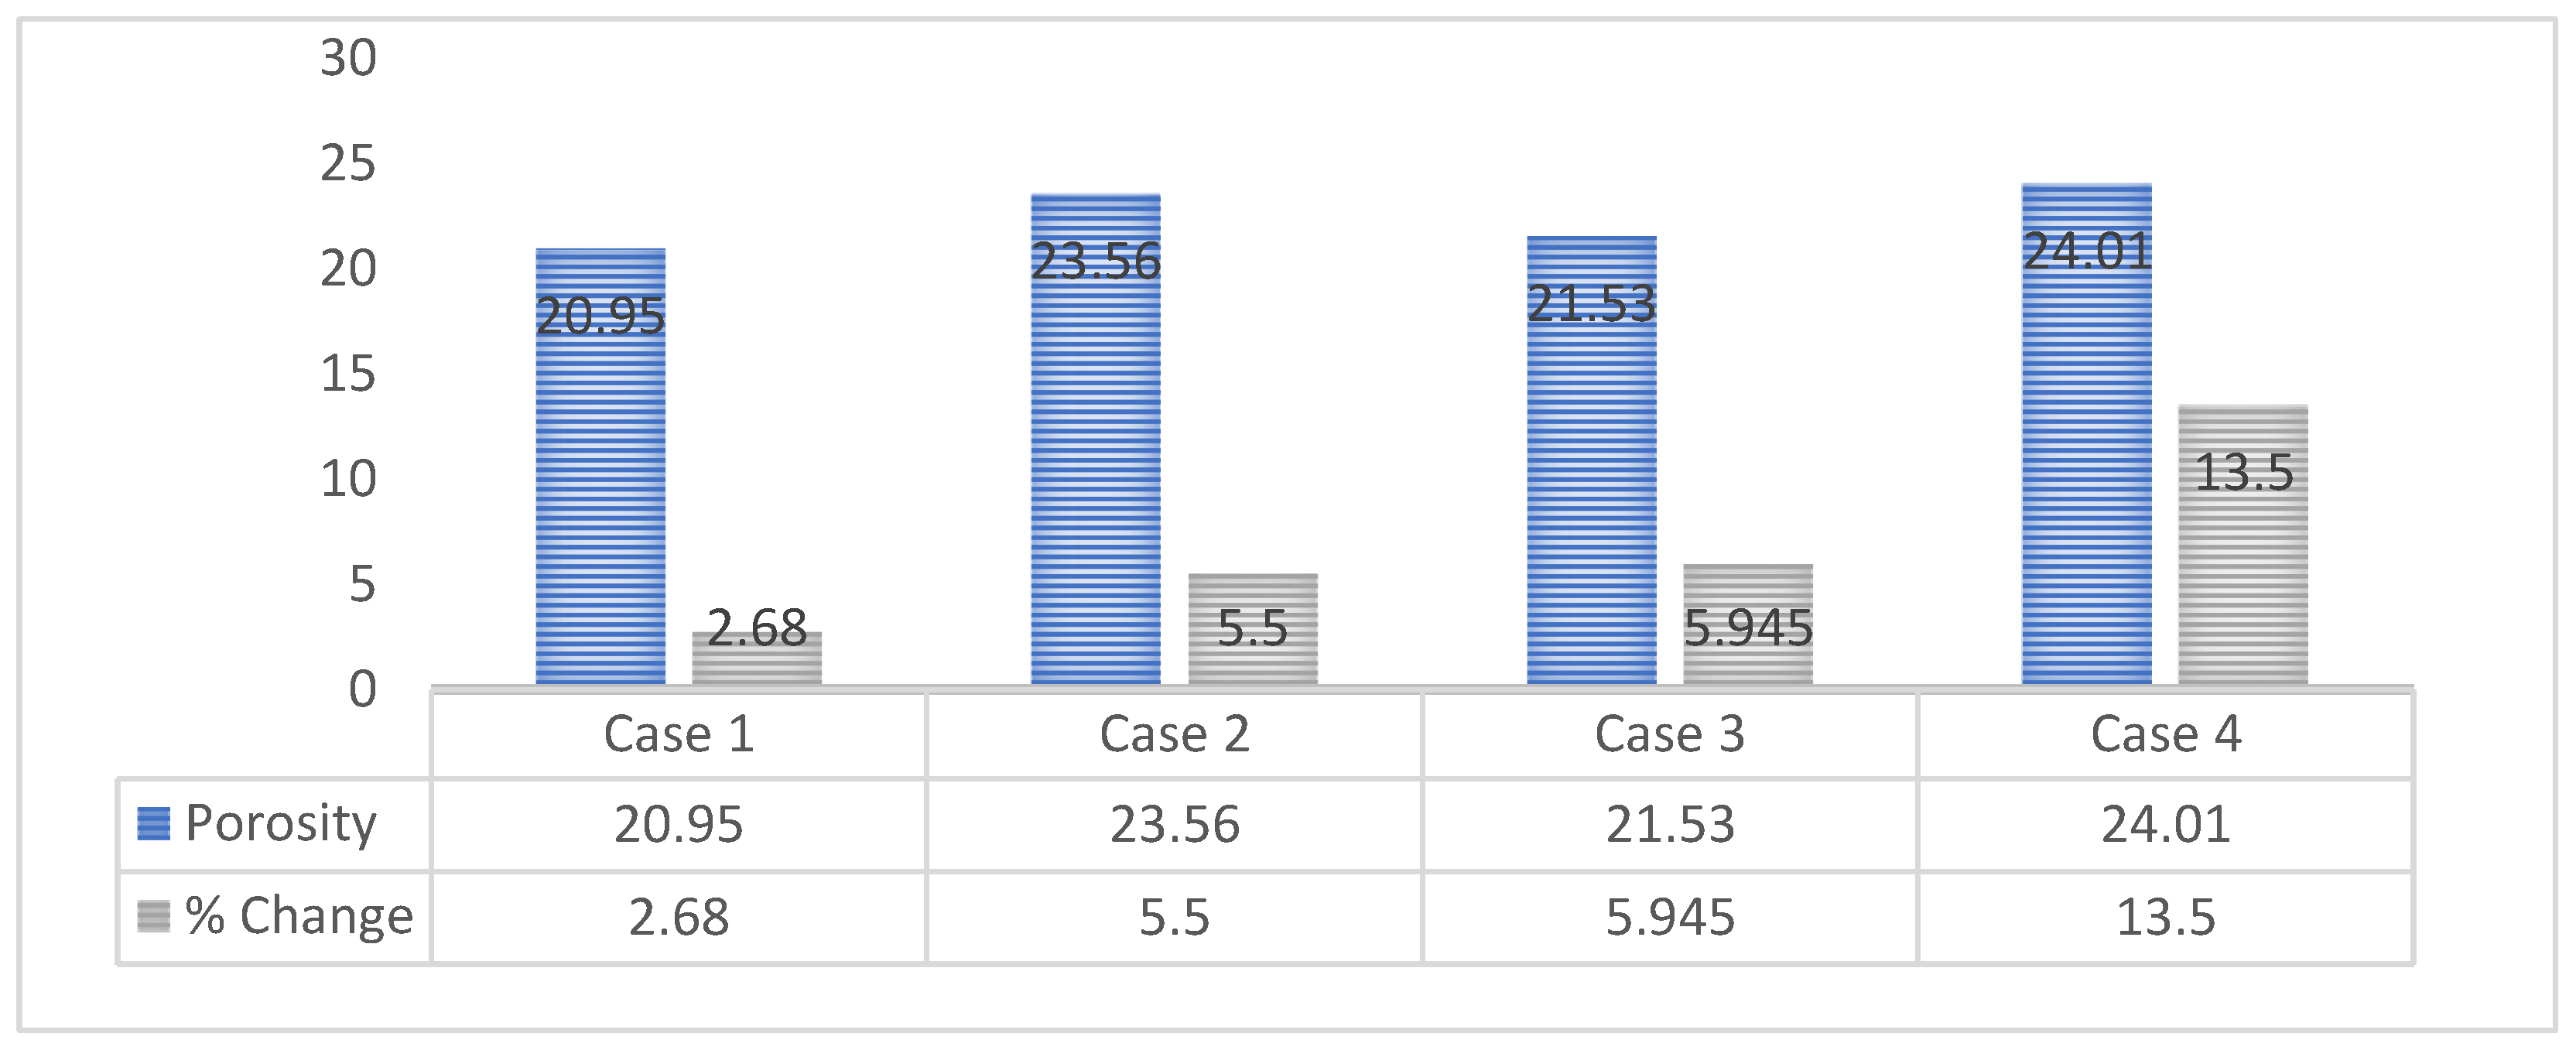
Porosity measurements were carried out using helium porosimeter post nano flooding;
Figure 9 shows the changes in porosity due to retention of nanomaterials in cores. The lowest reduction in porosity was recorded for 0.02 wt. % nanofluid, whereas the reduction was approximately similar for 0.05 wt. % and 0.07 wt. % fluids, which was around 5.5–6%. The major reduction in porosity was measured for 0.10 wt. % concentration nanofluid which indicates higher concentrations result in more unstable fluids and agglomeration tends to plug the pores and absorb on rock surfaces.
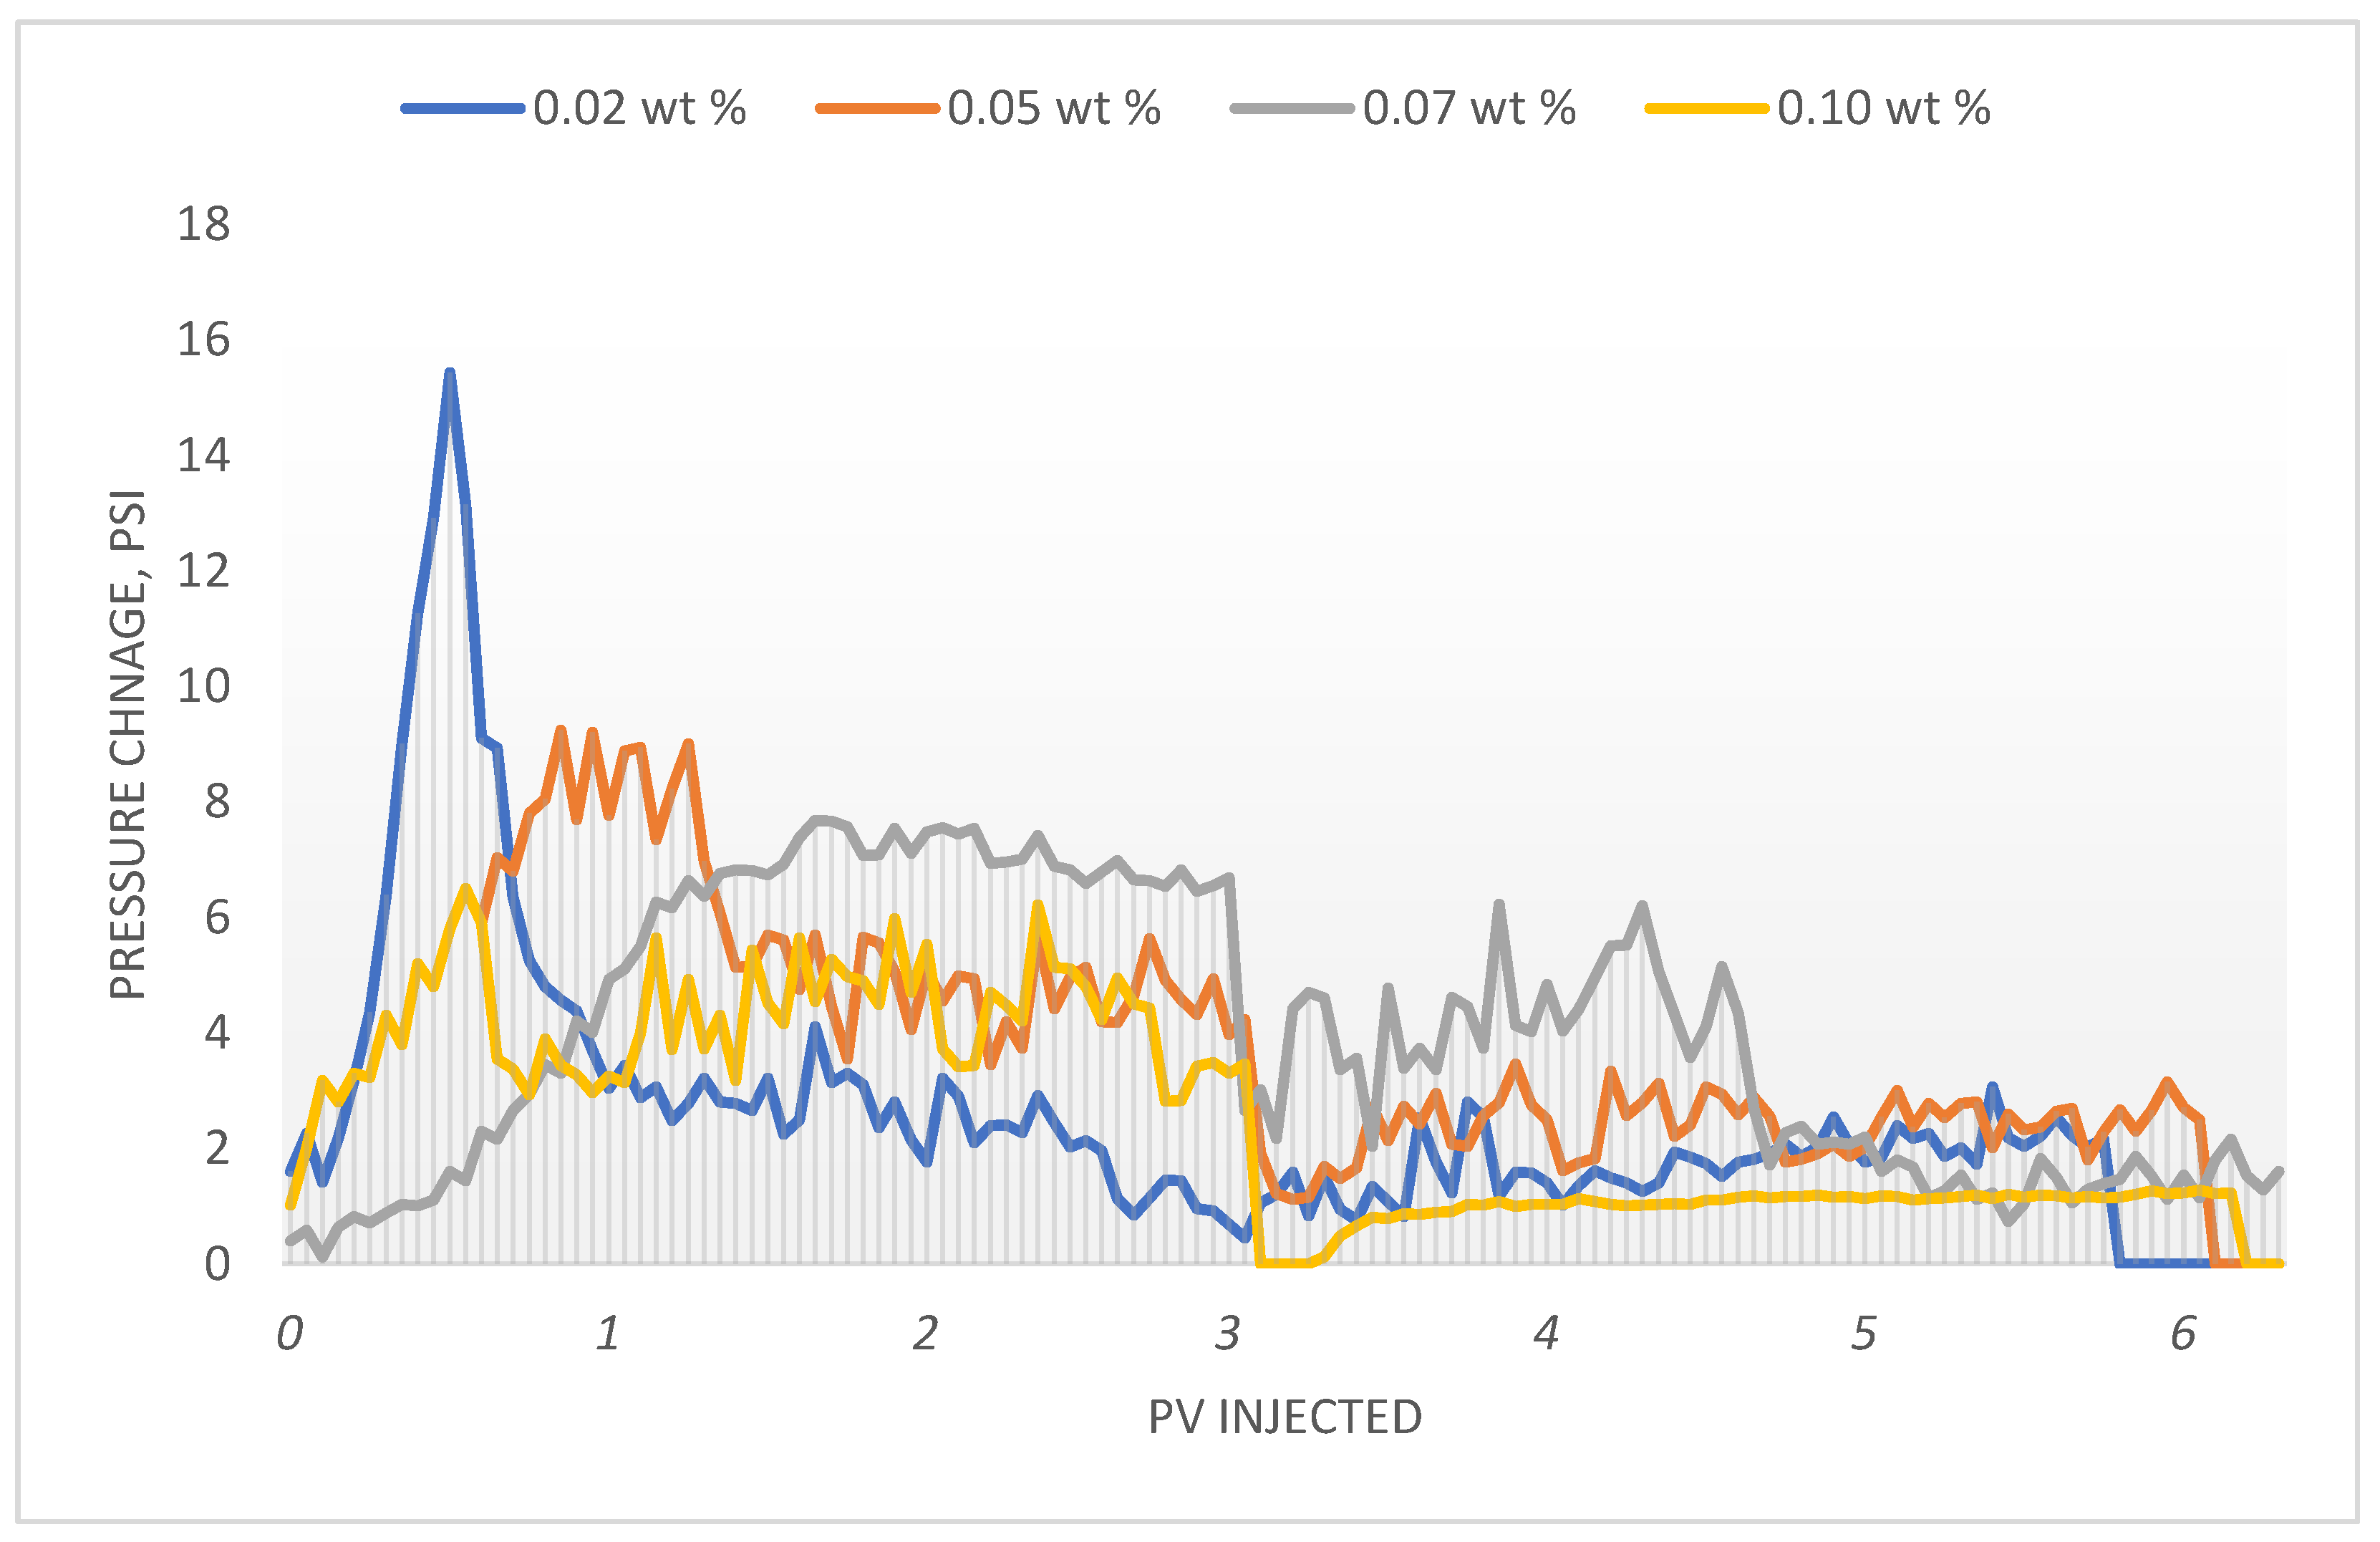
The pressure difference between the core inlet and outlet was measured, and the data was obtained from the EOR-Flooding system’s computer. The pressure remained low throughout the nano flooding, as can be seen in
Figure 10, indicating no or low retention. Whereas for 0.07 wt. %, it began to rise at the beginning and then followed a similar trajectory to that of lower concentrations after injection of approximately 1.5 PV, indicating log jamming at the beginning and then gradually declining after production from clogged pores was achieved. In the case of 0.1 wt. %, the pressure differential remained lower, indicating rapid clogging of pores at entry due to very unstable particles and, therefore, many pores were not penetrated by the fluid, resulting in reduced recovery and increased porosity reduction. The lower pressure differential for 0.02 and 0.05 wt. % indicated reduced retention, which was supported by the lower porosity reduction in both cases. In the case of 0.07 wt. %, the porosity reduction was significant, and the increase in pressure for the first 2 PV suggests log jamming and pore-throat blockage, however after oil recovery was ceased, the pressure differential also declined. The reduced pressure of 0.1 wt. % is unexplainable and does not correspond to a reduction in porosity. The lower recovery, on the other hand, suggests that the clogged pores were left untapped. The reduction could be due to bigger particles settling in the first few pores, whereas the rest of the pores were not affected by nanofluids.
3.2. Scenario 2: 0.05 wt. % at 30,000 ppm and 40,000 ppm
In the second scenario, the concentration was kept constant at 0.05 wt. %. In case 6, salinity was increased to 30,000 ppm, whereas it was increased to 40,000 ppm in case 7. The output of flooding and other evaluations in this scenario was compared with that of 0.05 wt. % nanofluid at 20,000 ppm from the previous scenario which was termed as case 5 for comparison in this scenario. The recovery and saturation data is given in
Table 4 below:
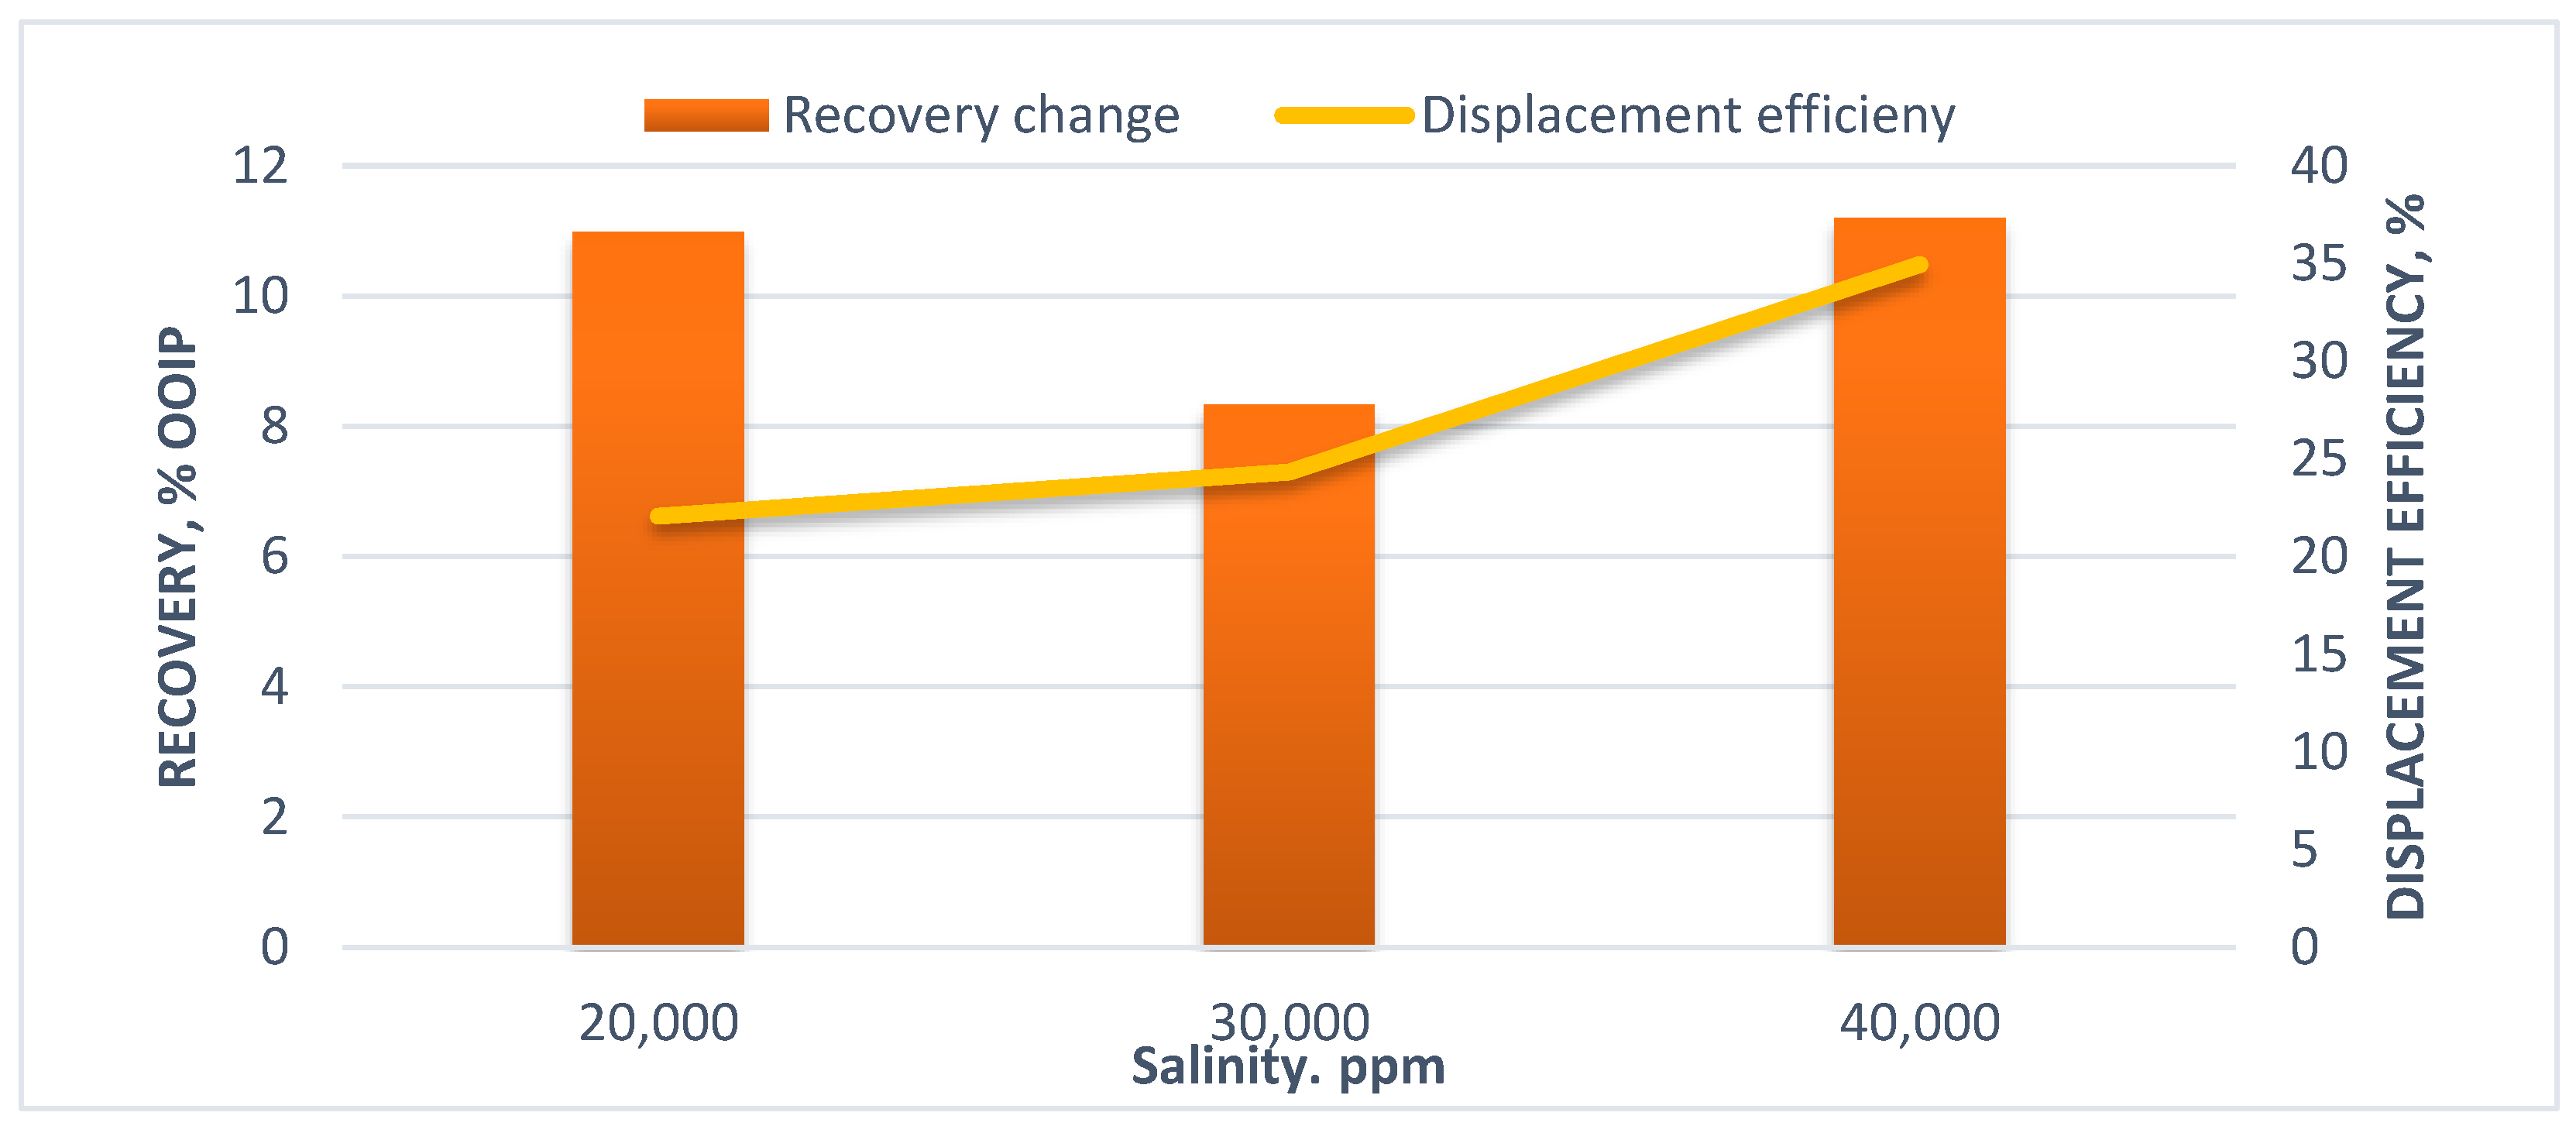
As may be determined, the case with the highest salinity had the highest displacement efficiency, indicating alterations in mechanisms and fluid impact. The recovery profiles of the above instances are compared in
Figure 11. When salinities were increased, nanofluids were still able to improve recoveries even more, demonstrating that they have a lot of potential for recovery improvement due to mechanical mechanisms.
When comparing incremental recovery profiles, it was discovered that when salinities were increased, the incremental recovery profile displayed an interesting tendency. When salinities were increased to 30,000 ppm, incremental recovery by nano flooding was lowered. However when concentrations were increased even more, tertiary nanofluid flooding recorded the highest increment in oil recovery, as seen in
Figure 12 below:
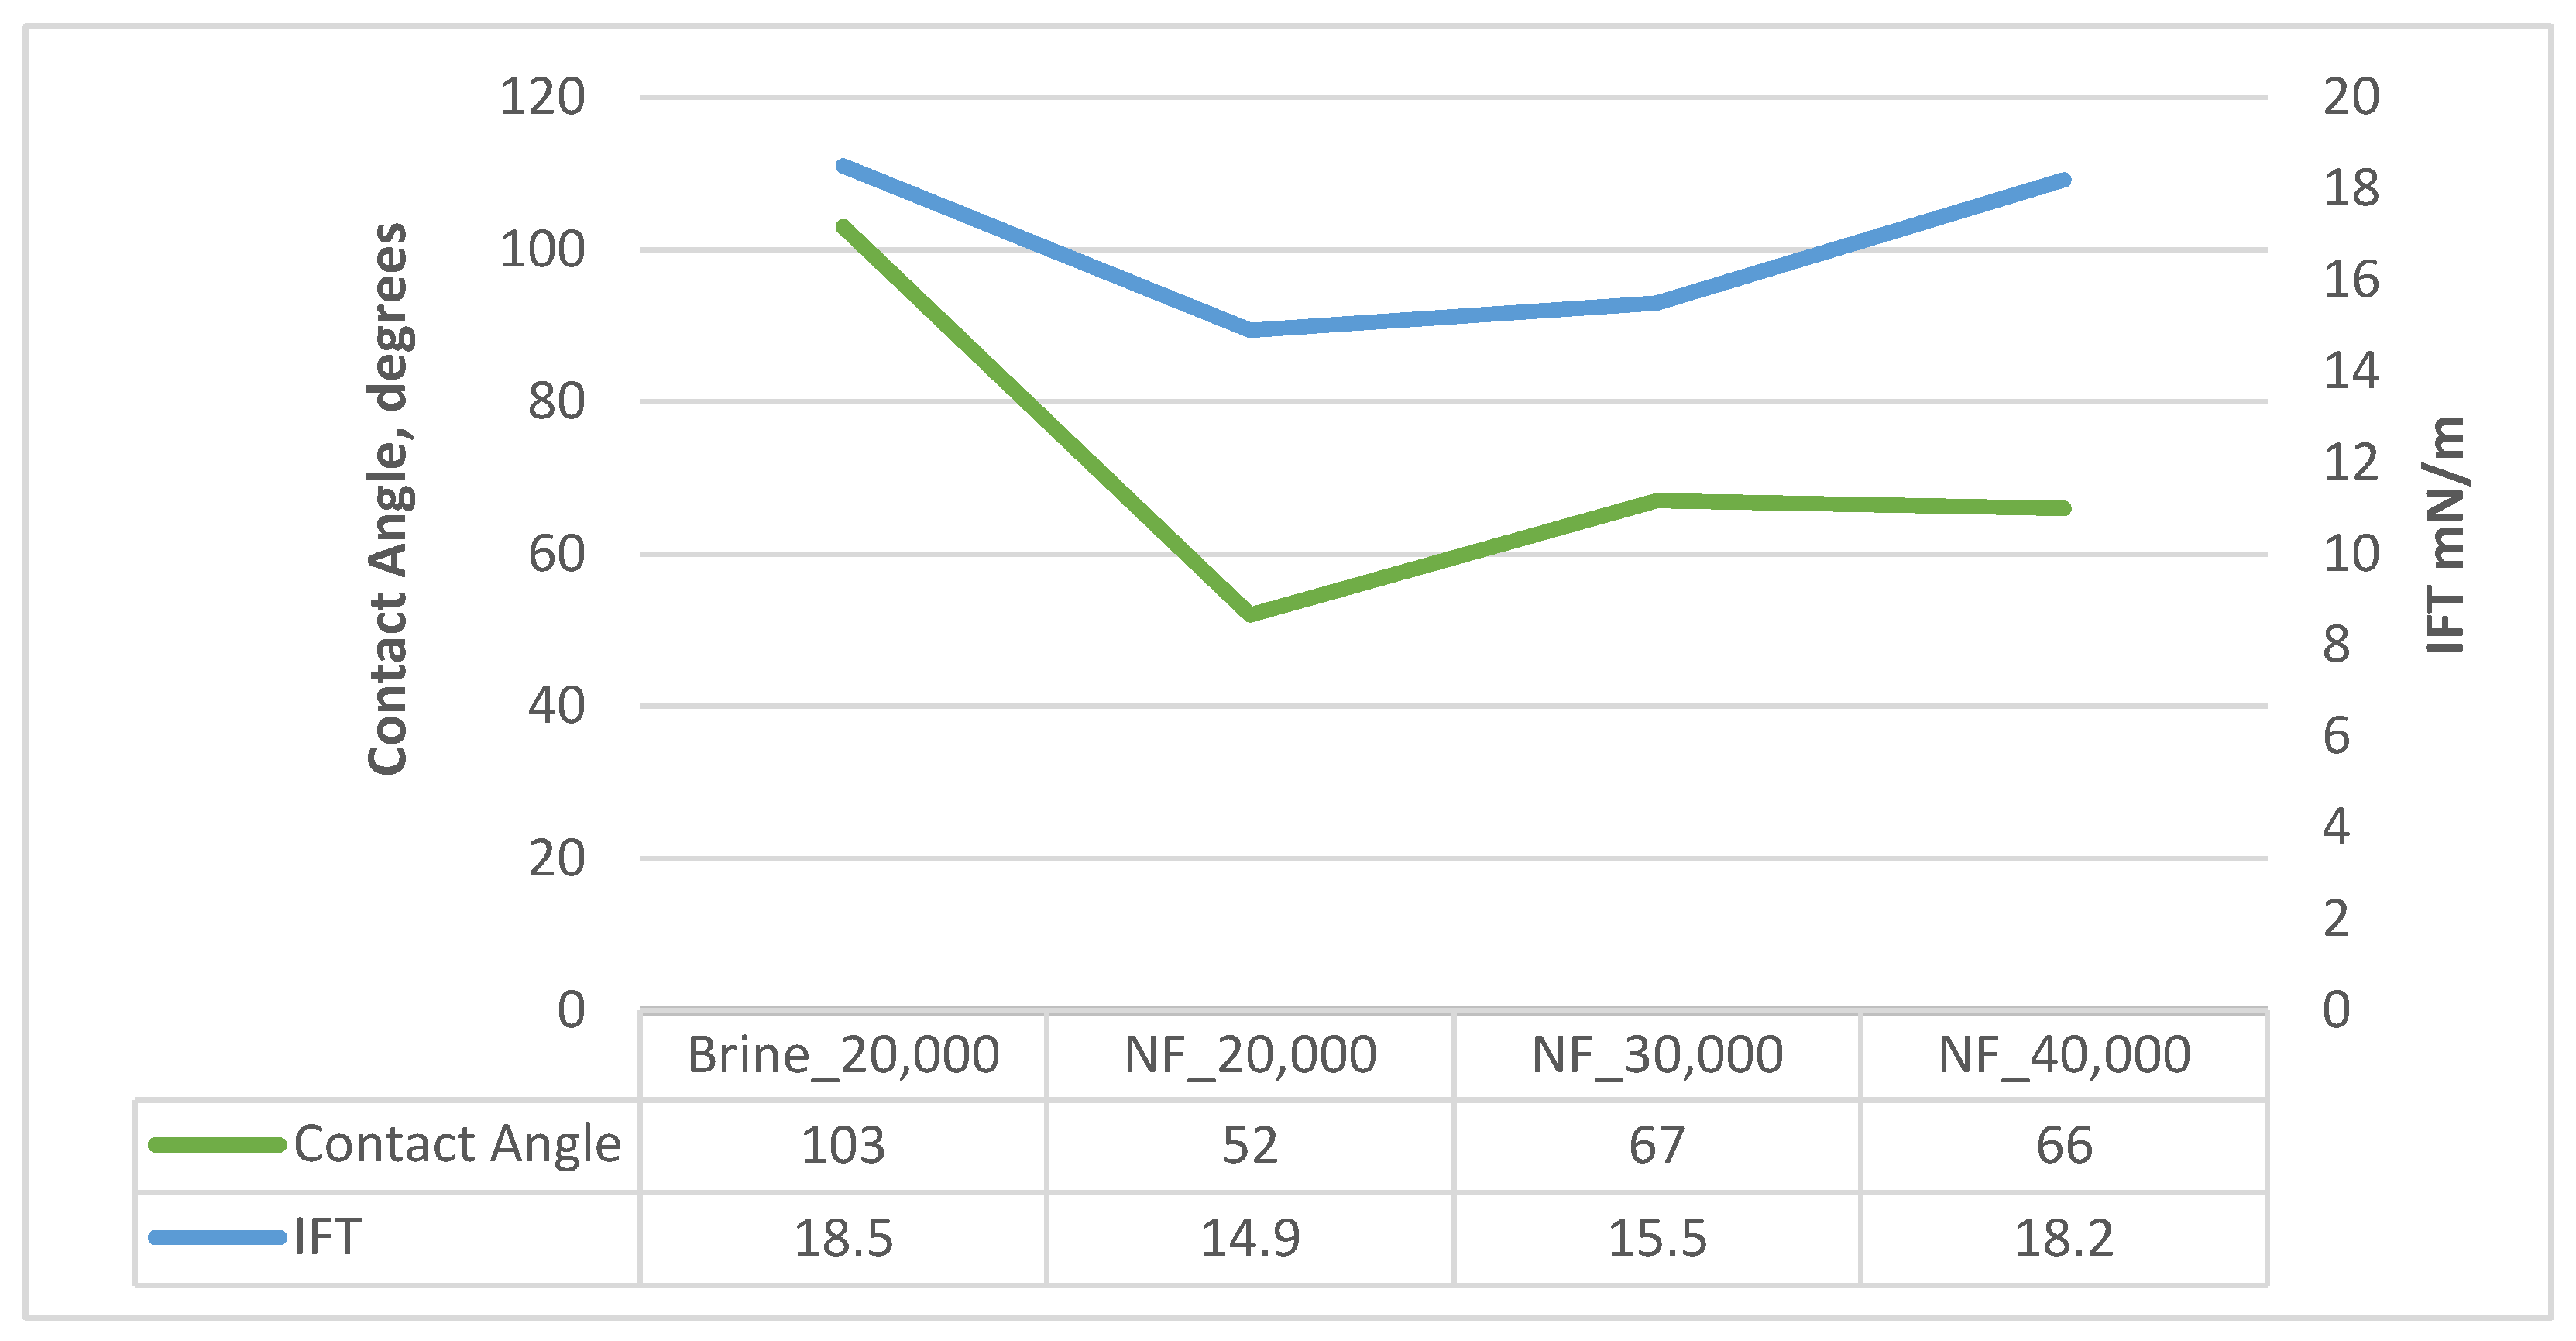
When salinity was increased for a concentration of 0.05 wt. %, the contact angle and IFT changes were impacted inversely to scenario 1. In the case of IFT, as the salinity was increased IFT also increased. Whereas in the case of contact angle, the angle was increased from 52 to 66–67 degrees when salinity was increased, which indicates the mechanism might have shifted from IFT reduction and wettability change to another dominant mechanism. The trend can be seen in
Figure 13.
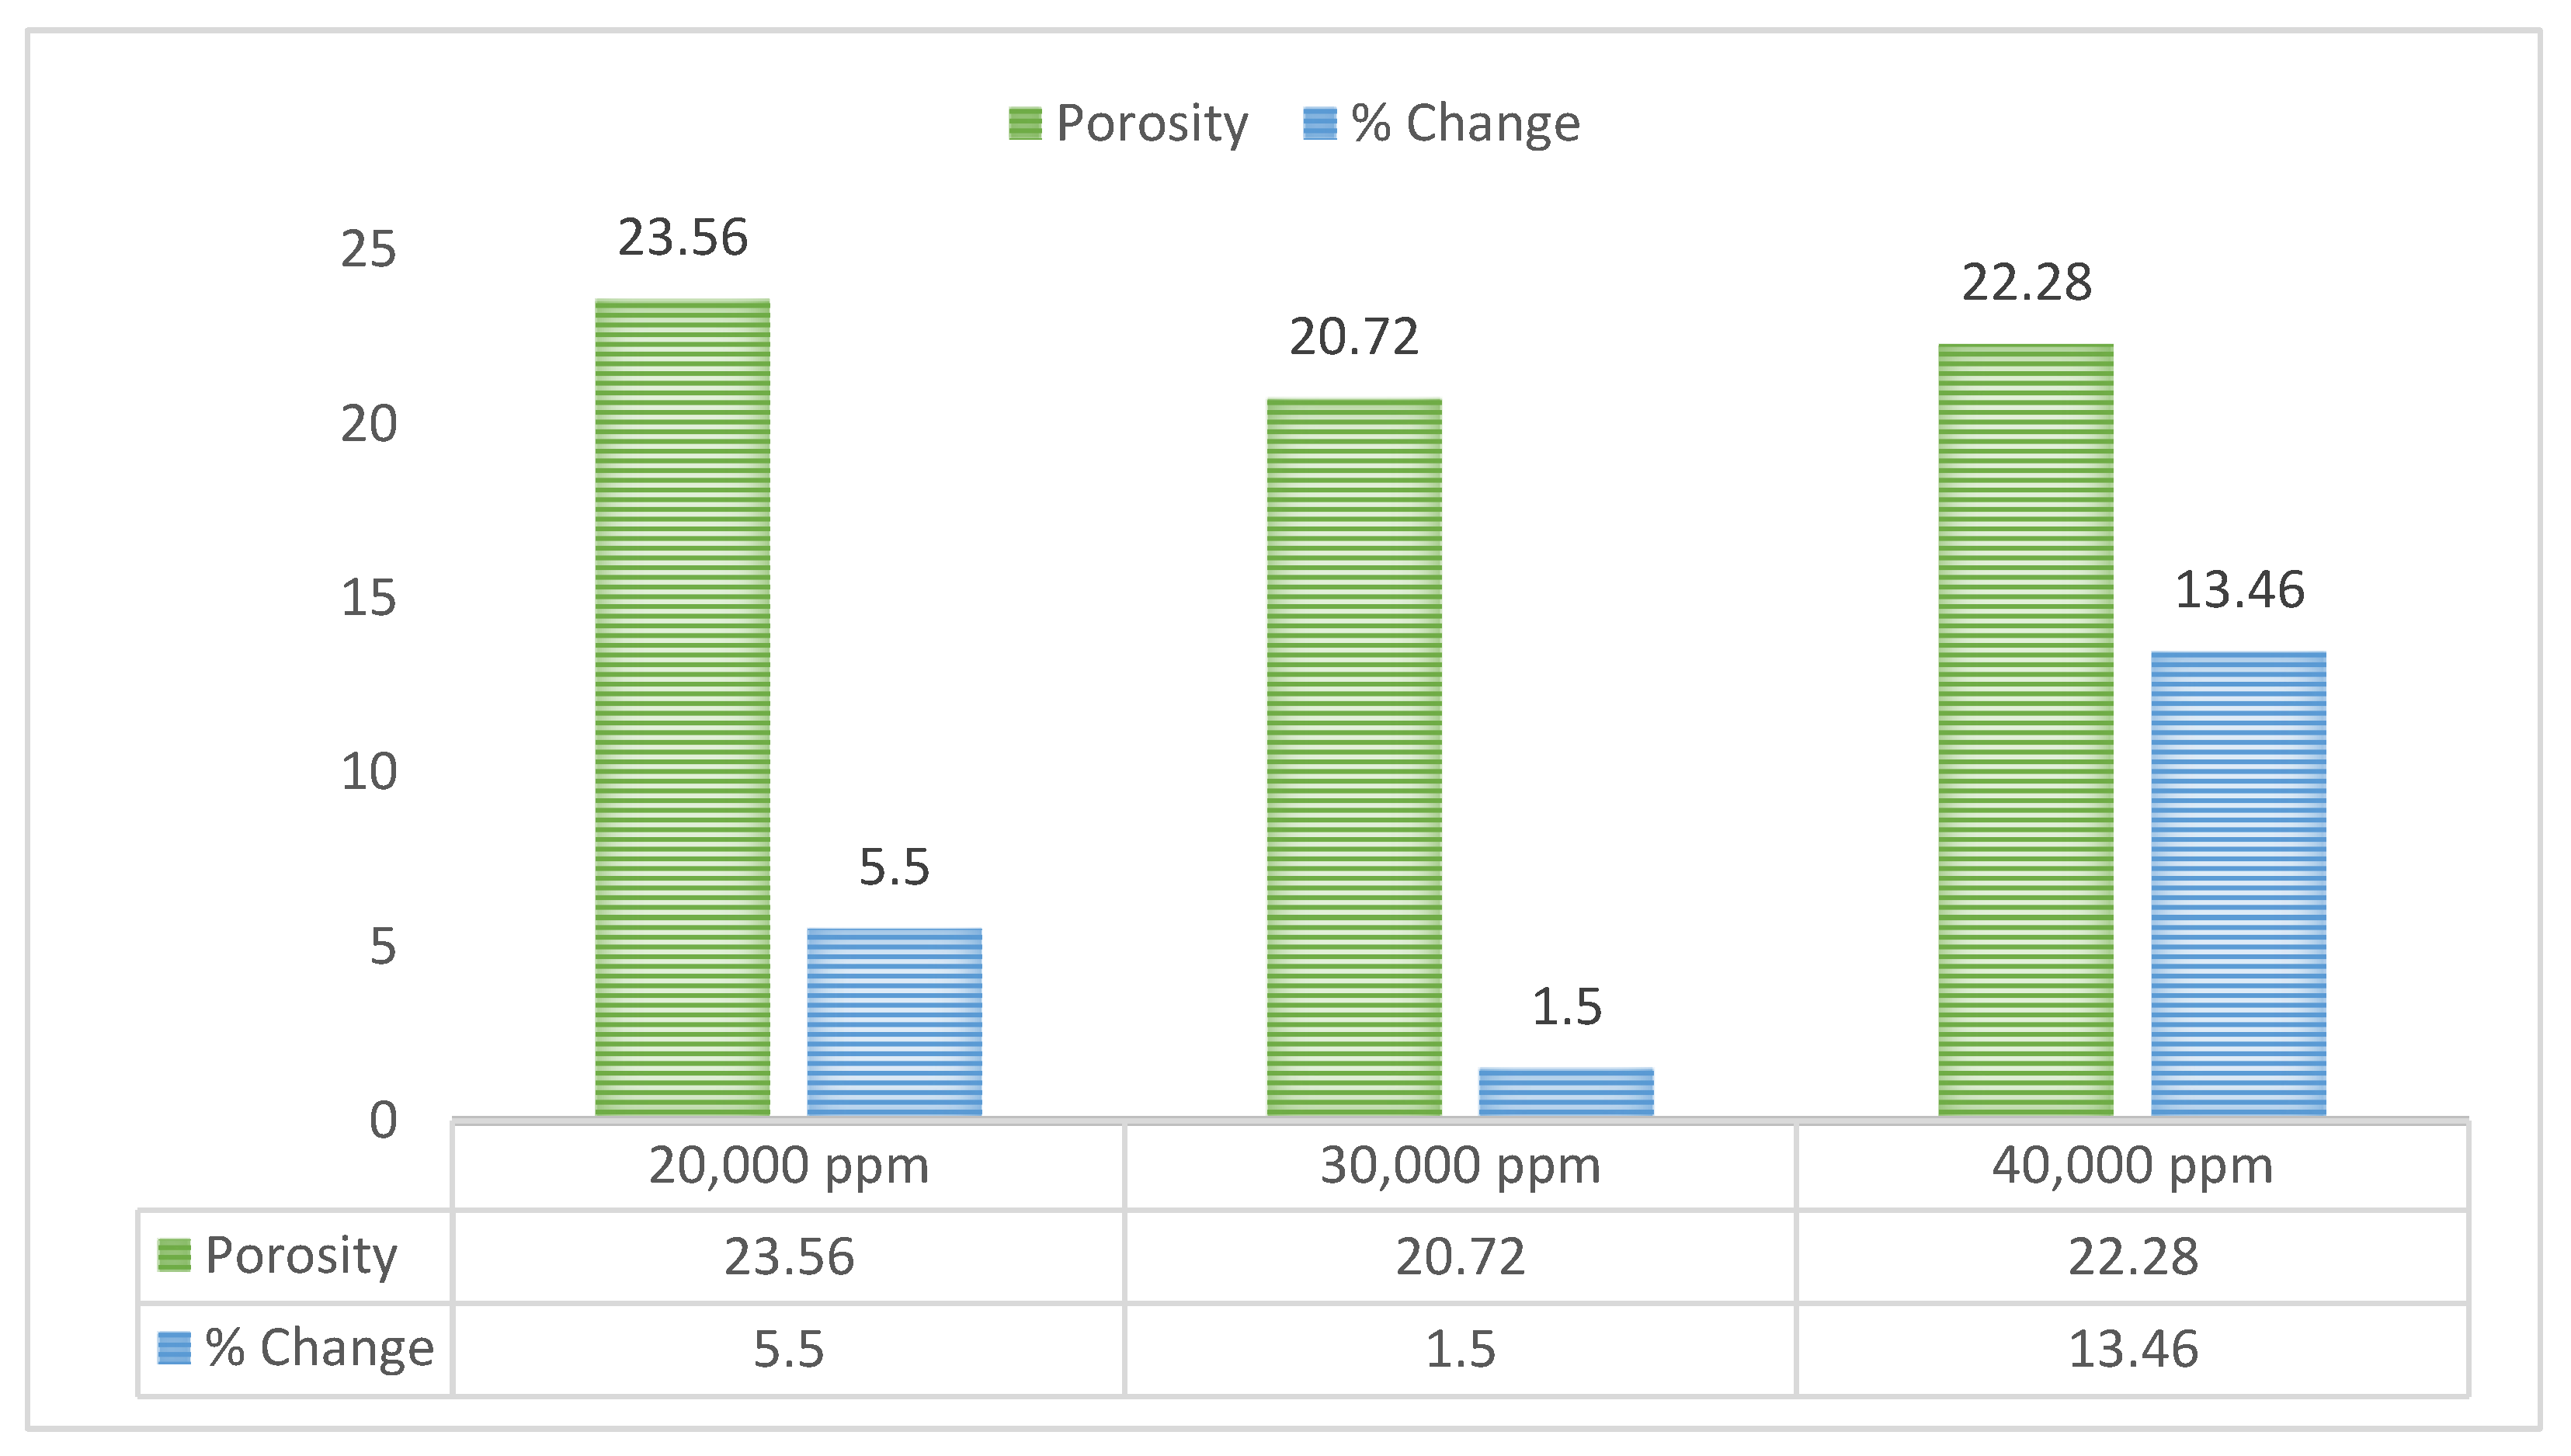
When porosities were measured for this scenario, again a two-fold relation between salinity and retention was observed as seen in
Figure 14. When salinity was increased to 30,000 ppm, the reduction in porosity was much lower than the case at 20,000 ppm, whereas when the salinity was increased to 40,000 ppm, the reduction was highest among all cases, indicating the highest retention in this case.
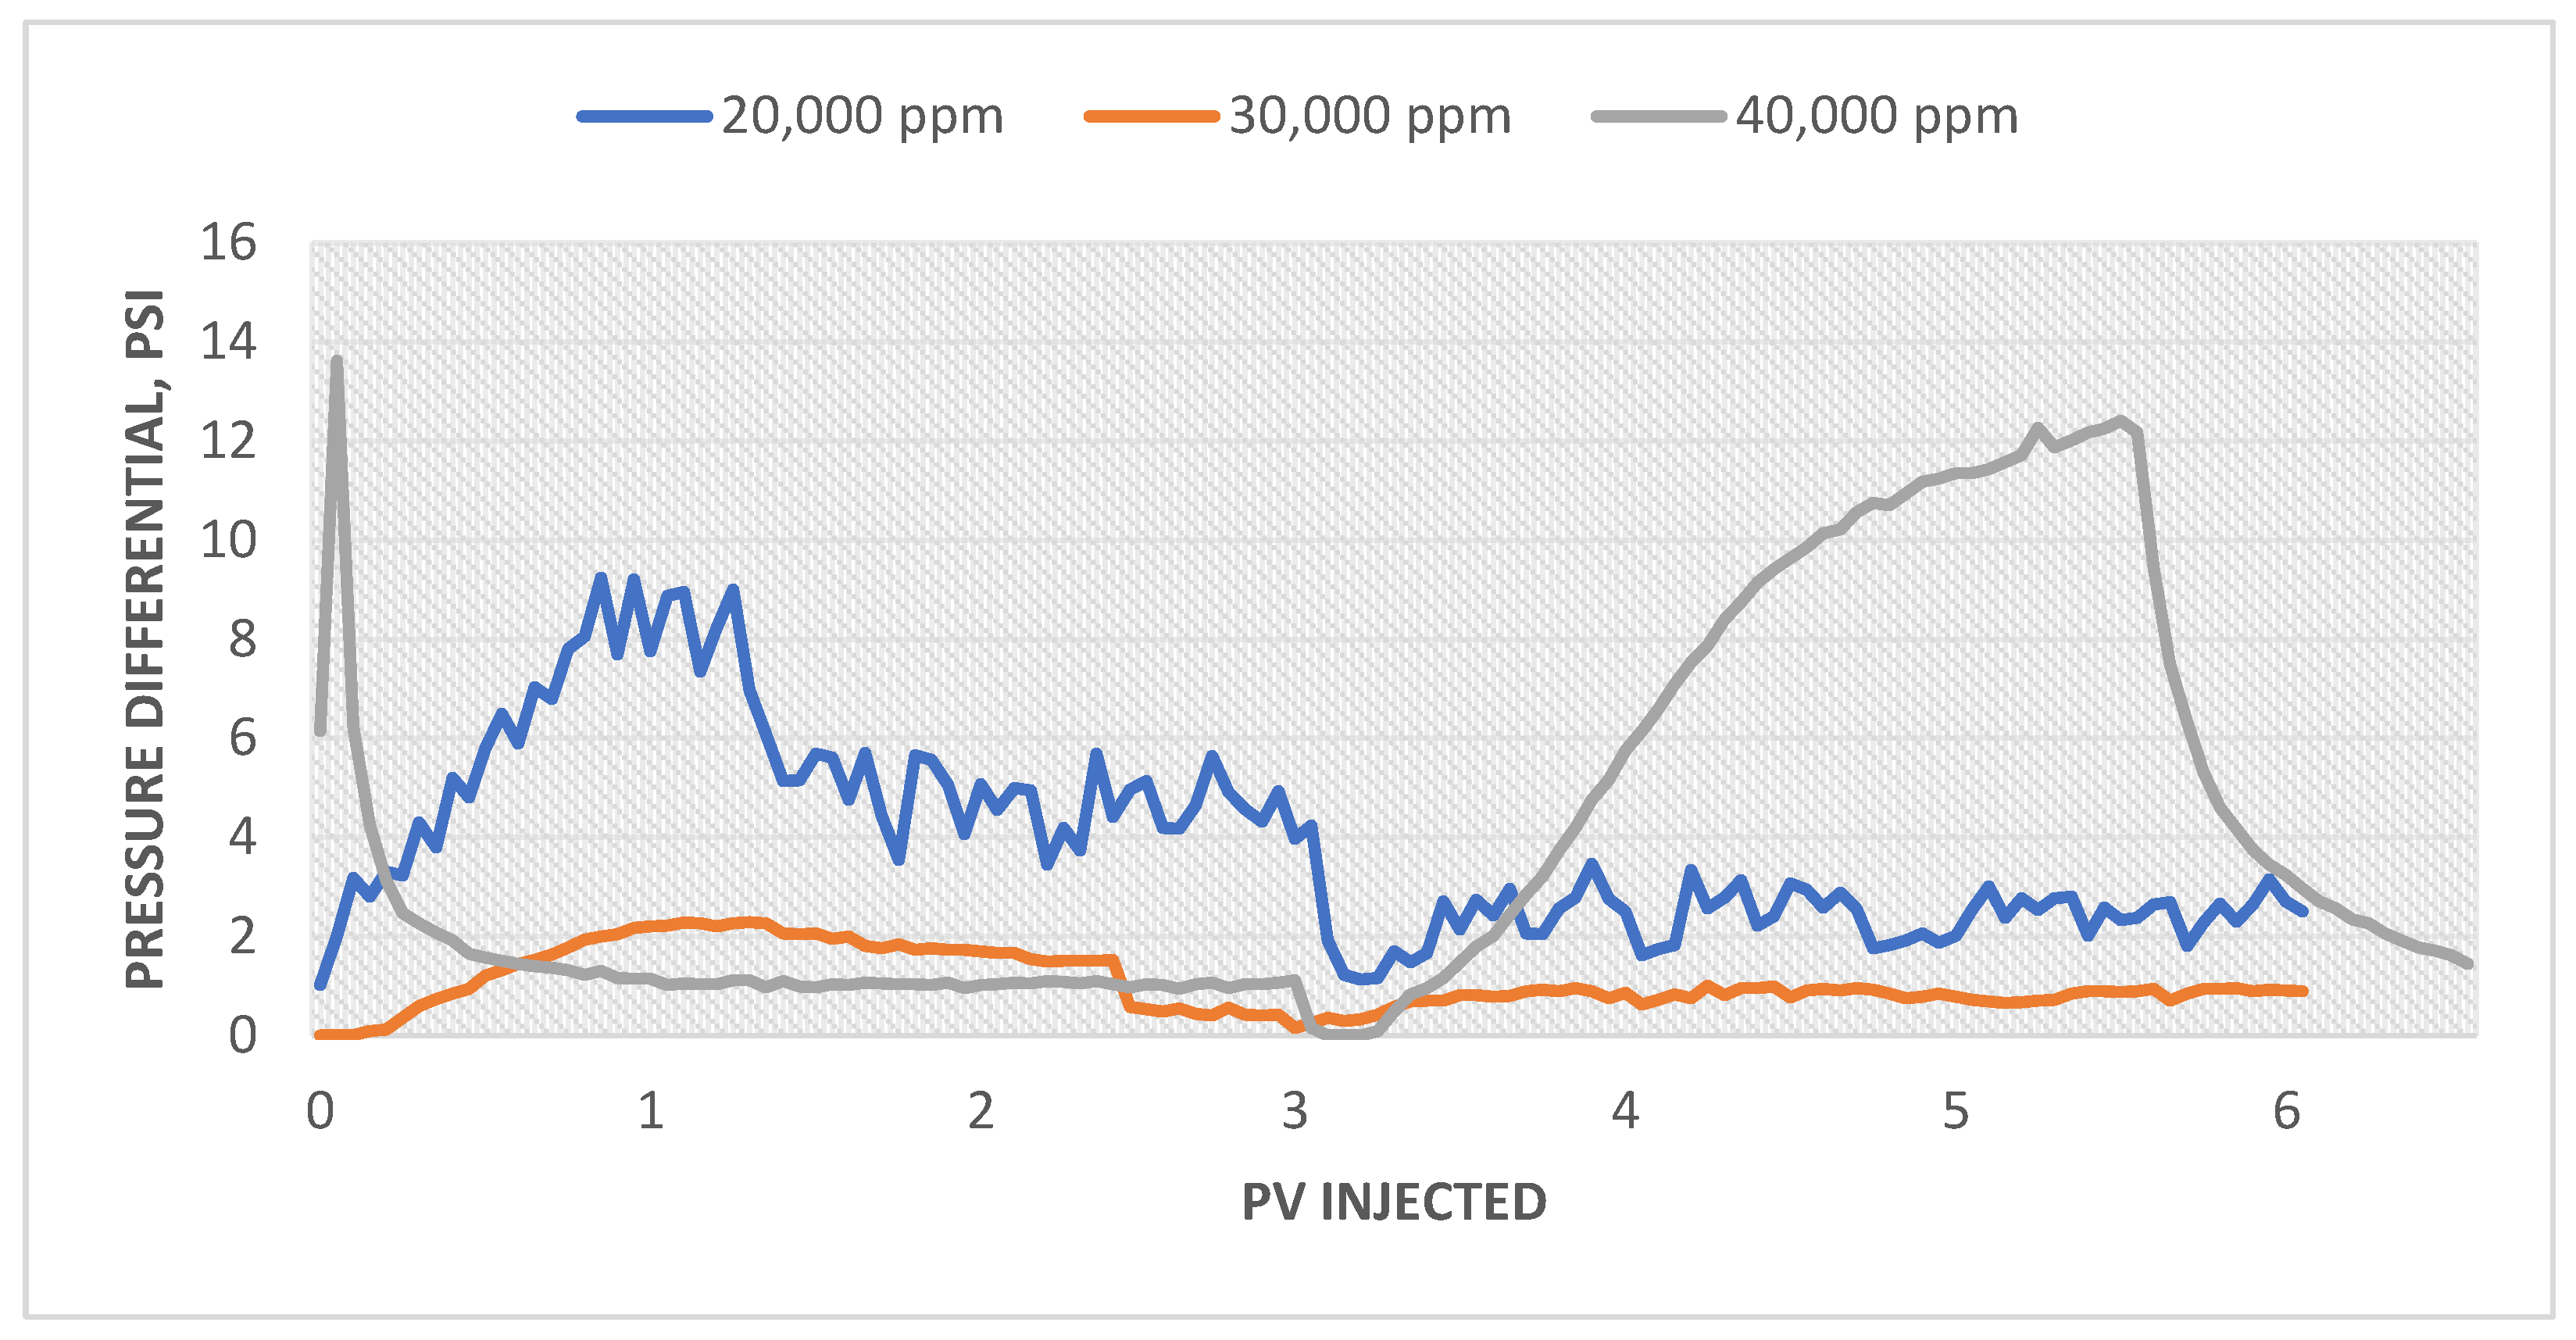
Figure 15 shows the pressure differential profile for increasing salinities at 0.05 wt. %. At 2000 ppm salinity, lower retention occurred because the differential pressure remained lower, and the velocity difference between the solvent and nanomaterial must have been negligible. In the case of 30,000 ppm salinity, retention was reduced, most likely due to clogging of the pores at the entrance and bypassing most pores, resulting in lower recovery and retention in the core. The intake of the core was discovered to have residue of nanomaterials at the front after flooding. The pressure differential increased linearly until 1PV was injected in the third case, resulting in higher oil production. When production started to fall, the injection rate was increased to 5 mL/min, which resulted in a higher differential but no improvement in recovery. This case displayed maximum retention due to agglomerations and material drop at higher injection rates, as well as significant velocity differences due to pre-throat plugging and log jamming, between the solvent and the nanoparticles.
4. Discussion
4.1. Recovery Potential
In published studies, silica nanofluids were demonstrated as an effective tertiary recovery strategy, and they were also shown to boost recoveries dramatically. This study was able to discover two distinct patterns and their implications on recoveries and processes by using an integrated strategy that comprised concentration, salinity, and stability. All the concentrations promoted recovery; however, recovery began to decline at lower salinity when concentrations were increased beyond 0.05 wt. %. The recovery was reduced at 30,000 ppm but enhanced at 40,000 ppm salinity when the salinity was increased at 0.05 wt. % nanoparticles, which could be due to a short-term influence from flow route constraints induced by the aggregation of the nanomaterial in the fluid. Increased recovery despite lesser aid from the contact angle and IFT mechanisms in the case of 40,000 ppm, one of the most unstable fluids as evidenced by reduction in porosities, indicate log jamming and mechanical entrapment as a key mechanism.
4.2. Recovery Mechanisms
The most typical recovery methods during the application of silica nanofluid flooding were contact angle adjustments to water-wet, interfacial tension reductions, and log jamming, or mechanical entrapment. At concentrations of 0.02 wt. %, contact angle reduction and interfacial tension reduction appear to affect recovery. However, a lower reduction in porosity implies the lack of log jamming or mechanical entrapment of nanoparticles. When the concentration was increased to 0.05 wt. percent, the contact angle was reduced the most, indicating wettability change as the most dominant mechanism, while the IFT was also reduced, indicating a reduction in tension between the liquids, which also served as an important mechanism in enhancing recoveries. Porosity reduction was also found, indicating the presence of a less apparent but significant log jamming mechanism.
There was a decrease in recovery when the concentrations were increased even higher, which was accompanied by changes in contact angle and IFT. This means that as concentrations were increased, wettability and IFT changes were not able to keep up, resulting in the formation of more unstable fluids. Even while the changes in contact angle and IFT were identical in both situations, 0.07 wt. % was able to significantly enhance recovery, but 0.10 wt. % nanofluids recovery was only 6.58%, showing that log jamming, and pore throat plugging are more prominent when stability is compromised.
In the case of salinity changes, the recoveries decreased as the salinity increased. As seen in
Figure 13, the fundamental reason for the reduced recovery is that stability is quickly compromised, which has a negative impact on contact angle and IFT. At 40,000 ppm, on the other hand, the solution became extremely unstable, as indicated by the fact that when nanofluids were synthesized, visible white particles emerged within hours, and the same was found in recovery samples collected. Pore plugging is considered the recovery mechanism in this case. The injected fluid may have freed oil in neighboring unclogged pores with higher pressure due to log jamming or mechanical entrapment, as evidenced by the largest reduction in porosity in this case.
4.3. Stability
Stability was recognized as one of the underlying key parameters that is influenced by a variety of factors. When the concentration was increased, the fluids appeared to lose their stability, which might explain the lower recovery at higher concentrations. Stability appears to influence contact angle and IFT variations. When the salinity was increased from 20,000 ppm to 30,000 ppm at 0.05 wt. % nanoparticles, the stability of the solution tended to decline much more quickly. The requirement for determining an optimal set of variables arises as a result of the preceding observation. Increase the concentration to the point where stability is unaffected, while more studies should be performed into techniques to improve stability at higher salinities and temperatures.
5. Conclusions
In a range of nanomaterial concentrations (i.e., 0.02, 0.05, 0.07, and 0.10 wt. %) and saline conditions, silica-based nanofluid flooding improved recoveries. Concentration assisted recovery up to a point (i.e., 0.02 and 0.05 wt. %), after which stability was negatively impacted and recovery began to decrease. This phenomenon is linked to variations in stability caused by particle agglomeration as concentration was increased. Mechanical entrapment and pore plugging became active mechanisms that were not as efficient as chemical methods at 0.07 and 0.10 wt. %, whereas the reduction in porosity in these cases points to higher retention. As a result, chemical recovery mechanisms lost their dominance, and mechanical entrapment and pore plugging became active mechanisms that were not as efficient as chemical methods.
When salinity was raised (from 20,000 to 40,000 ppm), the stability of the previously optimal concentration was also affected. Hence this outlines that higher salinity will have an adverse effect on stability even in concentrations that were stable at lower salinity. Resultantly, the recovery was decreased with an increase in salinity and the reason for this decrease is again because the recovery mechanisms of wettability change and IFT reduction were adversely affected.
The analysis of recovery mechanisms revealed variations in the dominance of the mechanism with changes in concentration and salinity parameters, which finally destabilized the solution as they were increased. In the case of lower salinity, the contact angle and interfacial tension were among the dominant recovery mechanisms for concentrations of 0.02% and 0.05%, whereas in a higher concentration, their effect was reduced in the case of 0.07 wt. % fluid and was almost completely lost when the solution became 0.10 wt. %. In higher concentrations and a high saline environment, log jamming or mechanical entrapment was found as an important mechanism. Higher reductions in porosity were found when stability was impaired at higher concentrations in a low saline environment and lower concentrations in a higher saline environment, owing to nanomaterial retention in the system.
At 20,000 ppm salinity, 0.05 wt. % silica nanomaterial concentration was found to be the optimal concentration, resulting in the highest oil recovery, with the presence of most of the nano-induced recovery mechanisms, such as wettability changes to water-wet, IFT reduction between the fluids, log jamming, and mechanical entrapment, as well as better stability. Thus, in the case of silica nanofluid application, this integrated study has outlined two-fold impacts of various parameters, concluding that when an optimized set of independent parameters, such as particle type, size, concentration, and salinity, is selected, more optimized recoveries can be achieved.
Author Contributions
T.A.C., Conceptualization, Methodology, Investigation; M.A.M., Supervision, Resources, Review; K.R.M., Methodology, Validation; G.A., Software, Review; G.R.A., Visualization, Results review. All authors have read and agreed to the published version of the manuscript.
Funding
This research received no external funding.
Institutional Review Board Statement
Not applicable.
Informed Consent Statement
Not applicable.
Data Availability Statement
All the data has been provided in the manuscript, for further data sets, corresponding author can be contacted.
Acknowledgments
Authors would like to acknowledge the Faculty of Engineering, Universiti Teknologi Malaysia (UTM) Malaysia, for the technical support, material, and laboratory access for the experimental work carried out.
Conflicts of Interest
The authors declare no conflict of interest.
References
- Memon, K.R.; Mahesar, A.A.; Ali, M.; Tunio, A.H.; Mohanty, U.S.; Akhondzadeh, H.; Awan, F.U.R.; Iglauer, S.; Keshavarz, A. Influence of Cryogenic Liquid Nitrogen on Petro-Physical Characteristics of Mancos Shale: An Experimental Investigation. Energy Fuels 2020, 34, 2160–2168. [Google Scholar] [CrossRef]
- Afolabi, R.O. Enhanced oil recovery for emergent energy demand: Challenges and prospects for a nanotechnology paradigm shift. Int. Nano Lett. 2019, 9, 1–15. [Google Scholar] [CrossRef] [Green Version]
- Turta, A.T.; Singhal, A.K. Field Foam Applications in Enhanced Oil Recovery Projects: Screening and Design Aspects. J. Can. Pet. Technol. 2010, 41. [Google Scholar] [CrossRef]
- Kharrat, R.; Zallaghi, M.; Ott, H. Performance Quantification of Enhanced Oil Recovery Methods in Fractured Reservoirs. Energies 2021, 14, 4739. [Google Scholar] [CrossRef]
- Muggeridge, A.; Cockin, A.; Webb, K.; Frampton, H.; Collins, I.; Moulds, T.; Salino, P. Recovery rates, enhanced oil recovery and technological limits. Philos. Trans. R. Soc. A Math. Phys. Eng. Sci. 2014, 372, 20120320. [Google Scholar] [CrossRef] [PubMed] [Green Version]
- Sun, X.; Zhang, Y.; Chen, G.; Gai, Z. Application of nanoparticles in enhanced oil recovery: A critical review of recent progress. Energies 2017, 10, 345. [Google Scholar] [CrossRef] [Green Version]
- Fakoya, M.F.; Shah, S.N. Emergence of nanotechnology in the oil and gas industry: Emphasis on the application of silica nanoparticles. Petroleum 2017, 3, 391–405. [Google Scholar] [CrossRef]
- Kamyshny, A.; Magdassi, S. Aqueous Dispersions of Metallic Nanoparticles; CRC Press: New York, NY, USA, 2010; pp. 747–778. [Google Scholar]
- Fletcher, A.J.P.; Davis, J.P. How EOR can be transformed by nanotechnology. SPE-DOE Improv. Oil Recover. Symp. Proc. 2010, 1, 152–167. [Google Scholar]
- Evdokimov, I.; Eliseev, N.; Losev, A.; Novikov, M. Emerging Petroleum-Oriented Nanotechnologies for Reservoir Engineering. In Proceedings of the SPE Russian Oil and Gas Technical Conference and Exhibition, Moscow, Russia, 3–6 October 2006. [Google Scholar]
- Wong, K.V.; De Leon, O. Applications of nanofluids: Current and future. Adv. Mech. Eng. 2010, 2010, 519659. [Google Scholar] [CrossRef] [Green Version]
- Lashari, N.; Ganat, T. Emerging applications of nanomaterials in chemical enhanced oil recovery: Progress and perspective. Chin. J. Chem. Eng. 2020, 28, 1995–2009. [Google Scholar] [CrossRef]
- Alomair, O.A.; Matar, K.M.; Alsaeed, Y.H. Nanofluids application for heavy oil recovery. In SPE Asia Pacific Oil & Gas Conference and Exhibition; OnePetro: Richardson, TX, USA, 2014; Volume 2, pp. 1346–1363. [Google Scholar]
- Skauge, T.; Spildo, K.; Skauge, A. Nano-sized particles for EOR. In Proceedings of the SPE Improved Oil Recovery Symposium, Society of Petroleum Engineers, Tulsa, OK, USA, 24–28 April 2010. [Google Scholar]
- Aurand, K.R.; Dahle, G.S.; Torsæter, O. Comparison of Oil Recovery for Six Nanofluids in Berea Sandstone Cores. In Proceedings of the International Symposium of the Society of Core Analysts, Avignon, France, 8–11 September 2014. [Google Scholar]
- Hendraningrat, L.; Engeset, B.; Suwarno, S.; Torstæer, O. Improved oil recovery by nanofluids flooding: An experimental study. In SPE Kuwait International Petroleum Conference and Exhibition; Society of Petroleum Engineers: Richardson, TX, USA, 2012; Volume 2, pp. 585–593. [Google Scholar]
- Hashemi, R.; Nassar, N.N.; Pereira Almao, P. Enhanced heavy oil recovery by in situ prepared ultradispersed multimetallic nanoparticles: A study of hot fluid flooding for Athabasca bitumen recovery. Energy Fuels 2013, 27, 2194–2201. [Google Scholar] [CrossRef]
- Zamani, A.; Maini, B.; Pereira-Almao, P. Flow of nanodispersed catalyst particles through porous media: Effect of permeability and temperature. Can. J. Chem. Eng. 2012, 90, 304–314. [Google Scholar] [CrossRef]
- Abhishek, R.; Kumar, G.S.; Sapru, R.K. Wettability alteration in carbonate reservoirs using nanofluids. Pet. Sci. Technol. 2015, 33, 794–801. [Google Scholar] [CrossRef]
- Zallaghi, M.; Kharrat, R.; Hashemi, A. Improving the microscopic sweep efficiency of water flooding using silica nanoparticles. J. Pet. Explor. Prod. Technol. 2018, 8, 259–269. [Google Scholar] [CrossRef]
- Kanj, M.Y.; Funk, J.J.; Al-Yousif, Z. Nanofluid coreflood experiments in the ARAB-D. In SPE Saudi Arabia Section Technical Symposium; OnePetro: Richardson, TX, USA, 2009; pp. 1–11. [Google Scholar]
- Negin, C.; Ali, S.; Xie, Q. Application of nanotechnology for enhancing oil recovery—A review. Petroleum 2016, 2, 324–333. [Google Scholar] [CrossRef]
- Xu, K.; Agrawal, D.; Darugar, Q. Hydrophilic Nanoparticle-Based Enhanced Oil Recovery: Microfluidic Investigations on Mechanisms. Energy Fuels 2018, 32, 11243–11252. [Google Scholar] [CrossRef]
- Ahmed, A.; Mohd Saaid, I.; Pilus, R.M.; Abbas Ahmed, A.; Tunio, A.H.; Baig, M.K. Development of surface treated nanosilica for wettability alteration and interfacial tension reduction. J. Dispers. Sci. Technol. 2018, 39, 1469–1475. [Google Scholar] [CrossRef]
- Hendraningrat, L.; Li, S.; Torsæter, O. A coreflood investigation of nanofluid enhanced oil recovery. J. Pet. Sci. Eng. 2013, 111, 128–138. [Google Scholar] [CrossRef]
- Ayatollahi, S. Nanotechnology-assisted EOR techniques: New solutions to the old challenges. World Pet. Congr. Proc. 2014, 6, 4127–4138. [Google Scholar]
- Hendraningrat, L.; Shidong, L.; Torsæter, S.; Torsæter, O. A glass micromodel experimental study of hydrophilic nanoparticles retention for EOR project. In SPE Russian Oil and Gas Exploration and Production Technical Conference and Exhibition; OnePetro: Richardson, TX, USA, 2012; Volume 1, pp. 124–146. [Google Scholar]
- Hu, Z.; Azmi, S.M.; Raza, G.; Glover, P.W.J.; Wen, D. Nanoparticle-Assisted Water-Flooding in Berea Sandstones. Energy Fuels 2016, 30, 2791–2804. [Google Scholar] [CrossRef]
- Giraldo, J.; Benjumea, P.; Lopera, S.; Cortés, F.B.; Ruiz, M.A. Wettability alteration of sandstone cores by alumina-based nanofluids. Energy Fuels 2013, 27, 3659–3665. [Google Scholar] [CrossRef]
- Hendraningrat, L.; Torsæter, O. Metal oxide-based nanoparticles: Revealing their potential to enhance oil recovery in different wettability systems. Appl. Nanosci. 2015, 5, 181–199. [Google Scholar] [CrossRef] [Green Version]
- Hendraningrat, L.; Torsæter, O. Unlocking the potential of metal oxides nanoparticles to enhance the oil recovery. Proc. Annu. Offshore Technol. Conf. 2014, 1, 211–222. [Google Scholar]
- Youssif, M.I.; El-Maghraby, R.M.; Saleh, S.M.; Elgibaly, A. Silica nanofluid flooding for enhanced oil recovery in sandstone rocks. Egypt. J. Pet. 2018, 27, 105–110. [Google Scholar] [CrossRef]
- Bera, A.; Mandal, A.; Kumar, T. The effect of rock-crude oil-fluid interactions on wettability alteration of oil-wet sandstone in the presence of surfactants. Pet. Sci. Technol. 2015, 33, 542–549. [Google Scholar] [CrossRef]
- Hendraningrat, L.; Li, S.; Torsæter, O. Effect of some parameters influencing enhanced oil recovery process using Silica Nanoparticles: An experimental investigation. In SPE Reservoir Characterization and Simulation Conference and Exhibition; OnePetro: Richardson, TX, USA, 2013; Volume 1, pp. 186–195. [Google Scholar]
- Bila, A.; Stensen, J.Å.; Torsæter, O. Experimental investigation of polymer-coated silica nanoparticles for enhanced oil recovery. Nanomaterials 2019, 9, 822. [Google Scholar] [CrossRef] [Green Version]
Figure 1.
Silica nanoparticles wedging caused structural disjoining.
Figure 1.
Silica nanoparticles wedging caused structural disjoining.
Figure 2.
(A) Showing smaller particles without entrapment; (B) log jamming due to pore throat plugging.
Figure 2.
(A) Showing smaller particles without entrapment; (B) log jamming due to pore throat plugging.
Figure 3.
Flow diagram of experimental design.
Figure 3.
Flow diagram of experimental design.
Figure 4.
Schematic for contact angle measurement setup.
Figure 4.
Schematic for contact angle measurement setup.
Figure 5.
Schematic of three accumulator-based core flooding setup.
Figure 5.
Schematic of three accumulator-based core flooding setup.
Figure 6.
Recovery (%OOIP) vs. Pore Volume injected for scenario 1.
Figure 6.
Recovery (%OOIP) vs. Pore Volume injected for scenario 1.
Figure 7.
Recovery and displacement efficiency comparison for scenario 1.
Figure 7.
Recovery and displacement efficiency comparison for scenario 1.
Figure 8.
Contact angle (nanofluid-oil-solid), IFT (oil-nanofluid) for different wt. % of nanomaterial.
Figure 8.
Contact angle (nanofluid-oil-solid), IFT (oil-nanofluid) for different wt. % of nanomaterial.
Figure 9.
Porosity reduction in scenario: 1.
Figure 9.
Porosity reduction in scenario: 1.
Figure 10.
Pressure differential profile vs. pore volume, for different silica nanofluid concentrations at 20,000 ppm.
Figure 10.
Pressure differential profile vs. pore volume, for different silica nanofluid concentrations at 20,000 ppm.
Figure 11.
Recovery (%OOIP) vs. pore volume injected for scenario 2.
Figure 11.
Recovery (%OOIP) vs. pore volume injected for scenario 2.
Figure 12.
Recovery and displacement efficiency comparison for scenario 2 at 20,000, 30,000 & 40,000 ppm salinity.
Figure 12.
Recovery and displacement efficiency comparison for scenario 2 at 20,000, 30,000 & 40,000 ppm salinity.
Figure 13.
Contact angle (nanofluid-oil-solid), IFT (oil-nanofluid) for different salinities (ppm) at 0.05 wt. % nanomaterial.
Figure 13.
Contact angle (nanofluid-oil-solid), IFT (oil-nanofluid) for different salinities (ppm) at 0.05 wt. % nanomaterial.
Figure 14.
Porosity reductions for cores used in scenario 2.
Figure 14.
Porosity reductions for cores used in scenario 2.
Figure 15.
Pressure differential profile comparison for 0.05 wt. % silica nanofluids at different salinities.
Figure 15.
Pressure differential profile comparison for 0.05 wt. % silica nanofluids at different salinities.
Table 1.
Physical and flow properties of sandstone cores.
Table 1.
Physical and flow properties of sandstone cores.
| Case No. | Core Sandstone
No. | Length
cm | Diameter
cm | Pore Volume
cm3 | Porosity
% | Brine Permeability,
mD |
|---|
| 1 | A | 7.65 | 3.65 | 18.37 | 22.95 | 502.53 |
| 2 | B | 7.67 | 3.83 | 20.86 | 23.56 | 470.78 |
| 3 | C | 7.65 | 3.6 | 21.53 | 27.65 | 602.55 |
| 4 | D | 7.6 | 3.9 | 21.88 | 24.10 | 536.55 |
| 5 | E | 7.2 | 3.82 | 17.10 | 20.72 | 465.46 |
| 6 | F | 7.75 | 3.81 | 19.69 | 22.28 | 482.58 |
Table 2.
Details of nanofluids composition and cores used in the study.
Table 2.
Details of nanofluids composition and cores used in the study.
| Case No. | Silica CNP wt. % | Salinity (ppm) | Core |
|---|
| Scenario 1 |
| 1 | 0.02 | 20,000 | Core A |
| 2 | 0.05 | 20,000 | Core B |
| 3 | 0.07 | 20,000 | Core C |
| 4 | 0.10 | 20,000 | Core D |
| Scenario 2 |
| 5 | 0.05 | 20,000 | Core B |
| 6 | 0.05 | 30,000 | Core E |
| 7 | 0.05 | 40,000 | Core F |
Table 3.
Flooding data for scenario 1.
Table 3.
Flooding data for scenario 1.
| C# | Conc. wt. % | Core | Sor1 % | Oil Recovery (Brine) %OOIP | Ultimate Recovery %OOIP | Nanofluid Increment
Recovery
%OOIP | Sor2 %, Post Nano Flooding | Displacement Efficiency, Ed% |
|---|
| 1 | 0.02 | A | 35.93 | 54.42 | 63.45 | 09.03 | 29.40 | 18.18 |
| 2 | 0.05 | B | 32.60 | 54.15 | 65.13 | 10.99 | 25.41 | 22.06 |
| 3 | 0.07 | C | 23.22 | 62.12 | 71.97 | 09.85 | 18.58 | 20.00 |
| 4 | 0.1 | D | 14.65 | 55.26 | 61.84 | 06.58 | 11.91 | 18.68 |
Table 4.
Flooding data for scenario 2.
Table 4.
Flooding data for scenario 2.
| Case | Salinity
ppm | Core | Sor1 % Post Brine Injection | Oil Recovery (Brine) %OOIP | Ultimate Oil Recovery % OOIP | Nanofluid
Recovery
%OOIP | Sor2 %, Post Nano Flood | Displacement Efficiency, Ed% |
|---|
| 5 | 20,000 | B | 32.60 | 54.145 | 65.132 | 10.987 | 25.41 | 22.06 |
| 6 | 30,000 | F | 21.65 | 65.74 | 74.07 | 8.33 | 16.39 | 24.30 |
| 7 | 40,000 | G | 18.89 | 68.12 | 79.32 | 11.2 | 12.29 | 34.94 |
| Publisher’s Note: MDPI stays neutral with regard to jurisdictional claims in published maps and institutional affiliations. |
© 2021 by the authors. Licensee MDPI, Basel, Switzerland. This article is an open access article distributed under the terms and conditions of the Creative Commons Attribution (CC BY) license (https://creativecommons.org/licenses/by/4.0/).


 ,
, 


