1. Introduction
In mining, one of the most important safety elements is anchor bolting [
1,
2,
3,
4,
5]. Rock bolt roof support is used in underground mining mainly in ore mining. However, this type of rock mass reinforcement is becoming more and more popular in hard coal mines and other types of mines. In mining practice there are various solutions for construction of anchors which work in different systems with rock mass and other types of support structures. The variety of conditions in which bolt roof support is used makes it suitable for securing roof and side walls of mine workings either as an independent or reinforcing bolt roof support. Anchor bolting secures a mine workings’ breakout by solidifying the exposed surrounding rock with binder or friction anchors [
6,
7]. It is also used to suspend various pieces of mining equipment [
8].
Evaluation of the quality of the anchor shoring operation and the behavior of the rock mass around the excavations can be performed based on monitoring, which includes measurements of the following: excavation roof loads such as dynamometers [
9], instrumented anchors [
10], pressure pads [
11], dynamometer discs [
12], stratification of the roof rocks [
13], sloughing of the roof layers using a borehole endoscope, aerometric soda, radiometric method [
14], convergence of the excavation [
15] and many others. The effectiveness of anchor shoring in mine conditions most often includes activities related to verifying the correctness of its installation in the excavation. In the case of expansion anchors, the torque of tightening the anchor nut is checked with a torque wrench and their load capacity is tested by pulling the anchor out of the hole [
16,
17].
For nondestructive testing, ultrasonic systems are a very wide group [
18,
19,
20]. The authors of [
21] show a method related to the measurement of the first three natural frequencies of the anchor. The measurements carried out are for different filling degrees and different binder filling geometries. The numerical model presented makes it possible to relate the actual measurements to the numerical model and, thus, determine the discontinuity in the anchor fixture. A whole group of nondestructive measurements includes methods using guided wave. A method was shown in [
22] where a compressed chirp signal for guided wave allowed the excitation of long-range waves. These, in turn, allowed for the identification of the level of anchorage even when the wave energy leaked from the anchor into the surrounding rock masses as well as the cement itself. Guided waves are created by the superposition of longitudinal and transverse waves for a medium in which the diameter is much smaller than the length. Analysis of the pattern of superposition of these waves during propagation of the medium has become a topic of discussion in [
23]. The authors there suggest that reading such a pattern can be successfully used to assess the state of the anchoring. A very interesting method was presented in [
24]. This method is based on the analysis of the wavelet spectrum from ultrasonic testing of an anchor using a neural network. In this publication, the authors show an anchor condition assessment performance of over 90%.
This paper presents another method using the self-excitation effect. It is the self-excited method described in [
25,
26] called the Self-Acoustic System (SAS). Self-excited systems in general are not desirable in engineering. They can result in the destruction of the excited structure. However, with limit cycle control, it is possible to use the self-excitation phenomenon to investigate stresses in structures. An example of such an application is shown in [
27,
28,
29,
30]. In addition to civil engineering applications, mining applications are also possible, as described in [
31,
32,
33,
34]. The use of frequency measurement of a self-excited system to evaluate stress using the elastoacoustic effect described in [
35] has some disadvantages. One of the biggest is the frequency jump and limit cycle change described in [
25]. One method to analyze such frequency spectra is to use classification methods [
36]. Nevertheless, it is more advantageous to implement active filters in a positive feedback loop. However, this requires high processing frequencies due to the frequencies in the ultrasonic range.
This paper describes the implementation of such active filters for a self-excited system on a FPGA (Field-programmable gate array) platform. Additionally shown are experimental results that analyze the effect of their application on frequency jump.
The proposed system should allow to quick and accurate selection of anchors that should be examined more thoroughly by other well-known methods. The aim of this study was, therefore, to verify the application of the SAS system in the preliminary diagnosis of anchors.
2. The Self-Excitation Effect
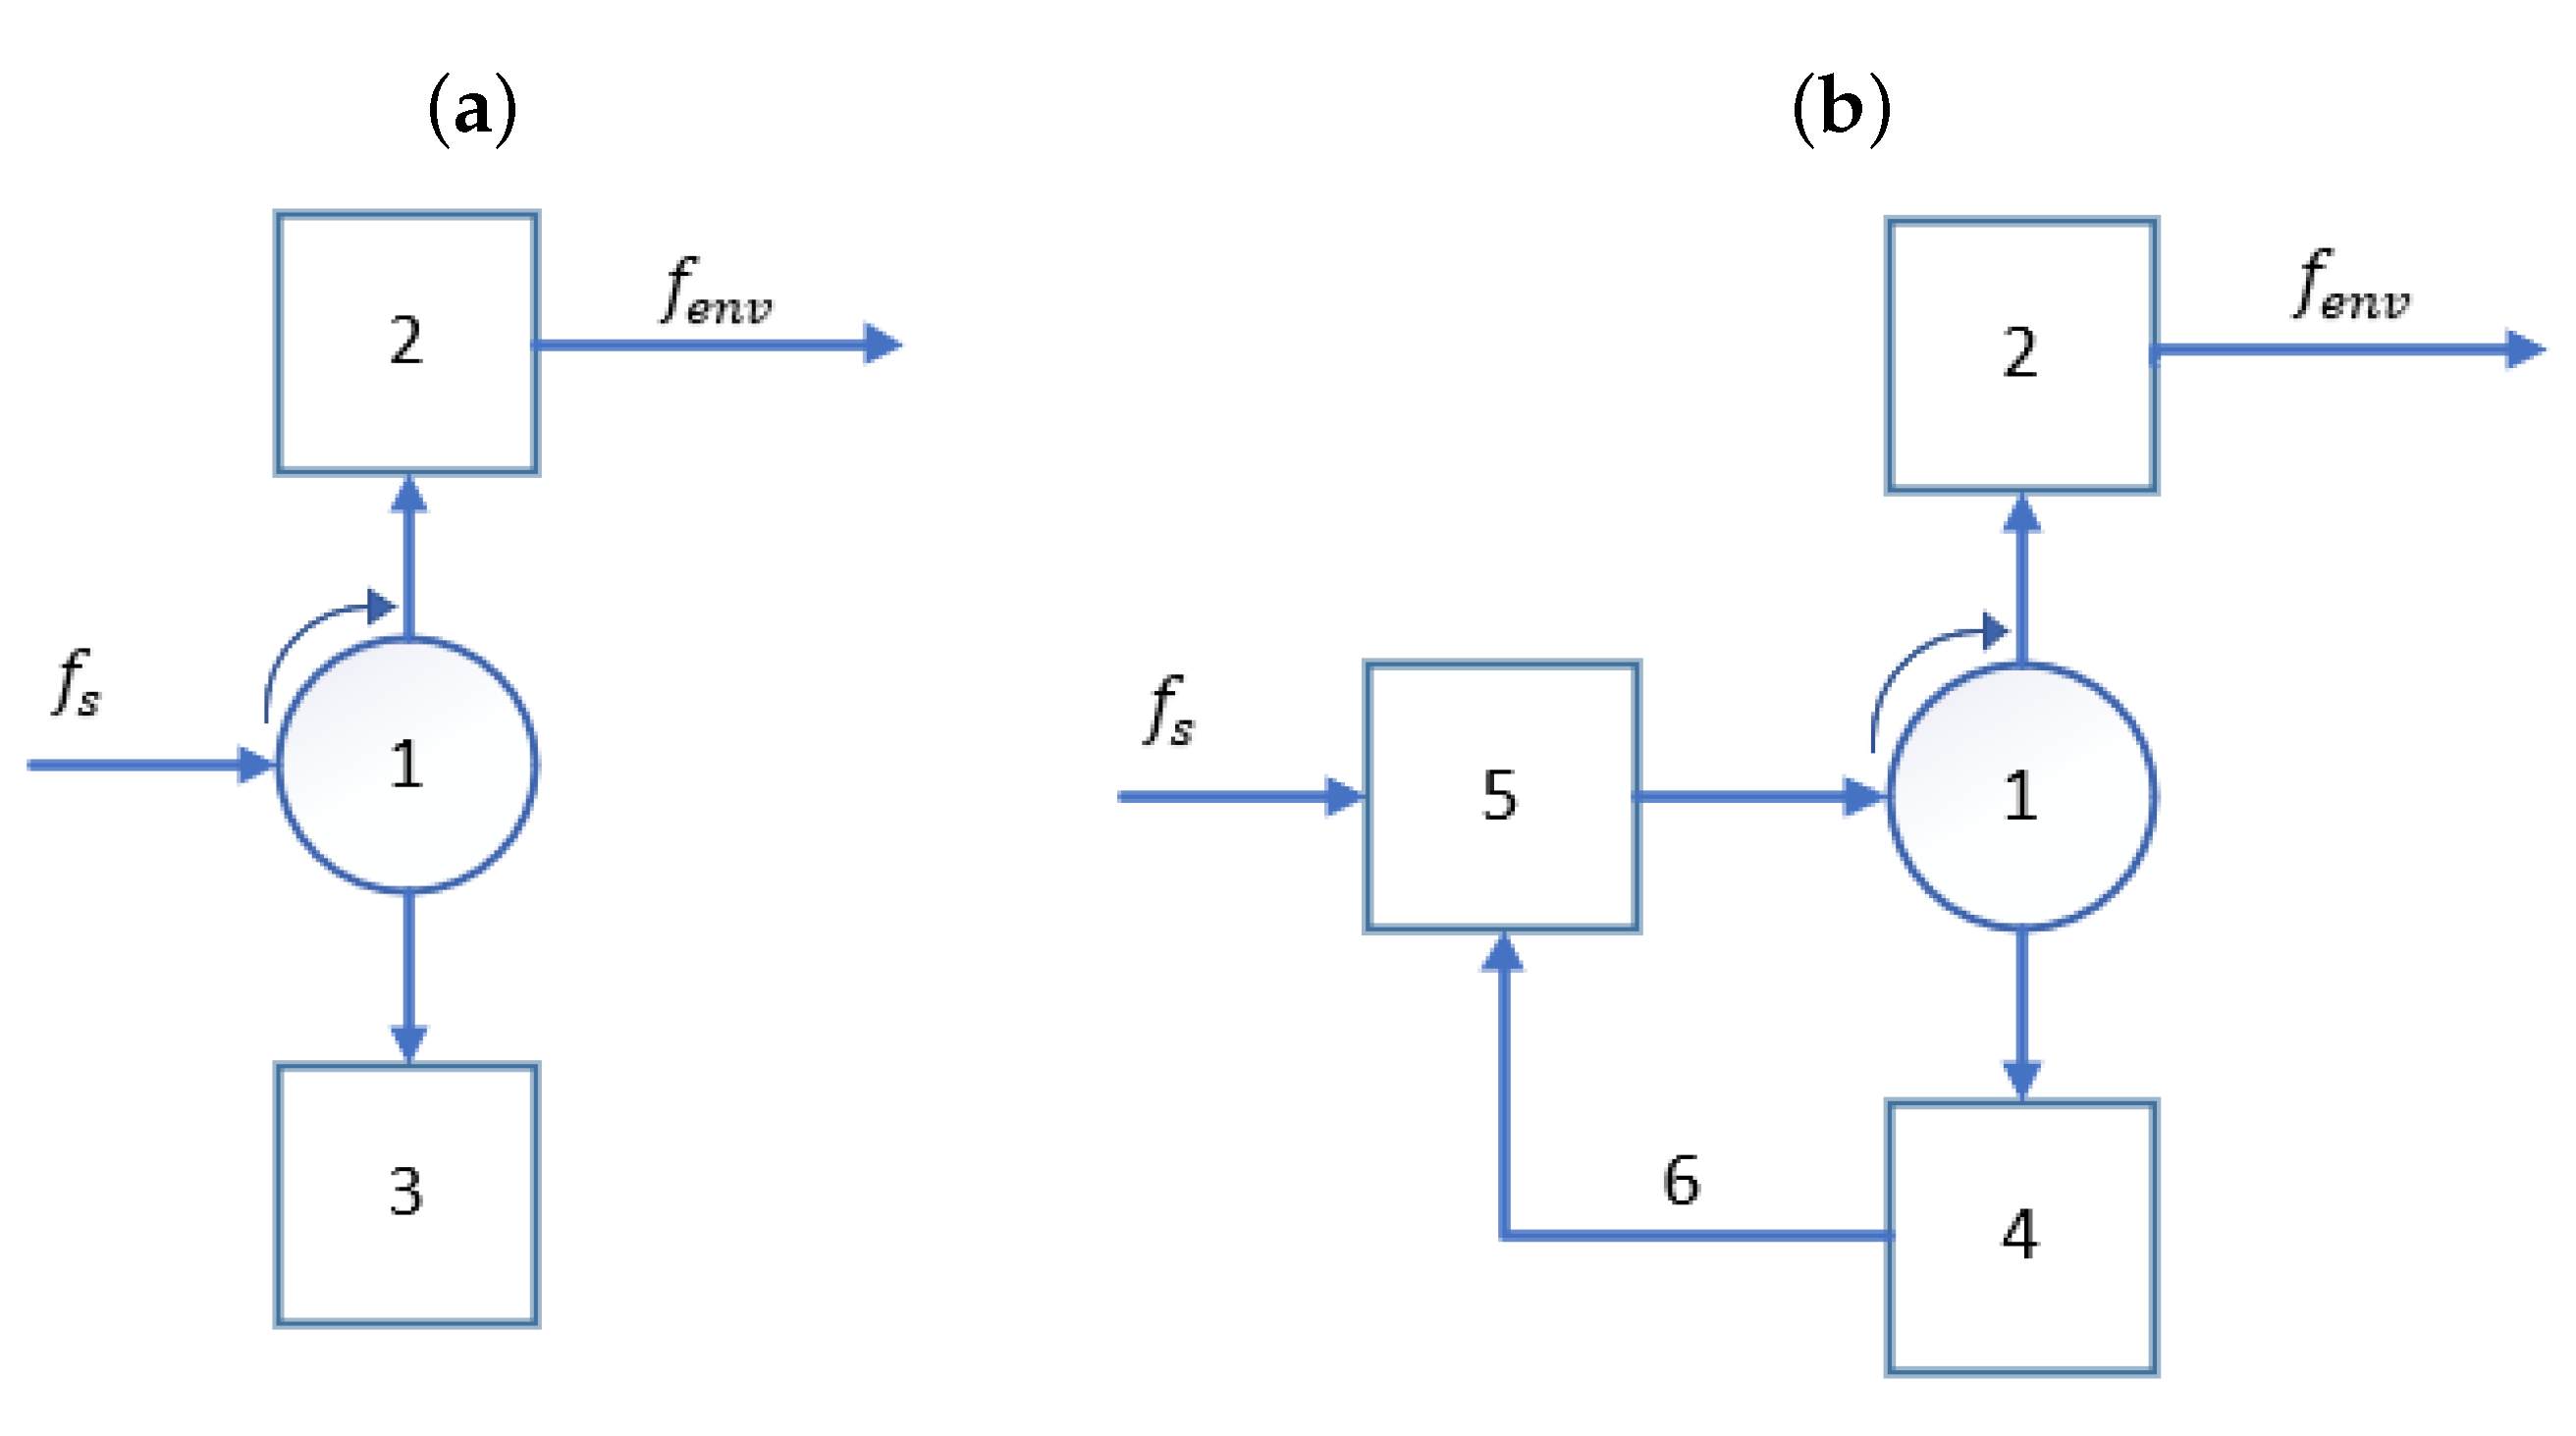
One of the key phenomenon involved in the operation of the Self-Excited Acoustic Stress Measurement System is the autodyne effect that occurs in vibrating systems. An autodyne is an oscillator that acts as both a transmitter and a mixer. In autodyne oscillators, the emitted and reflected signals are present at the same points in the autodyne system. A characteristic feature of autodyne systems is the quasi-linear nature of the conversion, satisfied only up to a given level of signal value. A typical autodynamic system (
Figure 1) consists of the following elements: 1—circulator; 2—self-excited oscillator; 3—matched load; 4—object introducing frequency shift; 5—signal combiner; 6—waveguide closing the coupling loop, and
and
are corresponding frequencies of the external and processed signal.
Figure 1a shows an autodyne system consisting of elements one, two and three. The processed signal is obtained by low-frequency loading of the oscillator system or by using a low-pass filter. The main disadvantage of this solution is the negative influence on the autodyne parameters due to absorption of part of the oscillations by the element three. On the other hand, in the
Figure 1b, there is no load that could absorb part of the oscillations, such an arrangement provides higher stability and signal amplification.
Autodyne systems allow for frequency conversion, control of amplitude-frequency and phase-frequency characteristics, as well as significant amplification of the signal caused by the circulator of autodyne vibrations. In addition, oscillations of the input signal are again directed to the circulator and used in the conversion, thus allowing the reduction in the associated losses. Despite the energy losses that occur in all mechanical systems, the self-excitation phenomenon can result in non-decaying periodic oscillations. In real systems, the self-excitation phenomenon occurs in cutting tools, turbine blades, aircraft airfoils and suspension bridges [
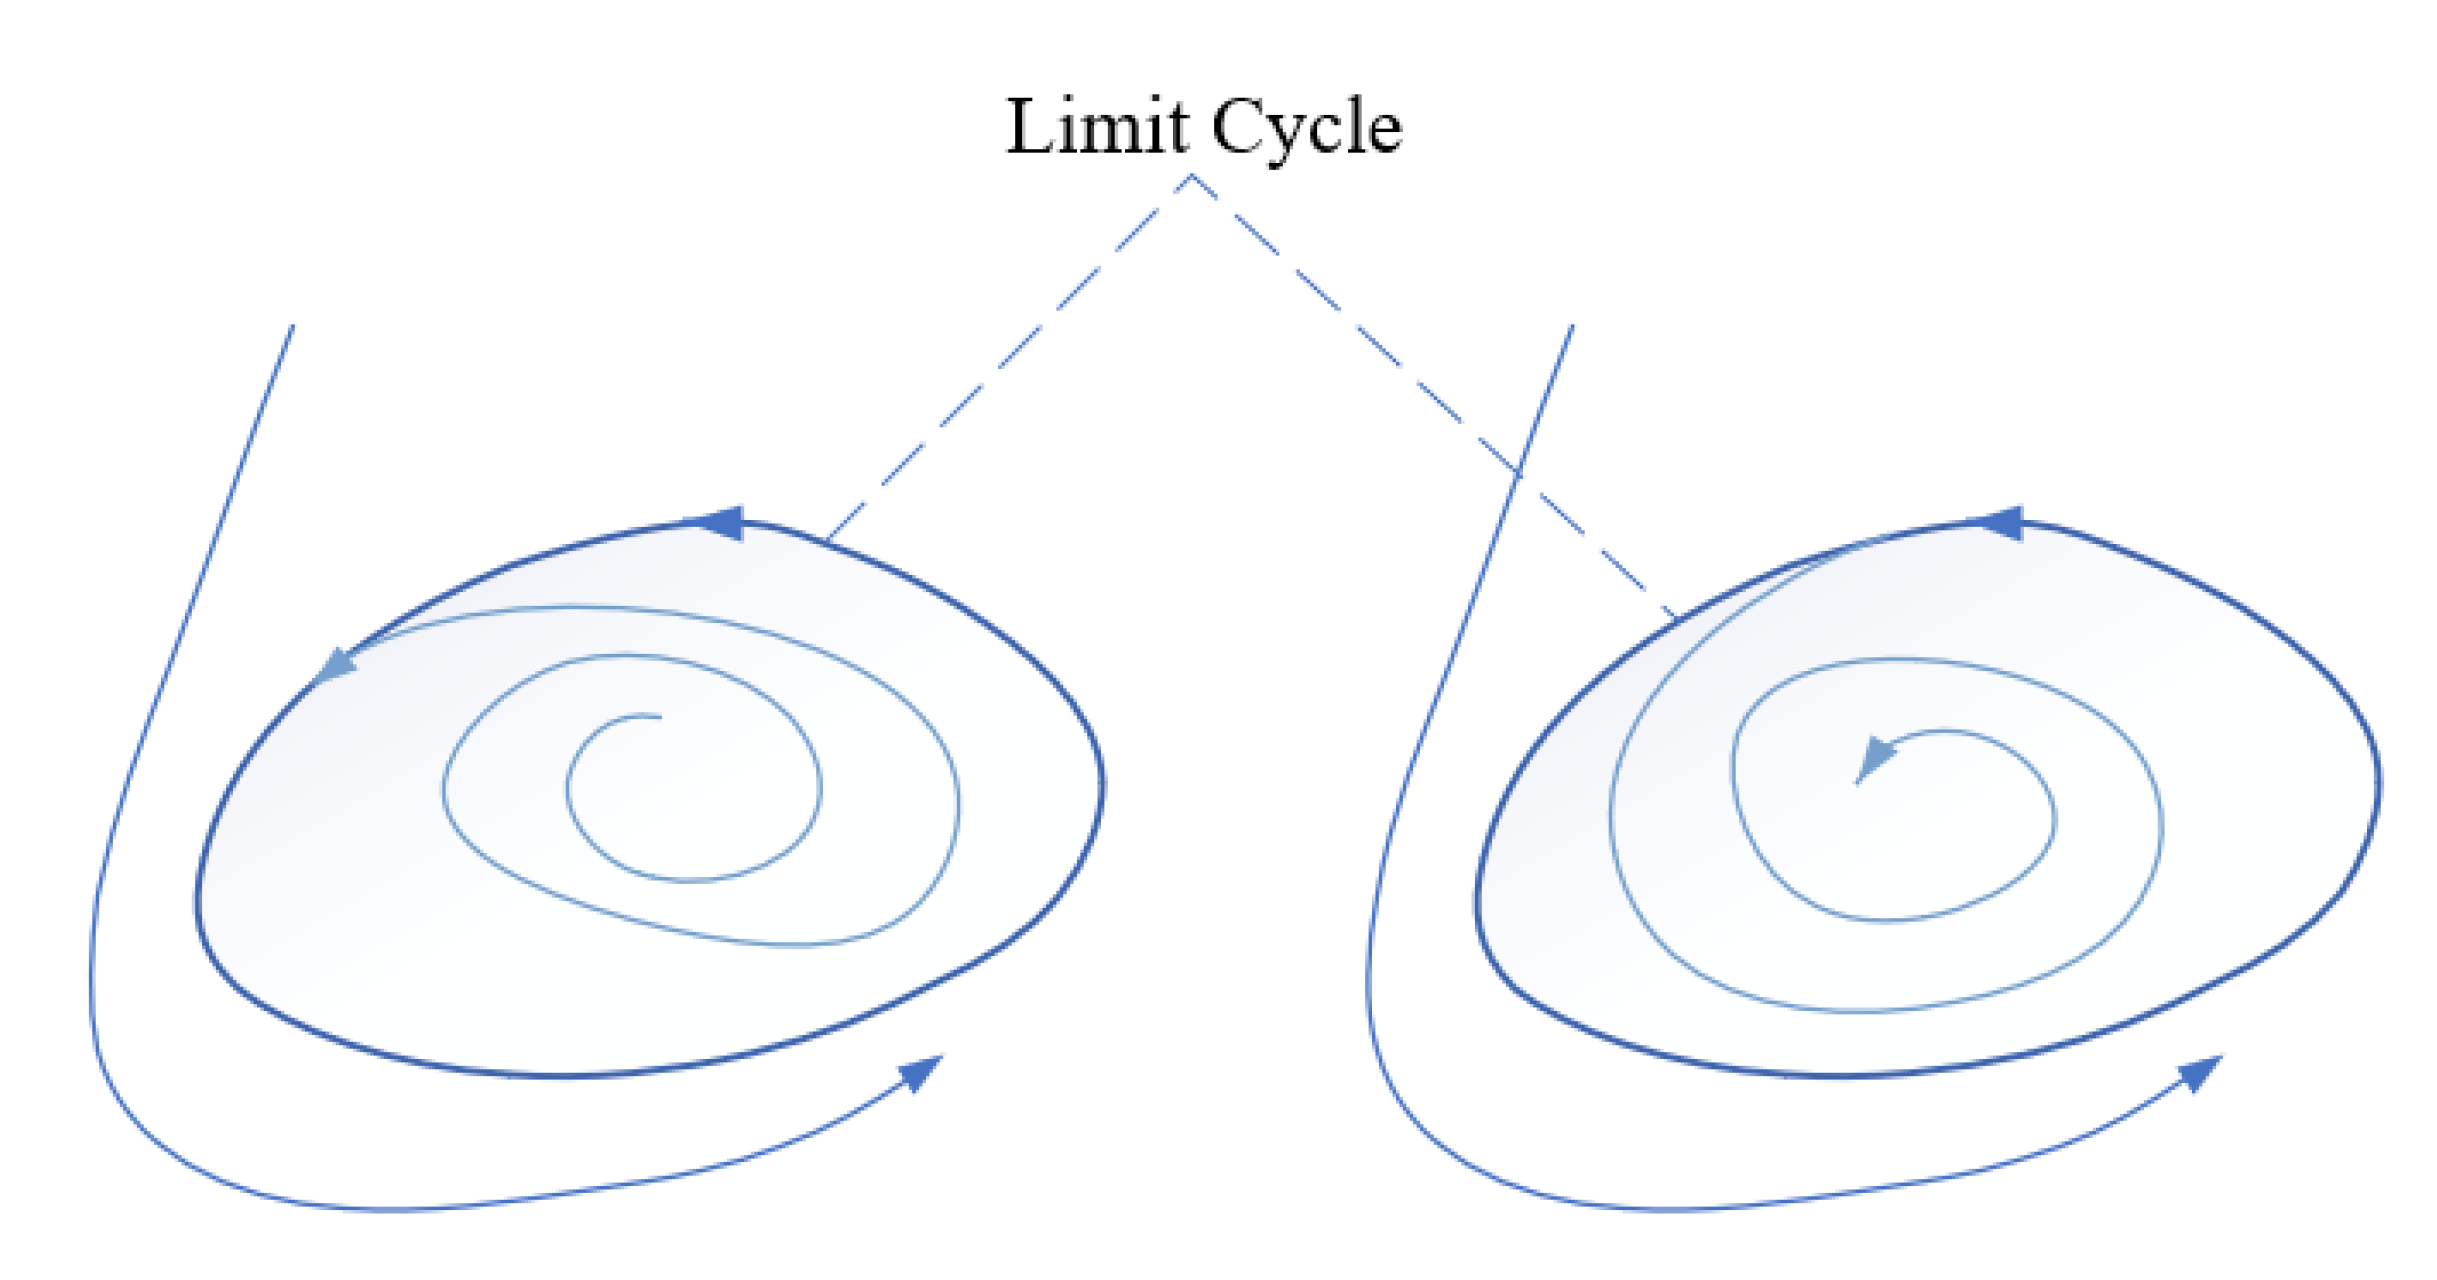
37]. Even a small perturbation of a non-static equilibrium position can cause not only non-decaying but also ncreasing vibrations (
Figure 2). Due to the nature of the limit cycle, there is a difference between soft and hard cycle oscillations. Soft oscillations occur when the phase trajectories follow a limit cycle. They are characterized by stable oscillations for which its amplitude tends towards the limit value. In the case of hard oscillation also known as catastrophic oscillation, the phase trajectories tend from the limit cycle to infinity. The amplitude of the oscillation infinitely increases, consequently resulting in the destruction of the oscillating object as in the case of the Tacoma Bridge in the USA [
38].
Self-excited vibrations in design are usually an undesirable effect, and efforts are made to exclude the possibility of their occurrence. Despite its destructive nature, the phenomenon of self-excitation finds applicability in real-world applications, including the SAS system.
3. Measurement Stand
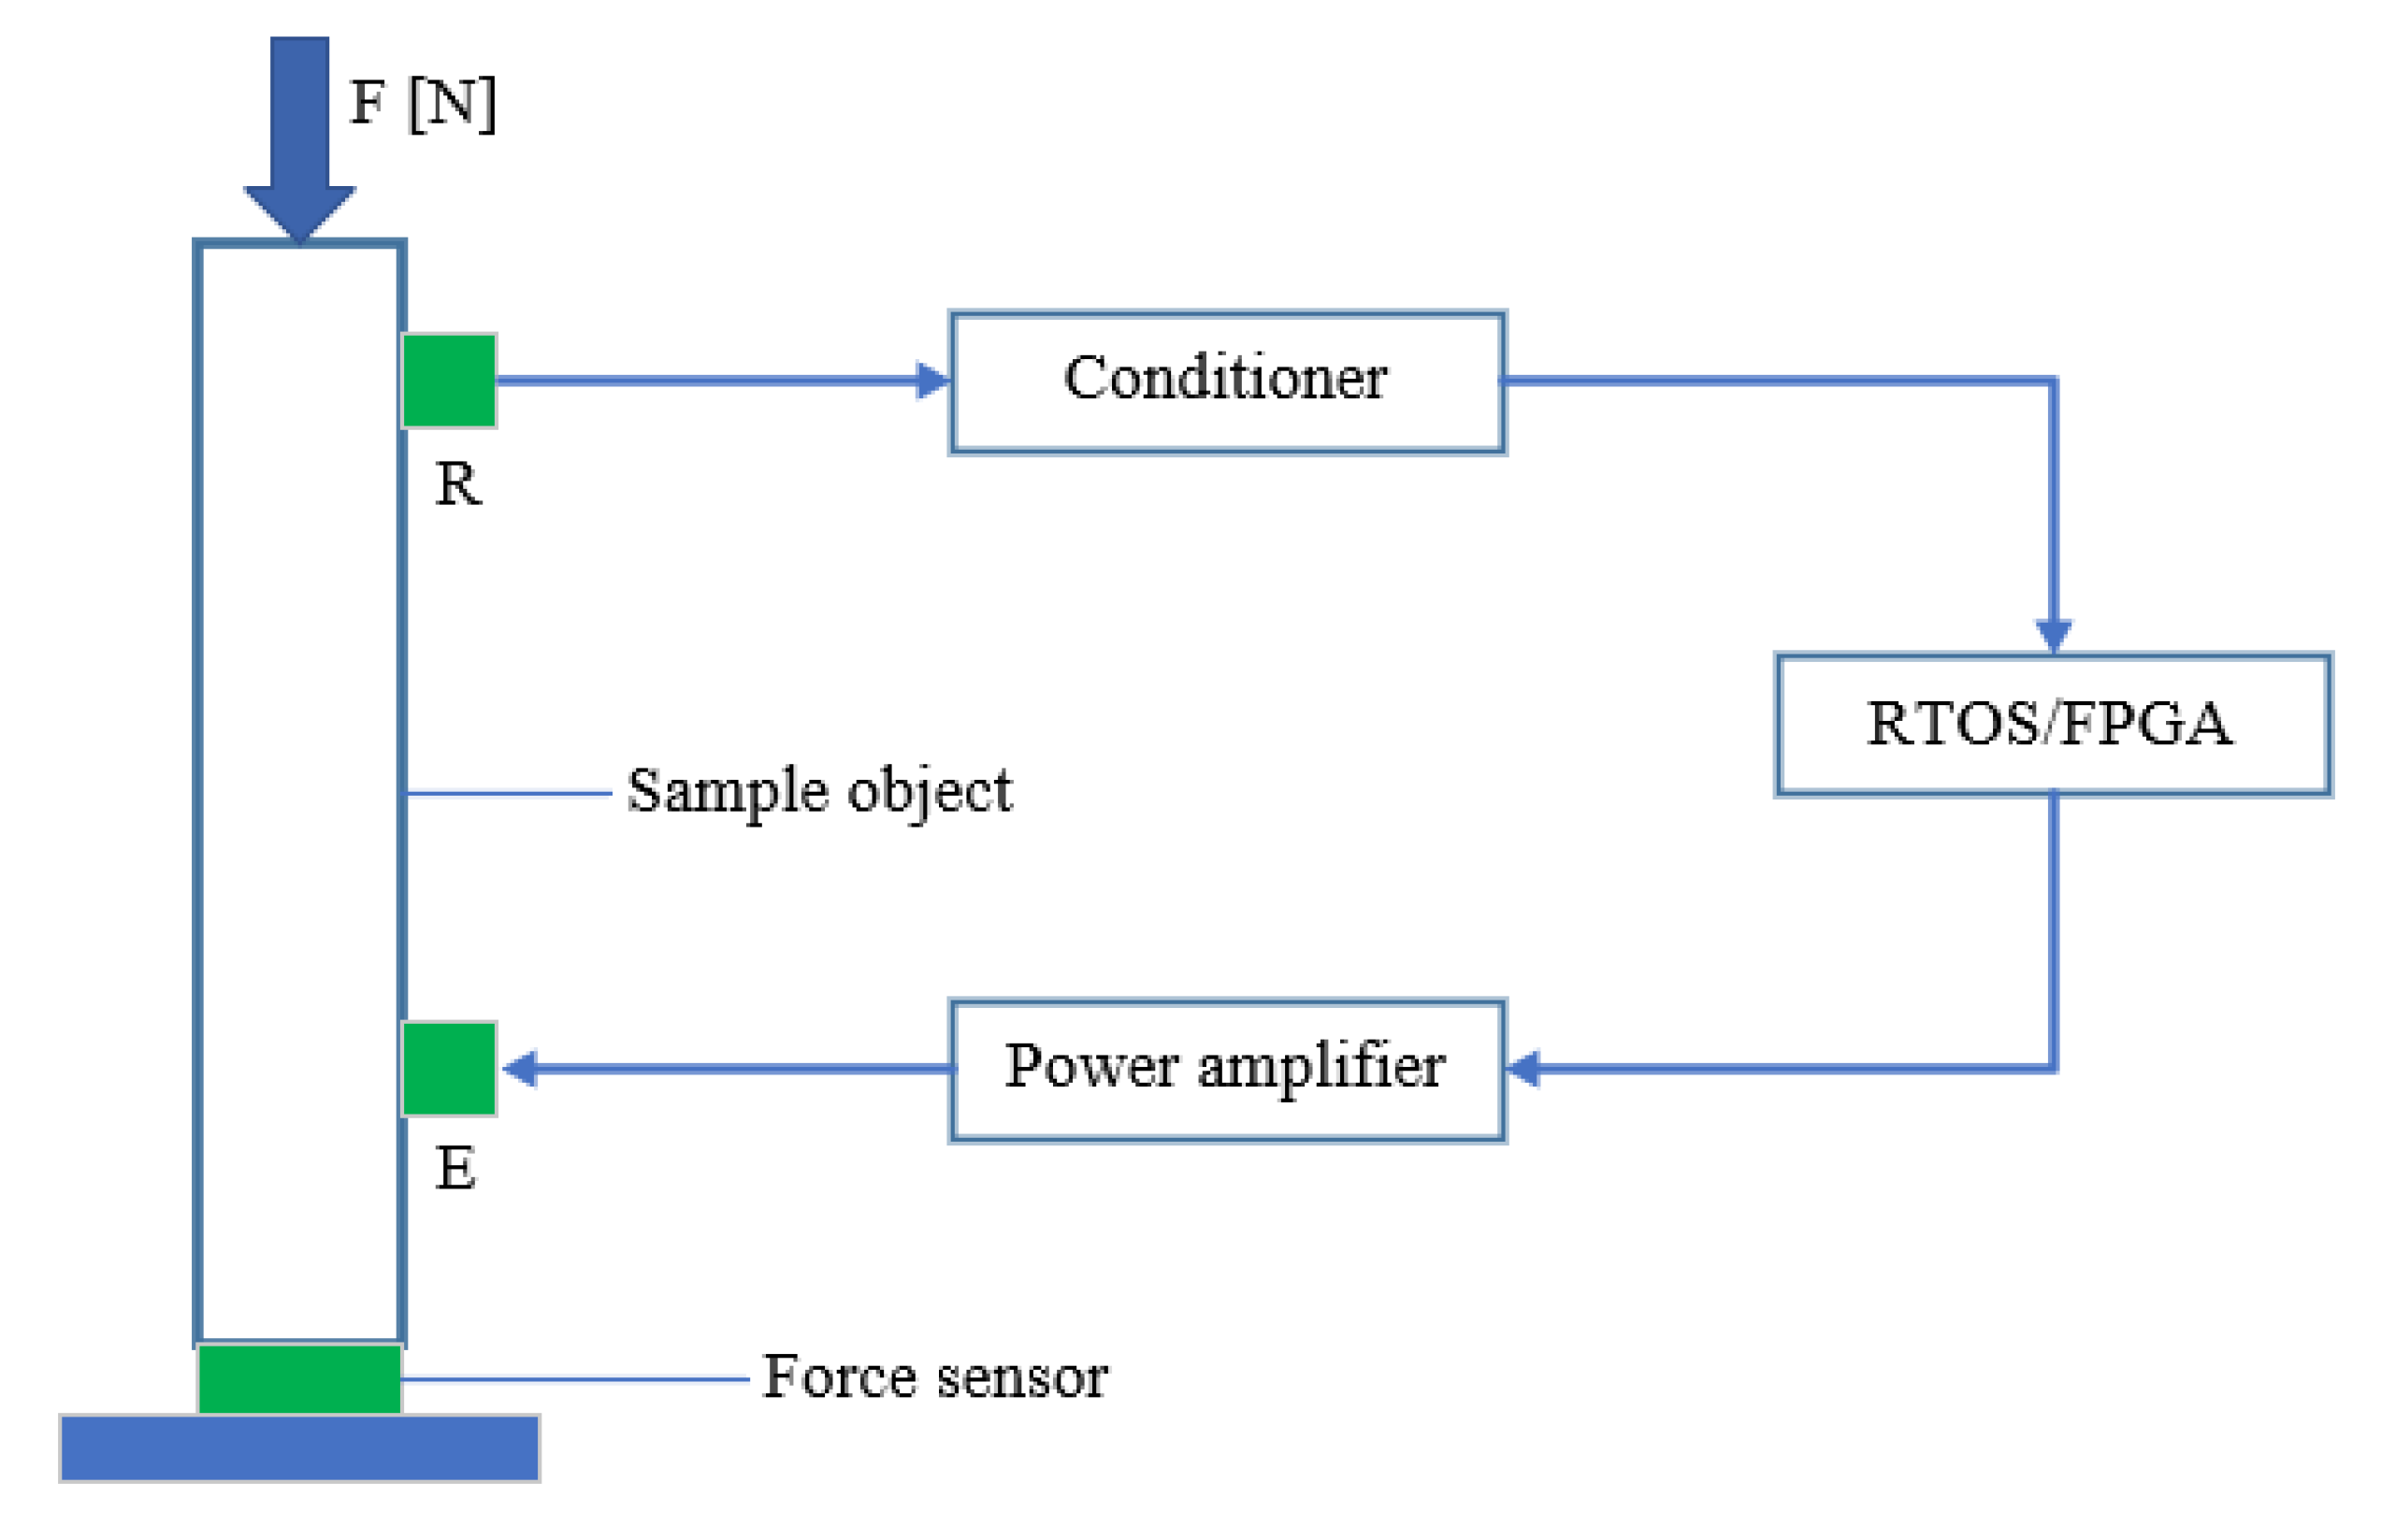
A prototype of a positive feedback loop filtering and signal processing device for a self-excited acoustic SAS system was created in this study. The Self-Excited Acoustic System (SAS) shown in
Figure 3 is a set of devices that use the self-excitation effect to measure stress changes. The measurement system consists of a vibration emitter (E), through which vibrations are introduced into the test object. Then, the vibrations are transmitted through the tested element to a piezoelectric accelerometer acting as a receiver (R). The signal received by the accelerometer is conditioned to match the voltage levels. The conditioned signal is then amplified and passed as positive coupling to the vibration emitter. This operation results in the self-excitation of the test element. It has been noted in previous research on self-excited acoustic SAS that multiple self-excitation frequencies may exist for the test element. Frequency jump is a phenomenon that negatively affects the analysis of measured data. Eliminating the jump phenomenon will make it easier to find the relationship between the stress and the self-excitation frequency of the element. Therefore, the aim of the research work was to develop an active filtering system that allows the element to excite the tested object in a selected frequency band. This band was set within the frequencies in which the self-excitation of the tested element was expected. The developed device filters and analyzes the voltage signal representing the mass acceleration of the tested sample. The filtered signal is then applied to the emitter input to excite that sample.
The main element of the filtering device is the FPGA platform with the processor working under the control of real time, located in a single housing creating a system of chip (SoC) type. Such a solution allows effective management of the computing power and reduces the delay in data exchange between the directly programmable gate array and the processor. Filtering and signal generation algorithms are implemented on the FPGA platform using hardware blocks supporting digital signal processing.
The circuit uses an IMI 623C01 piezoelectric accelerometer with a VibAMP PA-3000 adjustable gain conditioner. The accelerometer parameters are listed in
Table 1. The accelerometer measures vibration acceleration, which is key to explaining the occurrence of self-excitation and jumps between cut-off frequencies.
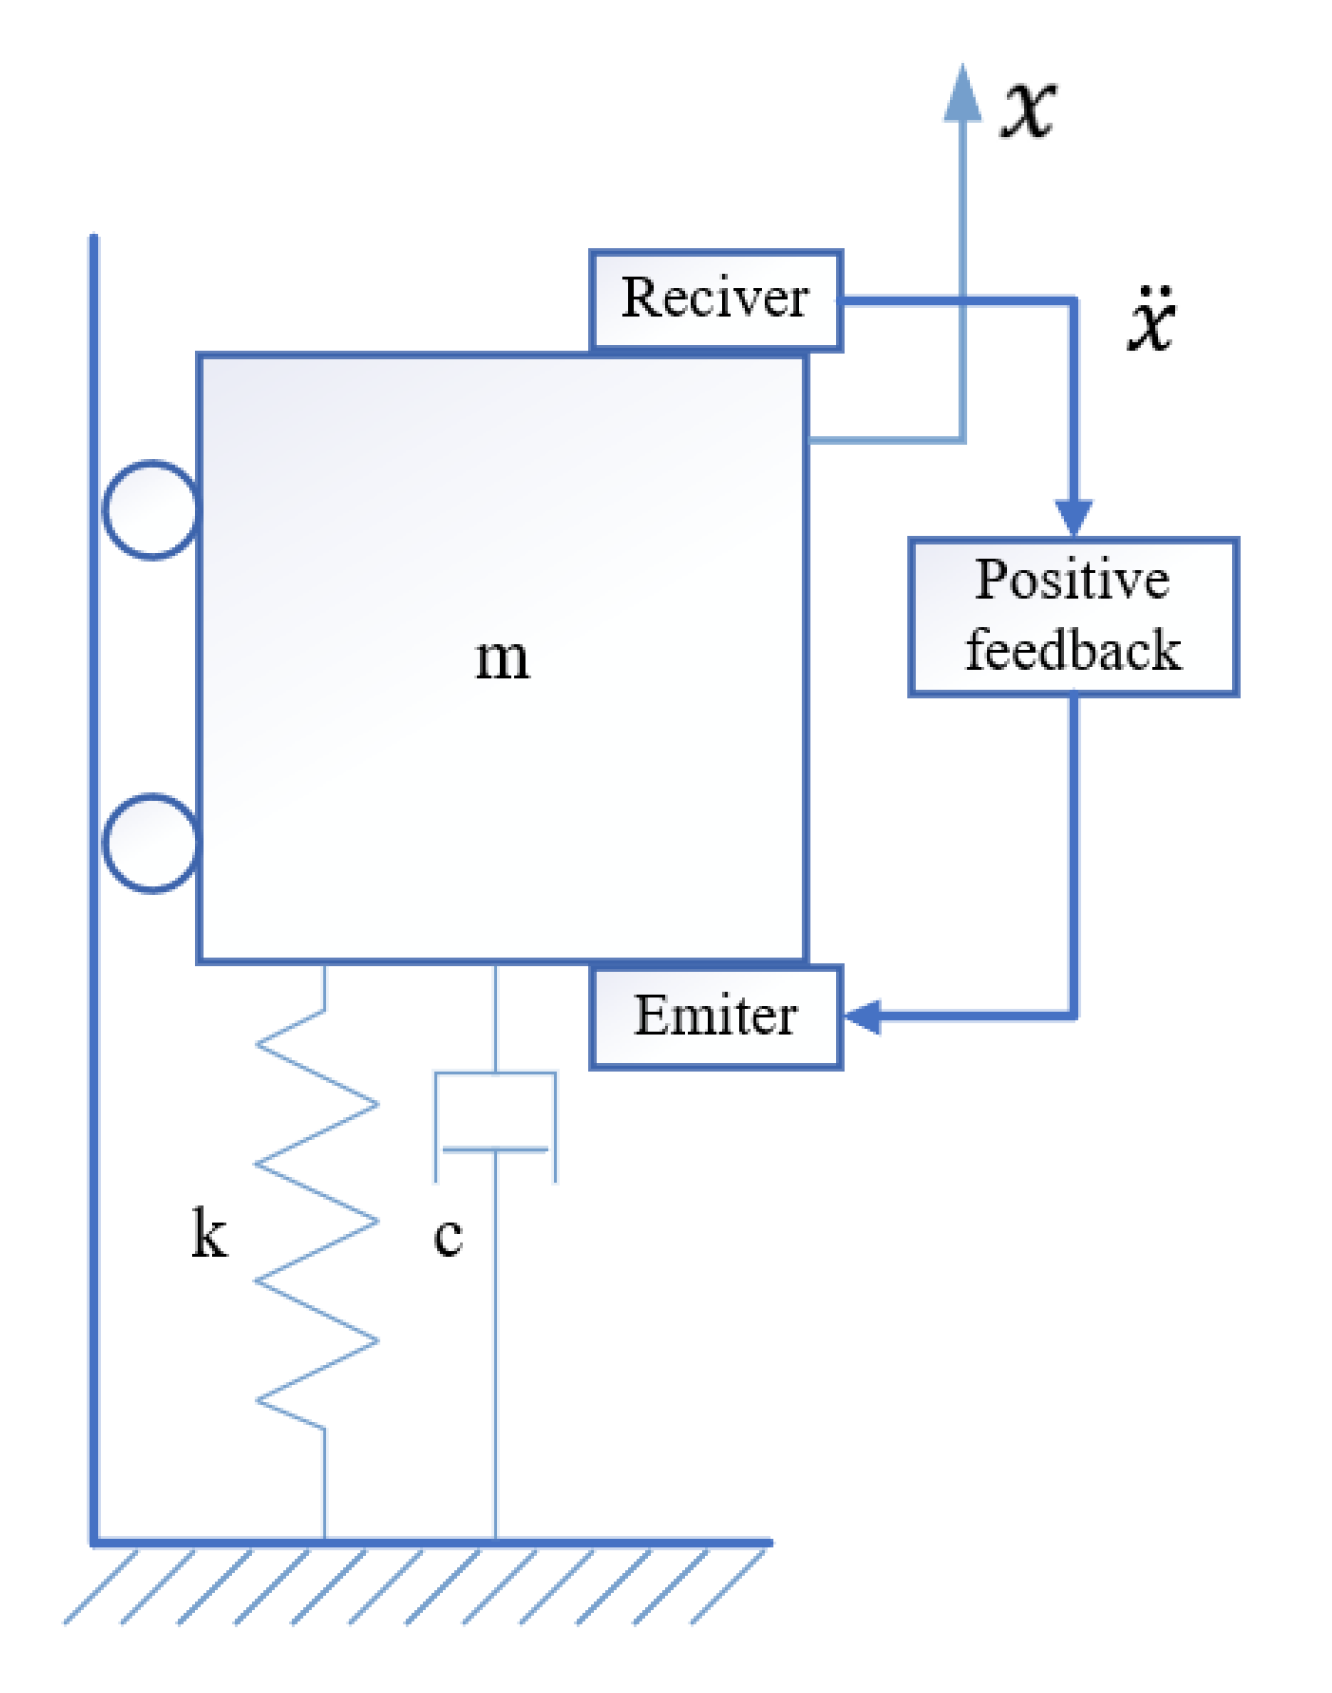
In order to model the system, a 1 degree of freedom system in the form of a damper spring mass system was used (
Figure 4). Equation (
1) is presented in non-dimensional form:
where
is the non-dimensional displacement,
is the nondimentional damping ratio defined by Equation (
2),
is the natural frequency of the system defined by Equation (
3),
is the delay between emitter and receiver,
t is the time and
is the feedback gain. The acceleration of vibrations of the system is measured by suitable sensors and sent to the controller to generate the actuation force. The control law (
u) utilizes the acceleration of the vibration delayed by the time
according to the Equation (
4).
The describes the sum of the delays, sum of the time of the acoustic wave propagation in the material, the processing time by the accelerometer, the processing time by all the electrical circuits and the FPGA computing circuit and the processing time of the emitter transducer.
The self-excited system independently selects its limit cycle at the appropriate gain. The task for an FPGA is not to select this gain but to limit the SAS system from moving to other forms of oscillation (to other limit cycles). Thus, it gives the control system interaction for particular mode according to the corresponding feedback filter:
where
c is the damping coefficient,
m is the reduced mass and
k is the reduced modulus of elasticity.
The assumed values of these parameters are shown in
Table 2.
Table 2 also shows the possible range of variation of the parameter values that guarantee that the limit cycle will be achieved.
The right side of Equation (
1) can be interpreted as the force generated by the exciter, which realizes the positive feedback by generating the previous signal received by the receiver, and the signal is further amplified by the gain
. The gain
depends both on the gain of the electrical part of the measuring circuit and on the gain of the acoustic wave in the tested material.
By transforming Equation (
1) by means of the Laplace transform, with zero initial conditions, Equation (
5) was obtained.
After converting to the spectrum domain and using the relation
s =
, the relation (
6) was obtained.
Then, the trigonometric form of the exponential part was used according to relation (
7).
By rearranging Equation (
2) into real and imaginary parts, the relations (
8) and (
9) were obtained.
After performing simple trigonometric transformations, Equations (
10) and (
11) were obtained. Their solutions combine the limit cycle frequencies with both the
delay and the feedback loop gain
.
This methodology allows explaining the frequency jump phenomenon in the study of thin structures. Both the delay and the gain of the mechanical part of the system are strongly quantized by the form of the natural vibration of the material under test. In some cases, when the SAS system is under special conditions, intelligent filtering is necessary because frequency jump can result in difficulties in interpreting the results.
3.1. Laboratory Tests
Testing of stress changes in the J64-27 anchor bolt support was performed using a laboratory test stand provided by the Faculty of Civil Engineering and Resource Management. This test stand is designed for testing of anchor bolts up to 6 m long. It is also possible to perform tests with dynamic load. The laboratory test stand consists of several components: Hydraulic Anchor Loading System (HULS), hydraulic power unit assembly, two control panels and measuring apparatus.
The Hydraulic Anchor Loading System (HULS) consists of a support frame on which a block of eight hydraulic cylinders is placed. The system is powered by a hydraulic power pack assembly (
Figure 5).
The construction of the hydraulic power pack assembly is based on a variable displacement multi-piston pump with constant pressure and constant power regulators. The hydraulic power pack tank, which has a capacity of 450 , is filled with HL46 hydraulic oil. The motor power is 18 kW, and the maximum supply pressure is 31 MPa.
The anchor tension is measured by using four evenly spaced strain gauges type KKM50-500kN on a pull-out measuring disc. The total force recorded during testing is the sum of the forces obtained at the individual force sensors. Measurement of anchor bolt elongation is carried out using incremental linear encoder HLS-S-10-01. Displacement sensor and strain gauges are connected to measuring amplifier QuantumX MX840A via 15-pin plugs. During anchor stretching, force and displacement measurements were recorded continuously using the CATMAN-EASY software. Additionally, a SAS measurement system consisting of a mechanical vibration exciter and receiver and a KMM40 clamp force sensor was attached to the anchor nut. Clamp force monitoring is performed on the FPGA operator panel. Recording of the SAS system measurement results is performed on the measurement computer using a measurement card, which is connected to the computer via a USB interface.
The block diagram of the laboratory station is shown in
Figure 5. A picture of the station is shown in
Figure 6.
The measurement involves increasing the tension of the anchor from 5 to 60 kN in 5 kN increments on an adapted test stand with simultaneous introduction of vibrations to the anchor by using an exciter. The response of the system is measured by an accelerometer, which measures the acceleration of the vibrations. Measurements are made for various configurations using digital filters.
The recording of the SAS system measurement results is performed using the same program written in the NI LabVIEW environment.
National Instruments DIAdem software is used to process the data obtained from the tests. The output signal recorded during testing is divided into fragments corresponding to the given specimen loads. The signal fragments are then subjected to a Fast Fourier Transform (FFT) in order to determine the frequency spectrum. After obtaining the frequency values for a particular configuration, the characteristics of vibration frequency changes as functions of a given load are prepared in MATLAB environment.
Tests have been carried out for an anchor type J64-27 with a length of 2.55 m differing in filter bandwidth or no filtering. The filtering of the signal is implemented by a control and measurement platform. The SAS measurement system was attached to a nut with a clamping force of approximately 450 N.
The first measurement was performed without any signal filtering. The signal waveform in
Figure 7 is characterized by numerous frequency jumps for lower stresses. The frequency stabilized only from about 44 MPa, increasing linearly in intervals. The only jump from frequency 5782 to 5908 Hz occurred at a stress of about 87 MPa. The jumps are apparently due to the lack of filtering applied during this measurement.
The measurement presented in
Figure 8 is made for the filter bandwidth set at 100–1000 Hz; there was only one frequency jump. It is not related to the operation of the filters, but more to the fact that the first sample was made for a system where the anchor did not have the backlash removed. Therefore, this changed the boundary conditions of the anchor mount, which affected the limit cycle frequencies. This is another positive feature of the SAS system when filters are used. When an anchor breaks or is destabilized at the rock mass (shell/cement/glue), the system could diagnose the loss of stability by analyzing the sudden change in frequency.
The curve in
Figure 8 characterizes one band within which the frequencies increase. During the measurement, the SAS system frequency increased by 88 Hz and was observed for a stress increase in the composite anchor by approximately 110 MPa.
This study demonstrates that the SAS system can be used in indirect measurement of stress in the anchor. The limit cycle frequency measurement indirectly indicates the stress state of the test material.
The effectiveness of intelligent filtering in eliminating the limit cycle frequency jump phenomenon was proven during laboratory tests. Tests conducted for other filter settings moved the SAS system into other limit bands corresponding to different mods of composite anchor vibration.
The laboratory tests, which were conducted under controlled conditions, produced some interesting conclusions:
Without the use of a filter element in the feedback loop, it is not possible to effectively evaluate the frequency spectrum of the SAS system because the system can switch between possible limit cycles in an uncontrolled manner;
The use of the filters allows determining the stress change in the anchor;
Since the anchor load was controlled by a second system, it was possible to conclude that, in the case of no anchor load/incorrect anchor attachment, the measured frequency differed significantly from the frequency measured for the stressed anchor.
These conclusions allowed the study to be transferred to a real mine. In this case, the anchoring conditions were unknown. Moreover, there was no other reference and non-destructive measurement system available that could provide information about the ceiling load or the condition of the anchor itself. There were also no measurements of the floor displacement since bolting. The primary purpose of this study was to perform a typing of suspected failed anchors based on experience gained during laboratory testing, and then to verify this typing by destructive methods.
3.2. Field Studies in the ’Wieliczka’ Salt Mine
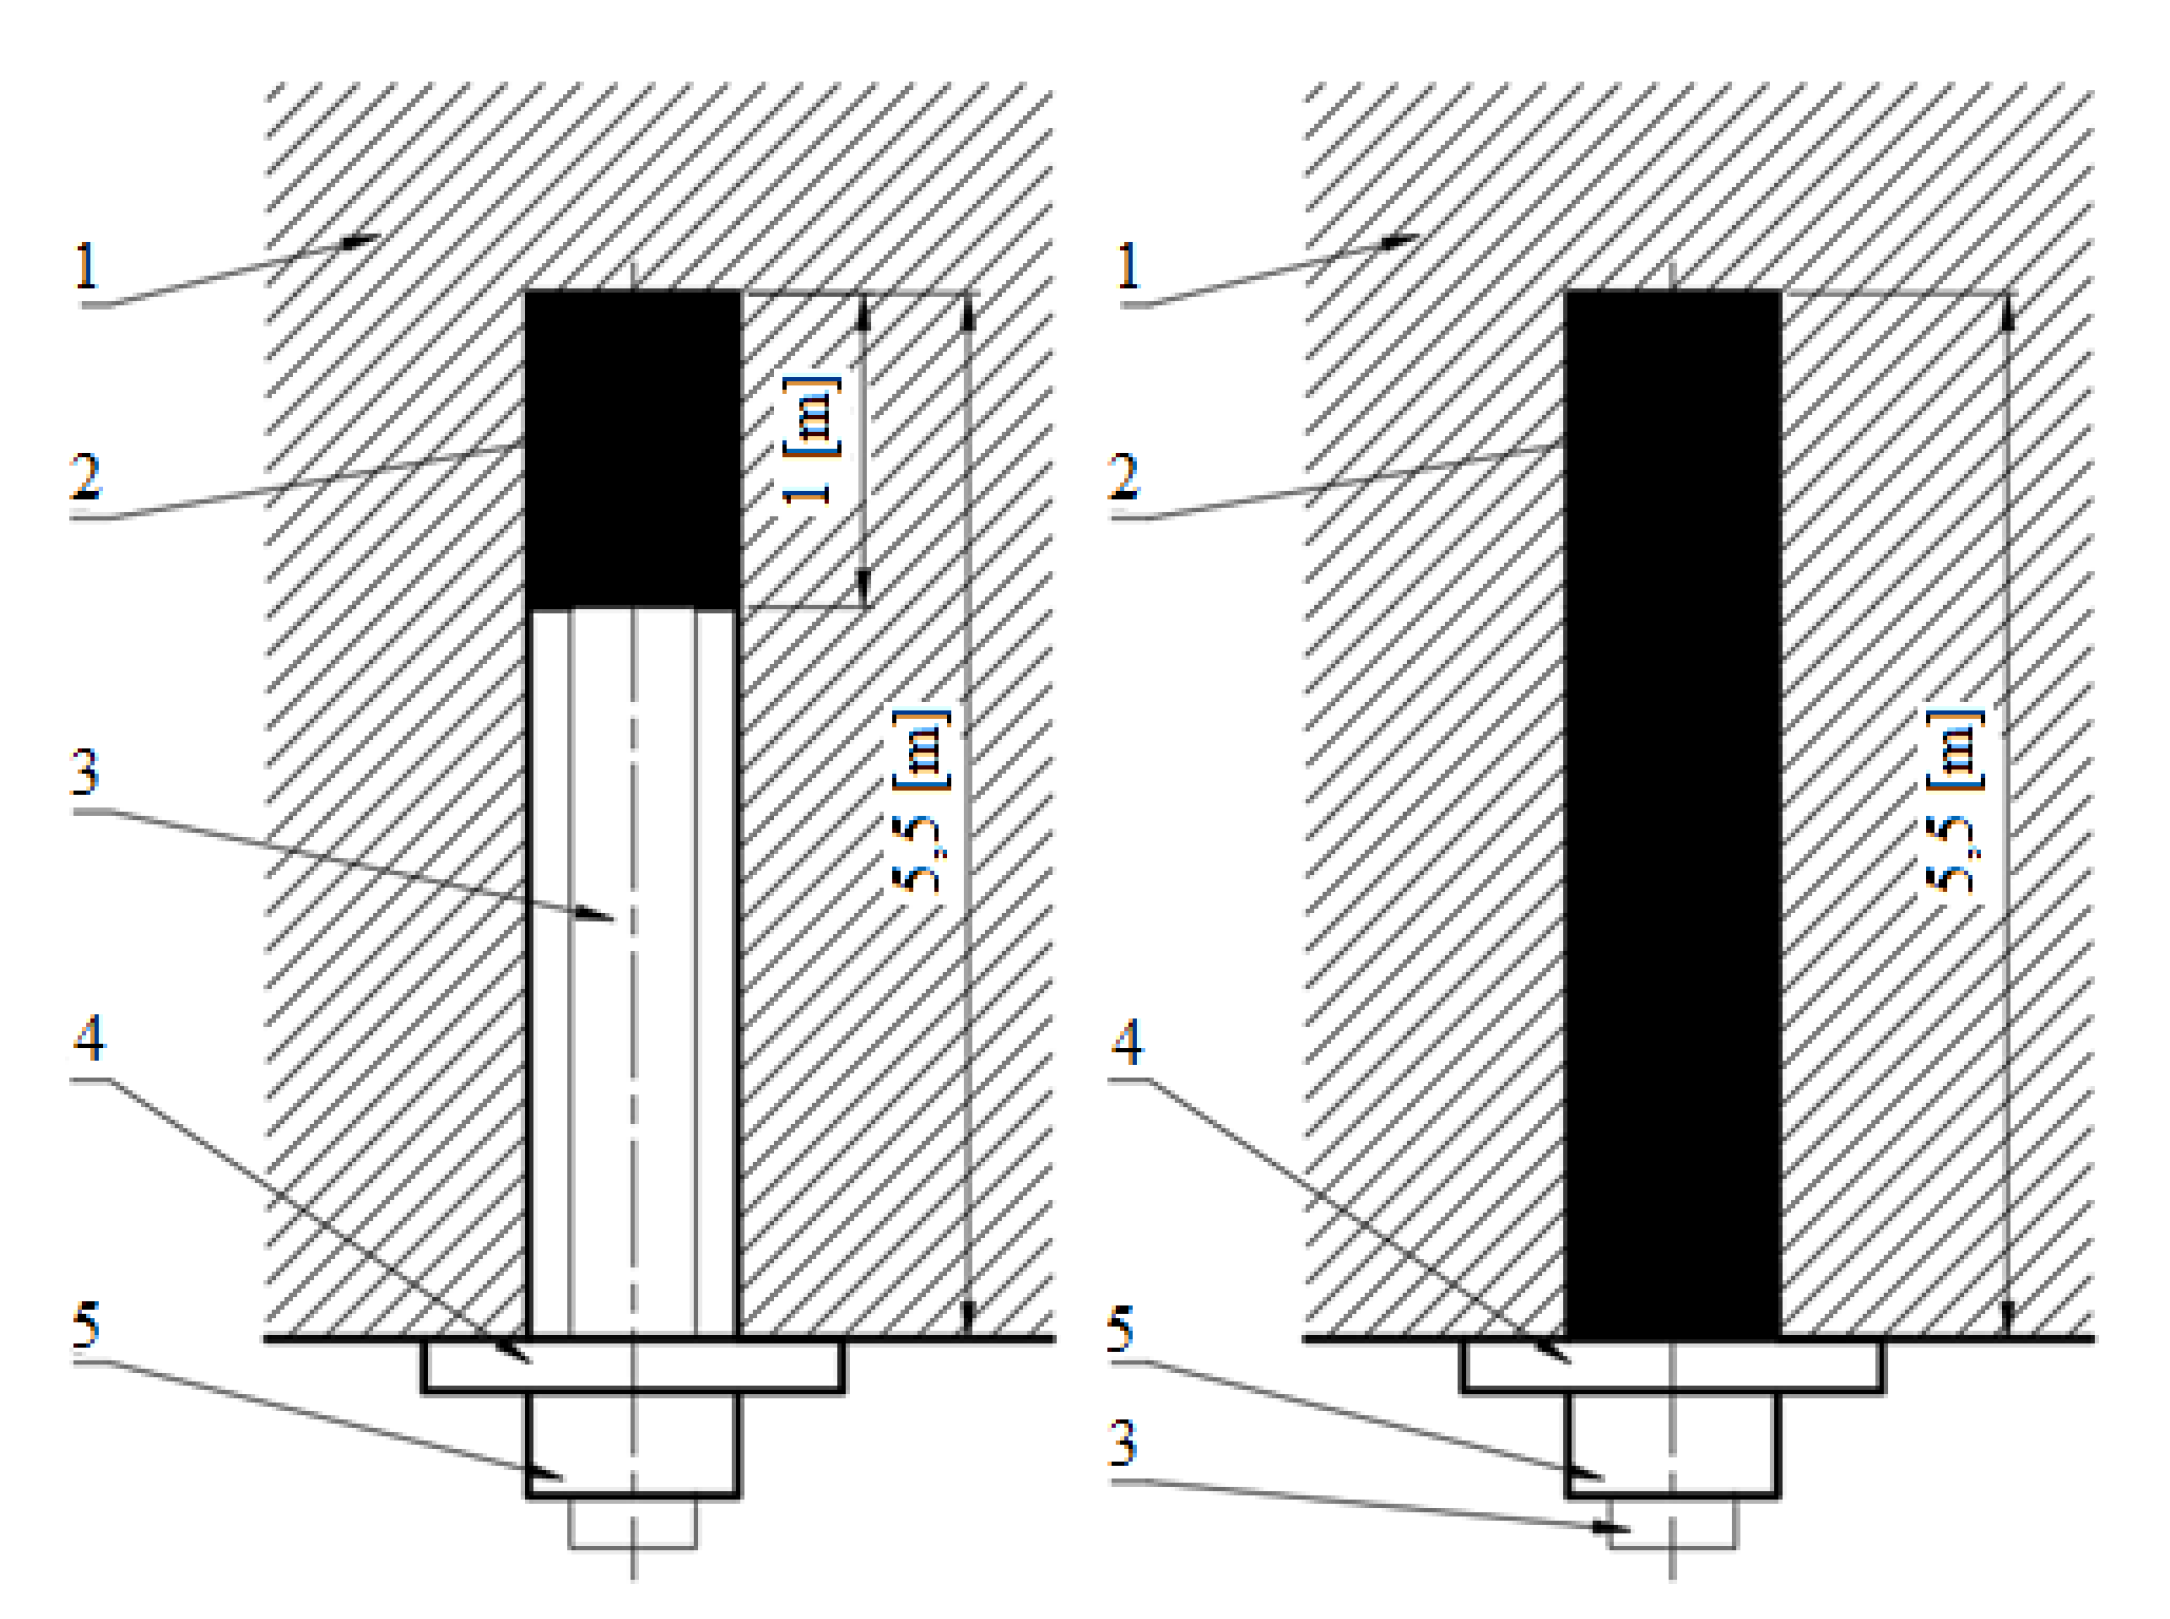
Further research was conducted in real conditions in the Wieliczka Salt Mine. Tests were conducted on the fourth level on Vernier longitudinal and Klein II transverse levels. The tests were performed on previously prepared composite anchor bolts type J64-27 (5.5 m long). A total of 10 anchors were tested, five per transverse. The anchor housings differed in the method of attachment. The anchors in the Klein II transverse were glued in for a length of one meter. The anchor housings in the Vernier longitudinal gallery were glued along the entire length of 5.5 m. A schematic representation of the anchor bolting is shown in
Figure 9 (left: Klein II transverse plane; right: Vernier longitudinal plane).
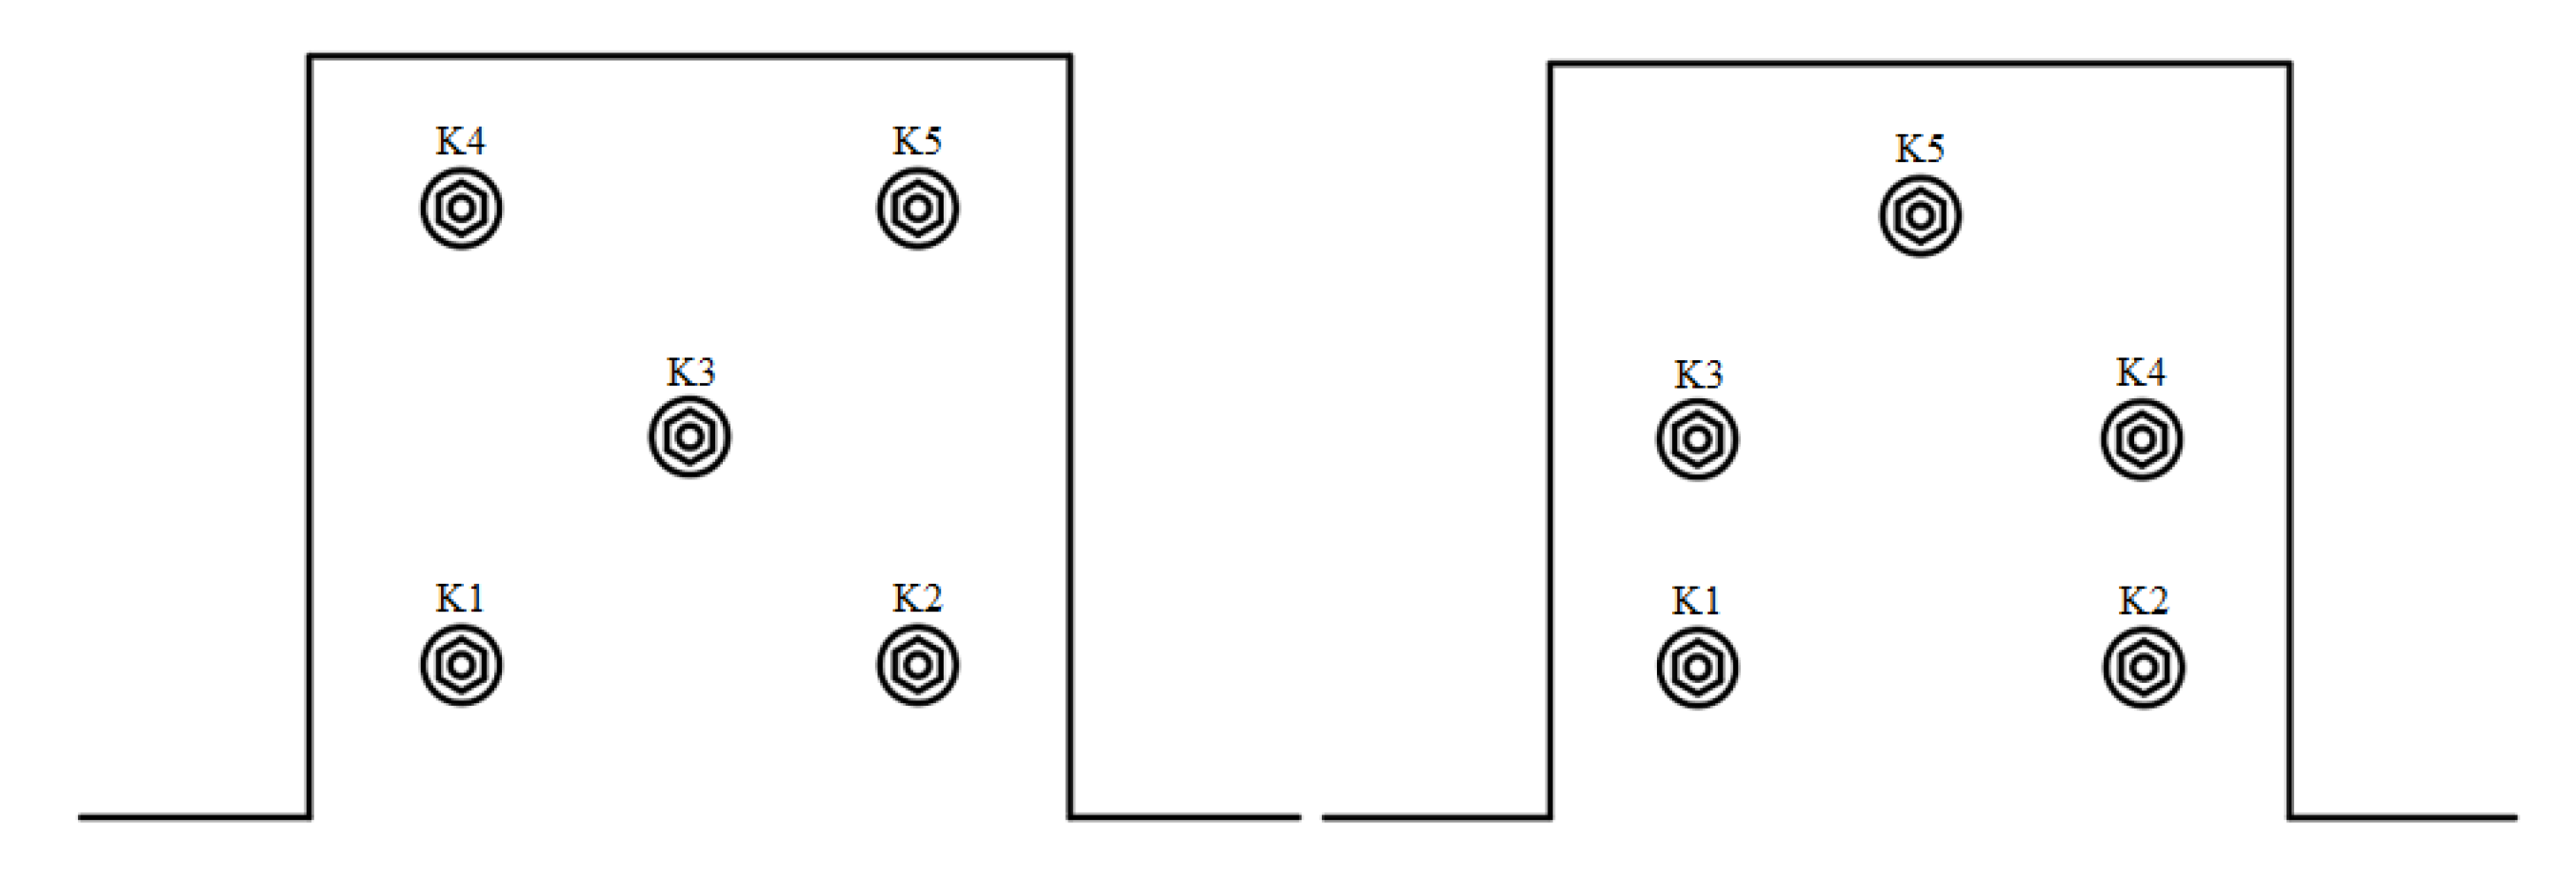
The tested anchors were labeled K1 through K5 for easier identification of the measurements. The anchors were spaced differently. A schematic of the anchor placement in the Klein II transverse and in the Vernier longitudinal is shown in
Figure 10.
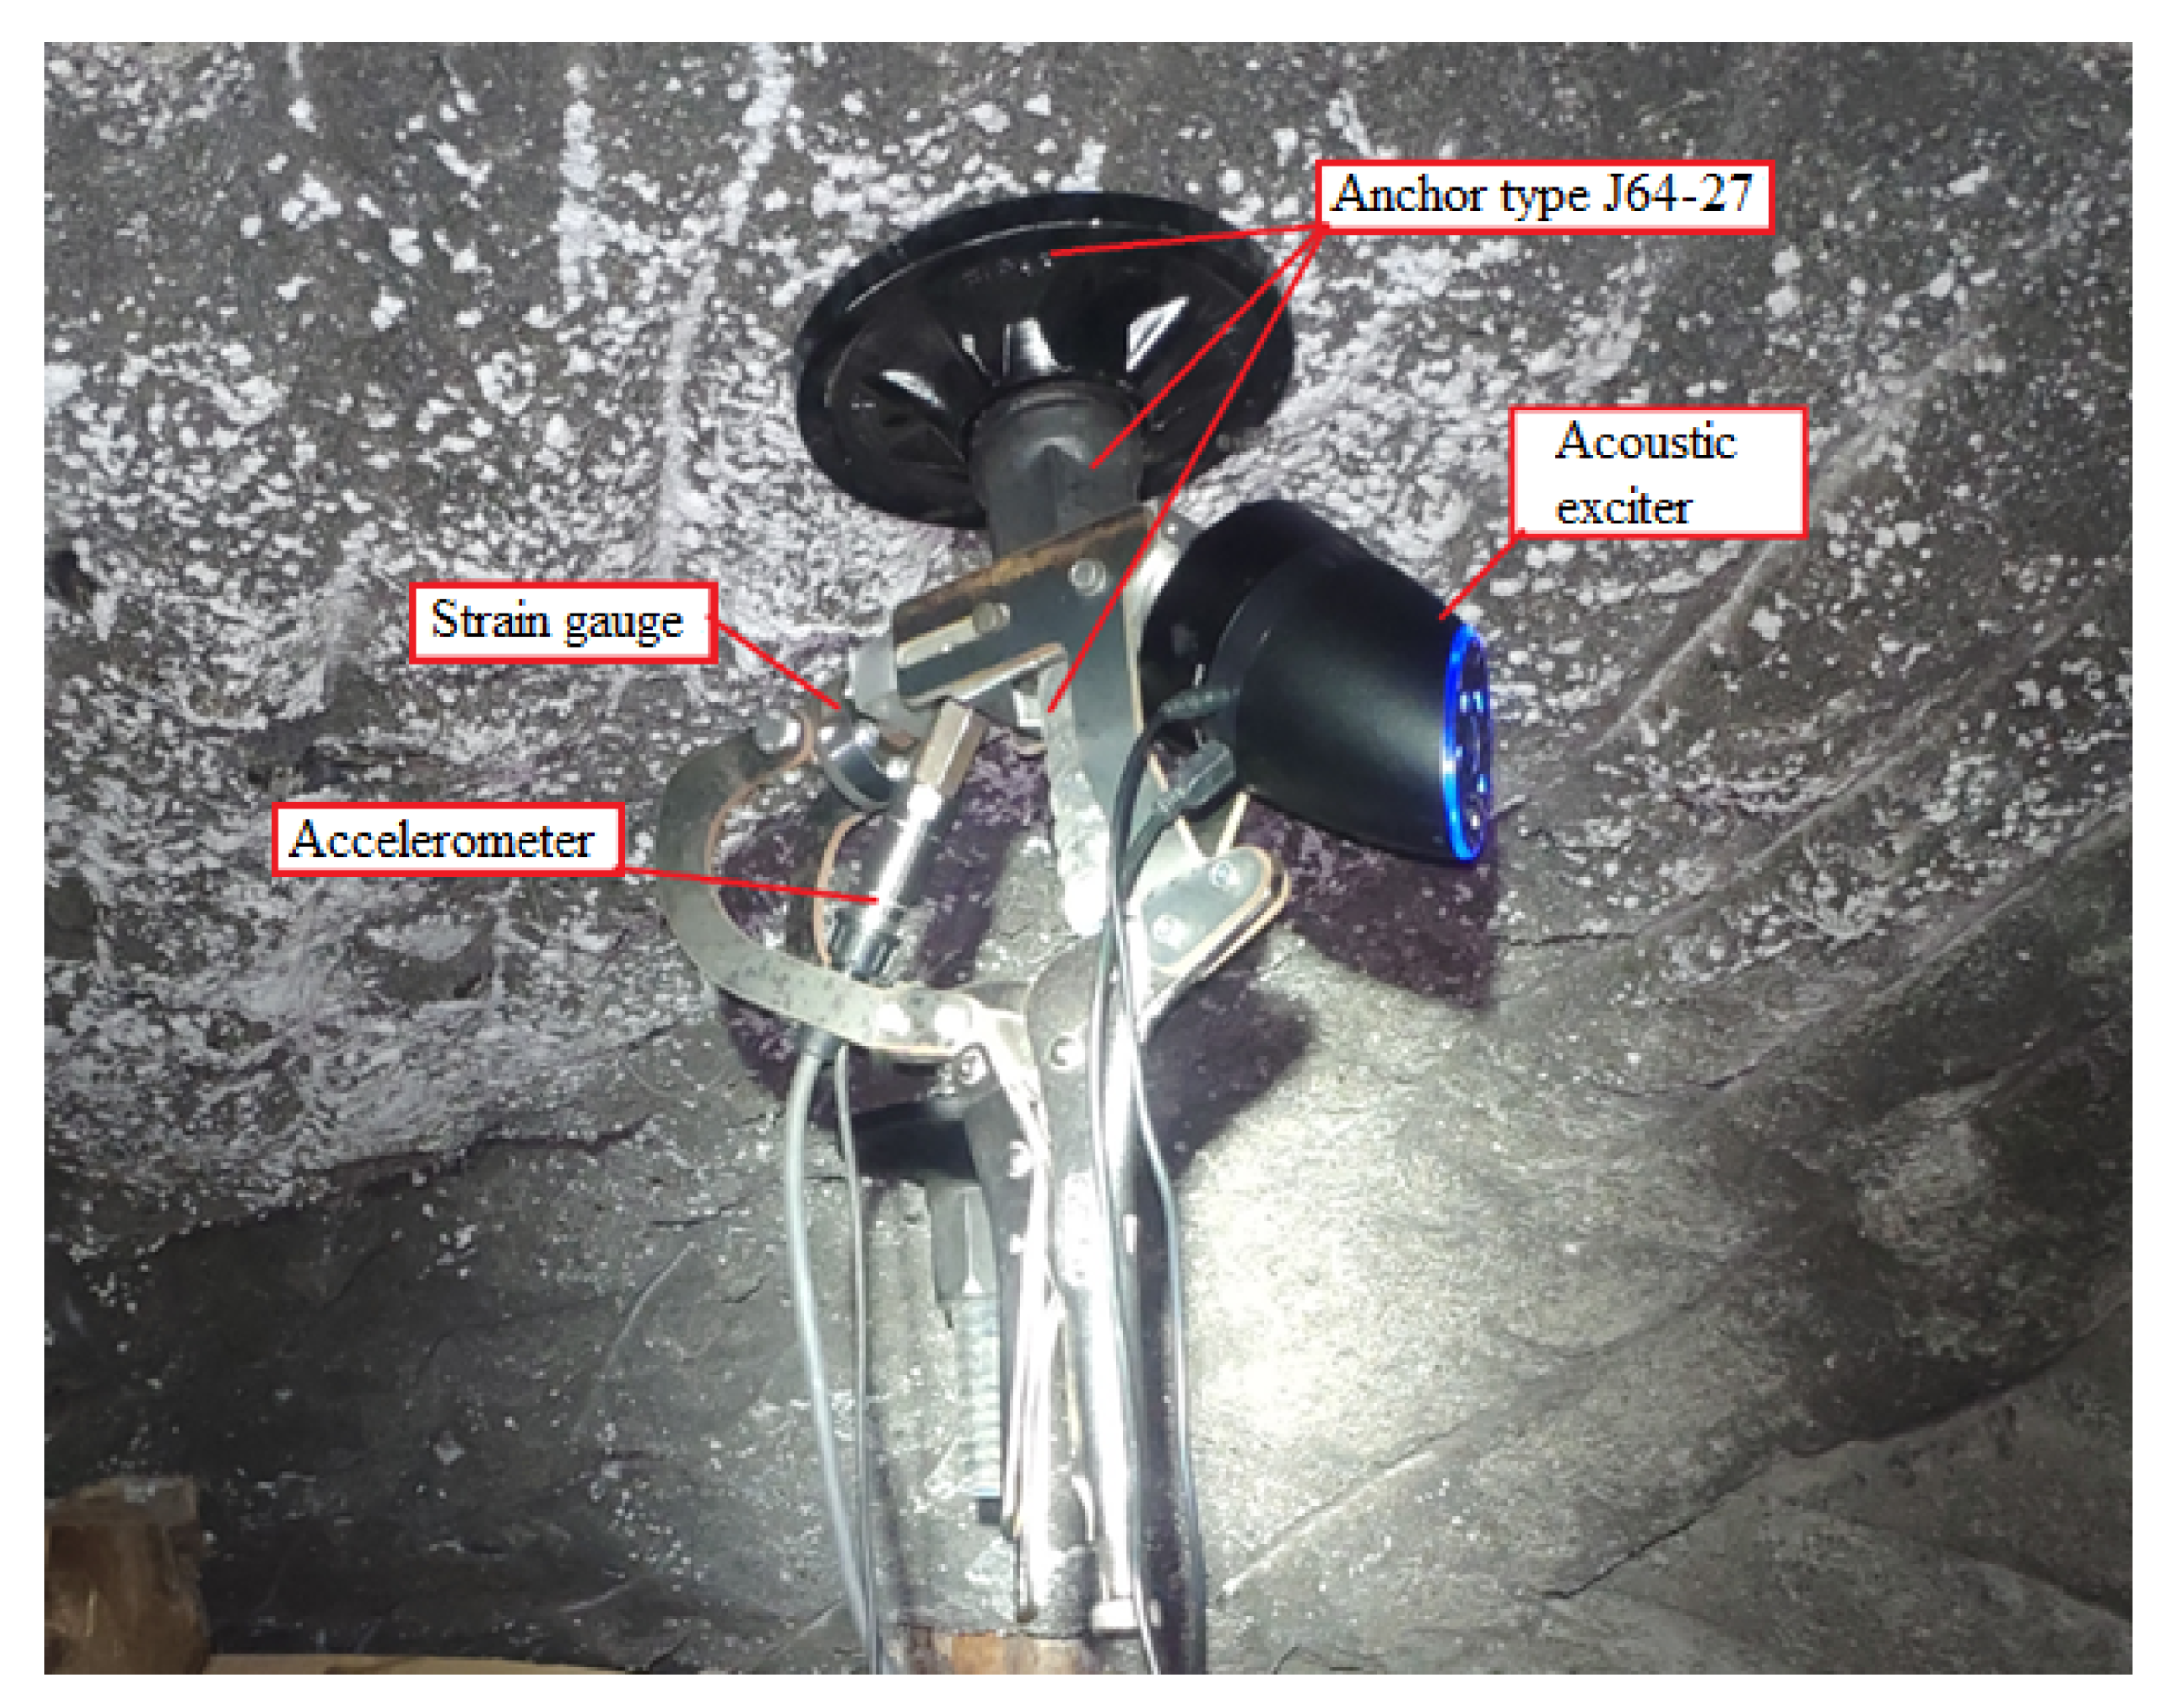
The measuring device consisting of a clamp force sensor, an emitter and a mechanical vibration receiver was attached to the nut of the bolt. A schematic diagram of the mounting of the measuring elements of the system is given in
Figure 11. It shows the location of the emitter and the mechanical vibration receiver, while the force sensor measures the clamping force of the emitter and the receiver on the nut. The nut is hexagonal in shape; thus, the measurements were performed in three positions. By changing the position, the measurement fixture was adjusted every 120 degrees.
4. Results
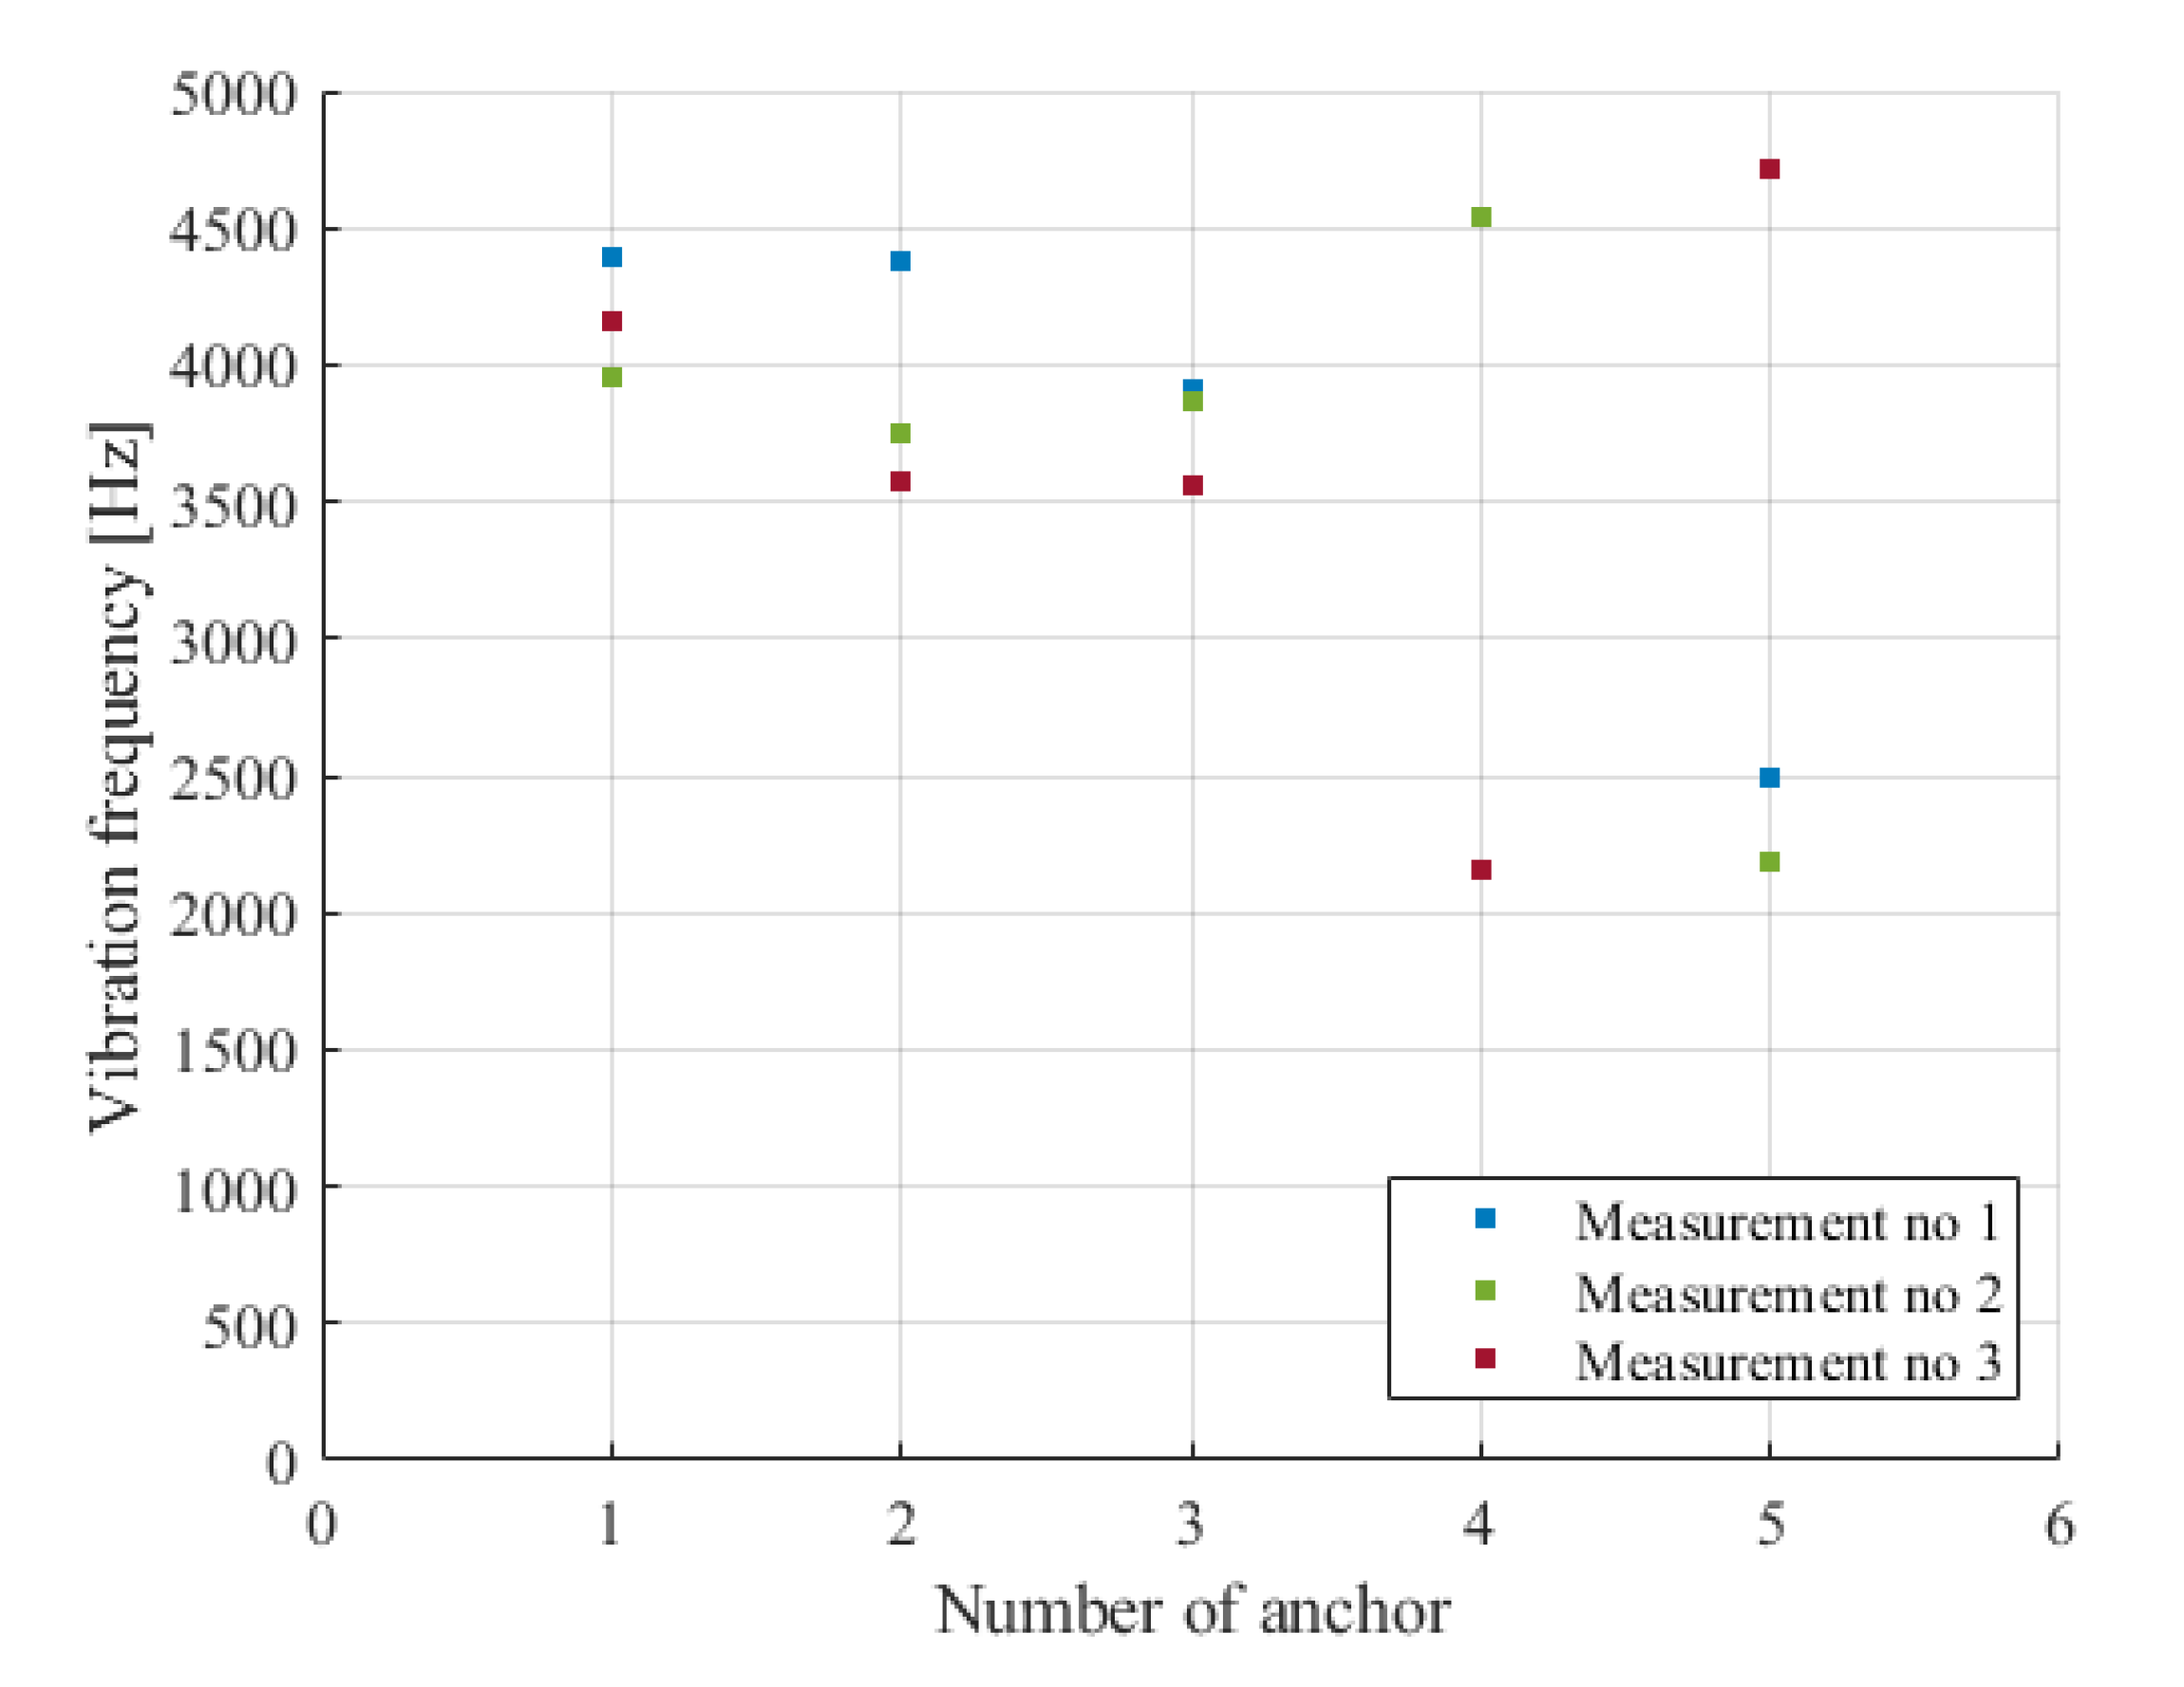
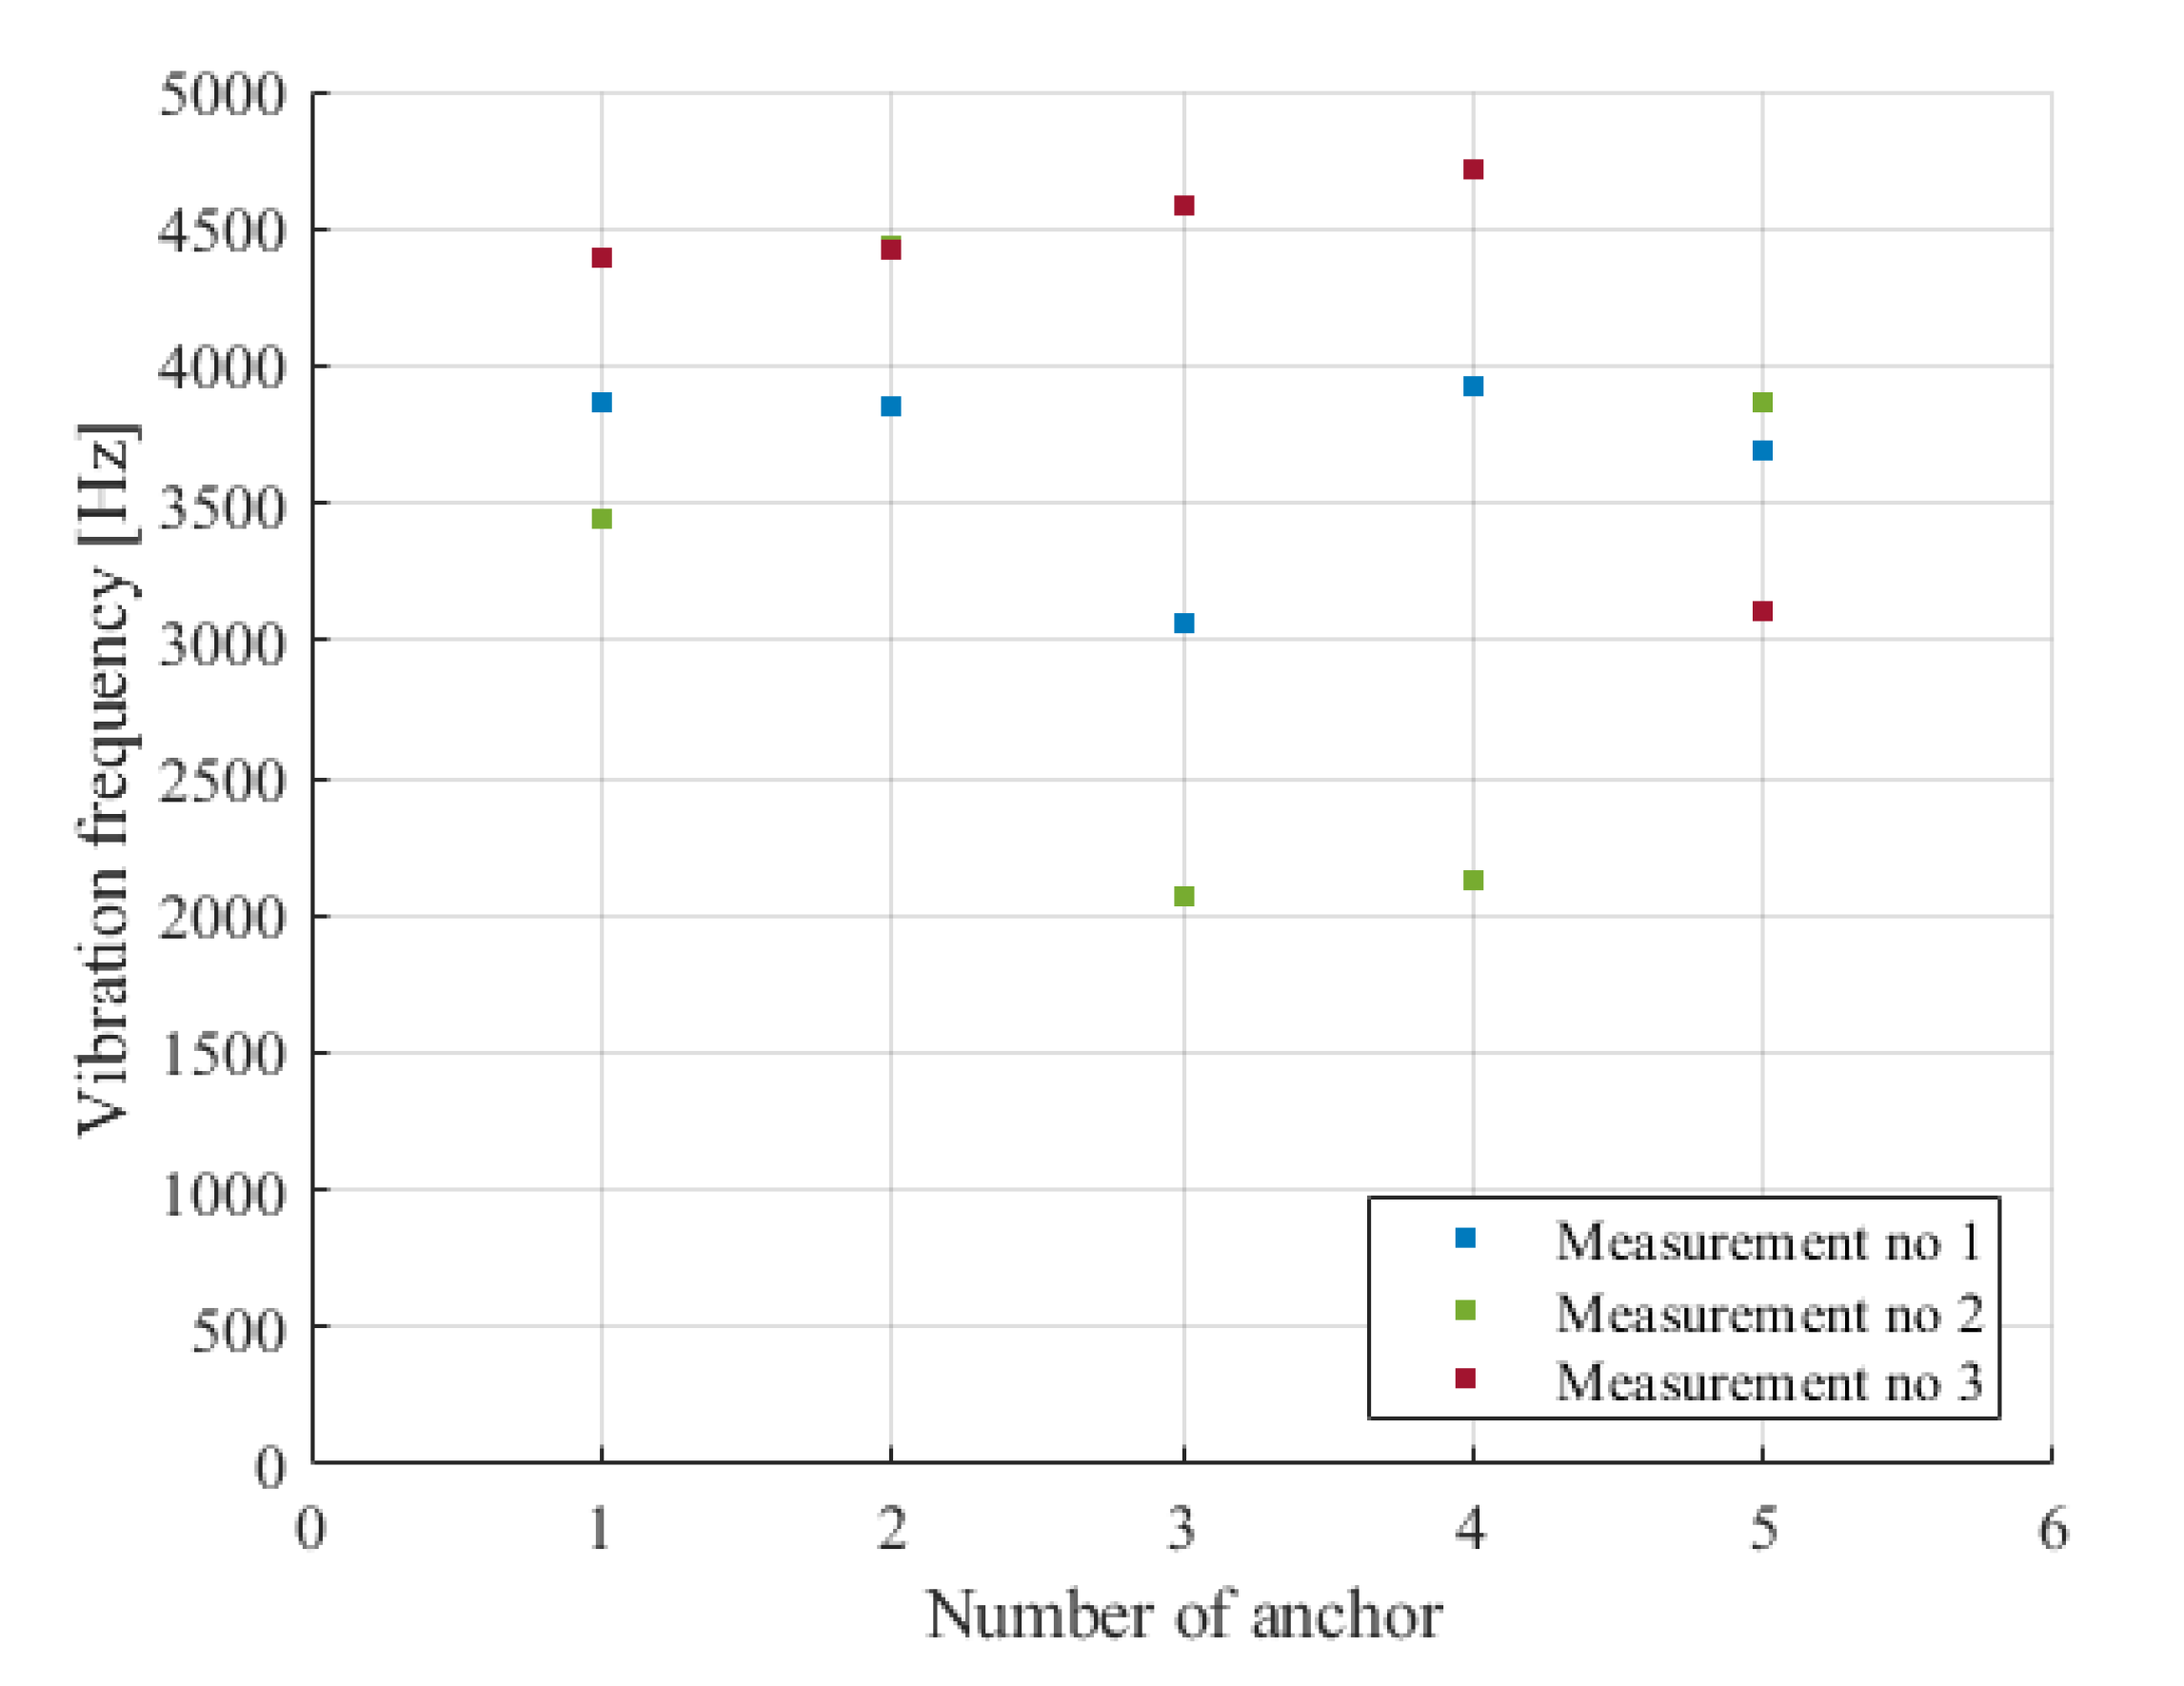
The proposed control and measurement systems were used during the research study on non-destructive evaluation of the load carrying capacity of mining anchors. During the tests, the signal initially sent to the exciter was not filtered. It was an amplified signal coming from the accelerometer. The results of the measurements are shown in
Figure 12 for the anchors fixed in the Vernier longitudinal shear and in
Figure 13 for the anchors fixed in the Klein II transverse. The vibration frequencies of the tested anchors mostly varied around 3800 Hz. Frequencies in the region of 4500 Hz and near 2100 Hz also appeared.
There was a large spread during the measurements. For both Vernier and Klein II sidewalks, the spread of results was in some cases above 2500 Hz. The NDT for the tested anchors was significantly difficult. Without using online filtering, it was basically impossible to determine the condition of any of the 10 test anchors. One reason for this was that, under mining conditions, it is even more difficult to have homogeneous anchoring and operating conditions for a single anchor bolt casing. It is also more difficult to satisfy a proper connection between an emitter and receiver heads and the bolt. This allows the system to switch more freely between limit cycles.
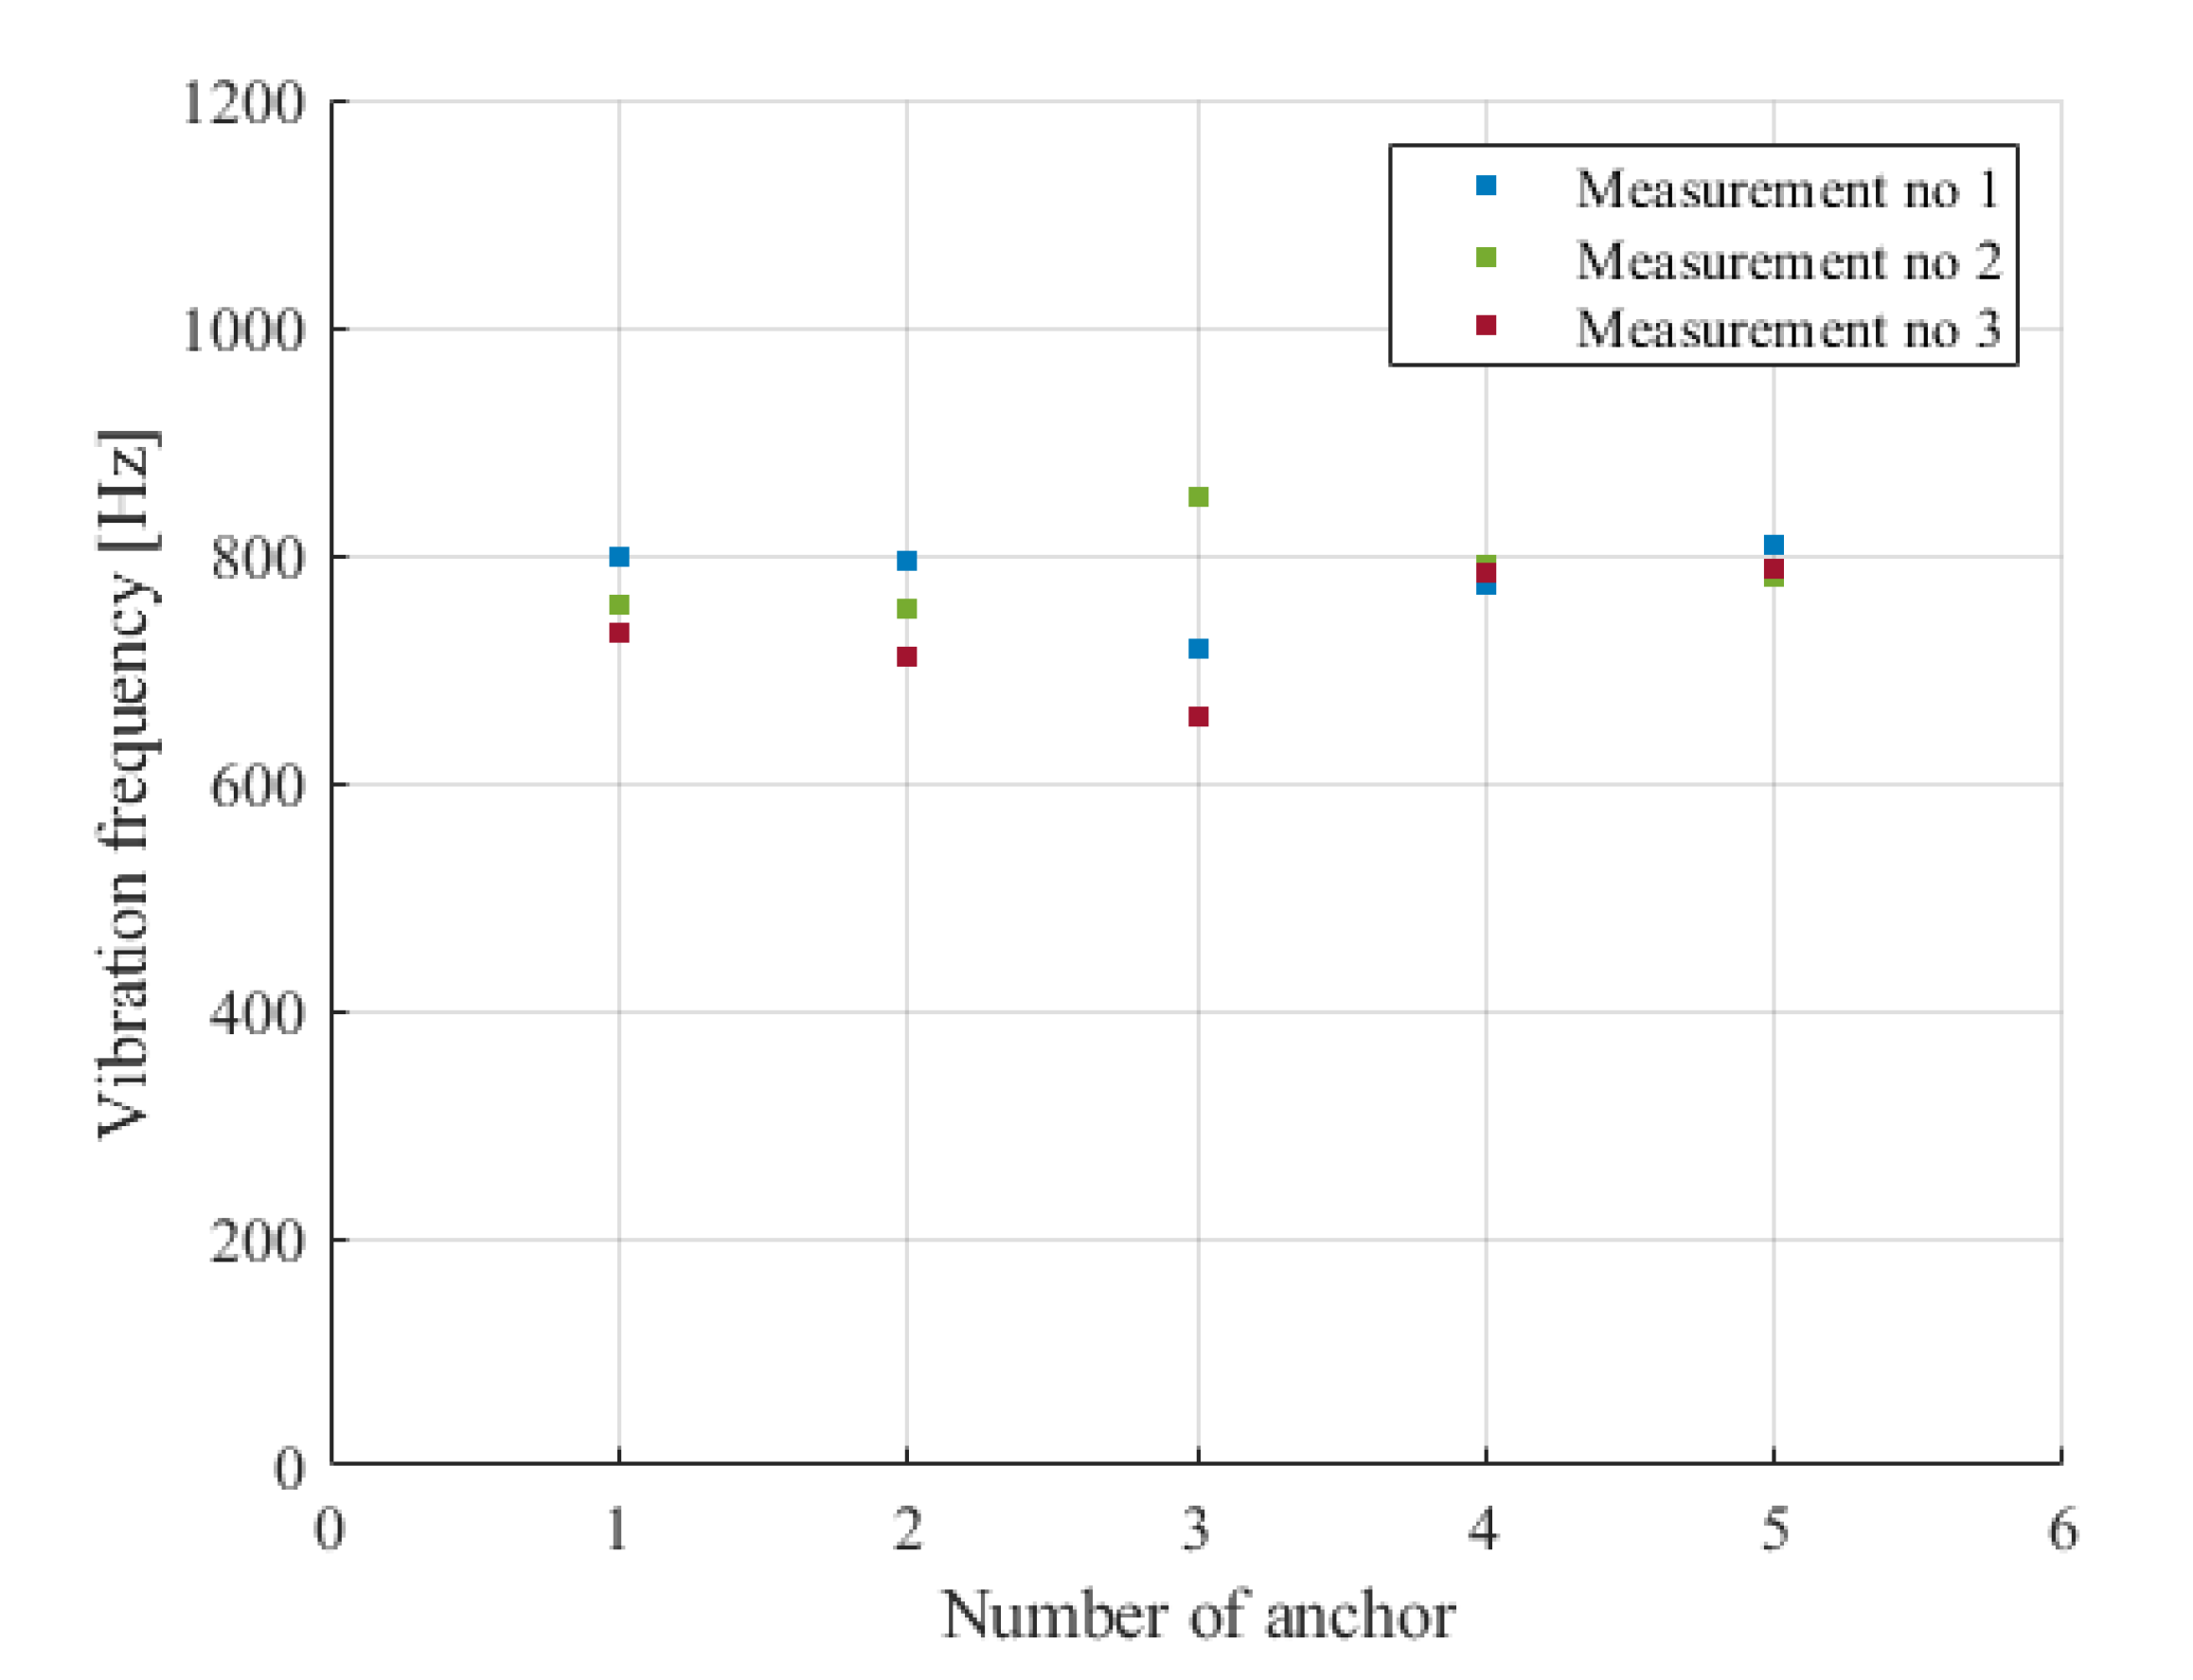
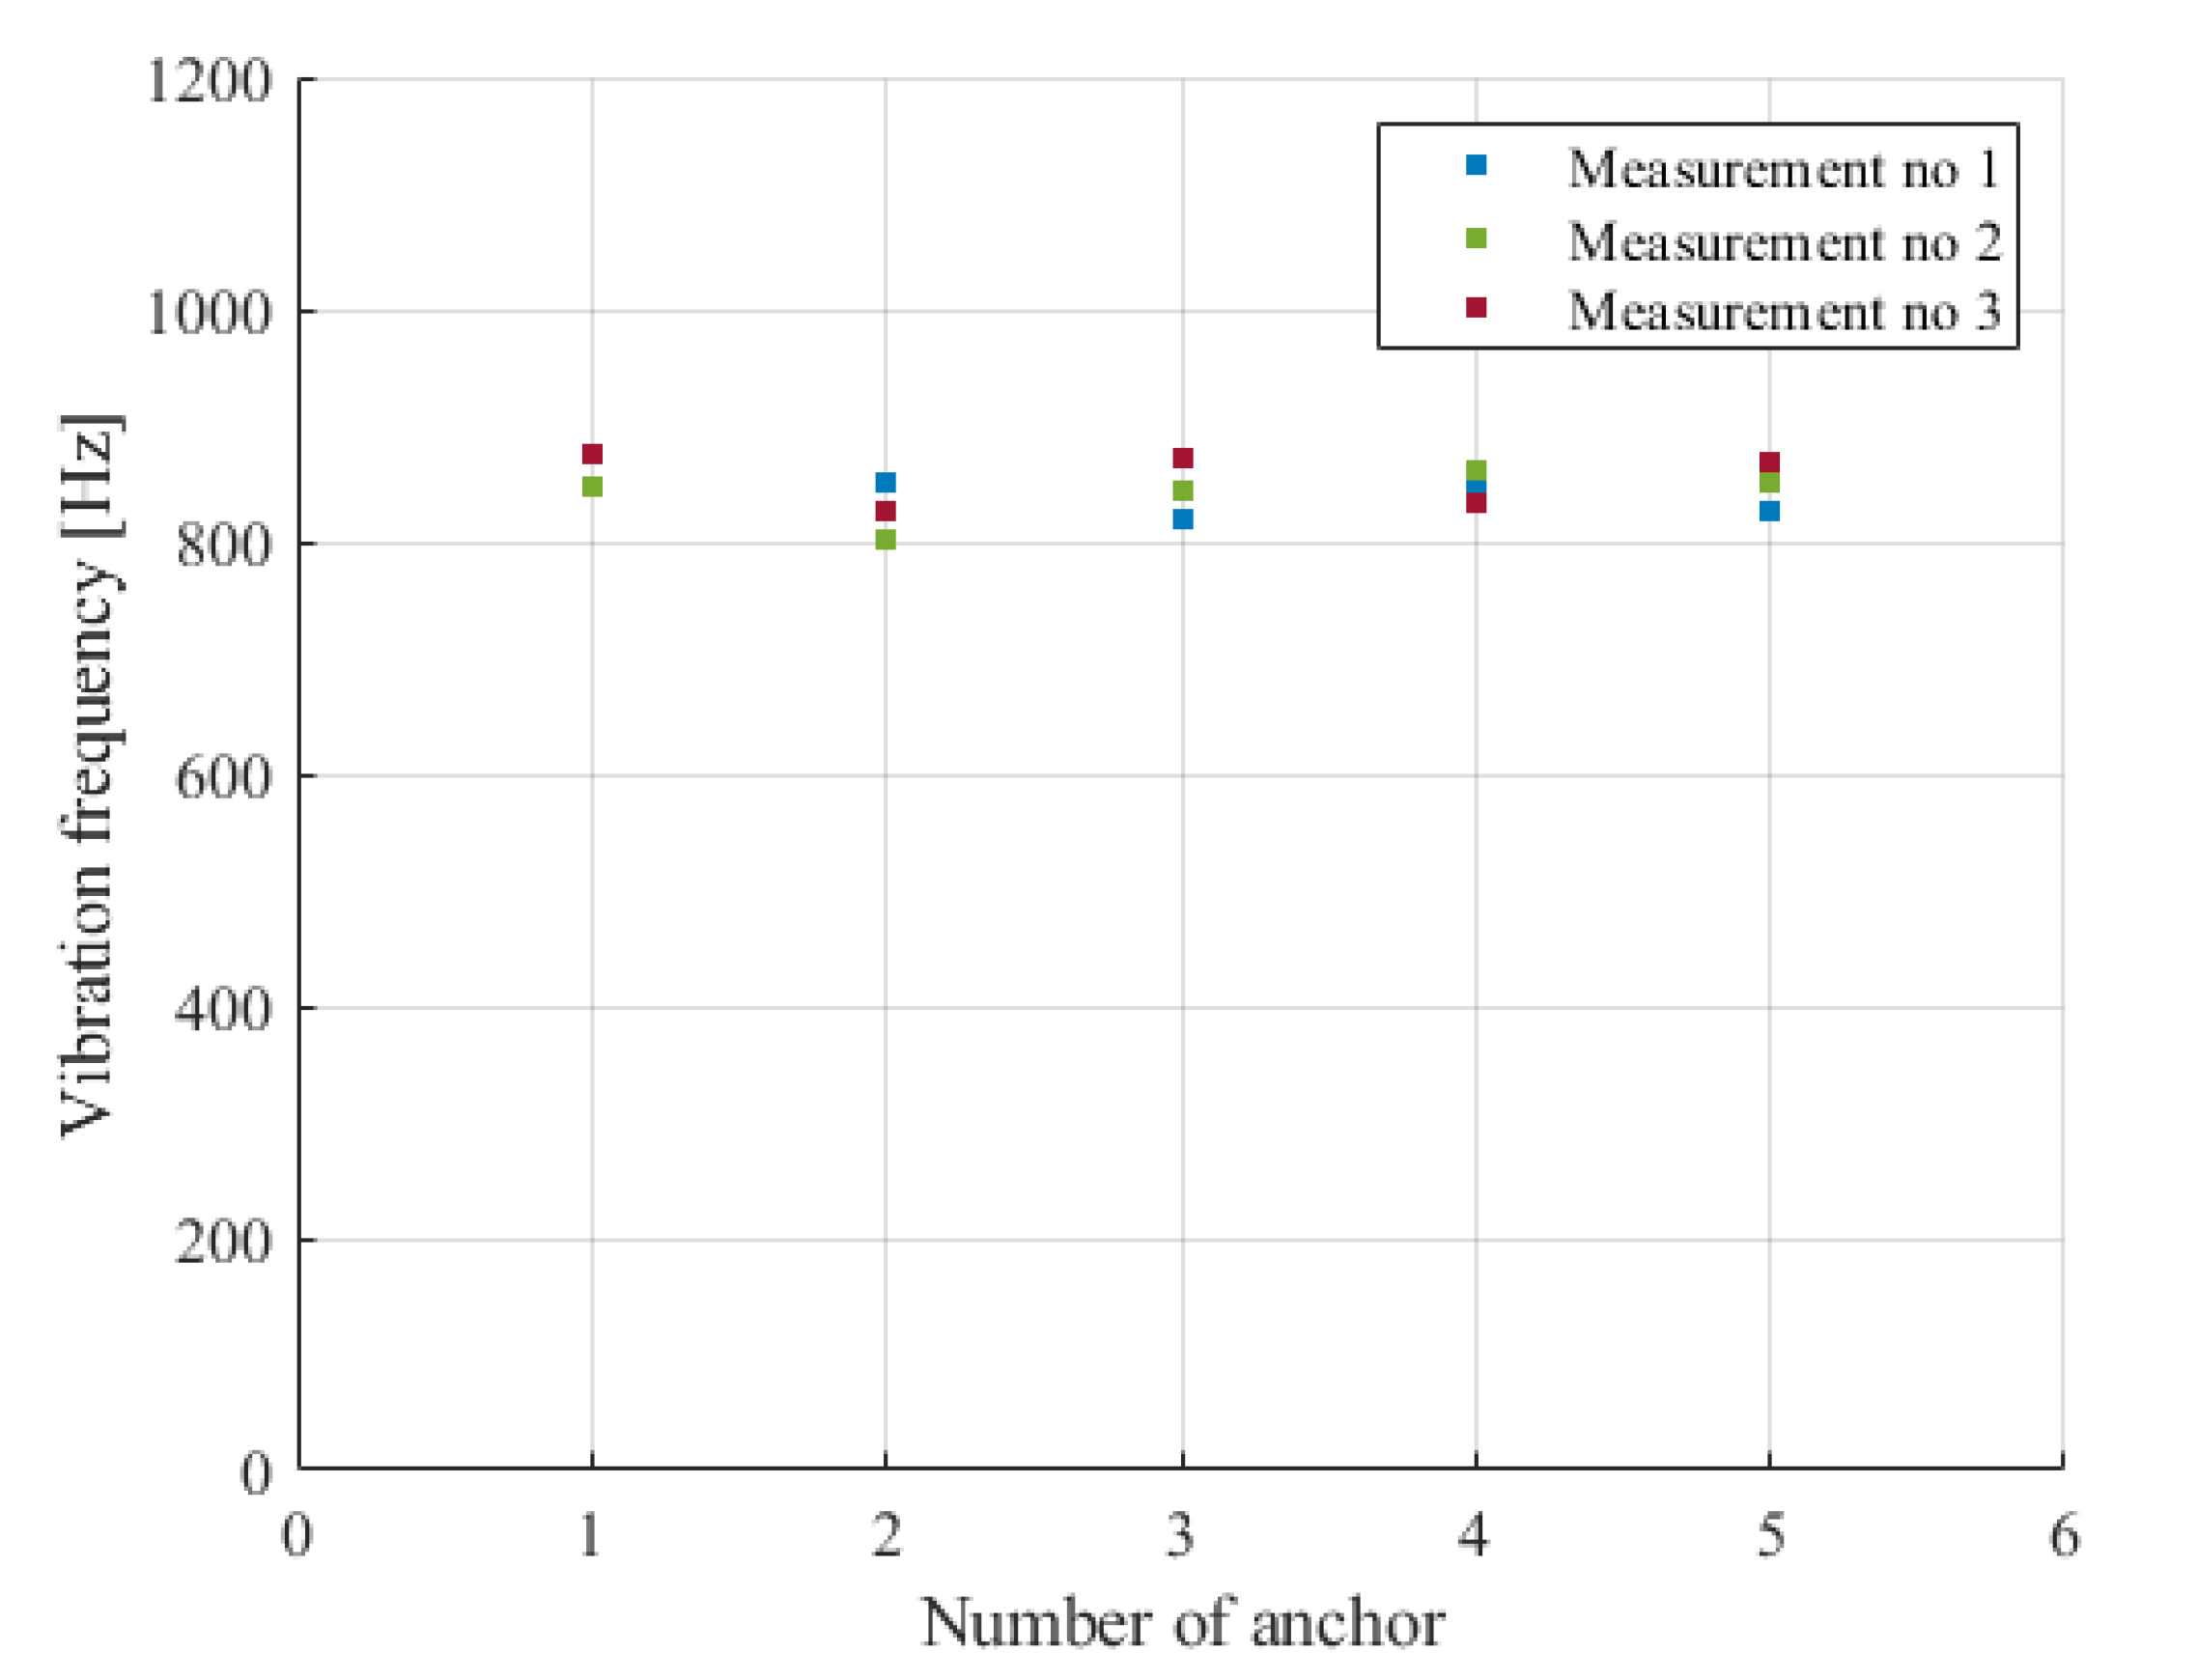
For this purpose, the filters in the FPGA were activated as in laboratory tests. The methodology of testing the anchors under mine conditions itself was the same. In this case, the amplified signal coming from the accelerometer was filtered before being transmitted to the exciter. During the measurements, the filter bandwidth was set from 600 Hz to 1 kHz. The results of the measurements are shown in
Figure 14 for the anchors fixed in the Vernier longitudinal gallery, and in
Figure 15 for the anchors fixed in the Klein II transverse gallery. When the filters were switched on, the distribution of the measured frequencies decreased. The measured frequencies were in the range of 600 Hz–1 kHz. Compared to the mine tests without filters, there was no large jump in the measured values—the system vibrated in the same limit cycle mode.
From the measurements, it can be observed that the greatest difference occurred at the anchor marked K3 in the Vernier longitudinal. The results of measurements of this anchor were significantly different from the others. The indication of “threatened” anchor could be observed only by using digital filters.
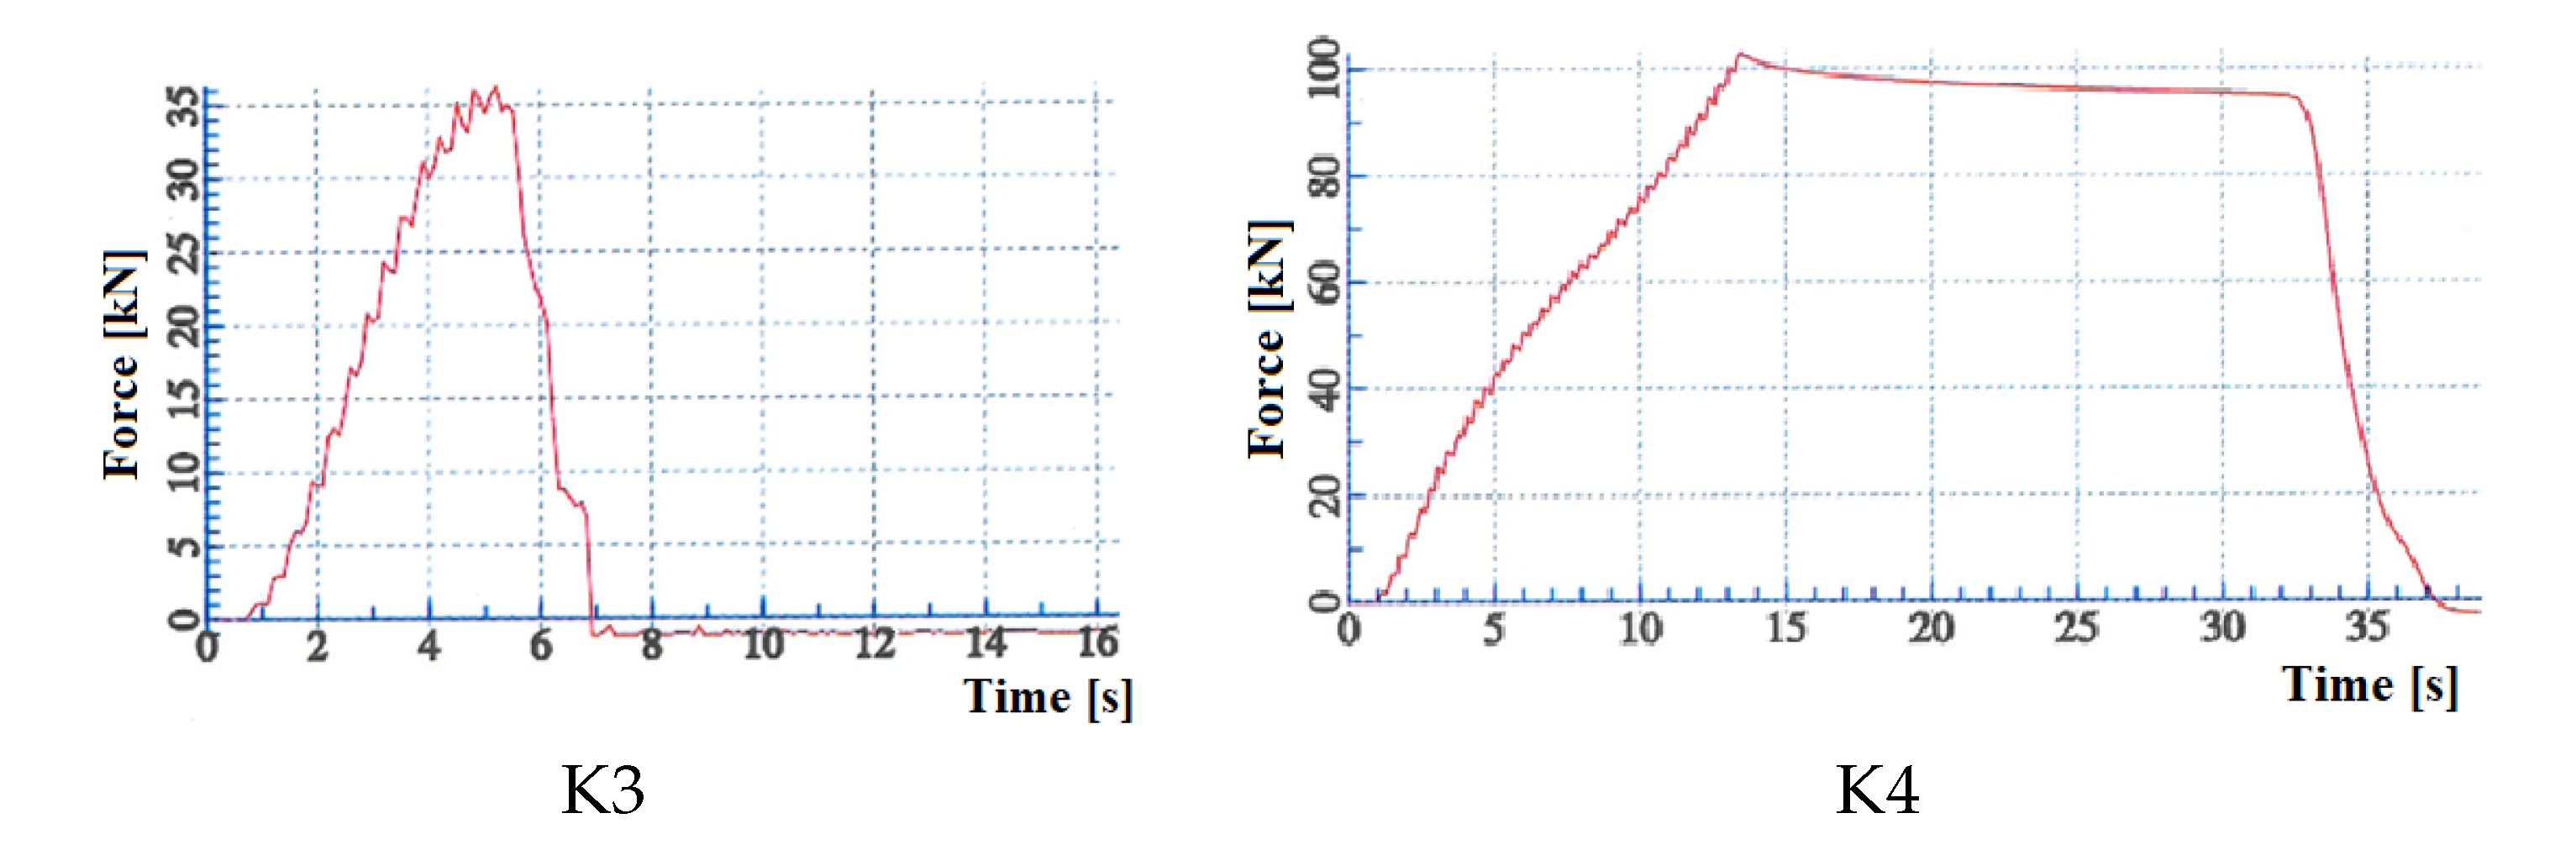
On the base of research carried out using presented measuring and control platform, K3 anchor from Vernier longitudinal gallery was selected for destructive testing. Testing was performed by loading the anchor with a force of 100 kN. During the tests the anchor was broken at the edge of the opening at a load of 36.2 kN. The load-time characteristics of the tested K3 anchor are shown in
Figure 16 (K3). For comparison, a test performed on K4 anchor from Vernier longitudinal gallery were shown in
Figure 16 (K4). Anchor K4 meets the strength requirements because it withstood a force of 102.9 kN.
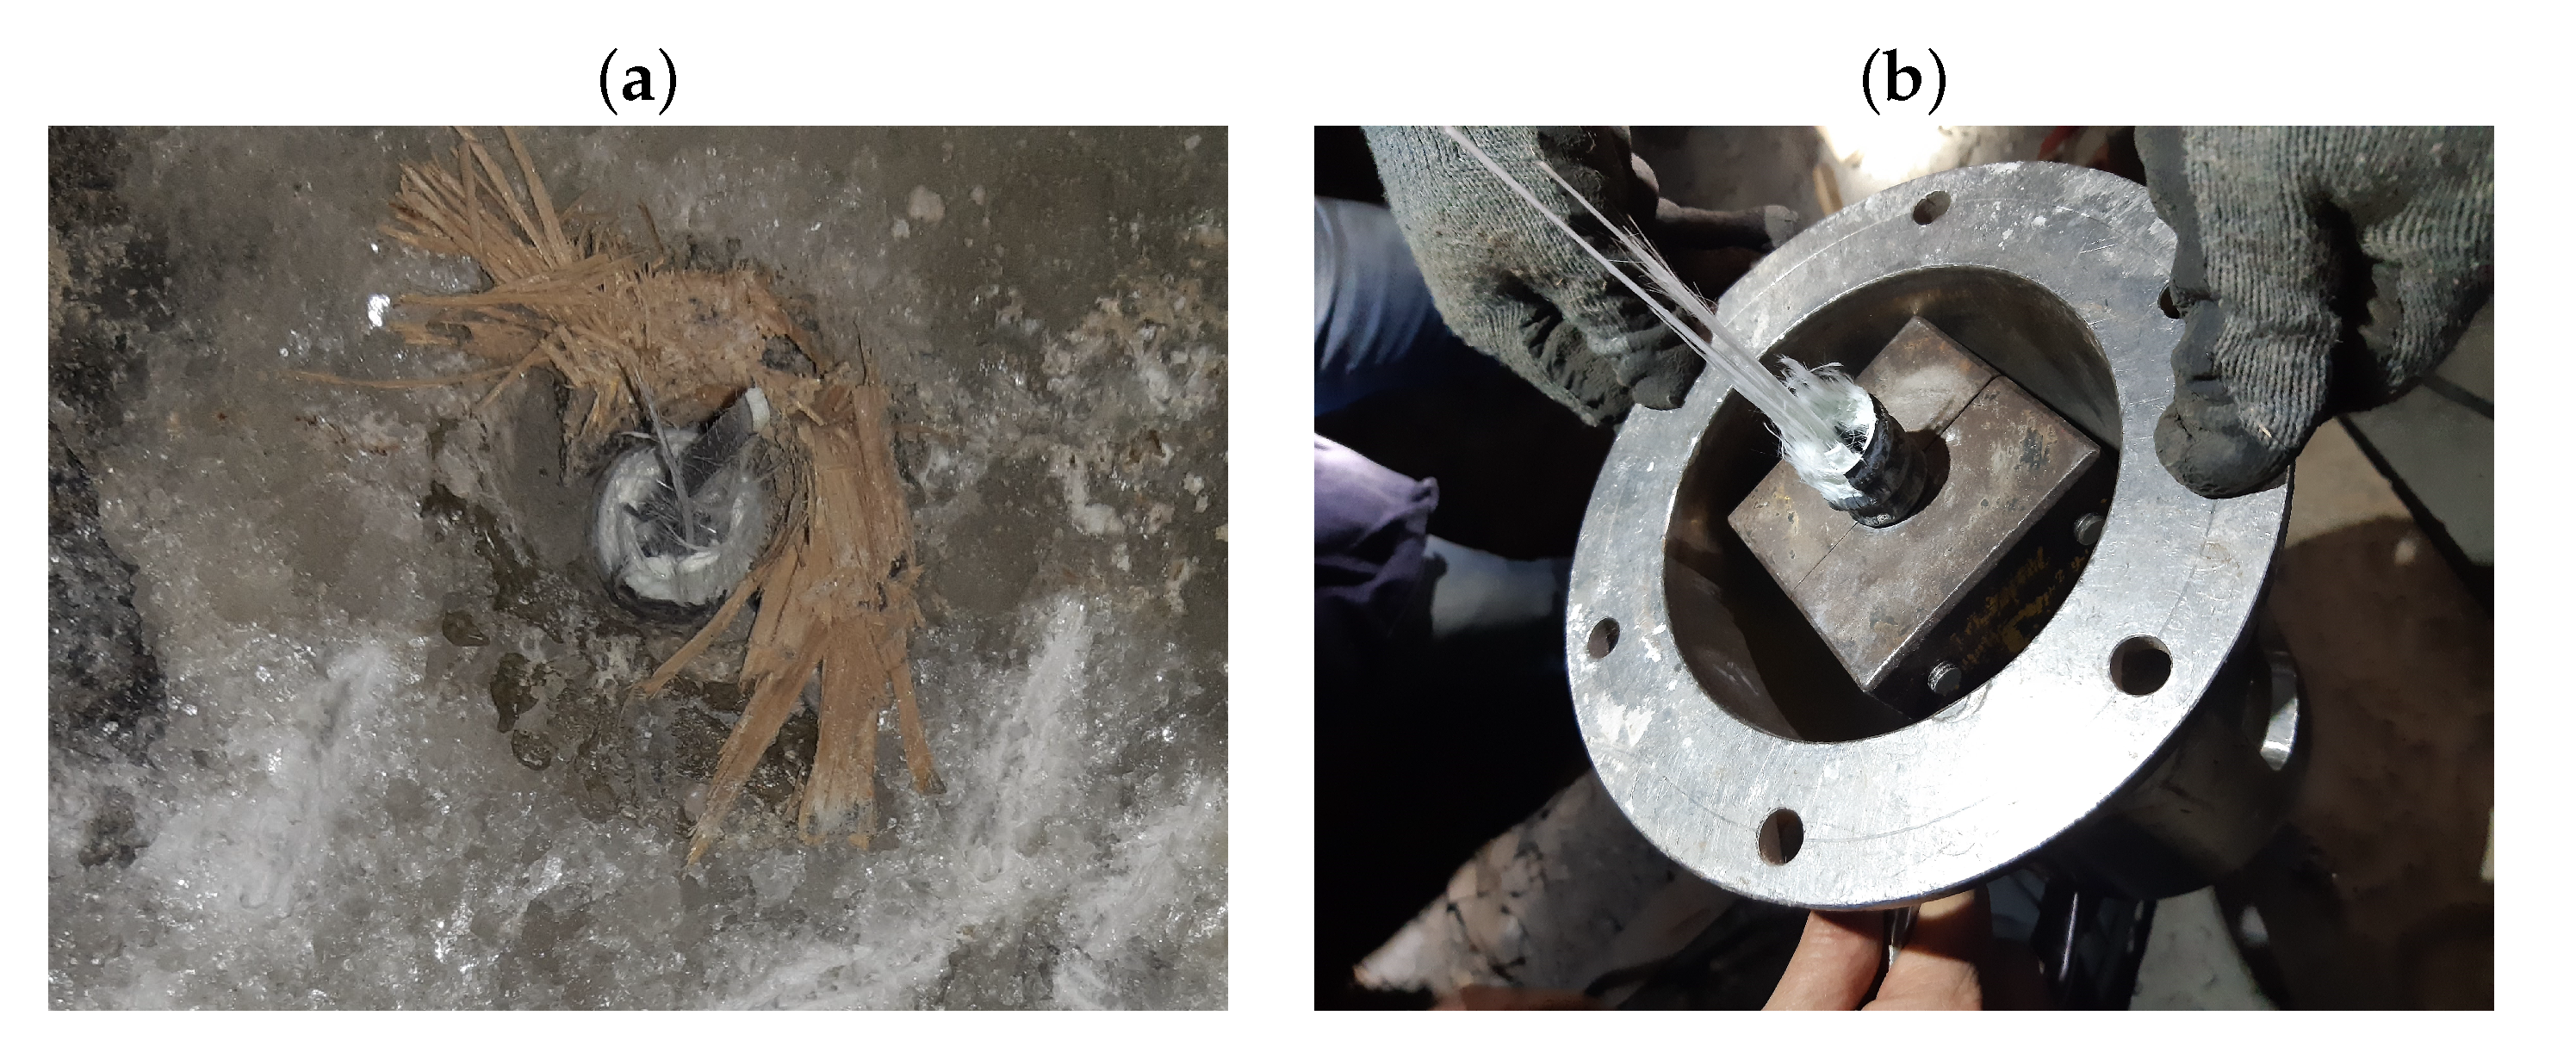
The view of the broken anchor shown in
Figure 17 explains the distribution of values for the SAS with filtration for K3. It shows the anchor was damaged during placement. A notch was formed on one side of the anchor at the boundary of the roof opening. Therefore, the anchor in the different directions of placement of the SAS system indicated different limit cycle frequencies. Thus, the anchor had a significant difference in load carrying capacity compared to the other nine correctly installed anchors.
It is important to note in this case the system correctly indicated the failure of the bolt itself and not as it was in laboratory tests at the attachment of the bolt to the rock mass. Thus, it is the third feature of the SAS system in NDT.
5. Conclusions
The proposed filtering system significantly facilitated non-destructive diagnostics of anchors using a self-excited acoustical system. Its use allowed for free analysis of the signal frequency spectrum. By implementing filtering in the assumed bandwidth, only the frequencies of one limit cycle are visible in the FFT spectrum.
This paper presents a model of a 1-DOF system in nonlinear control used to generate self-excited oscillations resulting in the determination of the relationship between the feedback loop delay and the frequency of this system. The determination of the loop delay time allows determining the frequency range for a given load range. This allows, on the one hand, determining the safe state in the sense of stresses. On the other hand, due to the use of filters in the feedback loop, such a determination of the frequency range can be indicative for other types of failures in the bolting. The SAS system reaches a limit cycle around the natural frequency of the element under test. This is due to the nature of the self-excited vibrations. Anomalies in the signal resulting, for example, from a bad bolting state, are exactly as in the case of free and forced vibration caused by a change in the boundary conditions. These conditions determine the absence/presence of free displacement and/or rotation of both ends of the anchor. This is very useful information because the large difference in the measured frequency of the SAS system provides an immediate indication of the loss of load capacity of the anchor. Thus, it determines the criteria of bolting failure.
The filtering system applied in the positive feedback loop of the SAS system works correctly. The developed solution made it possible to select a potentially damaged anchor, with measurement results clearly different from others. Destructive testing proved the effectiveness of the performed frequency analysis. Review of the test results without the filtering system was difficult due to the fact that the tested element had frequencies for many limit cycles.
The use of online filtering in the FPGA unit confirmed the feasibility of using the SAS system in a few areas:
Analyzing the quality of the connection between rock mass and anchor. It was successfully demonstrated that when anchor rupture or destabilization occurs, the SAS system can diagnose the loss of the anchor load capacity by observing the sudden change in frequency.
Indirect measurement of the material stress state. Laboratory tests proved that the SAS system can be used in indirect measurement of anchor stress. It is possible to calibrate the system in order to determine the current anchor load based on the measured frequency without a reference system.
The initial indication of defective anchors. The correct identification of the ’at risk’ anchor was performed on a blind basis. None of the article authors were present during the preparation and fixing of the anchors, yet the system successfully indicated the damaged anchor.
The effectiveness of the system was confirmed not only in the laboratory conditions but also in real mine conditions, which is undoubtly an advantage and novelty in the field of non-destructive testing of anchors. Currently, work is underway to further develop the presented filtration system using Artificial Neural Networks in the autonomous selection of the filtration band.


 ,
, 


