
An Accurate and Efficient Fitness-For-Service Assessment Method of Pipes with Defects under Surface Load


Abstract
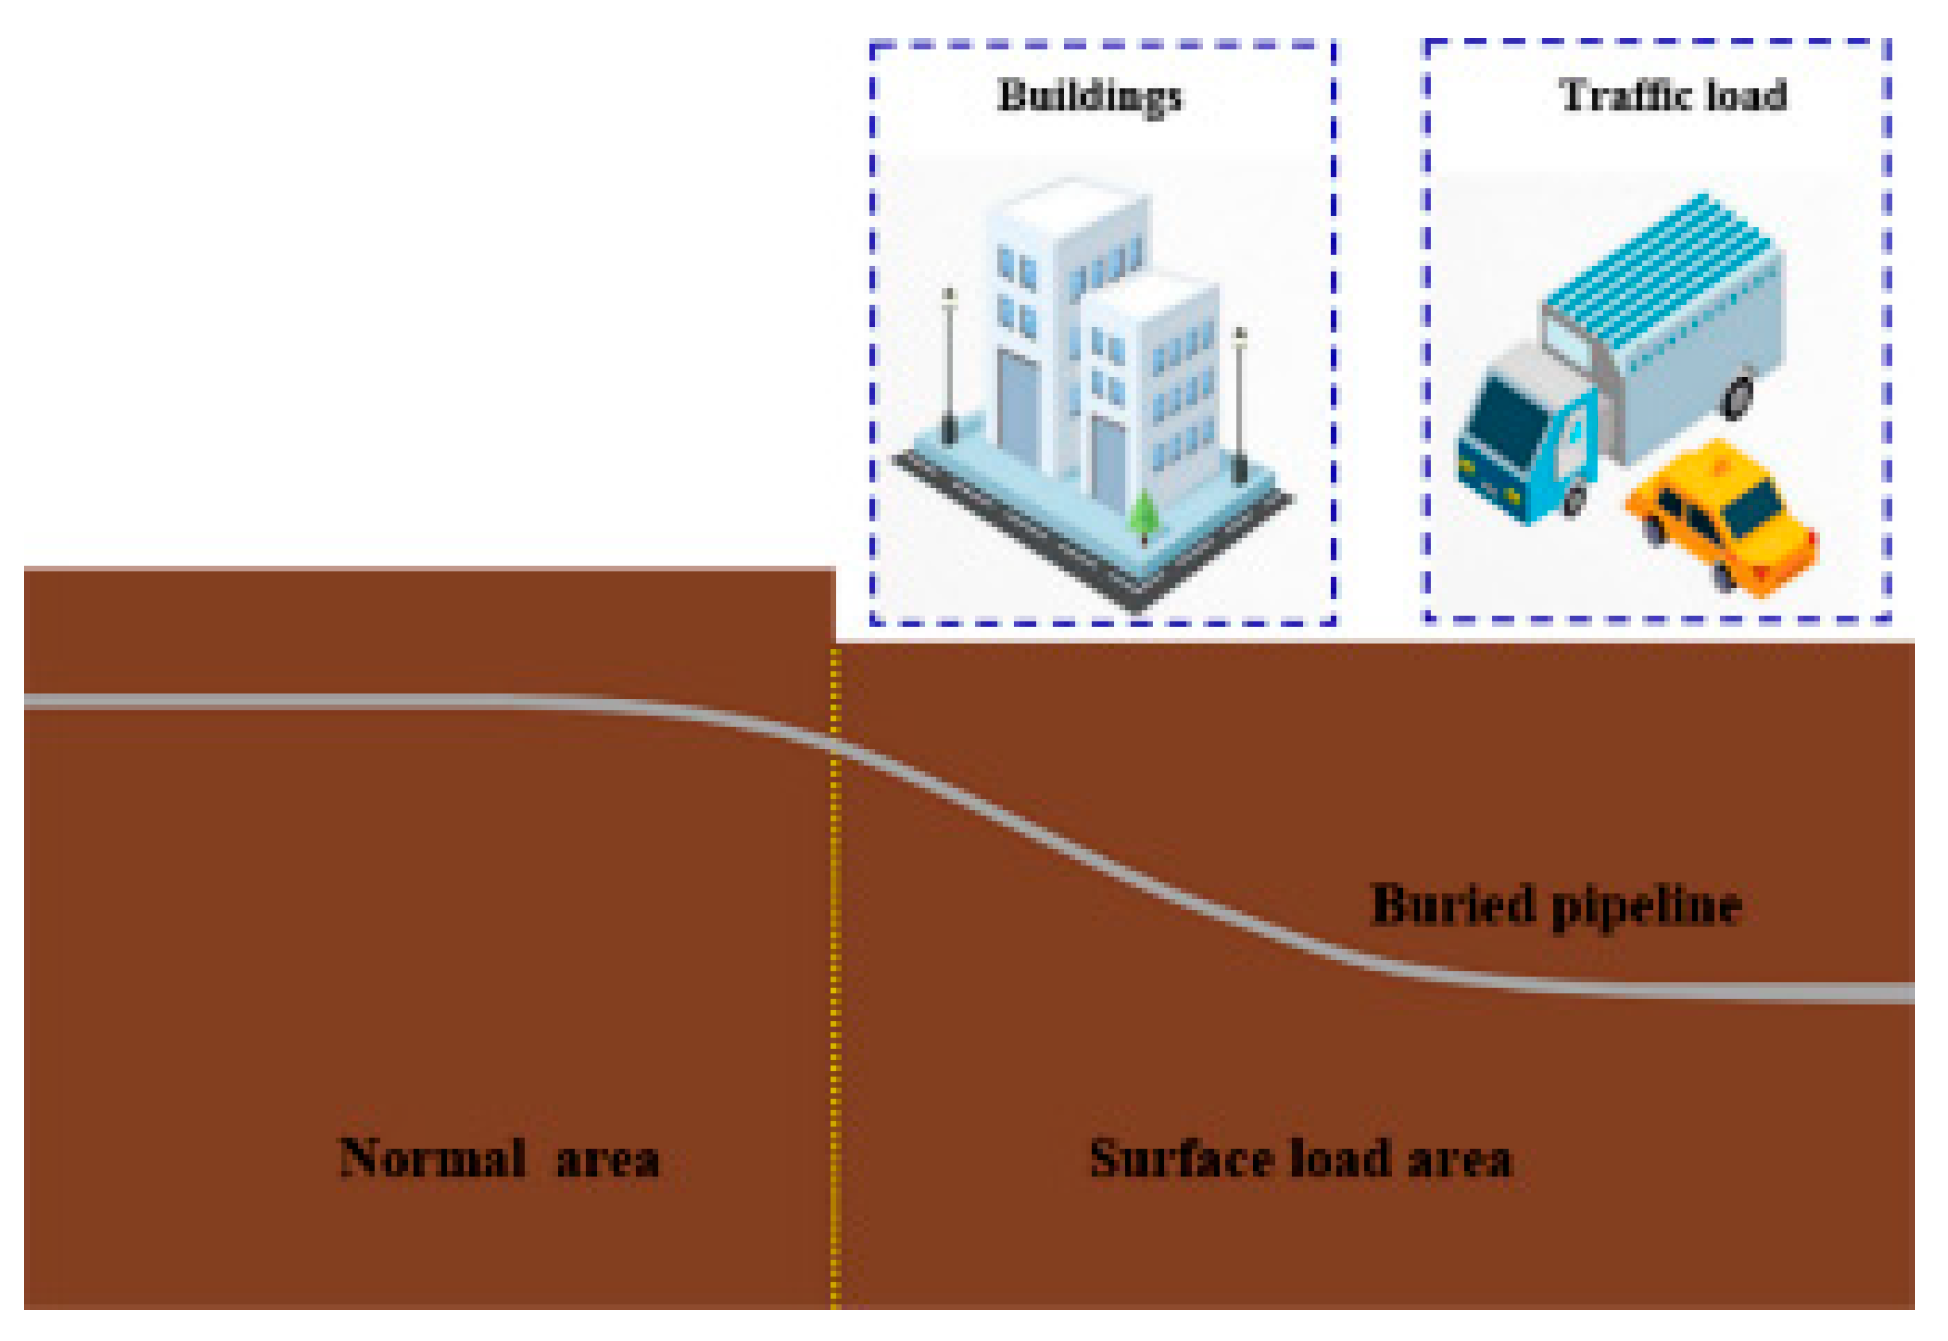
:1. Introduction
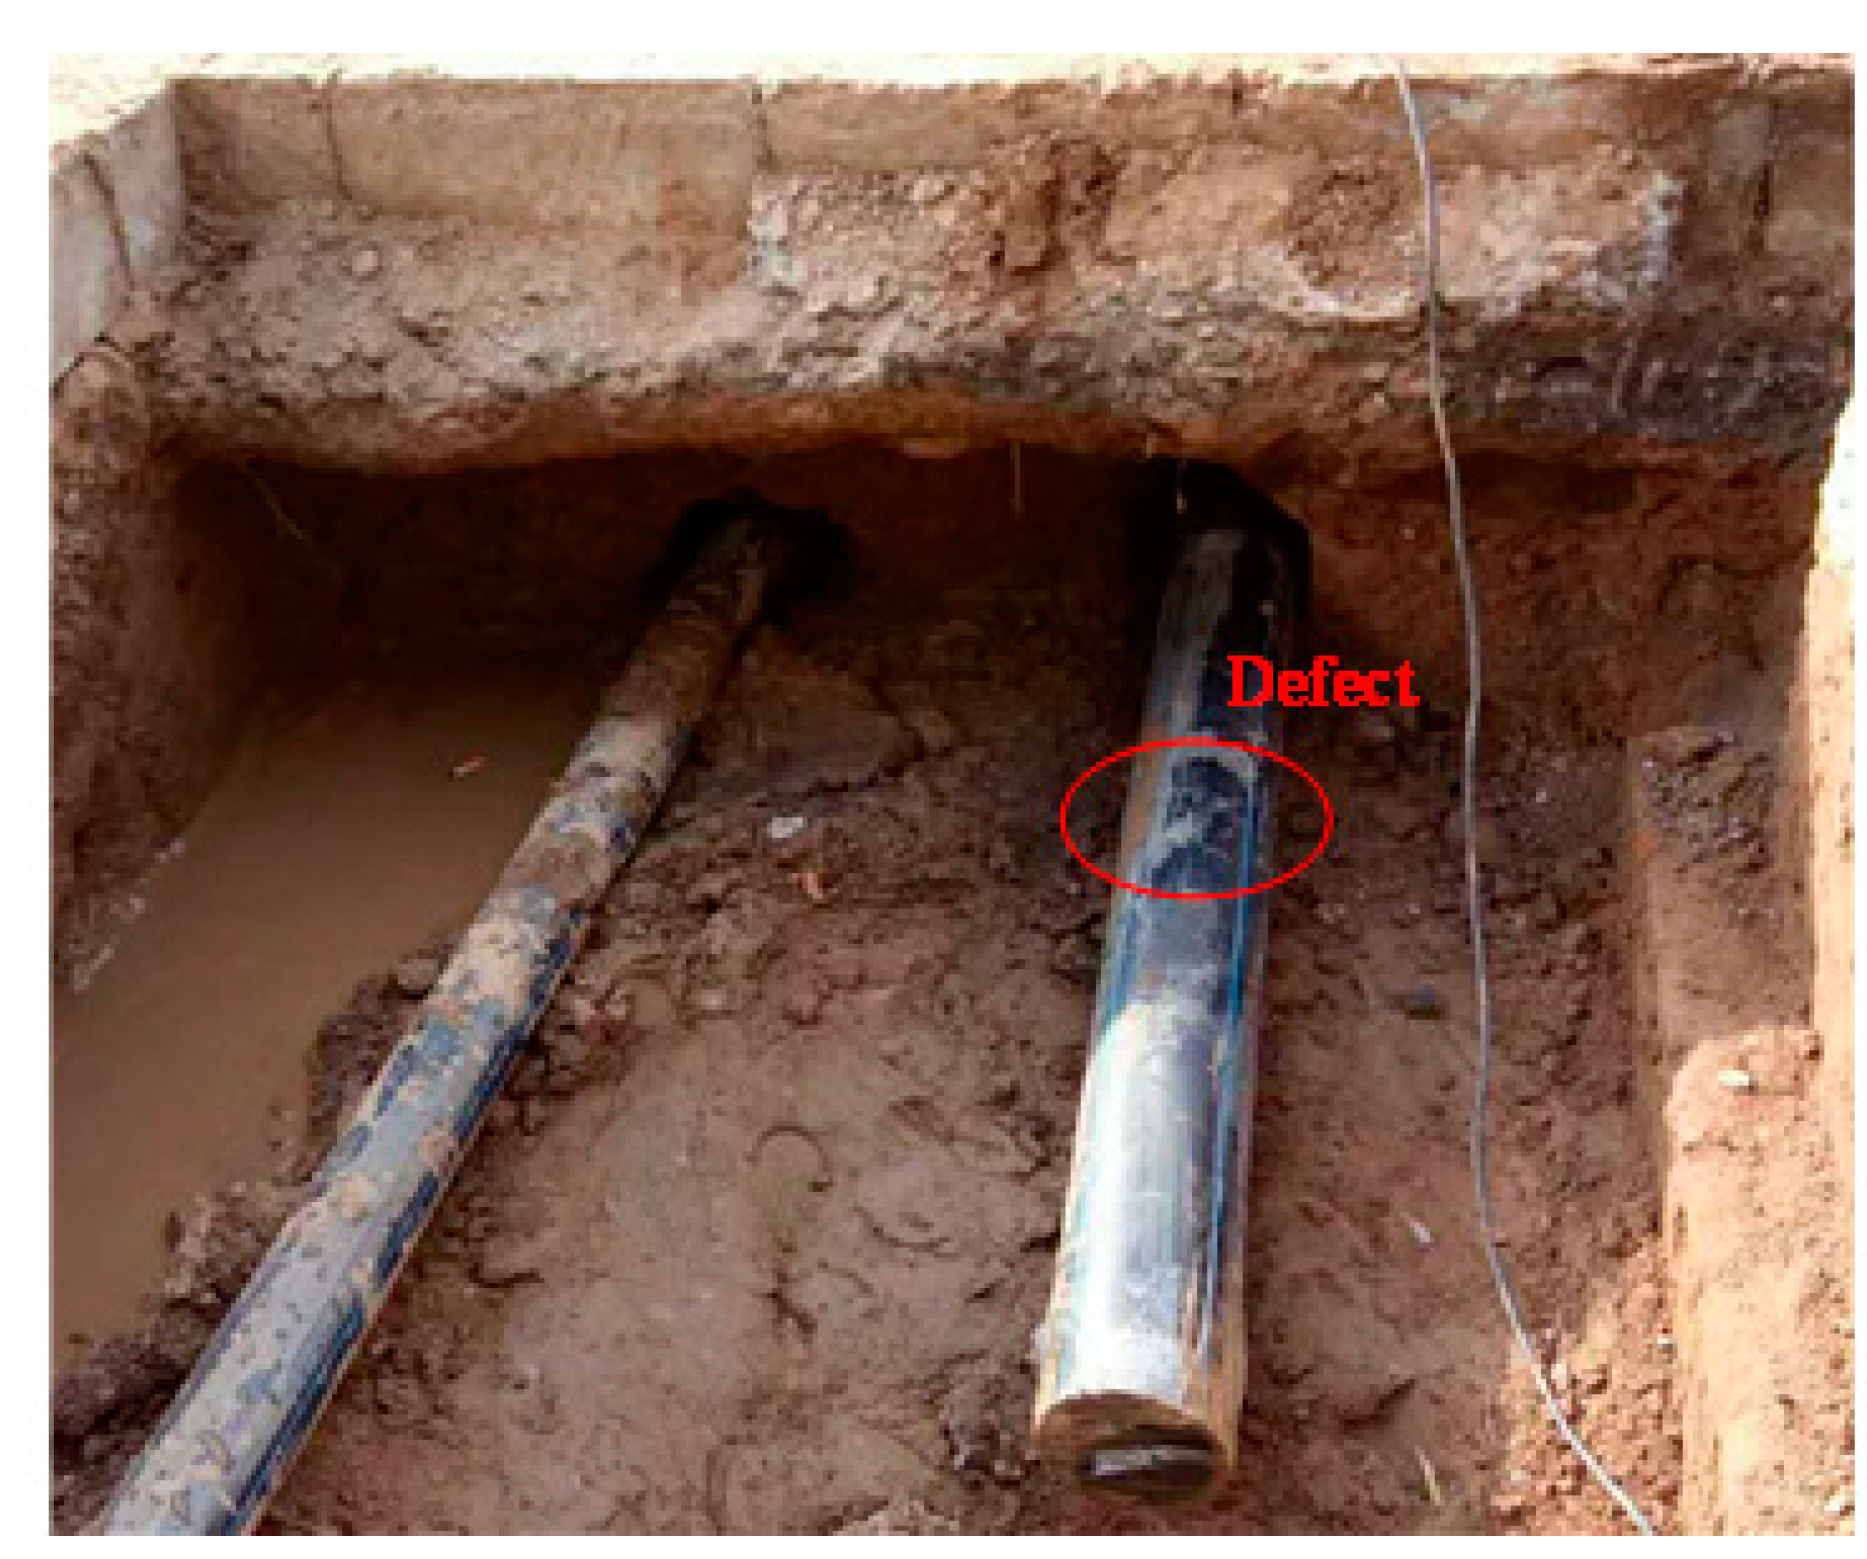
2. Numerical Model of Pipe with Defect under Surface Load
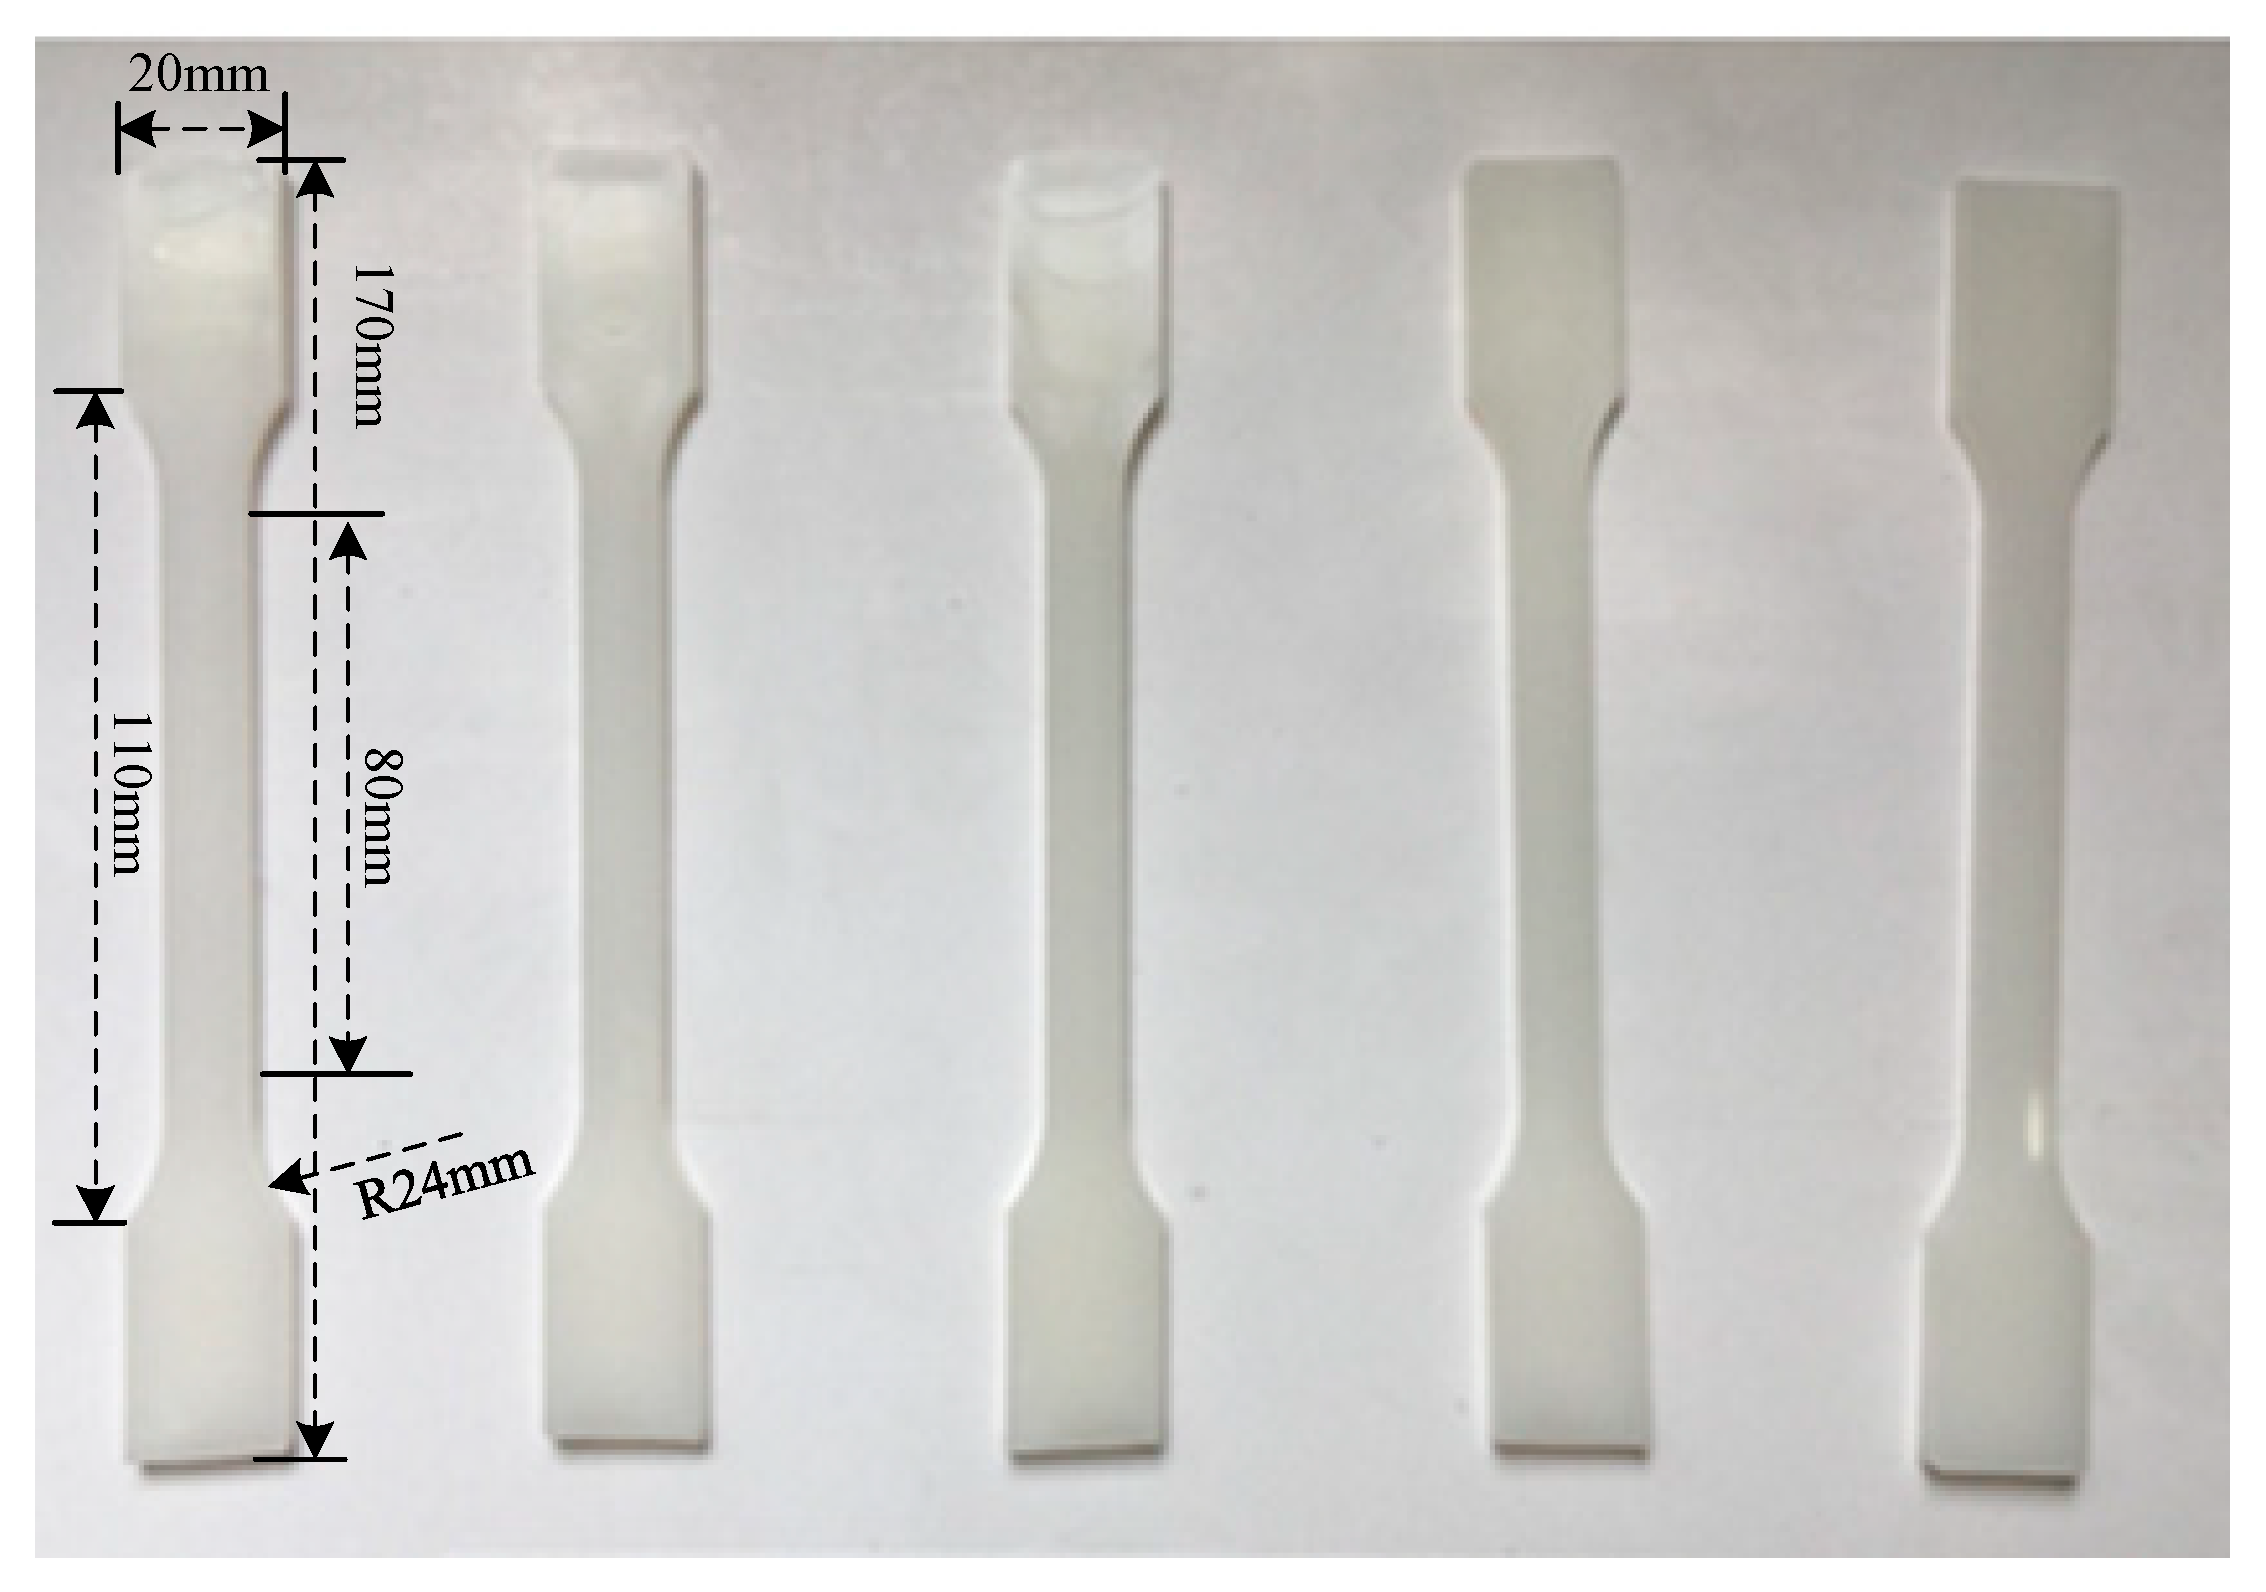
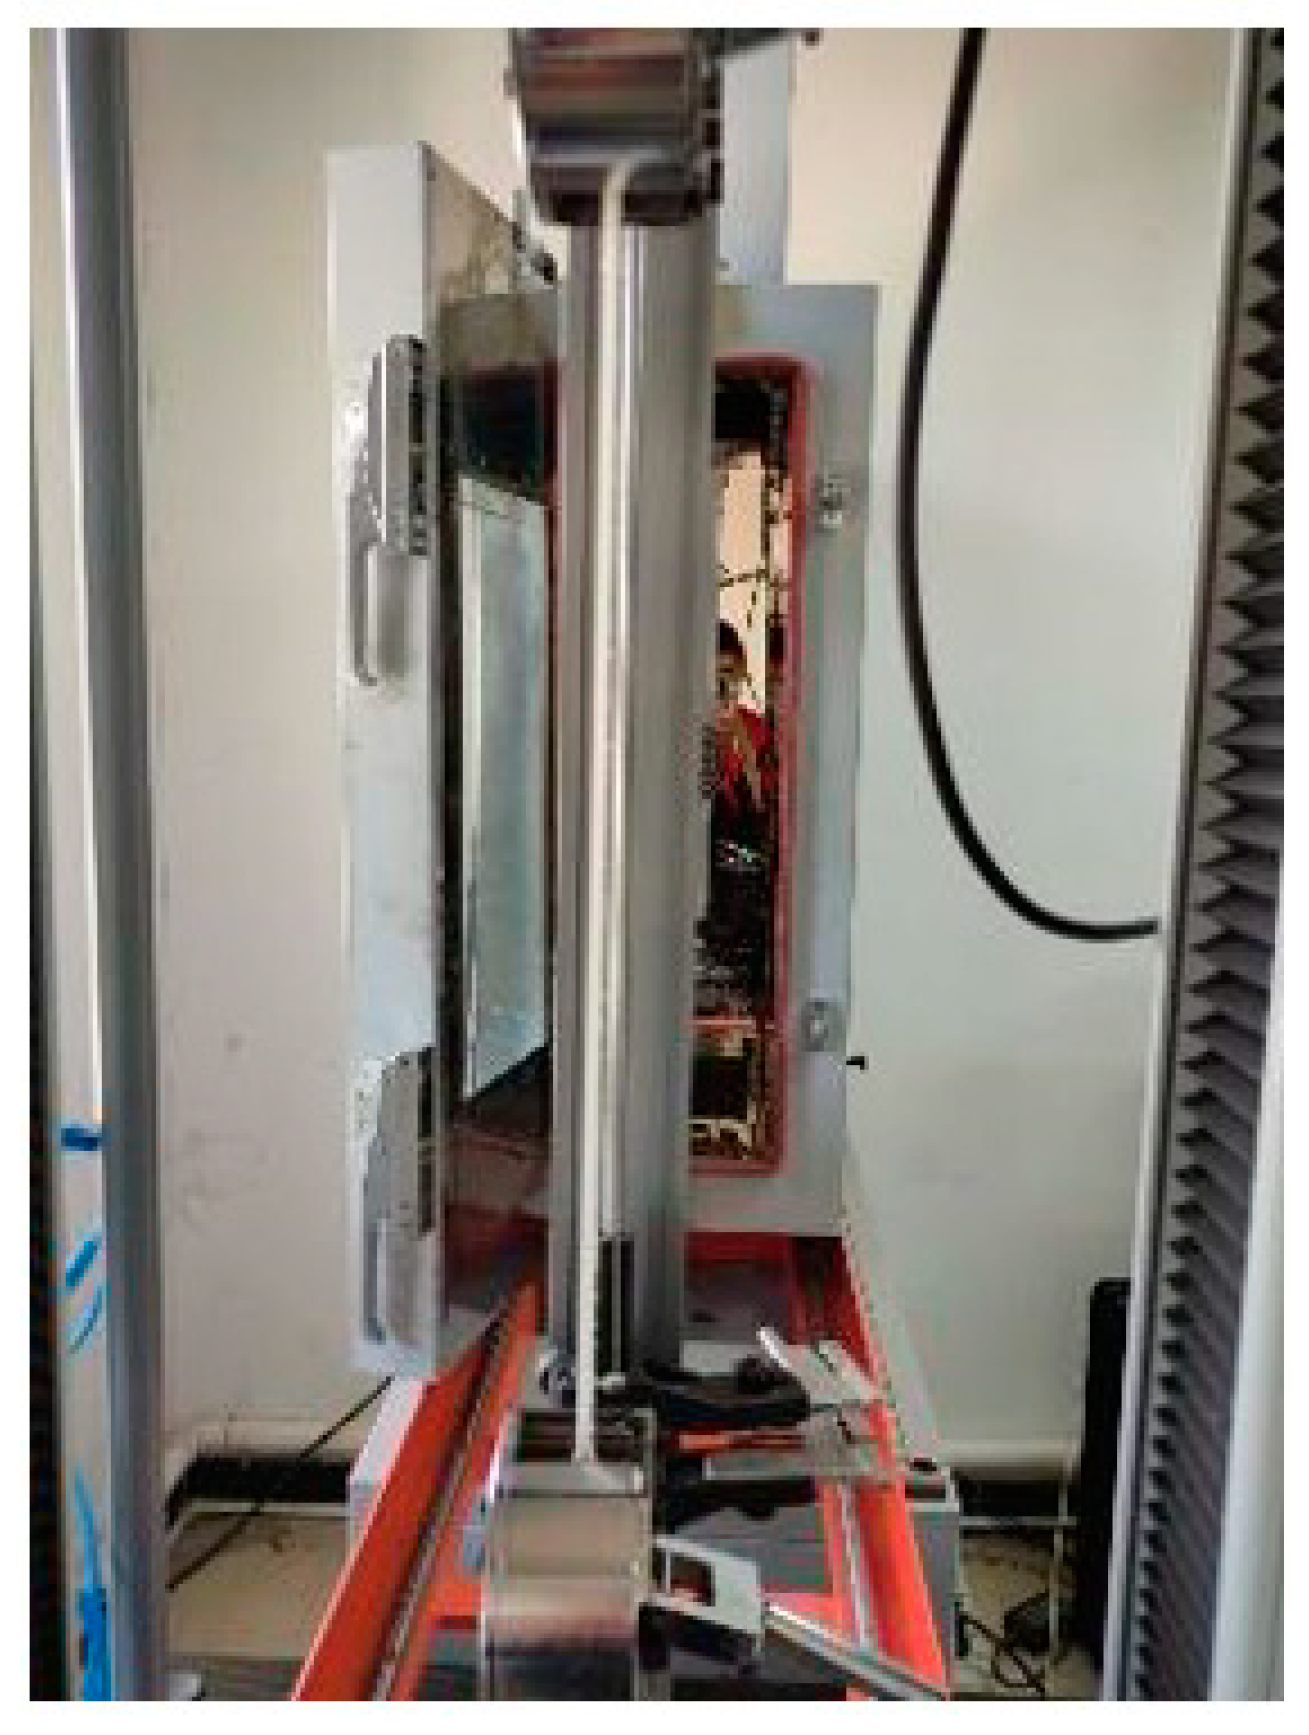
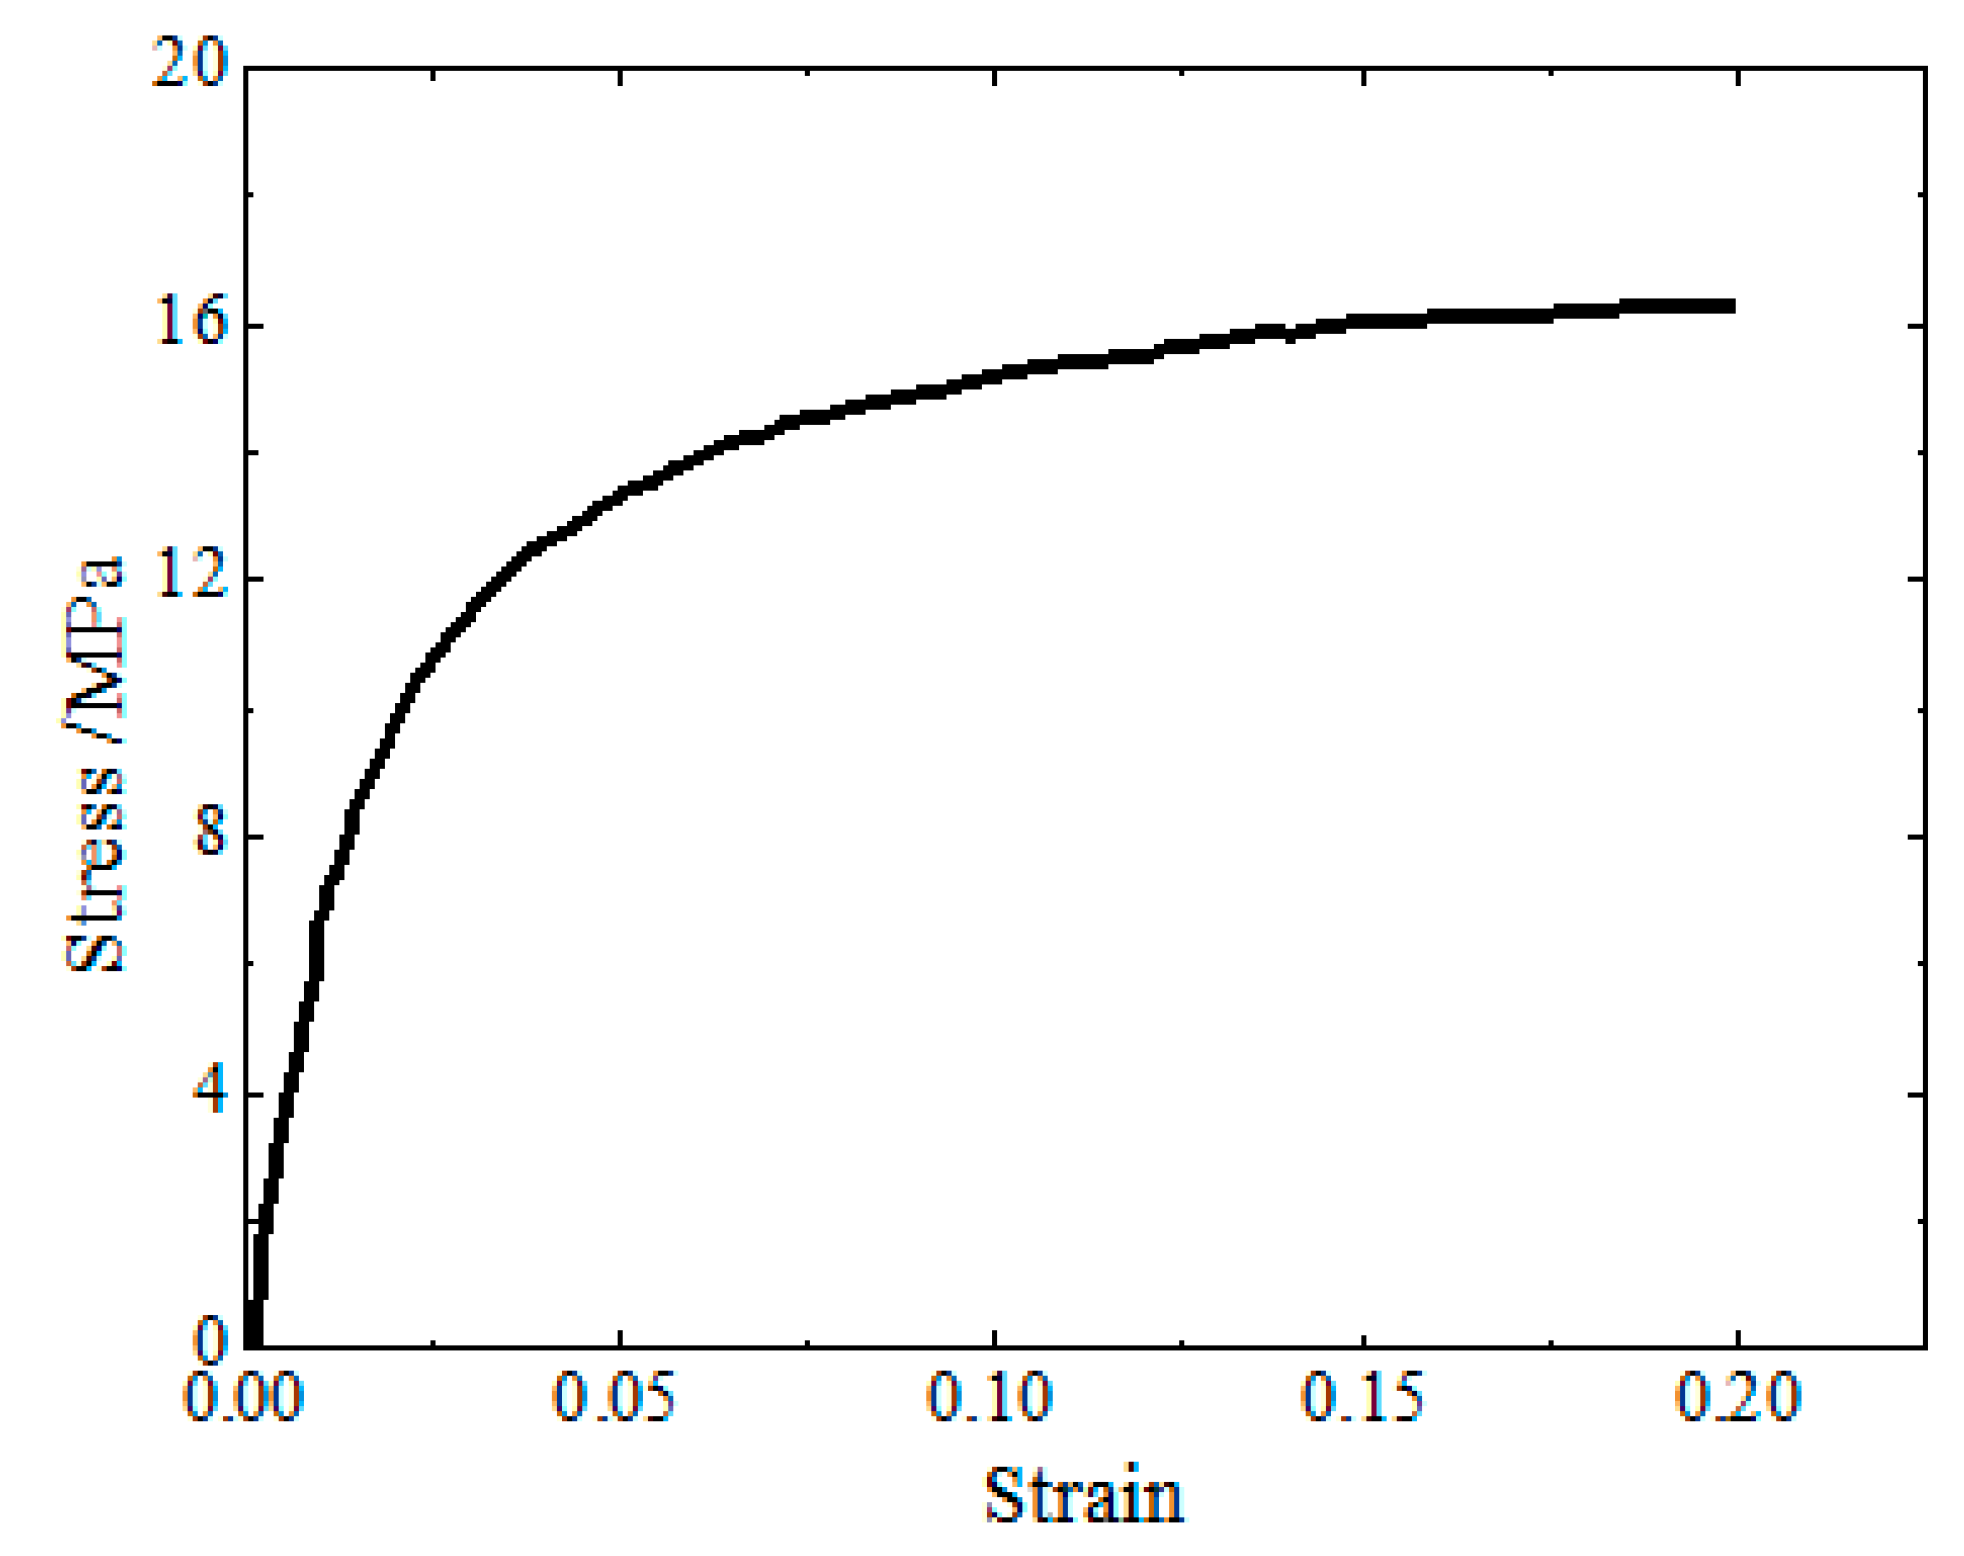
2.1. HDPE Pipe and Soil Properties
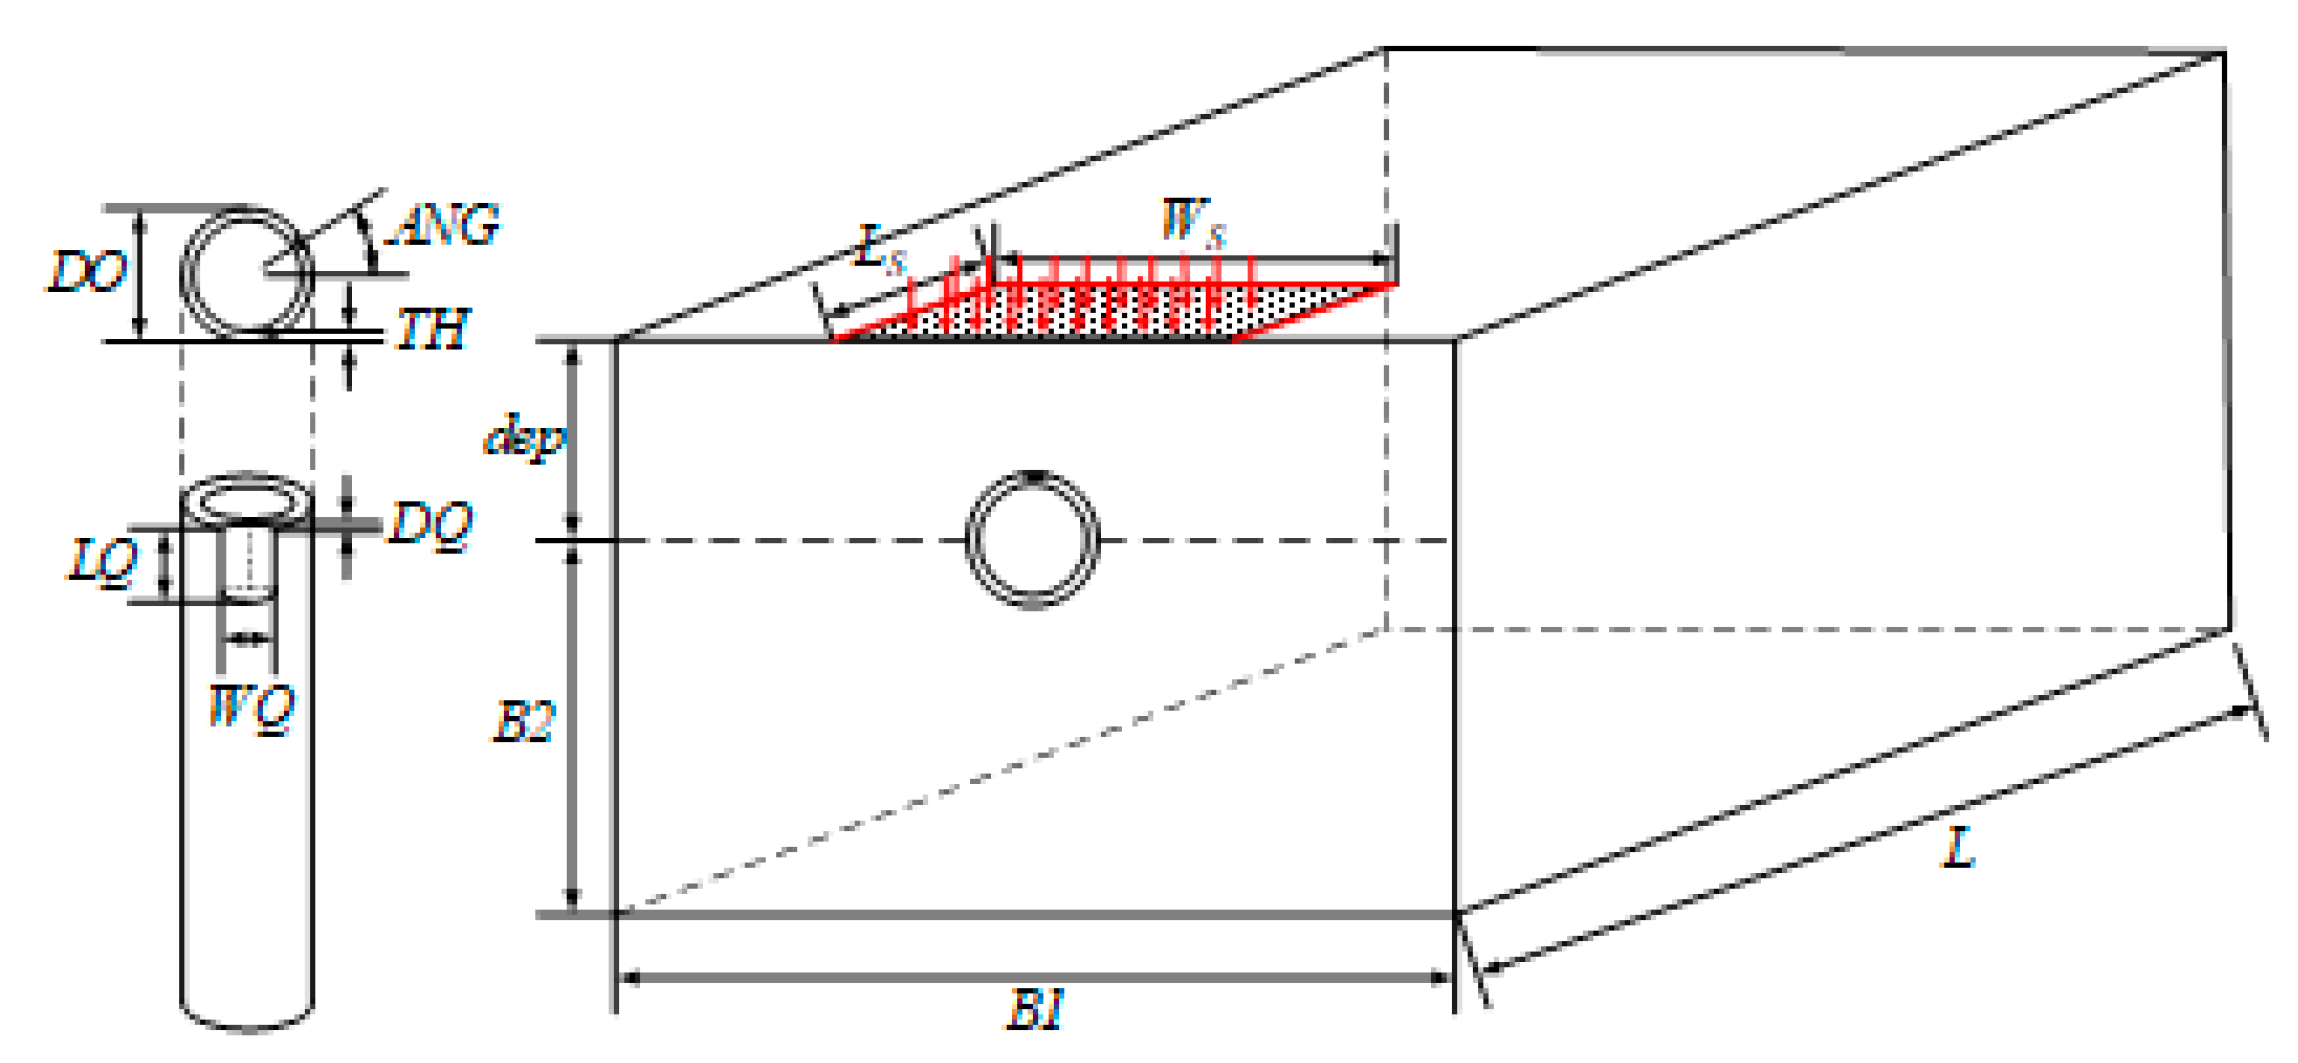
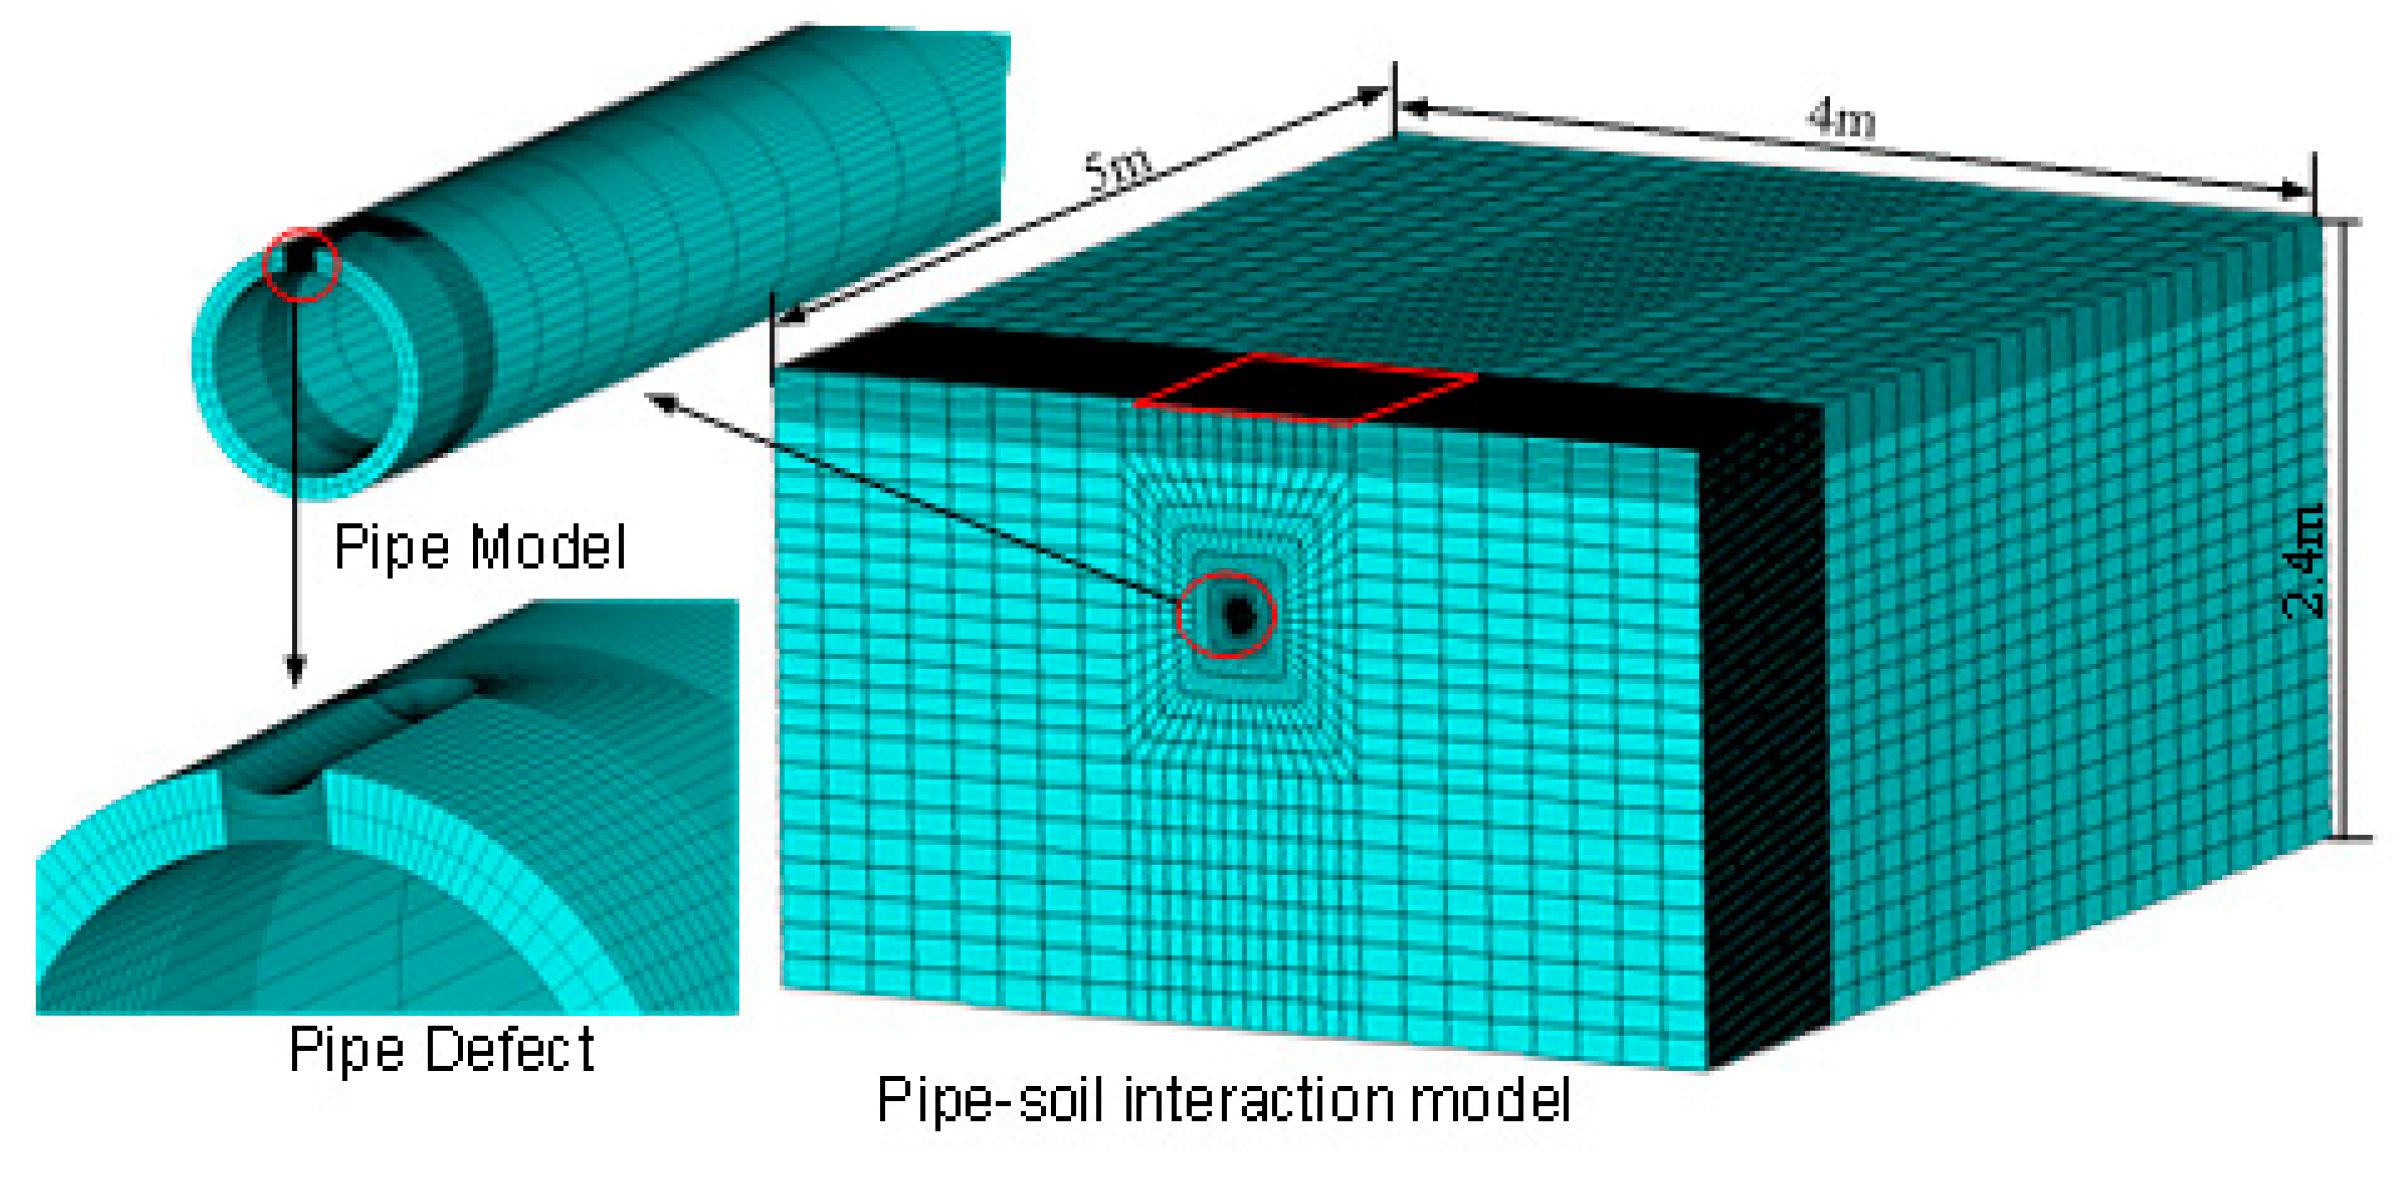
2.2. Mesh and Boundary Conditions of Finite Element Model
2.3. Failure Criterion of HDPE Pipeline
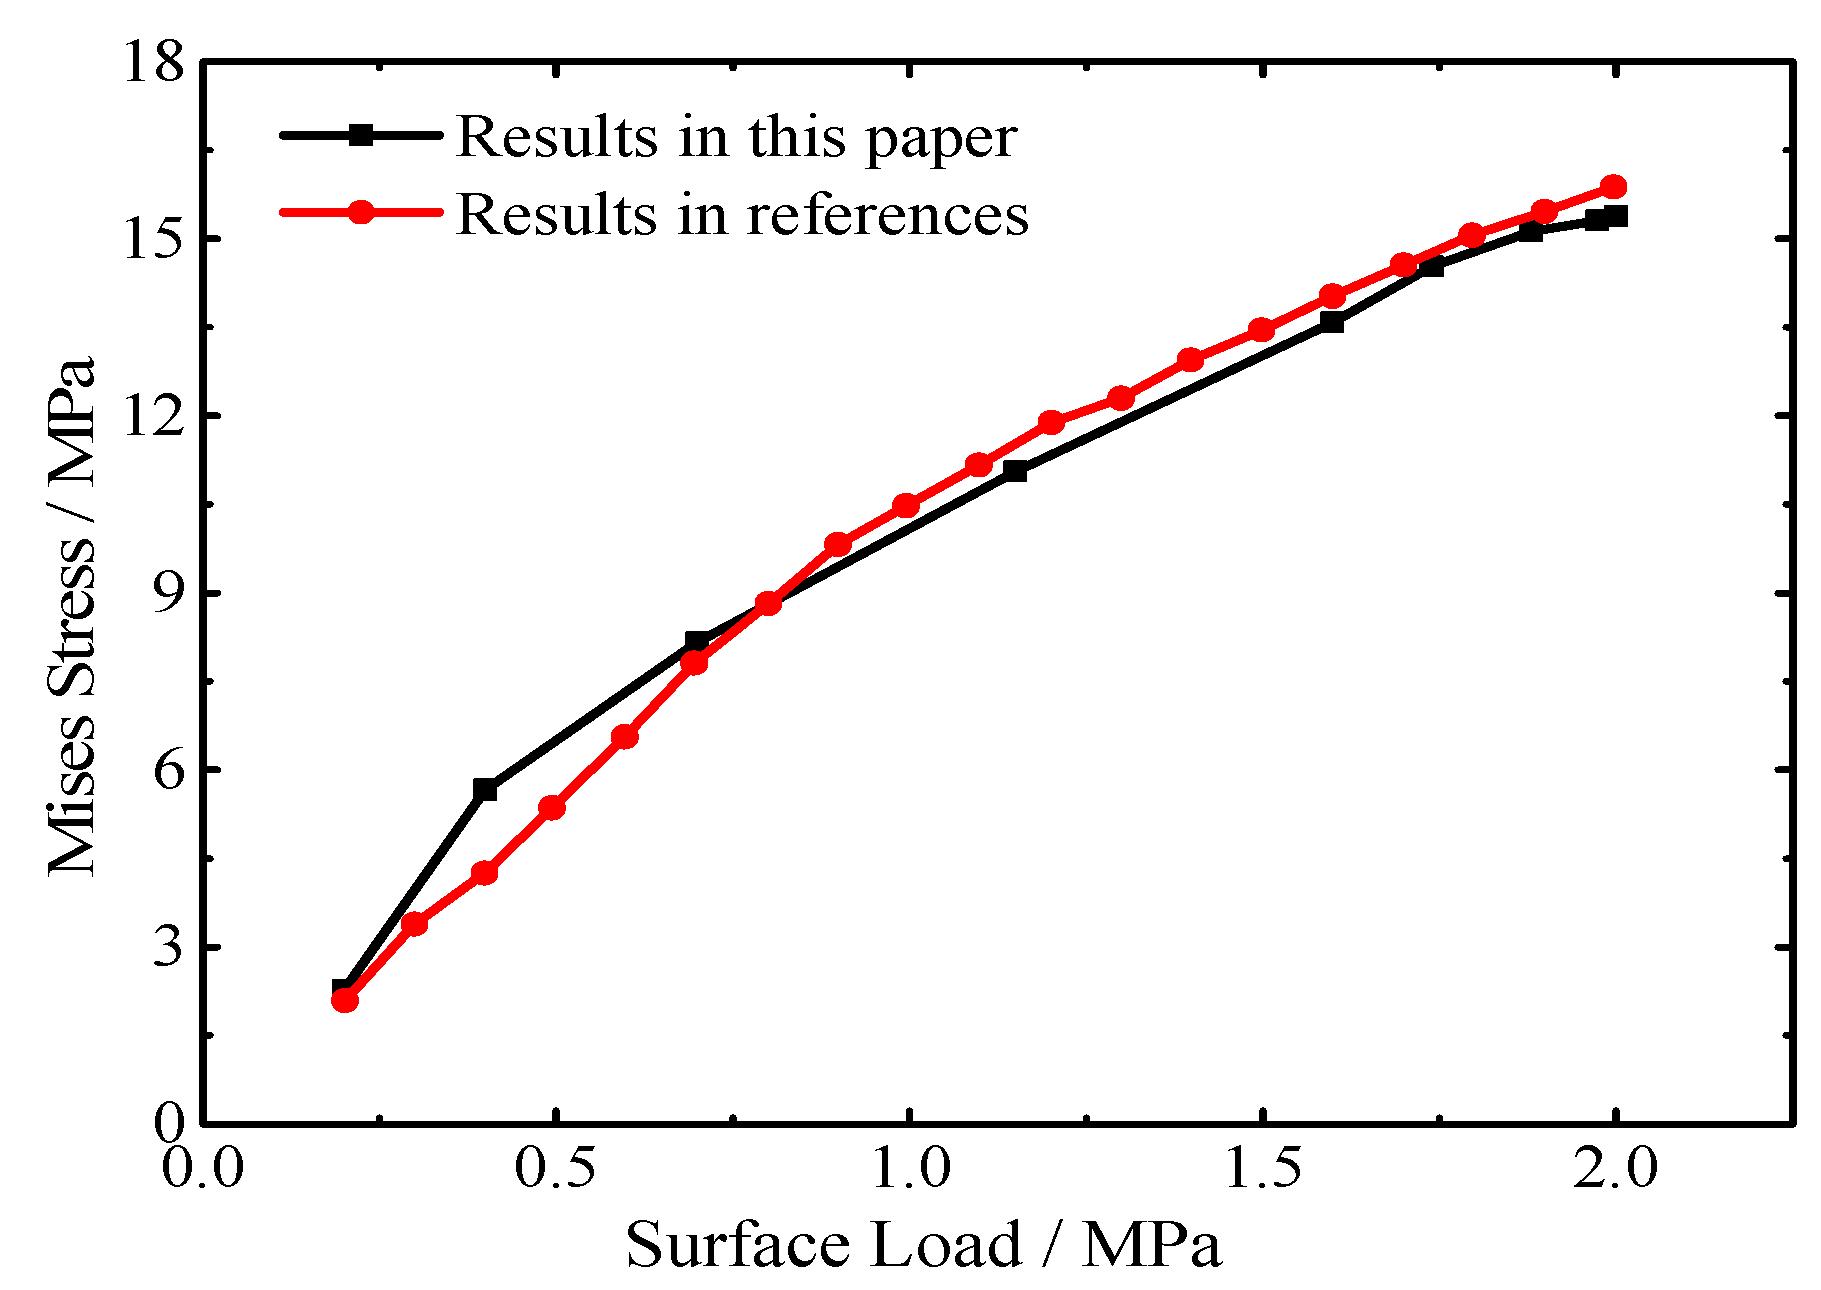
3. Validation of the Finite Element Model
4. Analysis of Finite Element Simulation Results
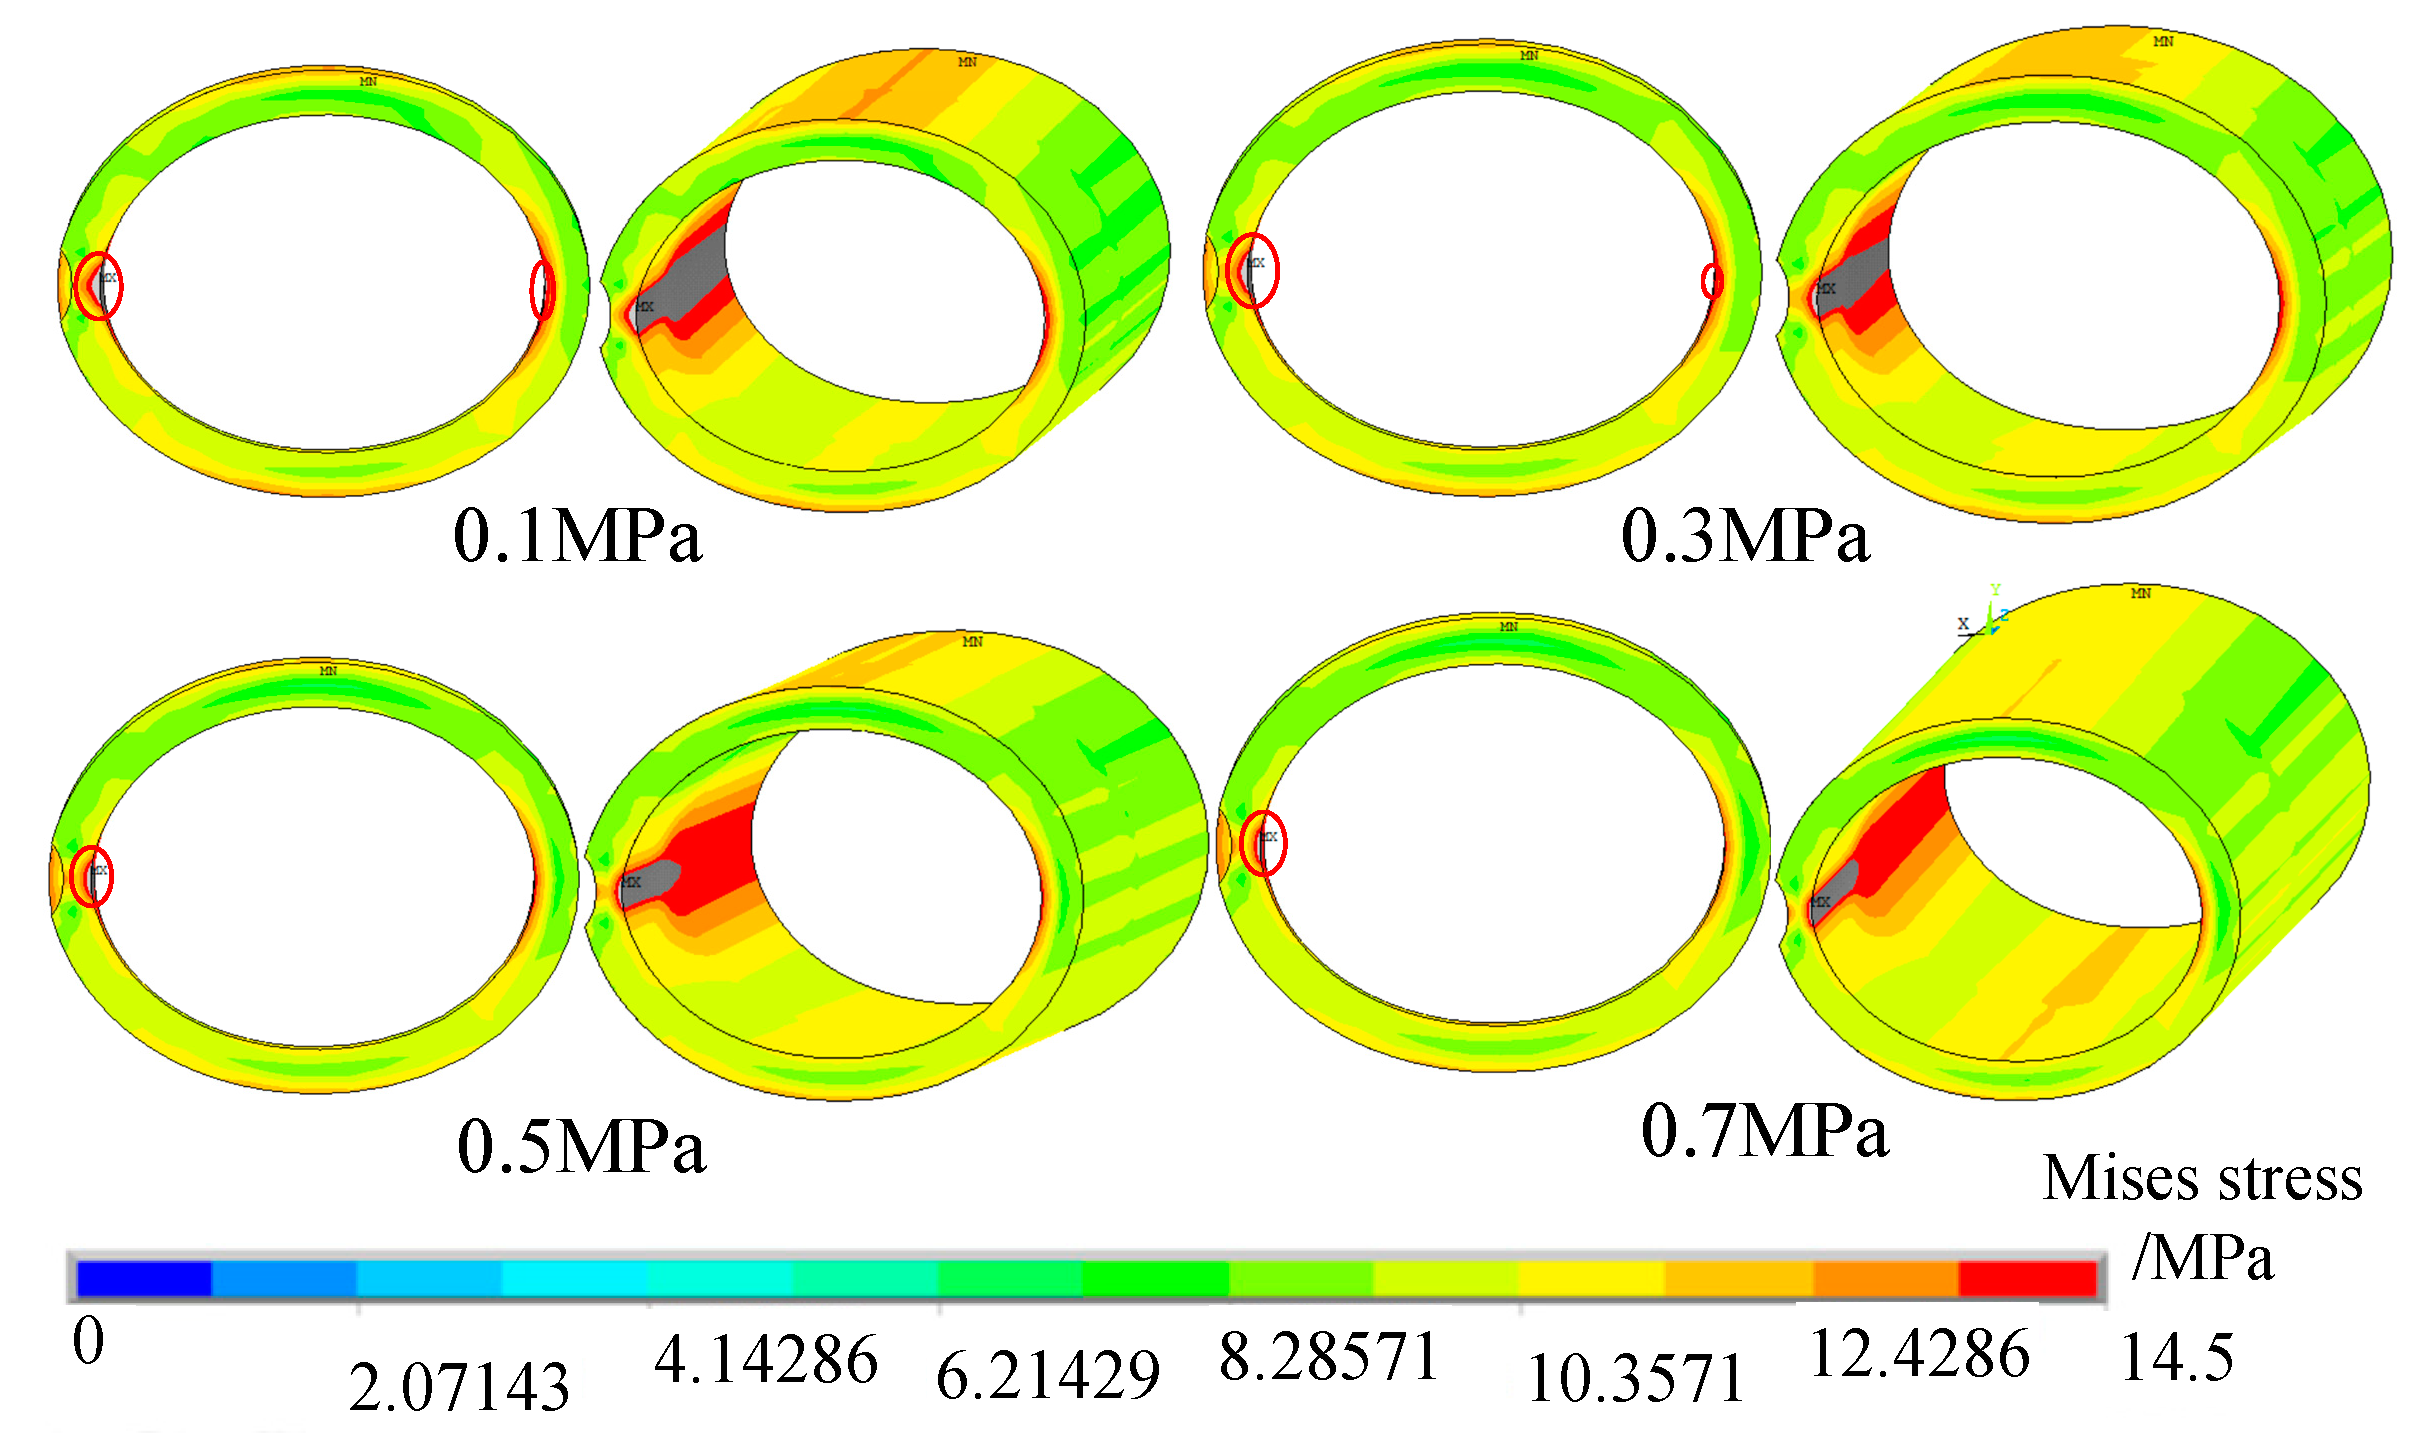
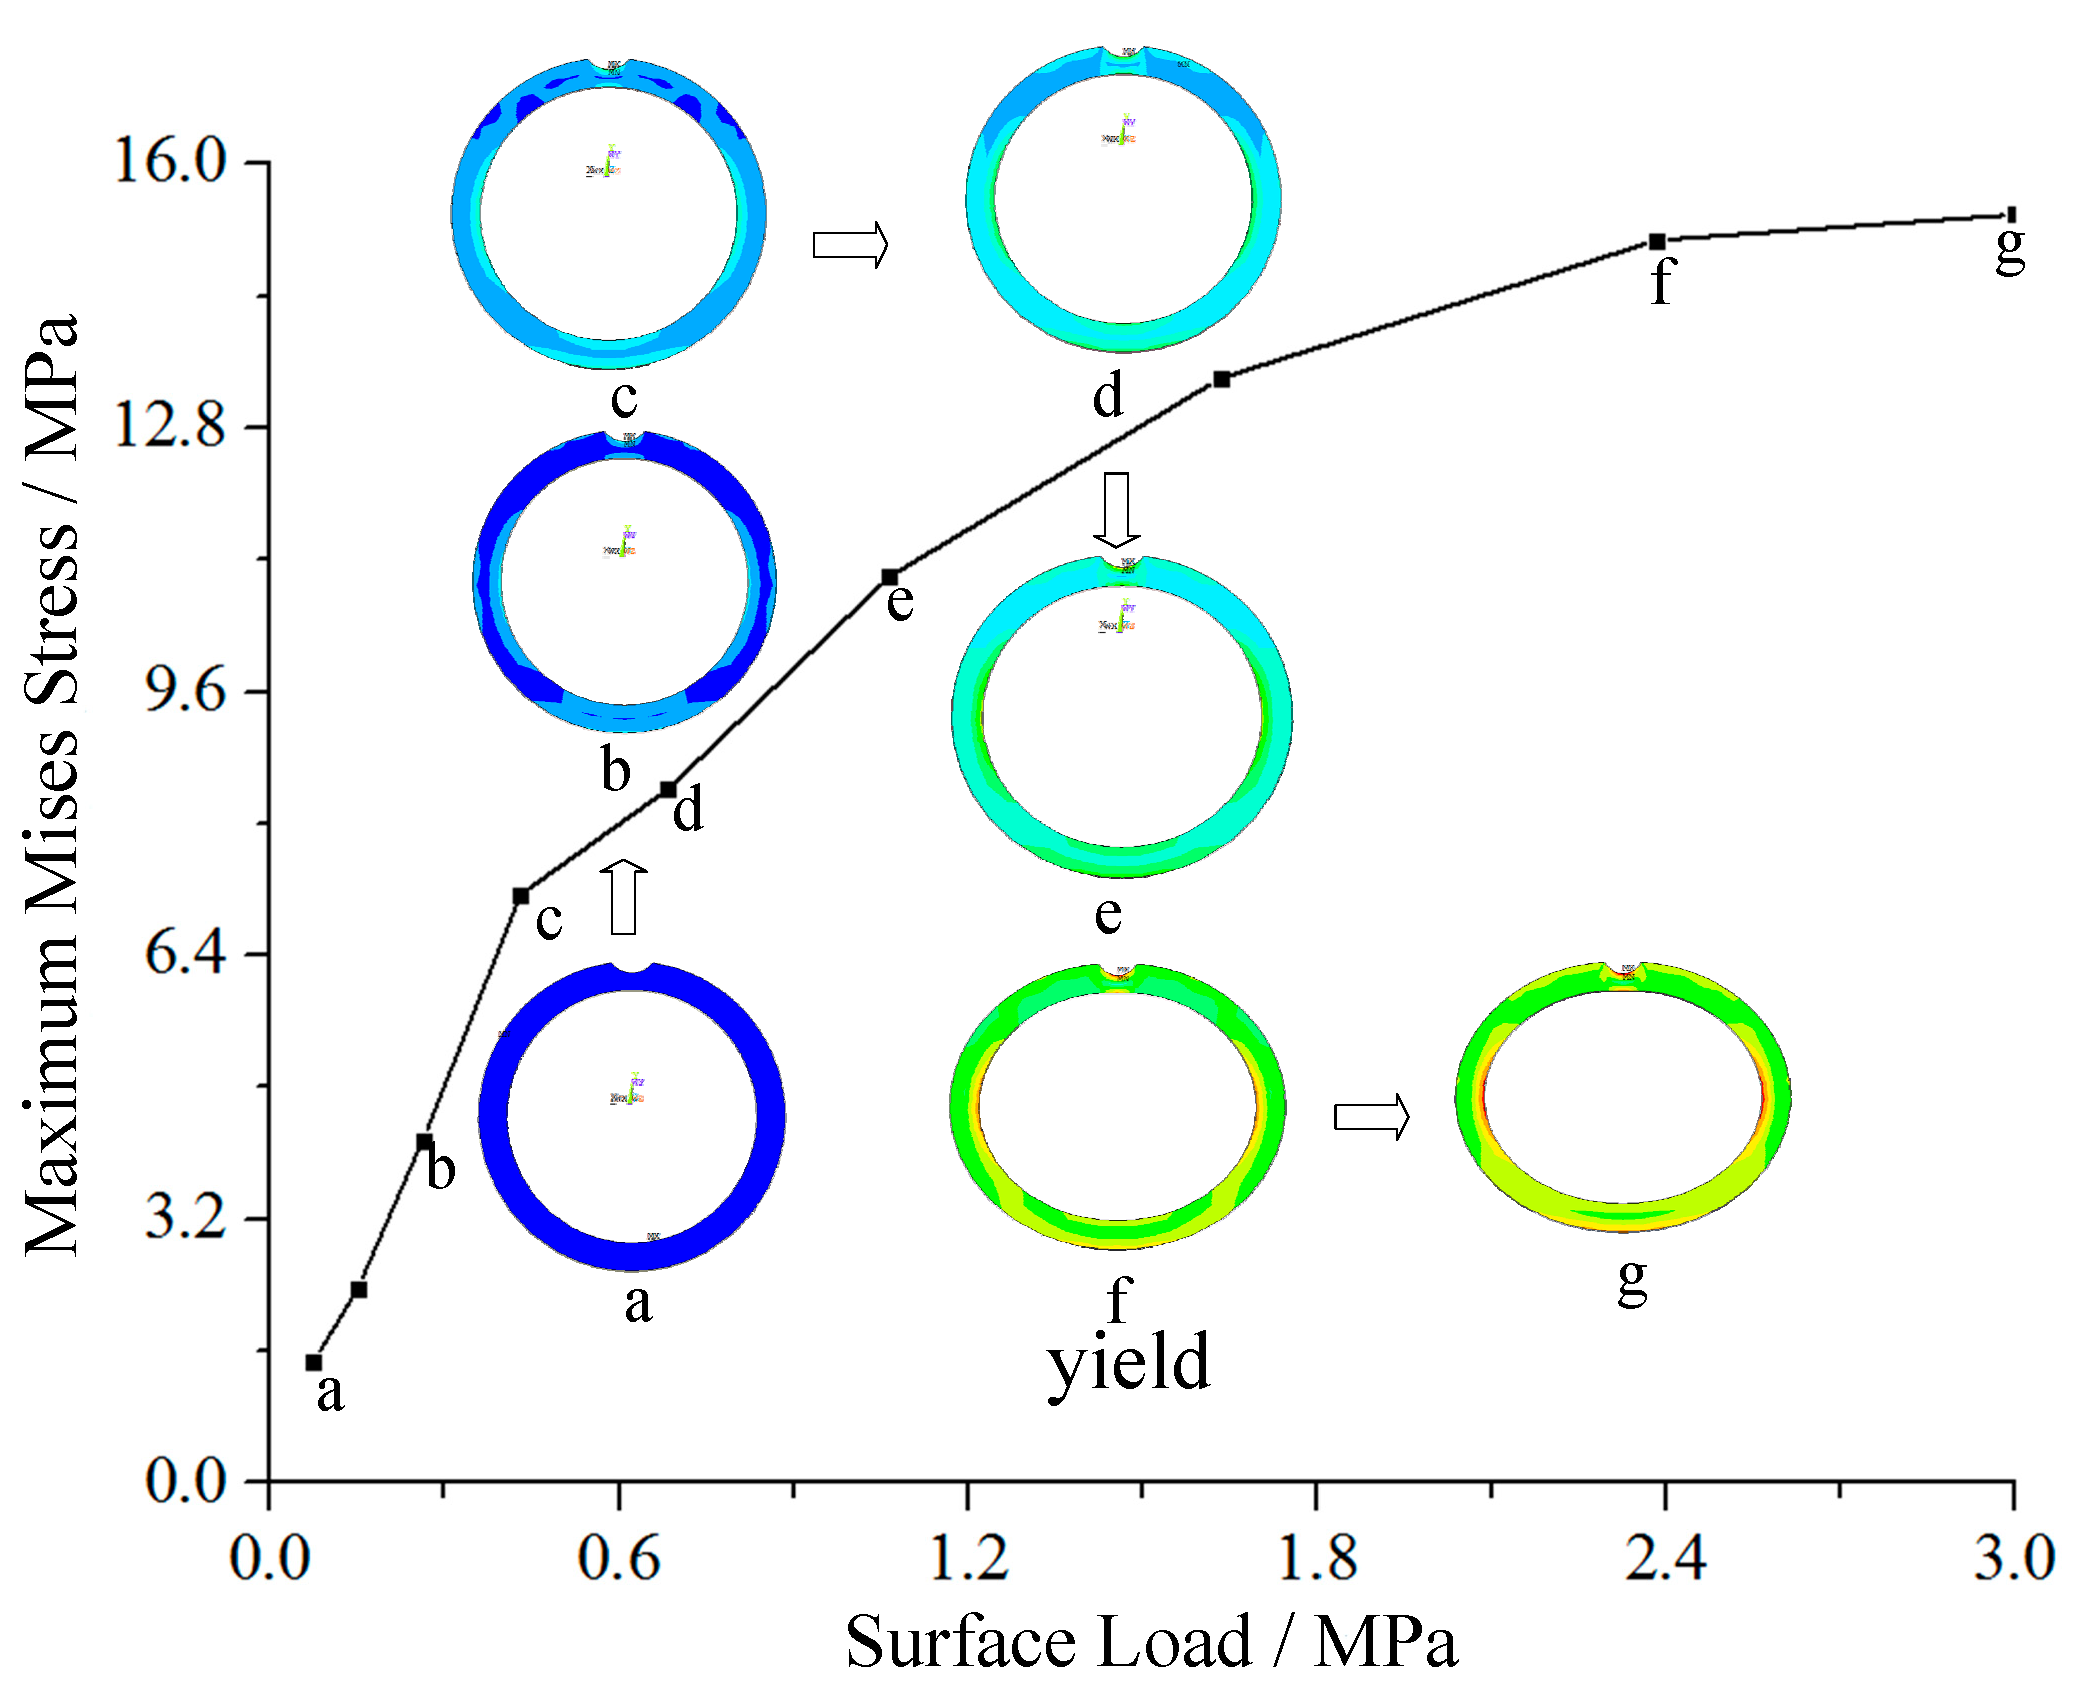
4.1. Failure Mechanism of Pipe with Defect under Surface Load
4.2. Parameter Analysis
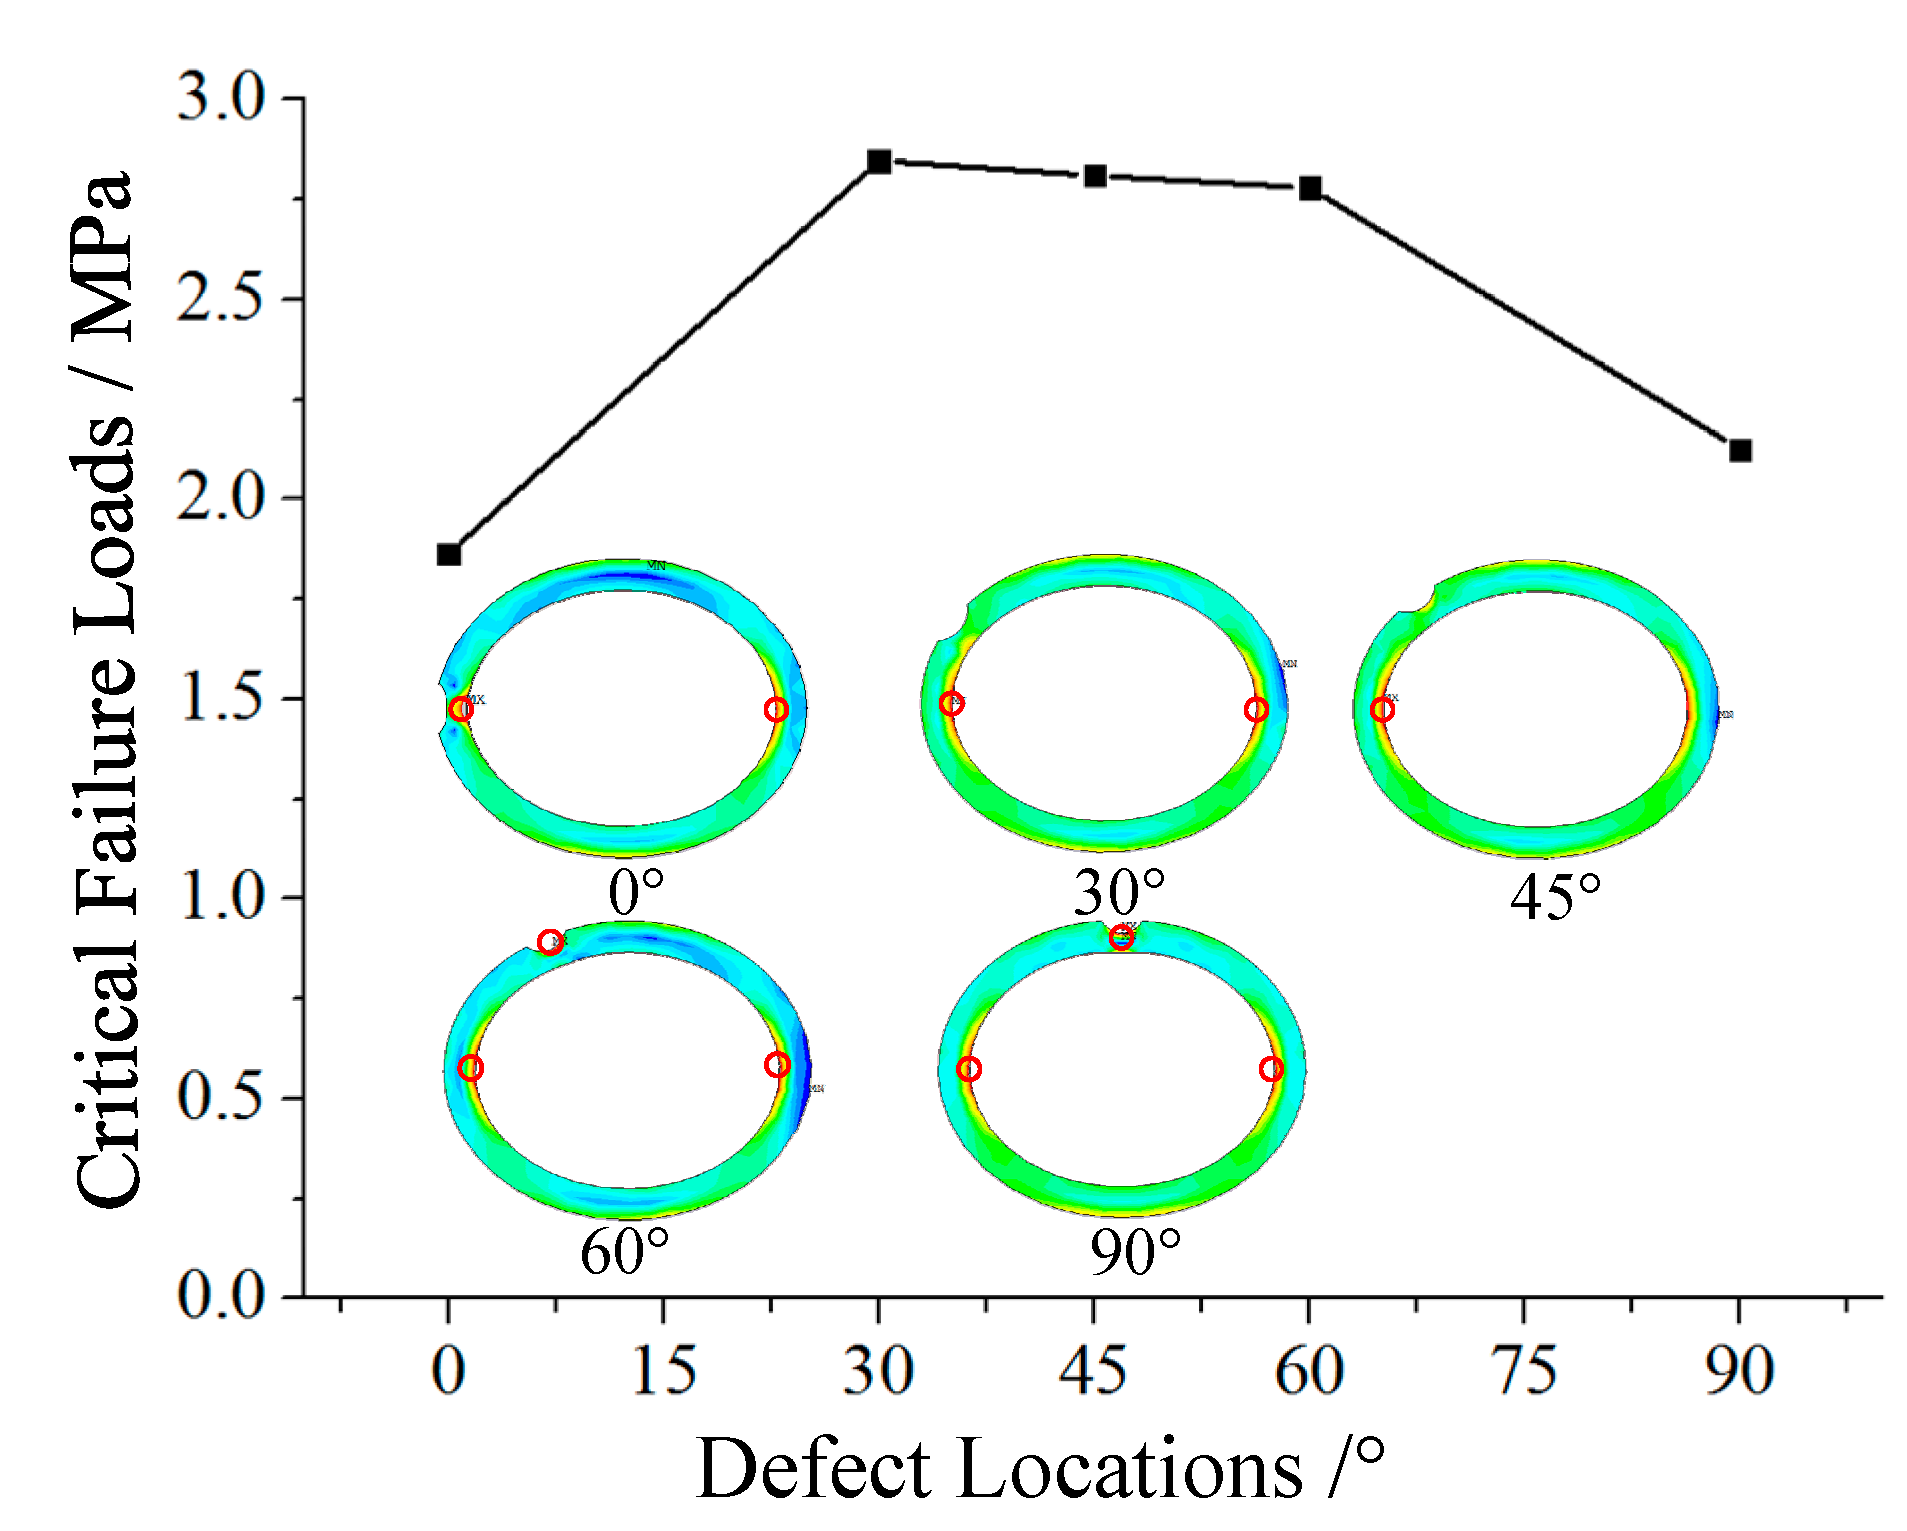
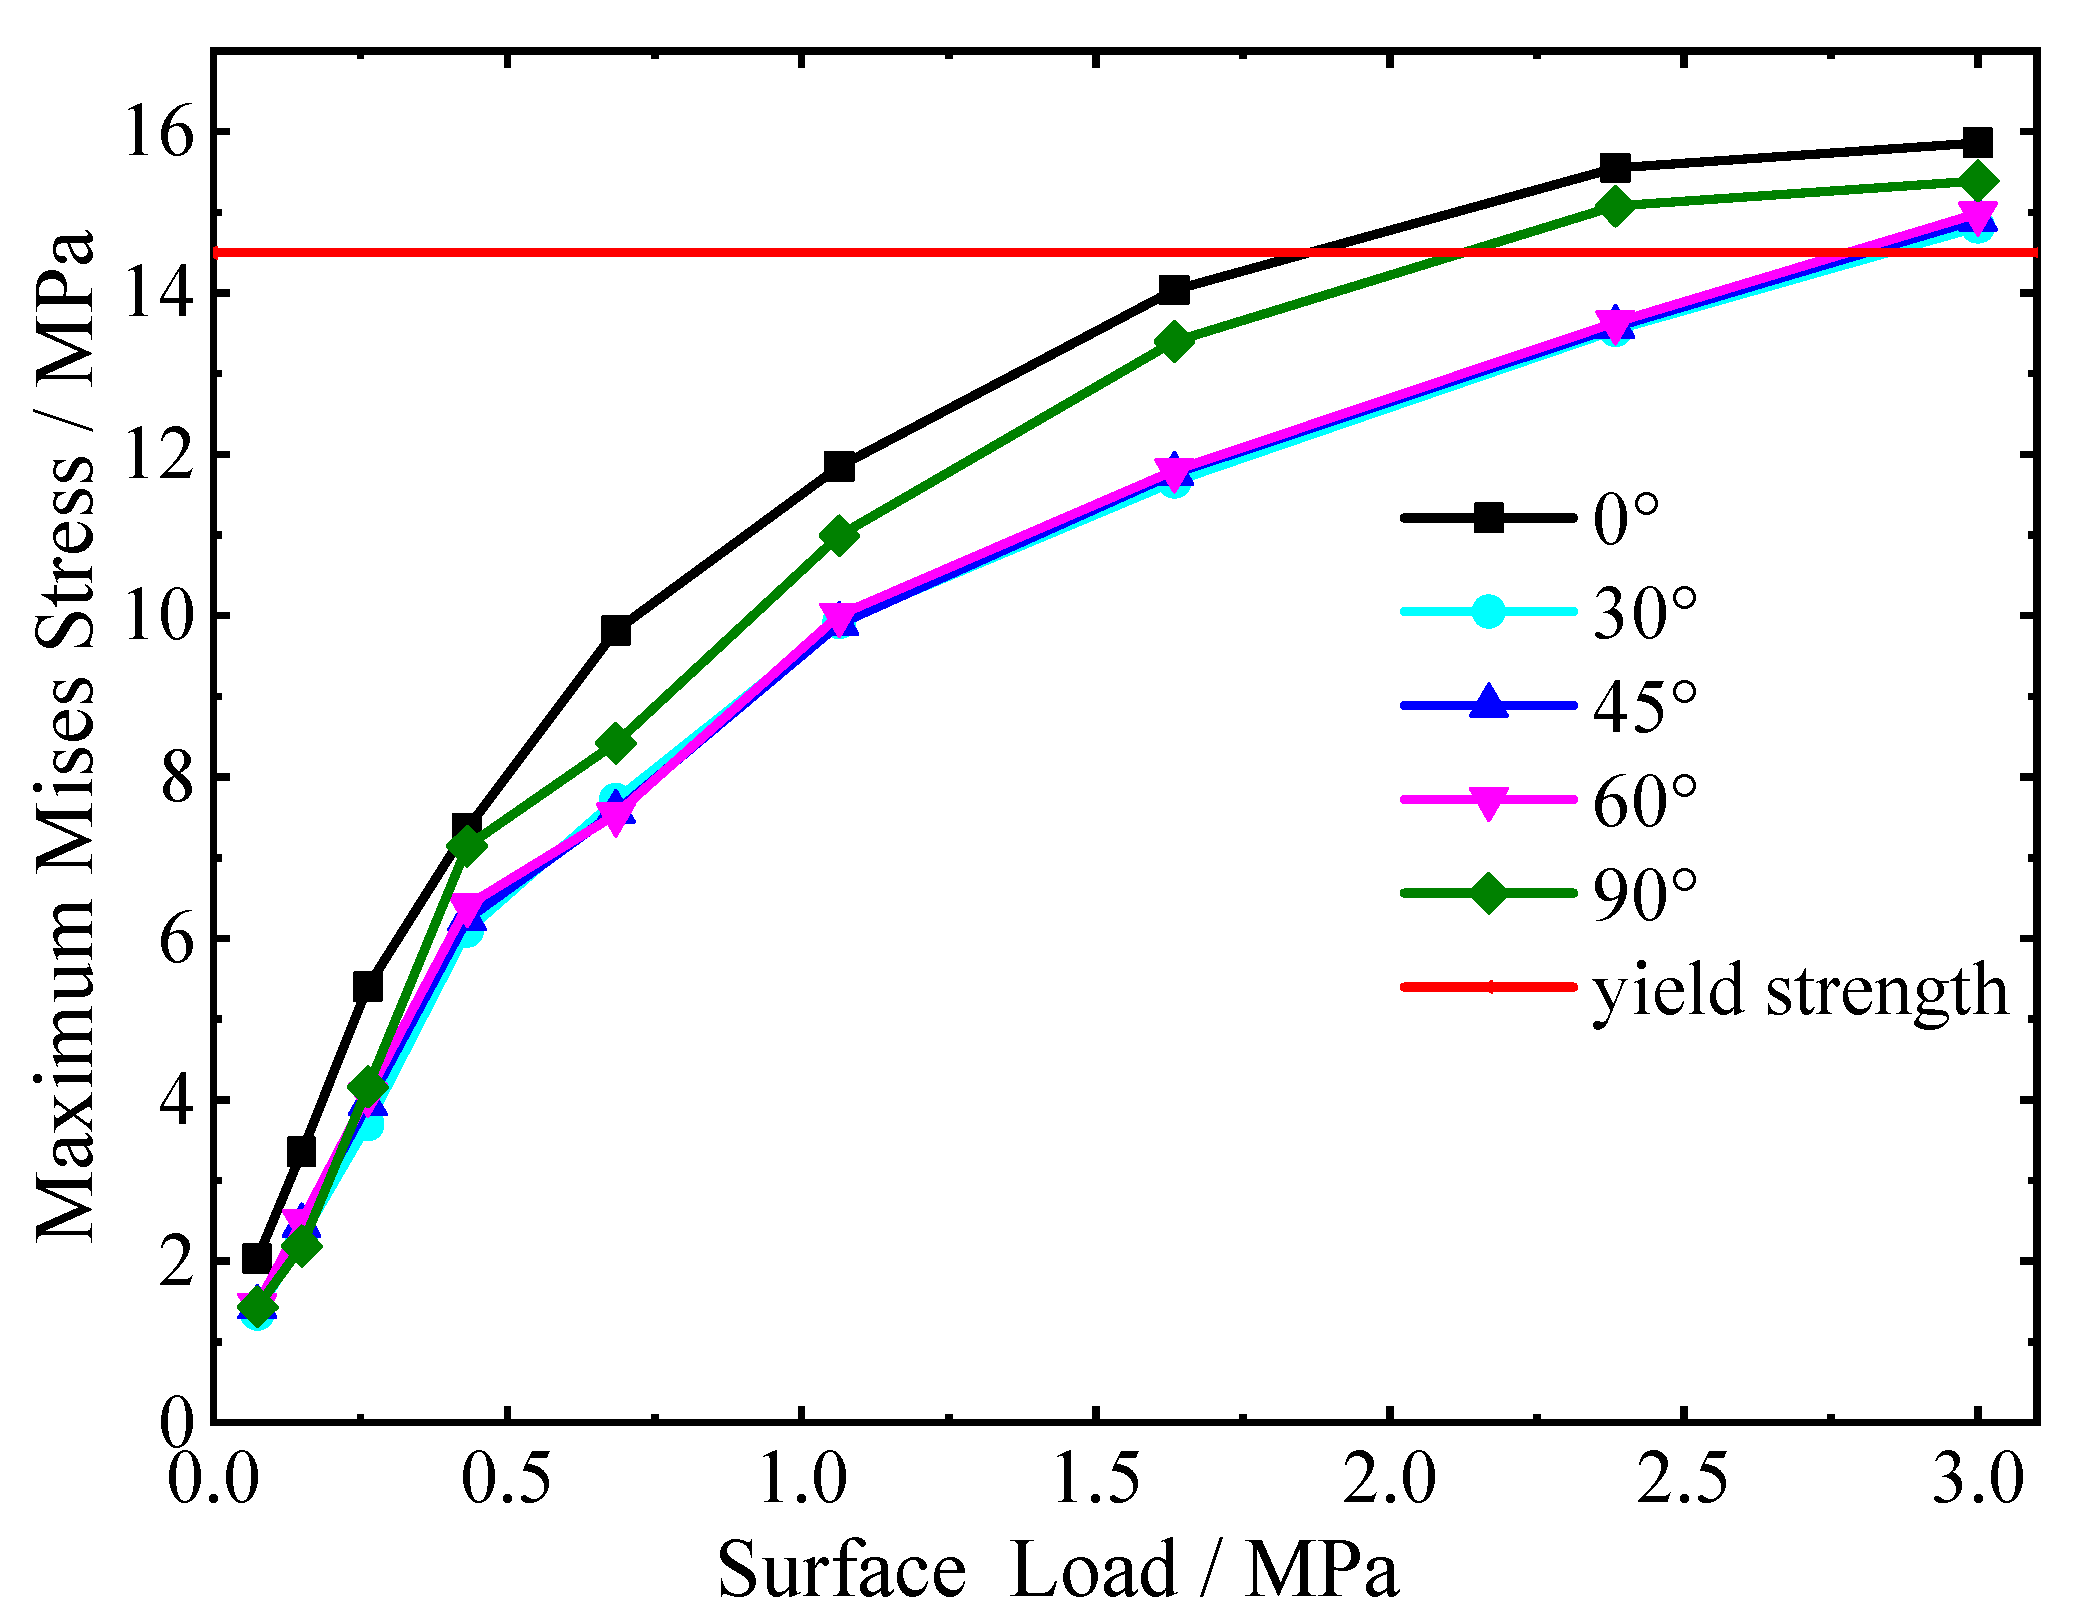
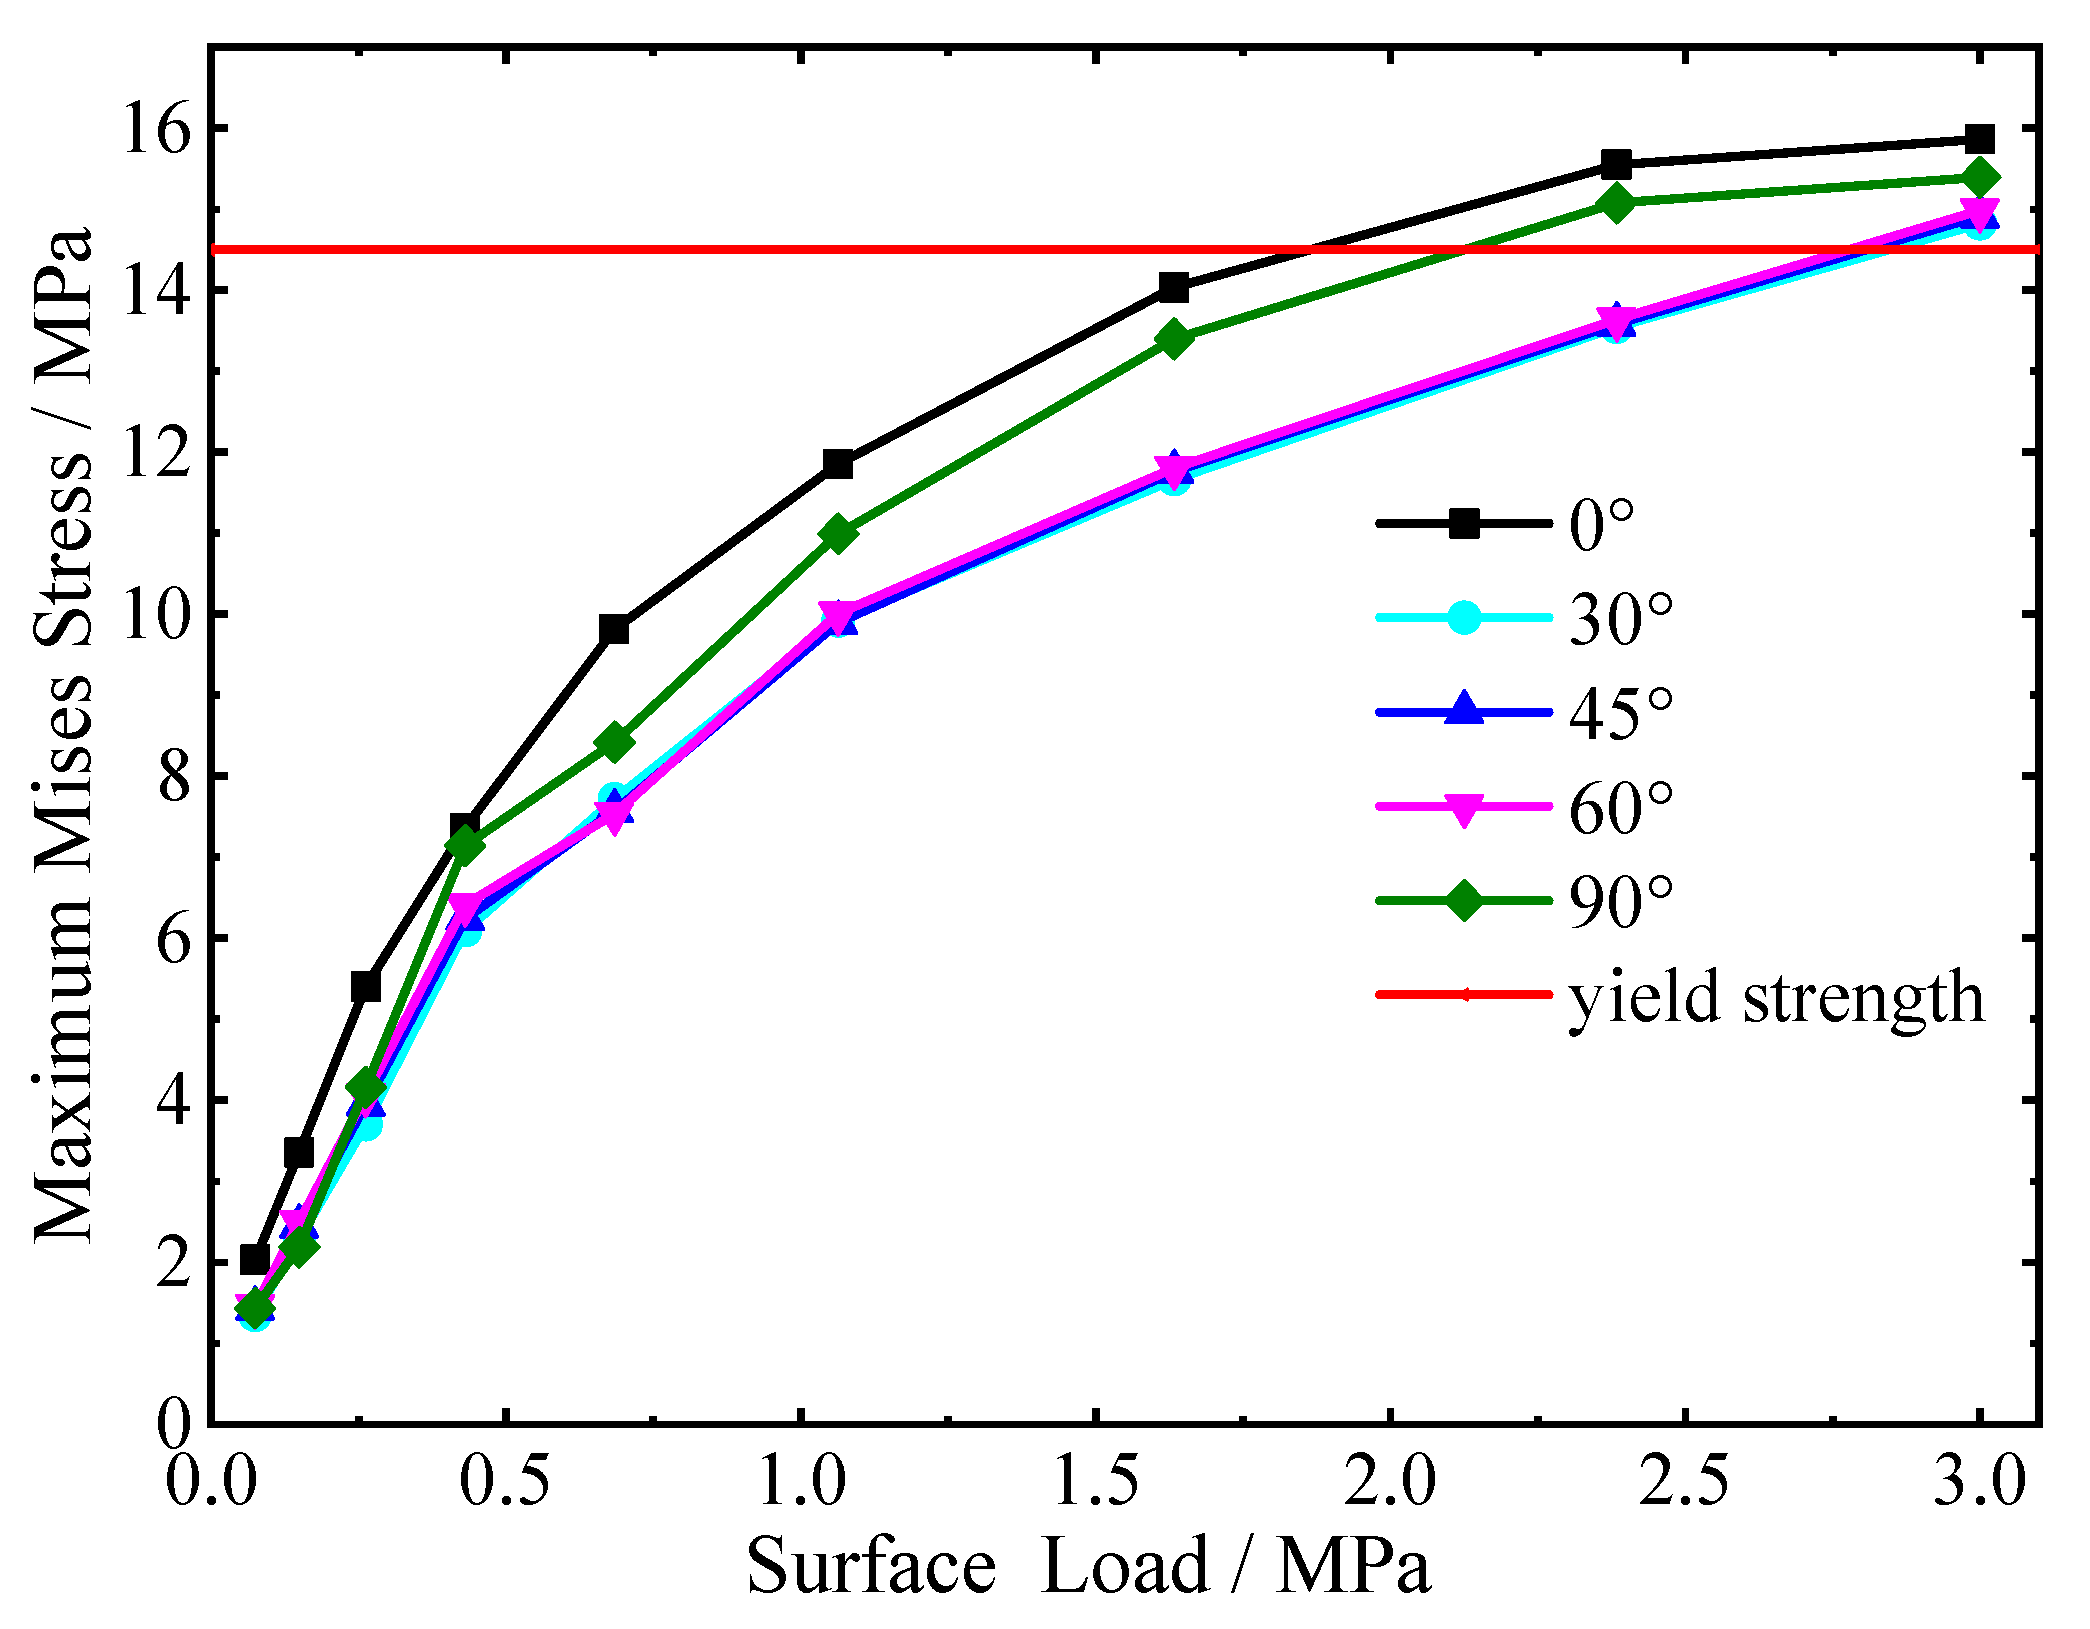
4.2.1. Defect Location
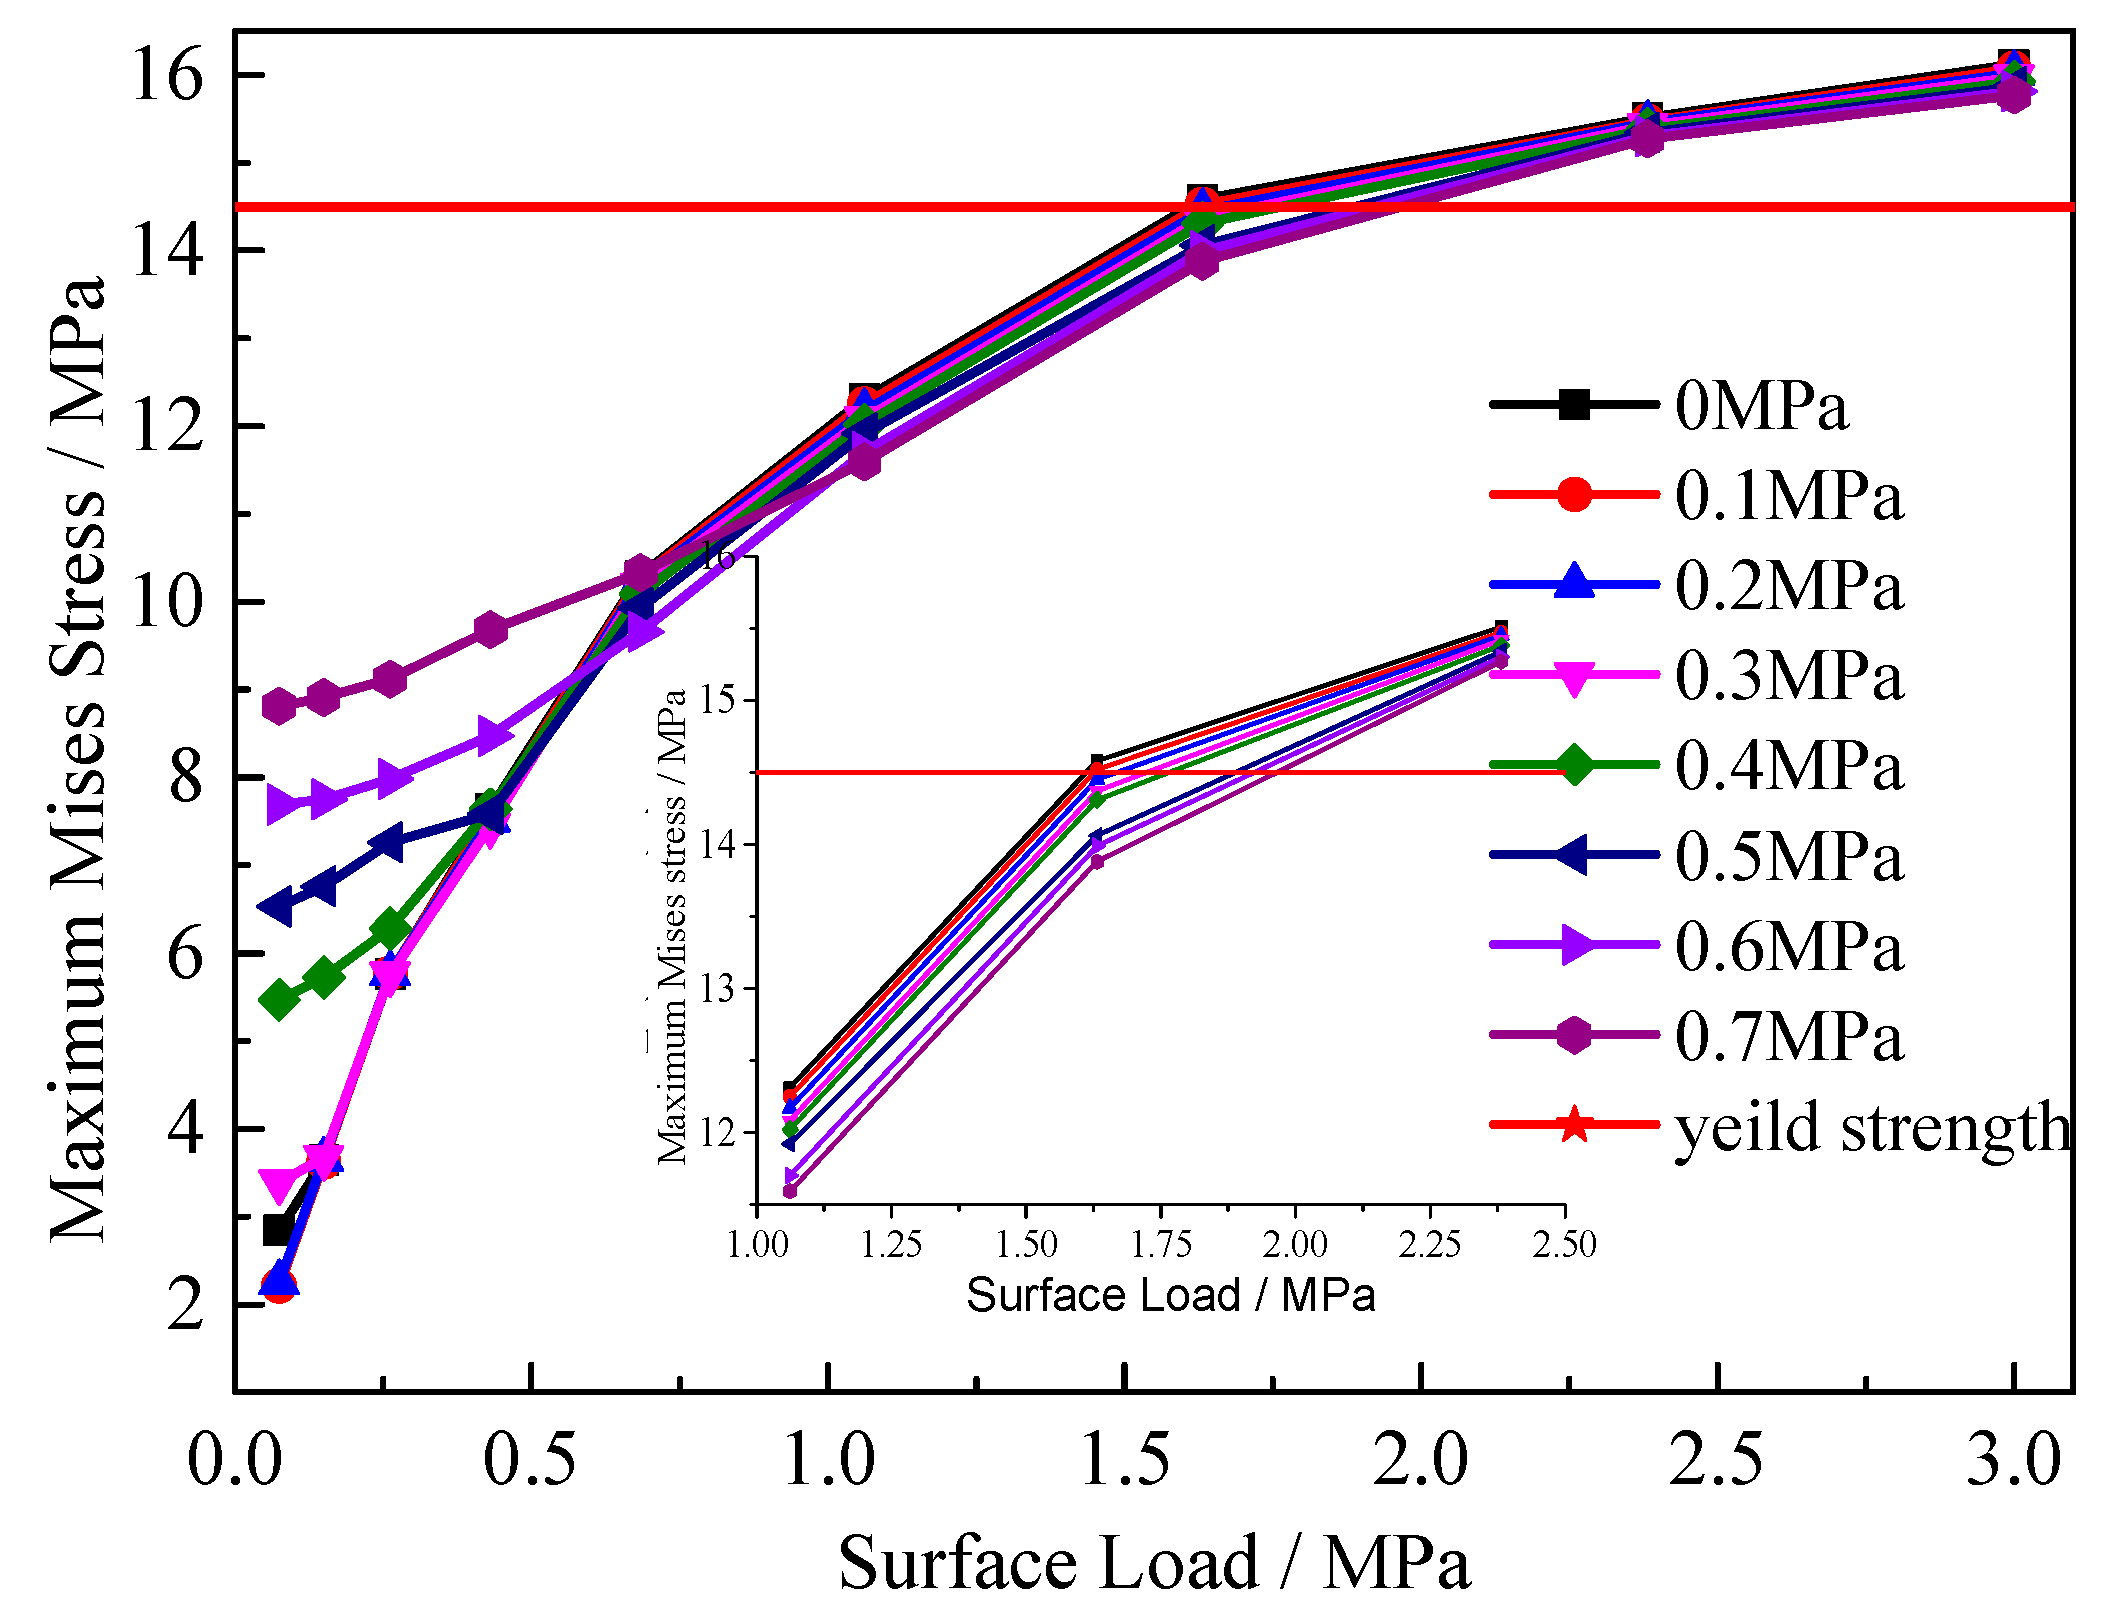
4.2.2. Internal Pressure Load
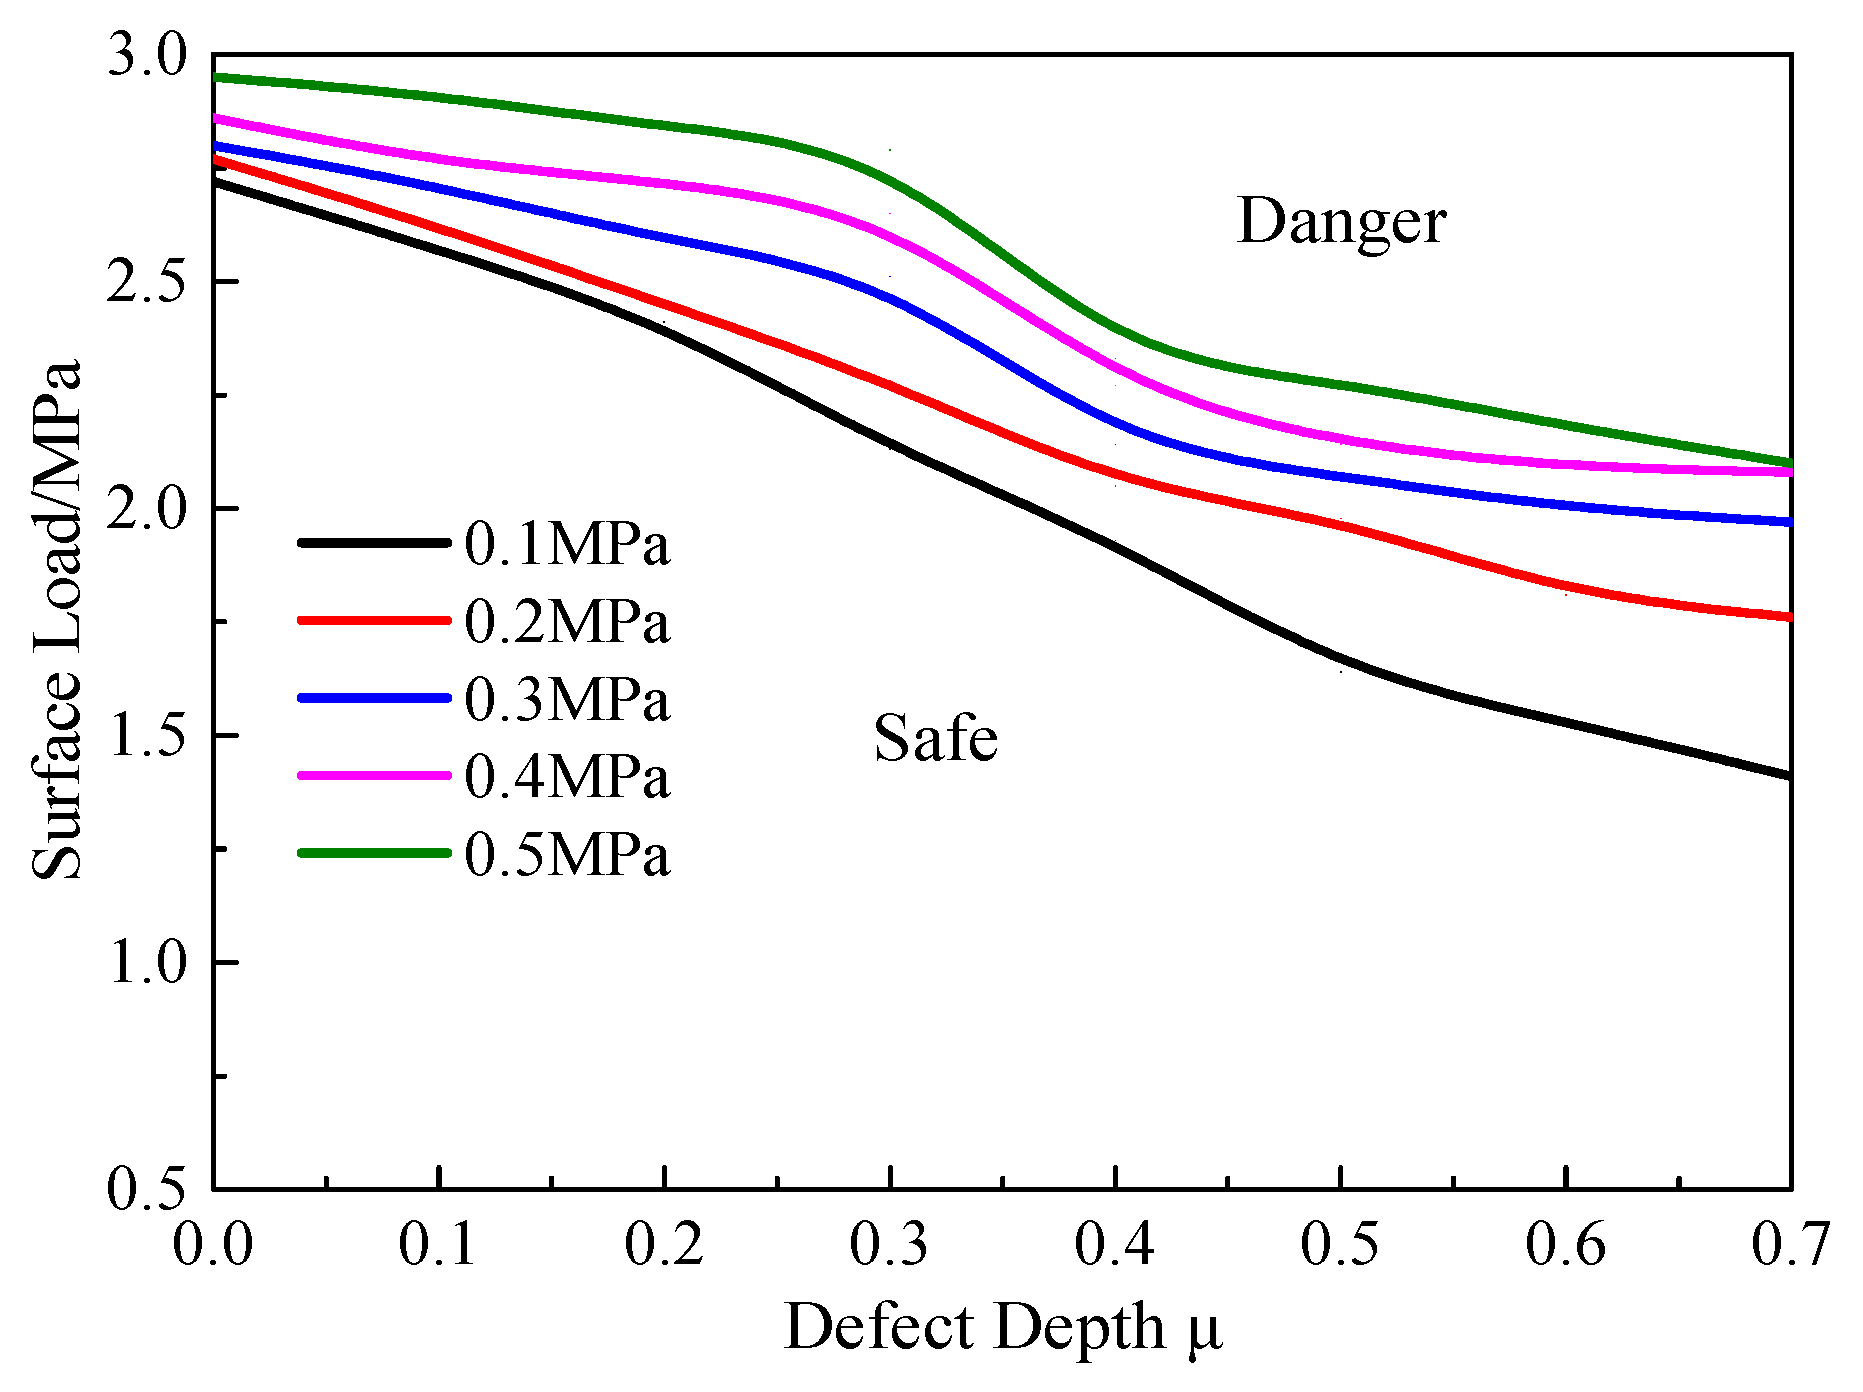
4.2.3. Defect Depth
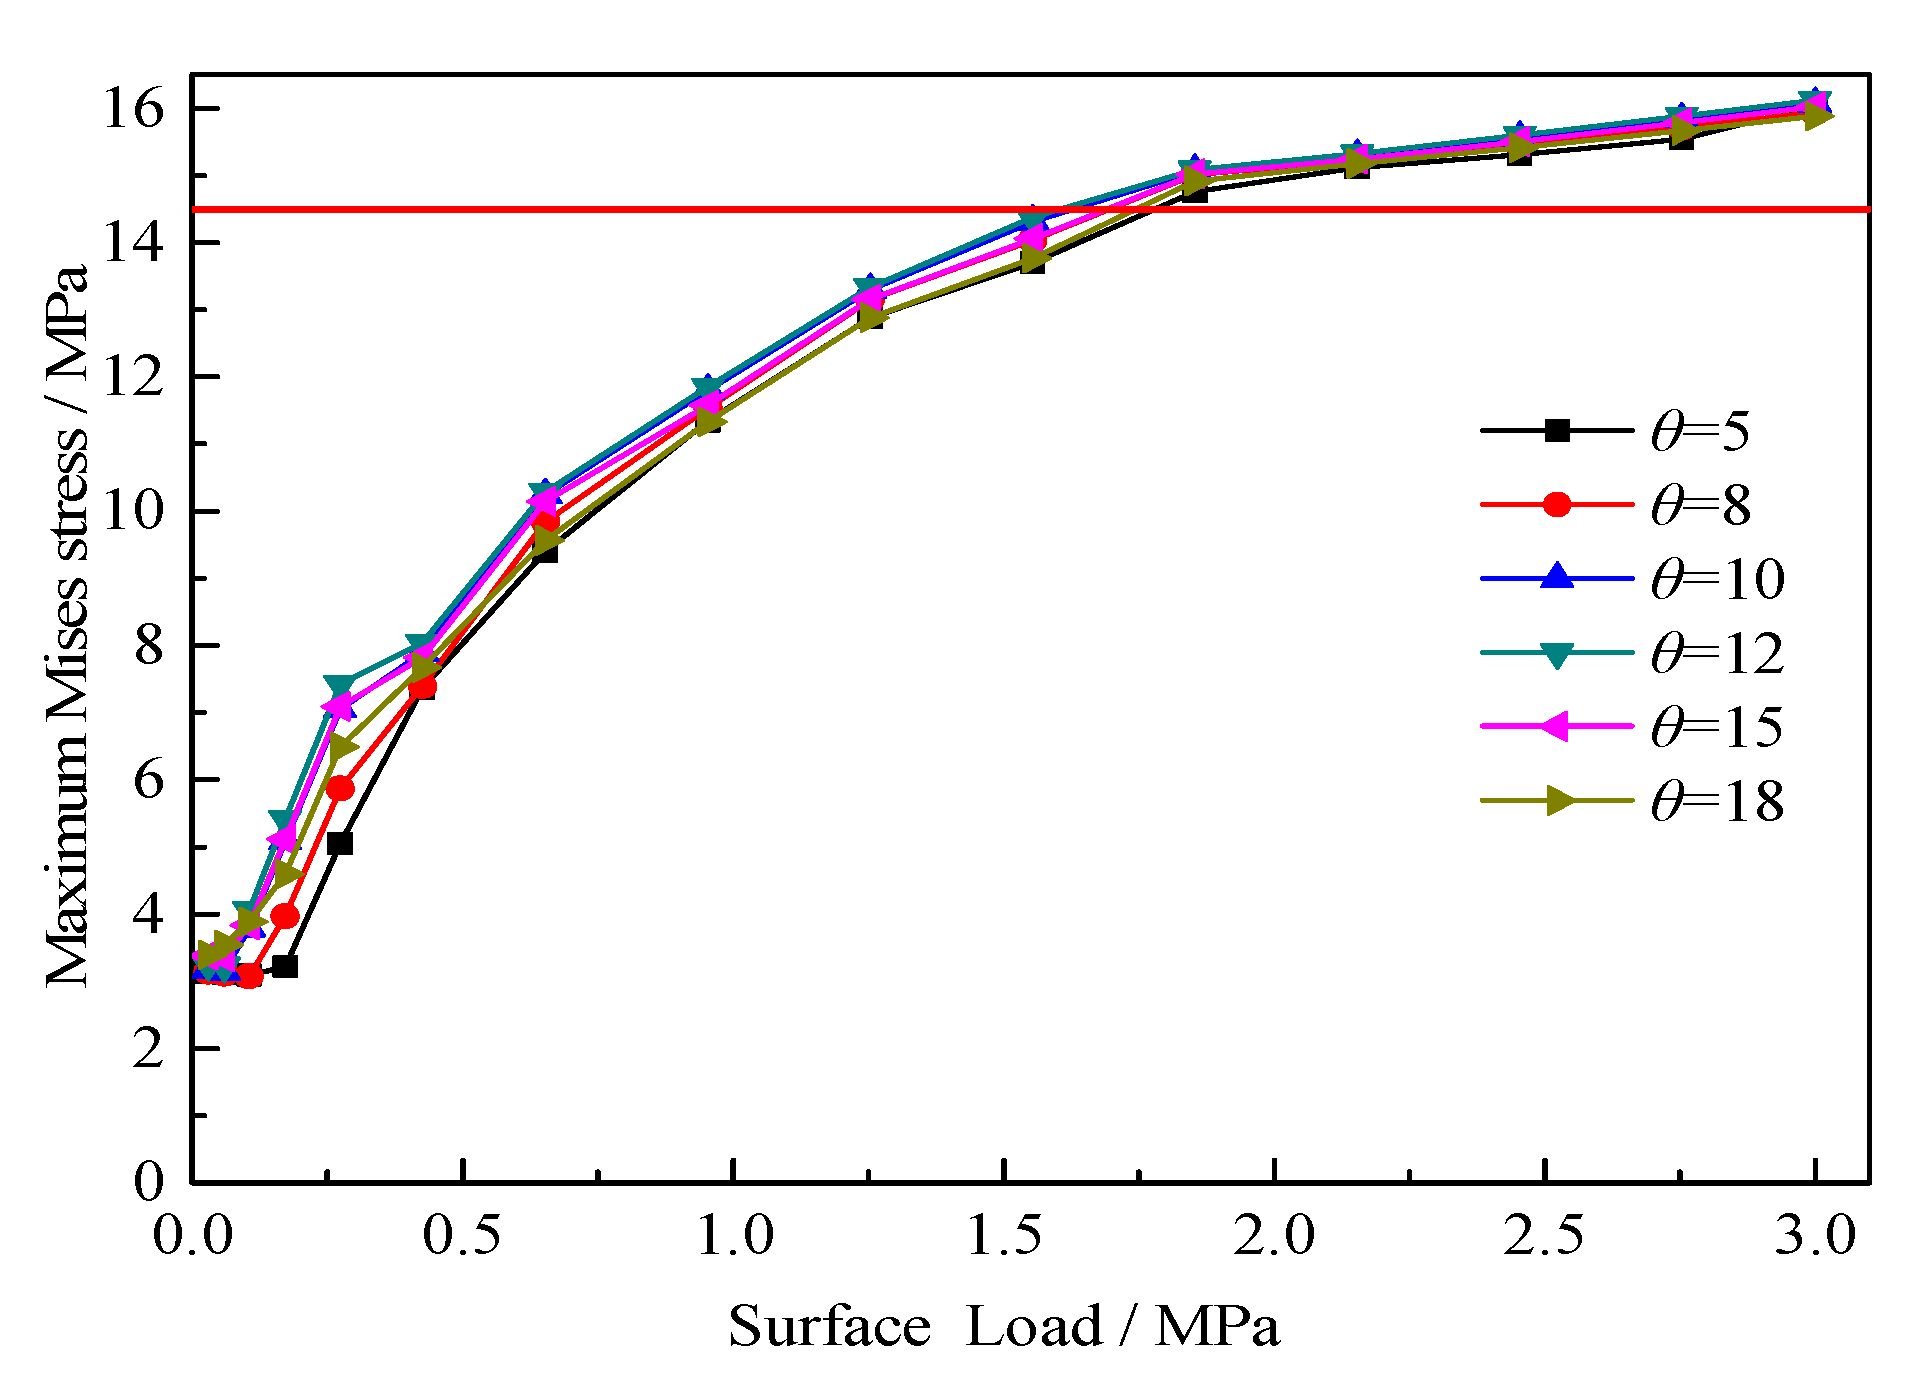
4.2.4. Defect Length
4.2.5. Defect Width
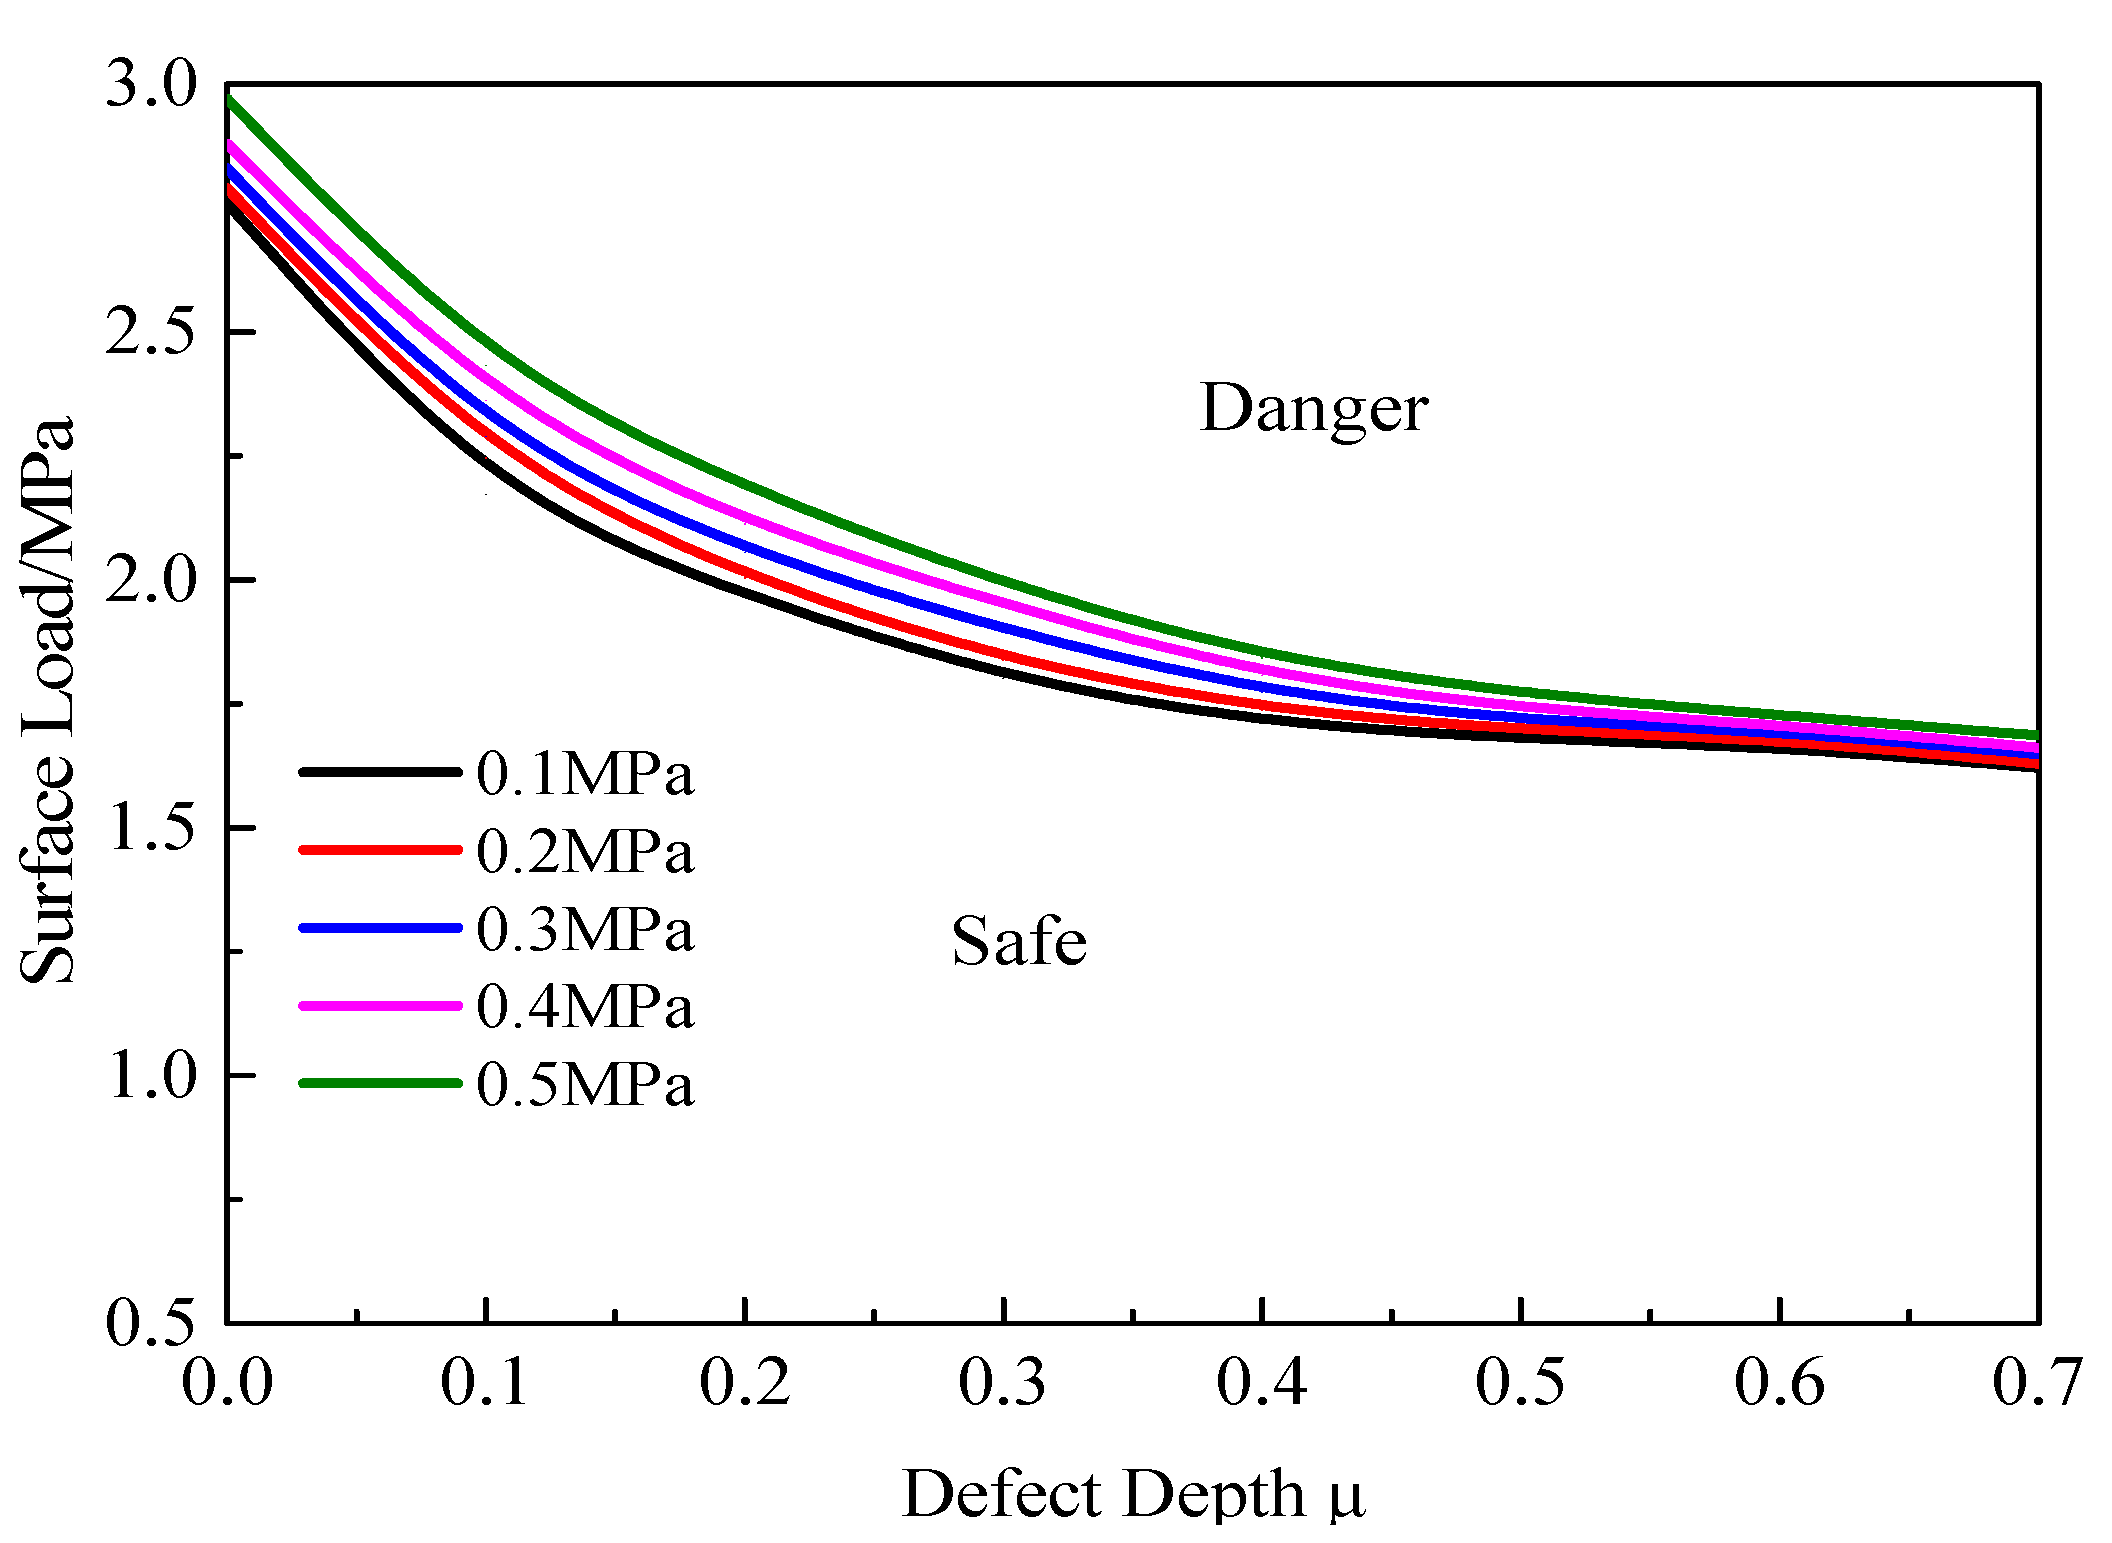
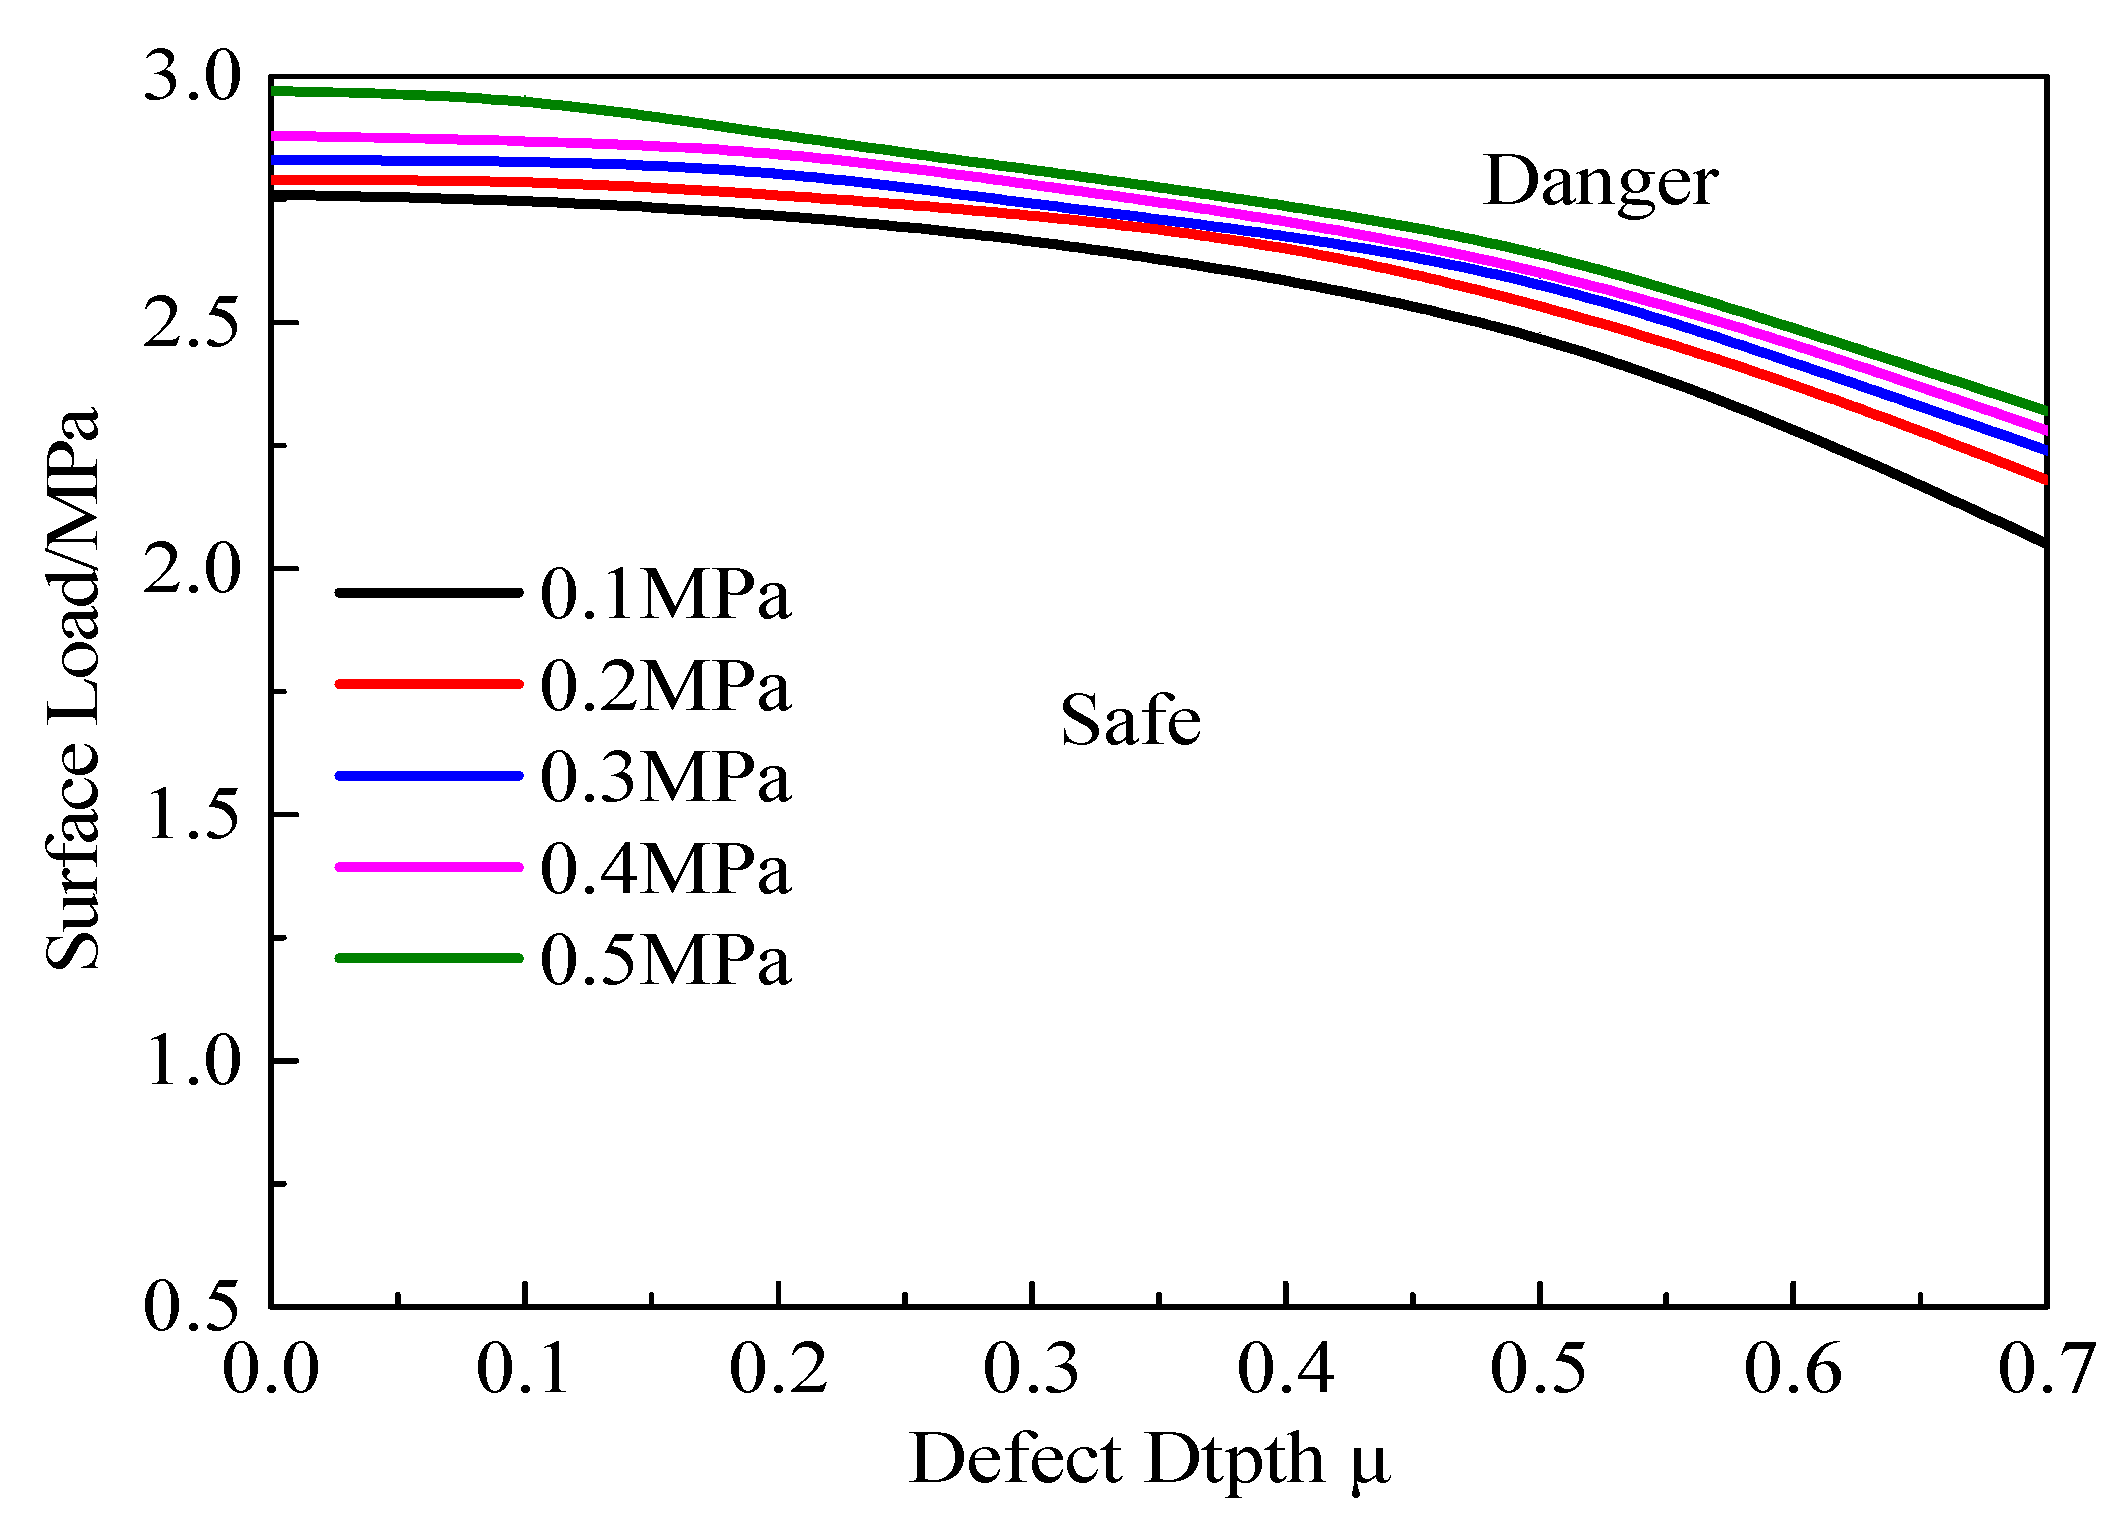
5. Fitness-for-Service Assessment Model Based on Failure Assessment Curves
6. Engineering Applications
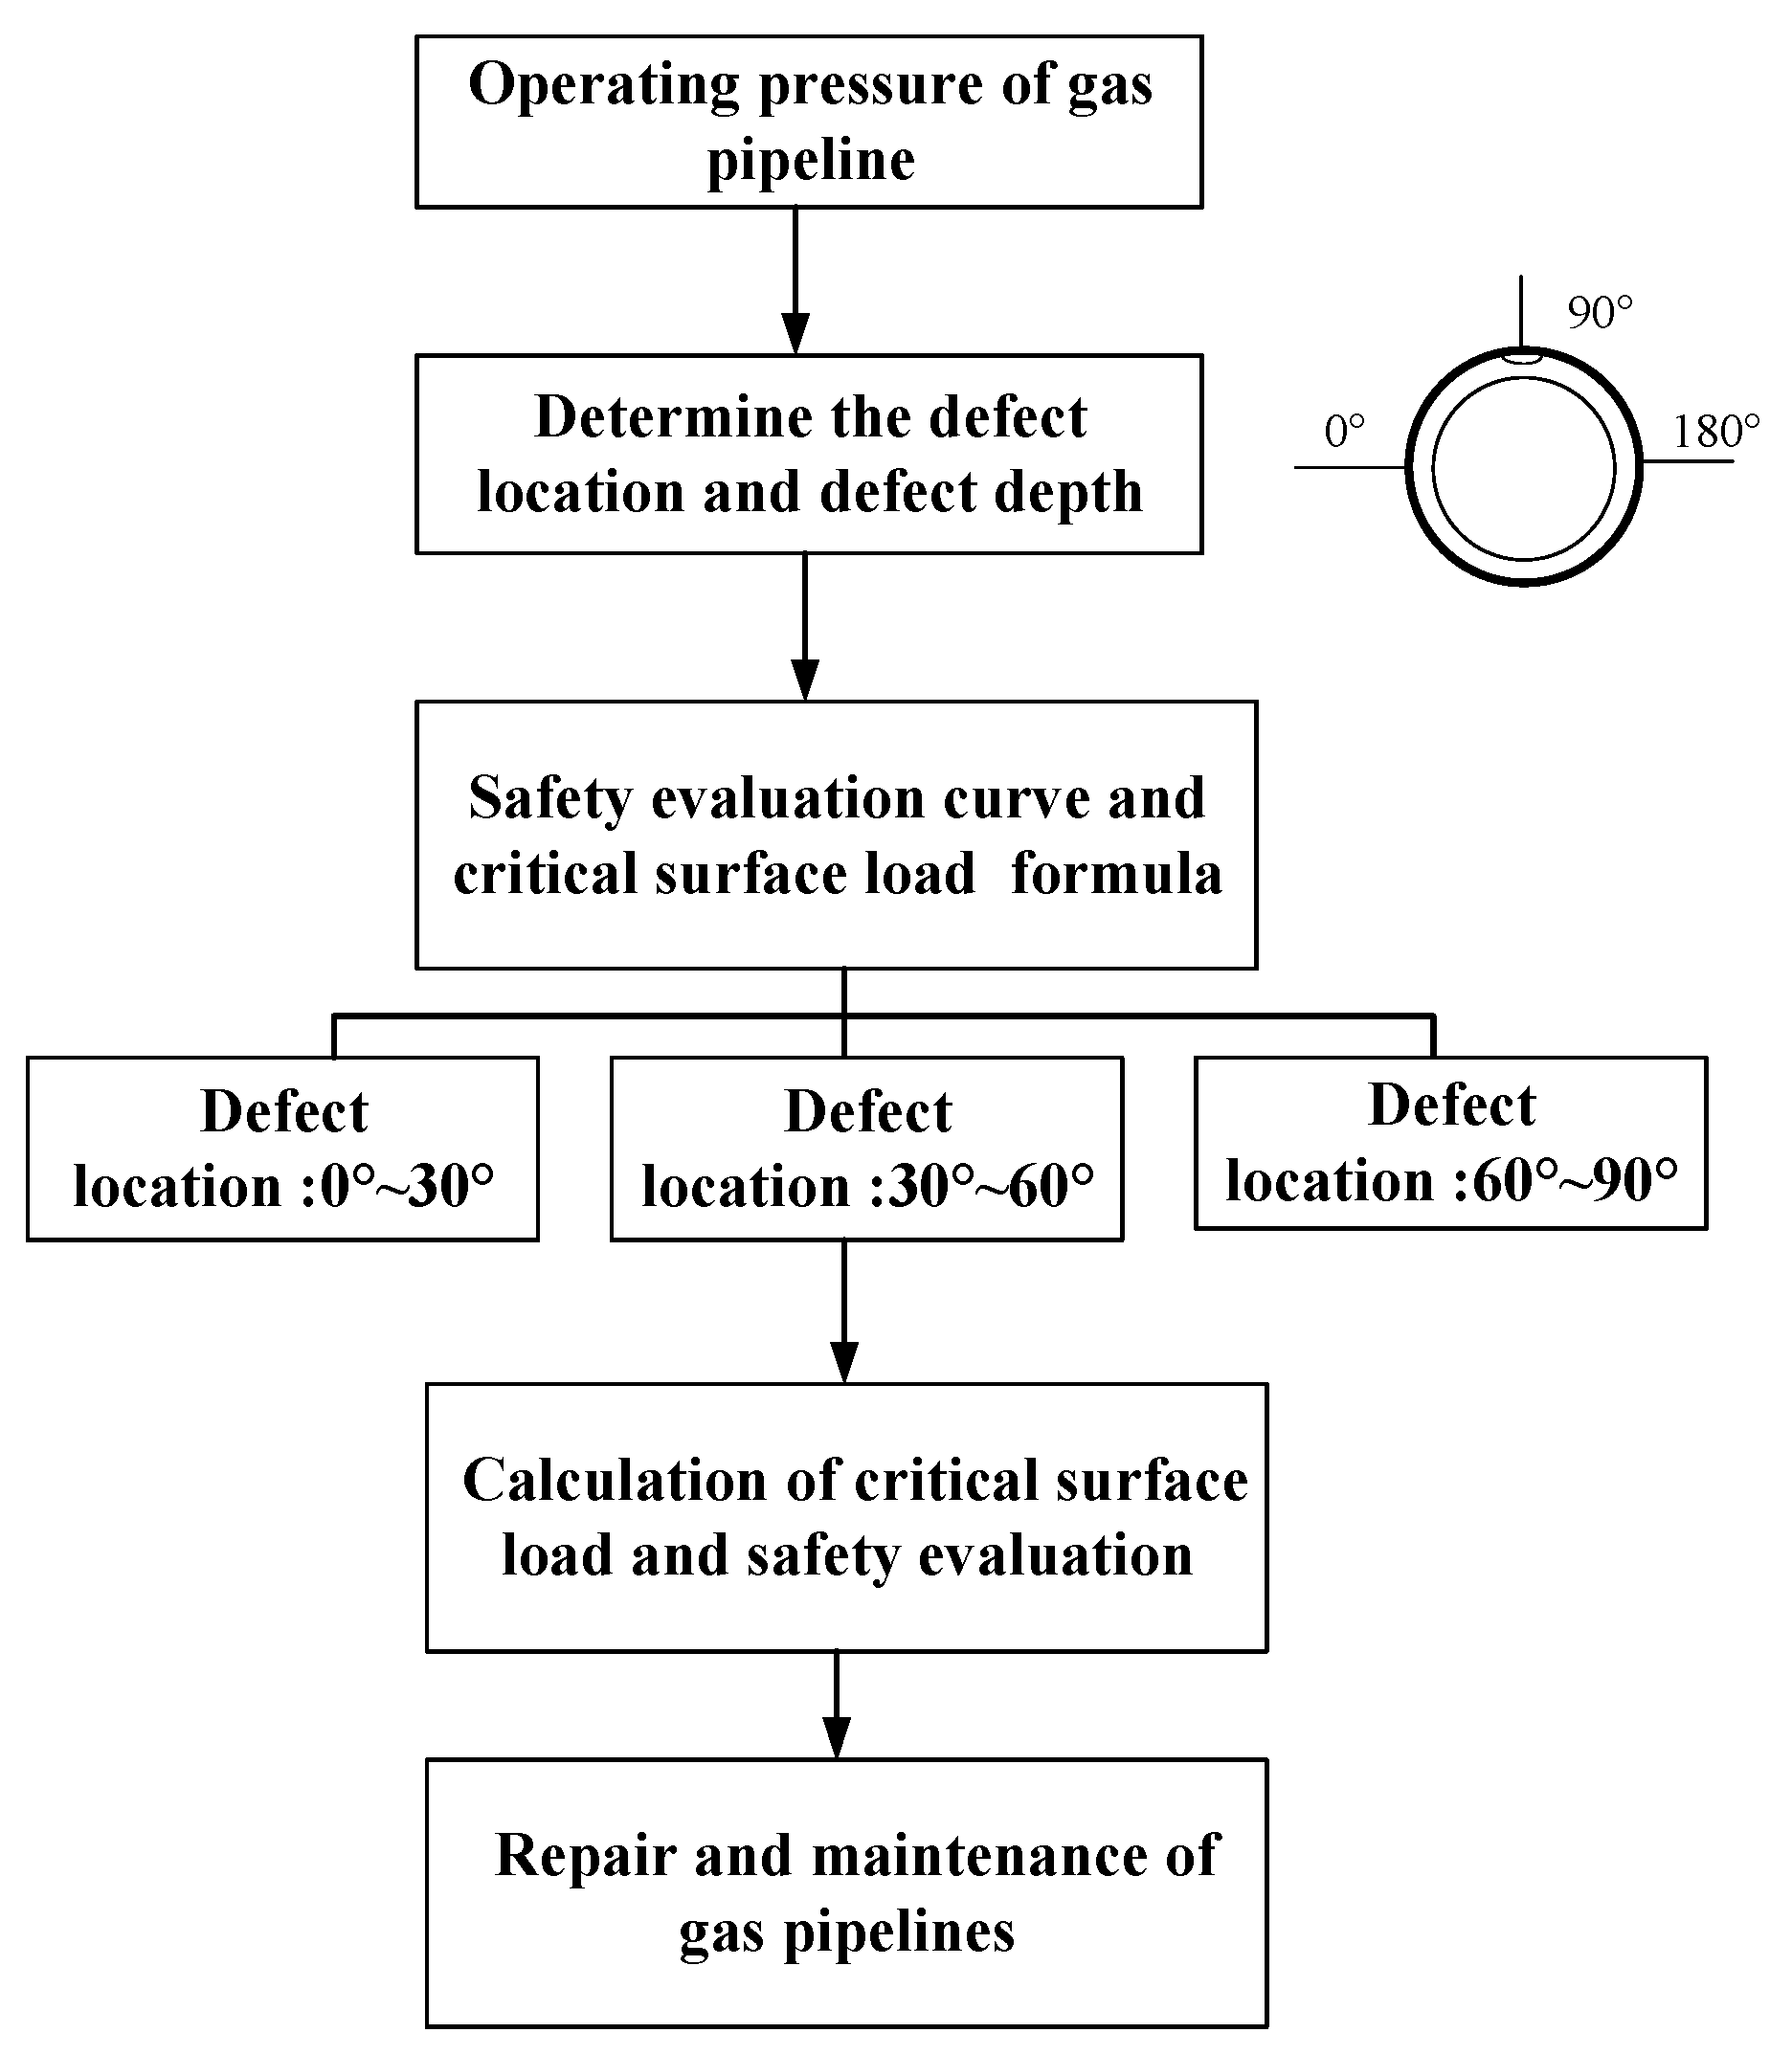
- Determine the operating pressure of the gas pipeline with defects.
- Determine the pipeline defect depth using detection and excavation measures and calculate the ratio of wall thickness to defect depth.
- According to the location of the defect, select the appropriate pipeline safety assessment curve for defects located in the ranges [0°, 30°], [30°, 60°] and [60°, 90°] and evaluate the safety state of the gas pipeline according to the surface load at the upper end of the pipeline.
- Repair dangerous sections of the gas pipeline. The proposed safety evaluation method can guide safety management of gas pipelines.
7. Conclusions
- A solid model of a HDPE pipe with defects under surface load was established. The model considers nonlinearity of the pipe material and soil, nonlinear contact between the pipe and soil, and geometric nonlinearity of pipe deformation. Furthermore, the rationality of the model was verified by comparing the simulation results with previously published results for a pipe with no defects.
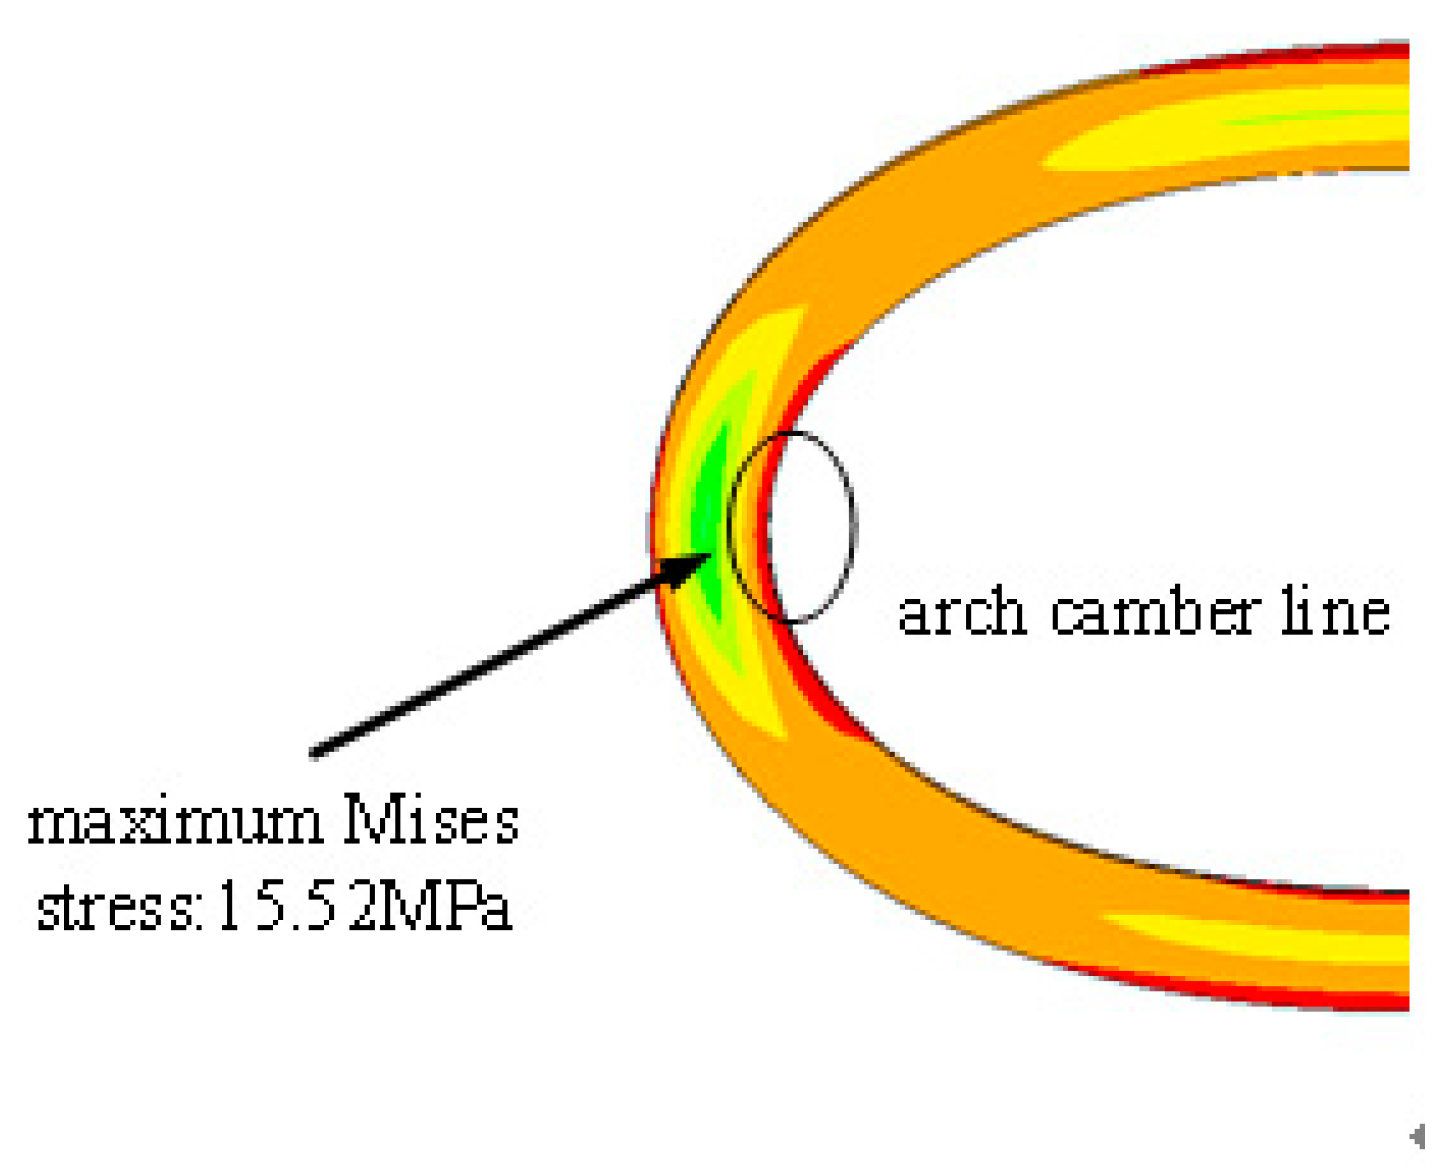
- As the surface load increases, the maximum von Mises stress in the HDPE pipe with defects gradually increases and the position of maximum stress shifts from the top and bottom of the pipe to the defect position and the arch line of the pipe. When the von Mises stress exceeds the yield limit, the pipe fails. The load also leads to the pipeline in the pressure area of the large vertical settlement; therefore, the pipeline is more prone to failure.
- The defect location will affect the failure process of the HDPE pipeline. When the defect is located was 0°, the critical failure load of the pipeline was smallest. The von Mises stress in the pipeline was lowest and the critical failure load was highest when the defect was located at 30°. Under a small surface load, the pressure in the pipe will have the largest influence on the mechanical behavior of the pipeline with defects. In addition, the maximum von Mises stress in the pipe varies with the variation in internal pressure load with increasing surface load. When the maximum von Mises stress in the pipe exceeds the yield limit and expires, the pipe internal pressure will have a minimal impact on the mechanical properties of the pipe.
- As the depth of the defect increases, the maximum von Mises stress of the HDPE pipe also gradually increases and the relationship between defect depth and critical failure load decreases linearly. With increasing defect length, the maximum von Mises stress of the pipe gradually increases; however, the length of the defect will have very little effect once the length exceeds 30 mm. The maximum von Mises stress decreases with increasing defect width.
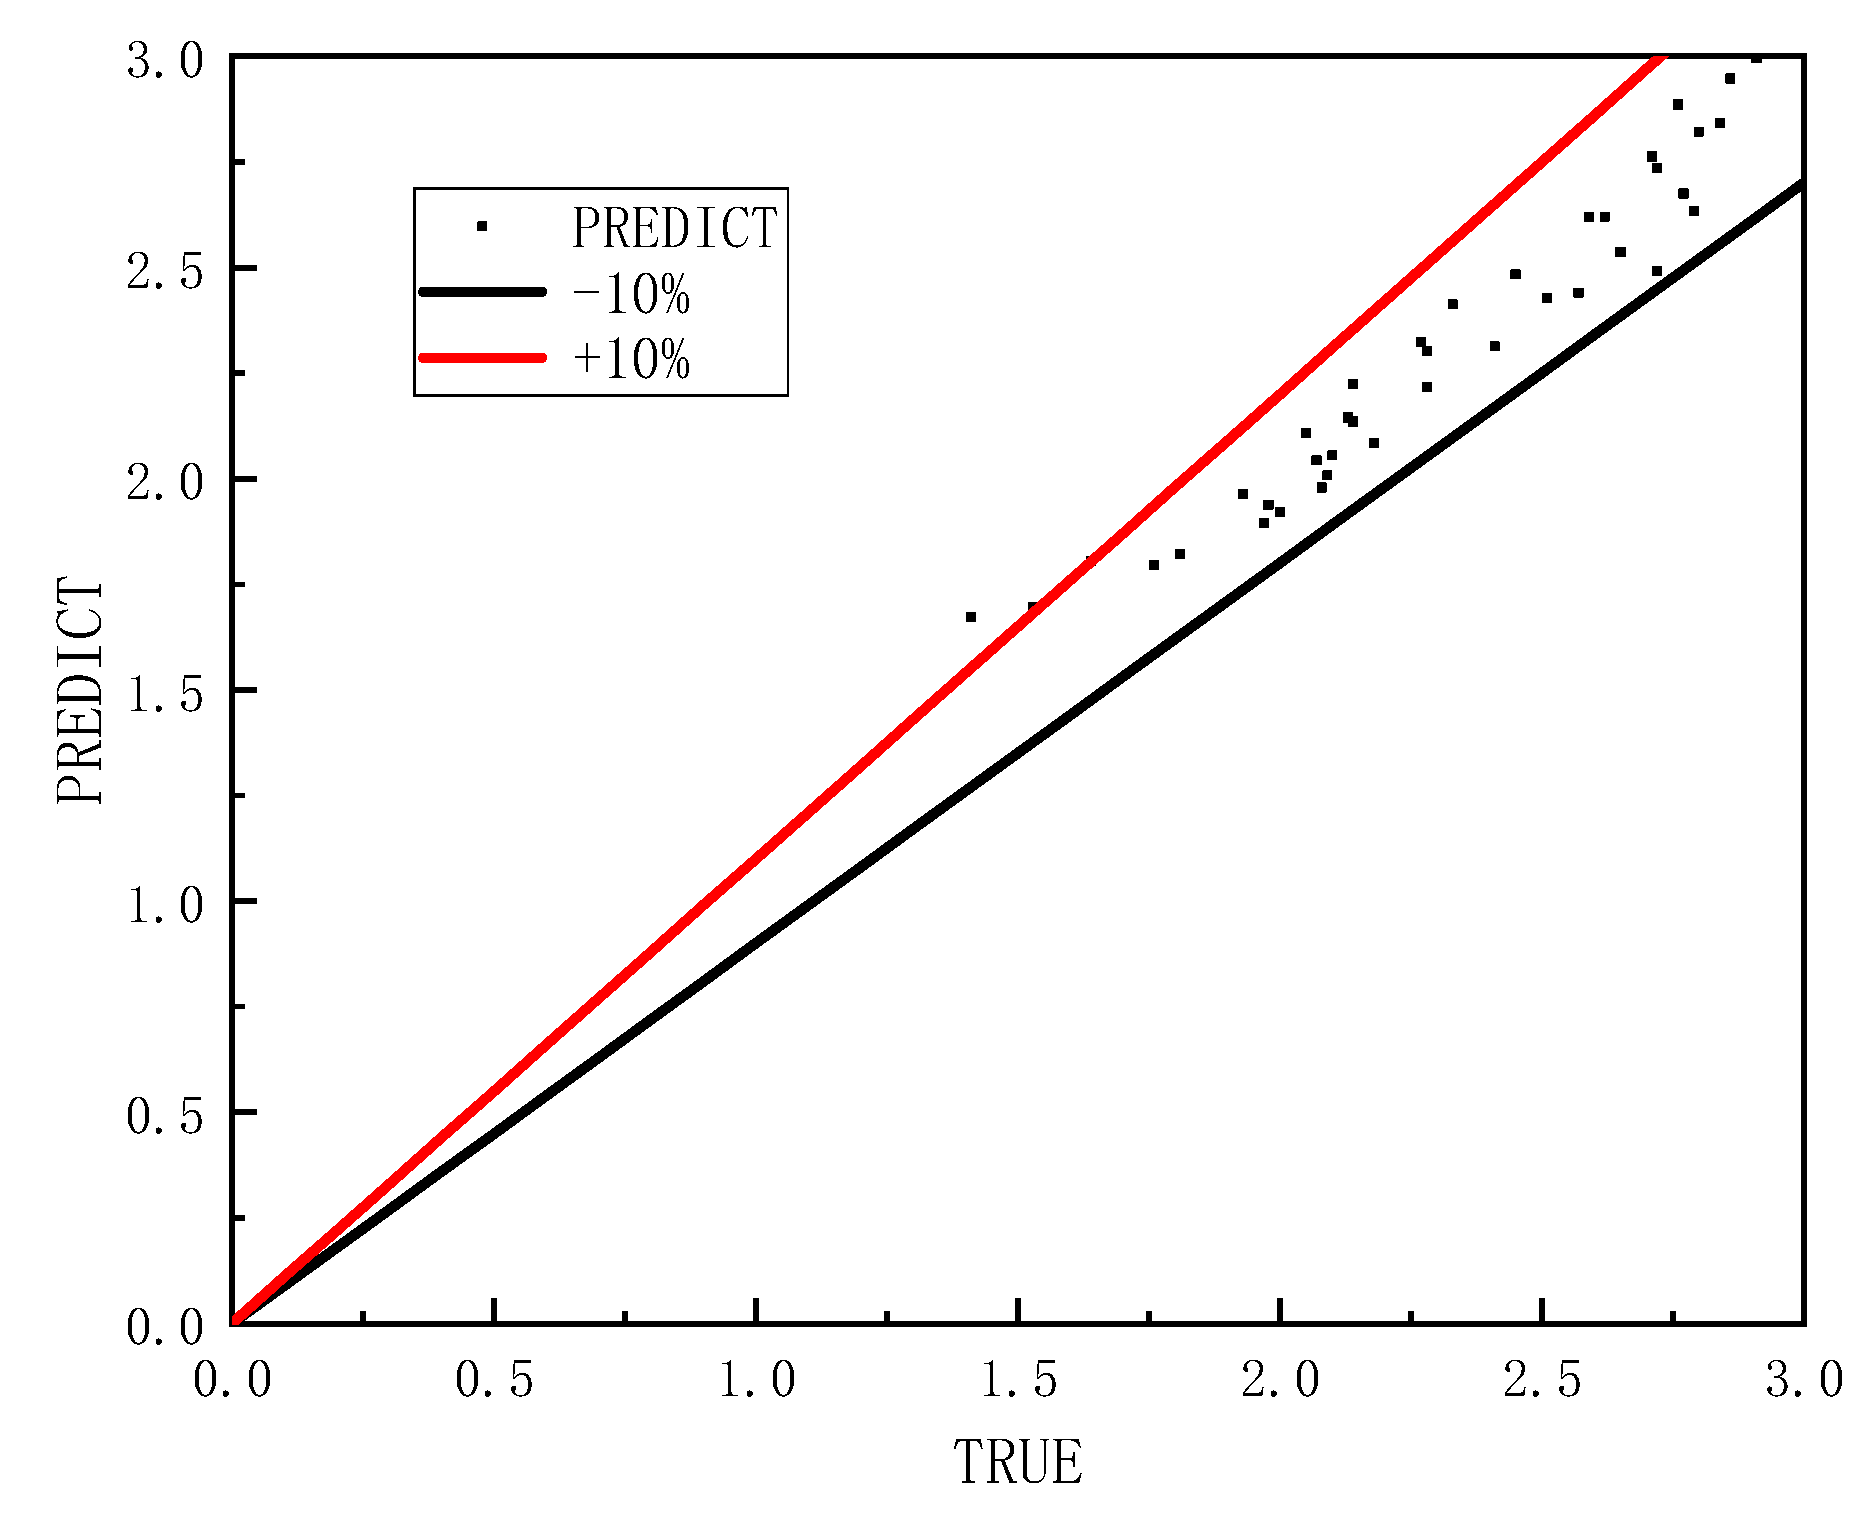
- Failure assessment curves of the HDPE pipeline were obtained for various surface loads, internal pressure loads, and defect depths. The formula for calculating the critical surface load according to defect parameters was obtained with nonlinear fitting. The proposed assessment method can be used as part of the safety evaluation of HDPE pipes with defects. The results of this study provide important reference for preventing gas pipeline accidents.
Author Contributions
Funding
Institutional Review Board Statement
Informed Consent Statement
Data Availability Statement
Acknowledgments
Conflicts of Interest
Nomenclature
| true stress (MPa) | |
| true strain | |
| Poisson ratio | |
| Density () | |
| E | Elastic modulus (MPa) |
| Yield Stress (MPa) | |
| C | soil cohesion (kPa) |
| internal friction angle (°) | |
| dilatancy angle of soil (°) | |
| L | defect length (m) |
| pipe wall thickness (m) | |
| order of magnitude of the defect length | |
| defect circumferential angle (°) | |
| ratio of defect depth to wall thickness | |
| principal stresses 1 (MPa) | |
| principal stresses 2 (MPa) | |
| principal stresses 3 (MPa) | |
| ai | coefficients of the equation |
| internal pressure (MPa) |
References
- Chen, W. The solution of the occupied pipeline in oil field. Oil-Gas Field Surf. Eng. 2012, 31, 70. [Google Scholar]
- Wu, S. Nanjing Xiaguan Gas Pipeline Rupture, Suspected due to Heavy Vehicle Overloading Rolling. N/OL. Yangzi Evening News. Available online: http://news.163.com/13/0307/05/8PBFEI4E00014AED.html (accessed on 7 March 2013).
- Ren, B.; Li, X.P.; Liao, X.; Zhang, K. Analysis on the Safety Hidden Danger of illegal occupation and pressure along the Long Natural gas Pipeline. Technol. Enterp. 2014, 11, 121–127. [Google Scholar]
- Li, M.Y.; Chen, G.H. Finite Element Analysis of Buried PE Gas Pipeline under Traffic Load. China Plast. Ind. 2009, 37, 30–33. [Google Scholar]
- Zhu, Y. Traction calculation of HDPE pipe with trenchless directional drilling. Water Technol. 2012, 6, 61–64. [Google Scholar]
- Huang, L.H.; Xu, Y.F. High density polyethylene HDPE pipeline construction leakage prevention measures. Constr. Sci. Technol. 2016, 10, 130–131. [Google Scholar]
- Guo, X.J. The Deformation and Failure Mechanism of HDPE Pipes in Horizontal Directional Drilling back to the Trailer and Numerical Simulation. Master’s Thesis, Chengdu University of Technology, Chengdu, China, 2011. [Google Scholar]
- Shuai, J.; Wang, X.L.; Ye, Y.X.; Zuo, S.Z. Stress analysis of pipeline subject to surface load. J. China Univ. Pet. 2009, 33, 99–103. [Google Scholar]
- Li, J.P.; Ding, S.J. Influence of Additional Load Caused by Adjacent Buildings on Underground Pipeline. J. Tongji Univ. 2004, 32, 1553–1557. [Google Scholar]
- Yang, J.T. Research on longitudinal Mechanical Characteristics of Pipelines Buried in Soft Soil under Vertical Loads. Master’s Thesis, Zhejiang University, Hangzhou, China, 2006. [Google Scholar]
- Zhang, J.; Liang, Z. Mechanical behavior analysis of a buried steel pipeline underground overload. Eng. Fail. Anal. 2016, 63, 131–145. [Google Scholar] [CrossRef]
- Ma, F.S.; Zhao, H.J.; Zhang, Y.M.; Zhao, J.; Wang, J.; Wei, A.H.; Gong, C.C. Numerical Simulation of Gas Pipeline Deformation under Load; Institute of Geology and Geophysics, Chinese Academy of Sciences: Beijing, China, 2011. [Google Scholar]
- Han, C.J.; Zhang, H.; Zhang, J.; Li, Q. Analysis on influence of surface load to stress-strain characteristics of pipeline buried in hard rock region. J. Saf. Sci. Technol. 2015, 11, 23–29. [Google Scholar]
- Li, J.; Zhang, H.; Wu, K.; Gu, X.T.; Xia, M.Y.; Liu, X.B. Failure behavior analysis on PE gas pipeline under the effect of third-party excavation. J. Saf. Sci. Technol. 2017, 13, 108–116. [Google Scholar]
- Zhang, J.; Liang, Z.; Han, C. Numerical Simulation of Pipeline Deformation Caused by Rock fall Impact. J. Sci. World J. 2014, 2014, 161898. [Google Scholar]
- Zheng, J.Y.; Lu, S.L.; Ma, J.J.; Shi, J.F. Numerical Simulation of Mechanical Response of Buried Polyethylene Pipes Under Surface Load. China Plast. 2014, 28, 60–64. [Google Scholar]
- Ren, J.D.; Wang, W.; Dong, M.; Gao, S. Analysis of deformation and mechanical characteristics of buried pipelines in mining subsidence areas. China Saf. Sci. J. 2020, 30, 86–93. [Google Scholar]
- Ma, J.J. Numerical Simulation of Strength of Buried Polyethylene Pipe under Typical Complex Loading. Master Thesis, Zhejiang University, Hangzhou, China, 2013. [Google Scholar]
- Liu, P.F.; Zheng, J.Y.; Zhang, B.J.; Shi, P. Failure analysis of natural gas buried X65 steel pipeline under deflection load using finite element method. Mater. Des. 2010, 31, 1384–1391. [Google Scholar] [CrossRef]
- Li, M.; Zhang, H.; Wang, B.D.; Liu, X. Failure analysis and safety evaluation on P110 oil tube containing corrosion defects based on finite element method. J. Saf. Sci. Technol. 2016, 12, 93–99. [Google Scholar]
- Zhang, J.; Liang, Z.; Han, C.J.; Zhang, H. Buckling behavior analysis of a buried steel pipeline in rock stratum impacted by a rock fall. Eng. Fail. Anal. 2015, 58, 281–294. [Google Scholar] [CrossRef]
- Vazouras, P.; Karamanos, S.A.; Dakoulas, P. Finite element analysis of buried steel pipelines under strike-slip fault displacements. Soil Dyn. Earthq. Eng. 2010, 30, 1361–1376. [Google Scholar] [CrossRef]


| Poisson Ratio | Density | Elastic Modulus E/MPa | Yield Stress /MPa |
|---|---|---|---|
| 0.45 | 951 | 1115 | 14.5 |
| Poisson Ratio | Density | Elastic Modulus E/MPa | Soil Cohesion C/kPa | Internal Friction Angle /° | Dilatancy Angle /° |
|---|---|---|---|---|---|
| 0.4 | 1867.3 | 20 | 29.3 | 28.7 | 0 |
| a1 | a2 | a3 | a4 | a5 | a6 | a7 |
|---|---|---|---|---|---|---|
| −2.005 | 3.960 | −2.782 | 1.858 | 0.309 | 1.233 | 1.353 |
| a1 | a2 | a3 | a4 | a5 | a6 | a7 |
|---|---|---|---|---|---|---|
| −1.116 | −0.349 | −0.115 | 2.850 | 0.163 | 0.710 | 0.931 |
| a1 | a2 | a3 | a4 | a5 | a6 | a7 |
|---|---|---|---|---|---|---|
| 4.845 | −4.871 | −0.040 | 2.292 | 0.614 | 0.566 | 0.919 |
Publisher’s Note: MDPI stays neutral with regard to jurisdictional claims in published maps and institutional affiliations. |
© 2021 by the authors. Licensee MDPI, Basel, Switzerland. This article is an open access article distributed under the terms and conditions of the Creative Commons Attribution (CC BY) license (https://creativecommons.org/licenses/by/4.0/).
Share and Cite
Liu, J.; Zhang, H.; Wang, B.; Zhang, D.; Ji, B.; Fei, F.; Liu, X. An Accurate and Efficient Fitness-For-Service Assessment Method of Pipes with Defects under Surface Load. Energies 2021, 14, 5521. https://doi.org/10.3390/en14175521
Liu J, Zhang H, Wang B, Zhang D, Ji B, Fei F, Liu X. An Accurate and Efficient Fitness-For-Service Assessment Method of Pipes with Defects under Surface Load. Energies. 2021; 14(17):5521. https://doi.org/10.3390/en14175521
Chicago/Turabian StyleLiu, Jianping, Hong Zhang, Baodong Wang, Dong Zhang, Beilei Ji, Fan Fei, and Xiaoben Liu. 2021. "An Accurate and Efficient Fitness-For-Service Assessment Method of Pipes with Defects under Surface Load" Energies 14, no. 17: 5521. https://doi.org/10.3390/en14175521
APA StyleLiu, J., Zhang, H., Wang, B., Zhang, D., Ji, B., Fei, F., & Liu, X. (2021). An Accurate and Efficient Fitness-For-Service Assessment Method of Pipes with Defects under Surface Load. Energies, 14(17), 5521. https://doi.org/10.3390/en14175521