Article

Numerical Investigation of the Influence of Vegetation on the Aero-Thermal Performance of Buildings with Courtyards in Hot Climates

Department of Architecture and Built Environment, University of Nottingham, University Park, Nottingham NG7 2RD, UK
*
Author to whom correspondence should be addressed.
Energies 2021, 14(17), 5388; https://doi.org/10.3390/en14175388
Submission received: 28 June 2021 / Revised: 20 August 2021 / Accepted: 24 August 2021 / Published: 30 August 2021

Abstract

:
Natural ventilation is an energy-efficient way to provide fresh air and enhance indoor comfort levels. The wind-driven natural ventilation in courtyards has been investigated by many researchers, particularly the influence of the spatial configuration and environmental parameters on the ventilation and thermal comfort performance. However, previous research has mainly focused on the courtyard region instead of the indoor spaces surrounding it. Additionally, as a microclimate regulator, courtyards are rarely assessed in terms of the impact of vegetation, including its impact on energy consumption and thermal comfort. Evapotranspiration from vegetation can help lower air temperature in the surrounding environment and, therefore, its influence on the ventilation and thermal comfort in buildings with courtyards should be evaluated. The present study investigates the impact of vegetation on the aero-thermal comfort conditions in a courtyard and surrounding buildings in hot climates. Computational fluid dynamics was employed to evaluate the aero-thermal comfort conditions of the courtyard and surrounding buildings with different configurations of vegetation. The modeling was validated using previous works’ experimental data, and good agreement was observed. Thermal comfort indices were used to assess thermal performance. The study also evaluated the cover, height and planting area of vegetation in the courtyard. The results of this study can help develop tools that can assist the addition of vegetation in courtyards to maximize their effects. Future works will focus on looking at the influence of the strategies on different designs and layouts of courtyards.

1. Introduction and Literature Review

The building sector consumes a great amount of energy and resources. Over 40% of the world’s energy demand comes from buildings and is still increasing [1]. In hot climates in particular, cooling and ventilation technologies are responsible for a significant portion of the building’s energy consumption. A passive cooling strategy can play an important role in enhancing energy efficiency, reducing indoor overheating and improving thermal comfort [2]. The integration of such strategies in building design has been gaining popularity among architects [3]. Appropriate selection and integration of passive cooling technology are critical in reducing energy consumption in buildings. As the awareness of the cost and environmental impact of energy use increases, passive cooling technologies such as natural ventilation have become increasingly attractive methods compared with the more common mechanical ventilation methods [4,5].
Another passive cooling strategy is a courtyard. Traditionally, buildings were built around an open space, often described as a courtyard, which is an architectural feature that can help improve the microclimate of the courtyard and surrounding areas [5]. Courtyards have a long history and are common in China, India and some Middle East countries. Courtyards inside buildings are widely used to enhance natural ventilation and provide shading in the summer. The presence of a courtyard can generate a difference in air temperature between the outdoor and the indoor area, generating airflow movement. Thus air is drawn into the room under the effect of wind and buoyancy forces. Taleghani et al. [6] compared three architectural forms (courtyards, pavilions, and ordinary buildings) on the hottest day in the Netherlands by monitoring the air temperature. They concluded that the courtyard provides the best microclimate conditions as compared to the three urban forms. However, the interaction of different factors in the courtyard leads to uneven air temperatures distribution.
Rojas et al. [7] compared numerical computational fluid dynamics (CFD) results with monitored air temperature data in a courtyard of a hotel in Spain. They demonstrated that the flow pattern in the semi-enclosed courtyard significantly changed as compared to the enclosed courtyard. Rajapaksha et al. [8] showed that internal courtyards increased the efficiency of natural ventilation to reduce indoor overheating. Ernest et al. [9] investigated several courtyard designs and identified the role of convective cooling in the transition space. The orientation of courtyards also influences the thermal and energy performance of the surrounding building. Muhayson and Gadi [10] emphasized the effect of different proportions of courtyards on the building energy consumption in Rome. They concluded that self-shading of courtyard buildings led to about a 4% decrease in cooling load in summer.
The thermal performance and microclimate condition of courtyards was investigated by many researchers using numerical simulation and field-monitoring methods. The present study focuses on the effects of courtyard design (such as geometry, proportion, orientation, and materials) and the impacts of the components/features of the courtyard (such as vegetation, water pool, and shading devices) on thermal conditions, ventilation and energy consumption [11]. Taleghani et al. [12] summarized the historical development of the courtyard. The courtyard architectural design emerged from the ancient civilization in Tunisia and China. Courtyards also appeared in traditional Greek and Roman buildings for obtaining sufficient sunlight in the winter. In Islamic civilizations, the development of courtyards was driven by not only their thermal performance but also their privacy features, as well as the aesthetic of the architectural design. In the modern era, the courtyard has been designed focusing on thermal performance and culture.
Many researchers investigated the performance of the courtyard based on different climates, especially in hot and humid climates. Paul et al. [13] conducted a field monitoring and questionnaire survey to test one courtyard in northern Nigeria (Bauchi, Nigeria) and investigated the thermal condition of the courtyard. They discovered that some occupants prefer large courtyards, especially those located in the center of the building, contributing to better airflow and natural ventilation, saving the cost of using cooling and heating equipment in hot and humid climates. Al-Masri and Abu-Highleh [14] performed energy simulations of traditional and courtyard buildings in the Arab region to establish the optimal courtyard building model. They compared the impact of different building materials on building performance. The authors demonstrated that the baseline courtyard building model keeping the original building material had a 6.9% reduction in the year-round total energy consumption. Compared to the reference traditional building, the optimized courtyard model presented an 11.16% reduction in annual energy consumption.
Some courtyards are decorated with vegetative elements such as trees, flowers and shrubs, which not only provide beauty and tranquility, but a combination that also provides shade and increases the relative humidity of the courtyard area, acting as a microclimate regulator [15]. The transpiration and the shading by vegetation plays an important role in regulating the microclimate of the courtyard [16]. Malys et al. [17] showed that the introduction of vegetation in and around buildings positively influences the interior of buildings in terms of thermal comfort. The study showed that the vegetation planting pattern and arrangement could influence the ventilation of the courtyard.
Several researchers studied the addition of vegetation to increase the humidity and improve the microclimate in courtyards. Salata et al. [18] studied the effect of the vegetation and high albedo materials on thermal comfort, revealing that outdoor thermal comfort can be improved by increasing the proportion of vegetation cover in urban courtyards in hot and arid areas. They employed the ENVI-MET software (v3.1. Roma, Italy) to carry out the modelling and validated the results with field measurement. Five scenarios with different vegetation and materials were simulated, and the results (air temperature, mean radiant temperature, relative humidity, wind speed) were compared. Their research demonstrated that vegetation could reflect direct shortwave radiation, and the transpiration effect can reduce ambient air and average radiation temperatures, enabling outdoor Predicted Mean Vote (PMV) to decrease by 1.5 in summer.
Zango et al. [16] examined the air temperature difference in the Chinese shop house in Malacca based on different percentages of vegetation (18% and 69%) within the same courtyard area. The outcomes of their study presented a difference of 3 °C between a 69% vegetated courtyard and an 18% vegetated courtyard. The results suggested the ability of vegetation to regulate the temperature in the courtyard. Shashua-Bar et al. [19] analyzed outdoor cooling landscape strategies in hot arid regions. Six landscape strategies adopted different combinations of trees, lawns, and overhead shade mesh in two semi-enclosed courtyards. They discovered that the courtyard treated with shade trees and grass could reduce the daytime temperature by 2.5 K. More recently, Mohammadi et al. [20] evaluated the cooling effect of vegetation in sky courtyards. They highlighted that trees located on high-rise courtyards could lower air temperatures in the range of 0.3 °C to 1 °C depending on the volume of the vegetation.
There are few studies that evaluated the impact of courtyards as a passive cooling technology on the indoor and outdoor thermal performance of buildings. Sadafi et al. [21] investigated the effect of internal courtyards on the thermal performance of a terraced building in the tropical climate of Malaysia. They conducted three days of field measurements in the naturally ventilated spaces of the house. The results suggested that an internal courtyard with access to the outdoors can improve the thermal comfort and natural ventilation in terrace houses, and appropriate openings and shading devices are essential for the thermal performance of the internal courtyard. Guedouh and Zemmouri [22] compared the indoor and outdoor temperatures of different courtyards in the hot and dry climate of Algeria and observed that the courtyards increase the air temperature in winter and decrease temperature in summer, respectively. Their results reflected that the appropriate use of deep and enclosed courtyards could enhance thermal comfort.
Previous research mainly focused on the courtyard area conditions instead of the indoor spaces surrounding the courtyard. The combination of courtyards and other passive cooling techniques (such as transpiration and shading by vegetation), which interact with courtyards and influence the thermal conditions and natural ventilation of the interior of the surrounding buildings, is a potential research direction. Furthermore, many researchers have mainly focused on improving the courtyard microclimate conditions by different passive cooling technologies; however, few studies have concentrated on incorporating these technologies in the courtyard on the building’s indoor thermal and wind environment. Vegetation (via an evapotranspiration process) can help lower air temperature around the surrounding area and the facades. The present study investigates the integration of vegetation on the aero-thermal conditions in a courtyard and surrounding the naturally ventilated building in hot climates by evaluating the wind speed, air temperature and thermal comfort in different spaces within the courtyard building. The simulations were conducted using ANSYS Fluent v18.1 (Nottingham, UK) and validated with experimental data.

2. Methods

To investigate the influence of different passive cooling technologies in the courtyard (Figure 1) on the buildings’ indoor environment, the simulation study is divided into three cases detailed in Table 1. Case 1 is the reference model, an enclosed courtyard model with only windows as the passive cooling strategy. For Cases 2–3, vegetation with different heights is arranged in the baseline courtyard

2.1. Computational Fluid Dynamics (CFD) Theory

The standard k-epsilon turbulence model and Boussinesq model were employed to model the airflow in the computational domain. Vegetation such as trees and hedges act as a momentum sink, slowing down the airflow in them. Many studies have modelled vegetation as a porous body, accounting for pressure loss across the domain. Additionally, to interpret the vegetation cooling effect, this current research took advantage of a method that had been simplified based on the works by Gromke and Rahman [23,24], wherein the cooling capacity is dependent on the leaf area density (LAD) of the vegetation. LAD is the leaf area per unit volume of vegetation and can vary with height. However, an average value of 2.3 m2/m3 was assigned to the domain based on the study by [25]. Simultaneously a cooling power of 350 W/m3 per LAD was set as the source term in the energy equation. Porosity was modelled using the Ergun equation for accounting for the viscous resistance factor (1/α) and the inertial resistance factor (C2). The Fluent theory guide provides the following formulae [26]:
α = d 2 150 3 ( 1 ) 2
C 2 = 3.5 d ( 1 ) 3
where d, denoting the particle diameter, was set to 0.02 m. And Ø referring to the void fraction, was set to 0.96.

2.2. Geometry

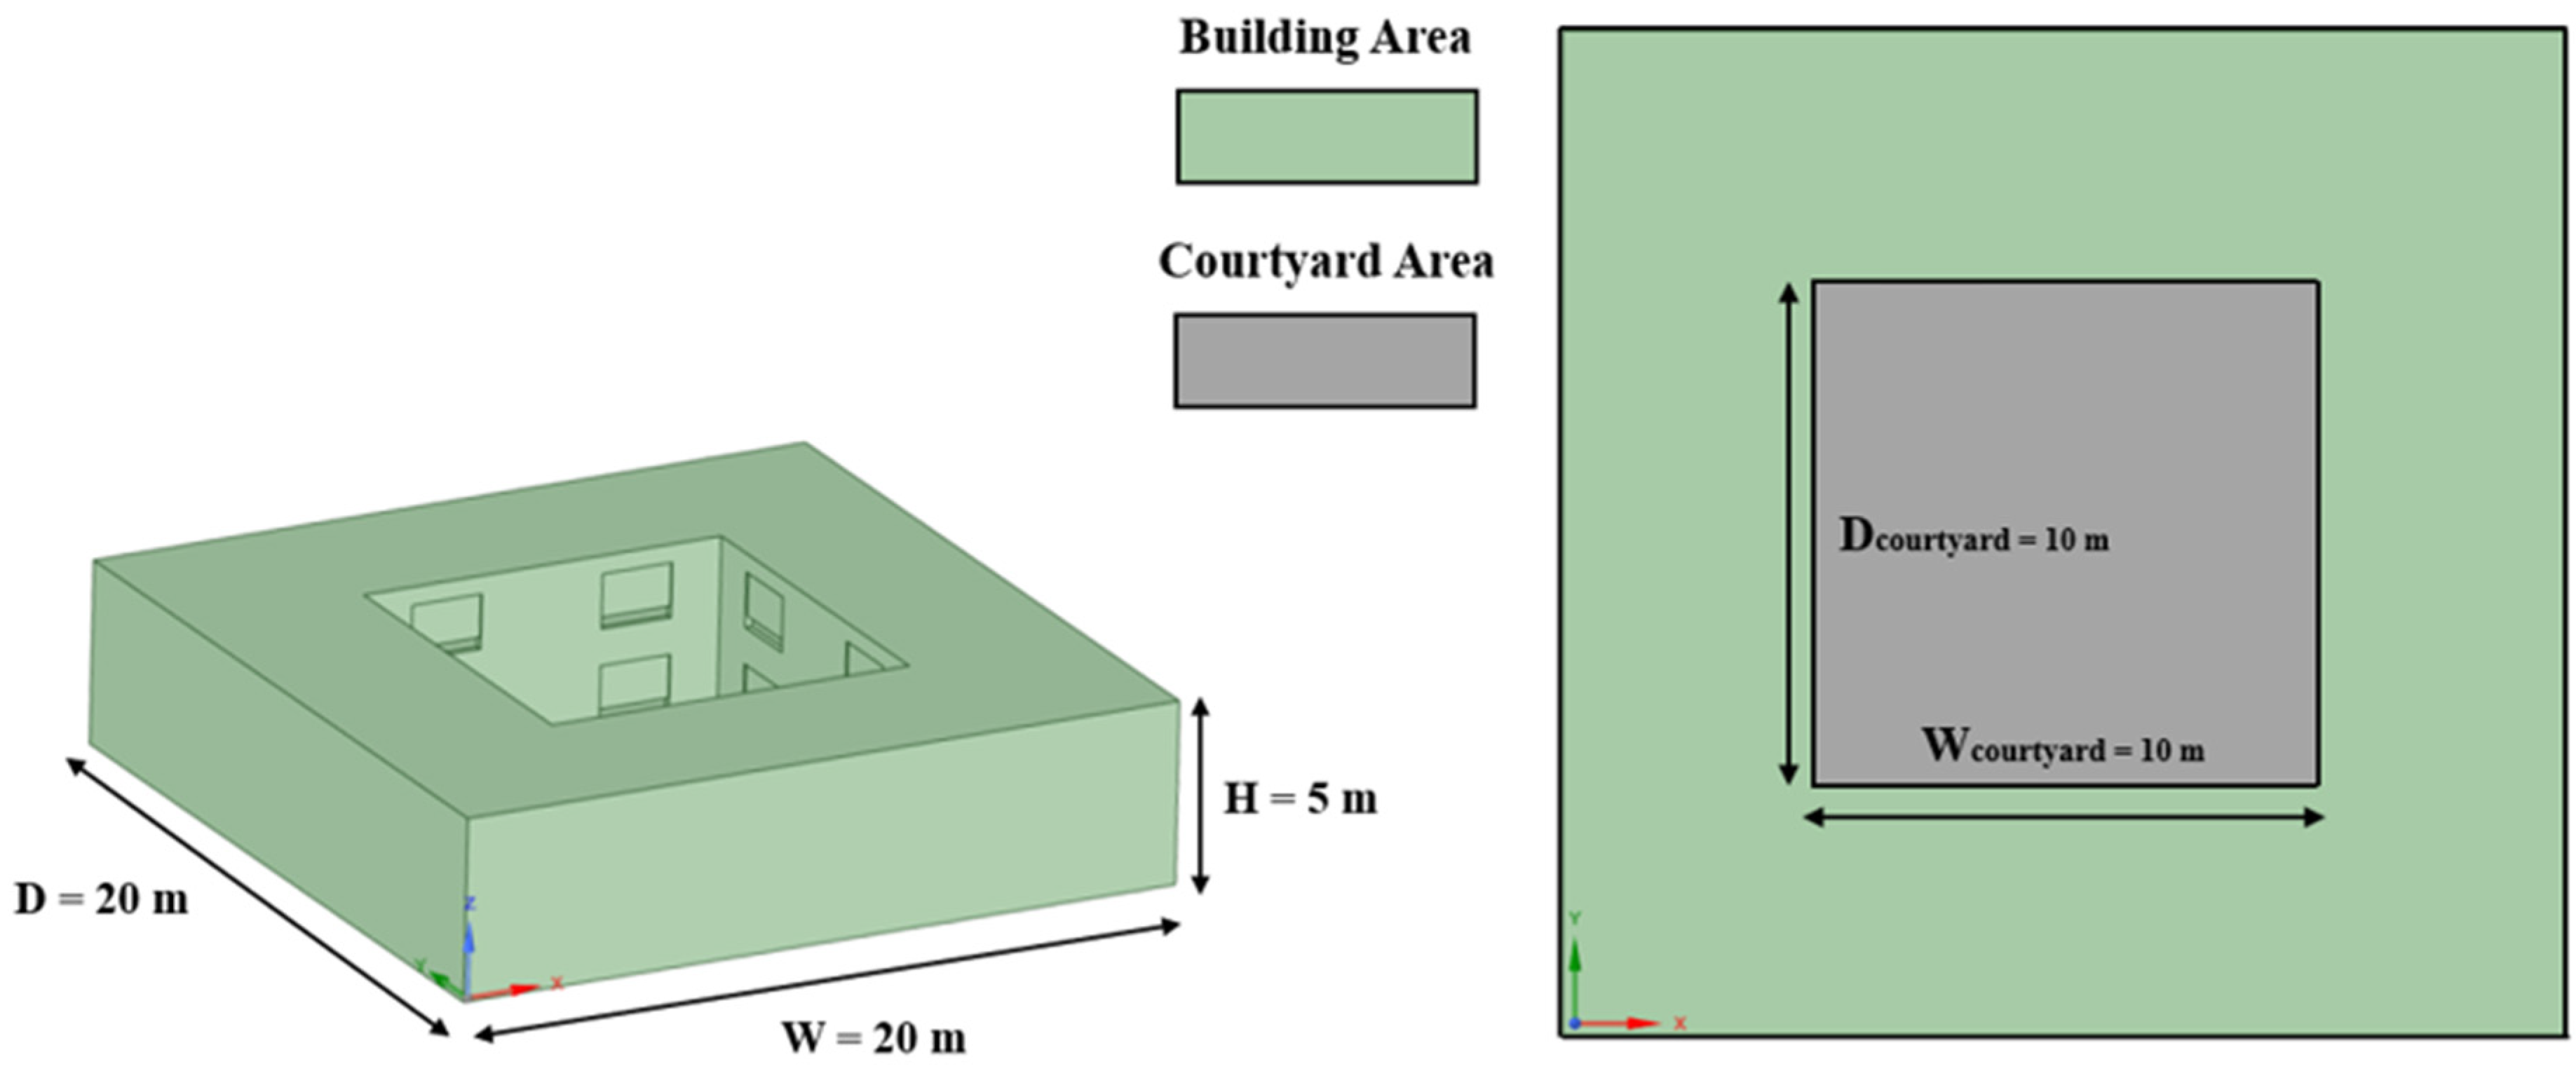
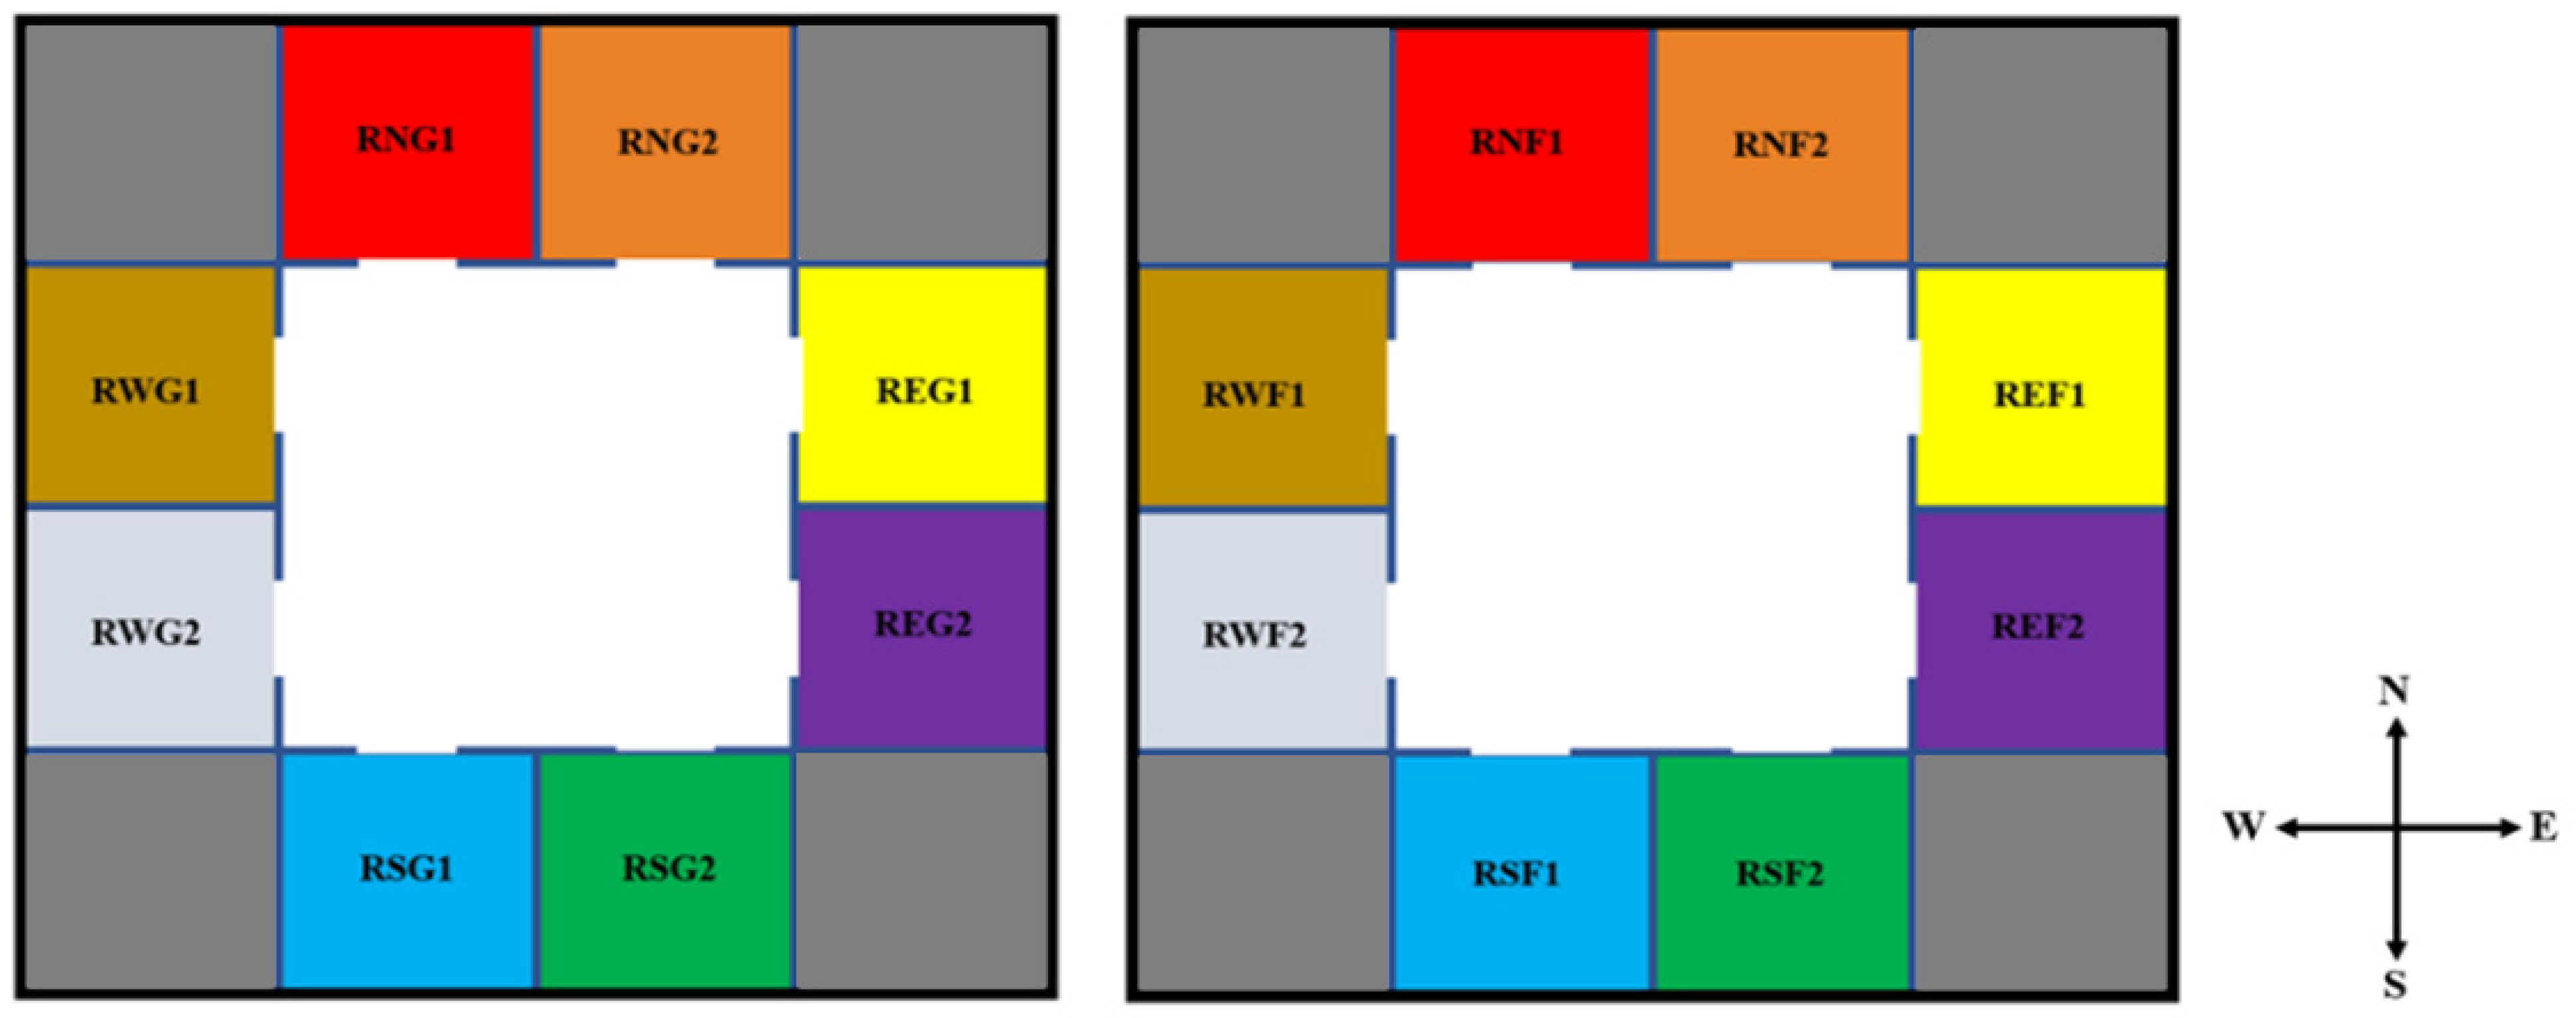
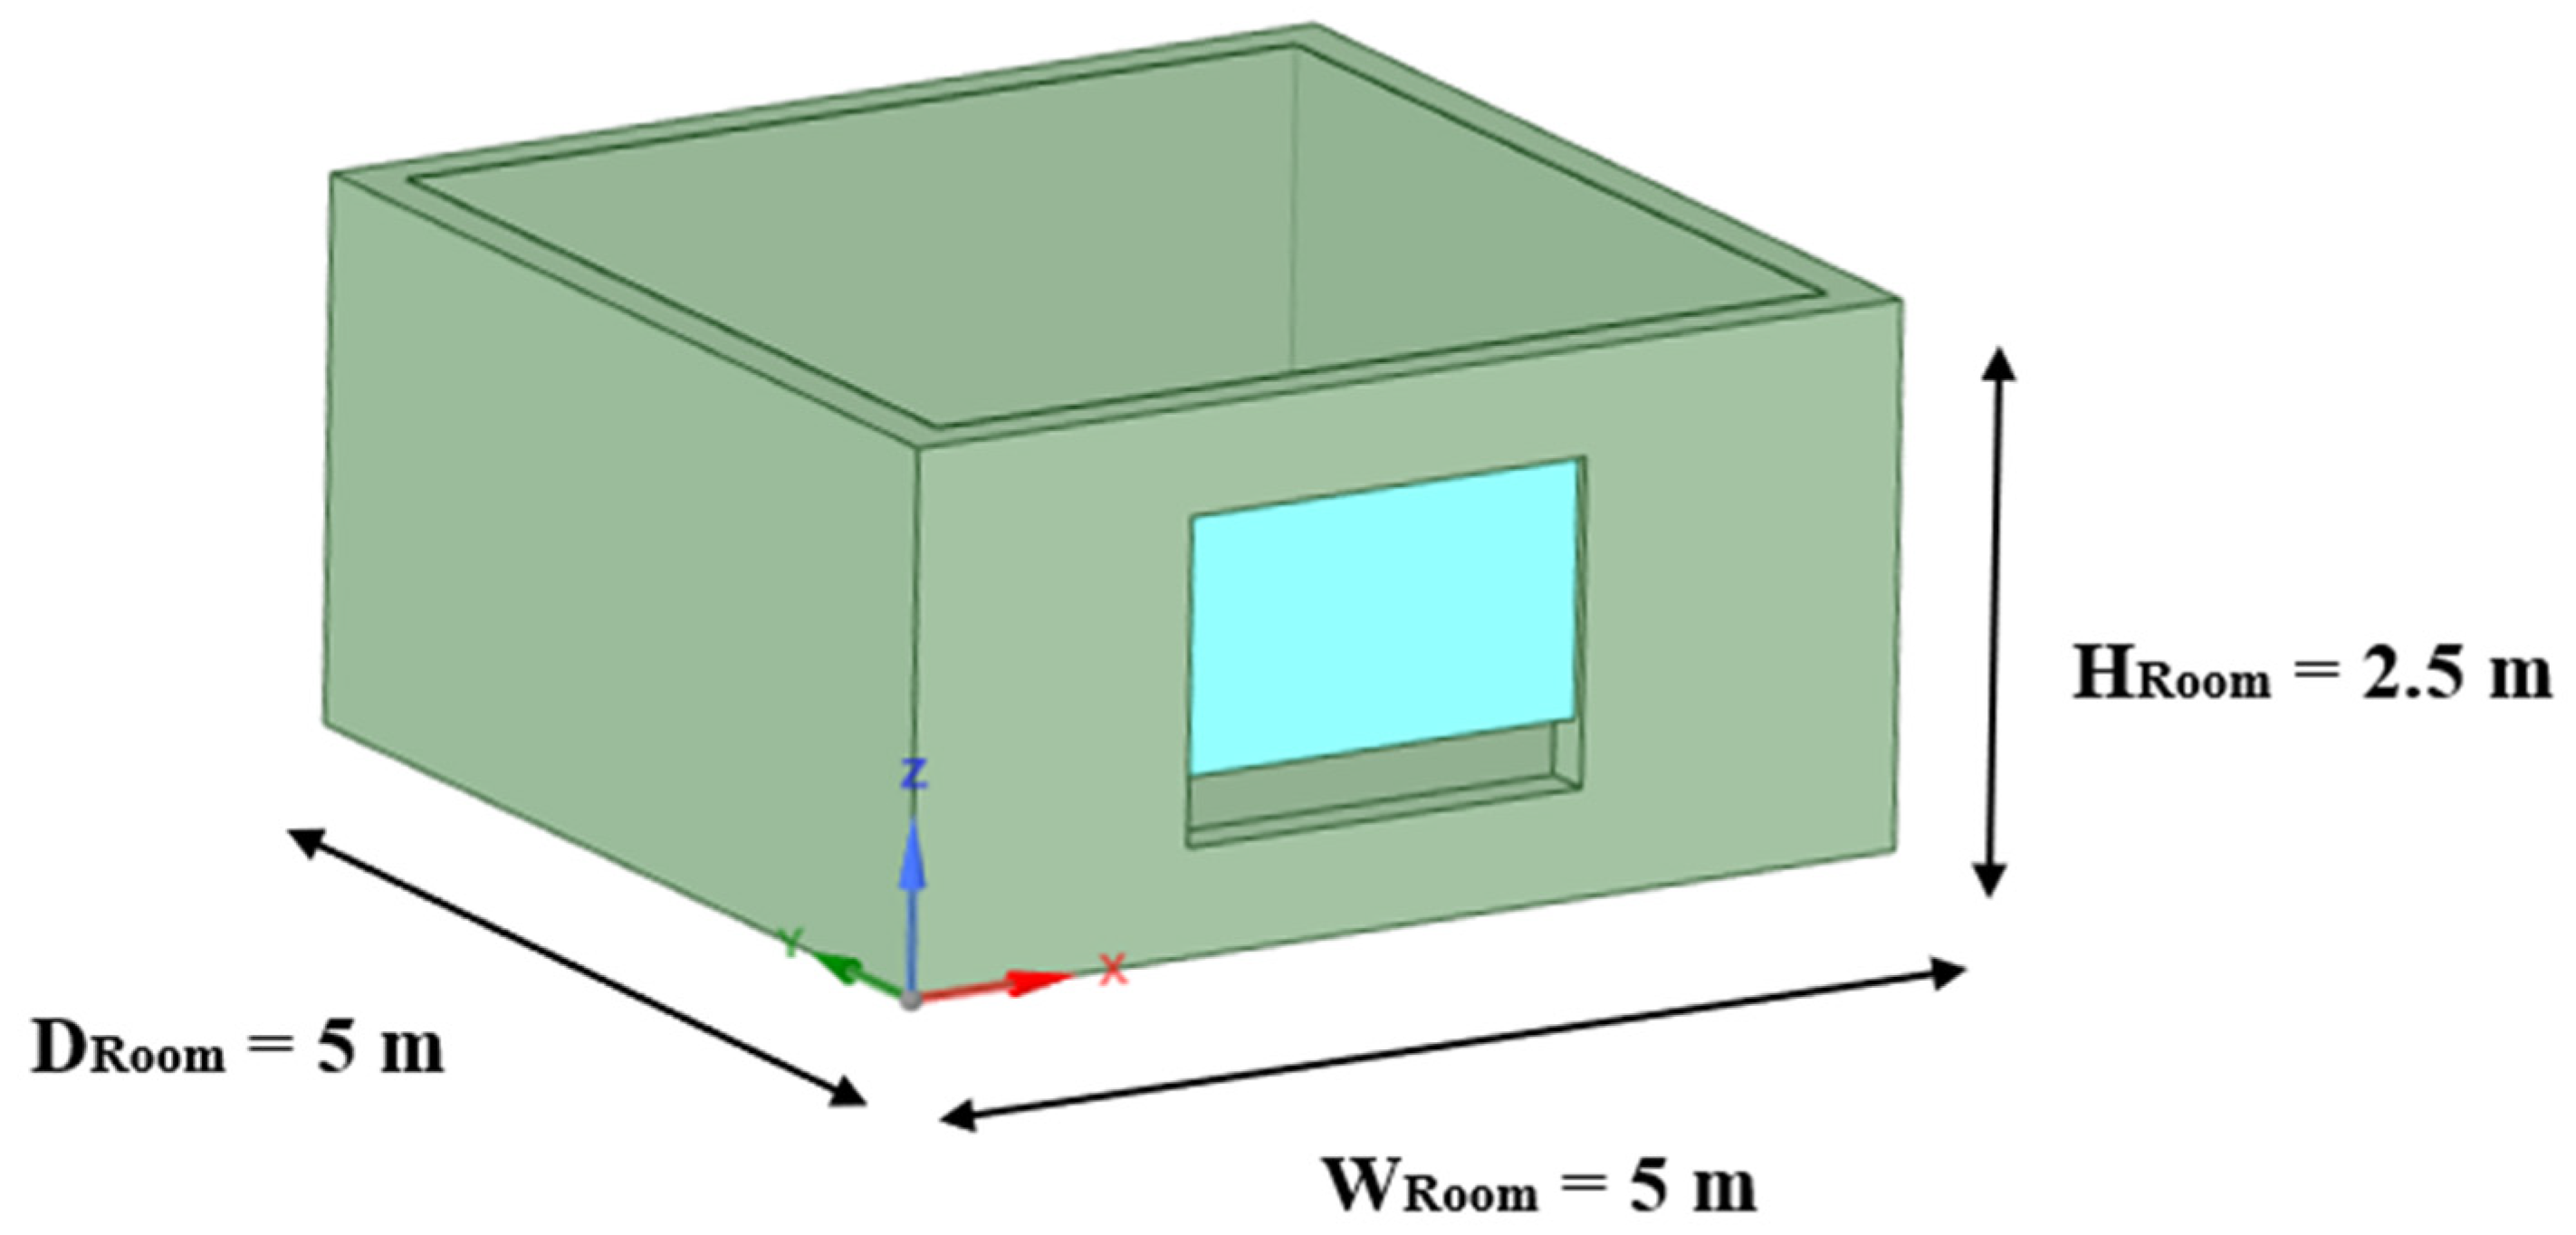
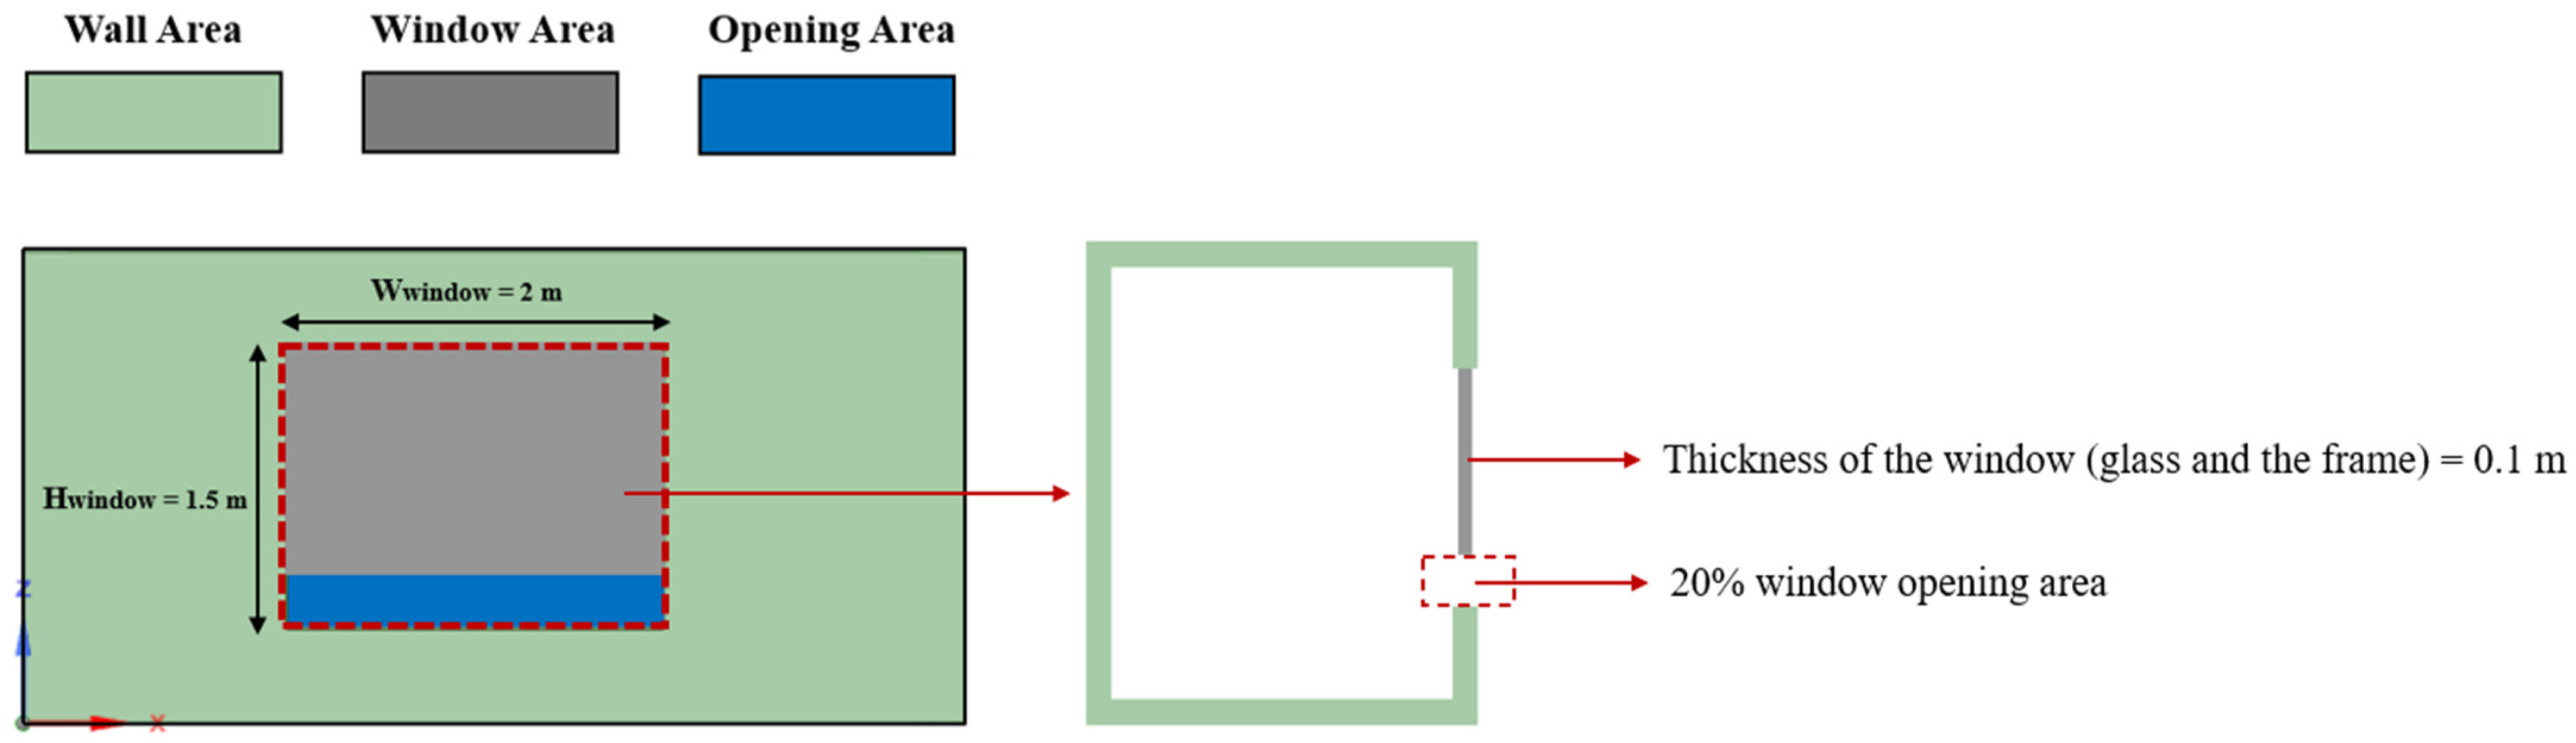
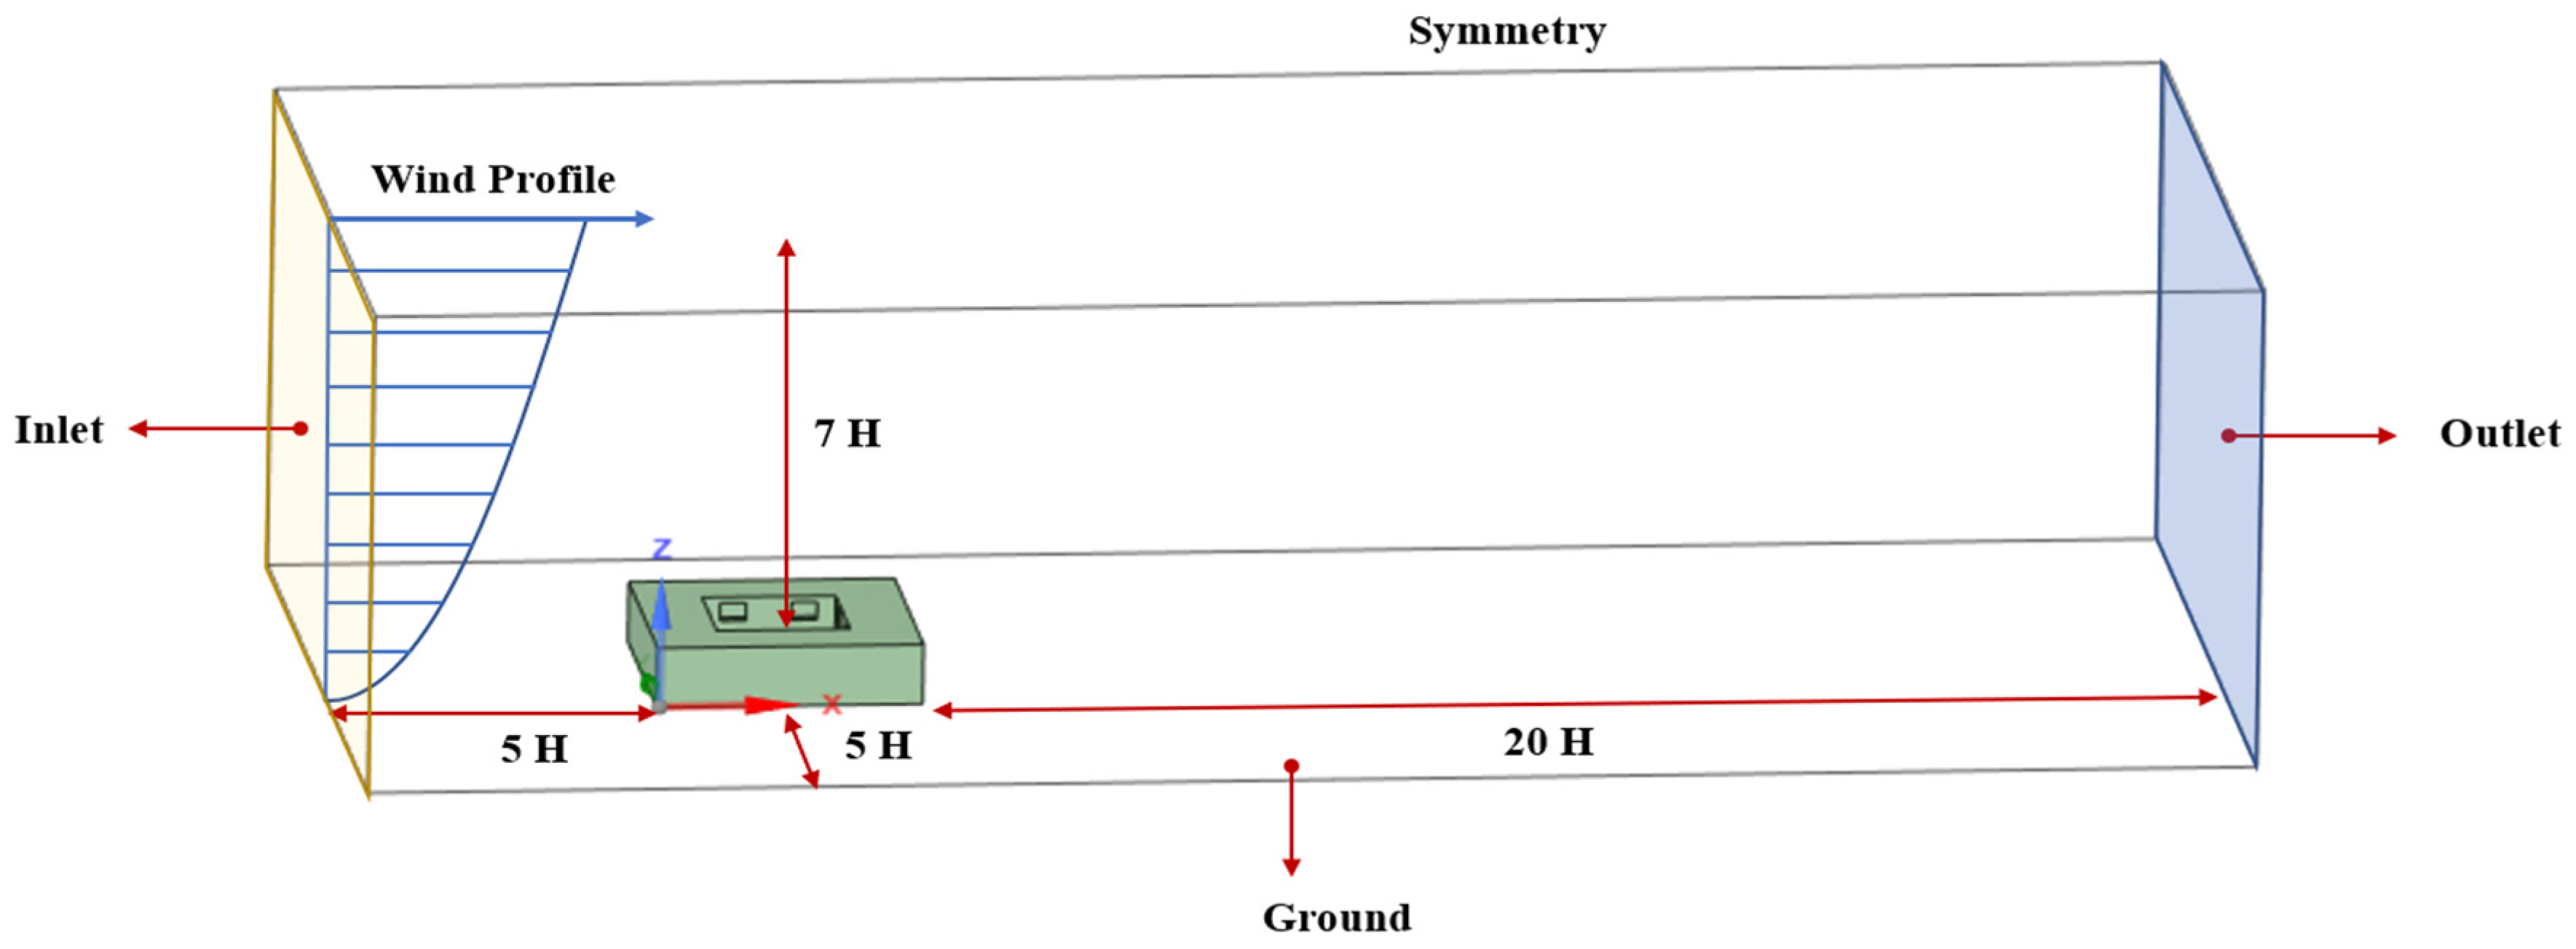
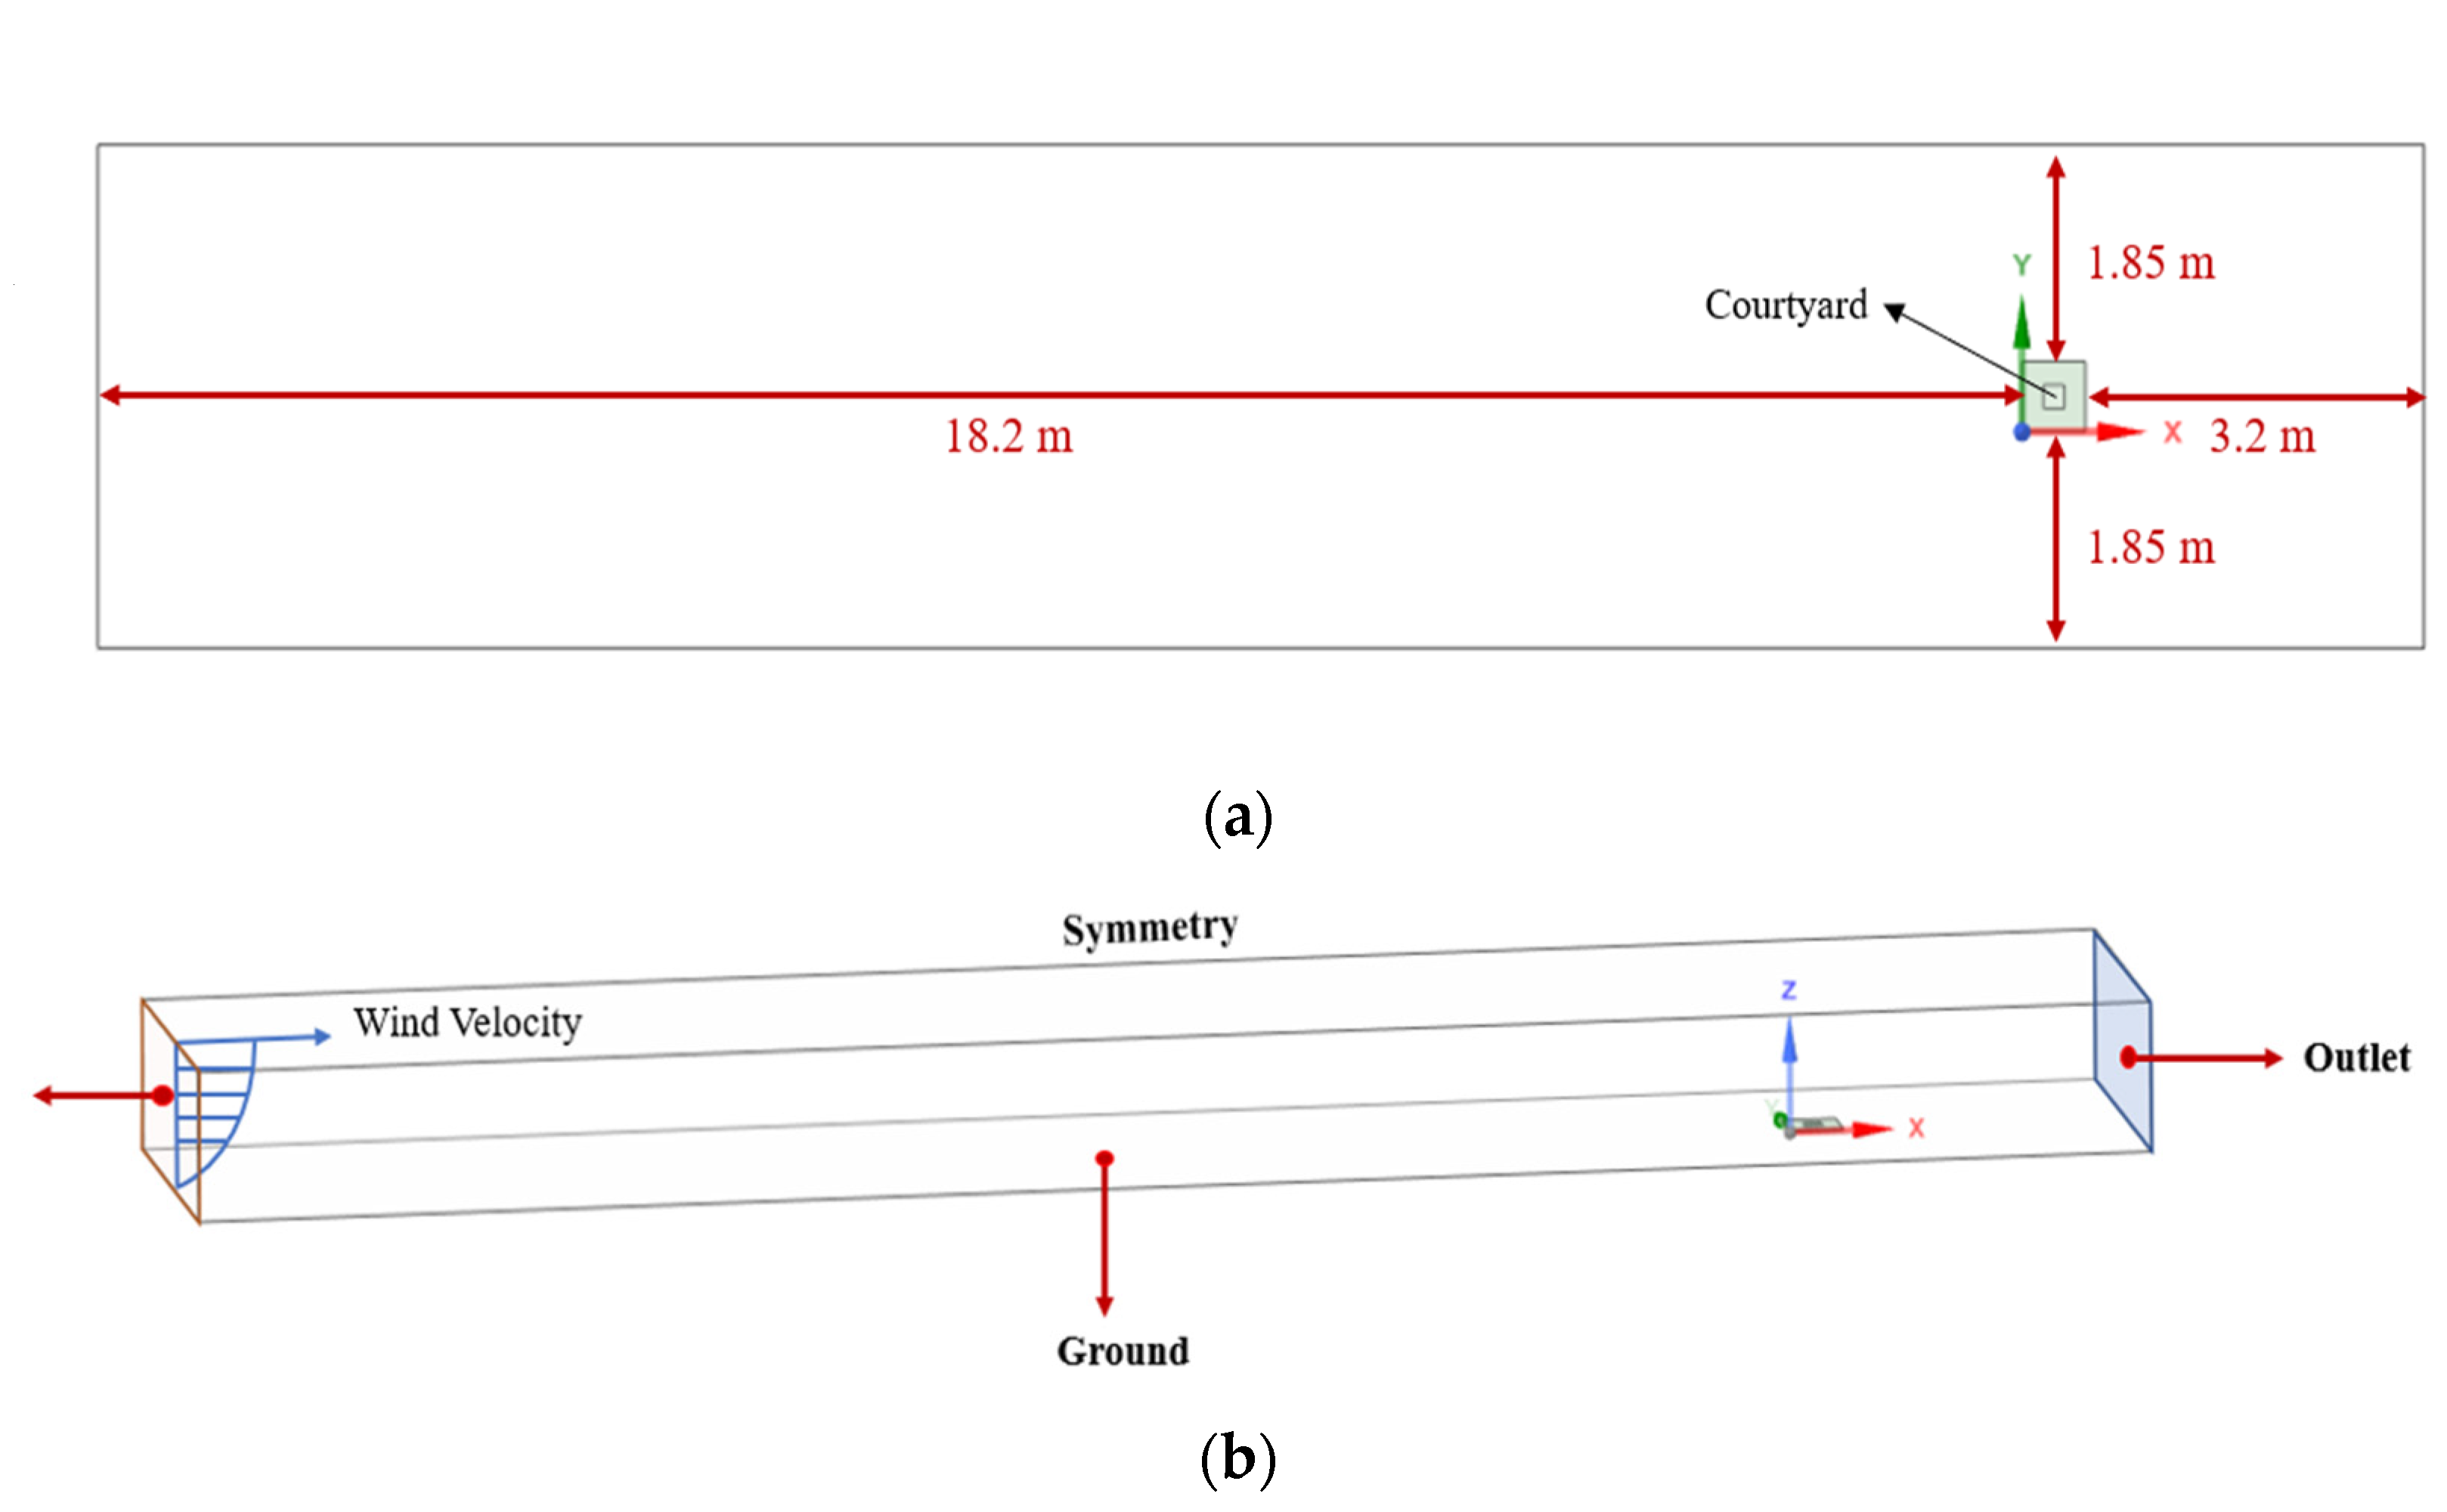
2.2.1. Courtyard and Domain

Hall et al. [27] carried out small-scale wind tunnel experiments to investigate the dispersion of pollutants emitted from the bottom of courtyards and other enclosed spaces. In their experiments, different types of closed courtyard were evaluated, with ratios of depth to width from 5 to 0.1. In this research, the closed courtyard model (ratio of depth to width is 1) was selected as the validation model and was modified to a full-size model, for investigating the indoor thermal performance and ventilation conditions. The building internal spaces and windows were also added to the model. For the baseline courtyard model, a standard courtyard model was modelled with the following dimensions: 20 m width, 20 m depth and 5 m height; there were two floors in the building, each floor with a height of 2.5 m. The courtyard was in the center of the building, which is 10 × 10 m2 (Figure 2).
The building had two stories, and 12 rooms on each story, and only the 8 rooms facing the courtyard were used for the analysis; the layout of the rooms on each floor is shown in Figure 3. The dimension of each room is 5 m width × 5 m depth × 2.5 m height, and the thickness of the external and internal walls are 0.24 m, and 0.2 m, respectively, which is shown in Figure 4; the layout of each room facing the courtyard has a window measuring 2 m × 1.5 m, and the thickness of the window (glass and the frame) is 0.1 m, with only 20% of the window opening area given for practical considerations (Figure 5).
The computational domain of the courtyard is shown in Figure 6 [27]. Two side and top walls were set as symmetry walls, the distance between the courtyard and two side symmetry walls were set to 5 H (height of the courtyard building), which was 25 m. We selected 5 H and 20 H for the distance between the courtyard and inlet and outlet, respectively. The distance between the courtyard and the top wall of the domain was set to 7 H, which was 35 m [27]. The wind profile was used to set the inlet velocity.

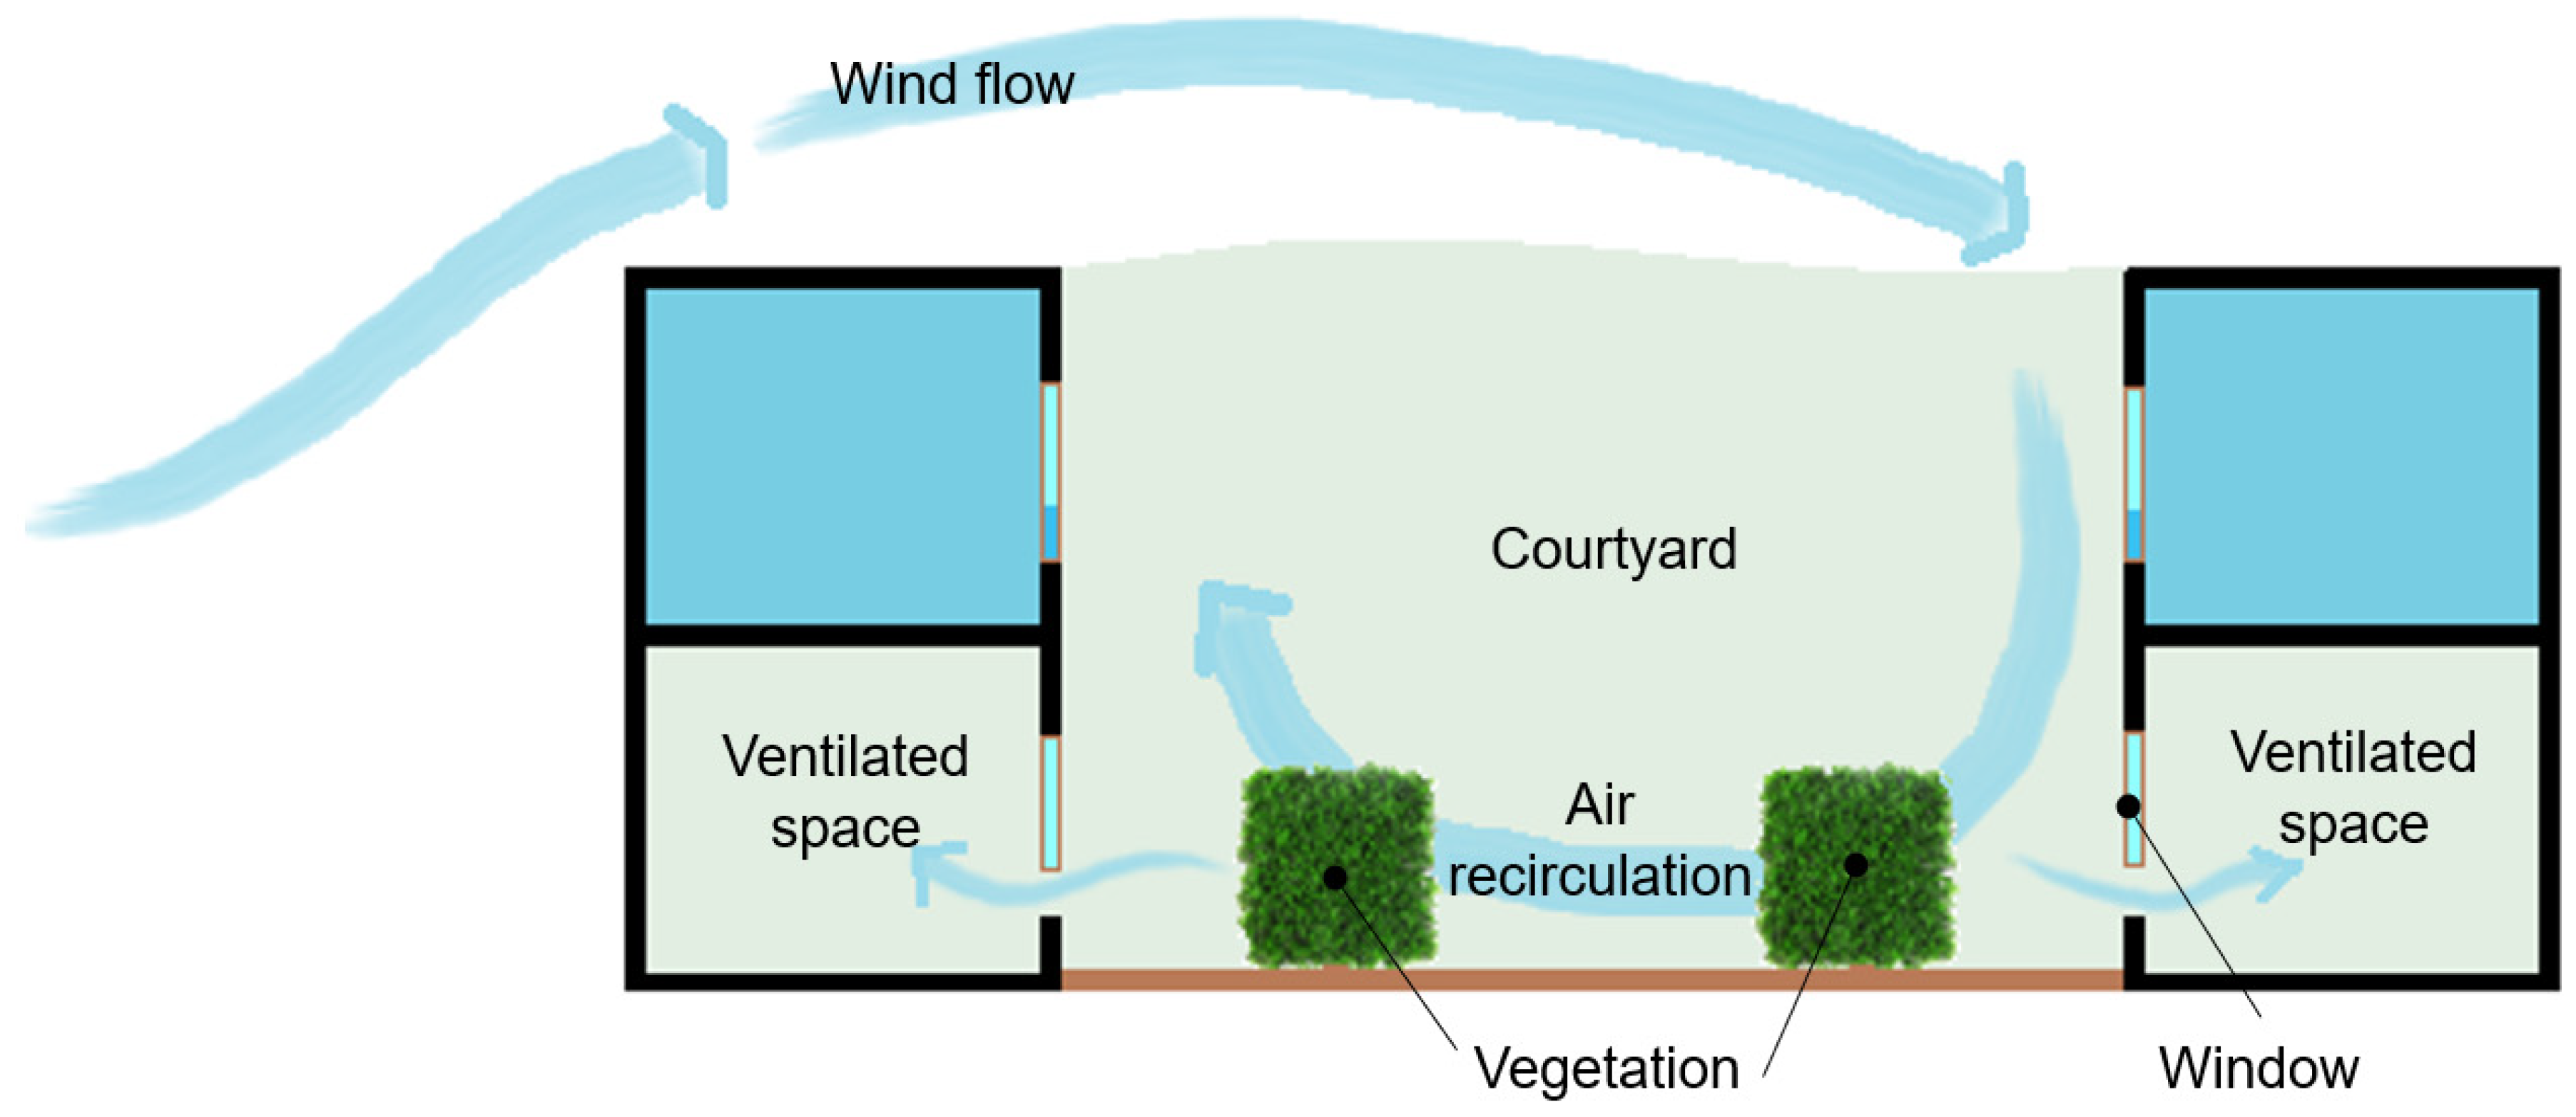
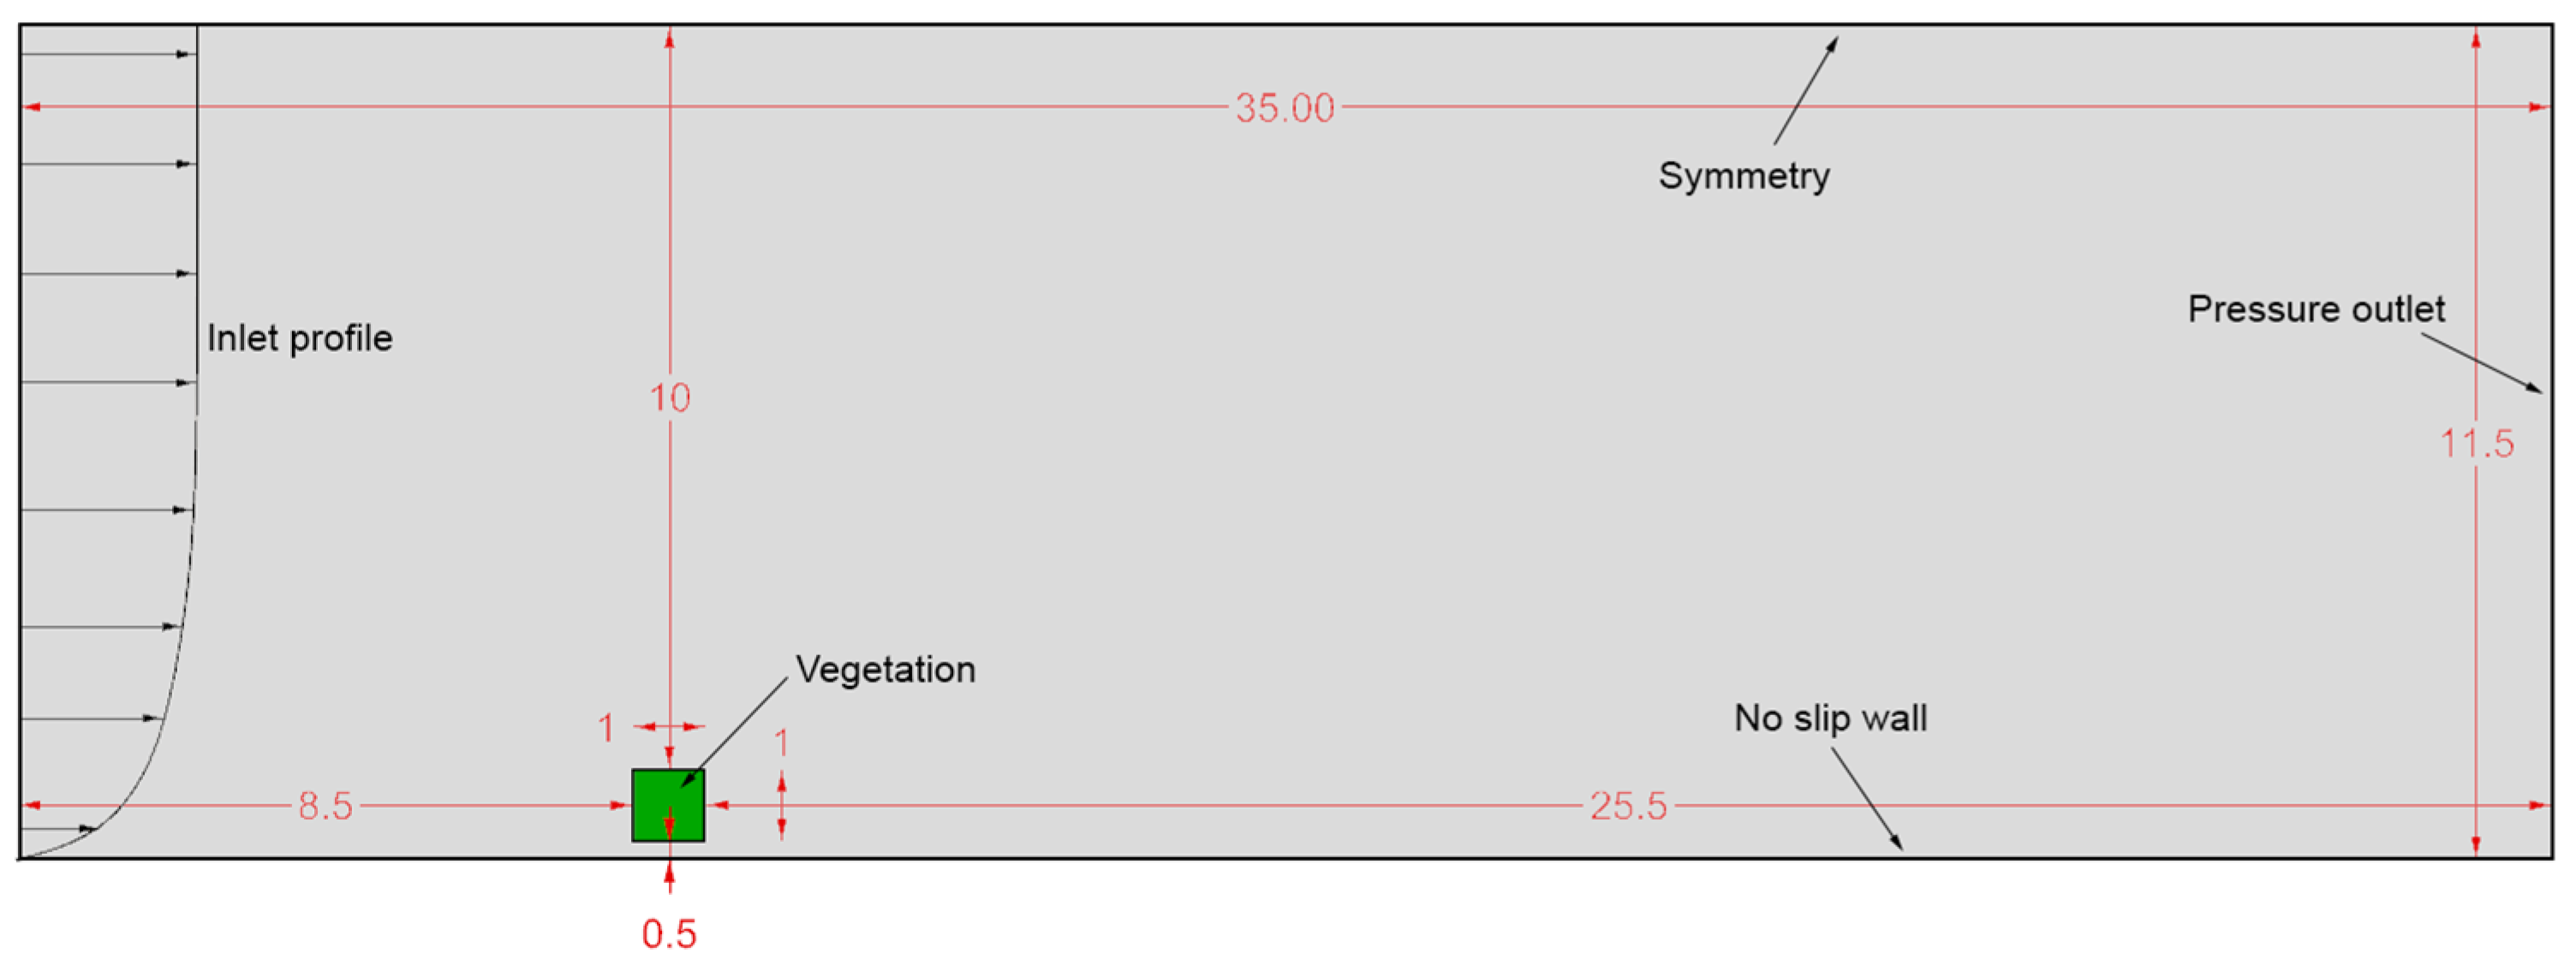
2.2.2. Vegetation Model

Vegetation in the form of cuboidal volumes was modelled as porous zones representing hedges. The model was based on the work by Manickathan [28], wherein the vegetation zone was modelled as a 2D porous square. The courtyard was divided into four sections, with a hedge in the center of each. The hedges extend 2.4 m in either direction, while two different heights (1.5 m and 2 m) of hedges were modelled for comparison. The simulated vegetation were cube-shaped hedges placed at a distance of 1.2 m away from the building with inter hedge distance of 2.8 m (Figure 7).

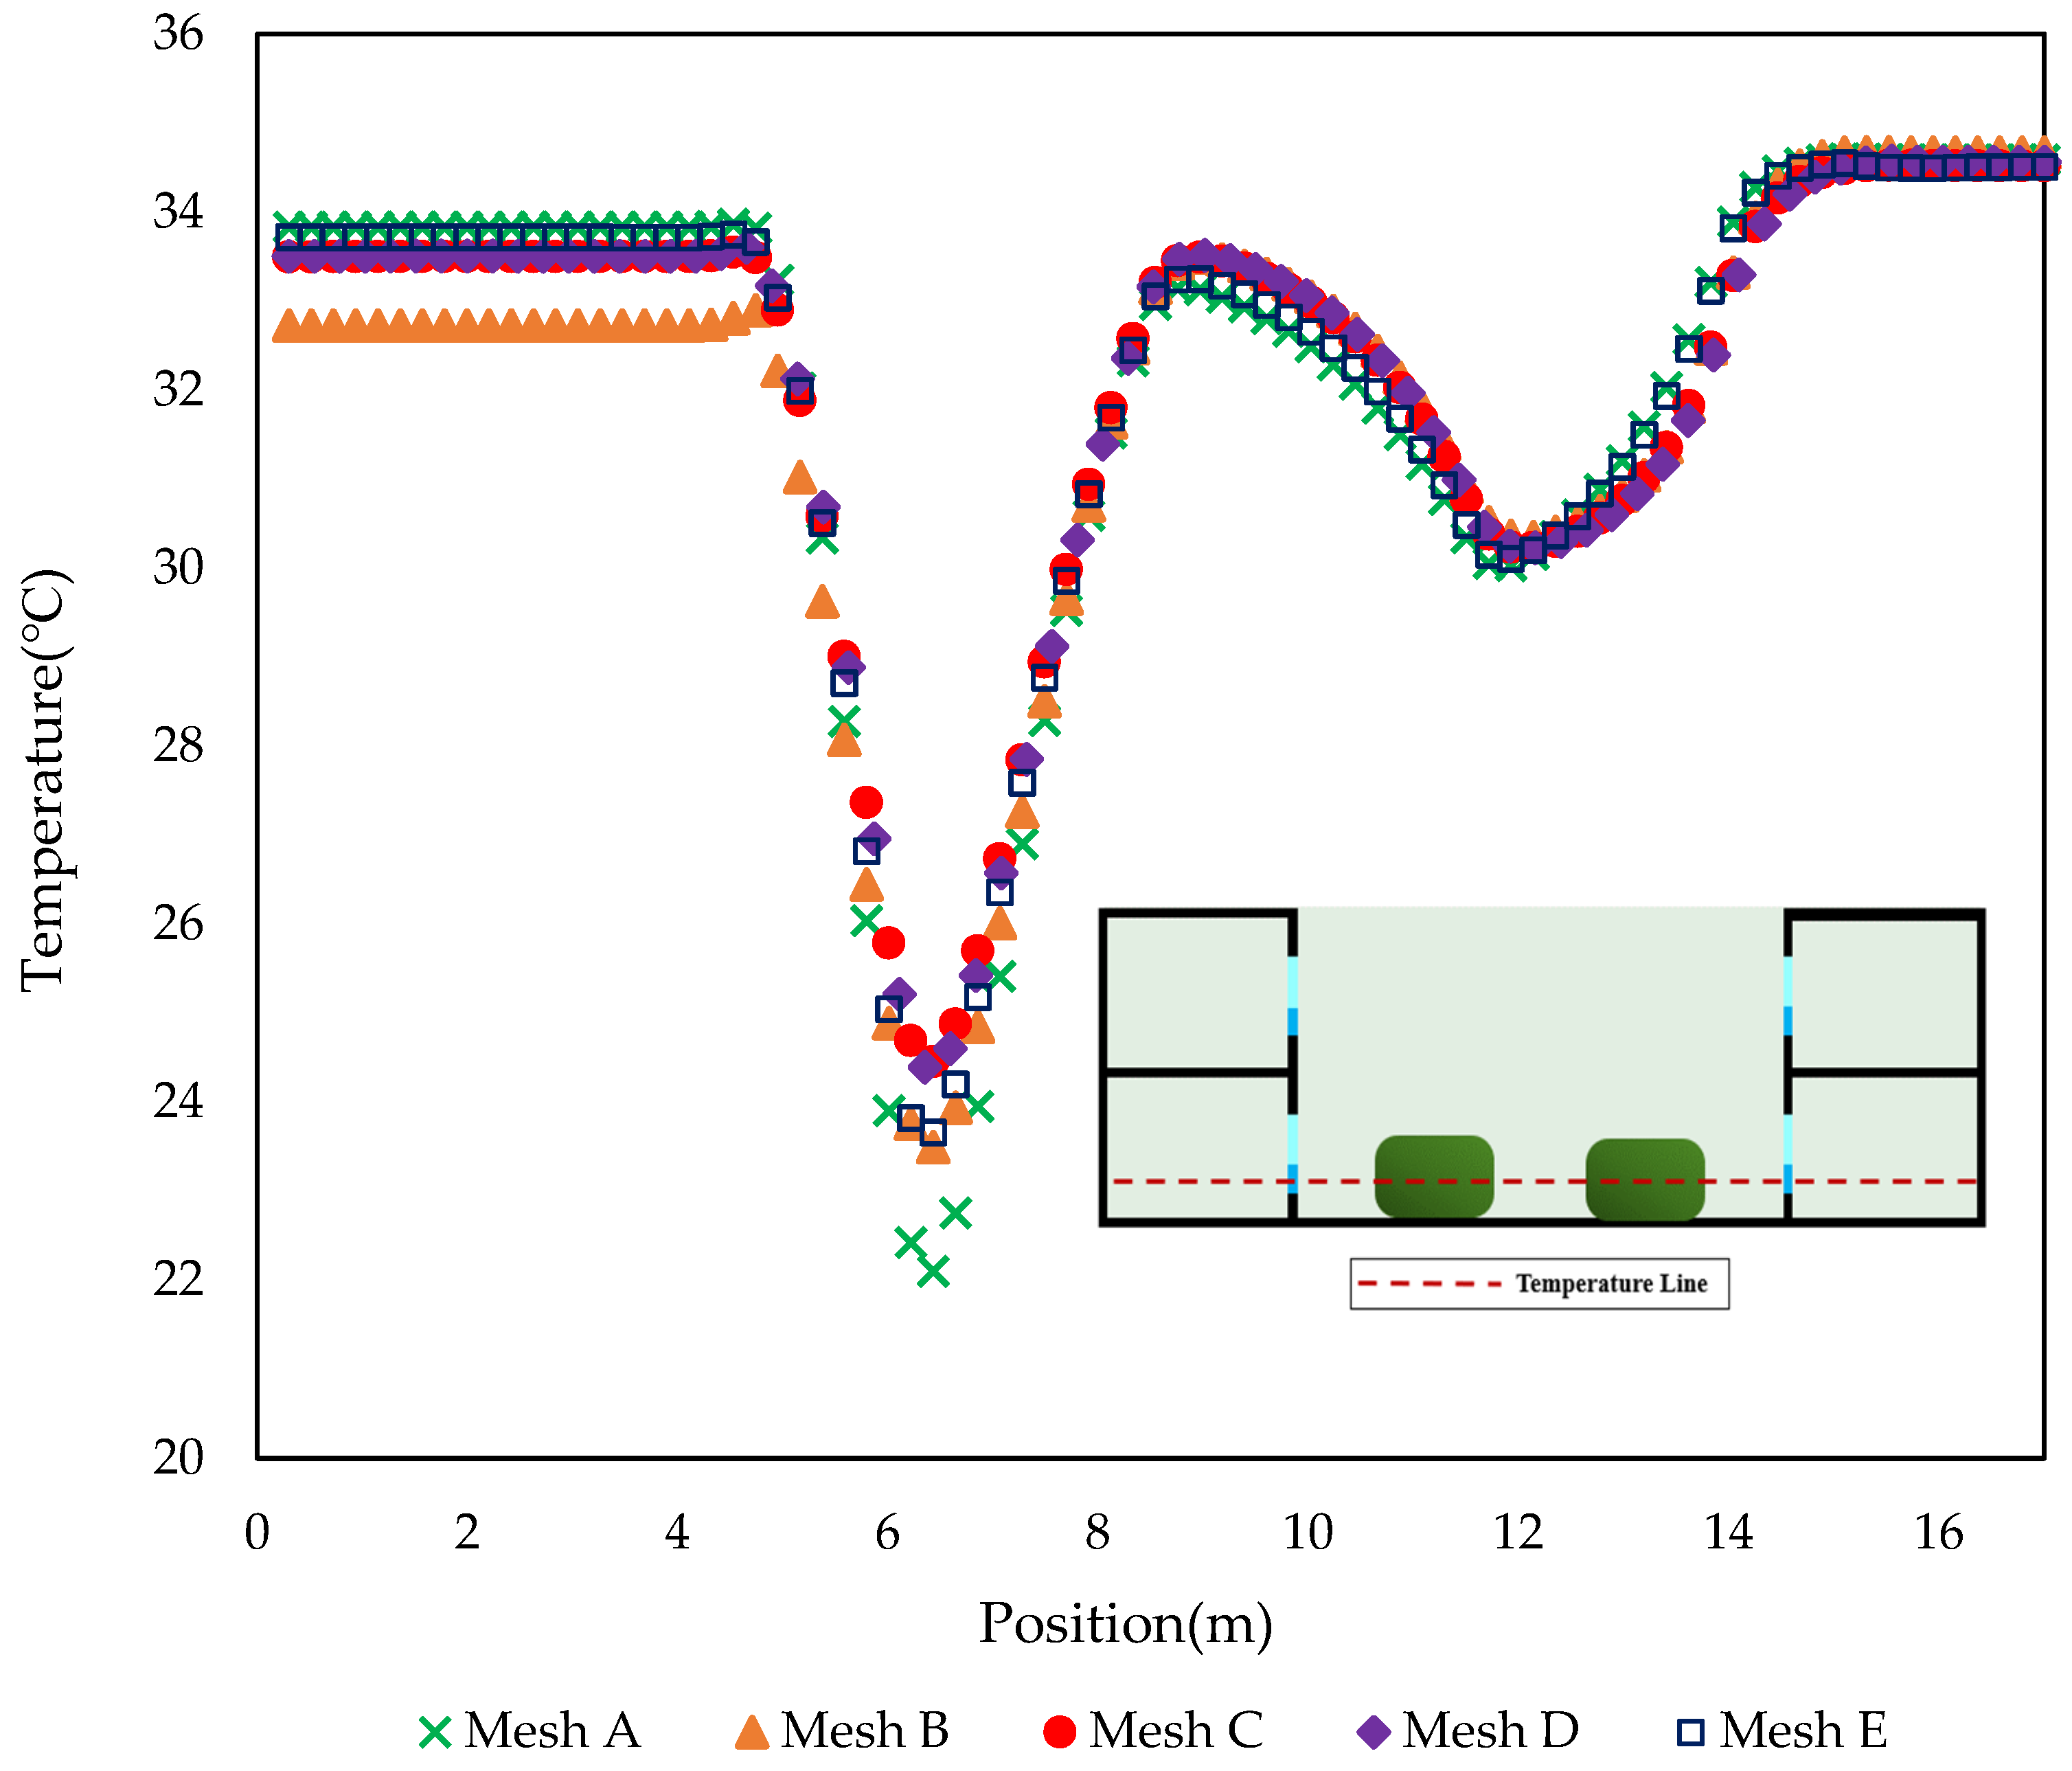
2.2.3. Mesh Design and Verification

In this study, the computational domain was meshed using unstructured mesh. The mesh of the courtyard and surrounding buildings was refined to ensure that the flow field was accurately captured in the simulation. For areas around the building, a larger element size was set to reduce calculation time. A finer mesh was set for the building facades and the interior of buildings and courtyard. In the model, a finer mesh was set for the small components, such as the windows with a thickness of 0.2 m. For the overall sizing, the sizing function was set as adaptive and the transition was set as slow; the element size was set to 1.5 m and the minimum side length at 0.05 m. The face sizing for the courtyard building was set to 0.1 m. As a result, the baseline model had 5,067,770 elements and 989,698 nodes. The meshed courtyard and its surrounding environment are shown in Figure 8.
A sensitivity analysis was carried out to verify the CFD modelling and ensure that the results were independent of the size of the mesh. Sensitivity analysis requires a comparison of results using the same model under the different sizes of mesh. Four groups of different sizes of meshes were selected for the analysis, shown in Table 2. The model used for the mesh sensitivity analysis was the courtyard model with four trees. Figure 9 shows the analysis result of the temperature line across the indoor area and the courtyard, comparing five different sizes of mesh. The results showed that the temperature difference between two medium mesh arrangements (Mesh C and Mesh D) along the horizontal line was 0.4%, while it was 1.13% between the medium mesh and the high mesh. All these results showed that different mesh sizes had minimal effect on the results. In this study, the medium size mesh (Mesh C) was selected for further calculations.

2.2.4. Boundary Conditions

The fluid domain was created as an enclosure which allows for the simulation of airflow around the courtyard model. In Figure 6, one side was set as the velocity inlet, the wind velocity and longitudinal profile from the wind tunnel experiment of Hall et al. [27] was used to define the inlet boundary conditions, the other side was set as the pressure outlet at 0 Pa. To investigate the influence of cooling strategies on the courtyard and indoor areas in a hot climate, the air temperature for the inlet was set to 309 K (35.85 °C). The simulation in the CFD took into account the influence of buoyancy factors, and the gravity was set to −9.8 m/s2. Symmetry for the top and two sidewalls and ground boundaries were set as no-slip boundary conditions. For the setting of the materials, the ground boundary conditions used the ash-solid, and brick material was used for the building surface, as shown in Table 3.

3. Results and Discussion

3.1. Validation

3.1.1. Validation of the Courtyard Model

The validation of the closed courtyard CFD model was based on the wind tunnel experiments in the study of Hall et al. [27]. They tested the courtyards in the wind tunnel working section, which was 22 m long by 4.3 m wide and 1.5 m high. For the validation, a similar size domain was set in ANSYS Fluent v18.1 (Nottingham, UK), which is shown in Figure 10. The dimension of the validation courtyard is 0.6 m width × 0.6 m depth × 0.02 m height.
For validating the wind velocity of the courtyard in the CFD, a wind velocity line perpendicular to the ground was set in the center of the courtyard to collect data for comparison (Figure 11). As shown in Figure 11, the comparison results showed that CFD simulation results for the airflow velocity were slightly higher than the measured values from wind tunnel tests, and the average discrepancy between the two results was 3.2%. The small errors between the two results were likely because of factors including the turbulence model limitations and experimental uncertainties. Overall, the results of the CFD simulations were in good agreement with the experimental results of Hall et al. [27].

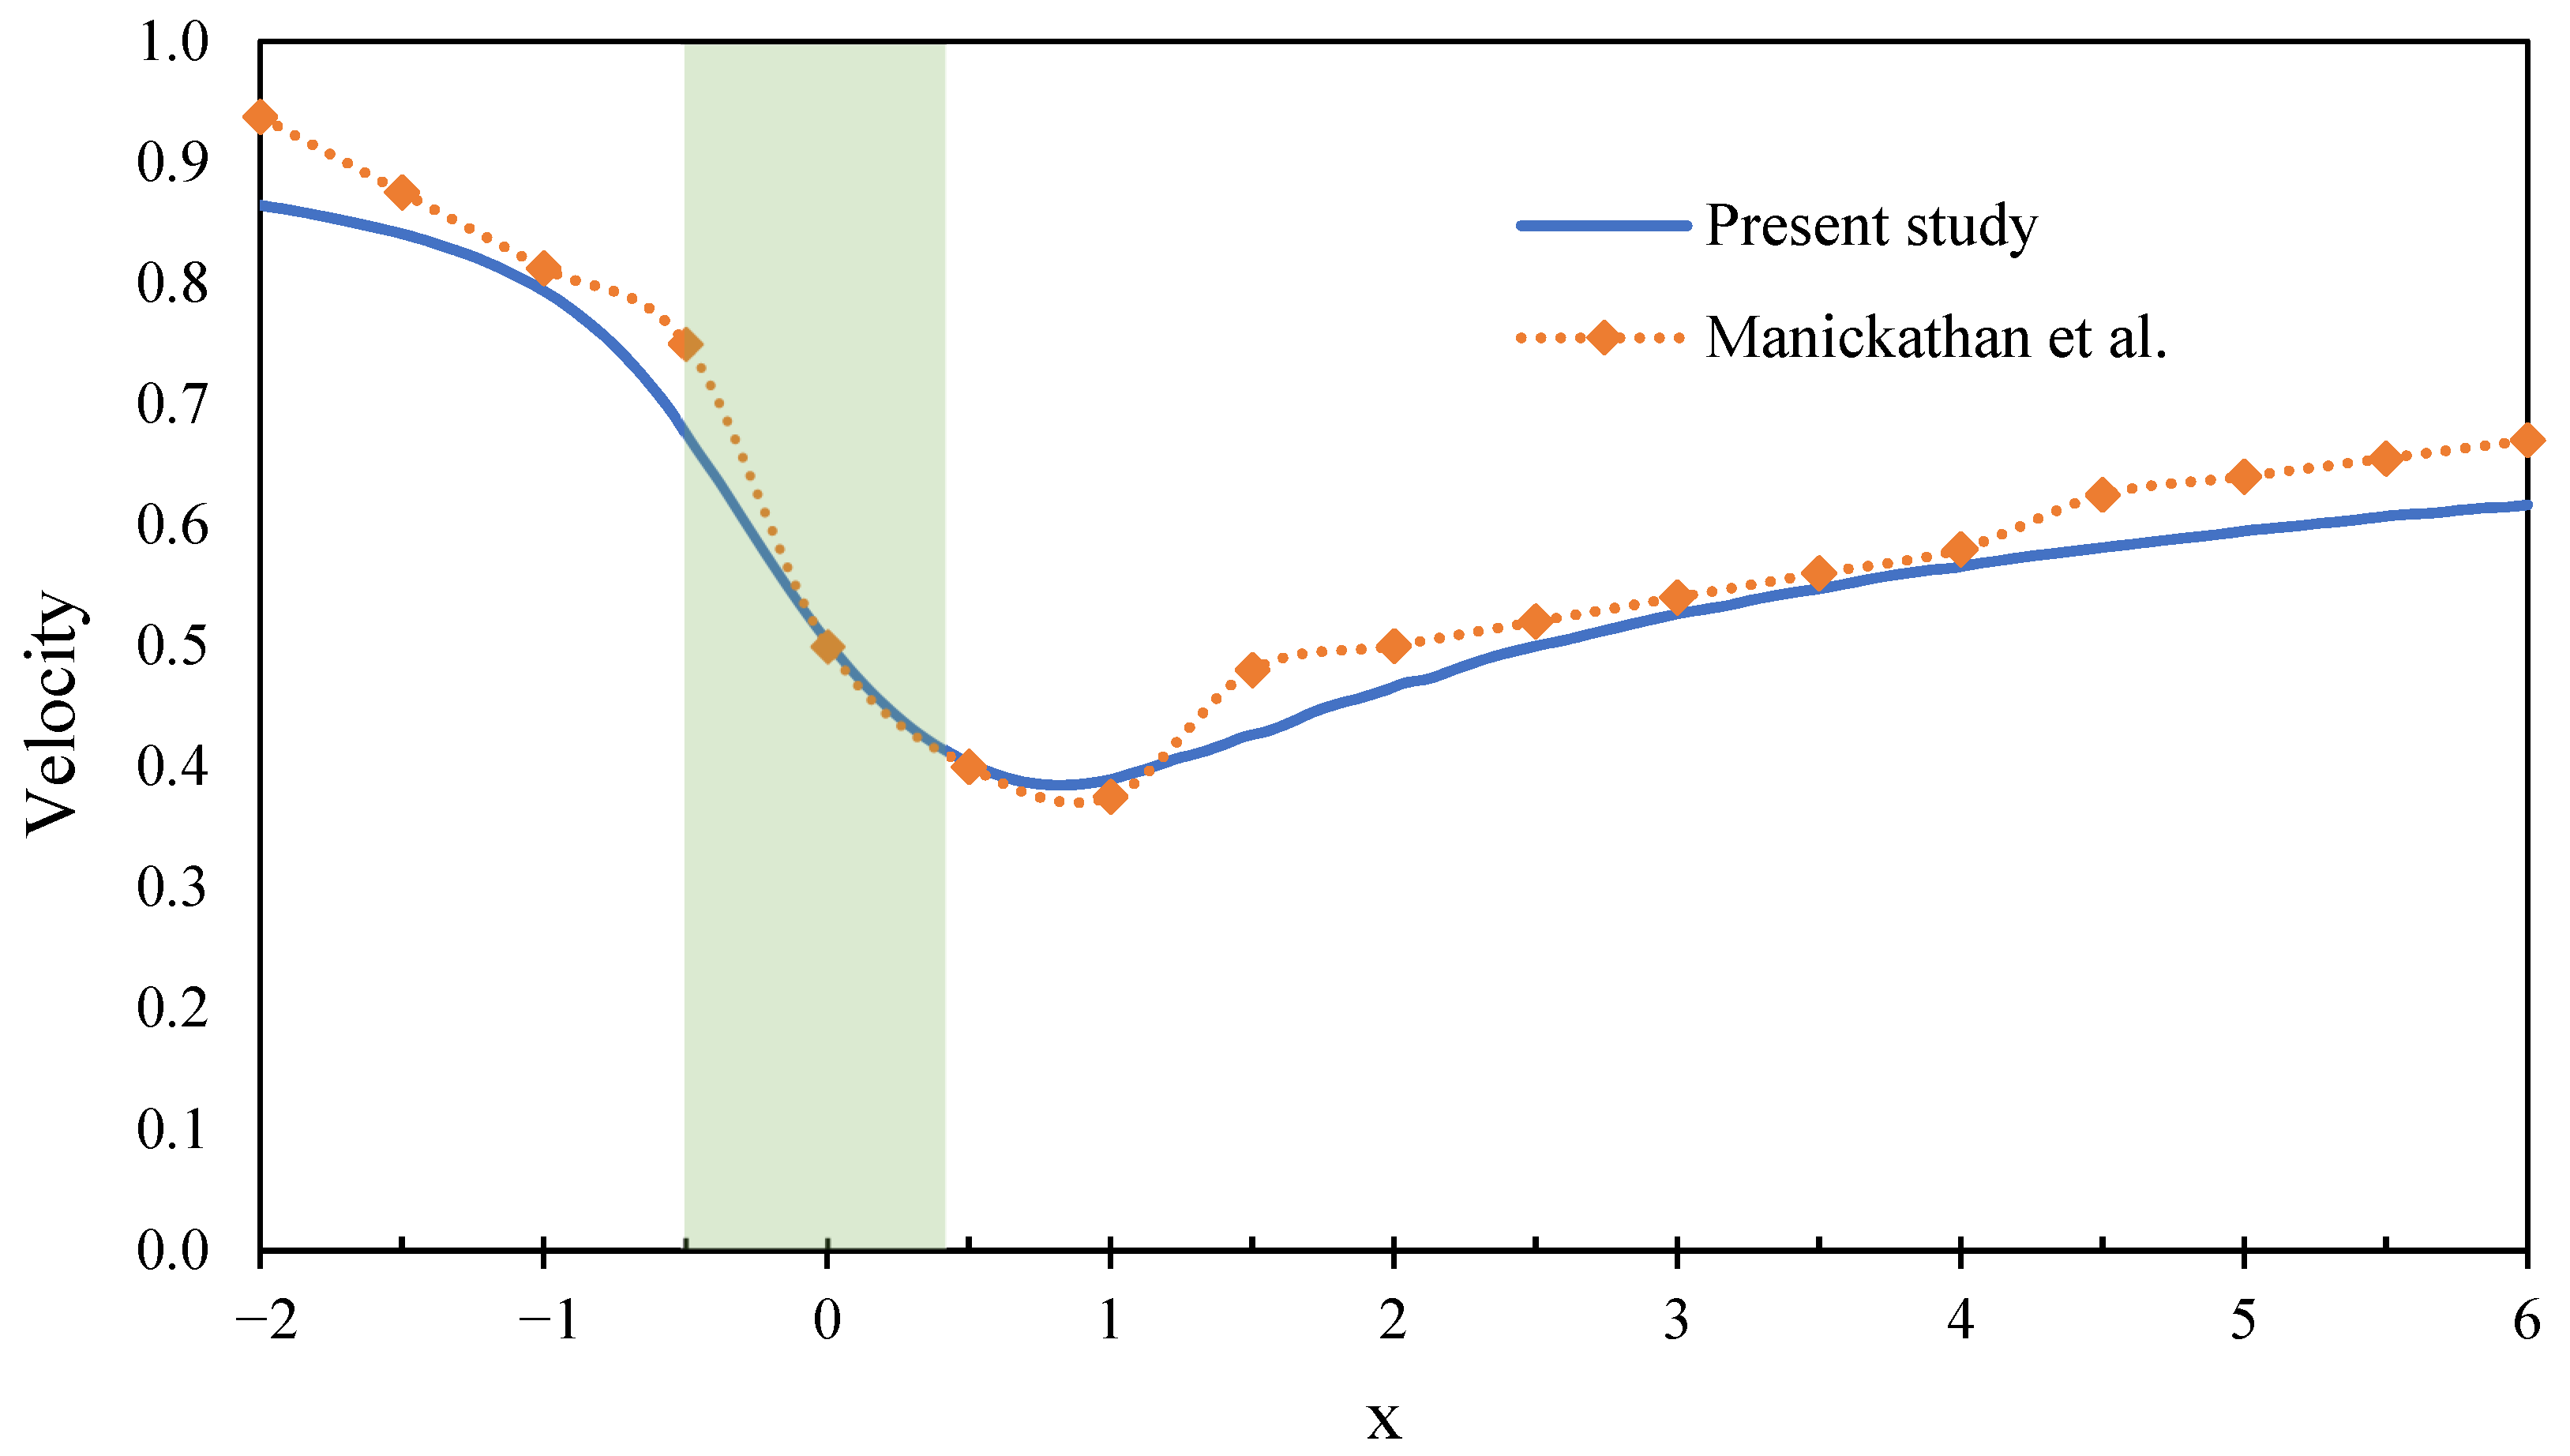
3.1.2. Validation of the Vegetation Model

The vegetation model was validated using the approach by Manickathan et al. [28], in which the domain size of the reference case had a length of 35 m and a height of 11.5 m (Figure 12). The approach has been previously used in studies including [28,29]. In the 2D domain, vegetation was represented by a square of 1 m and was placed at a distance of 8.5 m from the inlet. The square was raised above the ground at 0.5 m. Inlet velocity was constructed following Richard and Norris [30], with the von Karman number and roughness height set to 0.41 and 0.0217 m, respectively. The inlet air temperature was set to 32 °C.
Figure 13 shows the velocity and temperature distribution around the vegetation (− 2 < X < 6; 0 < Height < 3). The vegetation zone offers resistance toward the airflow, and a drop in wind speed can be observed in its wake. The velocity distribution displays fine conformity to the reference research [29]. A plot of velocity along the analysis line (with the marks in the figure, running through the center of the vegetation patch) is shown in Figure 14. The green patch indicates the extent of the vegetation domain, extending from −0.5 to + 0.5 on the x-axis. The trend closely resembles that of the reference case [29], with slight underprediction behind the vegetative patch. A deviation of about 0.04 m/s2 is seen in the far end of the line. The model works rather well amid the low modelling complexity featured by the vegetation zone. A temperature reduction of approximately 1 °C can be observed in the wake of the vegetation, which is similar to the reference case.
The slight variations in temperature and velocity can be explained by the differences in the modeling approaches of the two studies. While Manickathan [28] developed a detailed leaf interaction model, the present study adopts a simplified approach taking into account the porosity of the material. The reference author’s source/sink terms for expounding modifications in such aspects as air humidity, temperature, momentum, and turbulence were not considered in the present case. Beyond that, the numerical simulation was implemented in ANSYS, contrary to the use of OpenFOAM by [28]. In consideration of the target of the present research oriented with the determination of the attenuation effects that vegetation in a skygarden coupled with the seen wind pattern exerts upon the building platform, the deviations were regarded to be of small scale; besides, the observed contour took on sufficient accuracy oriented with the further in-depth analysis.

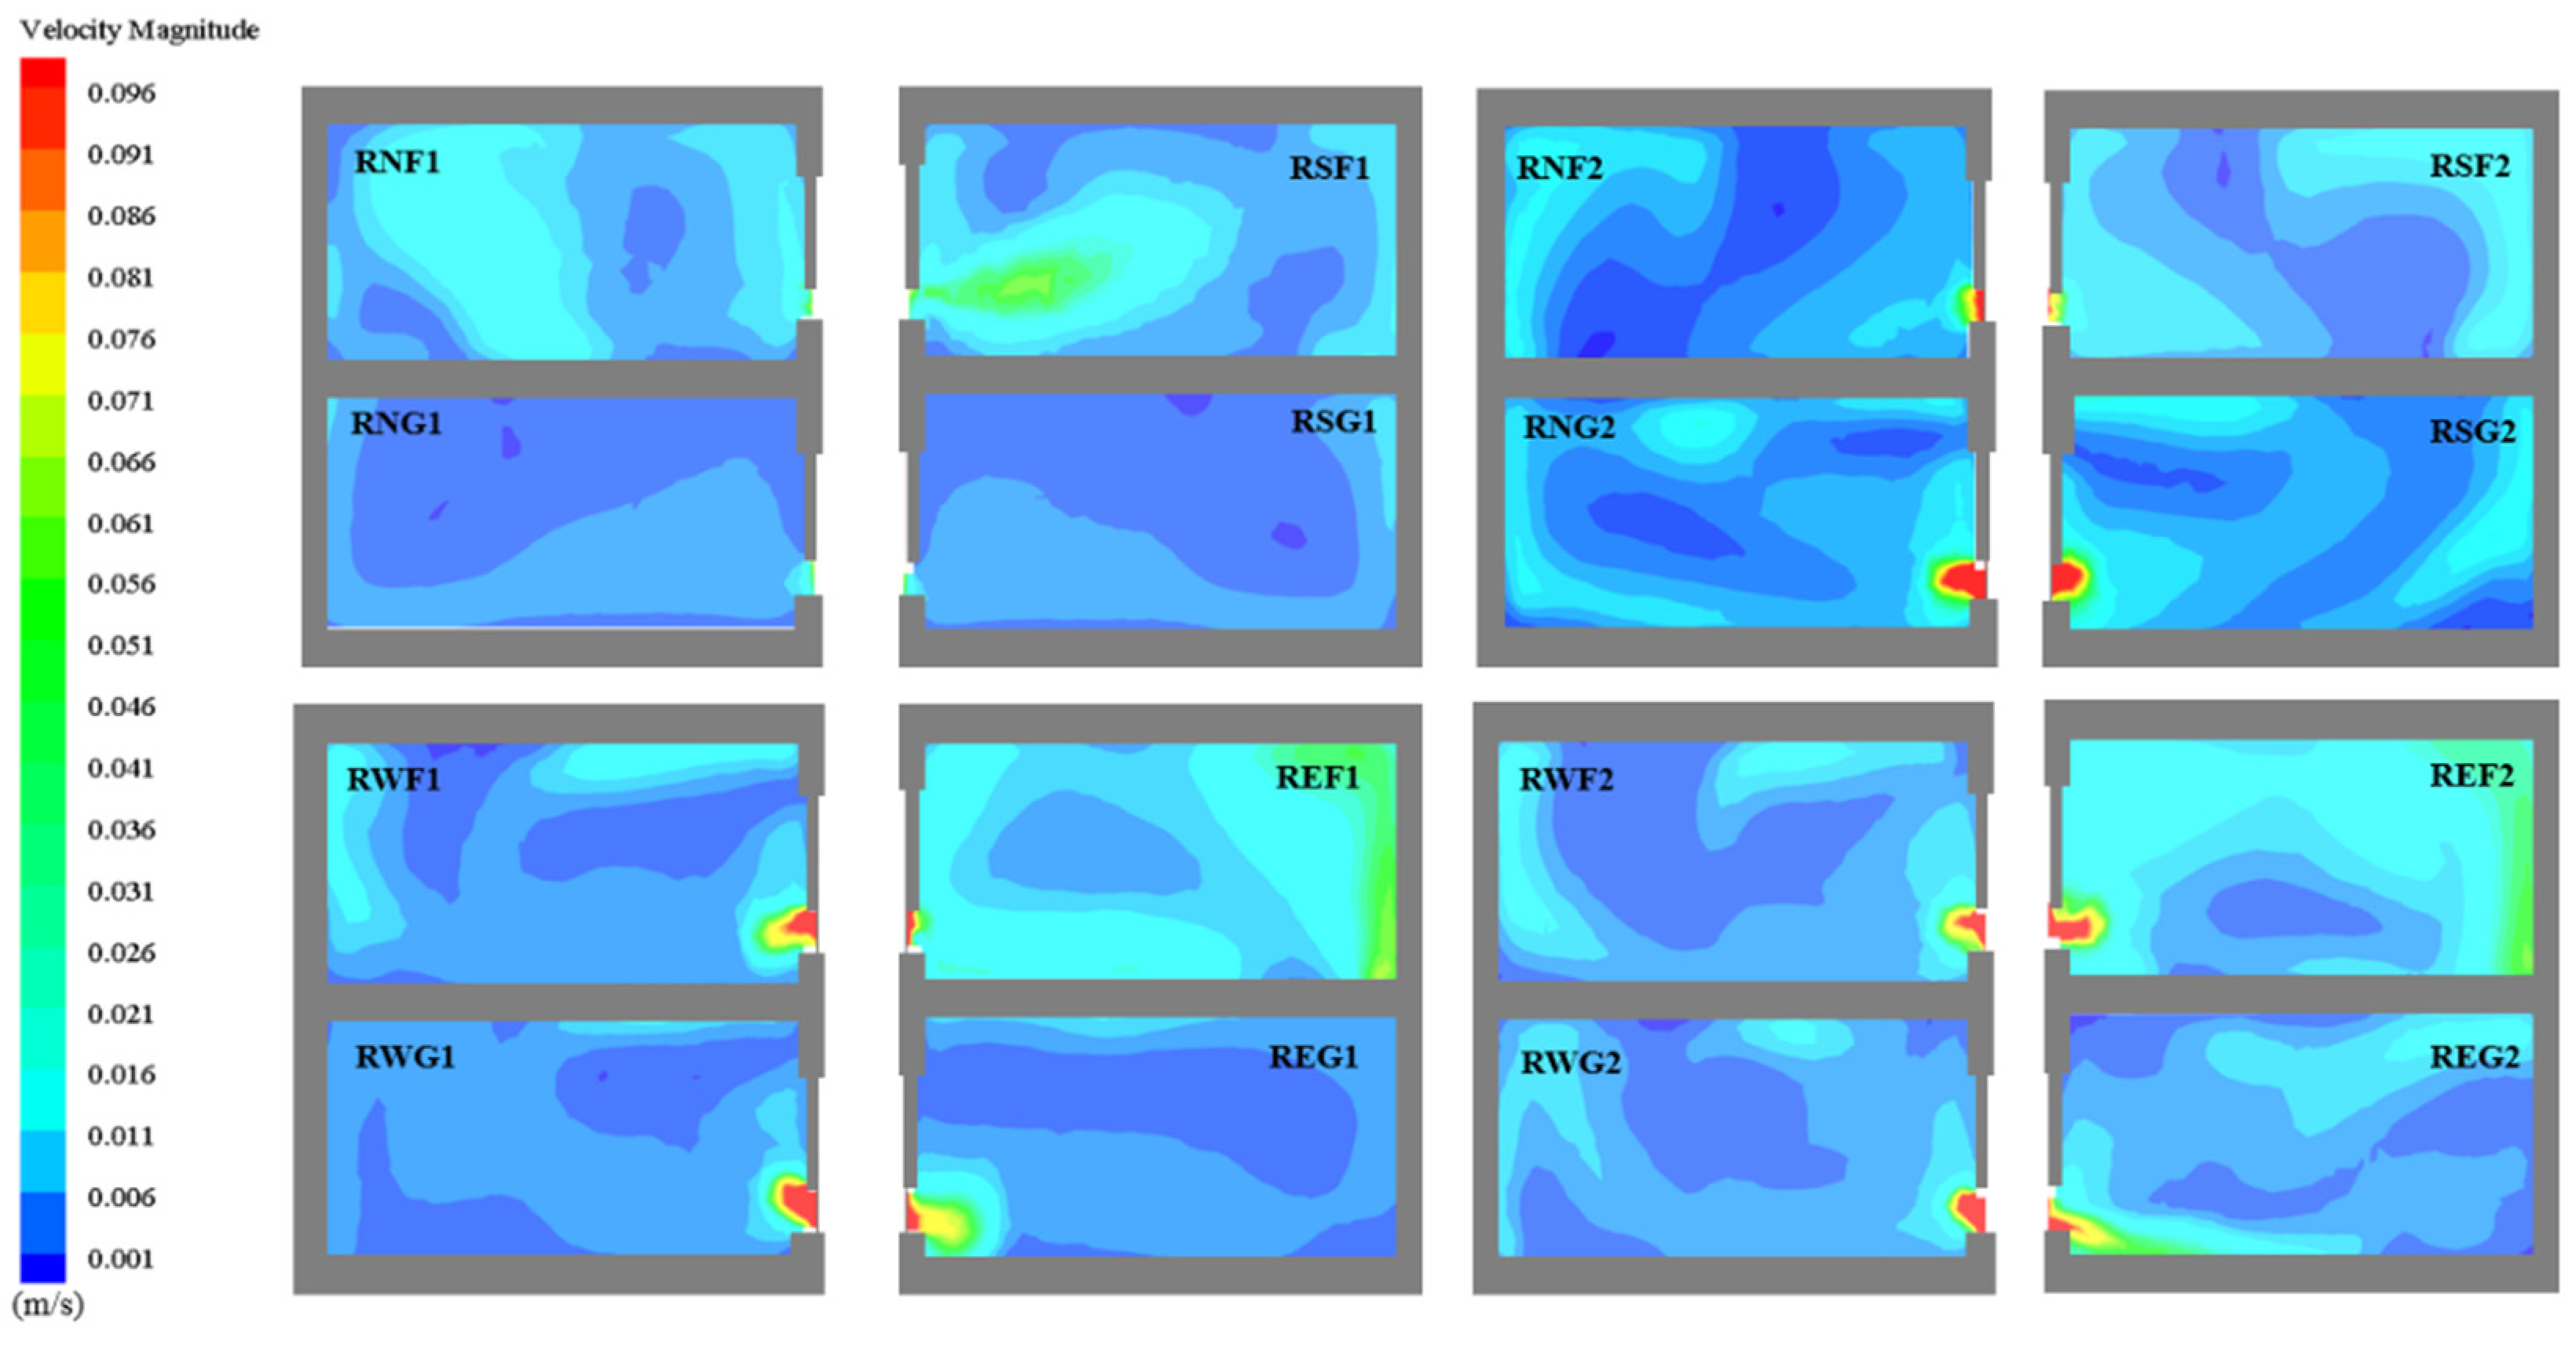
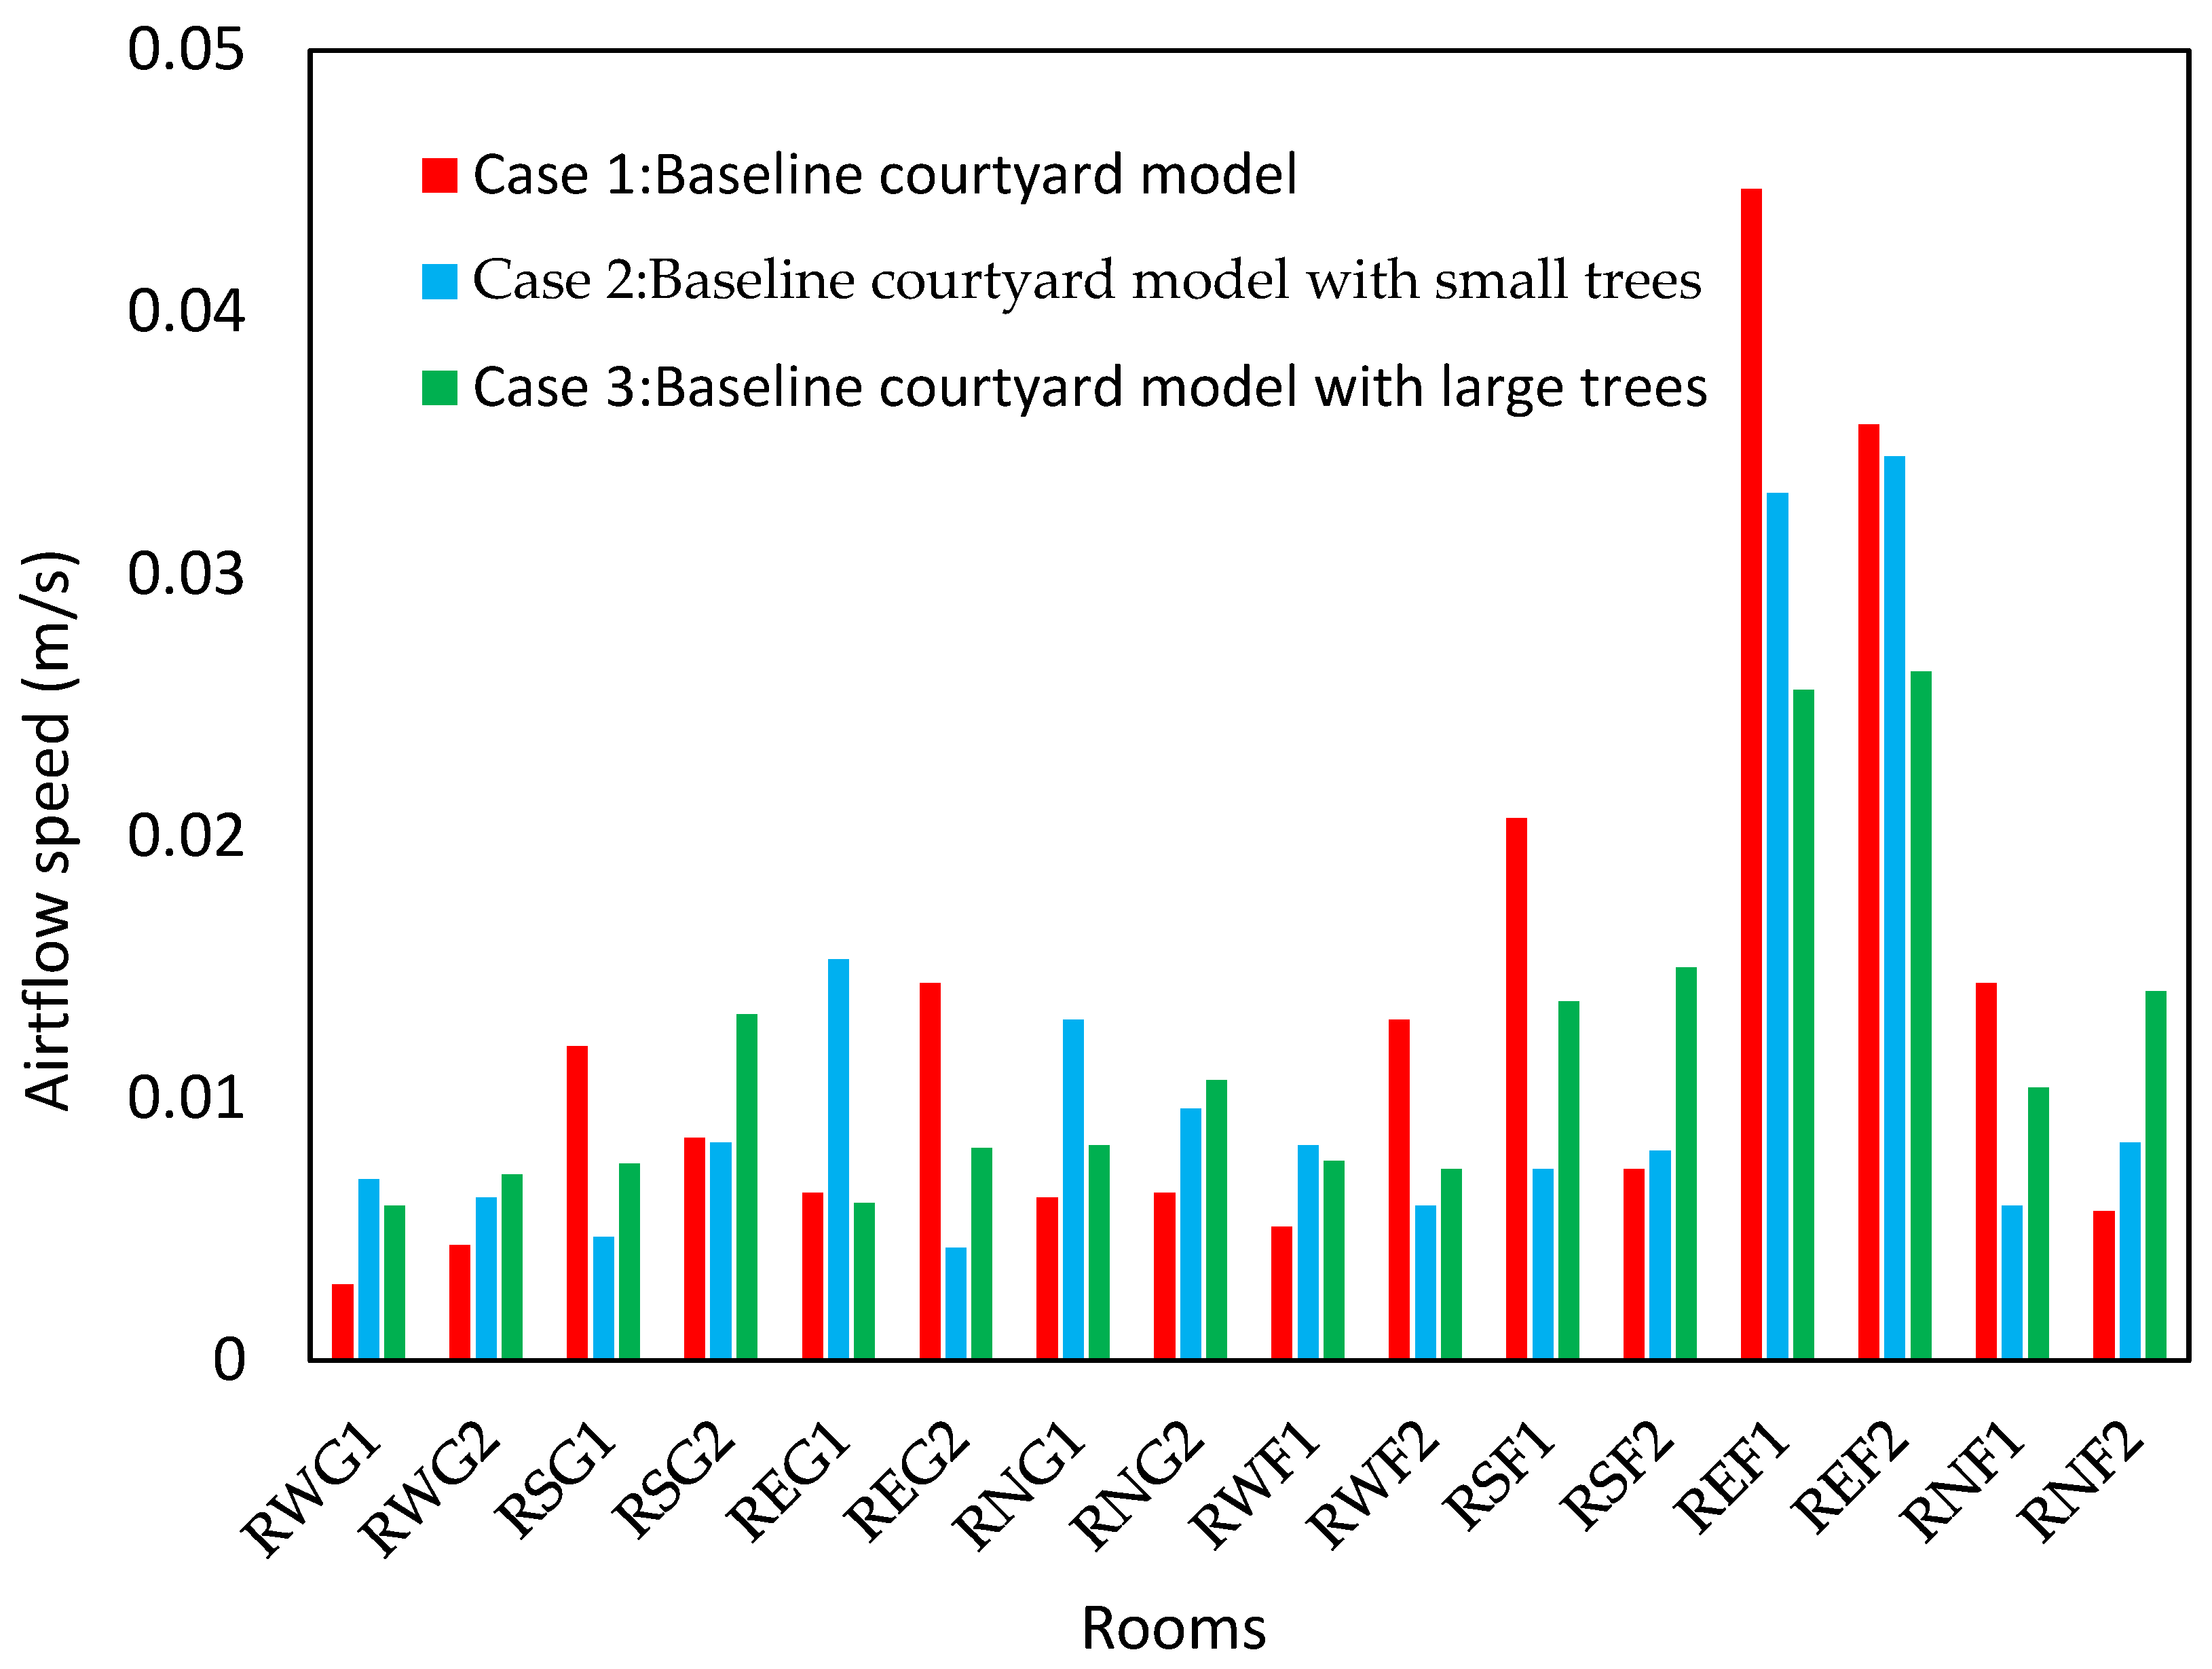
3.2. Simulation Results and Analysis

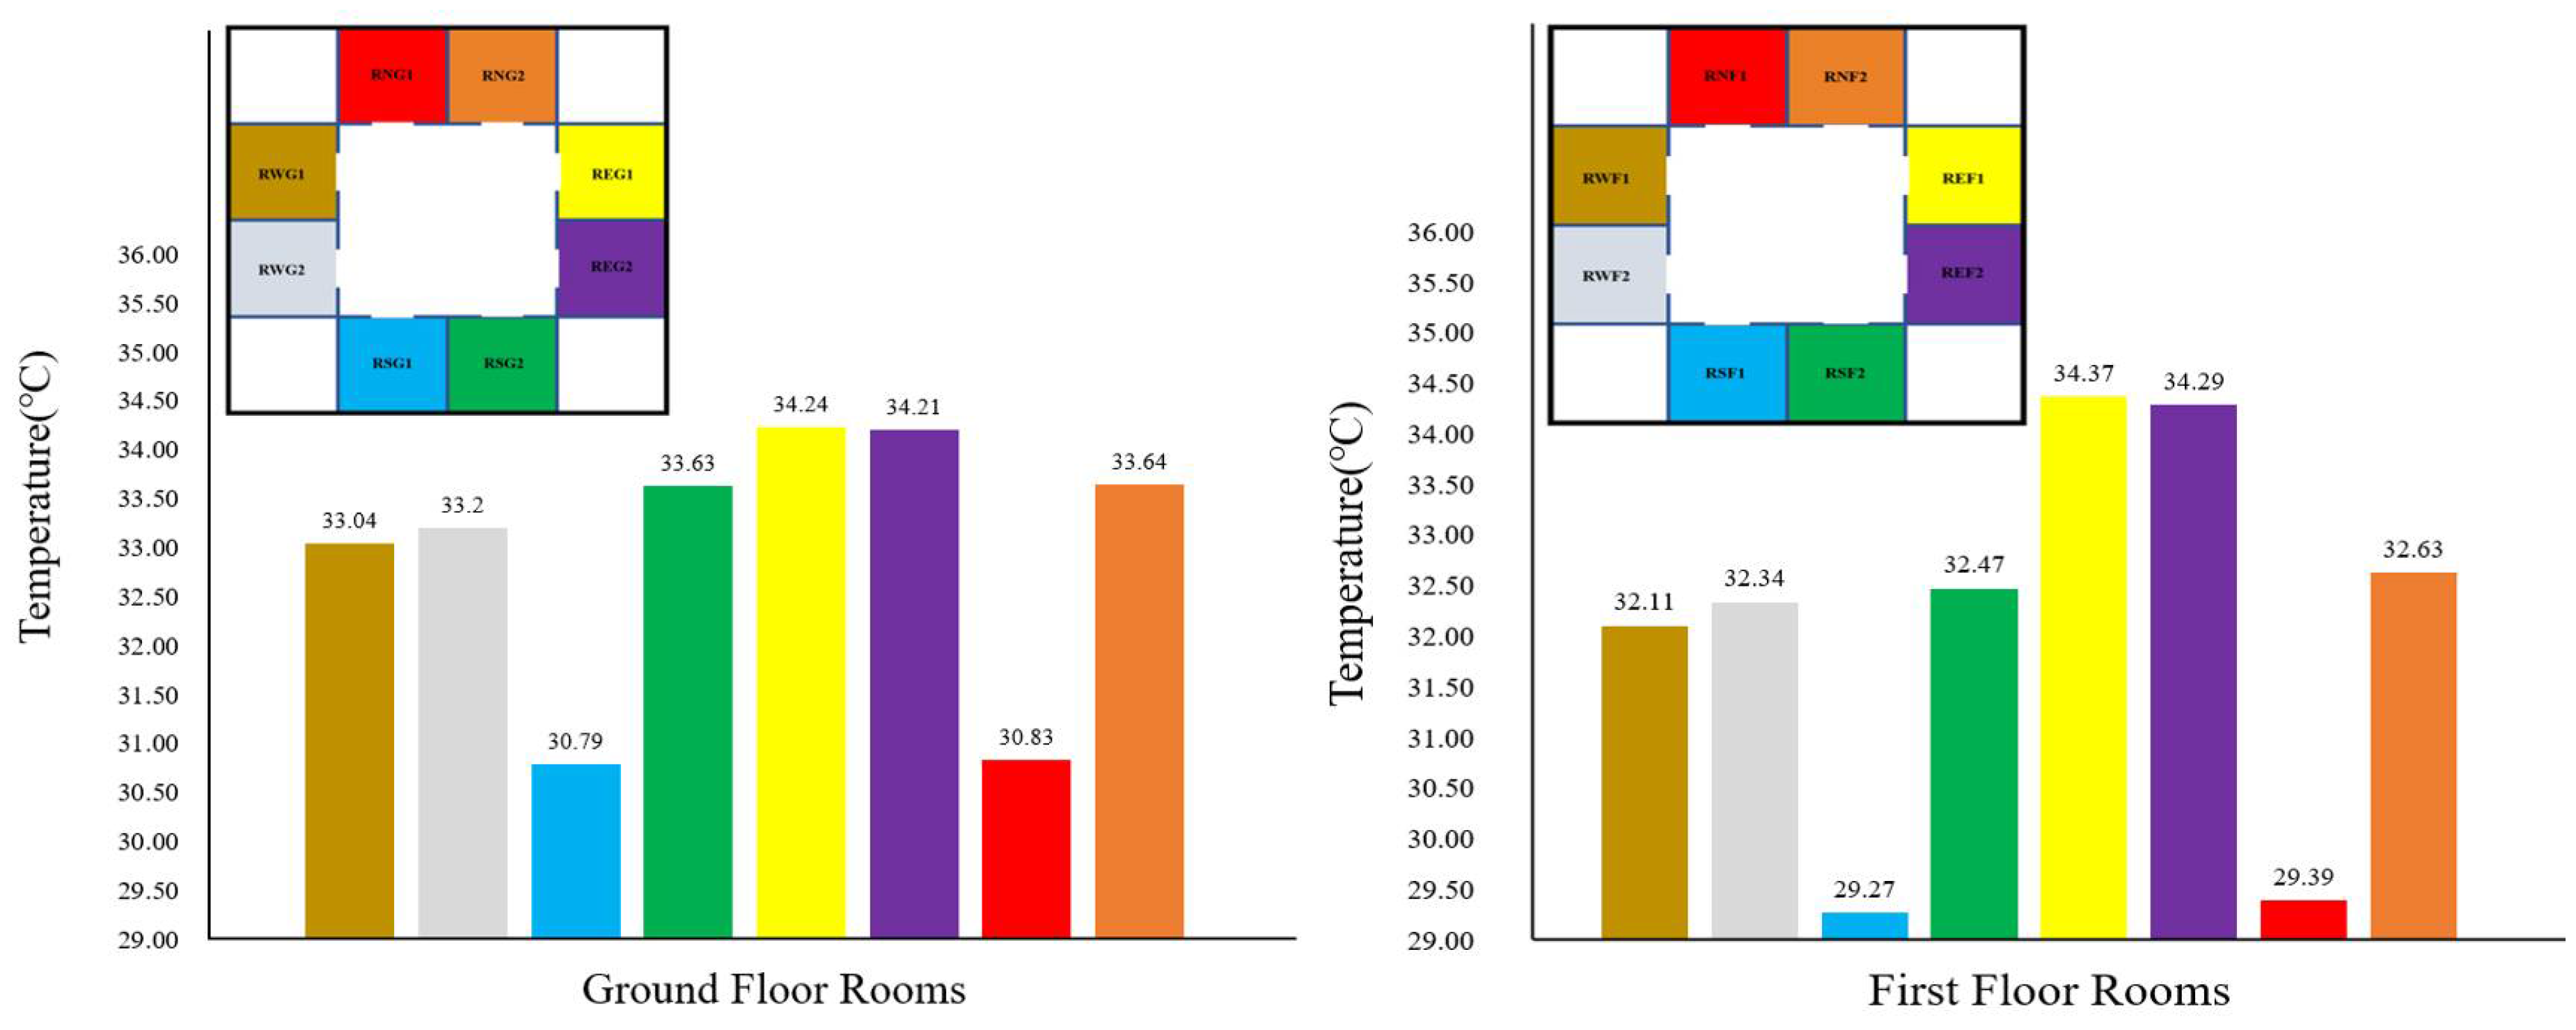
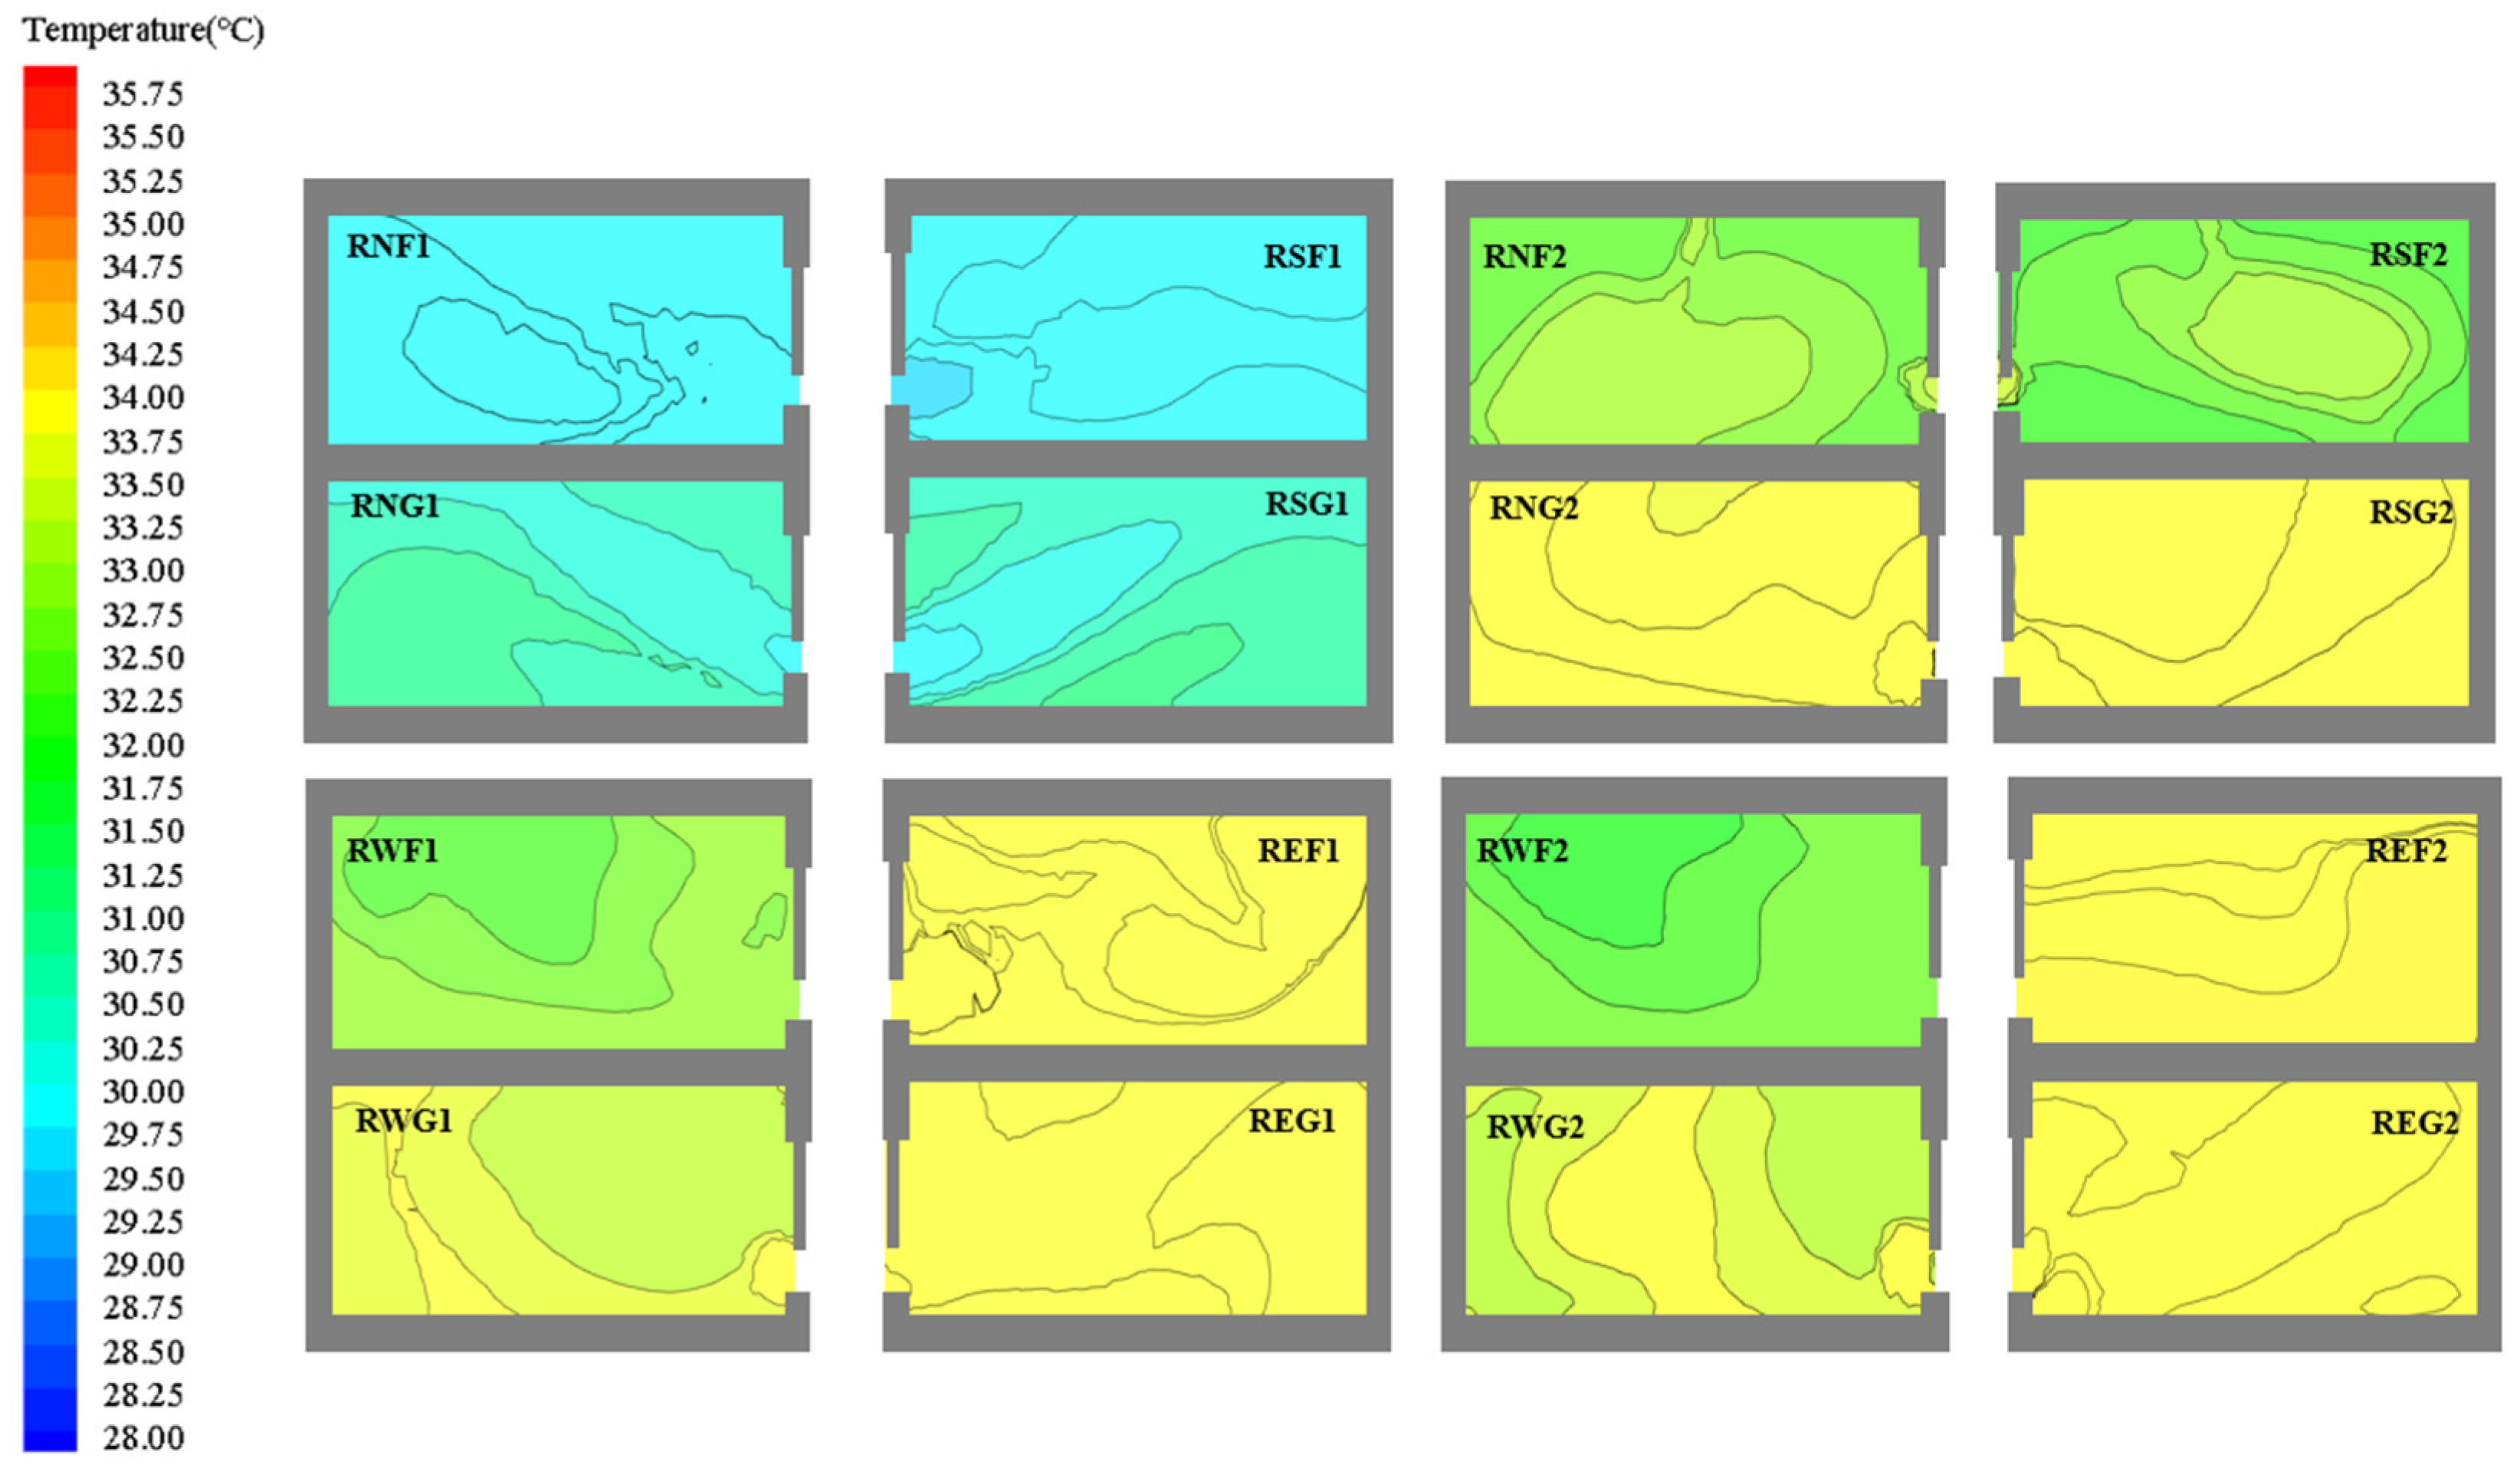
3.2.1. Case 1: Baseline Courtyard Model

The aim of the present study was to investigate the effects of the combination of courtyard and other passive cooling technologies on the indoor thermal performance and natural ventilation of the building. Two parameters, the indoor air-dry bulb temperature and the wind speed magnitude, were compared with the results of the different cases. Figure 15 presents the average wind speed magnitude in each room, the average wind speed and temperature in each room were calculated by setting up nine test points in each room, collecting the wind speed and temperature at the aforementioned nine points and determining their average value. The height of all test points was 0.6 m, based on the height of a normal person sitting on the chair. Figure 16 presents the contours of the wind speed in each room for the baseline courtyard model. According to the results, the wind speed in the rooms was extremely low, with an average wind speed on the ground floor around 0.0075 m/s in each room and on the first floor around 0.02 m/s in each room. Since the courtyard was a closed space, it could also be observed that on the ground floor, the average indoor wind speed above 0.01 m/s was recorded in the two rooms, i.e., REG2 and RSG1, with REG2 reaching 0.0144 m/s, whereas the lowest wind speed on this floor was in RWG1 on the west side at 0.0029 m/s. On the first floor, the highest wind speeds were identified in the two rooms, i.e., REF1 and REF2, on the east side, which were significantly higher than the other rooms tested, with wind speeds of 0.0447 m/s and 0.0357 m/s, respectively, while the lowest wind speed remained in REG1 on the west side (0.0051 m/s). In general, as observed from the comparison of the wind speeds in the two rooms on different floors, the wind speeds in the rooms on the first floor were mostly higher than those in the rooms on the ground floor. For the baseline model, the average room temperature was 35.85 °C which was the same as the inlet.

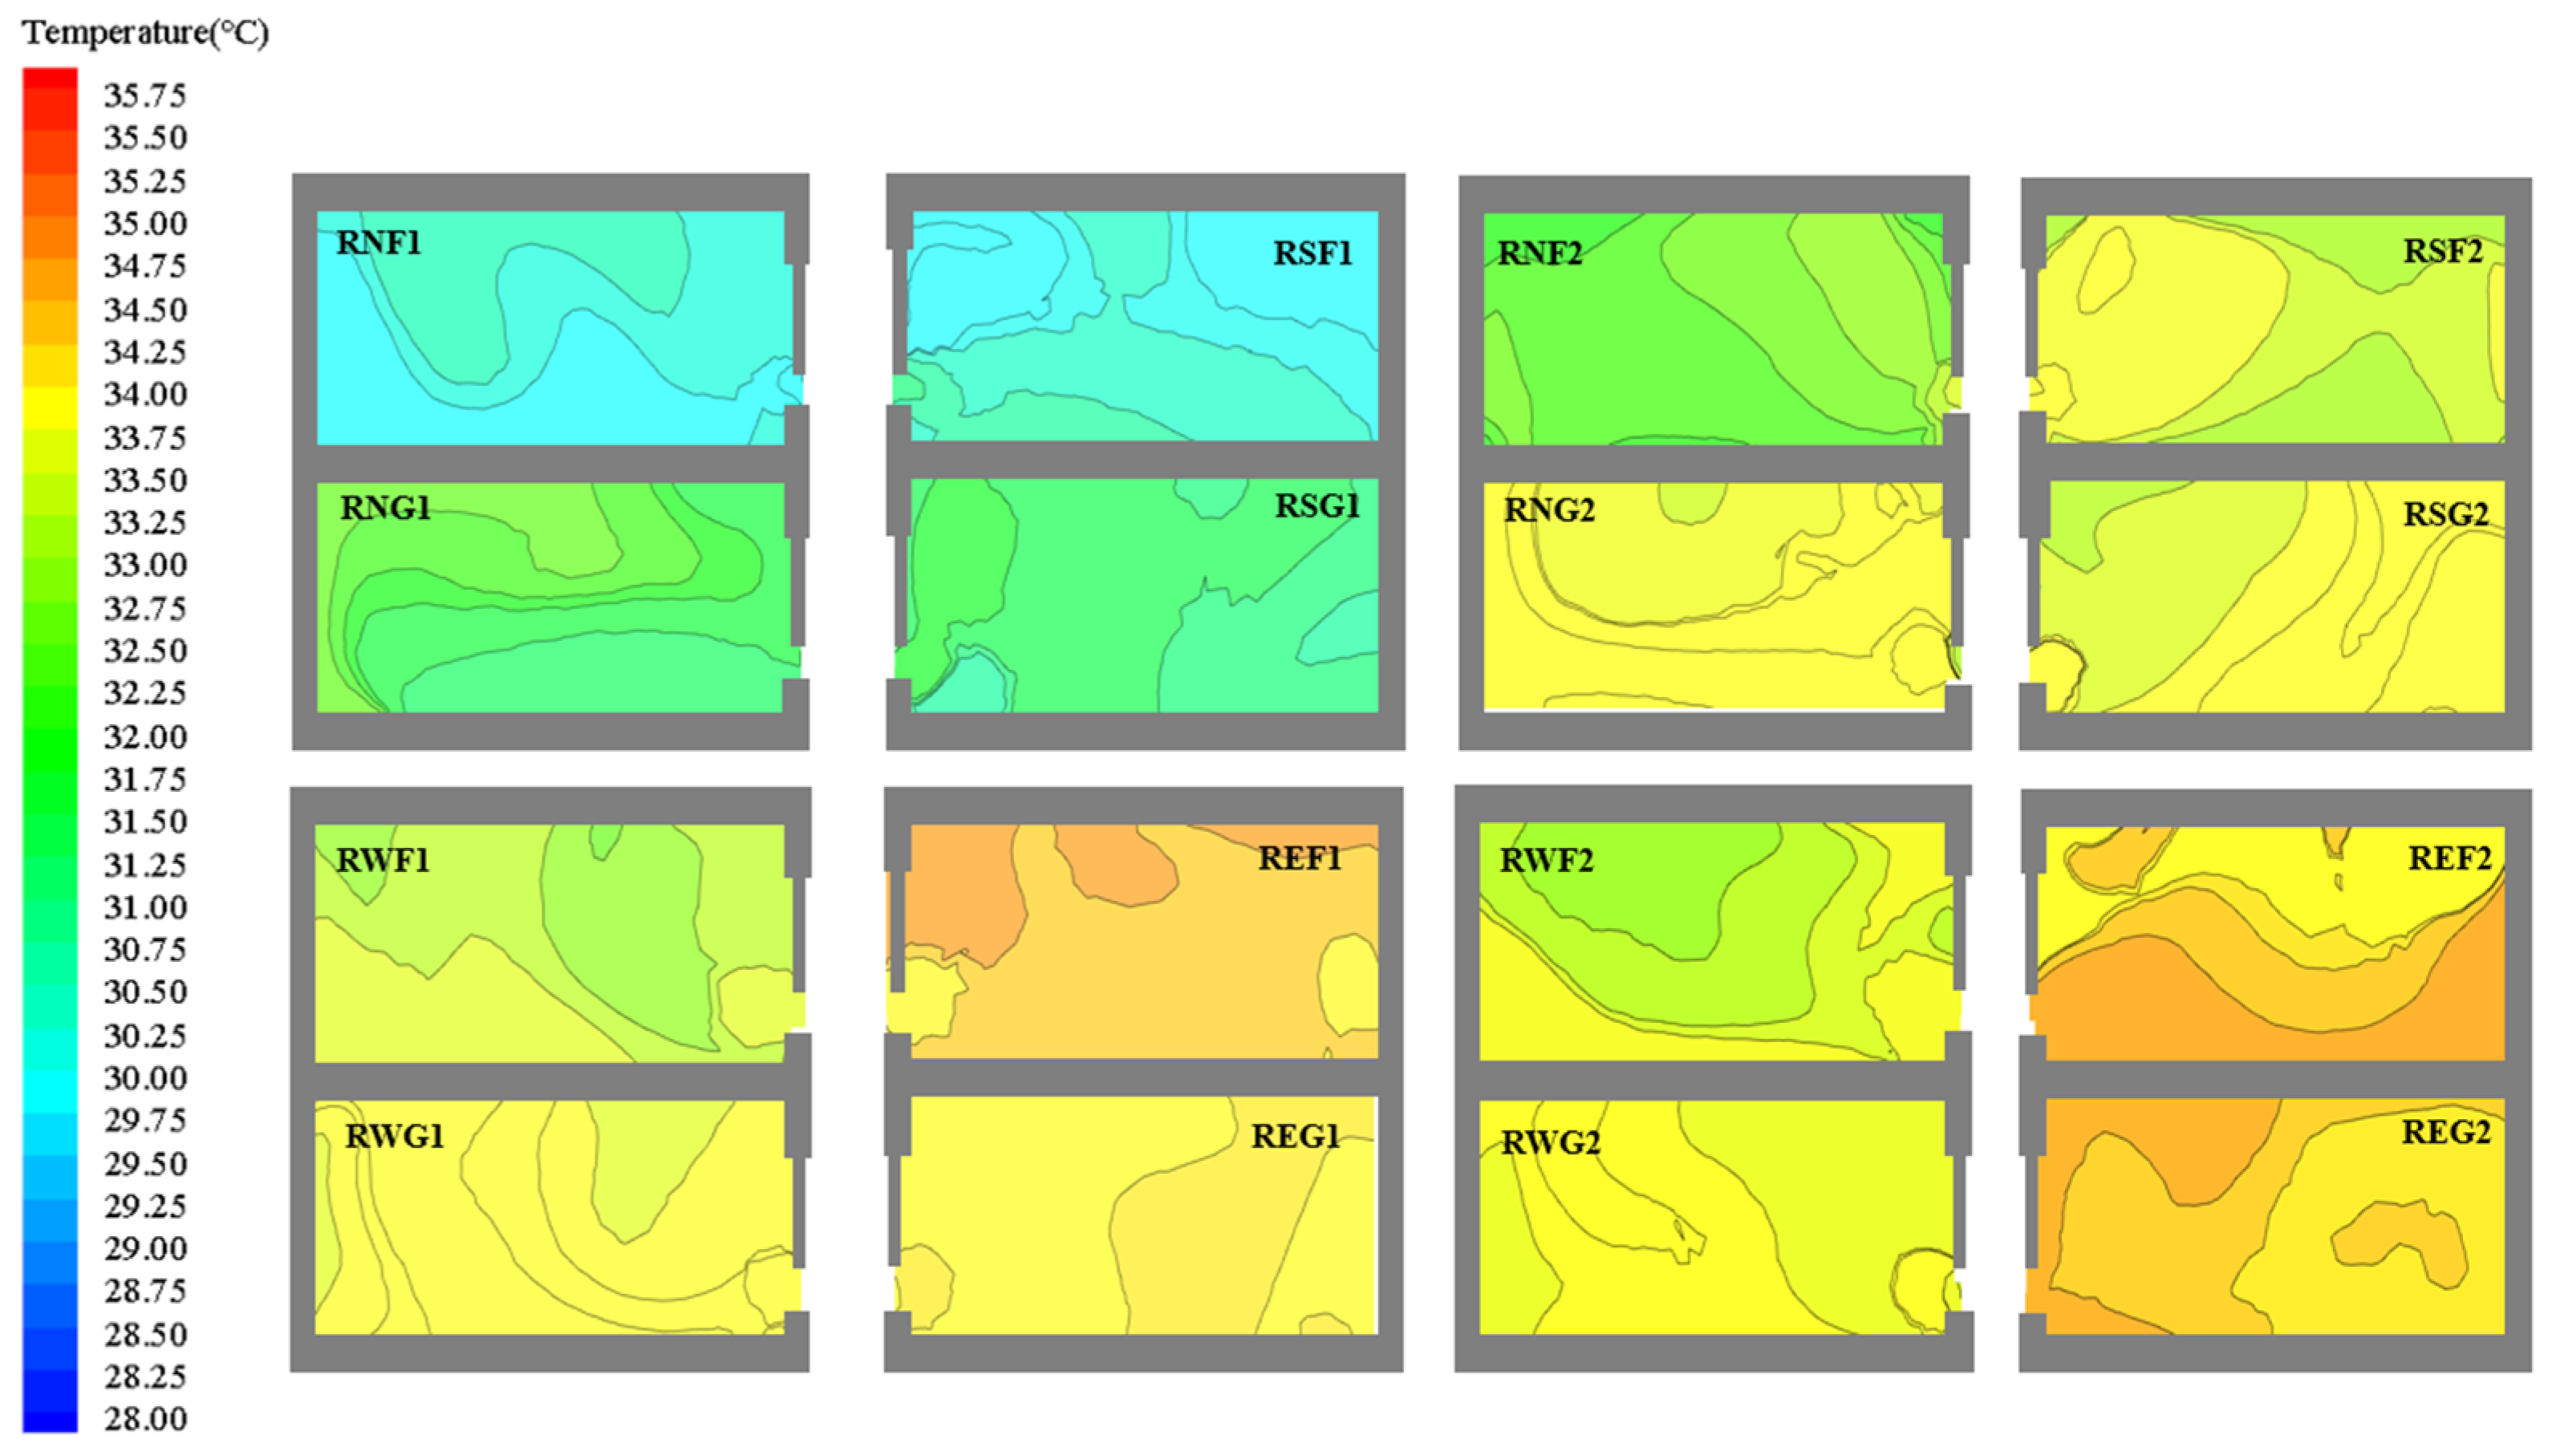
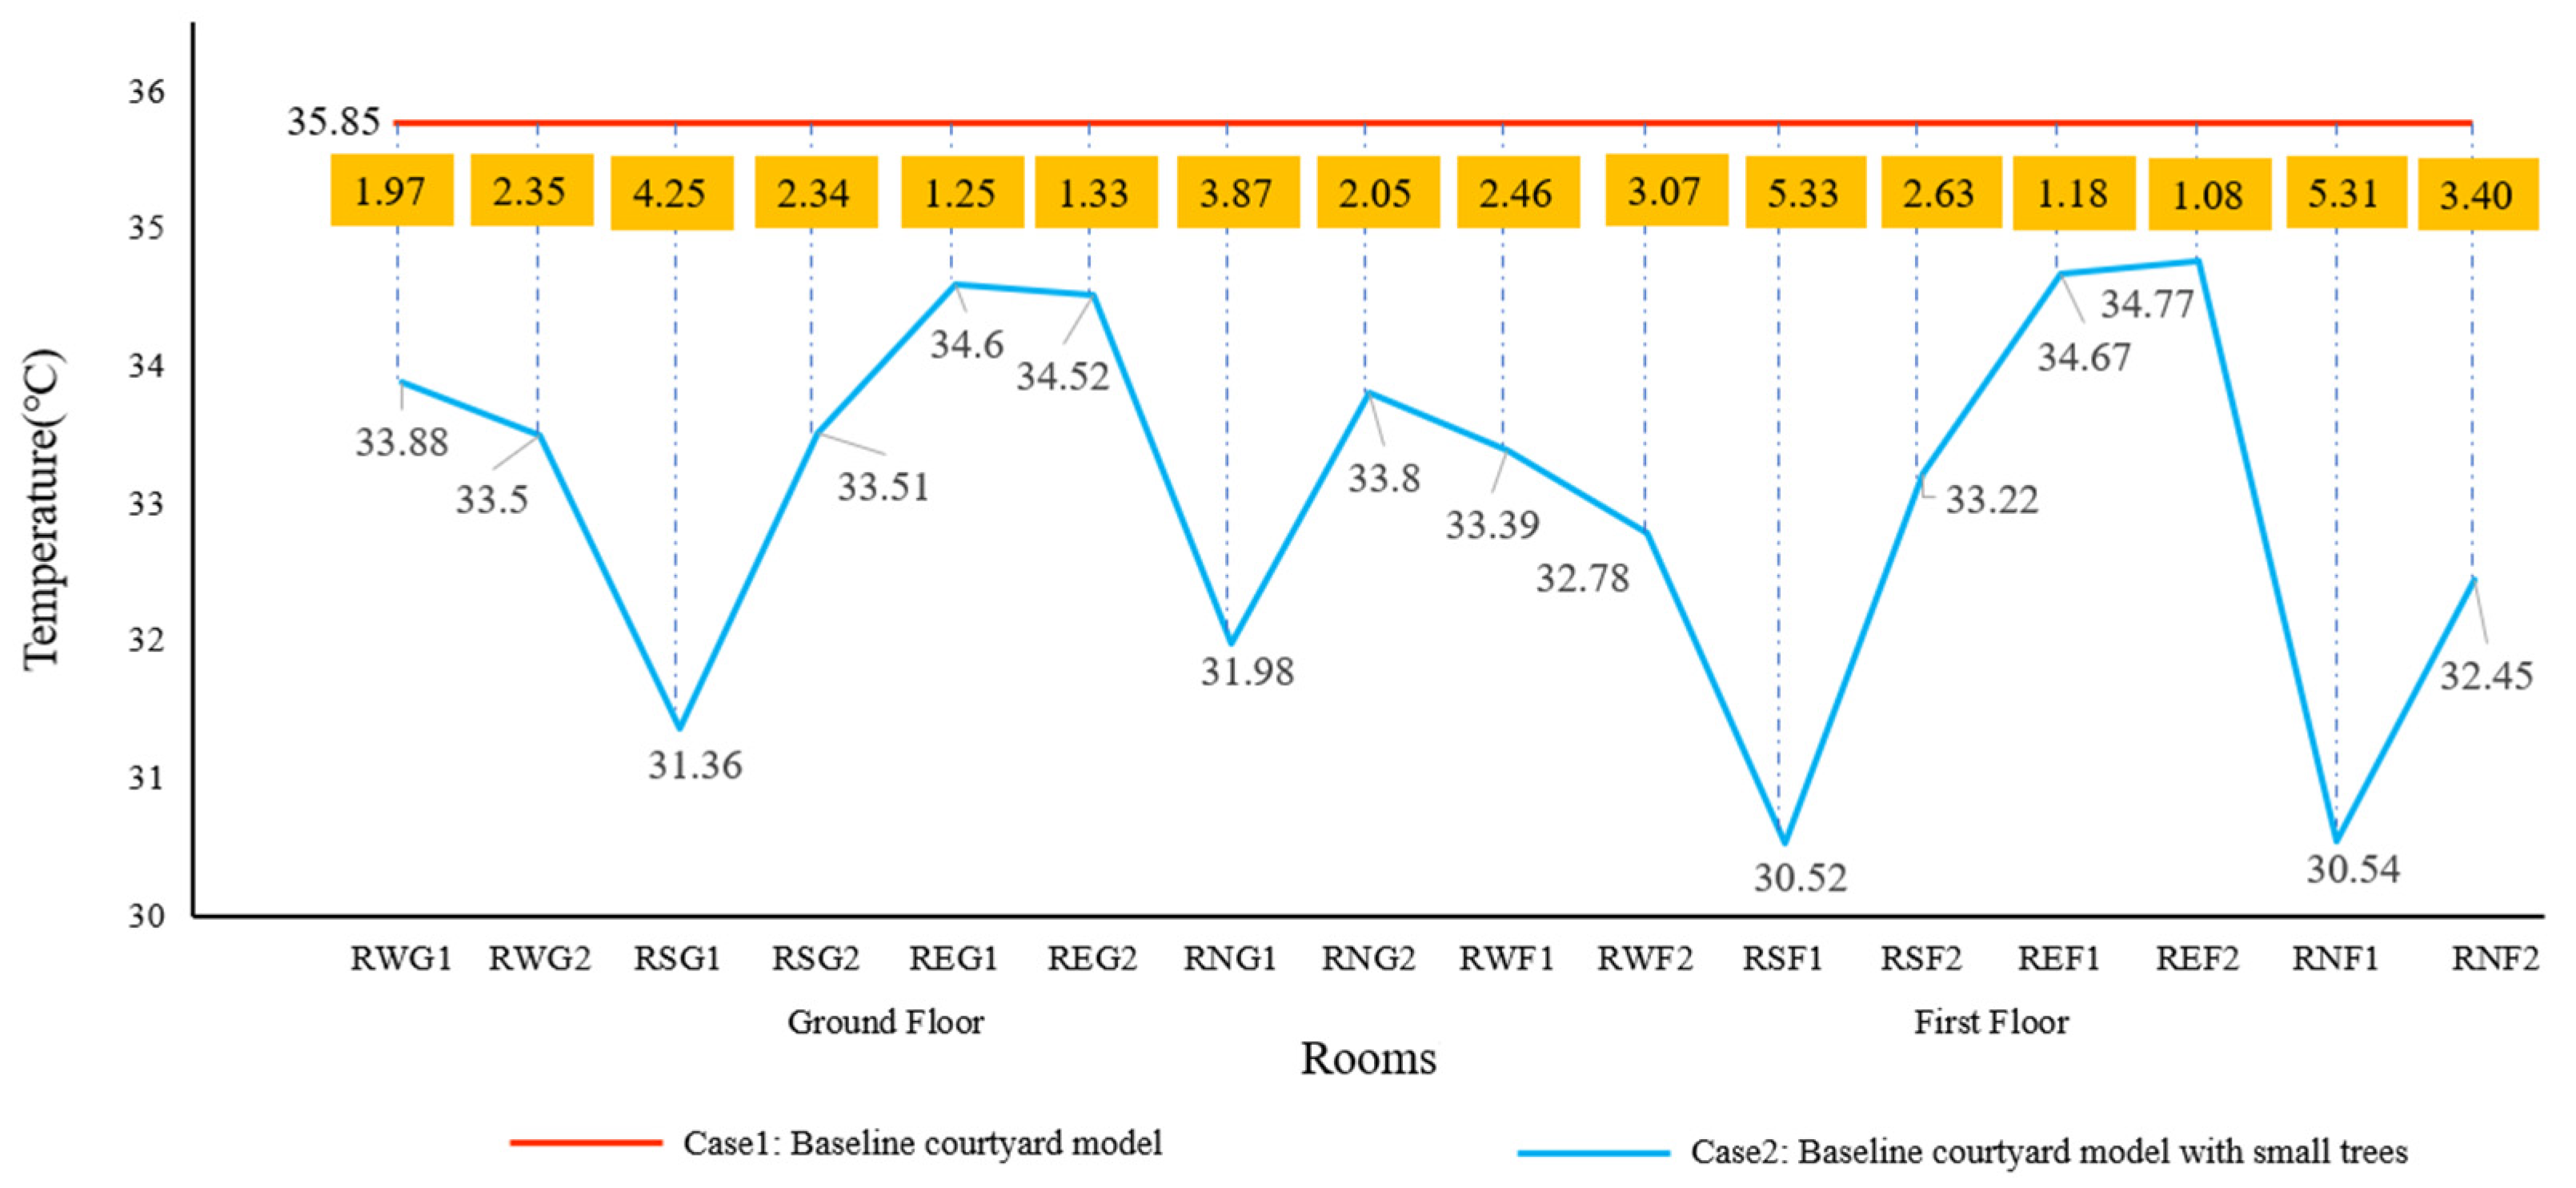
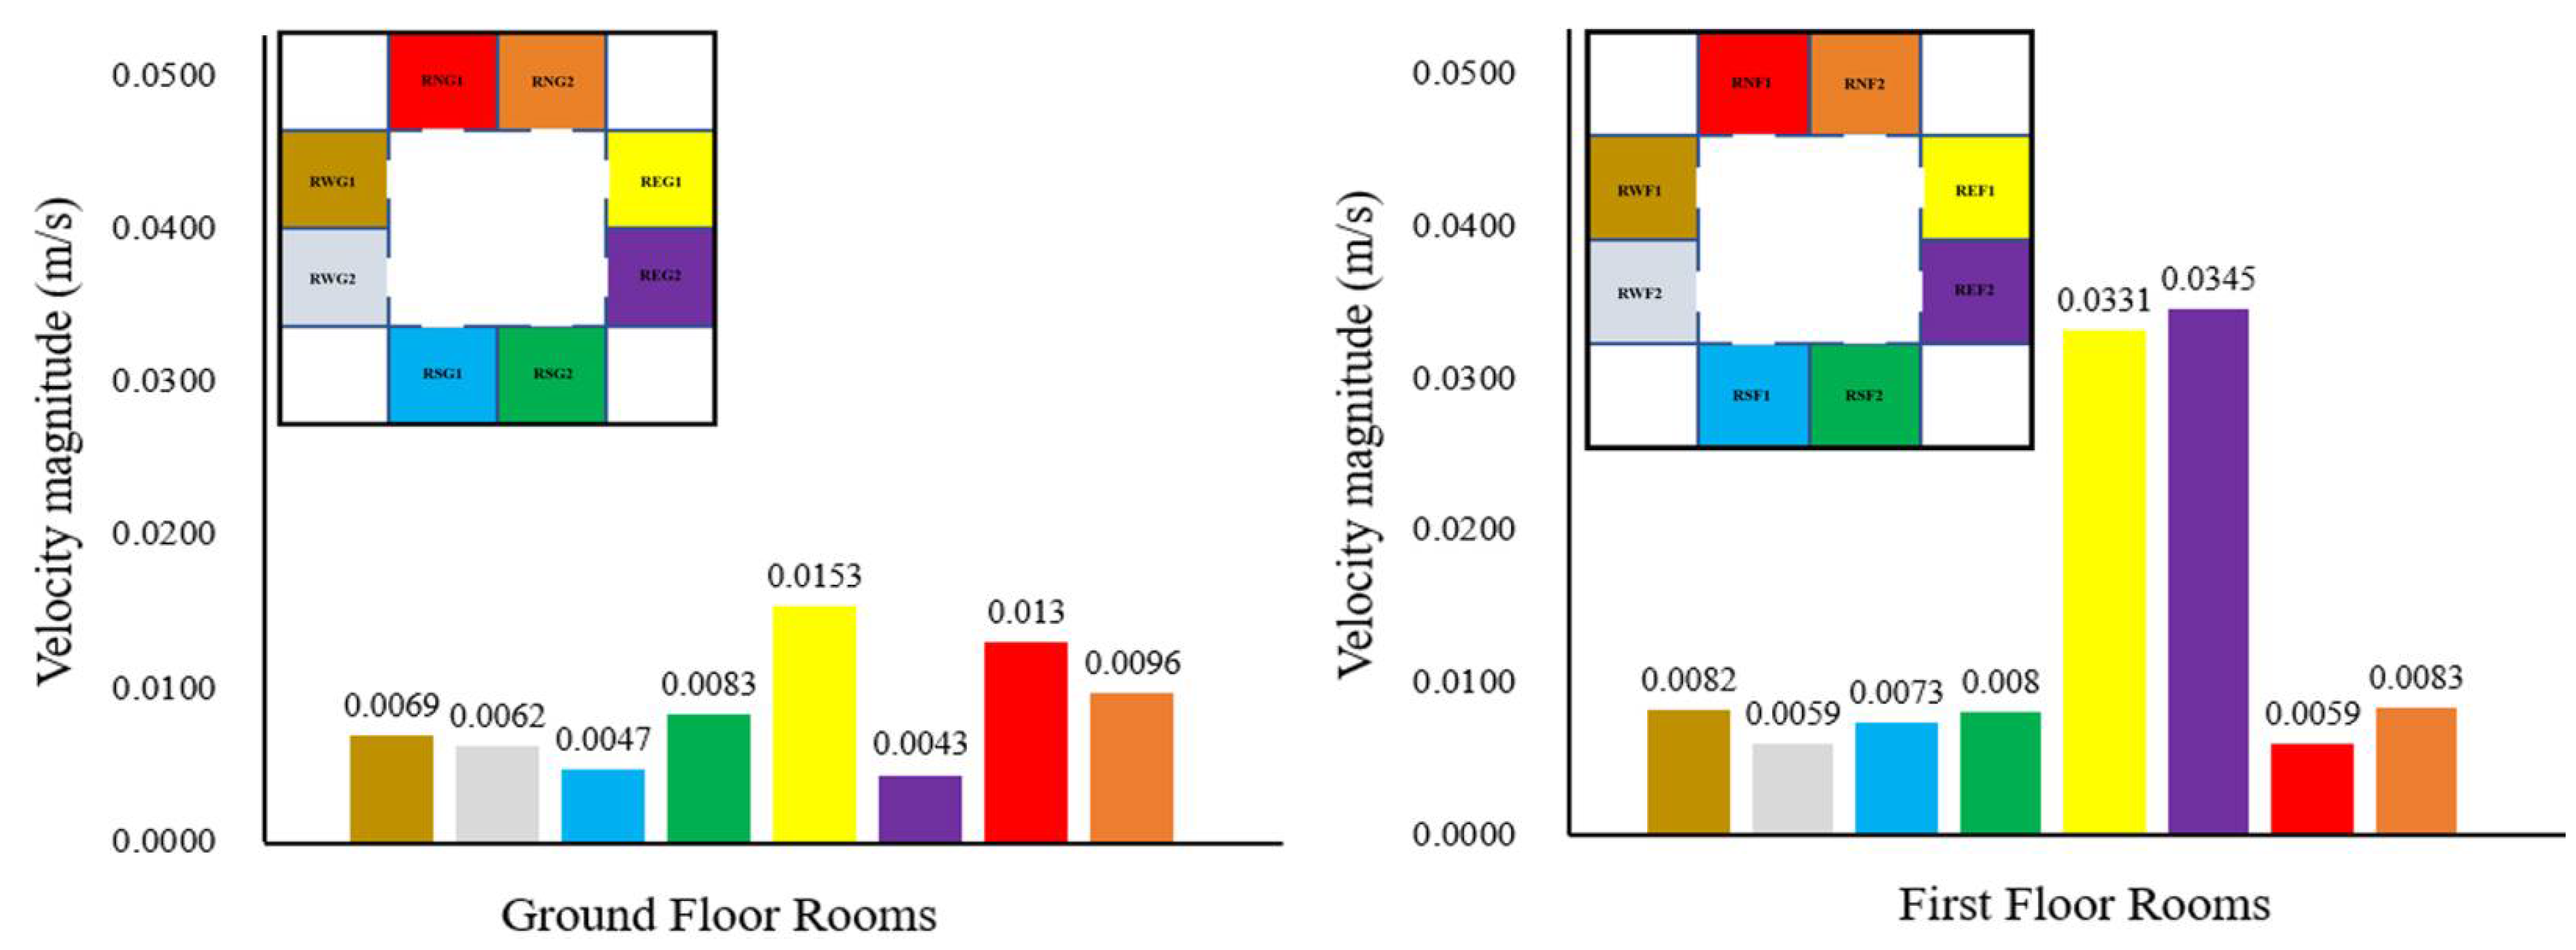
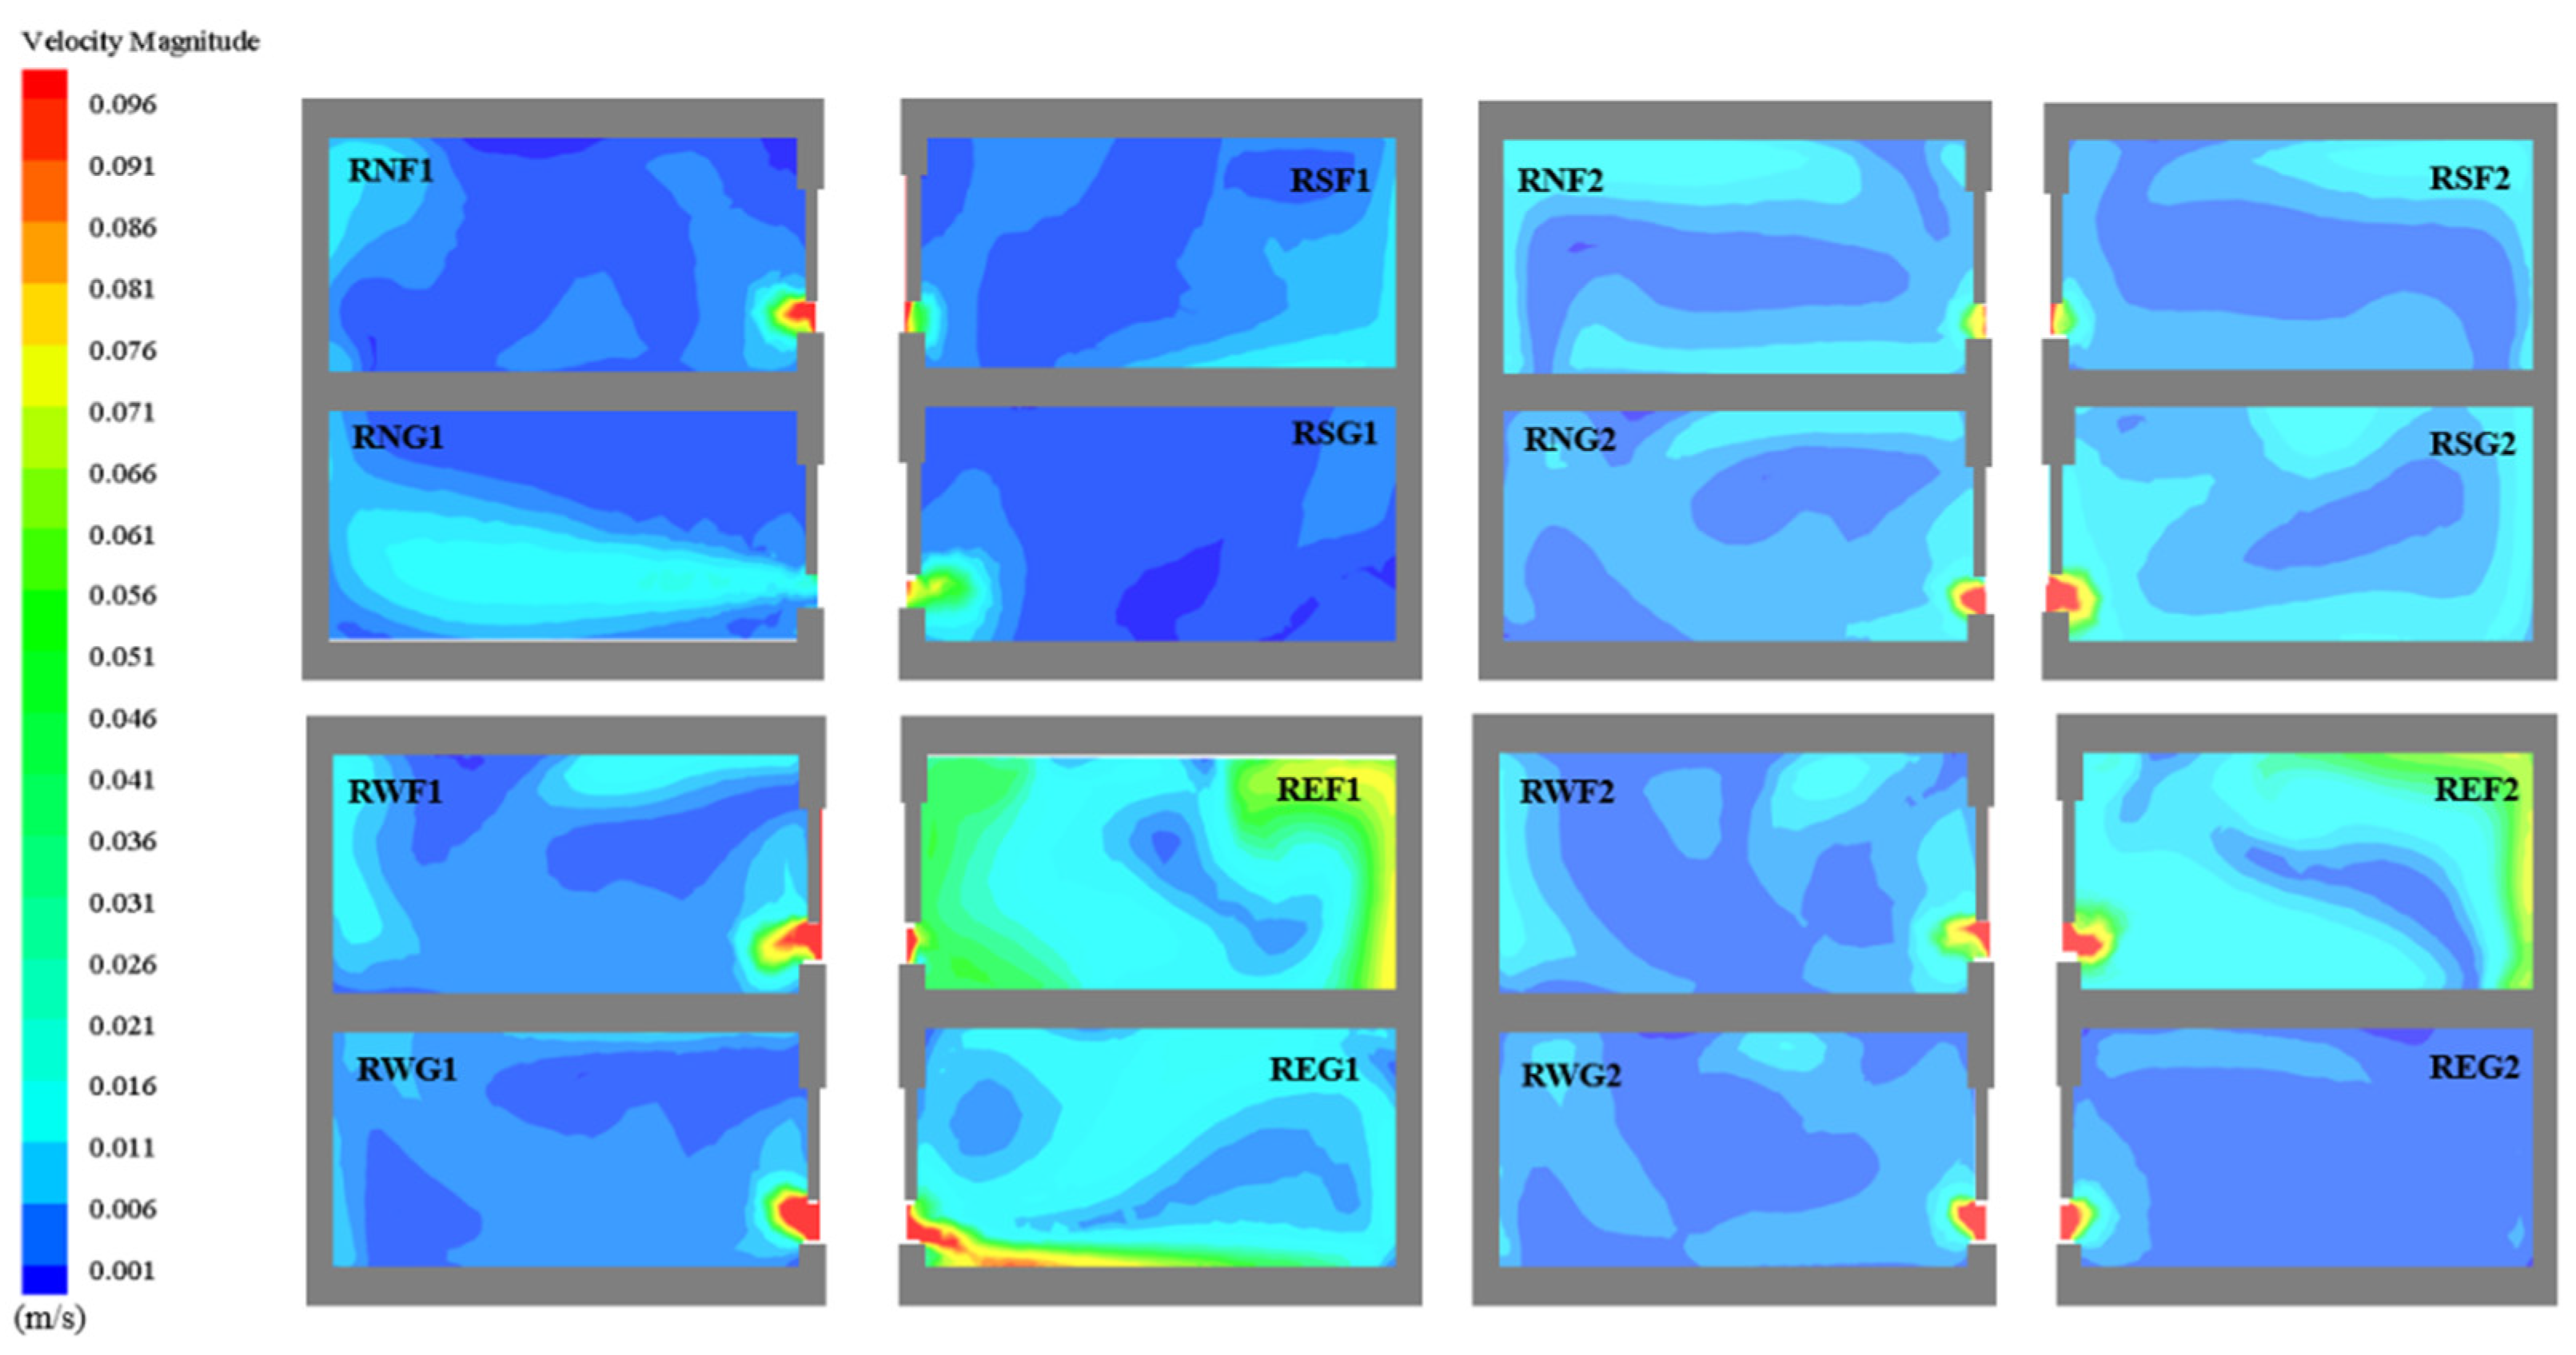
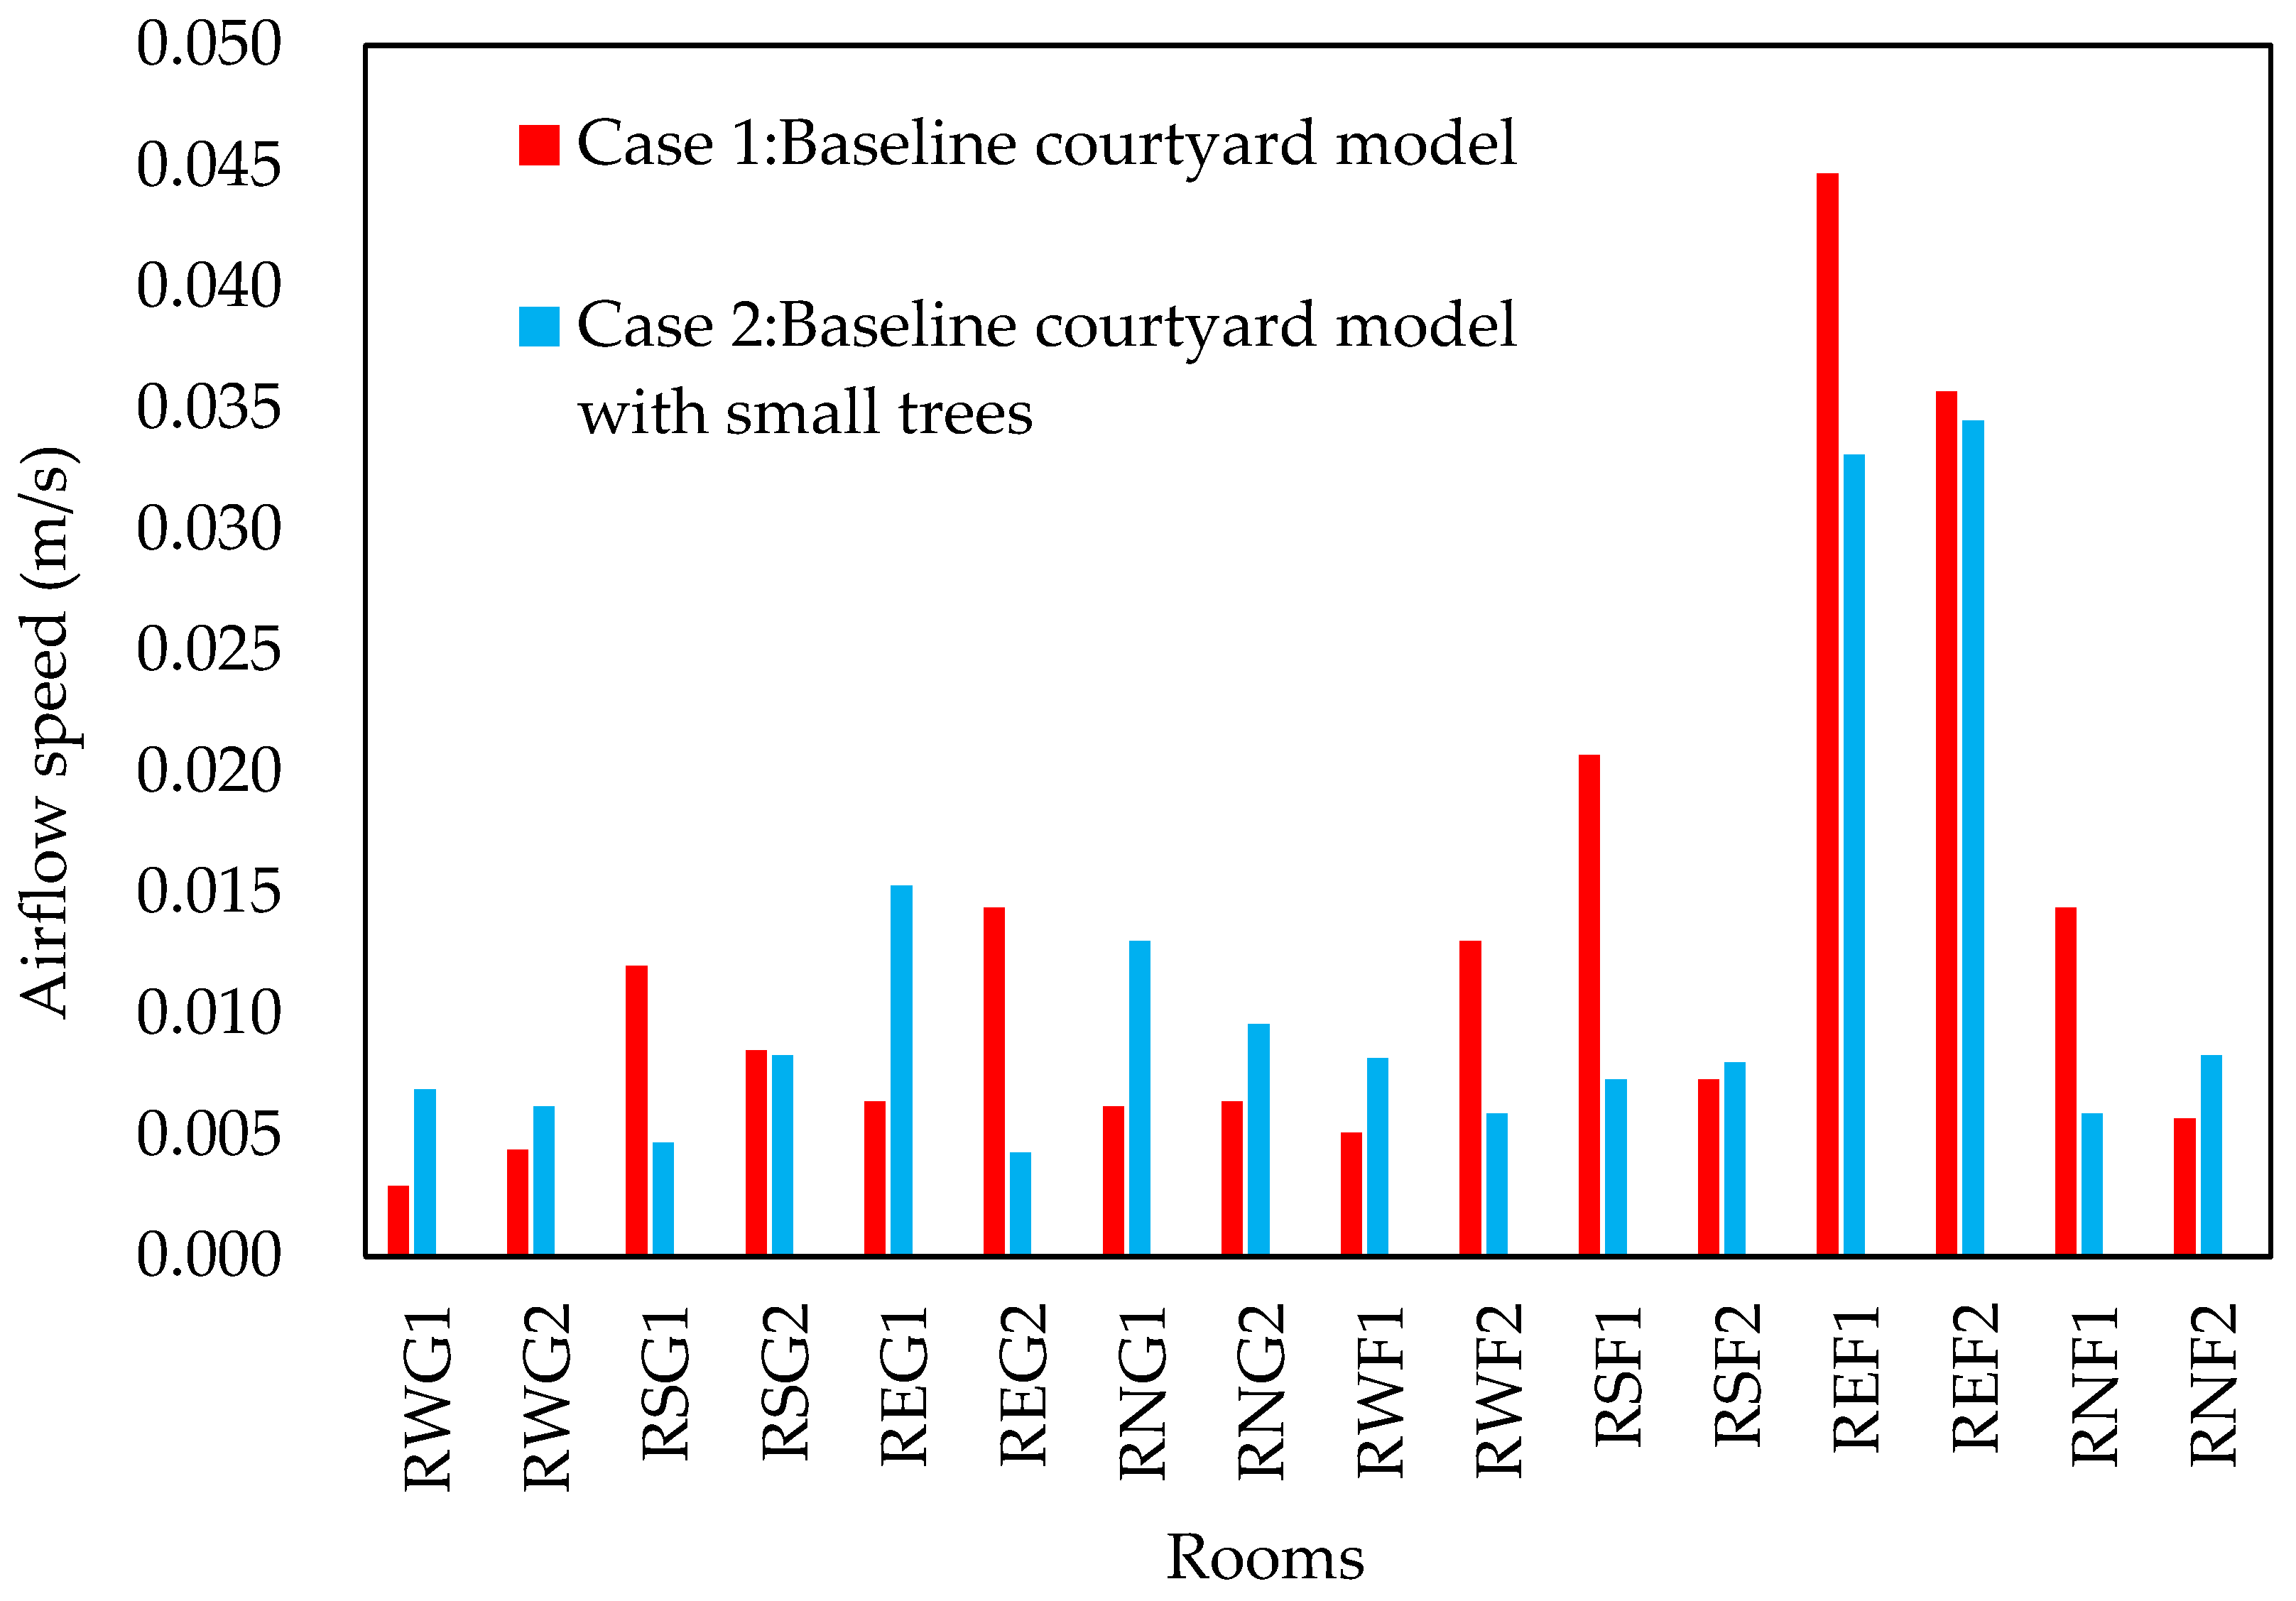
3.2.2. Case 2: Baseline Courtyard Model with Four Small Trees

Vegetation in the courtyard could effectively improve the microclimate of the courtyard due to its evaporative cooling effect and shading, which could improve the thermal comfort of the courtyard. In this section, four 1.5 m height hedges were placed at the corners of a closed courtyard to determine the effect of vegetation on the building’s indoor thermal performance and ventilation conditions.
In the baseline courtyard model, the outdoor air temperature was set to 35.85 °C. Figure 17 illustrates the air temperature in each room. Figure 18 illustrates the simulated results of the air temperature contour with isotherm in each room. According to the figure, the temperature in each room decreased after adding vegetation in the courtyard, whereas the decrease was different for each indoor space. Among the 16 rooms evaluated on the two floors, the four rooms on the east side were warmer than the rooms in the other directions, achieving average air temperatures over 34 °C. The four rooms (RNG1, RNF1, RSG1 and RSF1) on the north and south sides close to the inlet were cooler, especially RSG1 and RSF1 on the south side, which were the lowest air temperature rooms on the respective floor. The highest air temperature was observed in REF2 (34.77 °C), and the lowest temperature was RSF1 at 30.52 °C. In the eight test rooms on the ground floor, the average indoor temperature was 33.39 °C, and on the second floor, it was 32.79 °C. Compared with the baseline courtyard model, indoor temperatures dropped by 7.4% and 9.3%, respectively, demonstrating that planting vegetation in the courtyard can cool the indoor space.
In Figure 19, the air temperature in each room for Case 1 and Case 2 were compared, the relevant temperature difference was also shown. Therefore, it was indicated that the vegetation cooled the interior of the courtyard building. According to the comparison of the temperatures of the rooms in the identical locations, the temperatures of the first-floor rooms were lower than those of the ground-floor rooms. The most significant temperature reduction was in the two rooms on the first floor facing north and south (i.e., RNF1 and RSF1); the temperature reduced by 5.31 °C and 5.33 °C, respectively. The rooms facing east and west had a minimal decrease in temperature, especially in the four rooms on the east side, in which the average room temperature only decreased by around 1.2 °C.
As indicated from the comparison of the aforementioned results, in Case 2, the courtyard with four small trees cooled the interior of the building, whereas the extent of the cooling effect was determined by the specific location in each room. To be specific, the rooms facing north and south exerted the best cooling effect, the rooms facing east achieved a limited cooling effect, and the rooms on the first floor had a better cooling performance than those on the first floor. The reason for this result was explained as the temperature reduction from vegetation was limited in scope.
Figure 20 presents the average wind speed magnitude simulation results in the courtyard model’s respective room with four small trees. According to the figure, the wind speed on the ground floor was smaller than 0.02 m/s, and the two rooms with the highest and lowest wind speeds, at 0.0153 m/s and 0.0043 m/s respectively, were both on the east side. The indoor wind speed in RNG1 and RNG2, above 0.009 m/s, was higher than the average indoor wind speed of other rooms on the ground floor. On the first floor, the indoor airspeed in the REF1 and REF2 on the east side was significantly higher than that in the other rooms, nearly four times higher than the other rooms. The contours of the wind speed in each room for the baseline courtyard model with four small trees is shown in Figure 21.
Figure 22 shows the comparative results of the wind speed for the identical rooms in Case 1 and Case 2. According to the figure, the placement of four small trees in the closed courtyard impacted the ventilation of the building interior. As indicated from the comparison of the simulation results, the effect of small trees on the indoor ventilation of rooms in different locations was not similar. On the ground floor, specific to the four rooms (i.e., RNG1, RNG2, RWG1 and RWG2) on the north and western sides, with the addition of small trees in the courtyard, the indoor wind speed significantly increased, especially the indoor wind speed of RWG1, increasing from 0.0029 m/s to 0.0069 m/s, nearly a 2.4 times improvement. As opposed to the aforementioned, in the two rooms located to the south, RSG1 and RSG2, the indoor wind speed decreased due to the planting of small trees. The reduction in RSG1 was particularly pronounced, with a drop of 0.0073 m/s, and RSG2 only dropped by 0.0002 m/s, which was nearly identical to the Case 1. However, on the east side, the trends in REG1 and REG2 were opposed, REG1 increased by 0.0089 m/s, while REG2 decreased by 0.0101 m/s. In the eight testing rooms on the ground floor, by arranging four small trees inside the courtyard, the greatest increase in indoor wind speed magnitude was identified in REG1, and the most significant decrease was reported in REG2. According to the comparison of the simulation results on the first floor, the wind speed increased in three rooms, RNF2, RWF1 and RSF2, with the most significant increase in RWF1, where the wind speed increased magnitude increased by 0.0031 m/s. The minimum increase and the minimum decrease were achieved by RSF2 (an increase of 0.0007 m/s) and REF2 (decrease of 0.0012 m/s), respectively.
As suggested from the comparative results, the arrangement of four small trees in the courtyard impacted the indoor wind environment in surrounding buildings. Some rooms showed an increase in wind speed size, while some showed a decrease. A number of factors could be responsible for this (e.g., the transpiration of the vegetation), which changed the temperature and pressure of the surrounding air, thereby indirectly impacting the wind environment in the courtyard or the vegetation. As a result, the wind might be blocked, and the direction of the wind flow might be changed, thereby regulating the wind speed in the courtyard and the interior.

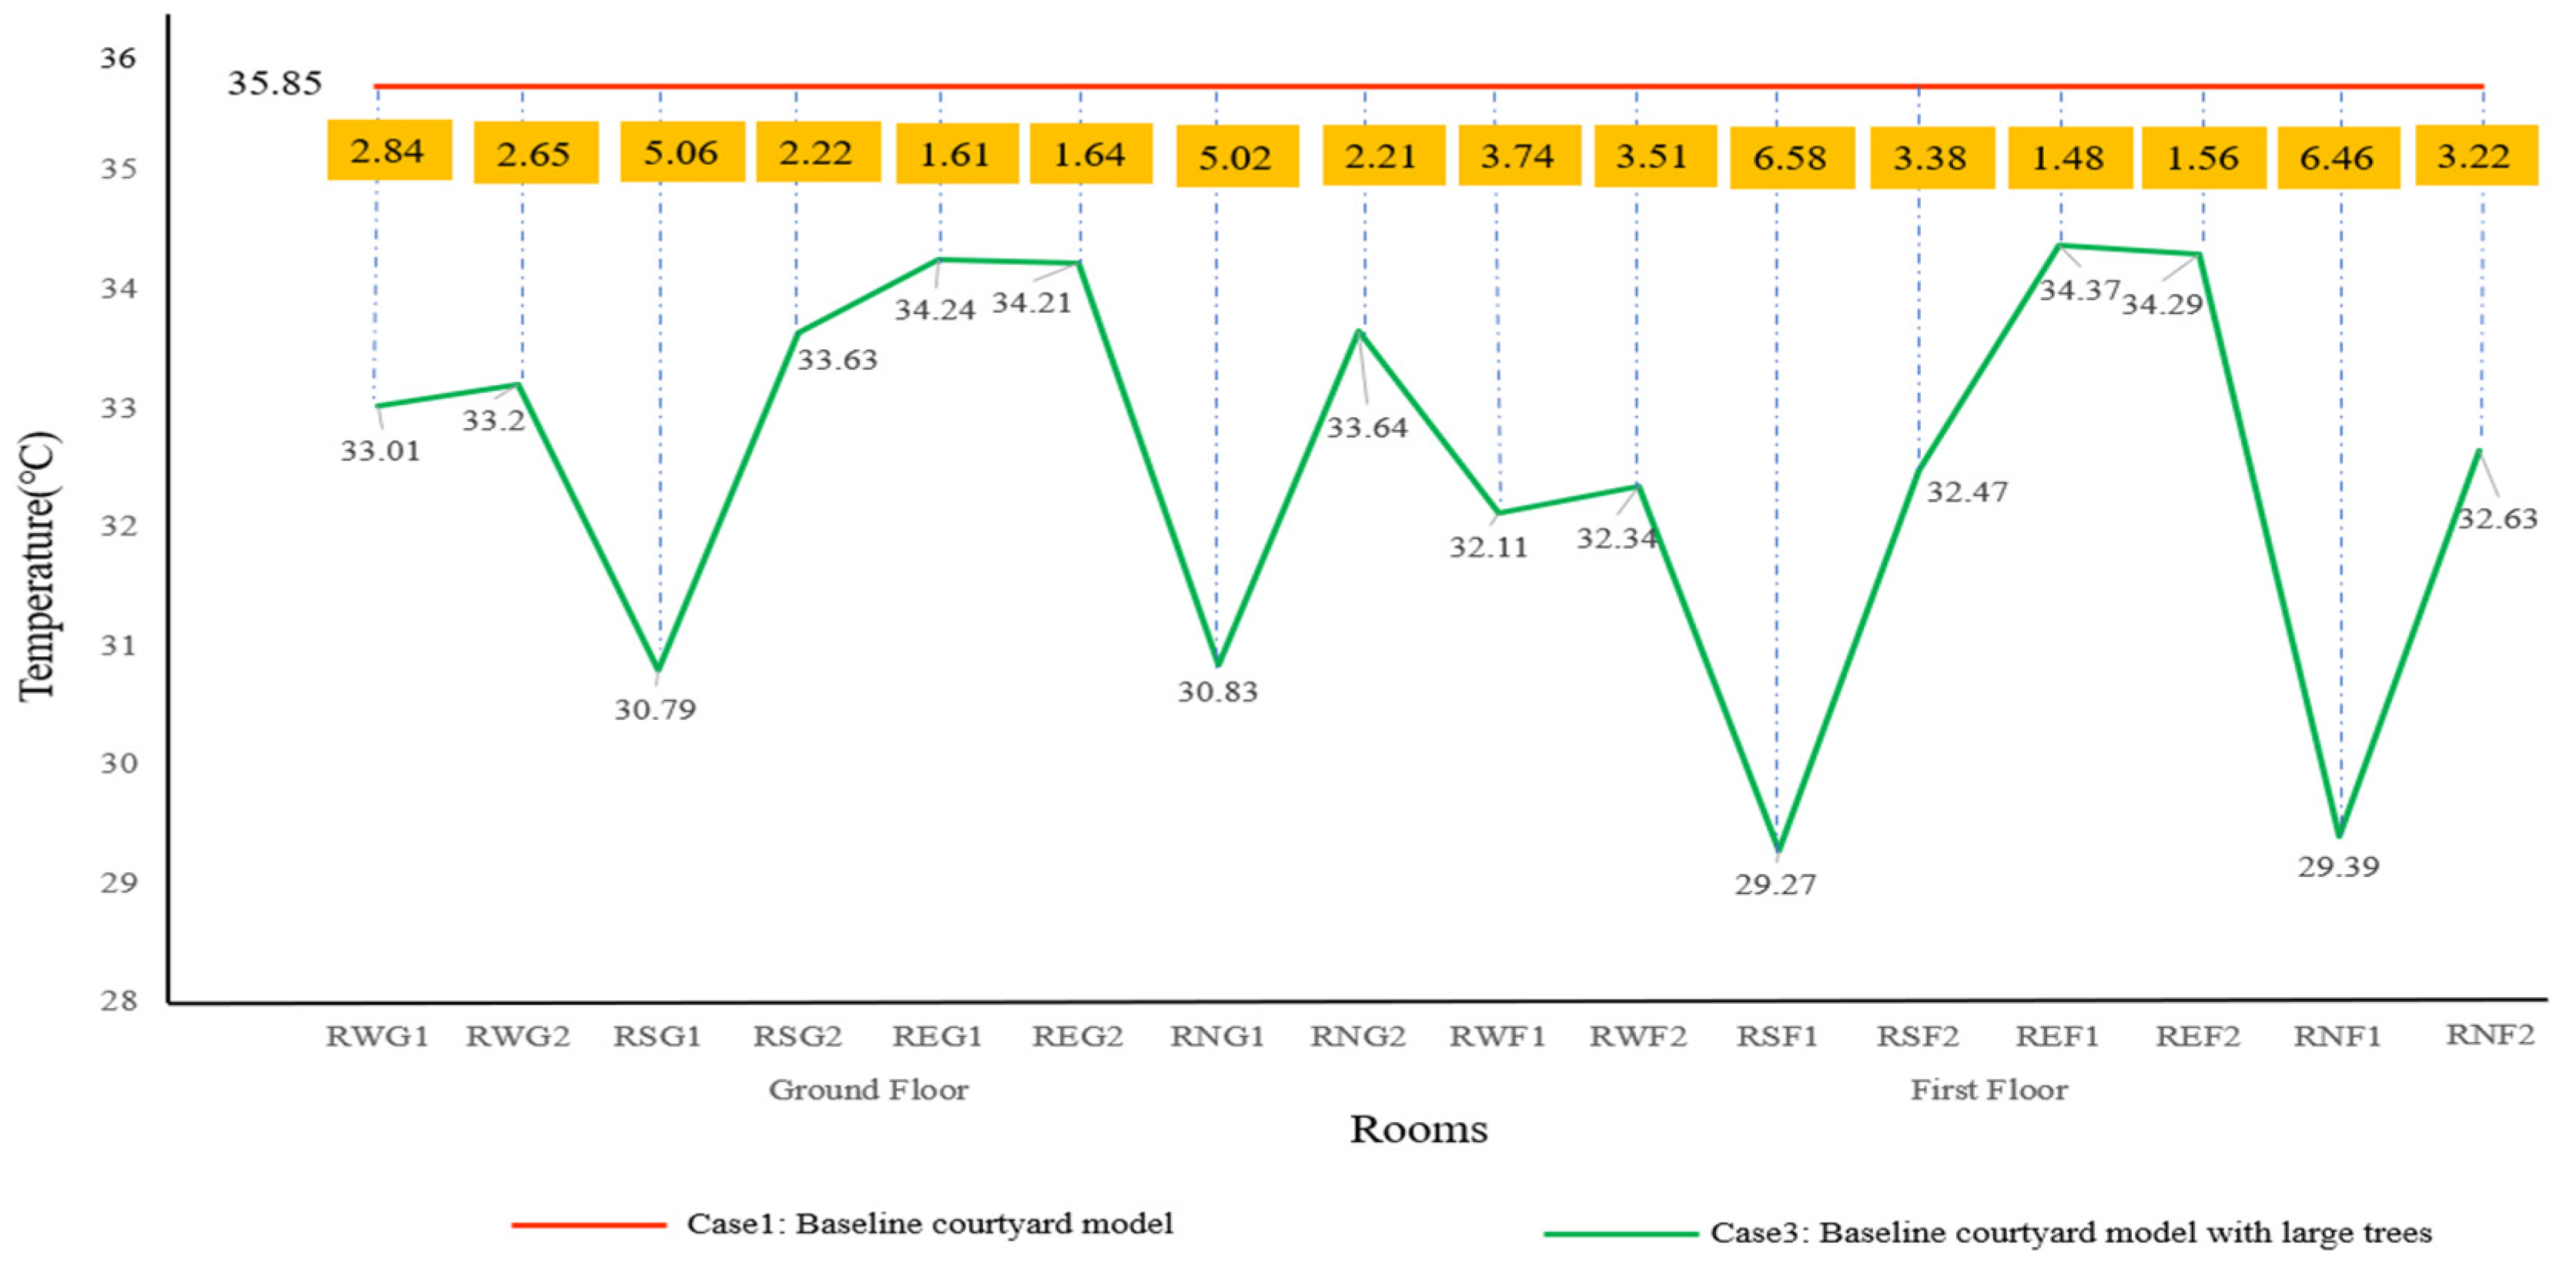
3.2.3. Case 3: Baseline Courtyard Model with Four Large Trees

To investigate the effect of different sizes of vegetation in the courtyard on the indoor thermal and wind environment, four trees with a height of 1.5 m were placed in Case 2. In this section, the height of the original vegetation was regulated, and the height of each tree increased to 2 m. The simulation results were employed to determine the effect of large trees on indoor air temperature and natural ventilation.
Figure 23 illustrates the average air temperature in 16 separate rooms with four large trees within the courtyard. A large temperature range could be found between different rooms on the identical floor and a slight temperature difference between two rooms on the identical vertical line. RNG1 and RSG1 were the two rooms with the lowest temperatures on the ground floor, which achieved the indoor air temperatures at 30.83 °C and 30.79 °C, respectively. Adjacent to the aforementioned two rooms, the air temperatures in RNG2 and RSG2 reached over 33 °C. However, the warmest rooms were REG1 (34.24 °C) and REG2 (34.21 °C) on the east side, with a maximum indoor temperature difference of 3.45 °C in the eight rooms tested on the ground floor. Compared with the average room temperature (32.94 °C) on the ground floor, the temperature in the first-floor room was reduced to 32.11 °C. Consistent with the indoor thermal conditions on the ground floor, RNF1 and RSF1 were the two rooms on the first floor with the lowest temperatures at 29.27 °C and 29.39 °C, respectively, while REF1 and REF2 were the rooms with the highest temperatures. According to the simulation results, among the 16 examined rooms in Case 3, the largest temperature differences were identified in REF1 and RSF1 on the first floor, with a difference of 5.1 °C. The temperature difference between two rooms on different floors located in the identical vertical direction was smaller, and the indoor temperature on the first floor would be lower than that on the ground floor, except for REF1 and REF2 where the room temperatures were 0.13 °C and 0.08 °C higher than those of REG1 and REG2, respectively. Simulated results of the air temperature contour with isotherm in each room for the baseline courtyard model with four large trees are shown in Figure 24.
Figure 25 presents a comparative result of the temperature in each room of Case 1 and Case 3, which indicates the effect of the large trees in the courtyard on the indoor thermal environment and the difference in thermal conditions of the rooms in different locations. In the baseline model, the temperature was kept constant. Thus, in Case 1, the air temperature in each room was 35.85 °C. The temperature in each room decreased, which proved that the placement of large trees in the courtyard helped improve the indoor thermal environment. On the ground floor, the average indoor temperature decreased by 2.91 °C, and RSG1 and RNG1 were the two rooms with a temperature reduction of more than 5 °C. The minimum temperature reduction was in the two rooms located at the east side, in which the temperature only dropped by 4.49% in REG1 and 4.57% in REG2, while the rest of the rooms underwent a 2 °C to 3 °C temperature decrease. On the first floor, the most significant temperature decrease was identified in RSF1 that experienced a 6.58 °C reduction; RNF1 ranked behind RSF1, which was located on the north side, with a drop of 6.46 °C. On the whole, the best cooling performance was achieved in the four rooms located on the north and south sides near the inlet, and the worst cooling effect was achieved in the four rooms on the east side.
In Figure 26, the average temperature in each room from Case 2 and Case 3 is presented to compare the improvement of the indoor thermal environment with different sizes of vegetation in the courtyard. As indicated from the comparative results, the average indoor temperature in Case 3 was generally lower than in Case 2, with only two rooms (RSG2 and RNF2) slightly higher than those in Case 2. The largest temperature drop was in RWF1 with a drop of 1.28 °C, the smallest drop was only 0.3 °C in RWG2 and REF1, and the largest temperature difference was found in RSF1, reaching 1.25 °C.
Figure 27 presents the average wind speed magnitude simulation results in each room for the courtyard model with four large trees. As indicated from the figure, on the ground floor, the room with the highest indoor wind speed was RSG2, located in the south, with a wind speed of 0.0132 m/s, the lowest indoor airspeed was in RWG1, which was located on the west side with only 0.0059 m/s. It can be observed that the magnitudes of the indoor airspeeds in the two rooms located in opposite positions were very close to each other. For instance, RNG2 and RSG2 were two rooms located on the north and south sides of the room. They were in the opposite positions, with indoor airspeeds above 0.01 m/s in both rooms, and the airspeed magnitude was relatively close. On the first floor, the highest indoor wind speeds were found in the two eastern side rooms (REF1 and REF2) measured as 0.0256 m/s and 0.0263 m/s, respectively. The two rooms on the west side had the lowest wind speed, both less than 0.008 m/s. As suggested from the comparison of the simulation results, on the first floor, the indoor airspeed in the two rooms on the same side was closer. Contours of the wind speed in each room for the baseline courtyard model with four small trees are shown in Figure 28.
Figure 29 draws a comparison of the indoor airspeeds in each room for the three different scenarios. As indicated from the simulation results, the arrangement of different sizes of vegetation in the courtyard impacted the indoor ventilation of rooms with different orientations. By comparing the results of Case 1 and Case 3, the change in indoor wind speed produced by planting large trees in the courtyard could be observed. On the ground floor, four large trees in the courtyard increased the indoor wind speed in a total of five rooms, i.e., four rooms on the north and west sides and RSG2 on the south side. The largest increase was achieved in RSG2 where the wind speed increased by 0.0047 m/s, and in the rest three rooms, the wind speed declined, with the most significant decline in REG2 (a decrease of 0.0063 m/s). On the first floor, only three rooms showed an increase in wind speed (i.e., RWF1, RSF2 and RNF2), marking an increase of 0.0025 m/s, 00077 m/s and 0.0084 m/s, respectively. The other five rooms underwent varying reductions in wind speed magnitude, with the largest drop happening in REF1 at 0.0191 m/s.
By comparing the effect of planting small and large trees in the courtyard on the indoor wind environment, the indoor wind speed magnitude was suggested to increase in 10 of the 16 individual rooms on the two floors due to the existence of large trees, with the most significant increase of 0.007 m/s in RSF2 located in the south side of the first floor. However, the wind speed in the remaining six rooms decreased, with the highest reduction observed in REG1 (0.0093 m/s).
As revealed from the comparison of the wind environment of each room in different scenarios, the indoor wind speed conditions were different in each room. There was no guarantee that planting vegetation in a courtyard would improve the indoor wind environment in surrounding buildings, and it was also not indicated that the larger size of the vegetation installed in the courtyard would improve the indoor wind environment. For instance, on the ground floor, Case 2 exhibited the highest average indoor wind speed (0.00854 m/s) for the eight rooms as compared with the other two cases. Furthermore, the highest average indoor wind speed on the first floor was reported in Case 1 (0.0183 m/s).

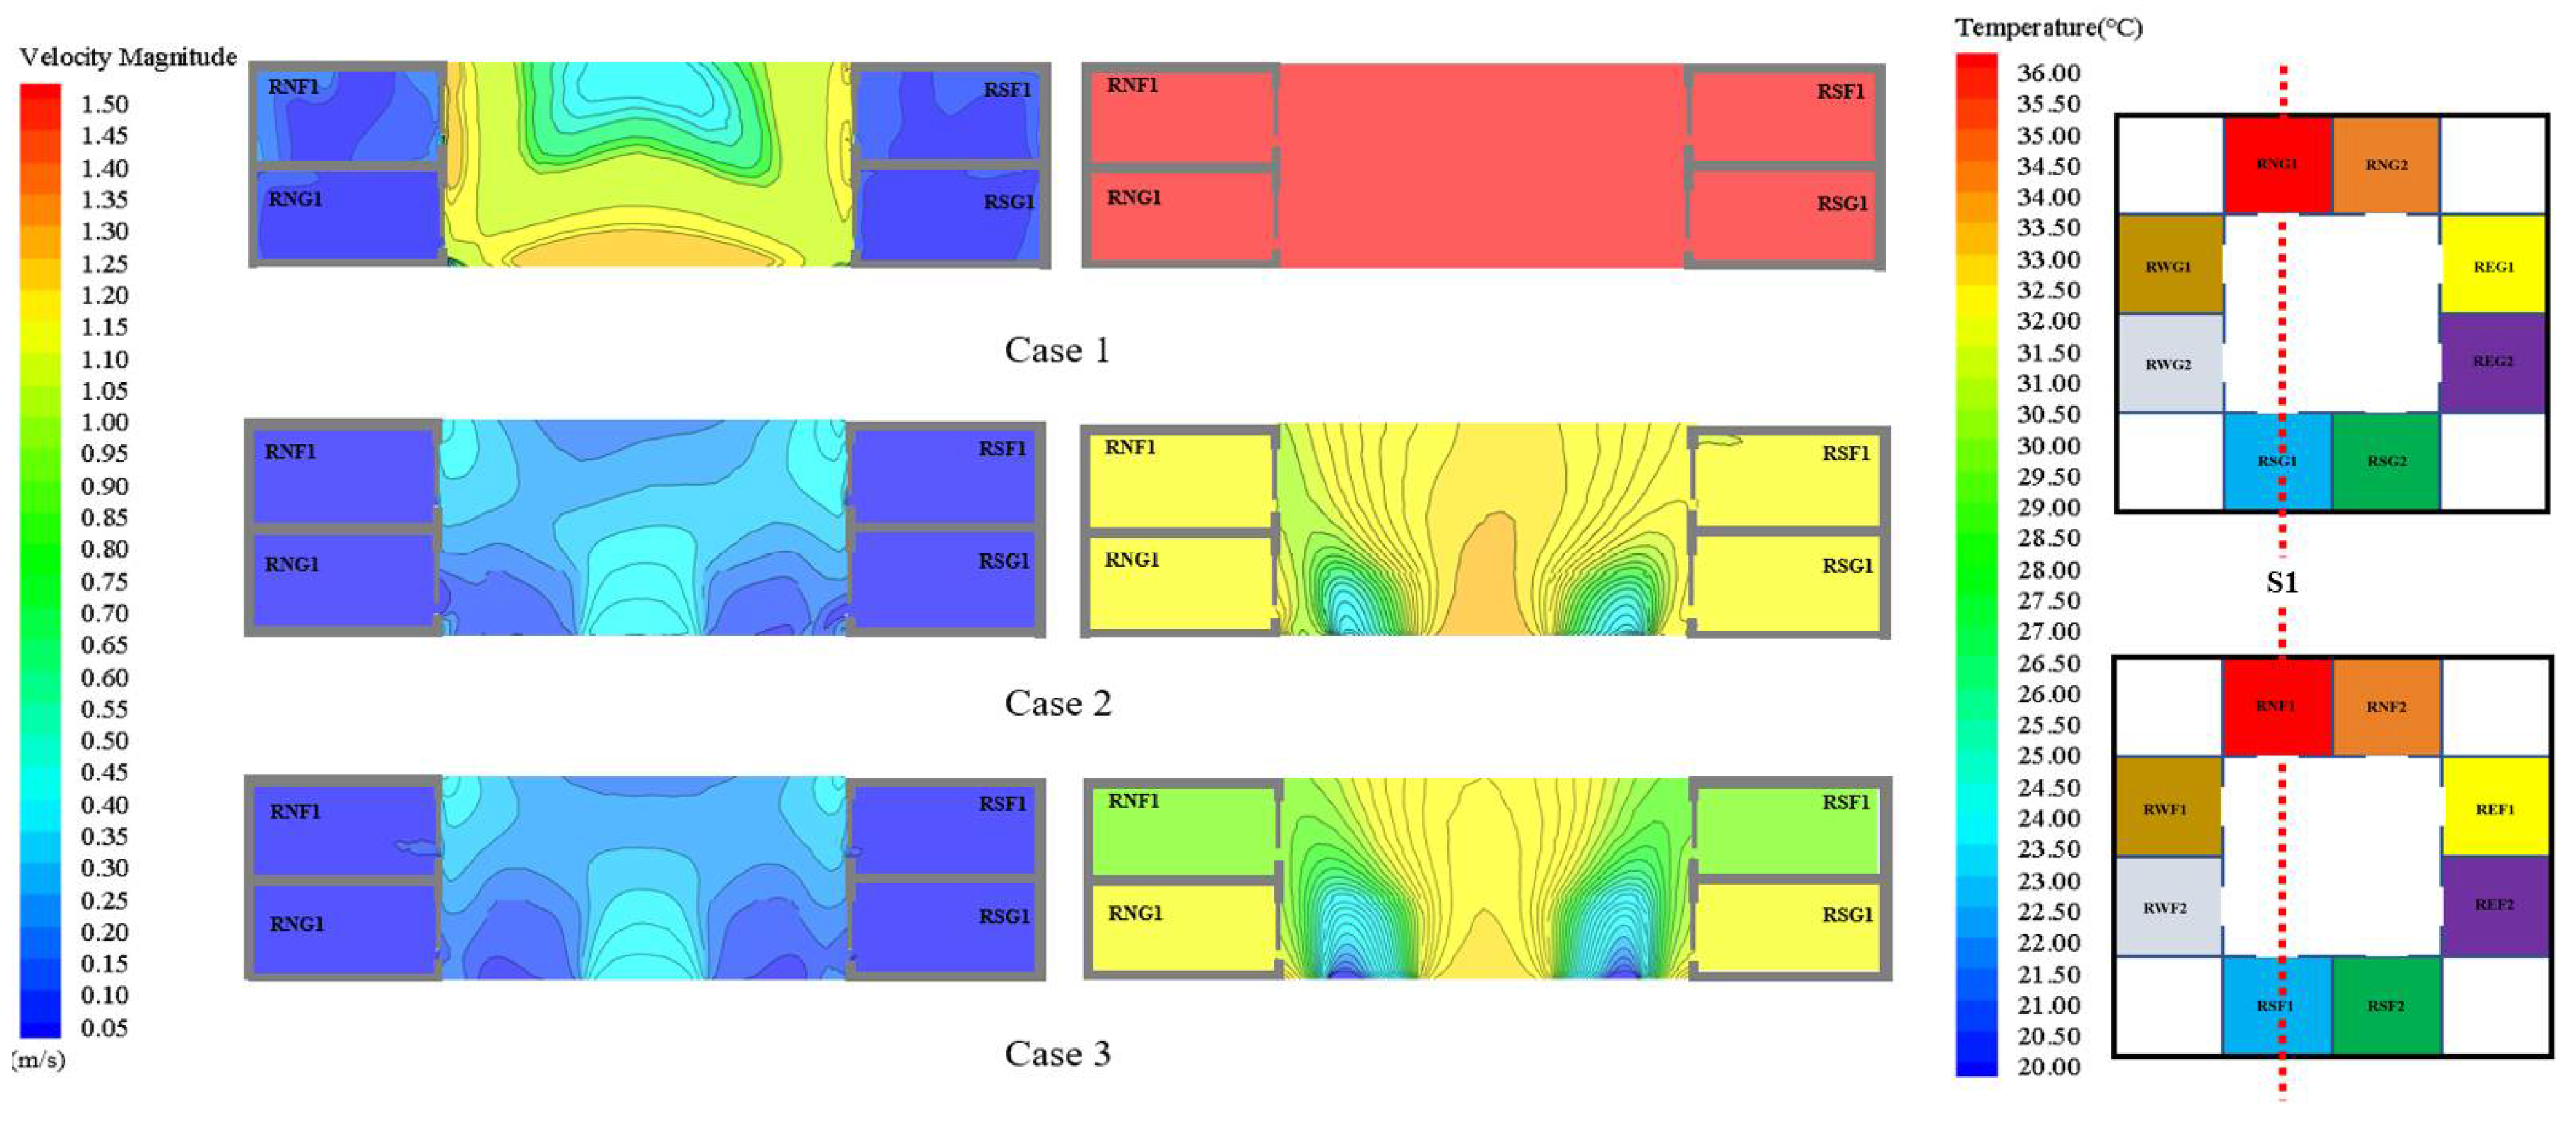
3.3. Indoor Thermal Comfort Analysis

The CBE Thermal Comfort Tool for ASHRAE-55 [31,32] was used to compare the thermal comfort of courtyard buildings after the installation of vegetation in the courtyard. The Predicted Mean Vote (PMV) and Predicted Percentage of Dissatisfied (PPD) for all the 16 rooms are shown in Table 4. The CBE Thermal Comfort Tool was used for calculations with humidity, metabolic rate and clothing level constant at 75% [33], 1 met (seated and quiet), and 0.5 clo (typical summer indoor), respectively.
For Case 1 (the baseline courtyard model without vegetation) as the indoor temperature is set at 35.85 °C and the indoor air velocity in each room is less than 0.1 m/s, the PMV and PPD value in each room remains constant at 4.10 and 100% respectively. After adding different heights of vegetation, the indoor temperature in each room changed dramatically, however, as the indoor air velocity was still less than 0.1 m/s, the indoor wind speed had minimal change on the PMV and PPD value. The indoor room temperatures were reduced after adding the vegetation, and in some rooms the reduction was significant. Nevertheless it still did not meet the human comfort criteria, due to the fact that the conditions were set in a tropical area and none of the rooms were equipped with cooling devices such as air conditioner, which is useful in improving PMV and PPD. However, the results in Table 3 shows that adding vegetation inside the courtyard improves the thermal comfort of the indoor areas, but not sufficiently after comparing the PMV and PPD values for each room in Case 2 and Case 3; different heights of vegetation in the courtyard have various impacts on thermal comfort index, with the higher height of vegetation being more effective in improving indoor thermal comfort.

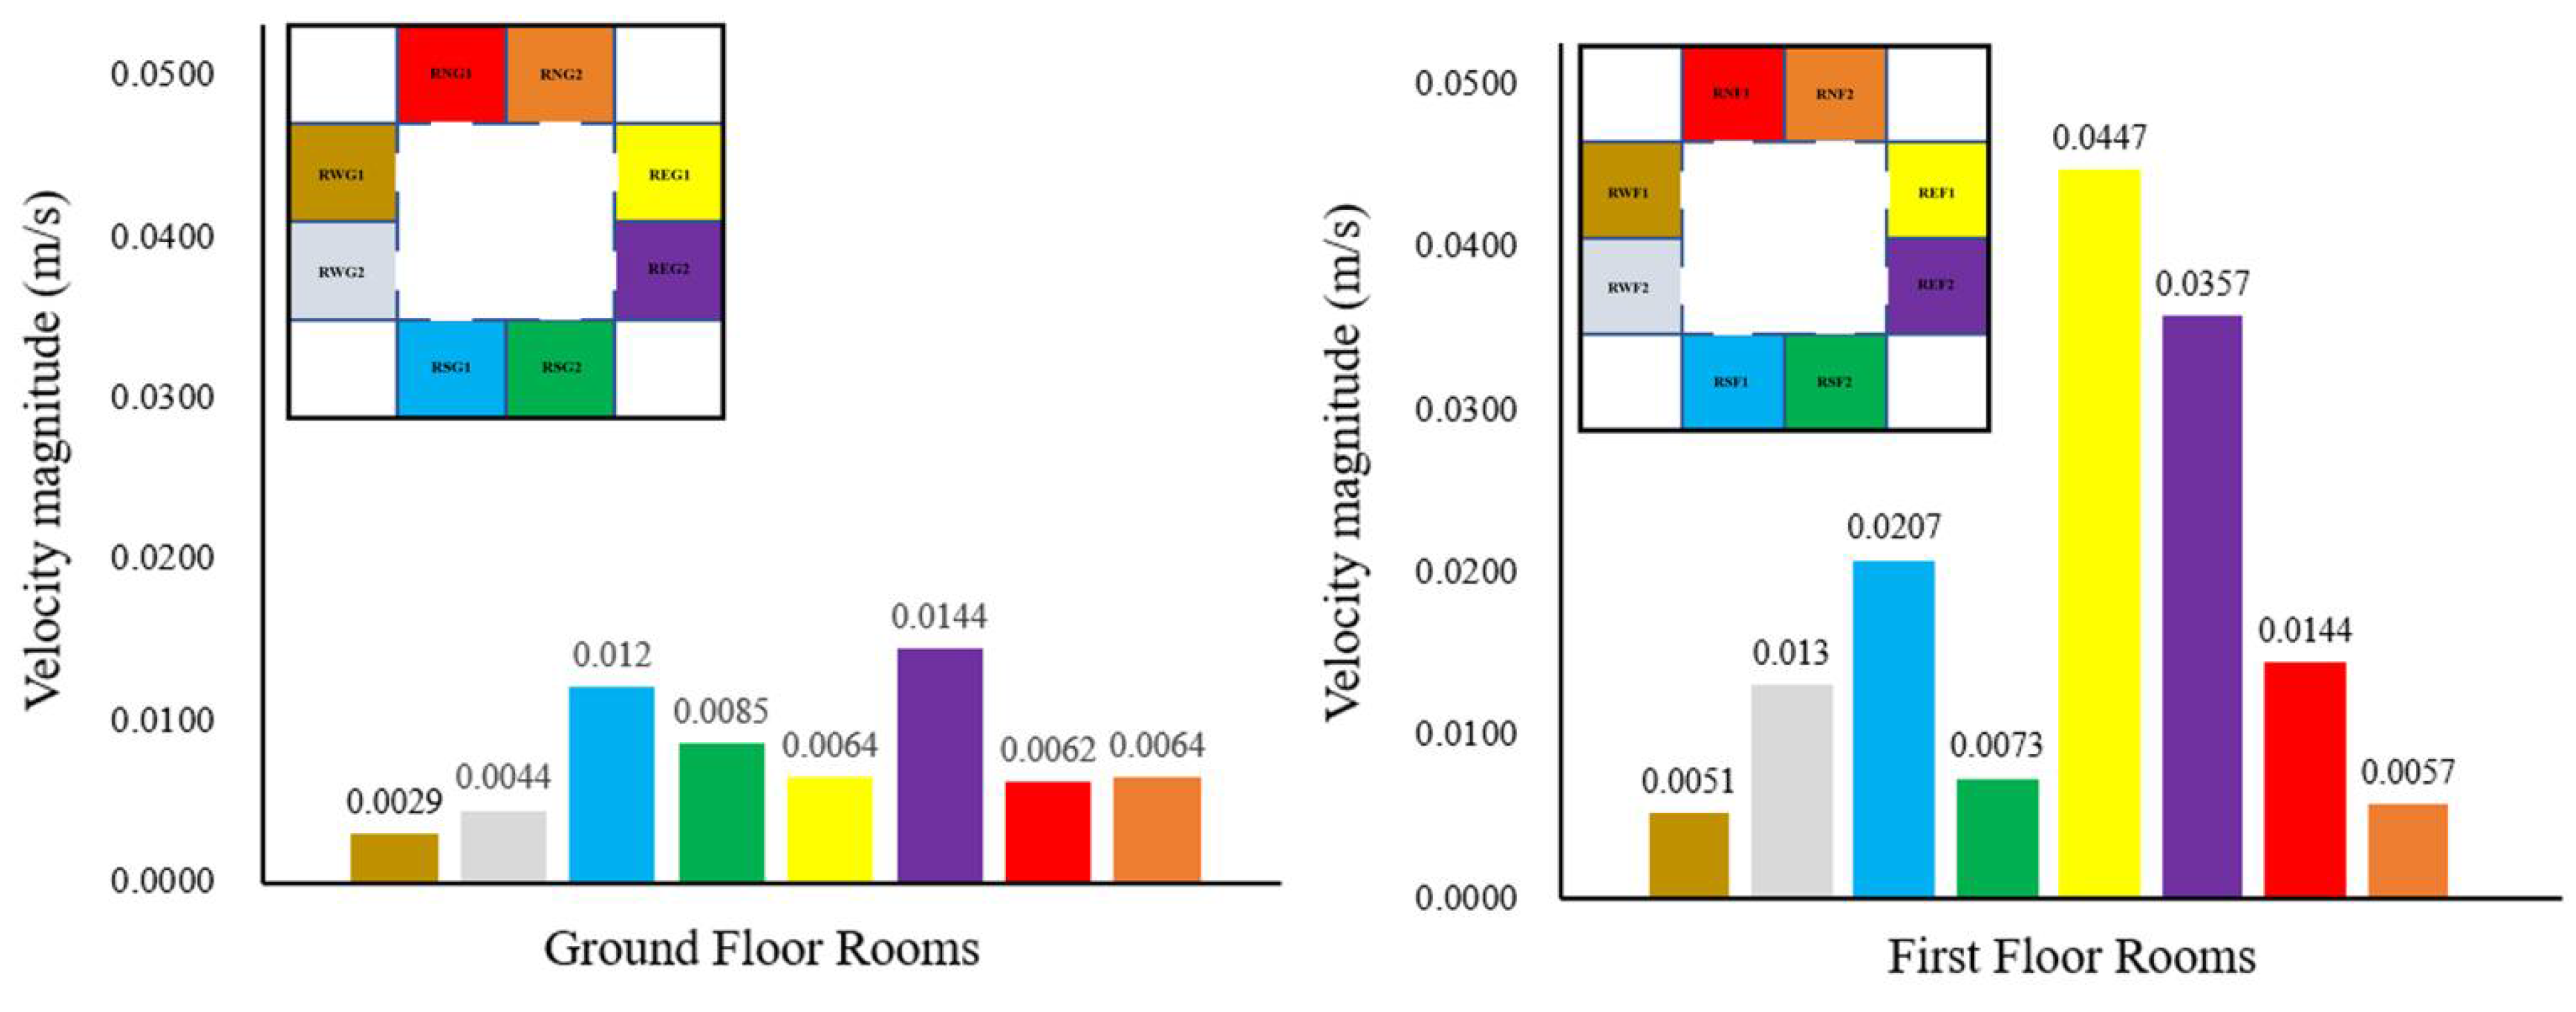
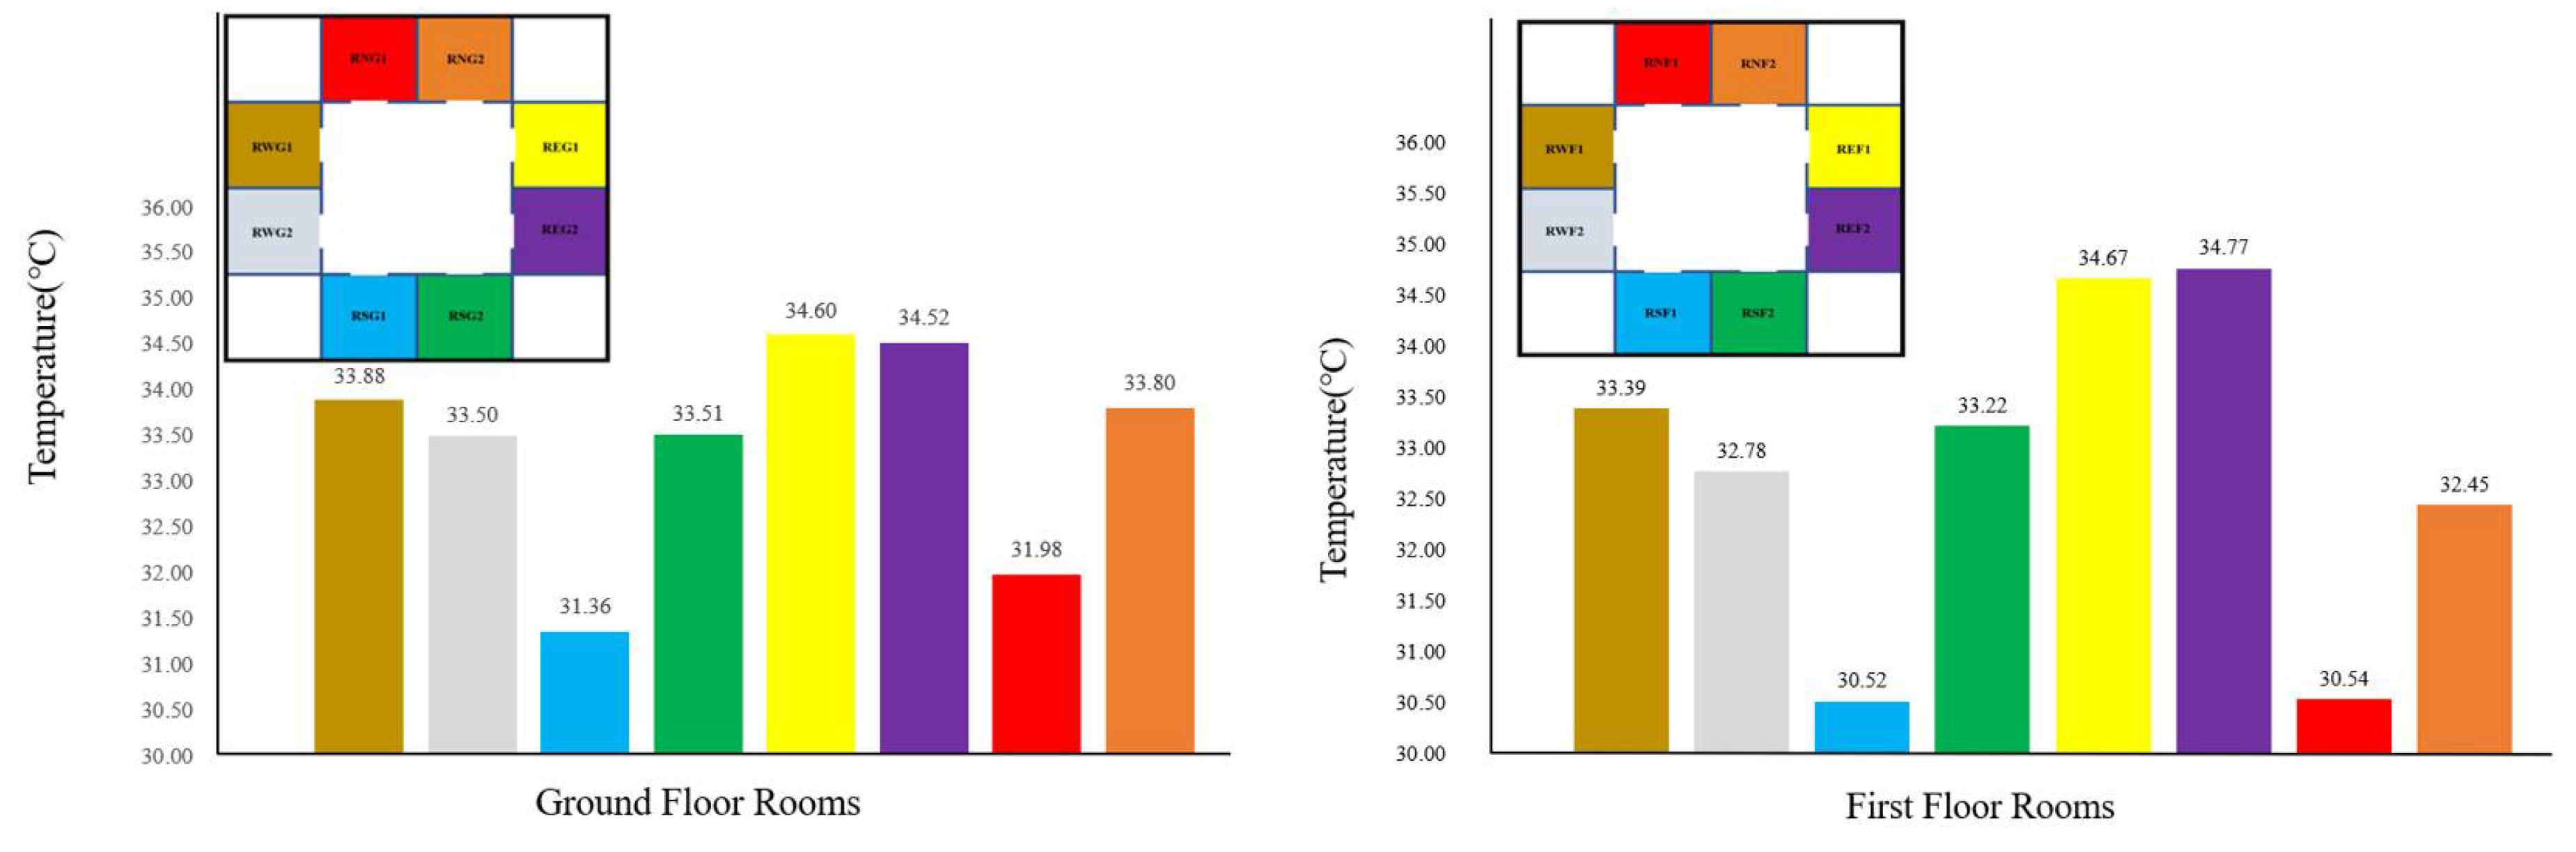
3.4. Ventilation and Temperature Conditions Inside the Courtyard

One slice (S1: X = 7500 mm) was selected to study the ventilation and temperature conditions within the courtyard impacted by different sizes of trees.
Figure 30 shows the wind speed and temperature conditions for three different cases at S1. For the courtyard in Case 1, no passive cooling technology was installed in such a courtyard, so the airflow in the courtyard was relatively constant. Moreover, the wind velocity decreased from top to bottom, and it was nearly 0.3 m/s in the parts close to the building, thereby accounting for the low air velocity in the indoor areas. However, the wind environment within the courtyard changed with the addition of different sizes of vegetation, with a reduction in wind speed around the vegetation, which was primarily attributed to the sheltering effect of the vegetation on the wind. The height of the small trees in Case 2 was 1.5 m, and the height of the large trees in Case 3 reached 2 m, which indicated that the height of the vegetation could impact the overall wind environment of the courtyard. It was found that the air temperature around the trees dropped significantly, the temperature at the bottom of the 1.5 m small trees in Case 2 reached approximately 27.5 °C, and the temperature at the bottom of the 2 m large trees in Case 3 was only 26 °C. Moreover, larger the vegetation, the more pronounced the effect of transpiration on the surrounding environment. Furthermore, the temperatures in the center of the courtyard were inconsistent with Case 2 and Case 3, at 34 °C and 33.5 °C, respectively, which also proved that different sizes of vegetation could exert different cooling effects on the interior of the courtyard.

4. Conclusions and Future Works

In this study, an investigation was conducted on the impact of incorporating vegetation in a closed courtyard on the surrounding buildings’ indoor wind and thermal environment. In the present work, four equally spaced trees with the height of 1.5 m and 2 m were set up in the model of the courtyard with the surrounding building using the CFD tool ANSYS Fluent 18.1. Based on the evaluated conditions, the results have shown that the addition of vegetation in the courtyard significantly influenced the wind and thermal environment of the indoor courtyard building. It indicated that installing suitable passive cooling strategies in courtyards can affect the distribution of flow and be effective in improving indoor thermal comfort.
For the wind environment inside the courtyard building, the comparison of the results of the three different cases indicated that the wind speed inside each room was significantly low due to the low wind speeds in the courtyard and small window openings that affected the natural ventilation into the rooms. The addition of vegetation changed the overall direction of airflow in the courtyard, and the vegetation decreases the temperature in the courtyard, which affected the flow distribution. Both in the baseline courtyard model and the courtyard model with small or large trees, the room with the highest indoor wind speed was found on the east side of the first floor. The size of vegetation in the courtyard also influence different indoor wind flow patterns. Future works should focus on developing solutions that can enhance the flow in the courtyard and indoor space. This could include the use of guide vanes and shading devices to redirect the flow into the spaces. Changing the size of vegetation in the courtyard affected the wind speed in different rooms, with some rooms experiencing an increased or decreased wind speed.
Additionally, the addition of vegetation led to a reduction in indoor air temperature, which improved the thermal comfort in different rooms, in particular the first floor, while the simulation results showed that larger trees were more effective in improving indoor thermal comfort. However, for the rooms in Case 2 and Case 3, it was observed that the rooms on the east side of the first floor had the highest indoor air temperatures. The rooms which had the most significant reduction in temperature were RSF1 and RNF1 which were located on the north and south sides close to the inlet, in Case 2, the room temperatures dropped by 5.33 °C and 5.31 °C in RSF1 and RNF1 respectively, and by 6.58 °C and 6.46 °C in Case 3 in each room. As a result of the temperature decrease in each room, the thermal comfort level has been improved.
Subsequent research should continuously seek different passive cooling techniques to optimize the indoor wind and thermal environment of courtyard buildings. In addition, it could also be conducted to determine the effectiveness of courtyards with vegetation or other passive cooling strategies in some specific climate situations. Besides, the influence of heat exchange from solar radiation on courtyards, vegetation and indoor thermal comfort will be investigated.

Author Contributions

Data curation, H.S., C.J.-B.; Formal analysis, J.K.C. and C.J.-B.; Investigation, H.S. and C.J.-B.; Methodology, H.S., M.M., F.Z., C.J.-B. and J.K.C.; Project administration, C.J.-B. and J.K.C.; Software, H.S., M.M. and F.Z.; Supervision, C.J.-B. and J.K.C.; Validation, H.S., M.M., F.Z.; Visualization, H.S., M.M., F.Z.; Writing—original draft, H.S., M.M., F.Z., J.K.C. and C.J.-B. All authors have read and agreed to the published version of the manuscript.

Funding

This research received no external funding.

Acknowledgments

The authors would like to thank the Department of Architecture and Built Environment of the University of Nottingham for providing the facility for carrying out the modelling and simulations.

Conflicts of Interest

The authors declare no conflict of interest.

References

  1. Cao, X.; Dai, X.; Liu, J. Building energy-consumption status worldwide and the state-of-the-art technologies for zero-energy buildings during the past decade. Energy Build. 2016, 128, 198–213. [Google Scholar] [CrossRef]
  2. Yu, C.-R.; Guo, H.-S.; Wang, Q.-C.; Chang, R.-D. Revealing the impacts of passive cooling techniques on building energy performance: A residential case in Hong Kong. Appl. Sci. 2020, 10, 4188. [Google Scholar] [CrossRef]
  3. Bagasi, A.A.; Calautit, J.K.; Karban, A.S. Evaluation of the Integration of the traditional architectural element Mashrabiya into the ventilation strategy for buildings in hot climates. Energies 2021, 14, 530. [Google Scholar] [CrossRef]
  4. Nejat, P.; Jomehzadeh, F.; Hussen, H.M.; Calautit, J.K.; Abd Majid, M.Z. Application of wind as a renewable energy source for passive cooling through windcatchers integrated with wing walls. Energies 2018, 11, 2536. [Google Scholar] [CrossRef] [Green Version]
  5. Cantón, M.A.; Ganem, C.; Barea, G.; Llano, J.F. Courtyards as a passive strategy in semi dry areas. Assessment of summer energy and thermal conditions in a refurbished school building. Renew. Energy 2014, 69, 437–446. [Google Scholar] [CrossRef]
  6. Taleghani, M.; Kleerekoper, L.; Tenpierik, M.; van den Dobbelsteen, A. Outdoor thermal comfort within five different urban forms in The Netherlands. Build. Environ. 2015, 83, 65–78. [Google Scholar] [CrossRef]
  7. Rojas, J.M.; Galán-Marín, C.; Fernández-Nieto, E.D. Parametric study of thermodynamics in the Mediterranean courtyard as a tool for the design of eco-efficient buildings. Energies 2012, 5, 2381–2403. [Google Scholar] [CrossRef] [Green Version]
  8. Nagai, H.; Okumiya, M. A ventilated courtyard as a passive cooling strategy in the warm humid tropics. Renew. Energy 2003, 28, 1755–1778. [Google Scholar] [CrossRef]
  9. Ernest, R.; Ford, B. The role of multiple-courtyards in the promotion of convective cooling. Archit. Sci. Rev. 2012, 55, 241–249. [Google Scholar] [CrossRef] [Green Version]
  10. Muhaisen, A.S.; Gadi, M.B. Effect of courtyard proportions on solar heat gain and energy requirement in the temperate climate of Rome. Build. Environ. 2006, 41, 245–253. [Google Scholar] [CrossRef]
  11. Zamani, Z.; Heidari, S.; Hanachi, P. Reviewing the thermal and microclimatic function of courtyards. Renew. Sustain. Energy Rev. 2018, 93, 580–595. [Google Scholar] [CrossRef]
  12. Taleghani, M.; Tenpierik, M.; van den Dobbelsteen, A. Environmental impact of courtyards—A review and comparison of residential courtyard buildings in different climates. J. Green Build. 2012, 7, 113–136. [Google Scholar] [CrossRef]
  13. Yakubu, P.W.; Alibaba, H.Z. Performance of Courtyard Systems of Housing in Hot and Humid Climate (Bauchi, Nigeria). Int. J. Civ. Struct. Eng. Res. 2018, 6, 13. [Google Scholar]
  14. Al-Masri, N.; Abu-Hijleh, B. Courtyard housing in midrise buildings: An environmental assessment in hot-arid climate. Renew. Sustain. Energy Rev. 2012, 16, 1892–1898. [Google Scholar] [CrossRef]
  15. Soflaei, F.; Shokouhian, M.; Mofidi Shemirani, S.M. Investigation of Iranian traditional courtyard as passive cooling strategy (a field study on BS climate). Int. J. Sustain. Built Environ. 2016, 5, 99–113. [Google Scholar] [CrossRef] [Green Version]
  16. Zango, M.S.; Ossen, D.R.; Toe, D.H.C.; Nimlyat, P.S.; Luke, B.J. The effect of vegetation in enhancing the performance of courtyard in buildings of tropical climate. J. Appl. Sci. 2017, 3, 34–42. [Google Scholar]
  17. Malys, L.; Musy, M.; Inard, C. Direct and indirect impacts of vegetation on building comfort: A comparative study of lawns, green walls and green roofs. Energies 2016, 9, 32. [Google Scholar] [CrossRef]
  18. Salata, F.; Golasi, I.; de Lieto Vollaro, A.; de Lieto Vollaro, R. How high Albedo and traditional buildings’ materials and vegetation affect the quality of urban microclimate. A case study. Energy Build. 2015, 99, 32–49. [Google Scholar] [CrossRef]
  19. Shashua-Bar, L.; Pearlmutter, D.; Erell, E. The cooling efficiency of urban landscape strategies in a hot dry climate. Landsc. Urban Plan. 2009, 92, 179–186. [Google Scholar] [CrossRef]
  20. Mohammadi, M.; Tien, P.W.; Kaiser Calautit, J. Influence of wind buffers on the aero-thermal performance of skygardens. Fluids 2020, 5, 160. [Google Scholar] [CrossRef]
  21. Sadafi, N.; Salleh, E.; Haw, L.C.; Jaafar, Z. Evaluating thermal effects of internal courtyard in a tropical terrace house by computational simulation. Energy Build. 2011, 43, 887–893. [Google Scholar] [CrossRef]
  22. Guedouh, M.S.; Zemmouri, N. Courtyard building’s morphology impact on thermal and luminous environments in hot and arid region. Energy Procedia 2017, 119, 153–162. [Google Scholar] [CrossRef]
  23. Rahman, M.A.; Smith, J.G.; Stringer, P.; Ennos, A.R. Effect of rooting conditions on the growth and cooling ability of Pyrus Calleryana. Urban For. Urban Green. 2011, 10, 185–192. [Google Scholar] [CrossRef]
  24. Gromke, C.; Ruck, B. Pollutant concentrations in street canyons of different aspect ratio with avenues of trees for various wind directions. Bound. Layer Meteorol. 2012, 144, 41–64. [Google Scholar] [CrossRef] [Green Version]
  25. Bitog, J.P.; Lee, I.-B.; Hwang, H.-S.; Shin, M.-H.; Hong, S.-W.; Seo, I.-H.; Mostafa, E.; Pang, Z. A wind tunnel study on aerodynamic porosity and windbreak drag. For. Sci. Technol. 2011, 7, 8–16. [Google Scholar] [CrossRef]
  26. ANSYS, Inc. Fluent User’s Guide 18.1; ANSYS, Inc.: Canonsburg, PA, USA, 2017. [Google Scholar]
  27. Hall, D.J.; Walker, S.; Spanton, A.M. Dispersion from courtyards and other enclosed spaces. Atmos. Environ. 1999, 33, 1187–1203. [Google Scholar] [CrossRef]
  28. Manickathan, L.; Defraeye, T.; Allegrini, J.; Derome, D.; Carmeliet, J. Parametric study of the influence of environmental factors and tree properties on the transportive cooling effect of trees. Agric. For. Meteorol. 2018, 248, 259–274. [Google Scholar] [CrossRef] [Green Version]
  29. Mohammadi, M.; Calautit, J.K. Numerical investigation of the wind and thermal conditions in sky gardens in high-rise buildings. Energies 2019, 12, 1380. [Google Scholar] [CrossRef] [Green Version]
  30. Richards, P.J.; Norris, S.E. Appropriate boundary conditions for a pressure driven boundary layer. J. Wind. Eng. Ind. Aerodyn. 2015, 142, 43–52. [Google Scholar] [CrossRef]
  31. Tartarini, F.; Schiavon, S.; Cheung, T.; Hoyt, T. CBE Thermal Comfort Tool: Online Tool for Thermal Comfort Calculations and Visualizations. SoftwareX 2020, 12, 100563. [Google Scholar] [CrossRef]
  32. Tien, P.W.; Calautit, J.K. Numerical analysis of the wind and thermal comfort in courtyards “Skycourts” in high rise buildings. J. Build. Eng. 2019, 24, 100735. [Google Scholar] [CrossRef]
  33. Weather and Climate in China, The Average Humidity in Nanjing, Jiangsu, China. Available online: https://Weather-and-Climate.Com/Average-Monthly-Humidity-Perc,Nanjing,China/ (accessed on 29 July 2021).
Figure 1. The courtyard model with natural ventilation and vegetation.
Energies 14 05388 g001
Figure 2. Courtyard model and dimensions.
Energies 14 05388 g002
Figure 3. The layout of the rooms on each floor (R—Room, N—North, W—West, S—South, E—East, G—Ground floor, F—First floor).
Energies 14 05388 g003
Figure 4. The dimension of each room, naturally ventilated by a window facing the courtyard.
Energies 14 05388 g004
Figure 5. The dimension of each window and the opening area.
Energies 14 05388 g005
Figure 6. The dimension of the domain and the direction of the wind.
Energies 14 05388 g006
Figure 7. The dimension of the vegetation inside the courtyard model.
Energies 14 05388 g007
Figure 8. Meshed surfaces of the courtyard and its surrounding microclimate.
Energies 14 05388 g008
Figure 9. Simulated results of temperature along a horizontal center line of the courtyard model with small trees at the height of 0.7 m for the grid sensitivity analysis.
Energies 14 05388 g009
Figure 10. (a) Simulation domain of the validation model. (b) The dimension of the validation model.
Energies 14 05388 g010
Figure 11. Comparison of dimensionless wind velocity along the analysis line (H: height above the ground, Hmax: reference height for the wind velocity, U: wind velocity, Uref: wind velocity at the height of Hmax [27]).
Energies 14 05388 g011
Figure 12. Simulation field of the validation model, based on the porous vegetation according to the indication of the green square and centred on the x-axis. (Reprinted with permission from [29]. Copyright 2019 Mohammadi Murtaza and John Kaiser Calautit.).
Energies 14 05388 g012
Figure 13. Contours of velocity and temperature near the vegetation (black square) based on the validation model. (Reprinted with permission from [29]. Copyright 2019 Mohammadi Murtaza and John Kaiser Calautit.).
Energies 14 05388 g013
Figure 14. Comparison of wind speed on the analysis line, in addition to the vegetation zone under the indication of the green patch in the range of −0.5 to 0.5 on the x-axis. (Reprinted with permission from [29]. Copyright 2019 Mohammadi Murtaza and John Kaiser Calautit.).
Energies 14 05388 g014
Figure 15. Average wind speed magnitude (m/s) in each room for the baseline courtyard model.
Energies 14 05388 g015
Figure 16. Contours of the wind speed in each room for the baseline courtyard model.
Energies 14 05388 g016
Figure 17. Average air temperature (°C) in each room for the baseline courtyard model with four small trees.
Energies 14 05388 g017
Figure 18. Simulated results of the air temperature contour with isotherm in each room for the baseline courtyard model with four small trees.
Energies 14 05388 g018
Figure 19. Comparison of air temperature for Case 1 and Case 2 in each room.
Energies 14 05388 g019
Figure 20. Average wind speed magnitude (m/s) in each room for the baseline courtyard model with four small trees.
Energies 14 05388 g020
Figure 21. Contours of the wind speed in each room for the baseline courtyard model with four small trees.
Energies 14 05388 g021
Figure 22. Comparison of wind speed magnitude for Case 1 and Case 2 in each room.
Energies 14 05388 g022
Figure 23. Average air temperature (°C) in each room for the baseline courtyard model with four large trees.
Energies 14 05388 g023
Figure 24. Simulated results of the air temperature contour with isotherm in each room for the baseline courtyard model with four large trees.
Energies 14 05388 g024
Figure 25. Comparison of air temperature for Case 1 and Case 3 in each room.
Energies 14 05388 g025
Figure 26. Comparison of air temperature for Case 2 and Case 3 in each room.
Energies 14 05388 g026
Figure 27. Average wind speed magnitude (m/s) in each room for the baseline courtyard model with four large trees.
Energies 14 05388 g027
Figure 28. Contours of the wind speed in each room for the baseline courtyard model with four small trees.
Energies 14 05388 g028
Figure 29. Comparison of wind speed magnitude for Case 1, Case 2 and Case 3 in each room.
Energies 14 05388 g029
Figure 30. Contours for the wind speed magnitude and temperature within the courtyard with small and large trees (S1: X = 7500 mm).
Energies 14 05388 g030
Table 1. Three scenarios for the modelling of the ventilation and thermal performance of the courtyard building.
Case 1Baseline enclosed courtyard model with no vegetation
Case 2Four small trees inside the courtyard
Case 3Four large trees inside the courtyard
Table 2. Mesh setup for sensitivity analysis (courtyard with small trees).
Mesh Config.Mesh SizeMesh SettingsNumber of
Building Vicinity Sizing
(mm)
ElementsNodes
ACoarse1303,161,904632,788
BCoarse1124,274,397855,019
CMedium1005,323,2811,063,550
DMedium946,016,8691,203,369
EHigh847,432,6651,483,888
Table 3. Material properties.
Fabric ElementMaterialDensity (kg/m3)Cp
(J/kgK)
Thermal Conductivity
(W/mK)
Walls
(ground/symmetry)
Ash-solid100010002
Walls (building)Brick100010000.15
Table 4. Indoor thermal comfort index in each room.
LocationIndoor Thermal Comfort Index: PMV (PPD)
Case 1Case 2Case3
First FloorRWG14.10 (100%)3.35 (100%)3.17 (99%)
RWG24.10 (100%)3.21 (100%)3.10 (99%)
RSG14.10 (100%)2.38 (91%)2.14 (83%)
RSG24.10 (100%)3.21 (100%)3.26 (100%)
REG14.10 (100%)3.61 (100%)3.48 (100%)
REG24.10 (100%)3.58 (100%)3.47 (100%)
RNG14.10 (100%)2.63 (96%)2.17 (84%)
RNG24.10 (100%)3.32 (100%)3.26 (100%)
Second FloorRWF14.10 (100%)3.17 (100%)2.68 (96%)
RWF24.10 (100%)2.94 (99%)2.77 (97%)
RSF14.10 (100%)2.05 (79%)1.55 (54%)
RSF24.10 (100%)3.11 (99%)2.82 (98%)
REF14.10 (100%)3.64 (100%)3.52 (100%)
REF24.10 (100%)3.68 (100%)3.49 (100%)
RNF14.10 (100%)2.06 (79%)1.60 (56%)
RNF24.10 (100%)2.81 (98%)2.88 (98%)
Publisher’s Note: MDPI stays neutral with regard to jurisdictional claims in published maps and institutional affiliations.

