
The Impact of COVID-19 on Electricity Demand Profiles: A Case Study of Selected Business Clients in Poland


Abstract
:1. Introduction
2. Literature Review
- 1.
- 2.
- The peak of electricity demand changes. Studies based on electricity consumption in Canada indicate that the highest demand before the pandemic was in the second half of the week (from Wednesday to Friday), while after the pandemic, it has been observed at the week’s beginning (from Monday to Tuesday) [28].
- 3.
- Demand for electricity decreases in the morning peak [29].
- 4.
- A change in society’s behavior is visible, e.g., in using public transport. A total of 56.3% of respondents have limited its usage during and after the COVID-19 pandemic [30].
- 5.
- Demand for electricity decreases in industry and commerce but increases in households [10].
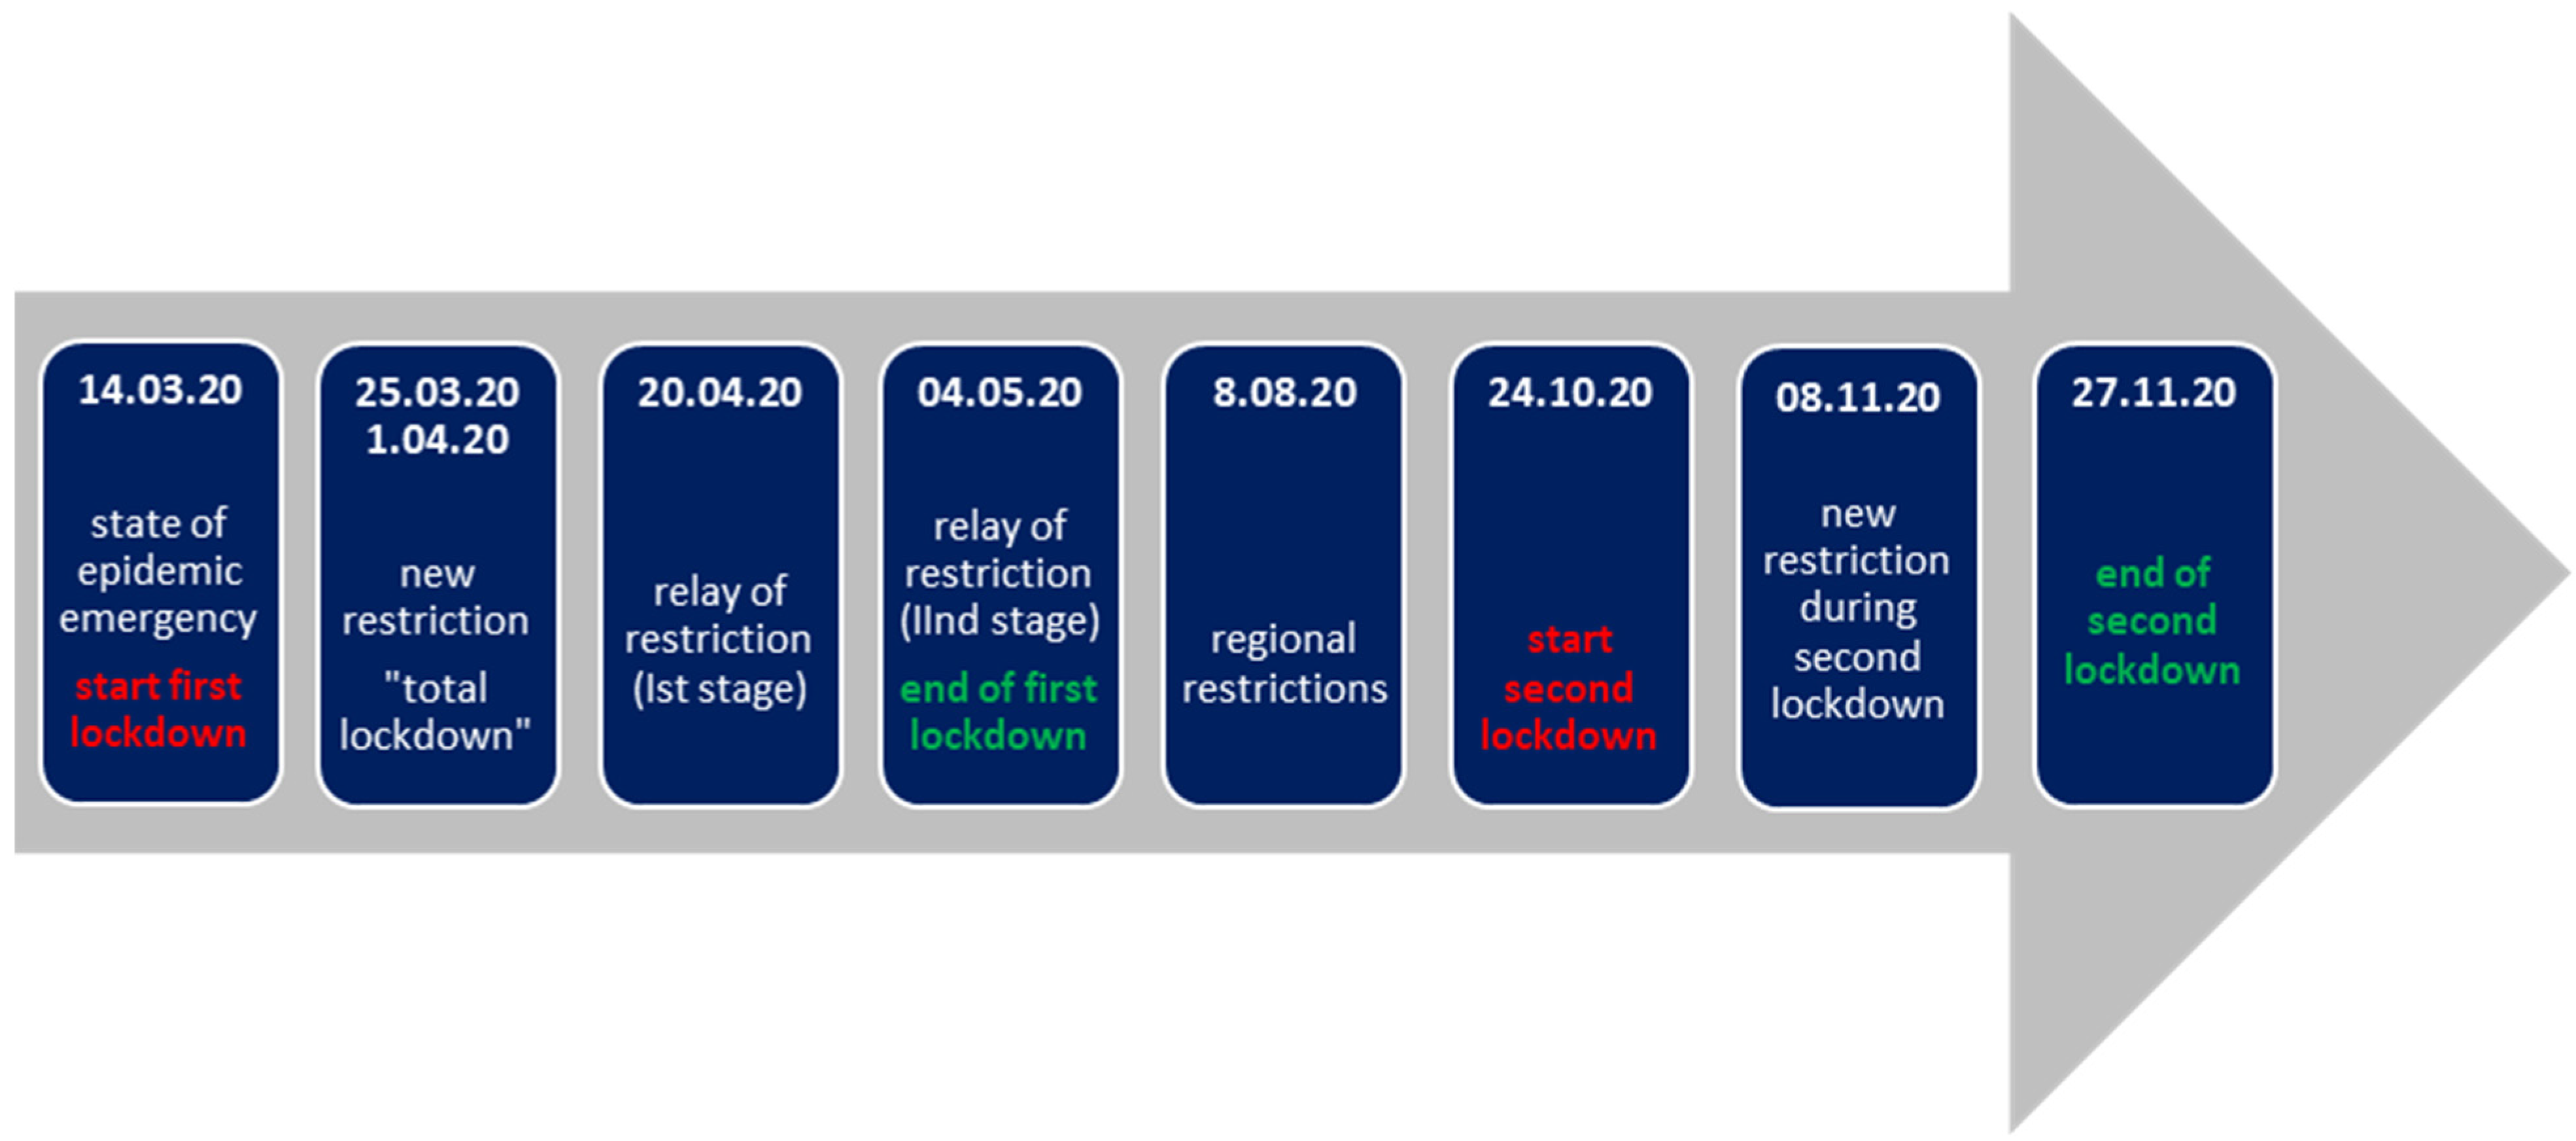
3. The Pandemic in Poland—A Course (Chronology)
4. Methodology and Data
4.1. Data Characteristics
4.2. Methodology
4.2.1. Comparative Analysis
4.2.2. Coefficient of Variation
4.2.3. Forecast (Trend) and Difference Calculation
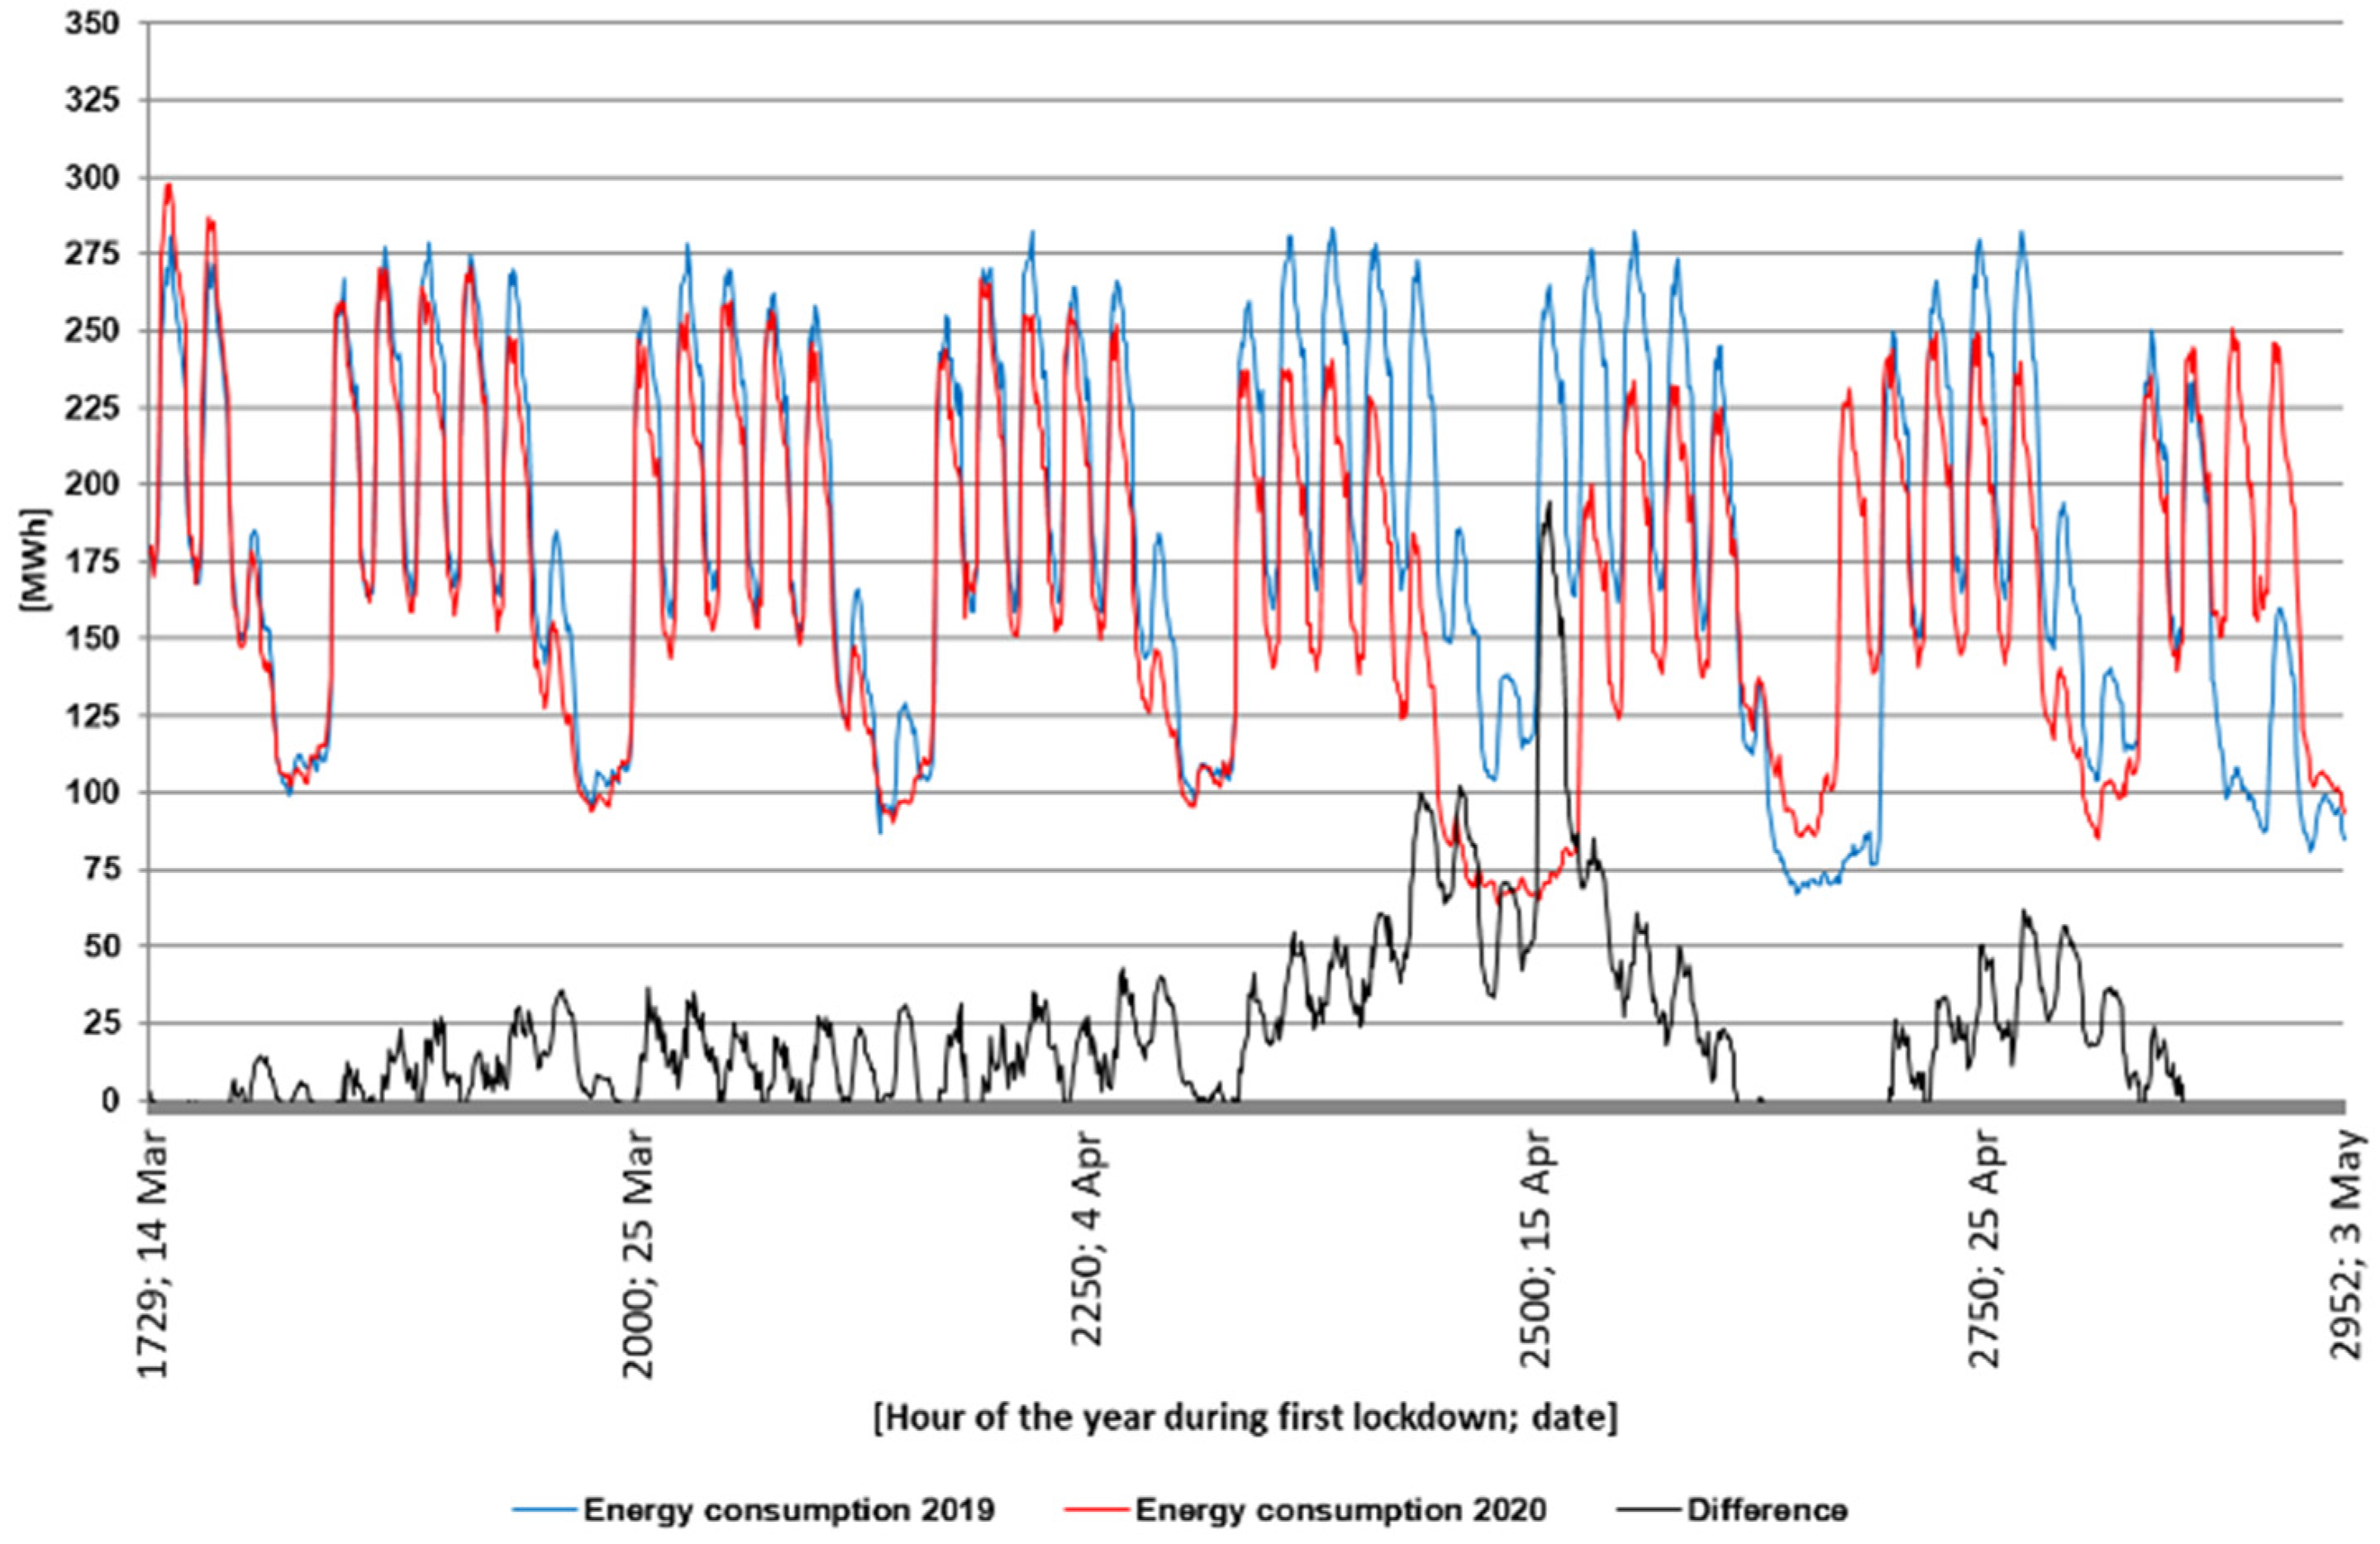
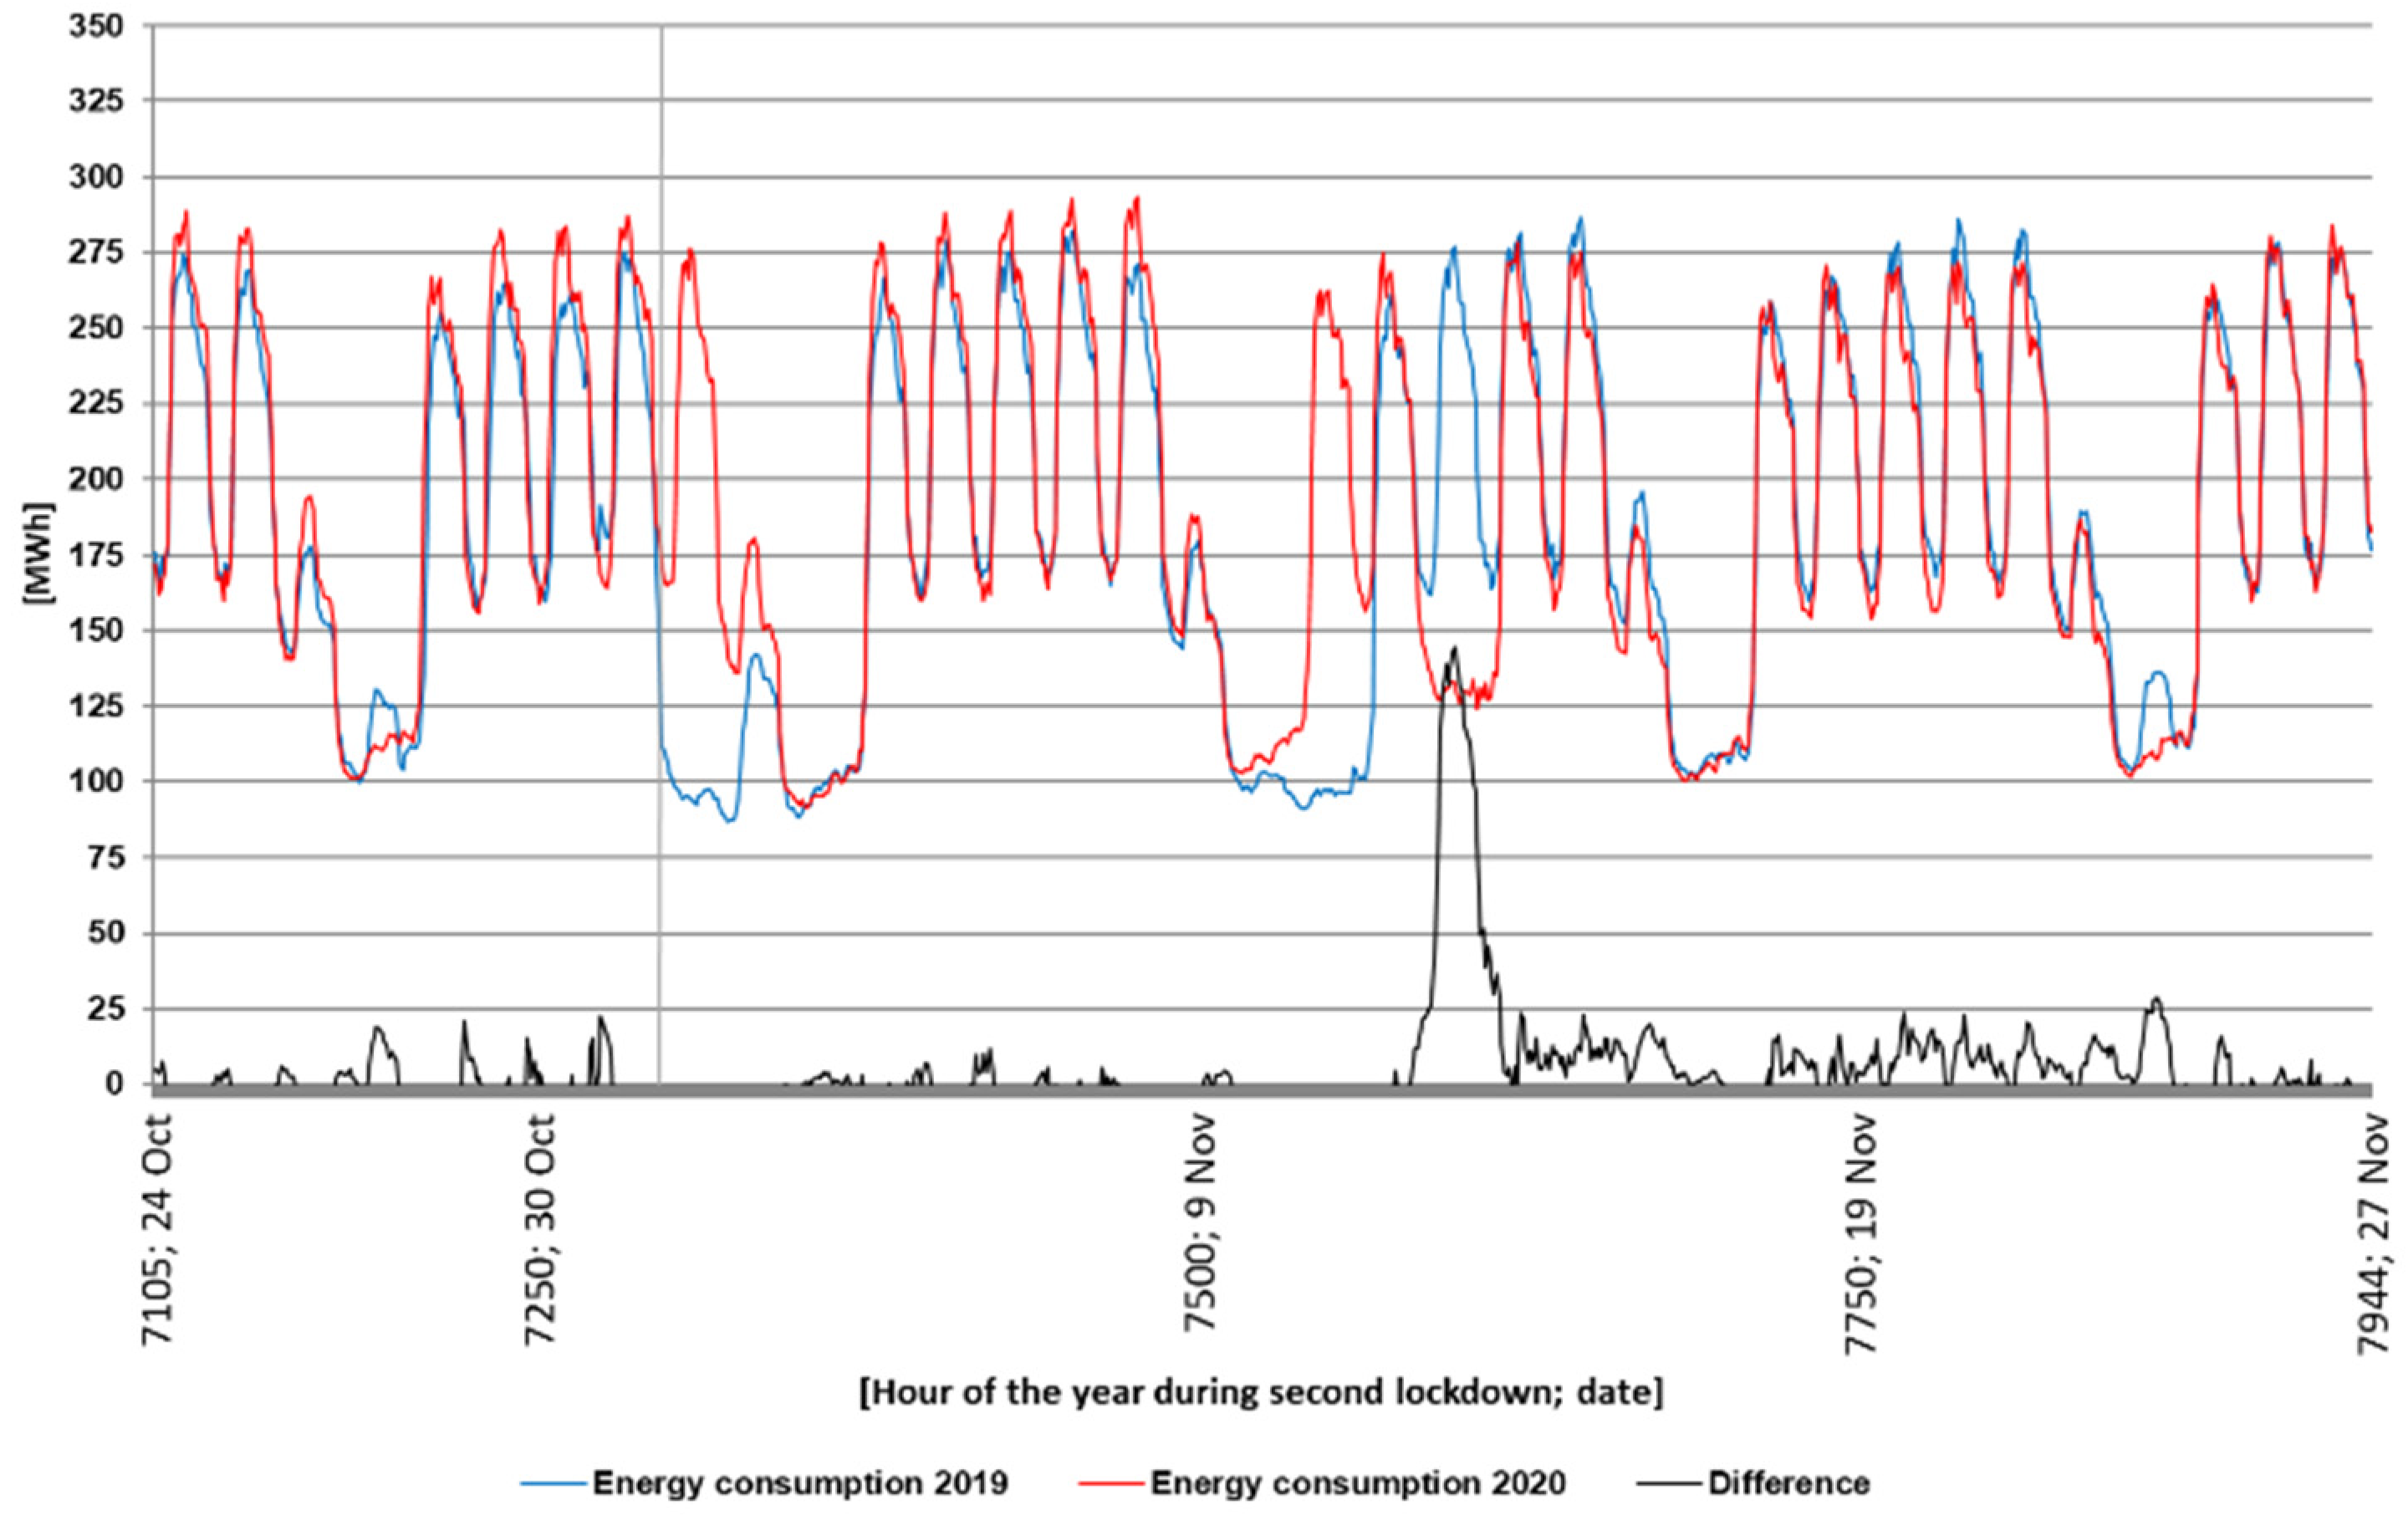
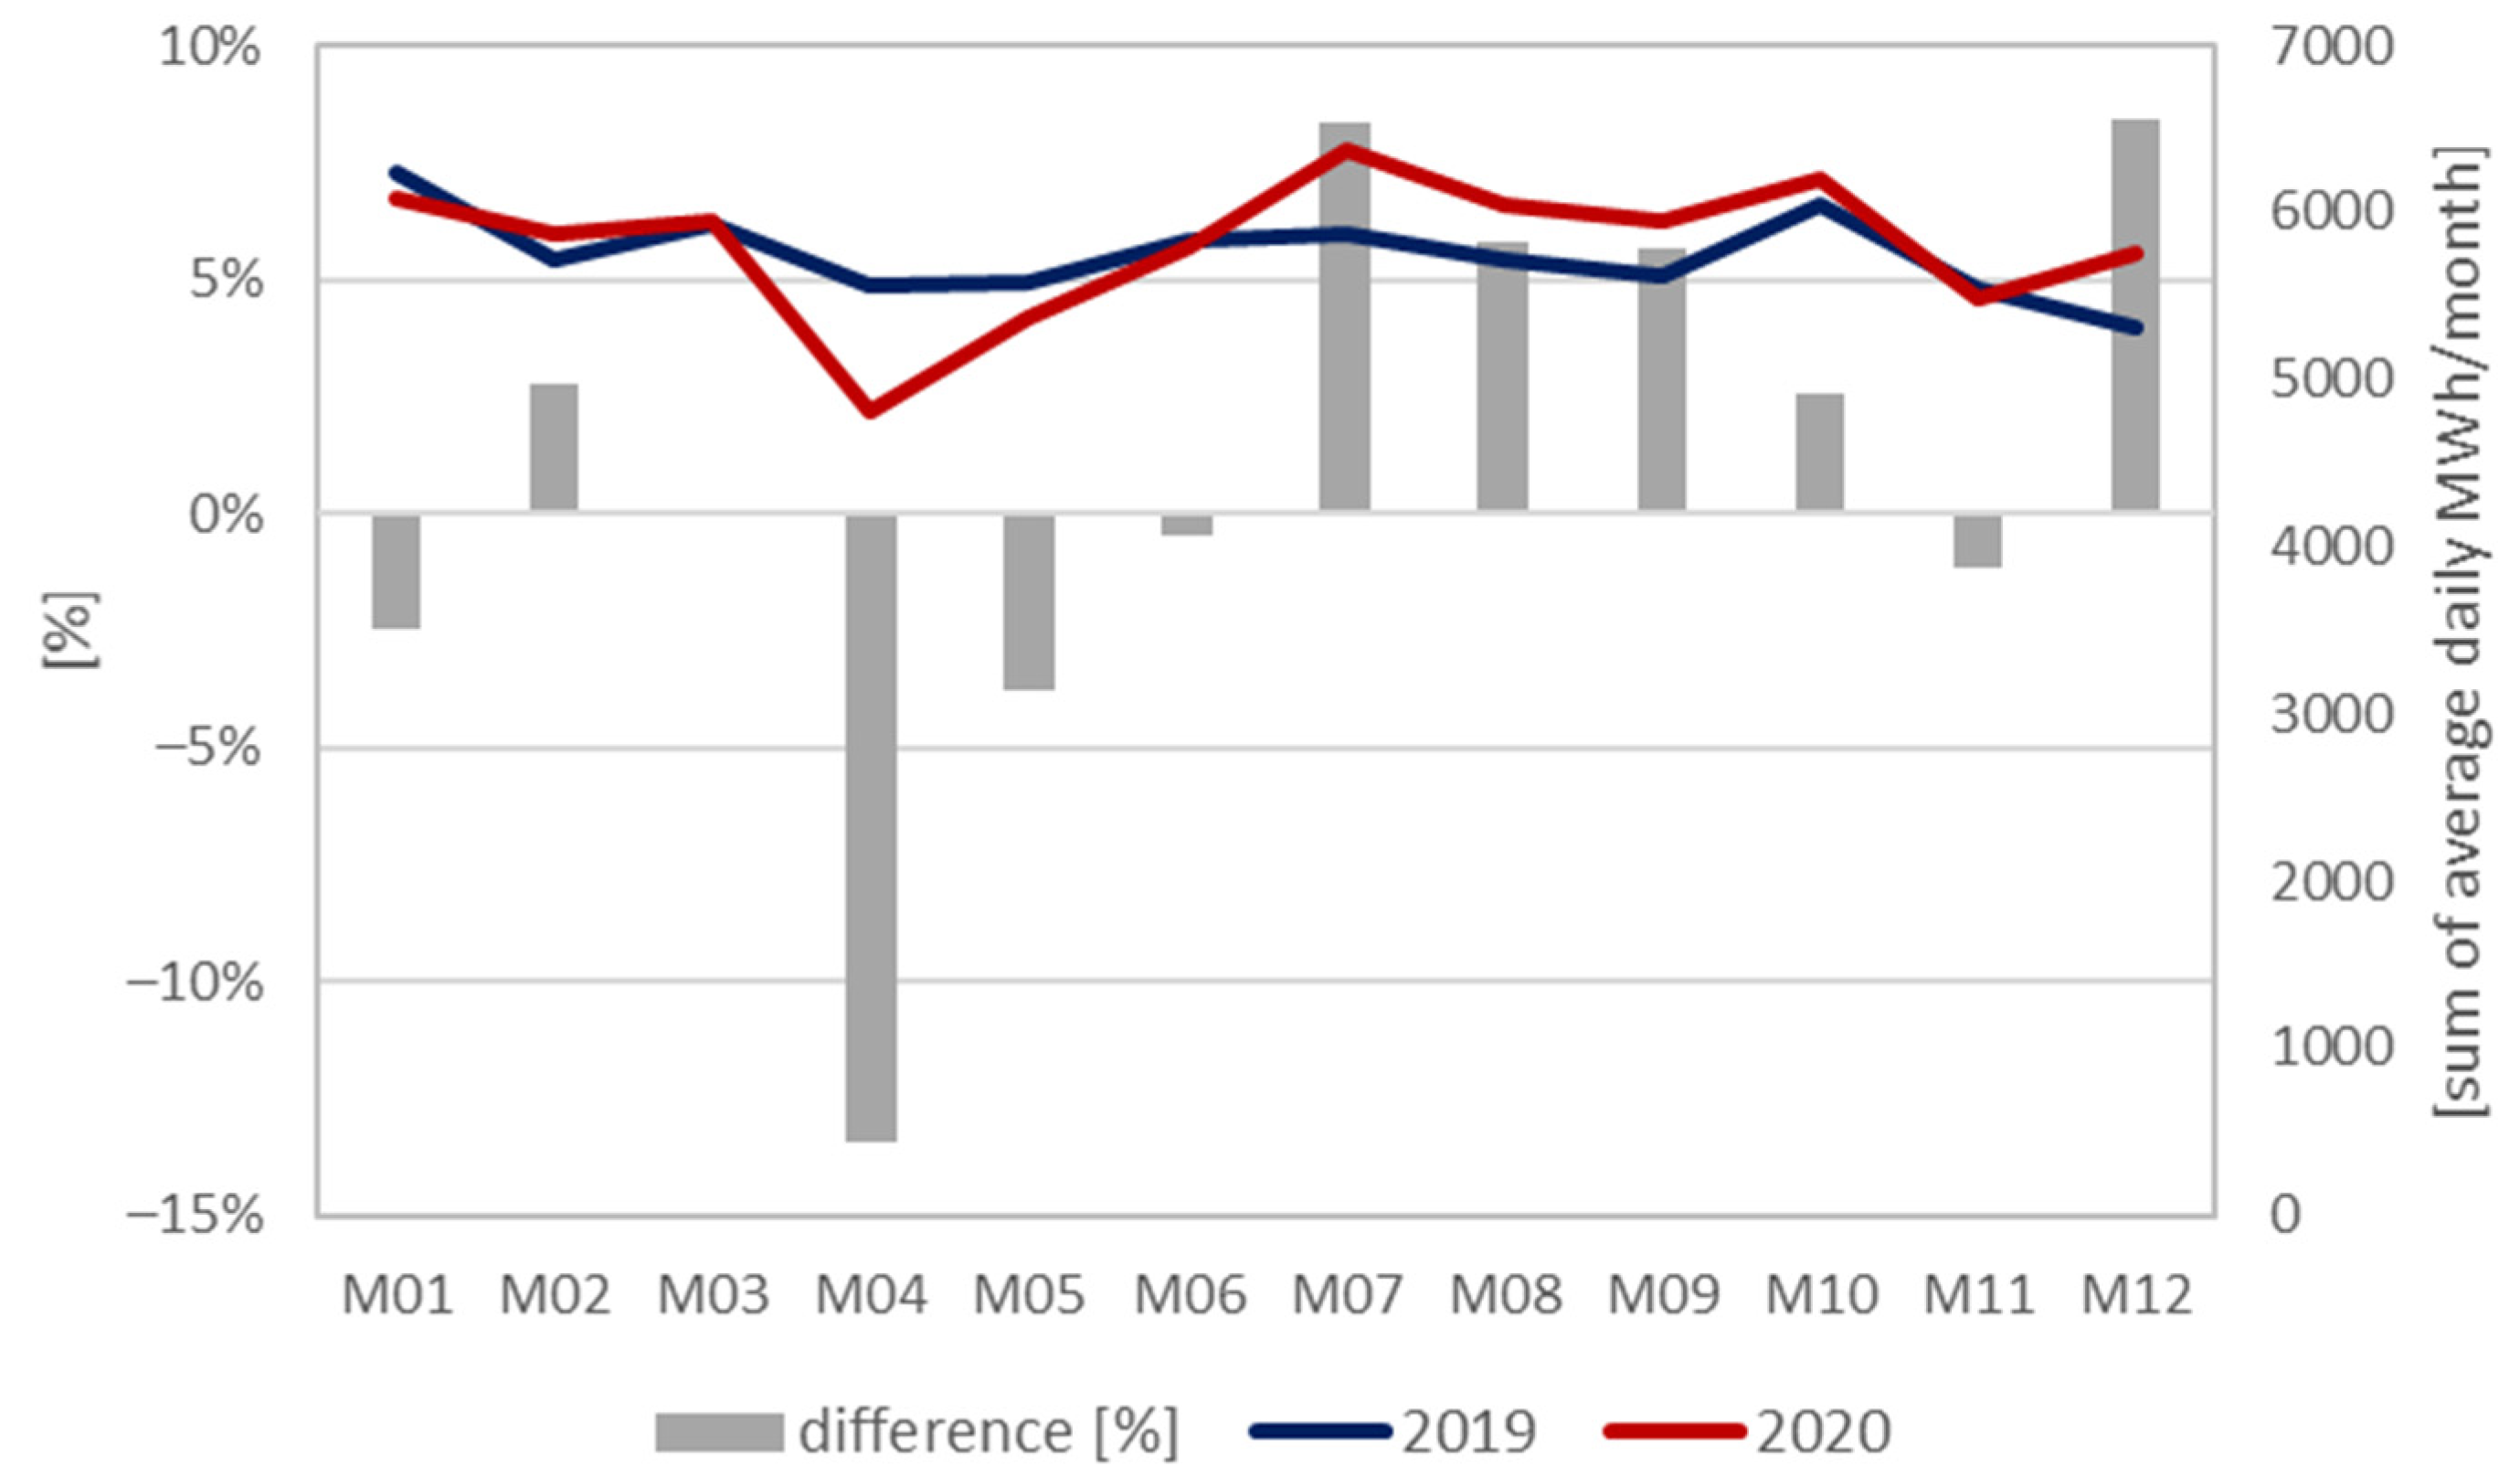
5. Results
6. Conclusions
Author Contributions
Funding
Acknowledgments
Conflicts of Interest
References
- Electricity Market Report; International Energy Agency (IEA): Paris, France, 2020. Available online: https://www.iea.org/reports/electricity-market-report-december-2020 (accessed on 21 May 2021).
- Nikola, M.; Alsafi, Z.; Sohrabi, C.; Kerwan, A.; Al-Jabir, A.; Iosifidis, C.; Agha, M.; Agha, R. The socio-economic implications of the coronavirus pandemic (COVID-19): A review. Int. J. Surg. 2020, 78, 185–193. [Google Scholar] [CrossRef]
- Szczepańska-Woszczyna, K. Management Theory, Innovation, and Organisation: A Model of Managerial Competencies; Routledge: Oxfordshire, UK, 2020; p. 206. [Google Scholar]
- Kinelski, G. The main factors of successful project management in the aspect of energy enterprises’ efficiency in the digital economy environment. Polityka Energetyczna Energy Policy J. 2020, 23, 5–20. [Google Scholar] [CrossRef]
- COVID-19 Impact on Electricity; International Energy Agency (IEA): Paris, France, 2020. Available online: https://www.iea.org/reports/covid-19-impact-on-electricity (accessed on 20 May 2021).
- Crider, J. COVID-19 Bankrupts 19 Energy (Oil & Gas) Companies. 2020. Available online: https://cleantechnica.com/2020/08/05/covid-19-bankrupts-19-energy-oil-gas-companies (accessed on 20 May 2021).
- Baker, M.G.; Wilson, N.; Blakely, T. Elimination could be the optimal response strategy for covid-19 and other emerging pandemic diseases. BMJ 2020, 371. [Google Scholar] [CrossRef]
- Czosnyka, M.; Wnukowska, B.; Karbowa, K. Electrical energy consumption and the energy market in Poland during the COVID-19 pandemic. In 2020 Progress in Applied Electrical Engineering (PAEE); IEEE: Piscataway, NJ, USA, 2020; pp. 1–5. [Google Scholar] [CrossRef]
- Polish Power System-PSE-Reports. Available online: https://www.pse.pl/web/pse-eng/data (accessed on 12 May 2021).
- Kaźmierska, M. Zużycie Prądu w Polsce. Jaki Wpływ Lockdownu? 2020. Available online: www.enerad.pl (accessed on 3 February 2021). (In Polish).
- Saługa, P.W.; Szczepańska-Woszczyna, K.; Miśkiewicz, R.; Chłąd, M. Cost of Equity of Coal-Fired Power Generation Projects in Poland: Its Importance for the Management of Decision-Making Process. Energies 2020, 13, 4833. [Google Scholar] [CrossRef]
- Mucha-Kuś, K.; Sołtysik, M.; Zamasz, K.; Szczepańska-Woszczyna, K. Coopetitive Nature of Energy Communities—The Energy Transition Context. Energies 2021, 14, 931. [Google Scholar] [CrossRef]
- Kinelski, G. Two-way market and the existence of its competitiveness in the electrolygenic subsector. Rynek dwutowarowy i istota jego konkurencyjności w sektorze elektroenergetycznym. Zesz. Nauk. Inst. Gospod. Surowcami Miner. I Energią Pol. Akad. Nauk. 2018, 102, 277–299. (In Polish) [Google Scholar]
- Wójcik-Jurkiewicz, M.; Czarnecka, M.; Kinelski, G.; Sadowska, B.; Bilińska-Reformat, K. Determinants of Decarbonisation in the Transformation of the Energy Sector: The Case of Poland. Energies 2021, 14, 1217. [Google Scholar] [CrossRef]
- Łabinowicz, K.; Bujalski, W. Extracting main factors influencing spot electricity prices with application of statistical methods. Wyodrębnienie głównych czynników kształtujących ceny energii elektrycznej na Rynku Dnia Następnego z wykorzystaniem metod statystycznych. Rynek Energii 2015, 6, 15–21. (In Polish) [Google Scholar]
- Malec, M. Impact of the volatility of coal prices in the international markets and it’s impact on the volatility of domestic fuel and electricity prices. Wpływ zmienności cen węgla kamiennego na rynkach światowych na zmienność cen paliw i energii elektrycznej w Polsce. Polityka Energetyczna Energy Policy J. 2017, 4, 39–54. (In Polish) [Google Scholar]
- Nowotarski, J.; Weron, R. Recent advances in electricity price forecasting: A review of probabilistic forecasting. Renew. Sustain. Energy Rev. 2018, 81, 1548–1568. [Google Scholar] [CrossRef]
- Maciejowska, K.; Nitka, W.; Weron, T. Day-ahead vs. Intraday—Forecasting the price spread to maximize economic benefits. Energies 2019, 12, 631. [Google Scholar] [CrossRef] [Green Version]
- Edoli, E.; Fiorenzani, S.; Vargiolu, T. Optimal Trading Strategies in Intraday Power Markets. In Optimization Methods for Gas and Power Markets; Palgrave Macmillan: London, UK, 2016; pp. 161–184. [Google Scholar] [CrossRef]
- Ghenai, C.; Bettayeb, M. Data analysis of the electricity generation mix for clean energy transition during COVID-19 lockdowns. Energy Sources Part A Recover. Util. Environ. Eff. 2021, 43. [Google Scholar] [CrossRef]
- Zhong, H. Implications of COVID-19 for the Electricity Industry: A Comprehensive Review. CSEE J. Power Energy Syst. 2020, 6, 489–495. [Google Scholar] [CrossRef]
- Fezzi, C. Real-Time Estimation of the Short-Run Impact of COVID-19 on Economic Activity Using Electricity Market Data. Environ. Resour. Econ. 2020, 76, 885–900. [Google Scholar] [CrossRef] [PubMed]
- Benatia, D.; Feron, O.; Alasseur, C. Ring the Alarm! Electricity Markets, Renewables, and the Pandemic; USAEE Working Paper No. 20-473; USAEE: Dayton, OH, USA, 2020; Available online: https://ssrn.com/abstract=3703117 (accessed on 10 May 2021).
- Mirnezami, S.R.; Rajabi, S. Changing primary energy consumption due to covid-19: The study 20 european economies. Int. J. Energy Econ. Policy 2021, 11, 615–631. [Google Scholar] [CrossRef]
- Castan Broto, V.; Kirshner, J. Energy access is needed to maintain health during pandemics. Nat. Energy 2020, 5, 419–421. [Google Scholar] [CrossRef]
- Elavarasan, R.M.; Shafiullah, G.M.; Kannadasan, R.; Mudgal, V.; Arif, M.T.; Jamal, T. COVID-19: Impact analysis and recommendations for power sector operation. Appl. Energy 2020, 279, 115739. [Google Scholar] [CrossRef]
- Global Energy Review 2020: The Impacts of the COVID-19 Crisis on Global Energy Demand and CO2 Emissions; International Energy Agency (IEA): Paris, France, 2020. Available online: https://www.iea.org/reports/global-energy-review-2020 (accessed on 22 May 2021).
- Abu-Rayash, A.; Dincer, I. Analysis of the electricity demand trends amidst the COVID-19 coronavirus pandemic. Energy Res. Soc. Sci. 2020, 68, 101682. [Google Scholar] [CrossRef]
- Chen, C.F.; de Rubens, G.Z.; Xu, X.; Li, J. Coronavirus comes home? Energy use, home energy management, and the social-psychological factors of COVID-19. Energy Res. Soc. Sci. 2020, 68, 101682. [Google Scholar] [CrossRef]
- Sui, Y.; Zhang, H.; Shang, W.; Sun, R.; Wang, C.; Ji, J. Mining urban sustainable performance: Spatio-temporal emission potential changes of urban transit buses in post-COVID-19 future. Appl. Energy 2020, 280, 115966. [Google Scholar] [CrossRef]
- Bielecki, S.; Skoczkowski, T.; Sobczak, L.; Buchoski, J.; Maciąg, Ł.; Dukat, P. Impact of the Lockdown during the COVID-19 Pandemic on Electricity Use by Residential Users. Energies 2021, 14, 980. [Google Scholar] [CrossRef]
- Cheshmehzangi, A. COVID-19 and household energy implications: What are the main impacts on energy use? Heliyon 2020, 6, e05202. [Google Scholar] [CrossRef]
- Santiago, I.; Moreno-Munoz, A.; Quintero-Jiménez, P.; Garcia-Torres, F.; Gonzalez-Redondo, M.J. Electricity demand during pandemic times: The case of the COVID-19 in Spain. Energy Policy 2021, 148, 111964. [Google Scholar] [CrossRef]
- Rouleau, J.; Gosselin, L. Impacts of the COVID-19 lockdown on energy consumption in a Canadian social housing building. Appl. Energy 2021, 287, 116565. [Google Scholar] [CrossRef]
- Jiang, P.; Klemeš, J.J.; Bee, Y.M. More is not enough: A deeper understanding of the covid-19 impacts on healthcare, energy and environment is crucial. Int. J. Environ. Res. Public Health 2021, 18, 684. [Google Scholar] [CrossRef]
- Jiang, P.; Fan, Y.V.; Klemeš, J.J. Impacts of COVID-19 on energy demand and consumption: Challenges, lessons and emerging opportunities. Appl. Energy 2021, 18, 684. [Google Scholar] [CrossRef]
- Eurostat Report—Impact of COVID-19 Crisis on Short-Term Statistics. 2021. Available online: https://ec.europa.eu/eurostat/statistics-explained/index.php?title=Impact_of_Covid-19_crisis_on_short-term_statistics (accessed on 30 May 2021).
- European Parliament Report—Impacts of the COVID-19 Pandemic on EU Industries. 2021. Available online: https://www.europarl.europa.eu/ (accessed on 2 June 2021).
- Bompard, E.; Mosca, C.; Colella, P.; Antonopoulos, G.; Fulli, G.; Masera, M.; Poncela-Blanco, M.; Vitiello, S. The Immediate Impacts of COVID-19 on European Electricity Systems: A First Assessment and Lessons Learned. Energies 2021, 14, 96. [Google Scholar] [CrossRef]
- Fu, M.; Shen, H. COVID-19 and Corporate Performance in the Energy Industry. Energy Res. Lett. 2020, 1, 12967. [Google Scholar] [CrossRef]
- Graf, C.; Quaglia, F.; Wolak, F.A. (Machine) learning from the COVID-19 Lockdown about Electricity Market Performance with a large share of renewables. J. Environ. Econ. Manag. 2021, 105, 102398. [Google Scholar] [CrossRef]
- Kuzemko, C.; Bradshaw, M.; Bridge, G.; Goldthau, A.; Jewell, J.; Overland, I.; Scholten, D.; Van de Graaf, T.; Westphal, K. COVID-19 and the politics of sustainable energy transitions. Energy Res. Soc. Sci. 2020, 68, 101685. [Google Scholar] [CrossRef] [PubMed]
- Aruga, K.; Islam, M.; Jannat, A. Effects of COVID-19 on Indian energy consumption. Sustainability 2020, 12, 5616. [Google Scholar] [CrossRef]
- Gomez-Omella, M.; Esnaola-Gonzalez, I.; Ferreiro, S. Short-Term Forecasting Methodology for Energy Demand in Residential Buildings and the Impact of the COVID-19 Pandemic on Forecasts. In International Conference on Innovative Techniques and Applications of Artificial Intelligence; Bramer, M., Ellis, R., Eds.; Springer: Cham, Switzerland, 2020. [Google Scholar] [CrossRef]
- Alasali, F.; Nusair, K.; Alhmoud, L.; Zarour, E. Impact of the COVID-19 Pandemic on Electricity Demand and Load Forecasting. Sustainability 2021, 13, 1435. [Google Scholar] [CrossRef]
- COVID-19 in Poland. Governments Actions. Available online: https://www.gov.pl/web/koronawirus/dzialania-rzadu (accessed on 22 April 2021). (In Polish)
- Code List of Classification of Business Activities in Poland (PKD Classification). Available online: https://ec.europa.eu/eurostat/ramon/nomenclatures/index.cfm?TargetUrl=LST_NOM_DTL&StrNom=NACE_REV2&StrLanguageCode=EN&IntPcKey=&StrLayoutCode=HIERARCHIC&IntCurrentPage=1 (accessed on 1 June 2021).
- Subrahmanya Nairy, K.; Aruna Rao, K. Tests of Coefficients of Variation of Normal Population. Commun. Stat. Simul. Comput. 2003, 32, 641–661. [Google Scholar] [CrossRef]
- Forkman, J. Estimator and Tests for Common Coefficients of Variation in Normal Distributions. Commun. Stat. Theory Methods 2009, 38, 233–251. [Google Scholar] [CrossRef] [Green Version]


| Parameter | Unit | Year | IQ | IIQ | IIIQ | IVQ | |
|---|---|---|---|---|---|---|---|
| Energy consumption—week (2019) | Mean | [MWh/week] | 31,775 | 33,590 | 31,383 | 31,340 | 30,788 |
| Standard deviation | [MWh/week] | 3031 | 1157 | 3613 | 1873 | 4112 | |
| Coefficient of variation | [%] | 10% | 3% | 12% | 6% | 13% | |
| Energy consumption—week (2020) | Mean | [MWh/week] | 32,125 | 33,001 | 29,484 | 33,558 | 32,459 |
| Standard deviation | [MWh/week] | 3435 | 3306 | 3 566 | 758 | 4023 | |
| Coefficient of variation | [%] | 11% | 10% | 12% | 2% | 12% | |
| Parameter | Unit | Year | IQ | IIQ | IIIQ | IVQ | |
|---|---|---|---|---|---|---|---|
| Energy consumption—working day (Tuesday 2019) | Mean | [MWh/week] | 5313 | 5565 | 5267 | 5140 | 5296 |
| Standard deviation | [MWh/week] | 324 | 111 | 435 | 317 | 203 | |
| Coefficient of variation | [%] | 6% | 2% | 8% | 6% | 4% | |
| Energy consumption—working day (Tuesday 2020) | Mean | [MWh/week] | 5328 | 5526 | 4995 | 5474 | 5320 |
| Standard deviation | [MWh/week] | 446 | 334 | 536 | 161 | 500 | |
| Coefficient of variation | [%] | 8% | 6% | 11% | 3% | 9% | |
| Parameter | Unit | Year | IQ | IIQ | IIIQ | IVQ | |
|---|---|---|---|---|---|---|---|
| Energy consumption—day off (Saturday 2019) | Mean | [MWh/week] | 3712 | 3841 | 3636 | 3722 | 3650 |
| Standard deviation | [MWh/week] | 348 | 211 | 522 | 262 | 364 | |
| Coefficient of variation | [%] | 9% | 5% | 14% | 7% | 10% | |
| Energy consumption—day off (Saturday 2020) | Mean | [MWh/week] | 3648 | 3868 | 3143 | 3756 | 3842 |
| Standard deviation | [MWh/week] | 454 | 298 | 521 | 297 | 182 | |
| Coefficient of variation | [%] | 12% | 8% | 17% | 8% | 5% | |
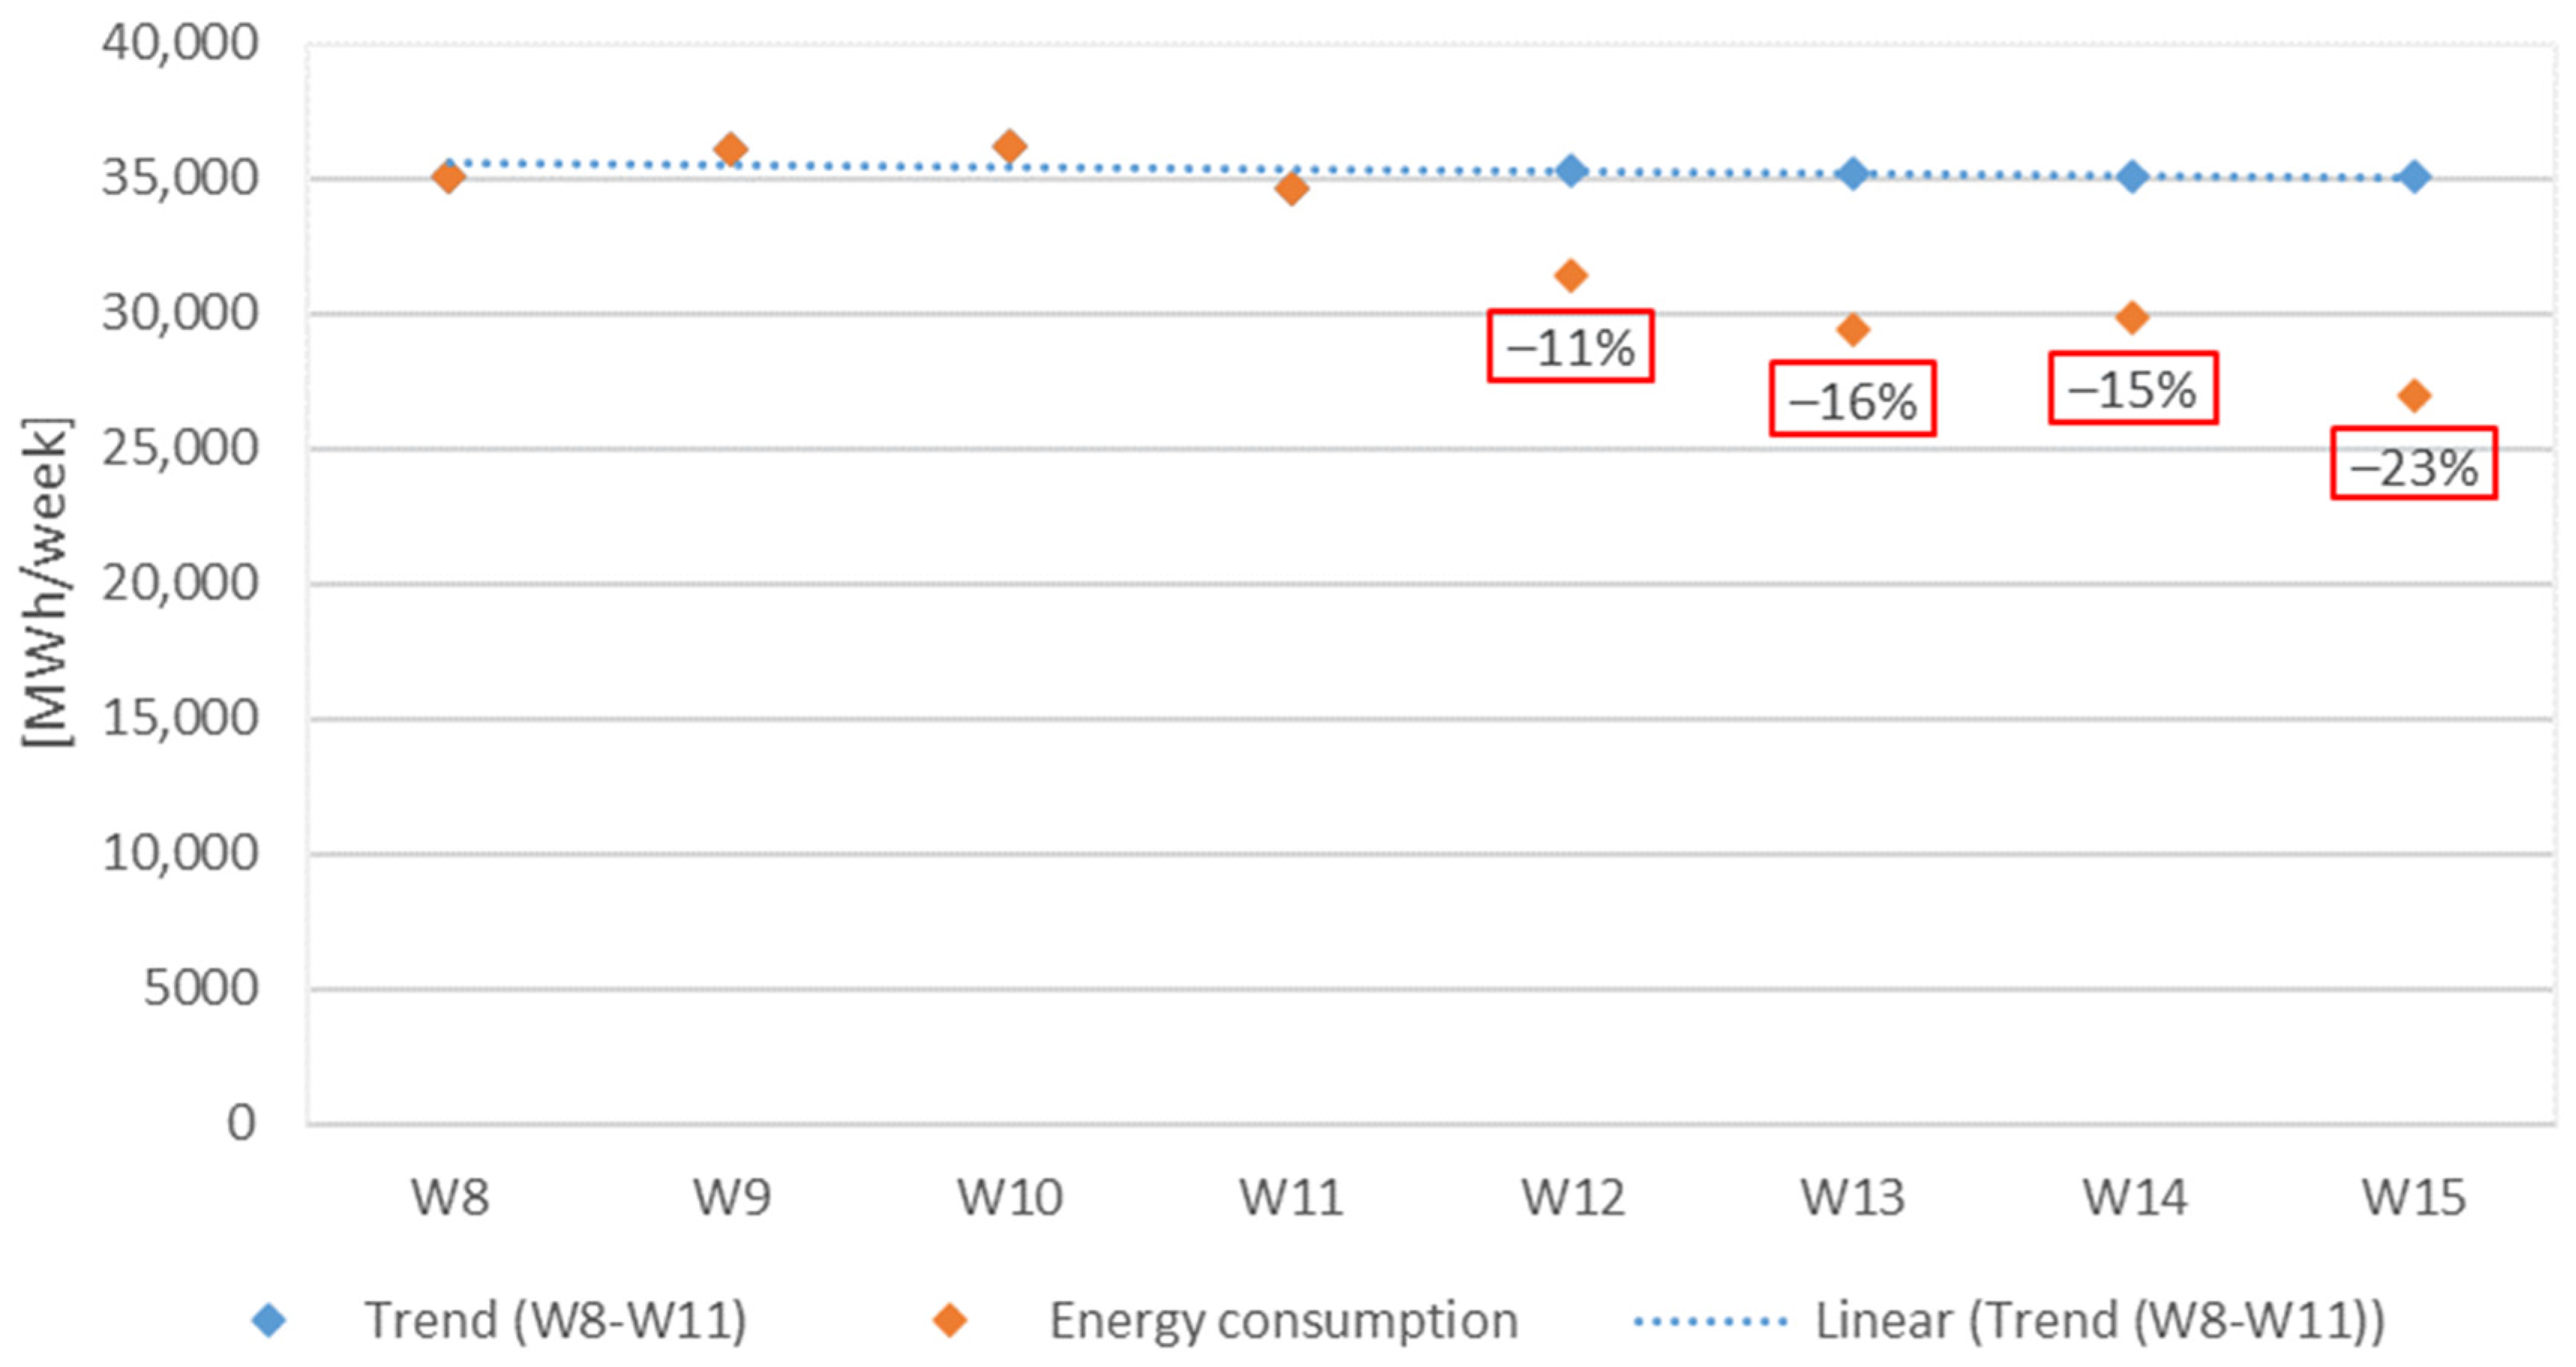
| Number of Week | Date | Energy Consumption | Values Calculated in Line with (W8–W11) Trend | The Difference Value in Reference to the Trend | ||
|---|---|---|---|---|---|---|
| Volume | % | |||||
| [-] | [-] | [MWh/week] | [MWh/week] | [MWh/week] | [%] | |
| NO LOCKDOWN | W8 | 15–21 February 2020 | 35,051 | 35,051 | 0 | 0% |
| W9 | 22–28 February 2020 | 36,060 | 36,060 | 0 | 0% | |
| W10 | 29 February–6 March 2020 | 36,169 | 36,170 | 0 | 0% | |
| W11 | 7–13 March 2020 | 34,689 | 34,688 | 0 | 0% | |
| LOCKDOWN | W12 | 14–20 March 2020 | 31,407 | 35,345 | 3938 | −11% |
| W13 | 21–27 March 2020 | 29,432 | 35,247 | 5816 | −16% | |
| W14 | 28 March–3 April 2020 | 29,832 | 35,150 | 5318 | −15% | |
| W15 | 4–10 April 2020 | 26,995 | 35,052 | 8057 | −23% | |
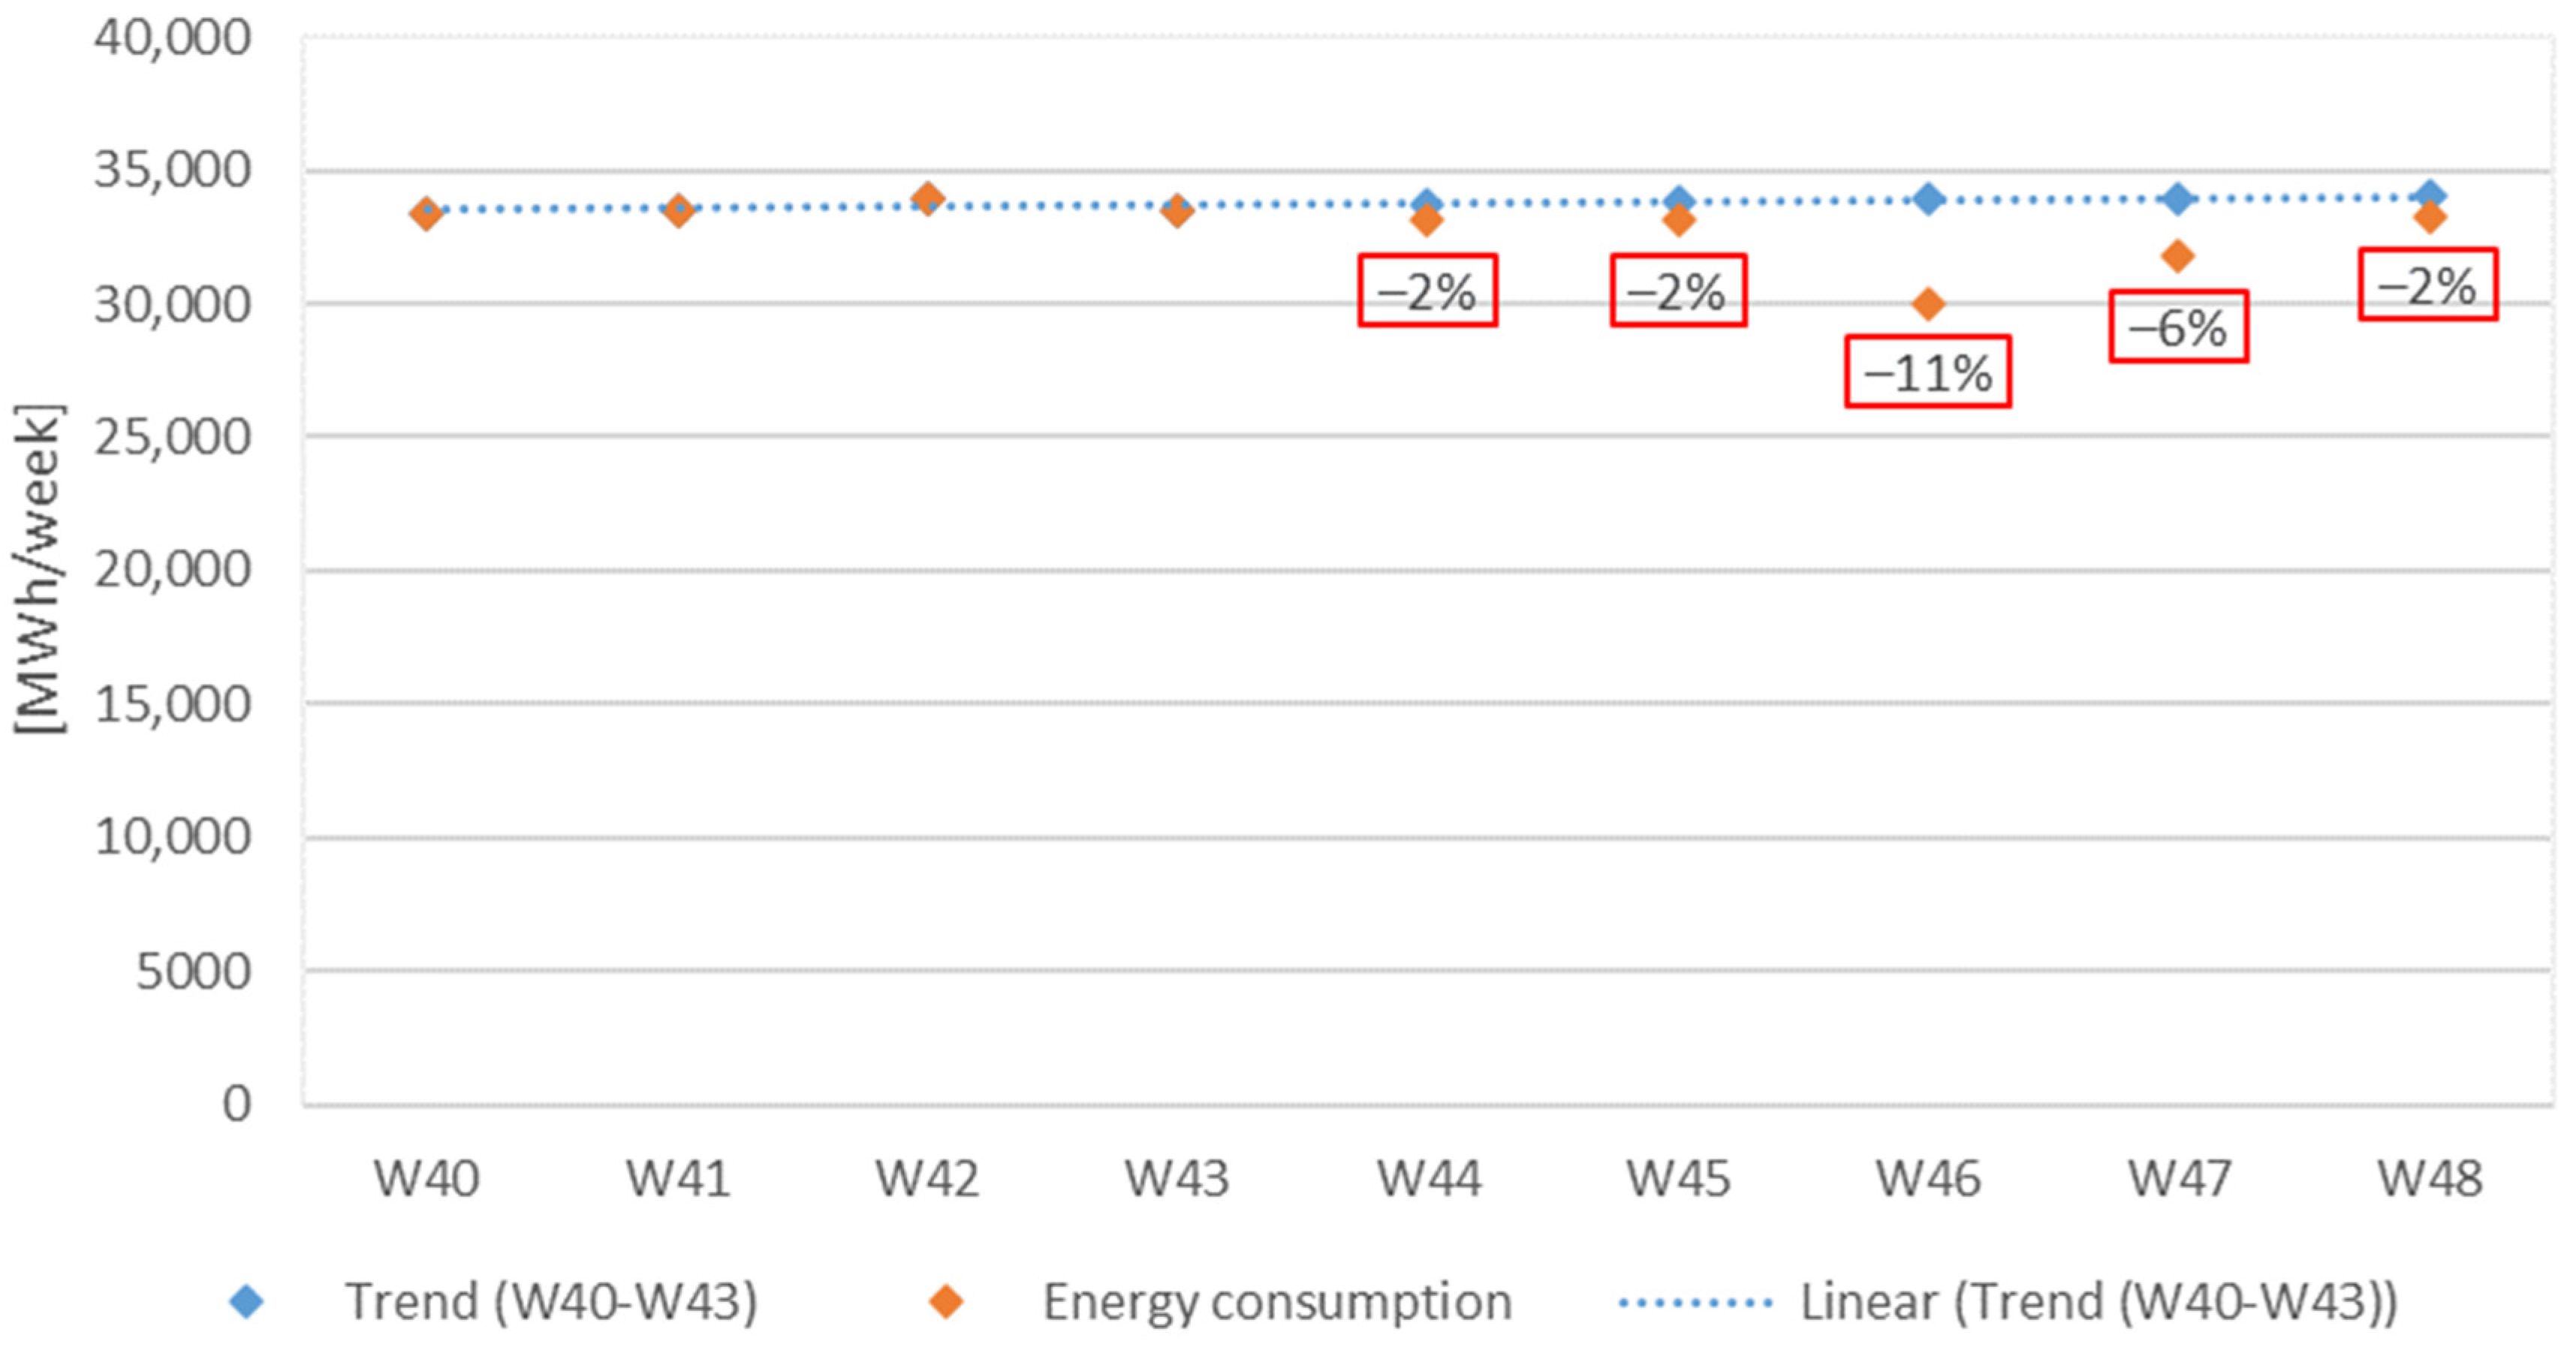
| Number of Week | Date | Energy Consumption | Values Calculated in Line with (W40–W43) Trend | The Difference Value in Reference to the Trend | ||
|---|---|---|---|---|---|---|
| Volume | % | |||||
| [-] | [-] | [MWh/week] | [MWh/week] | [MWh/week] | [%] | |
| NO LOCKDOWN | W40 | 26 September–2 October 2020 | 33,400 | 33,400 | 0 | 0% |
| W41 | 3–09 October 2020 | 33,527 | 33,527 | 0 | 0% | |
| W42 | 10–16 October 2020 | 33,995 | 33,995 | 0 | 0% | |
| W43 | 17–23 October 2020 | 33,465 | 33,465 | 0 | 0% | |
| LOCKDOWN | W44 | 24–30 October 2020 | 33,126 | 33,763 | 637 | −2% |
| W45 | 31 October–6 November 2020 | 33,127 | 33,829 | 702 | −2% | |
| W46 | 7–13 November 2020 | 30,040 | 33,896 | 3856 | −11% | |
| W47 | 14–20 November 2020 | 31,772 | 33,962 | 2190 | −6% | |
| W48 | 21–27 November 2020 | 33,312 | 34,029 | 717 | −2% | |
Publisher’s Note: MDPI stays neutral with regard to jurisdictional claims in published maps and institutional affiliations. |
© 2021 by the authors. Licensee MDPI, Basel, Switzerland. This article is an open access article distributed under the terms and conditions of the Creative Commons Attribution (CC BY) license (https://creativecommons.org/licenses/by/4.0/).
Share and Cite
Malec, M.; Kinelski, G.; Czarnecka, M. The Impact of COVID-19 on Electricity Demand Profiles: A Case Study of Selected Business Clients in Poland. Energies 2021, 14, 5332. https://doi.org/10.3390/en14175332
Malec M, Kinelski G, Czarnecka M. The Impact of COVID-19 on Electricity Demand Profiles: A Case Study of Selected Business Clients in Poland. Energies. 2021; 14(17):5332. https://doi.org/10.3390/en14175332
Chicago/Turabian StyleMalec, Marcin, Grzegorz Kinelski, and Marzena Czarnecka. 2021. "The Impact of COVID-19 on Electricity Demand Profiles: A Case Study of Selected Business Clients in Poland" Energies 14, no. 17: 5332. https://doi.org/10.3390/en14175332
APA StyleMalec, M., Kinelski, G., & Czarnecka, M. (2021). The Impact of COVID-19 on Electricity Demand Profiles: A Case Study of Selected Business Clients in Poland. Energies, 14(17), 5332. https://doi.org/10.3390/en14175332