
Hydro–Connected Floating PV Renewable Energy System and Onshore Wind Potential in Zambia


Abstract
:
1. Introduction
1.1. Overview
1.2. Objectives and Research Contributions
- An initial filtering and screening process identifying potential sites for floating PV and onshore wind installations near existing and future hydropower plants.
- Development of a ranking and scoring methodology of filtered sites using multi-criteria decision-making and the application of the same.
- Development of a methodology for scoping the case study design.
- Application of the design methodology on an actual site.
- Discussion of the findings.
2. Literature Review
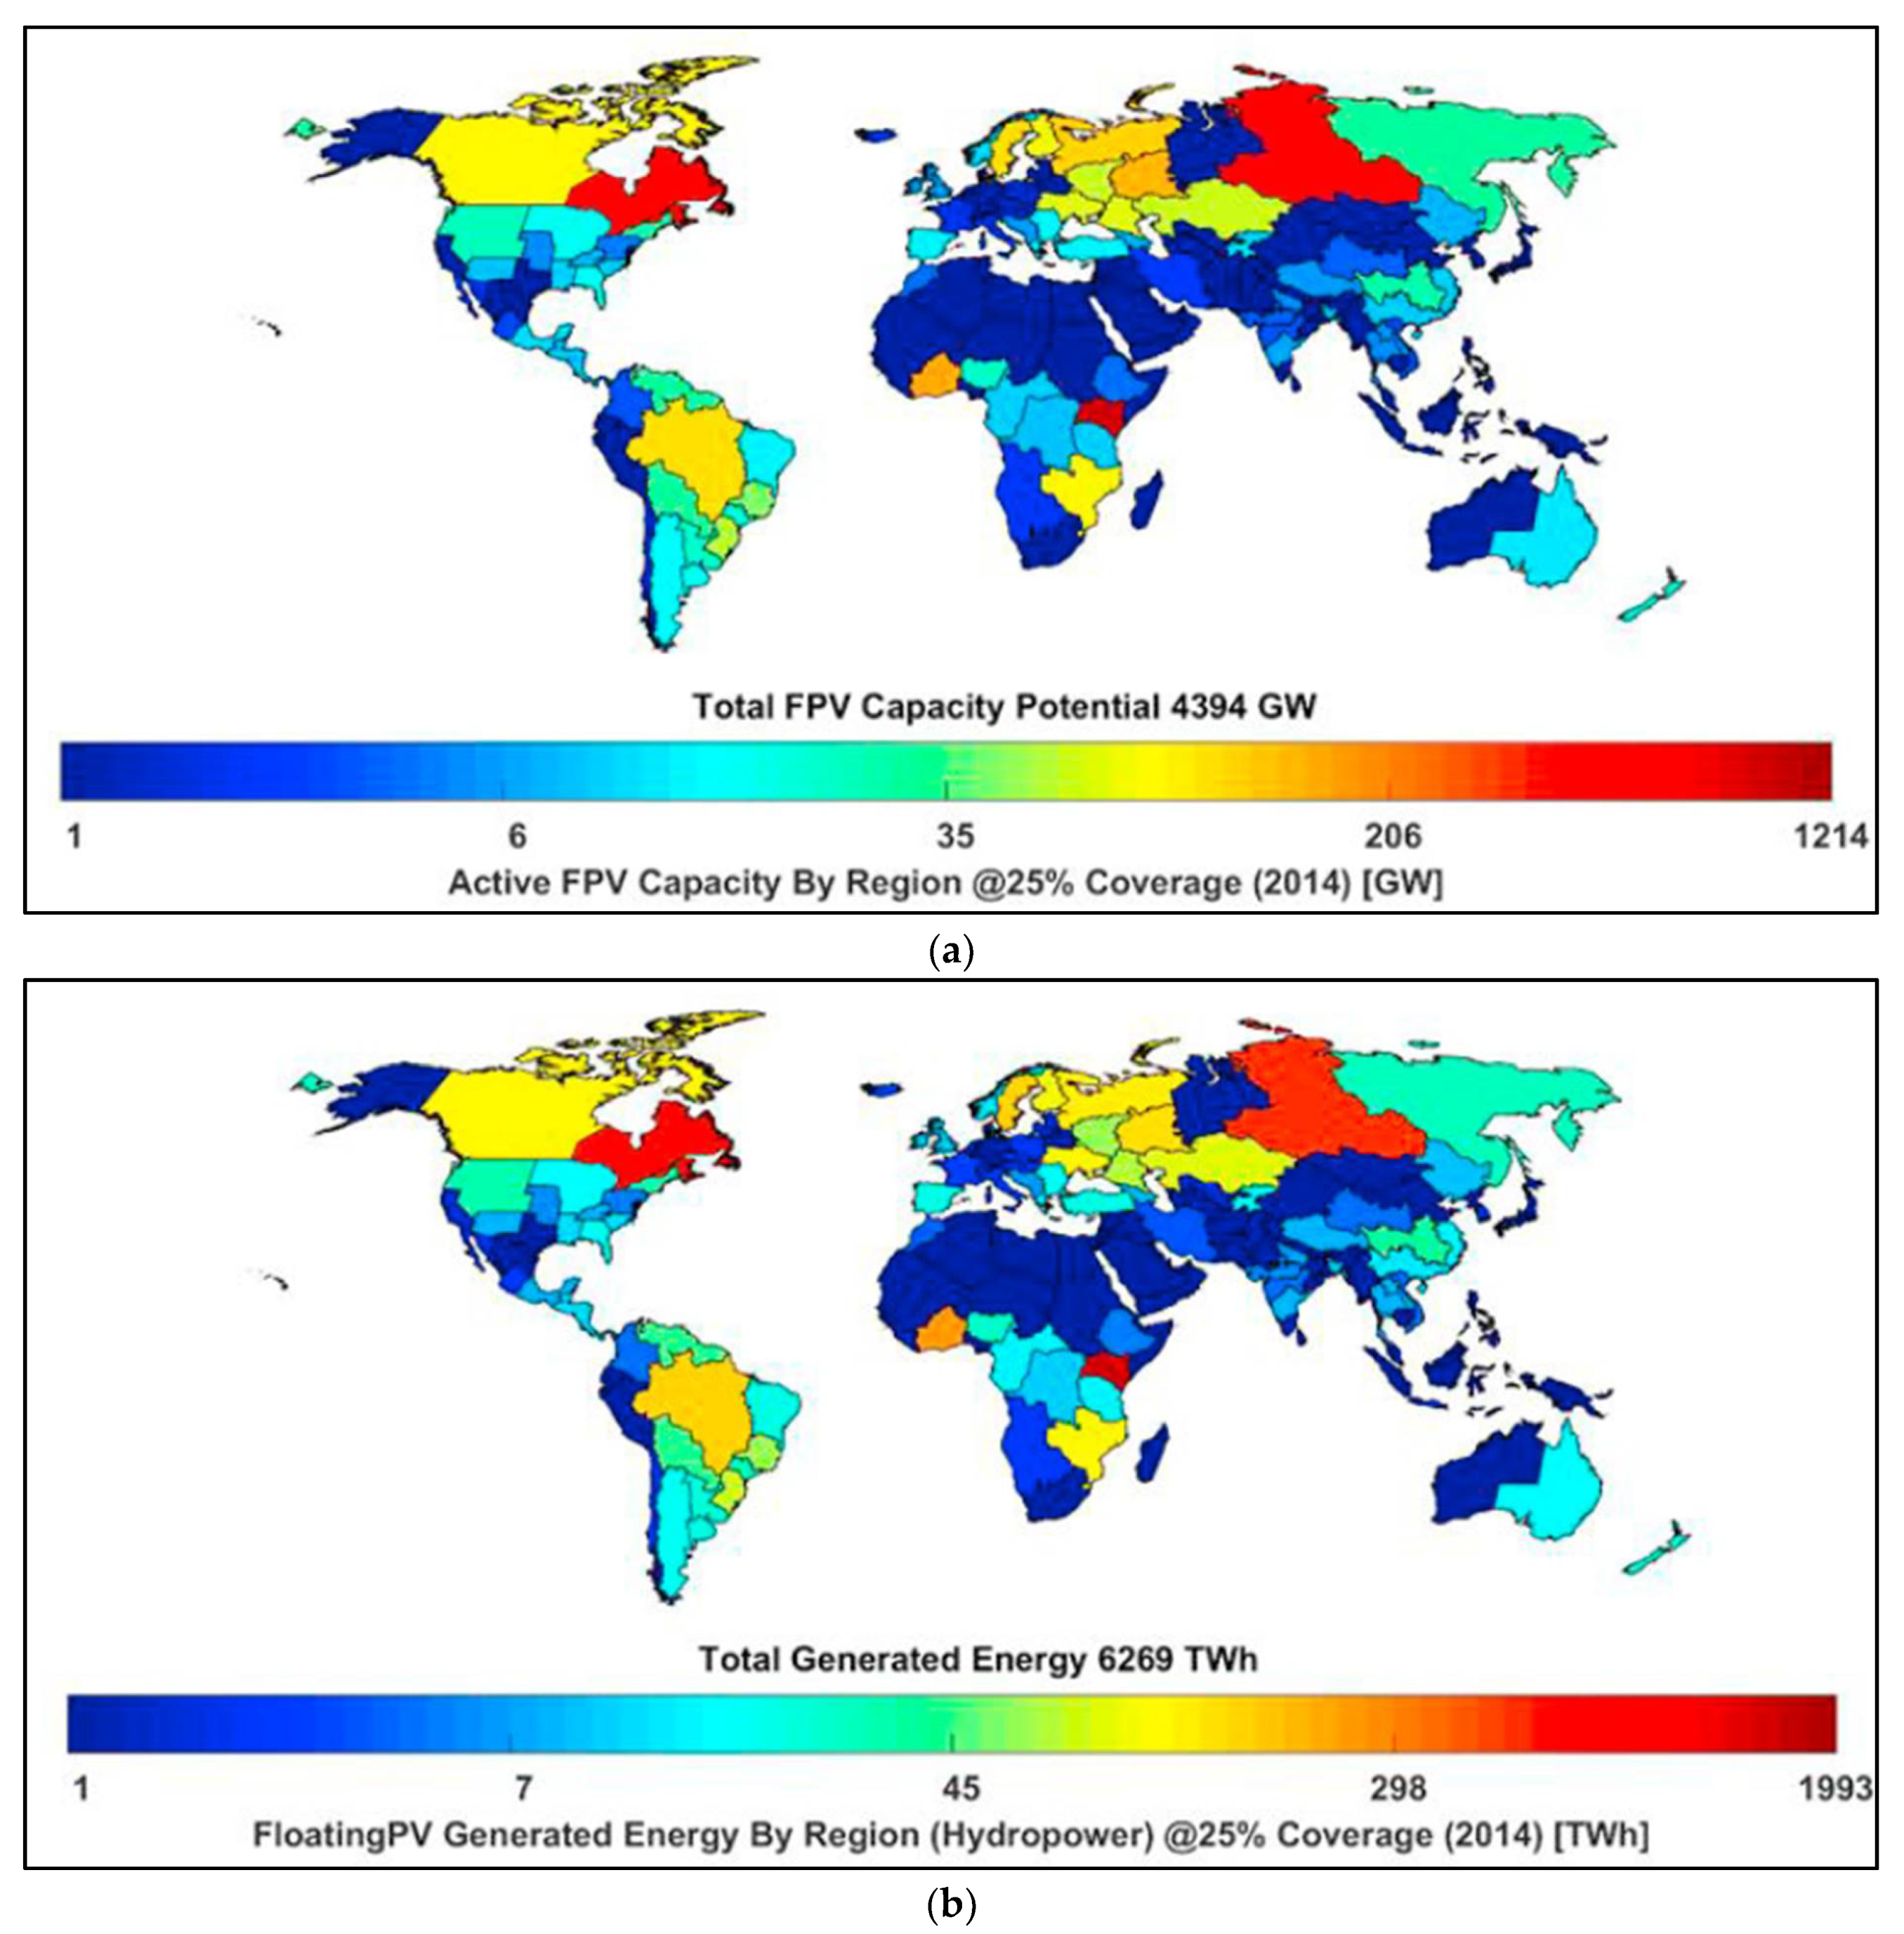
2.1. Overview on FPV and Onshore Wind Potential
2.2. Local Context Perspective
2.3. Role of Renewable-Energy Hybrid Systems in Energy Transition (Climate Mitigation and Dispatch)
3. Methodology
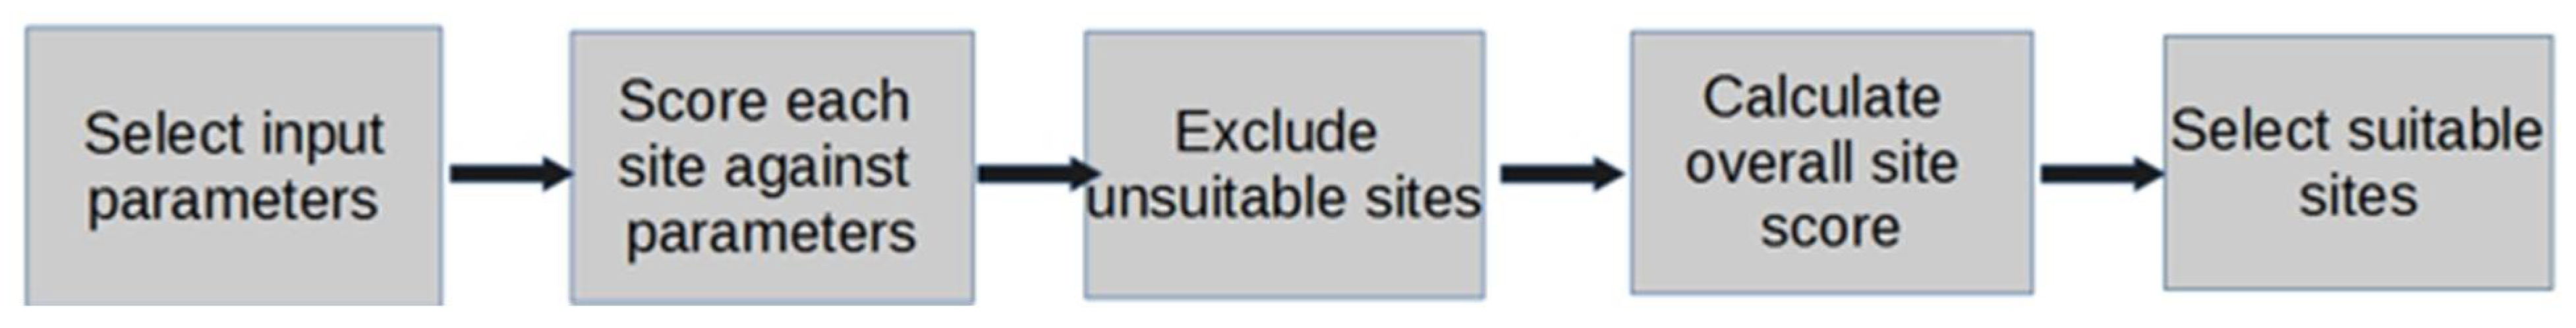
3.1. Site Appraisal and Ranking Methodology
3.1.1. Overview
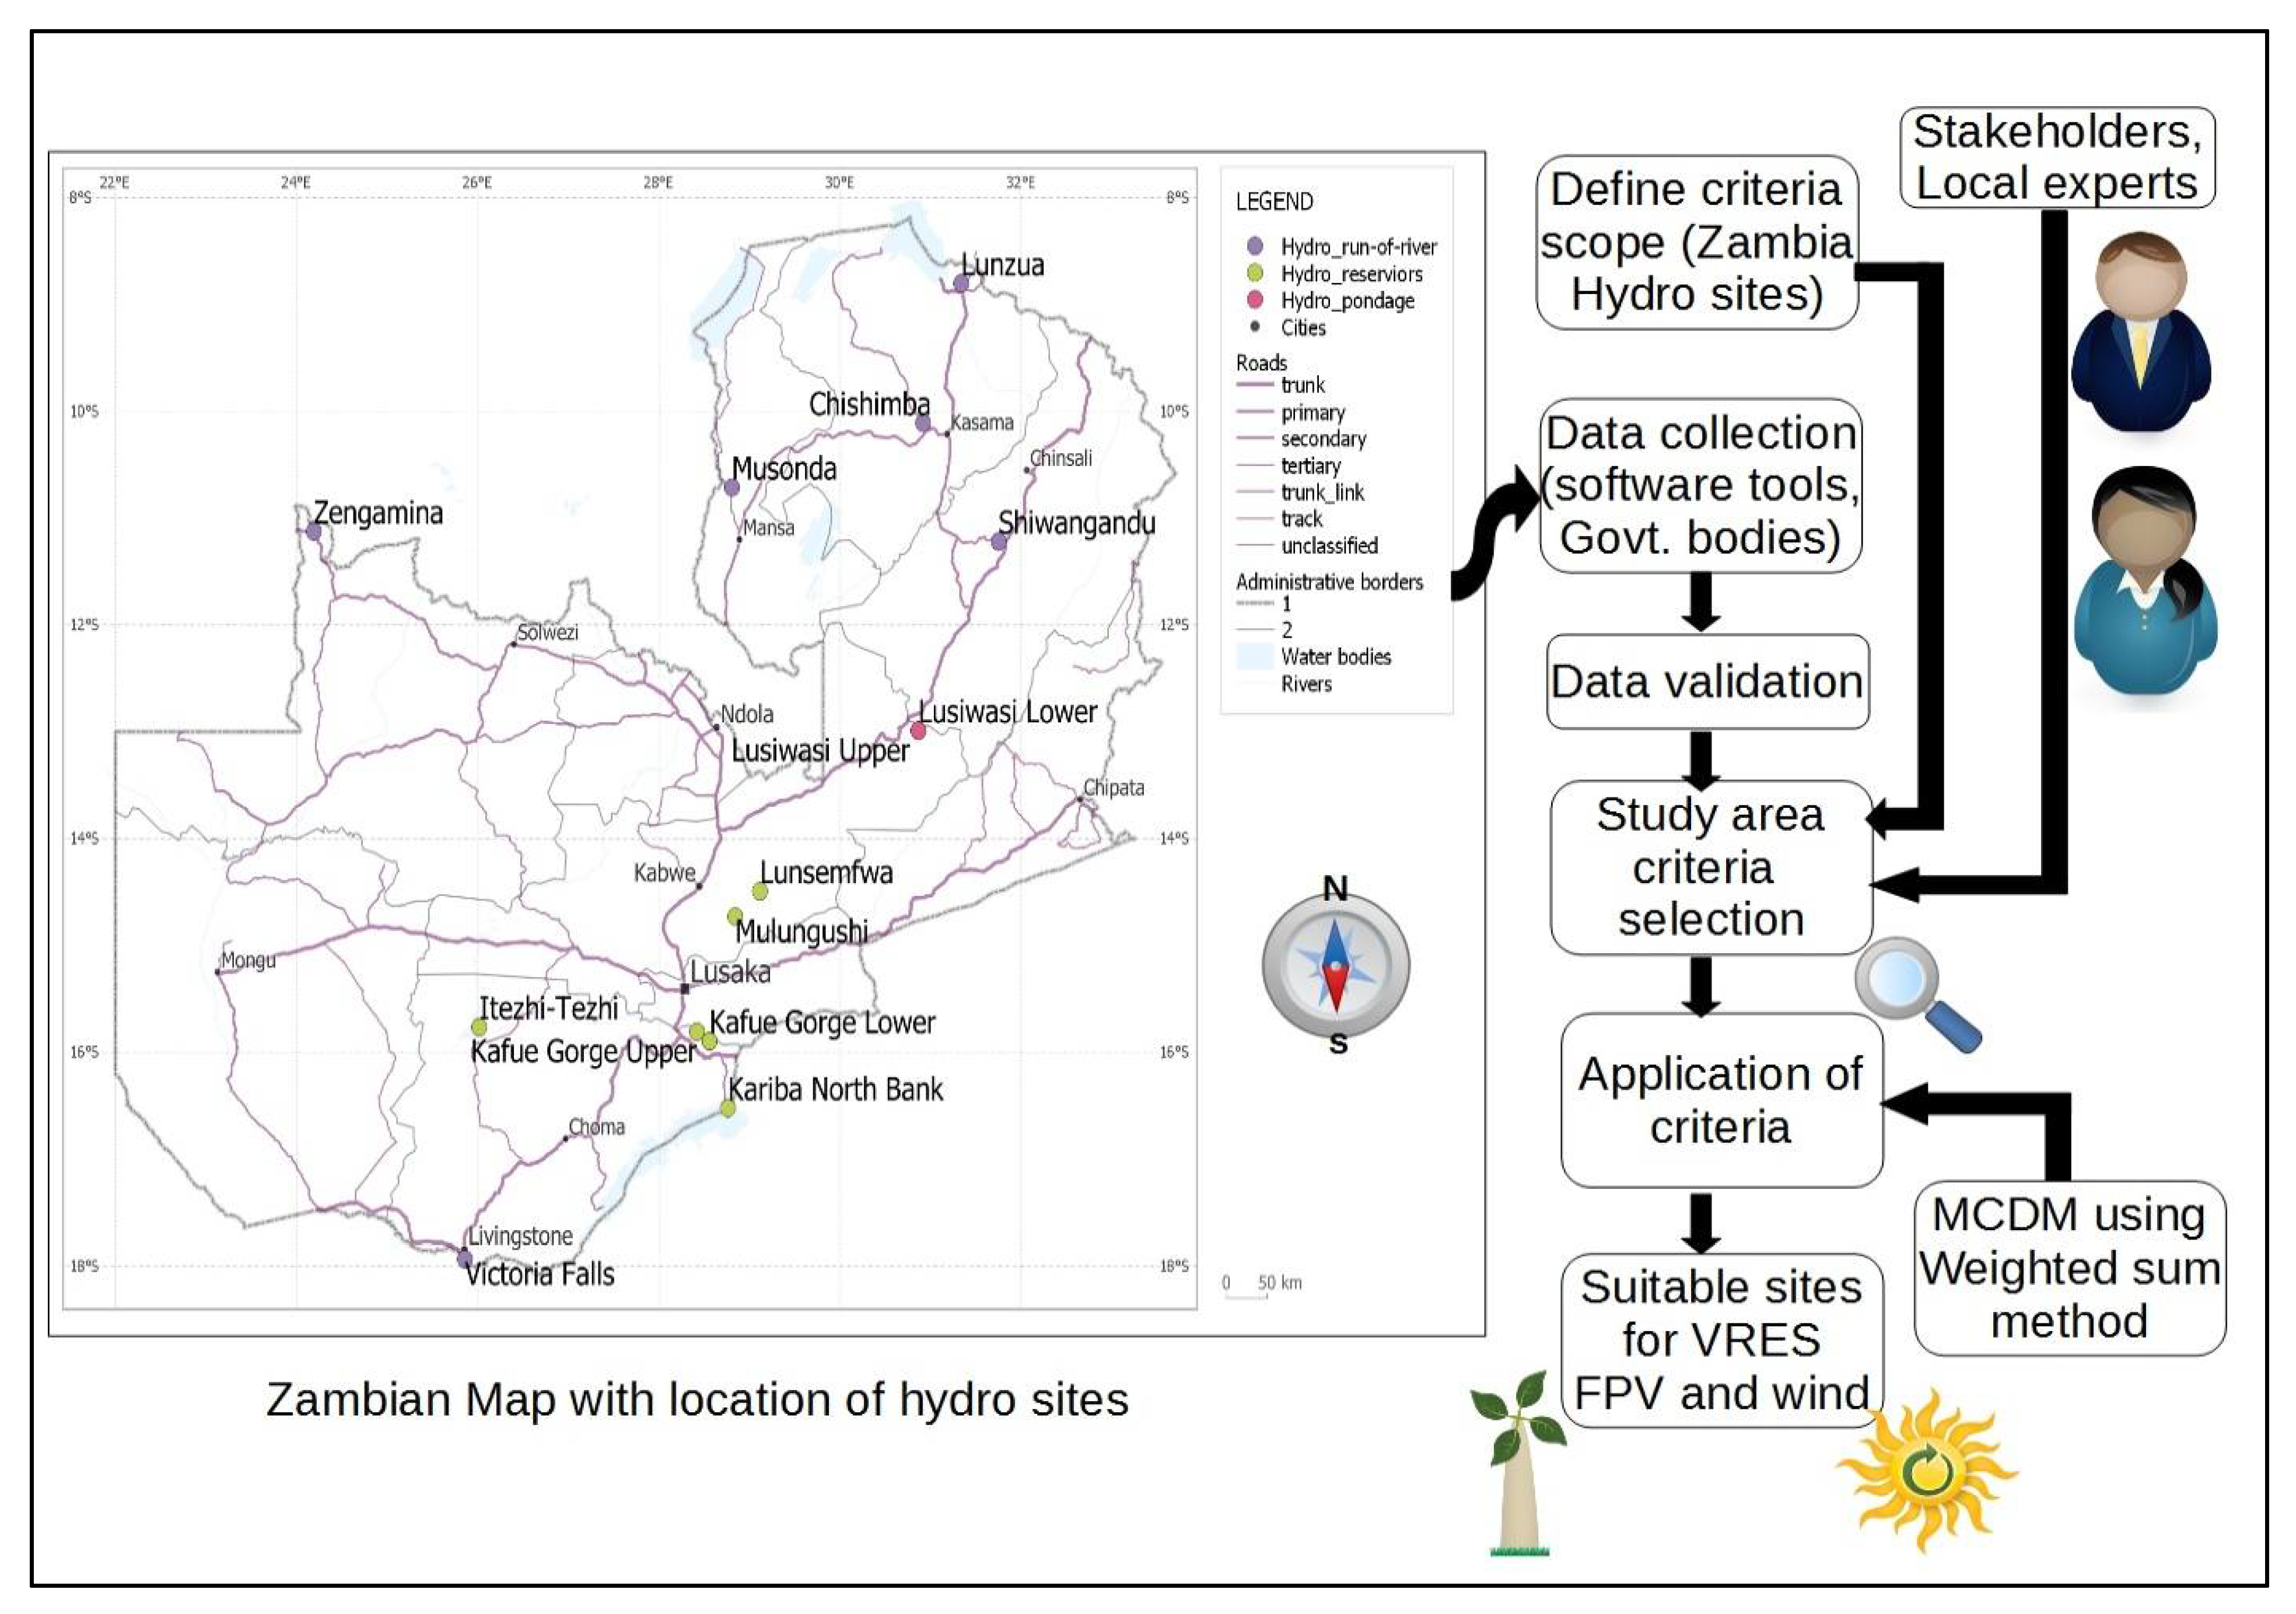
3.1.2. Proposed Study Methodology
3.1.3. Criteria Hierarchy Structure
Optimal FPV Site
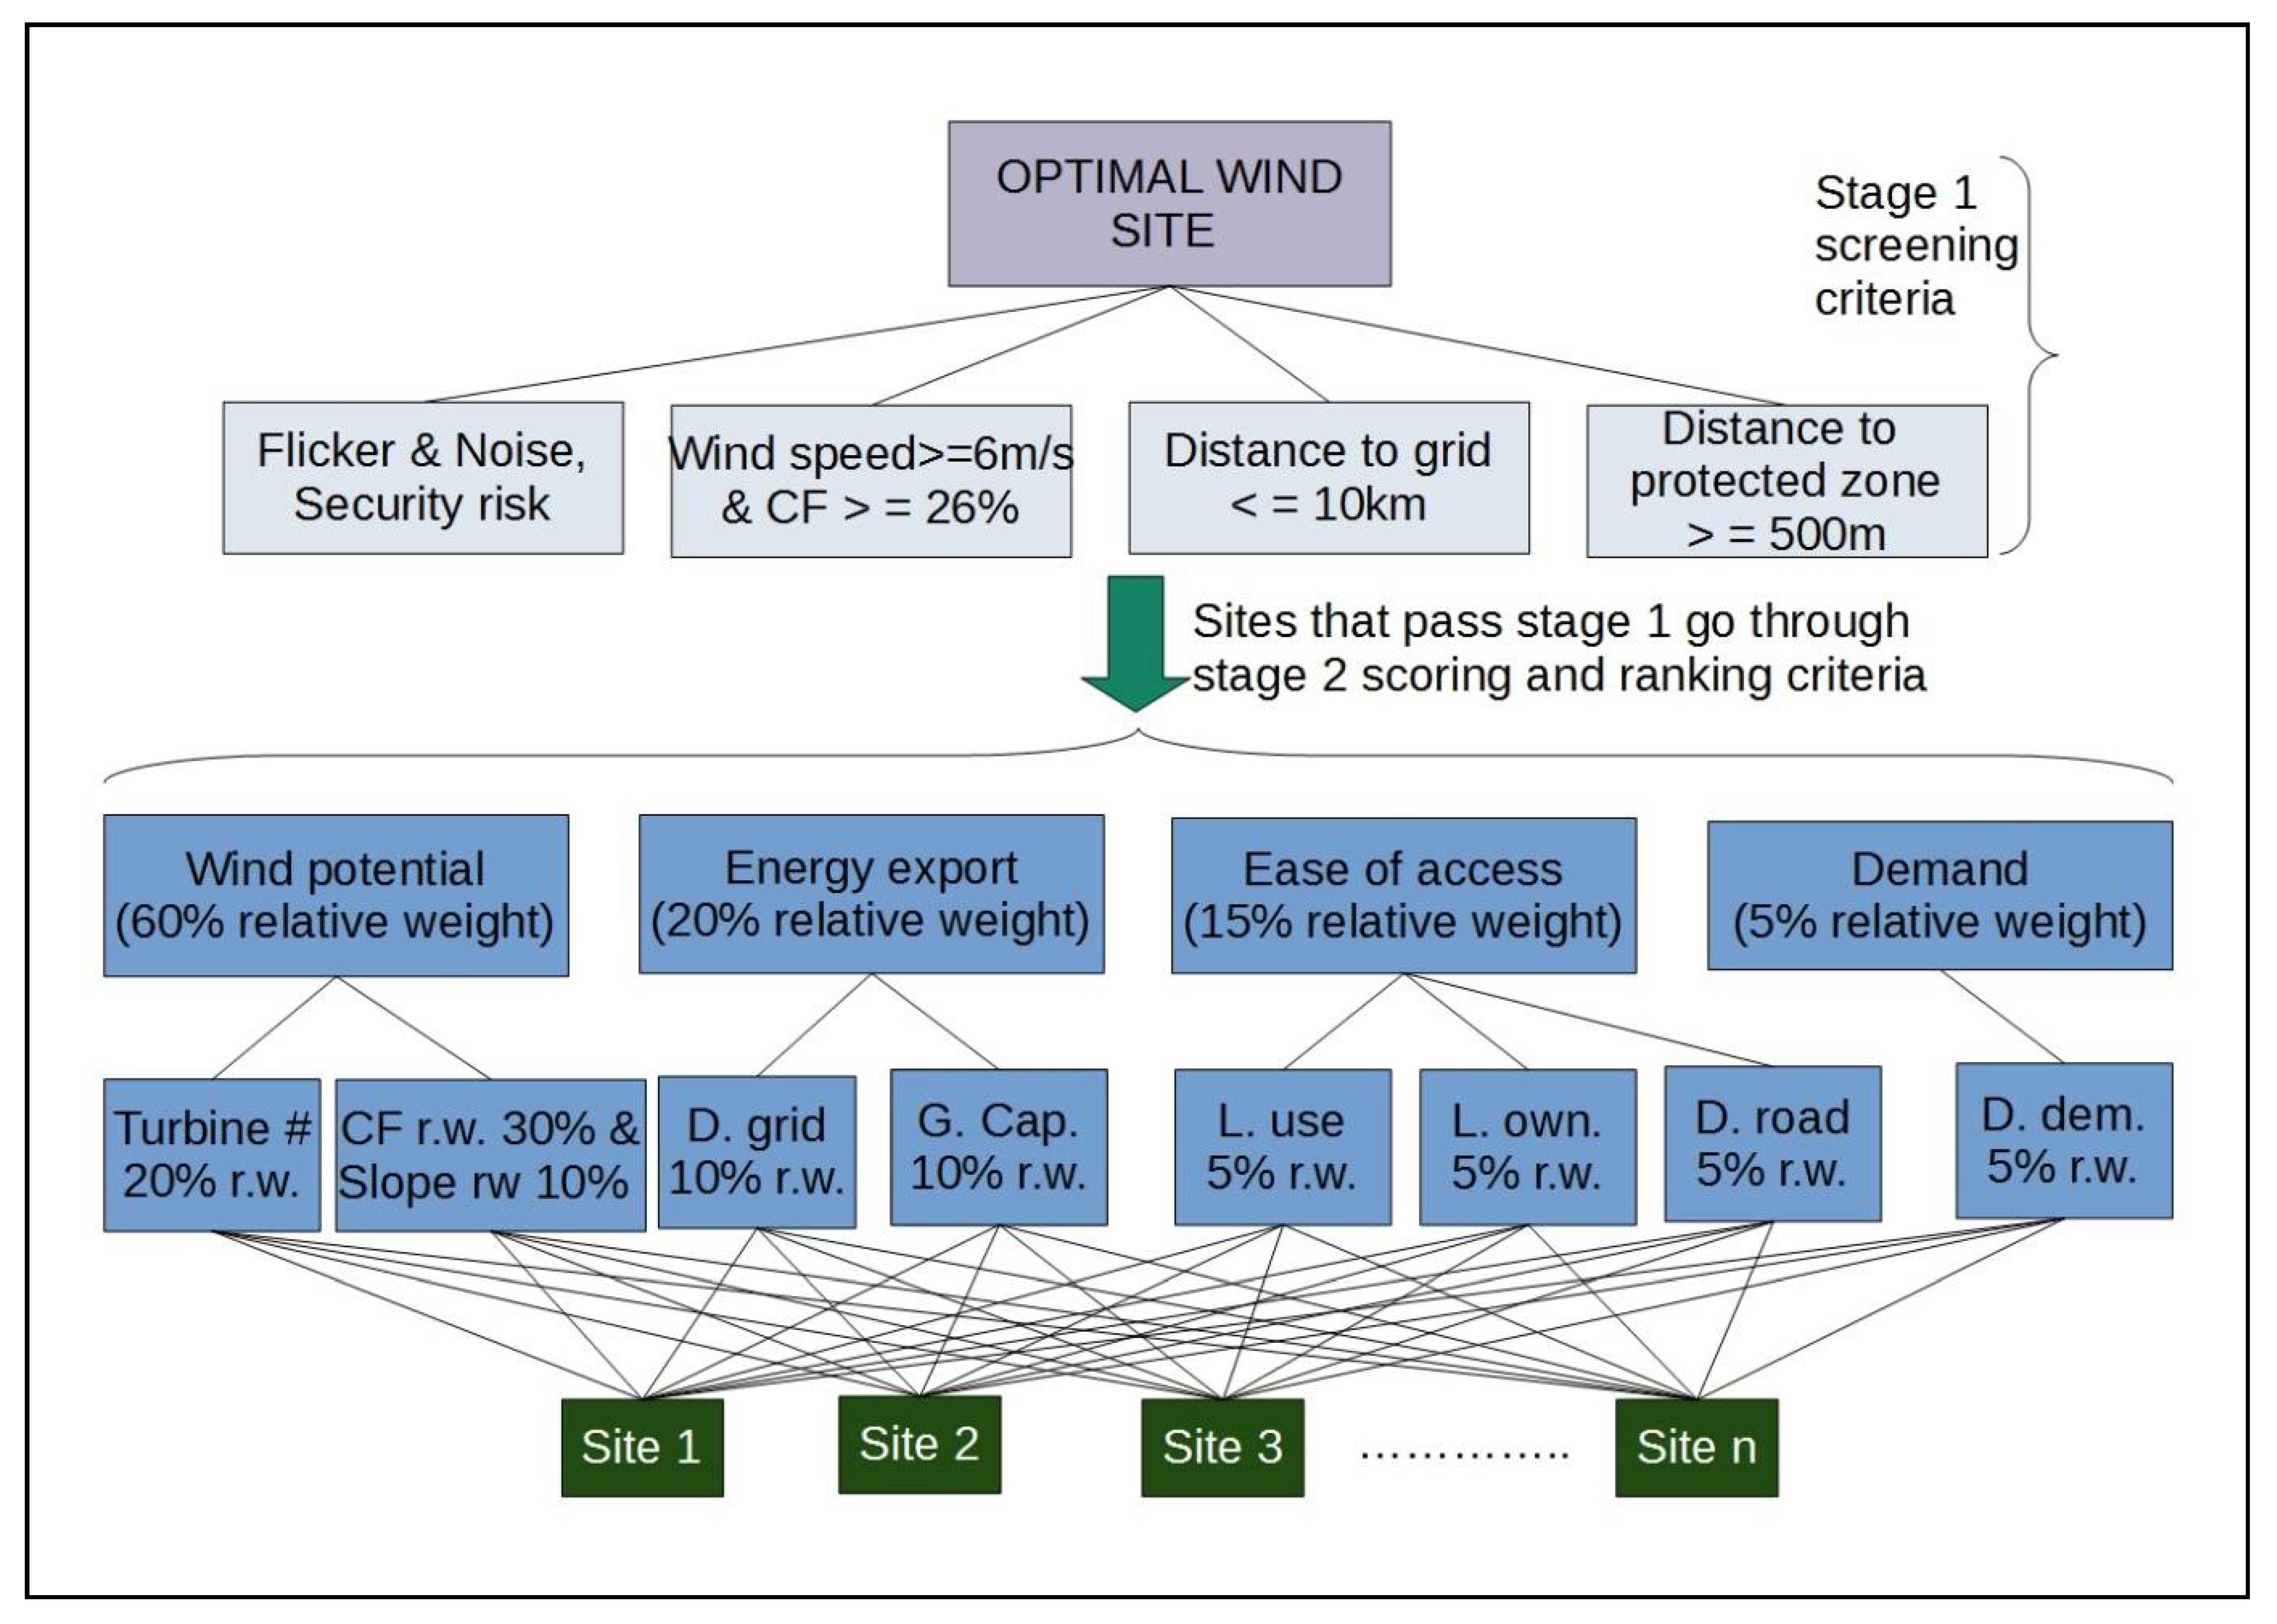
Optimal Wind Site
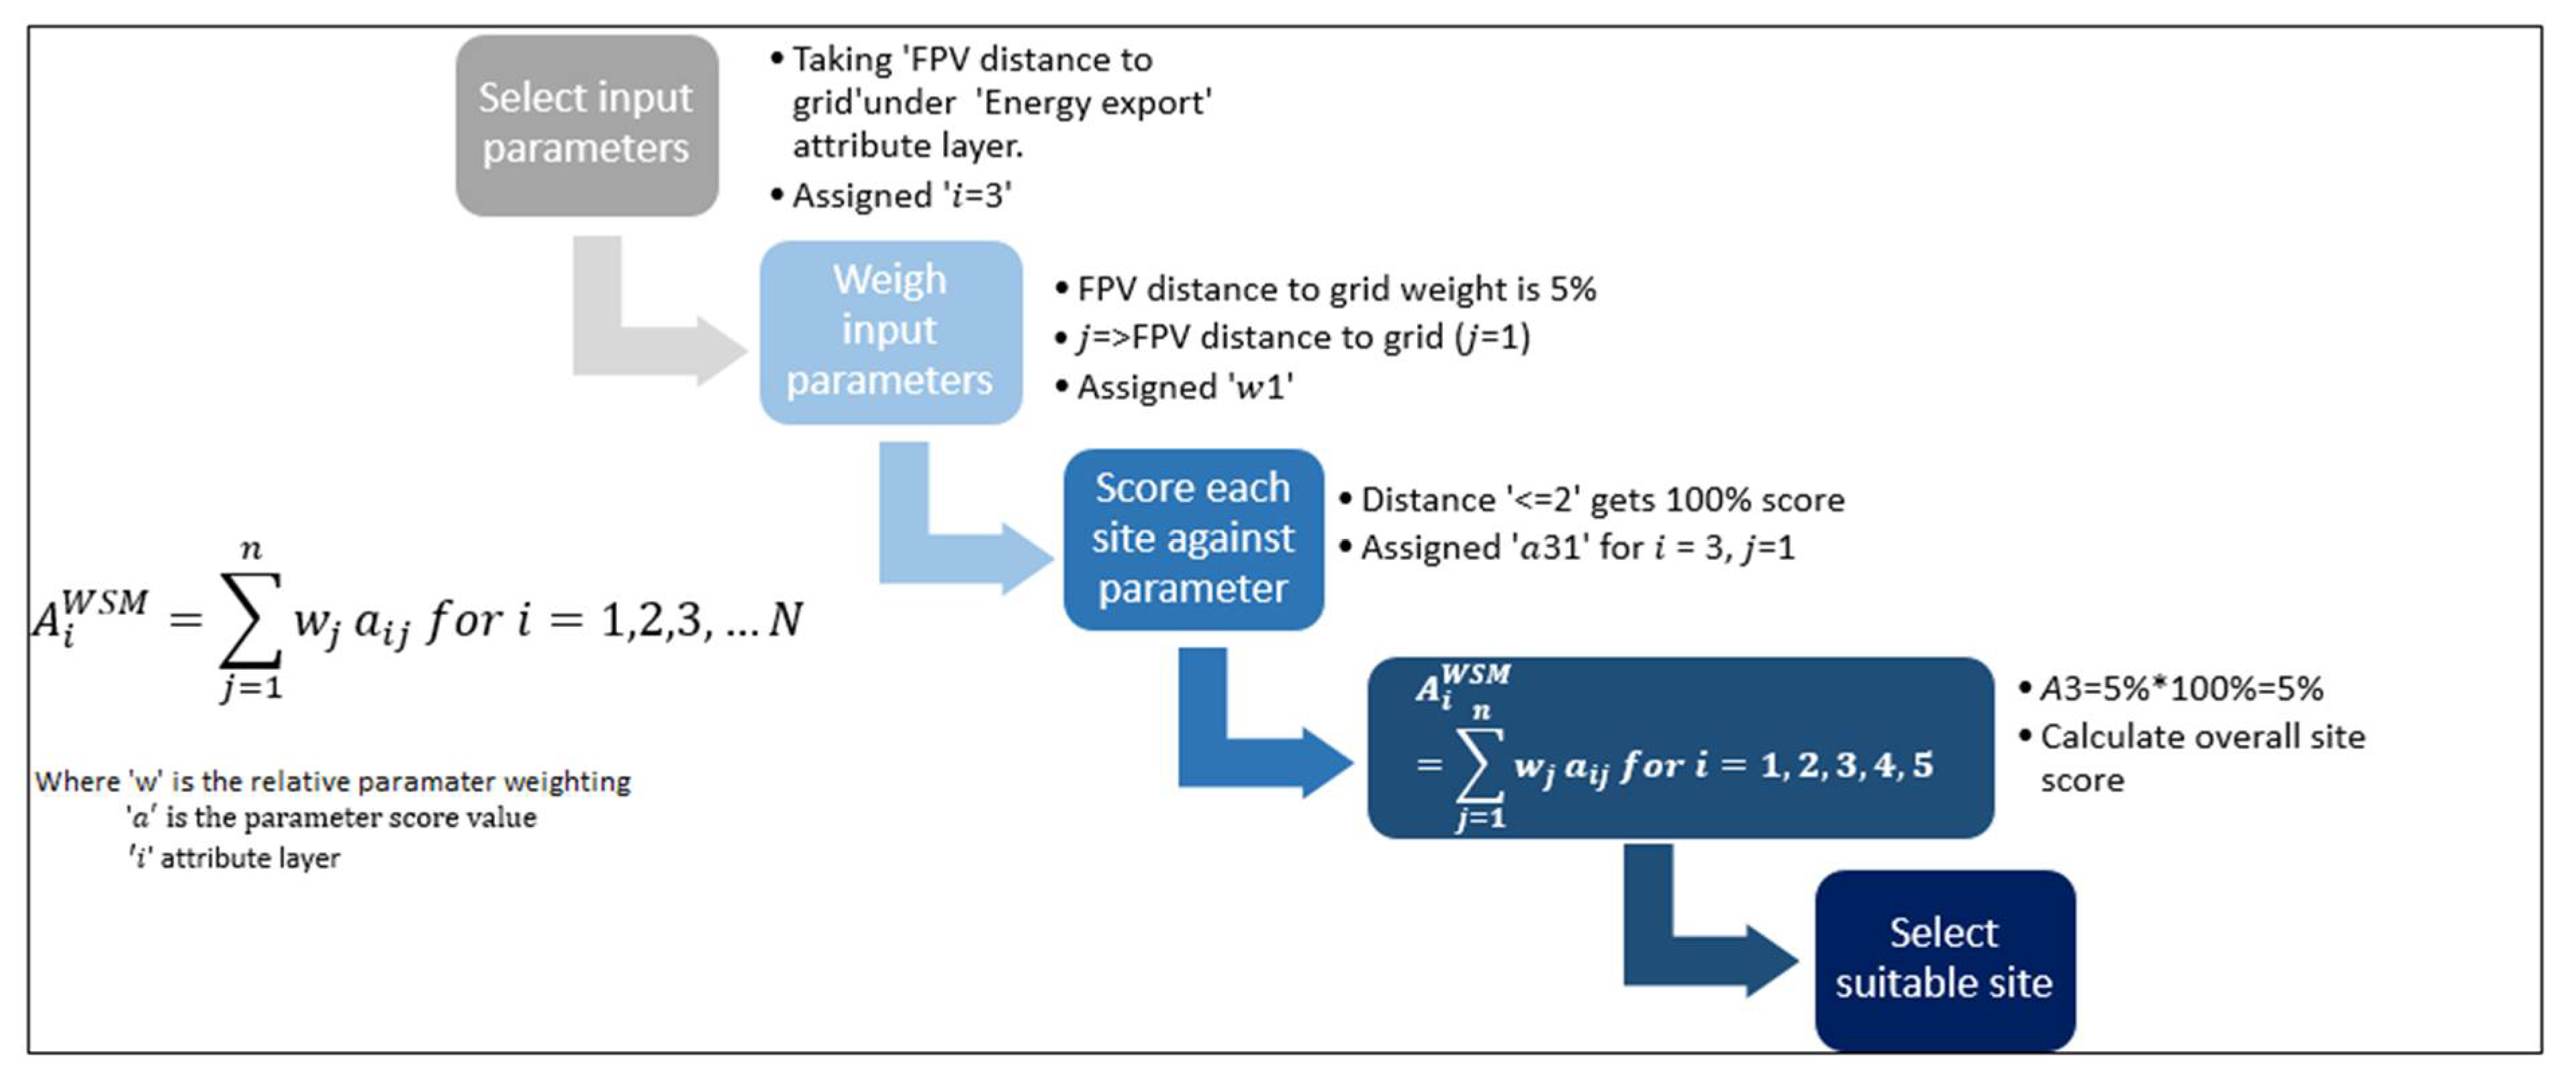
3.1.4. Site Attribute Suitability Score
3.1.5. Methodology Limitations
3.2. Design Scoping Methodology
3.2.1. Design Methodology Formulation
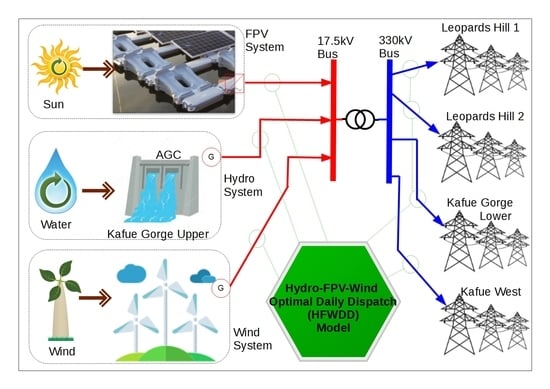
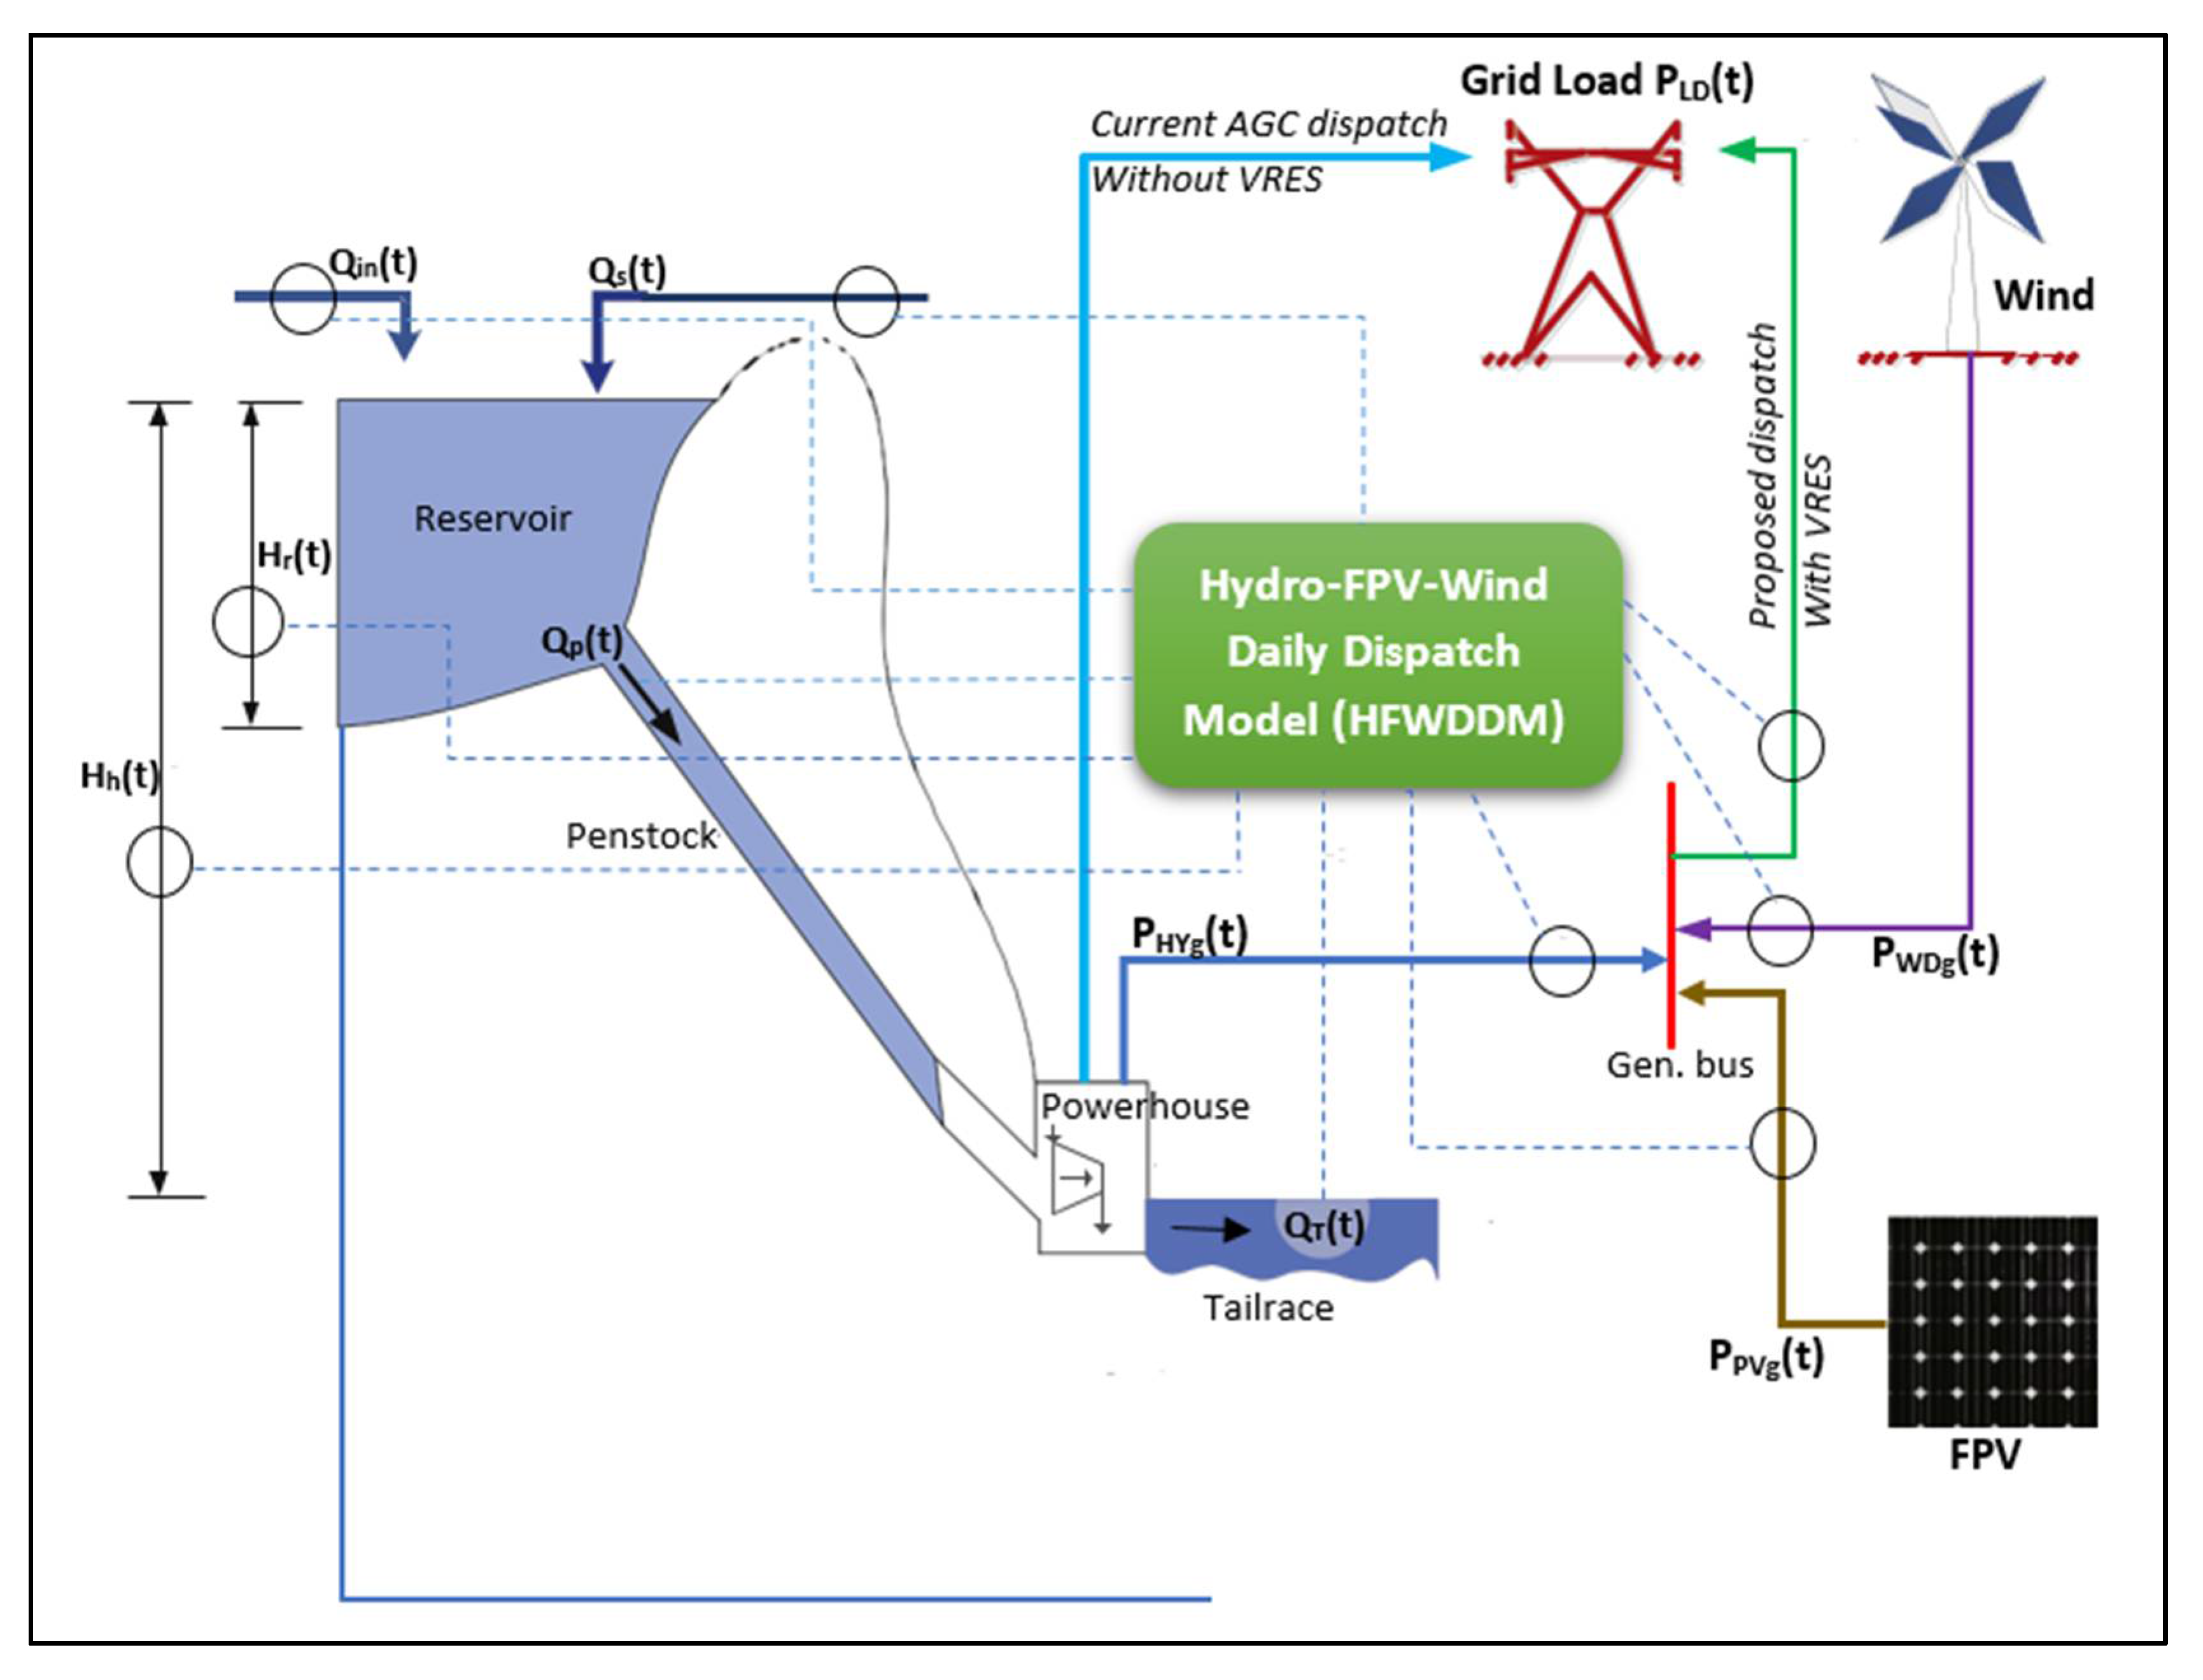
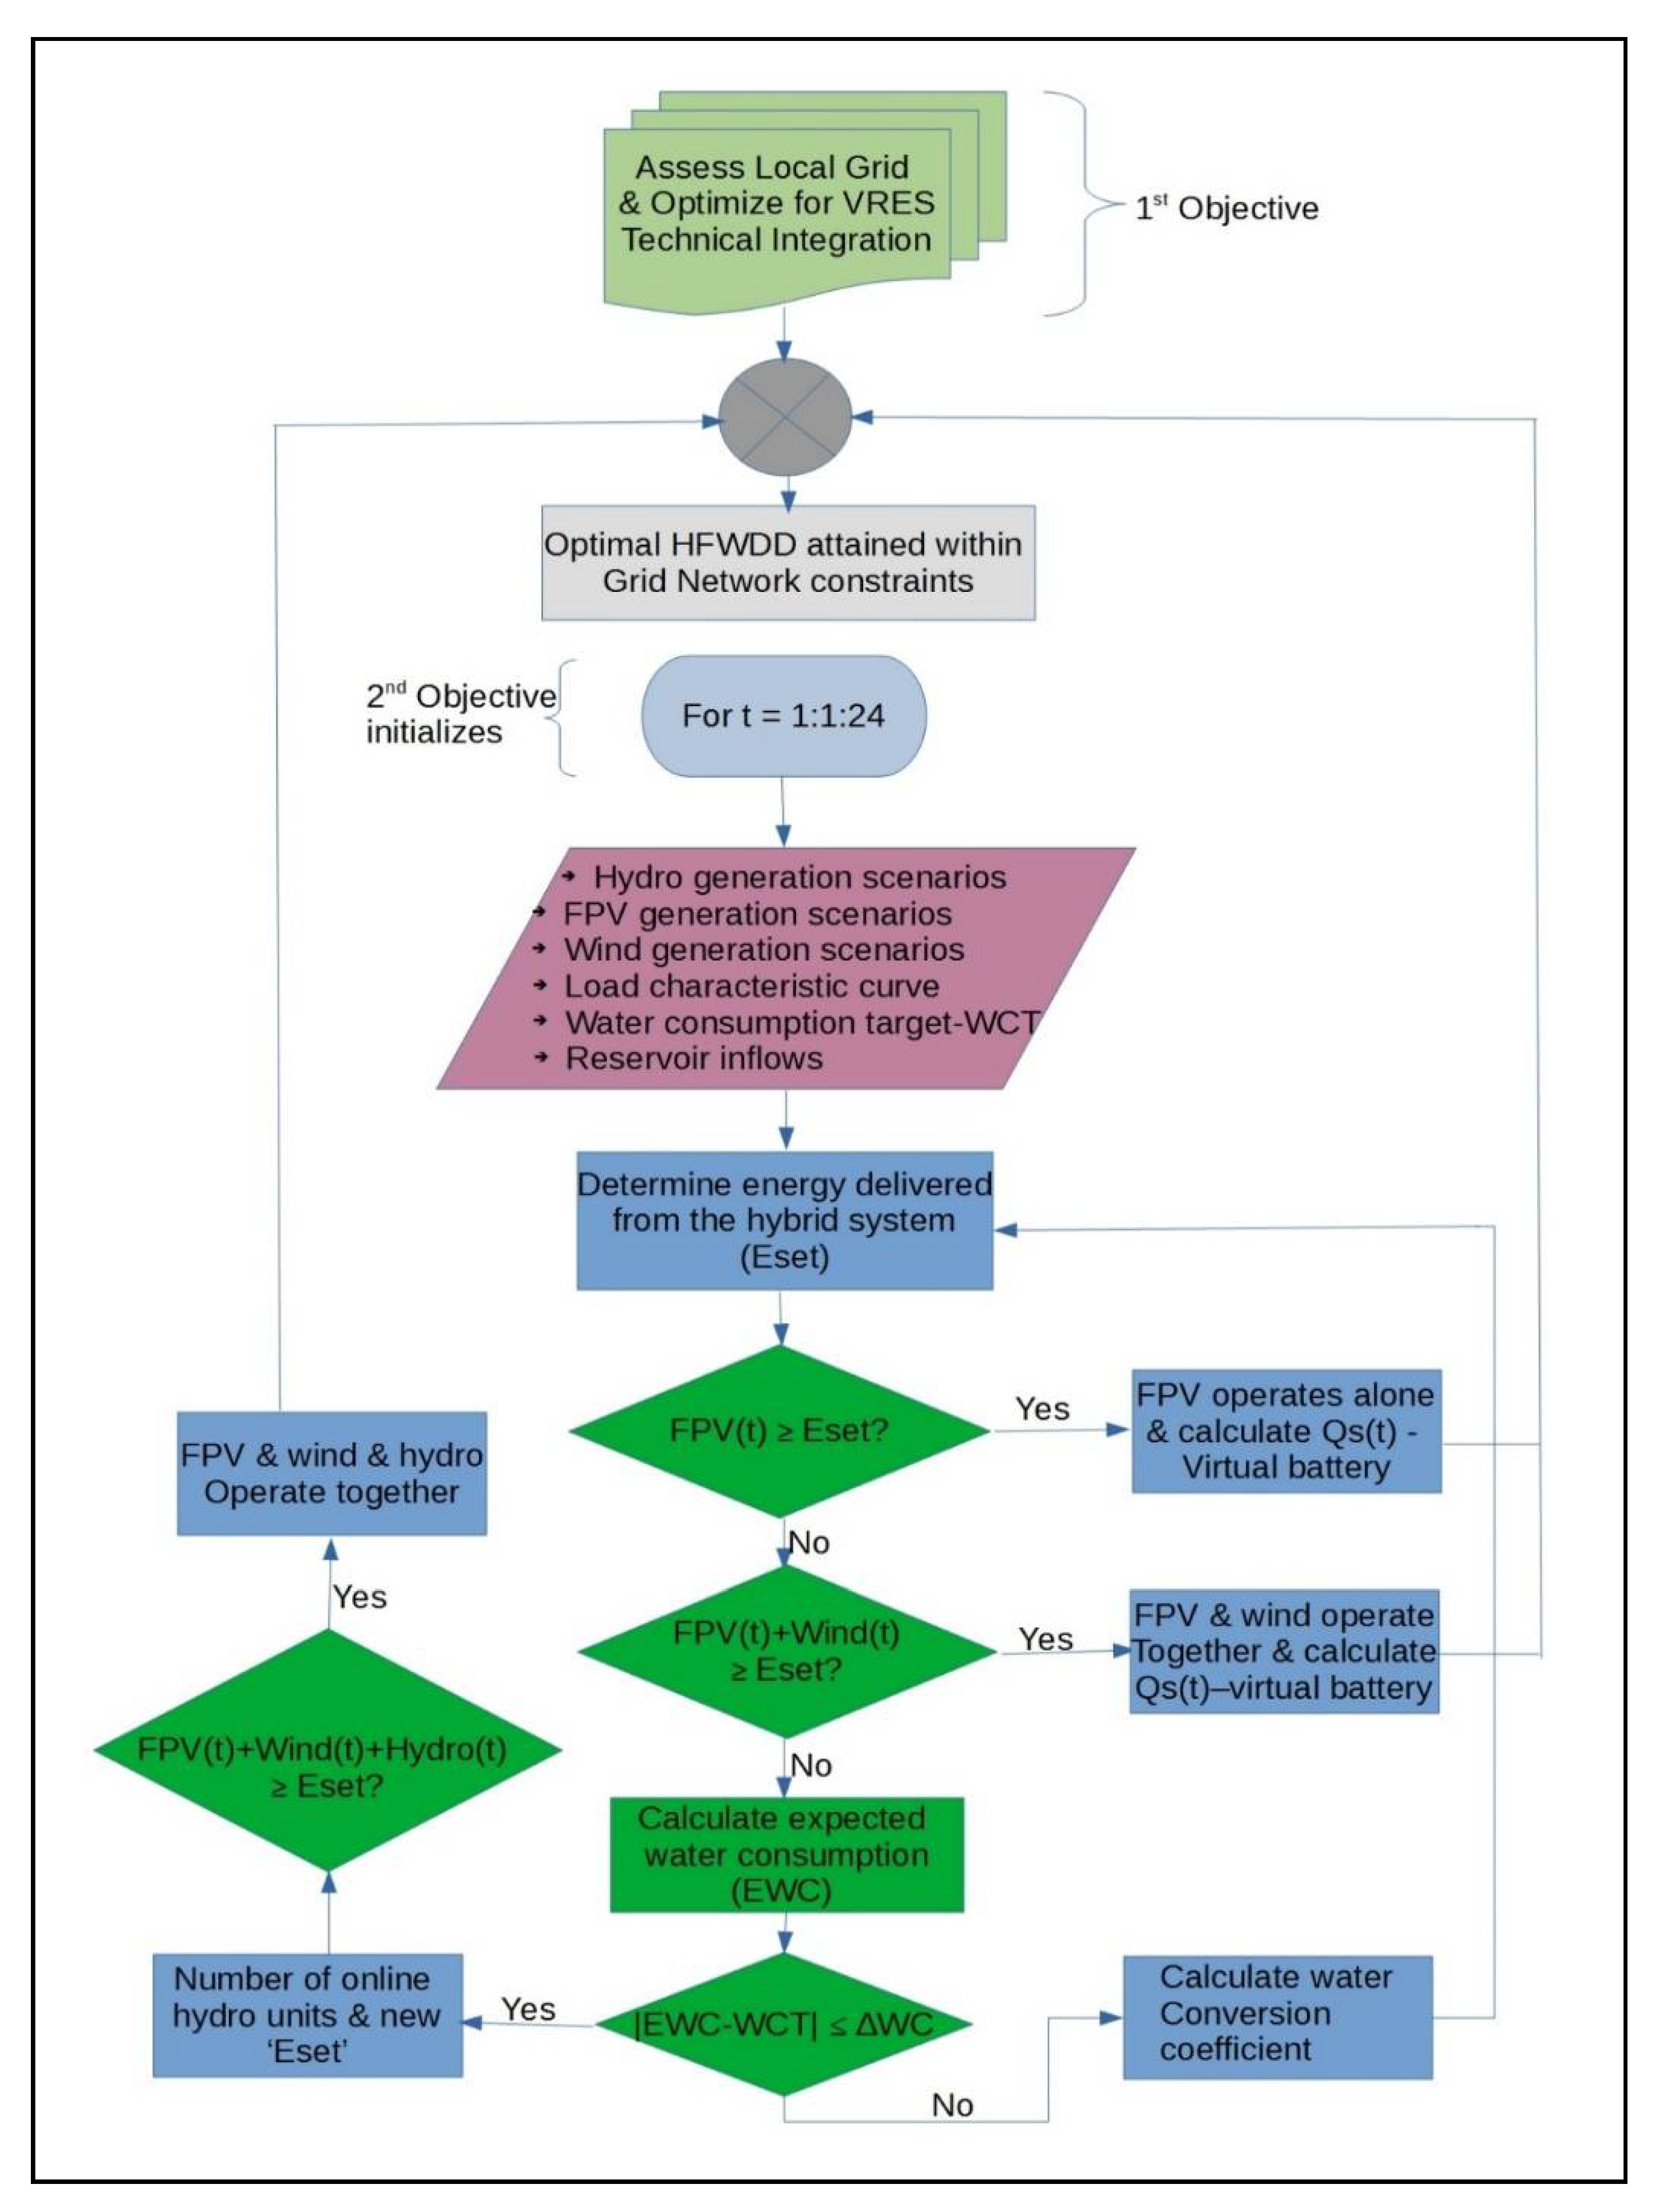
3.2.2. Hydro-FPV-Wind Daily Dispatch (HFWDD) Model
Parameter Uncertainty of VRES
Model Objective Function
HFWDD Model Constraints
- Hydro Constraints:where HYg and HYg are hydro water conversion coefficients, Qs,term and Qs,ini are final and initial storage values of the reservoir, Qmax and Qmin are the upper and lower reservoir storage limit at time “t”, QHYg,t is the water consumption at any time “t” of the hydro unit, PHYg,t is the power output of the hydro unit at time “t”, Qin,t is the inflow of reservoir at time “t”; Qs,t is the hydro reservoir storage at time “t”, QHYg,t(curt) is the curtailment of the reservoir water, and Vflow(max) and Vflow(min) are the water consumption upper and lower limits in a given period.
- Power Flow Branch Constraints:where Sb(max) is the branch maximum capacity, “i” is the power system node identifier, “b” is the branch identifier, Ni is the number of system network nodes in total, Pi,t is the net active power injected into the ith node. fbi is the sensitivity factor of the bth node.
- Power Balance Constraints:where PLD,t is the grid load of the system at any given time “t”.
- Onshore Wind Power Constraints:where PWDg,t is the variable wind generator power output at time “t”.
- Floating PV Power Constraints:where PPVg,t the variable FPV power output at time “t”.
4. Results and Discussions
4.1. Application of Appraisal and Ranking Methodology
4.1.1. Stage 1—Site Screening
4.1.2. Stage 2—Ranking and Scoring
4.2. Application of Design Scoping Methodology—Kafue Gorge Upper Case Study
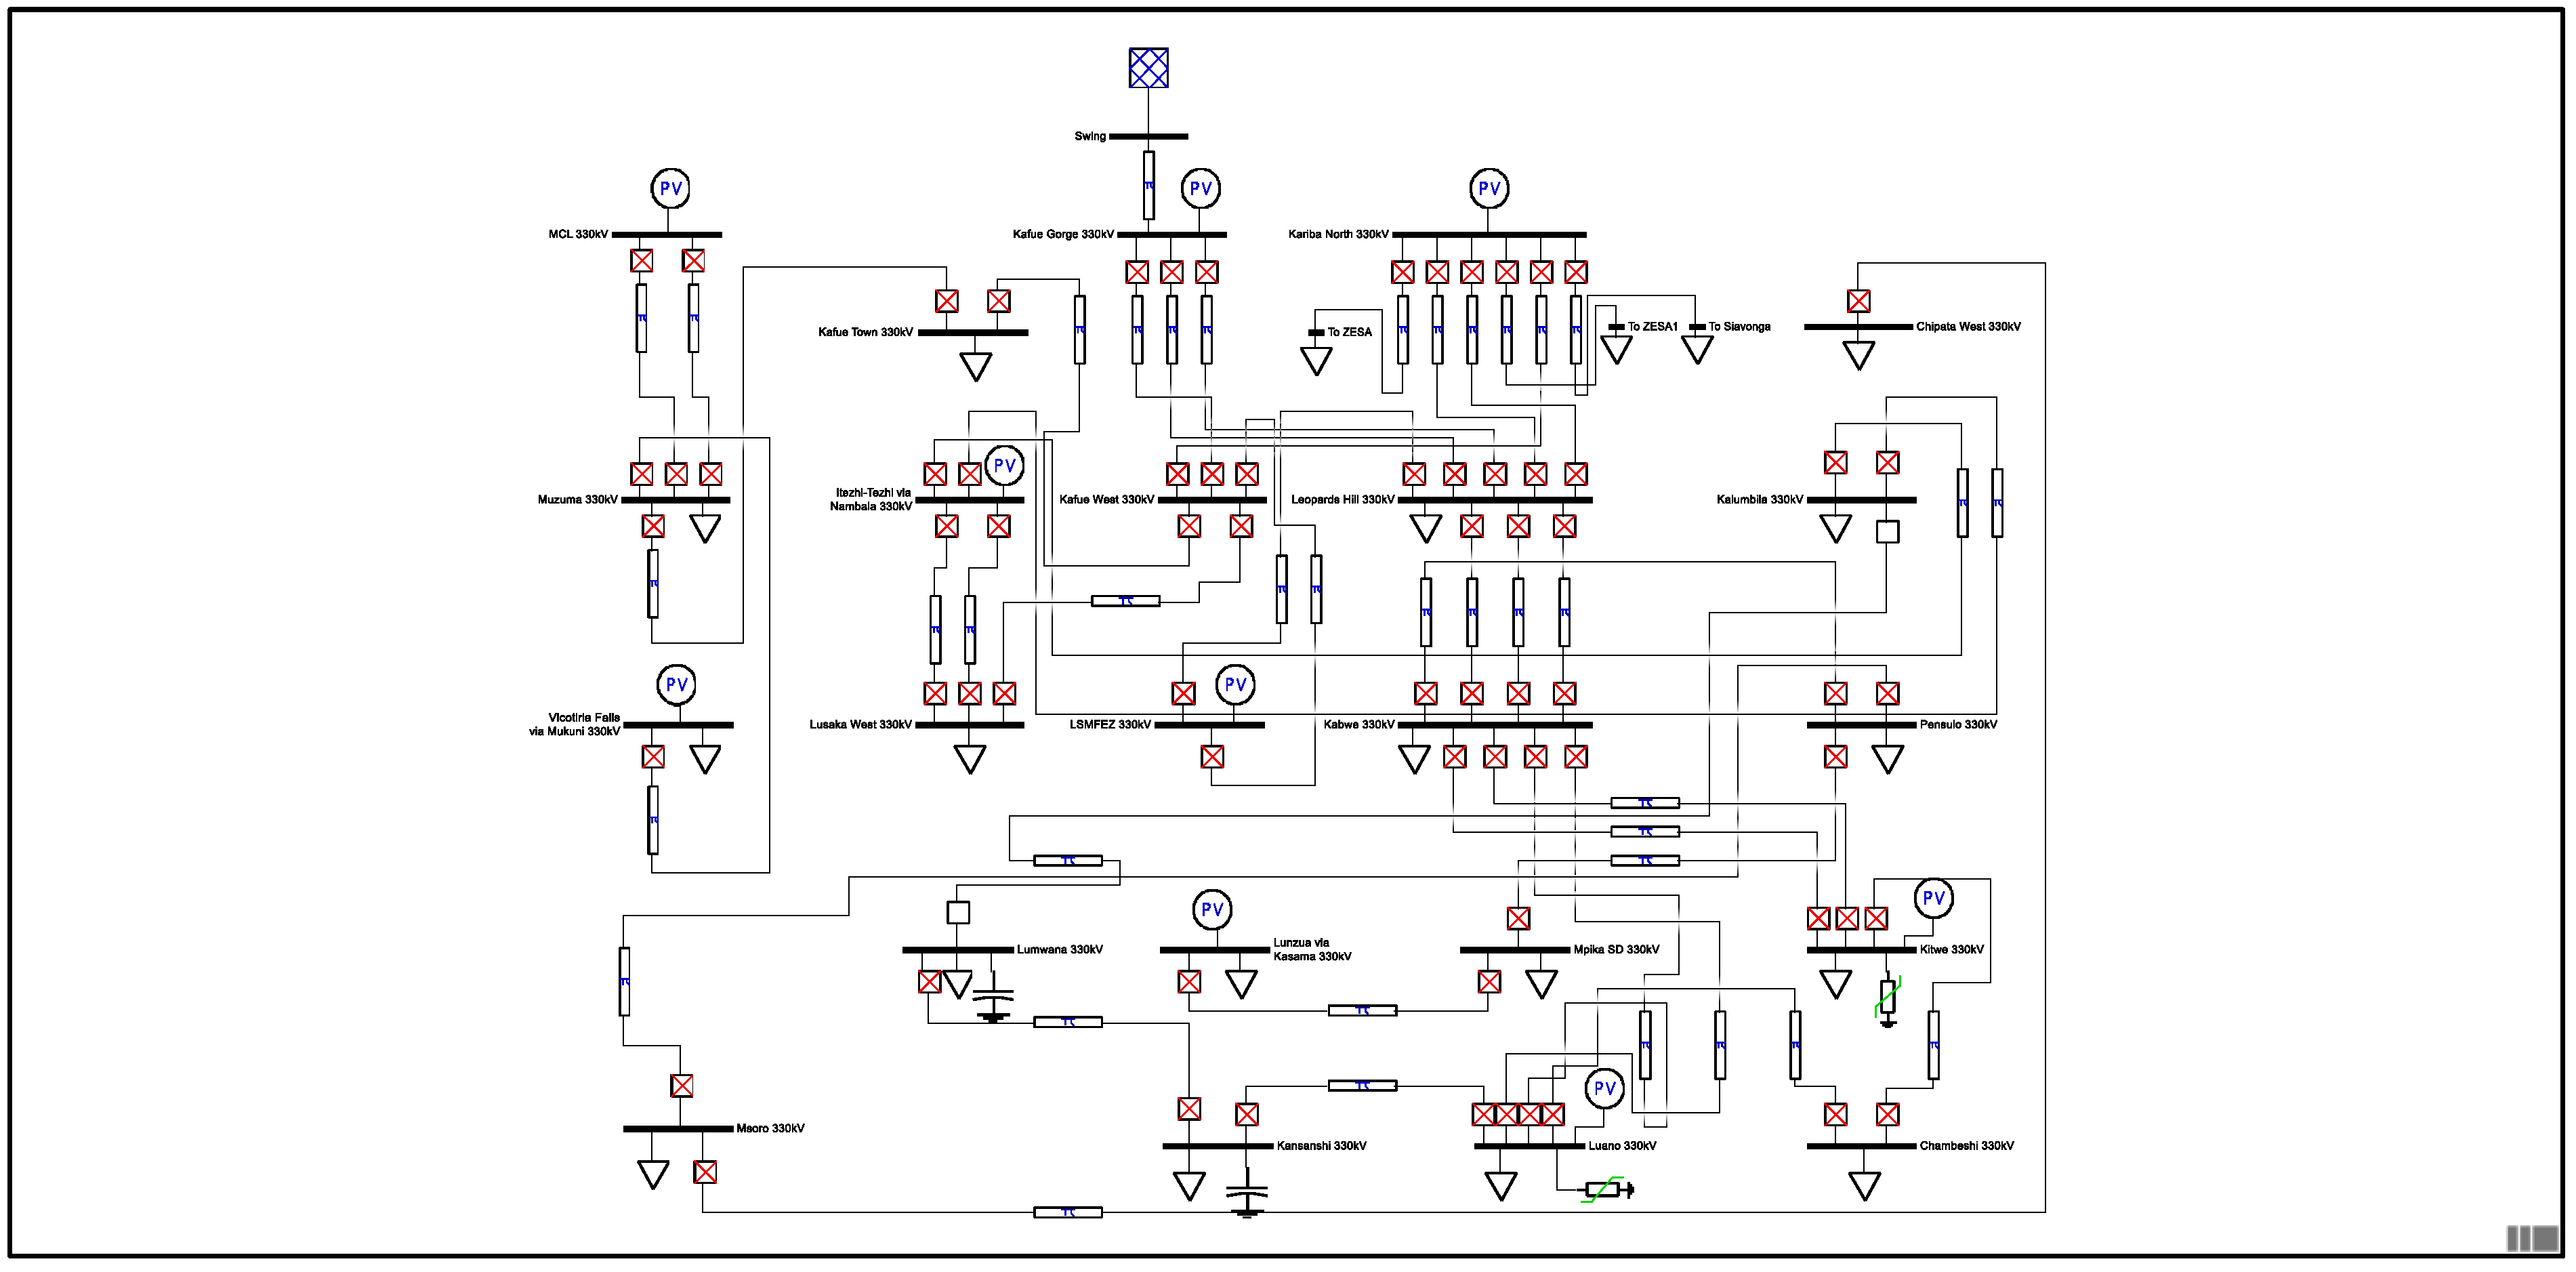
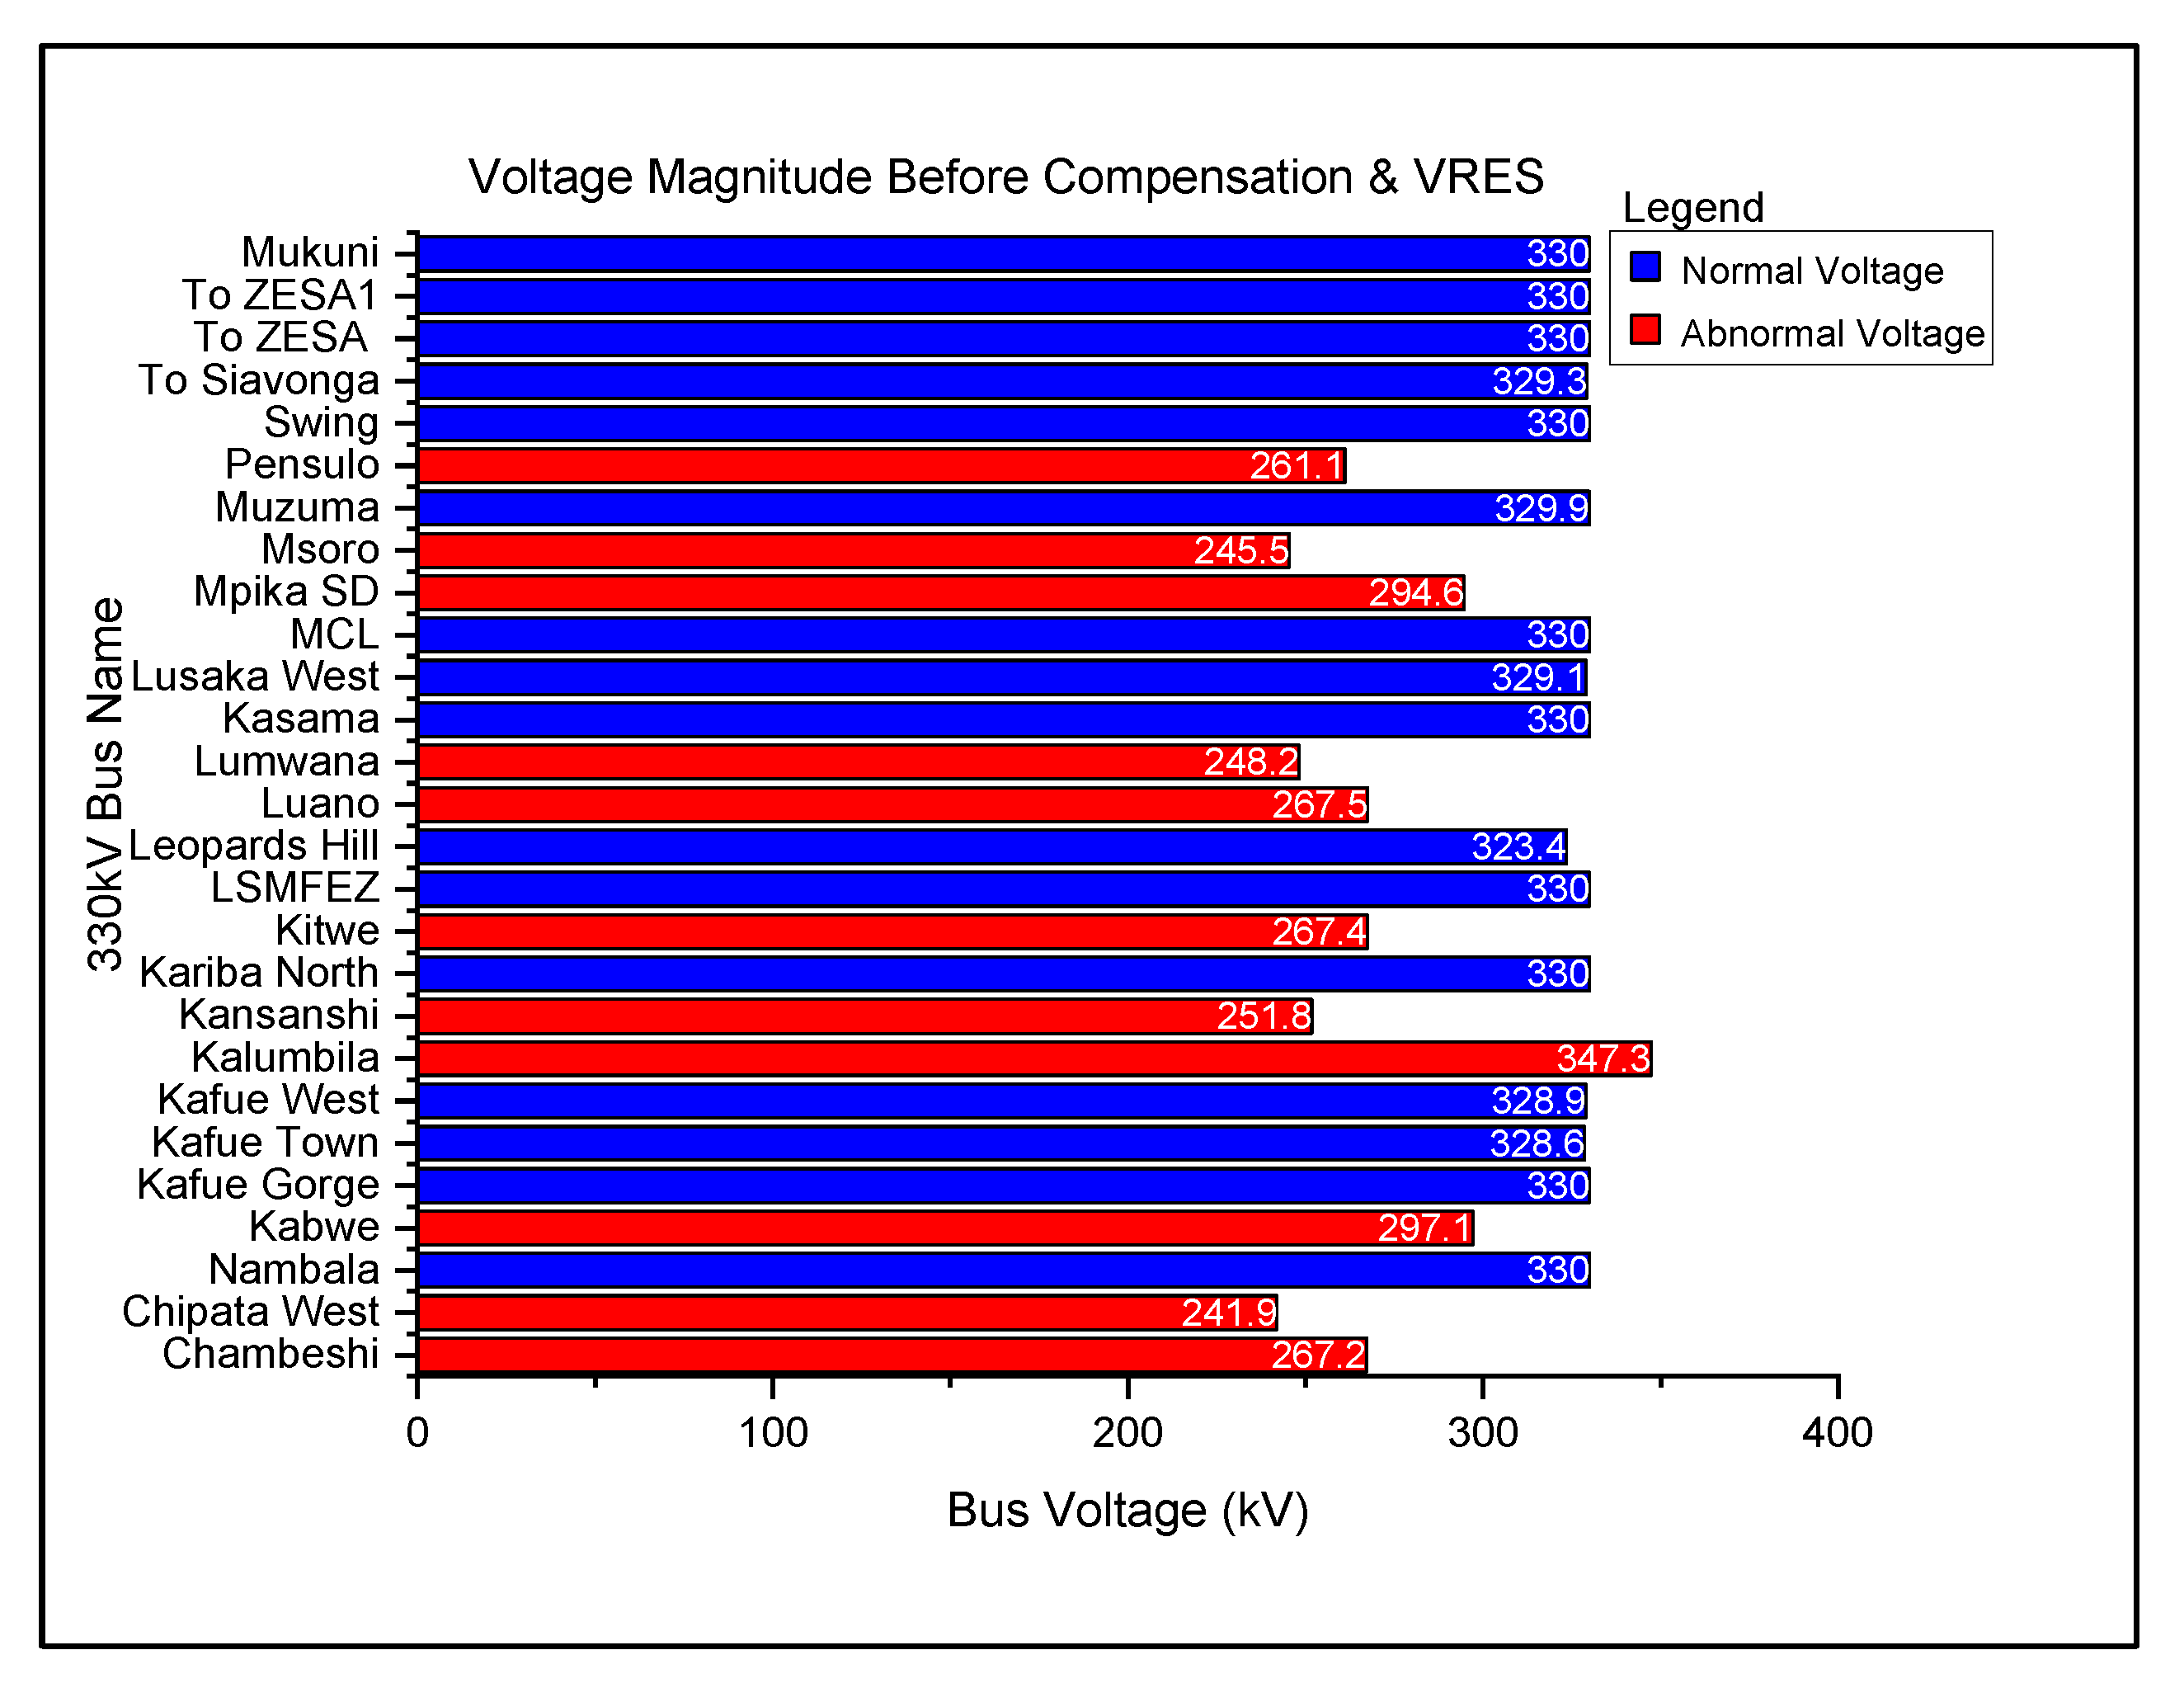
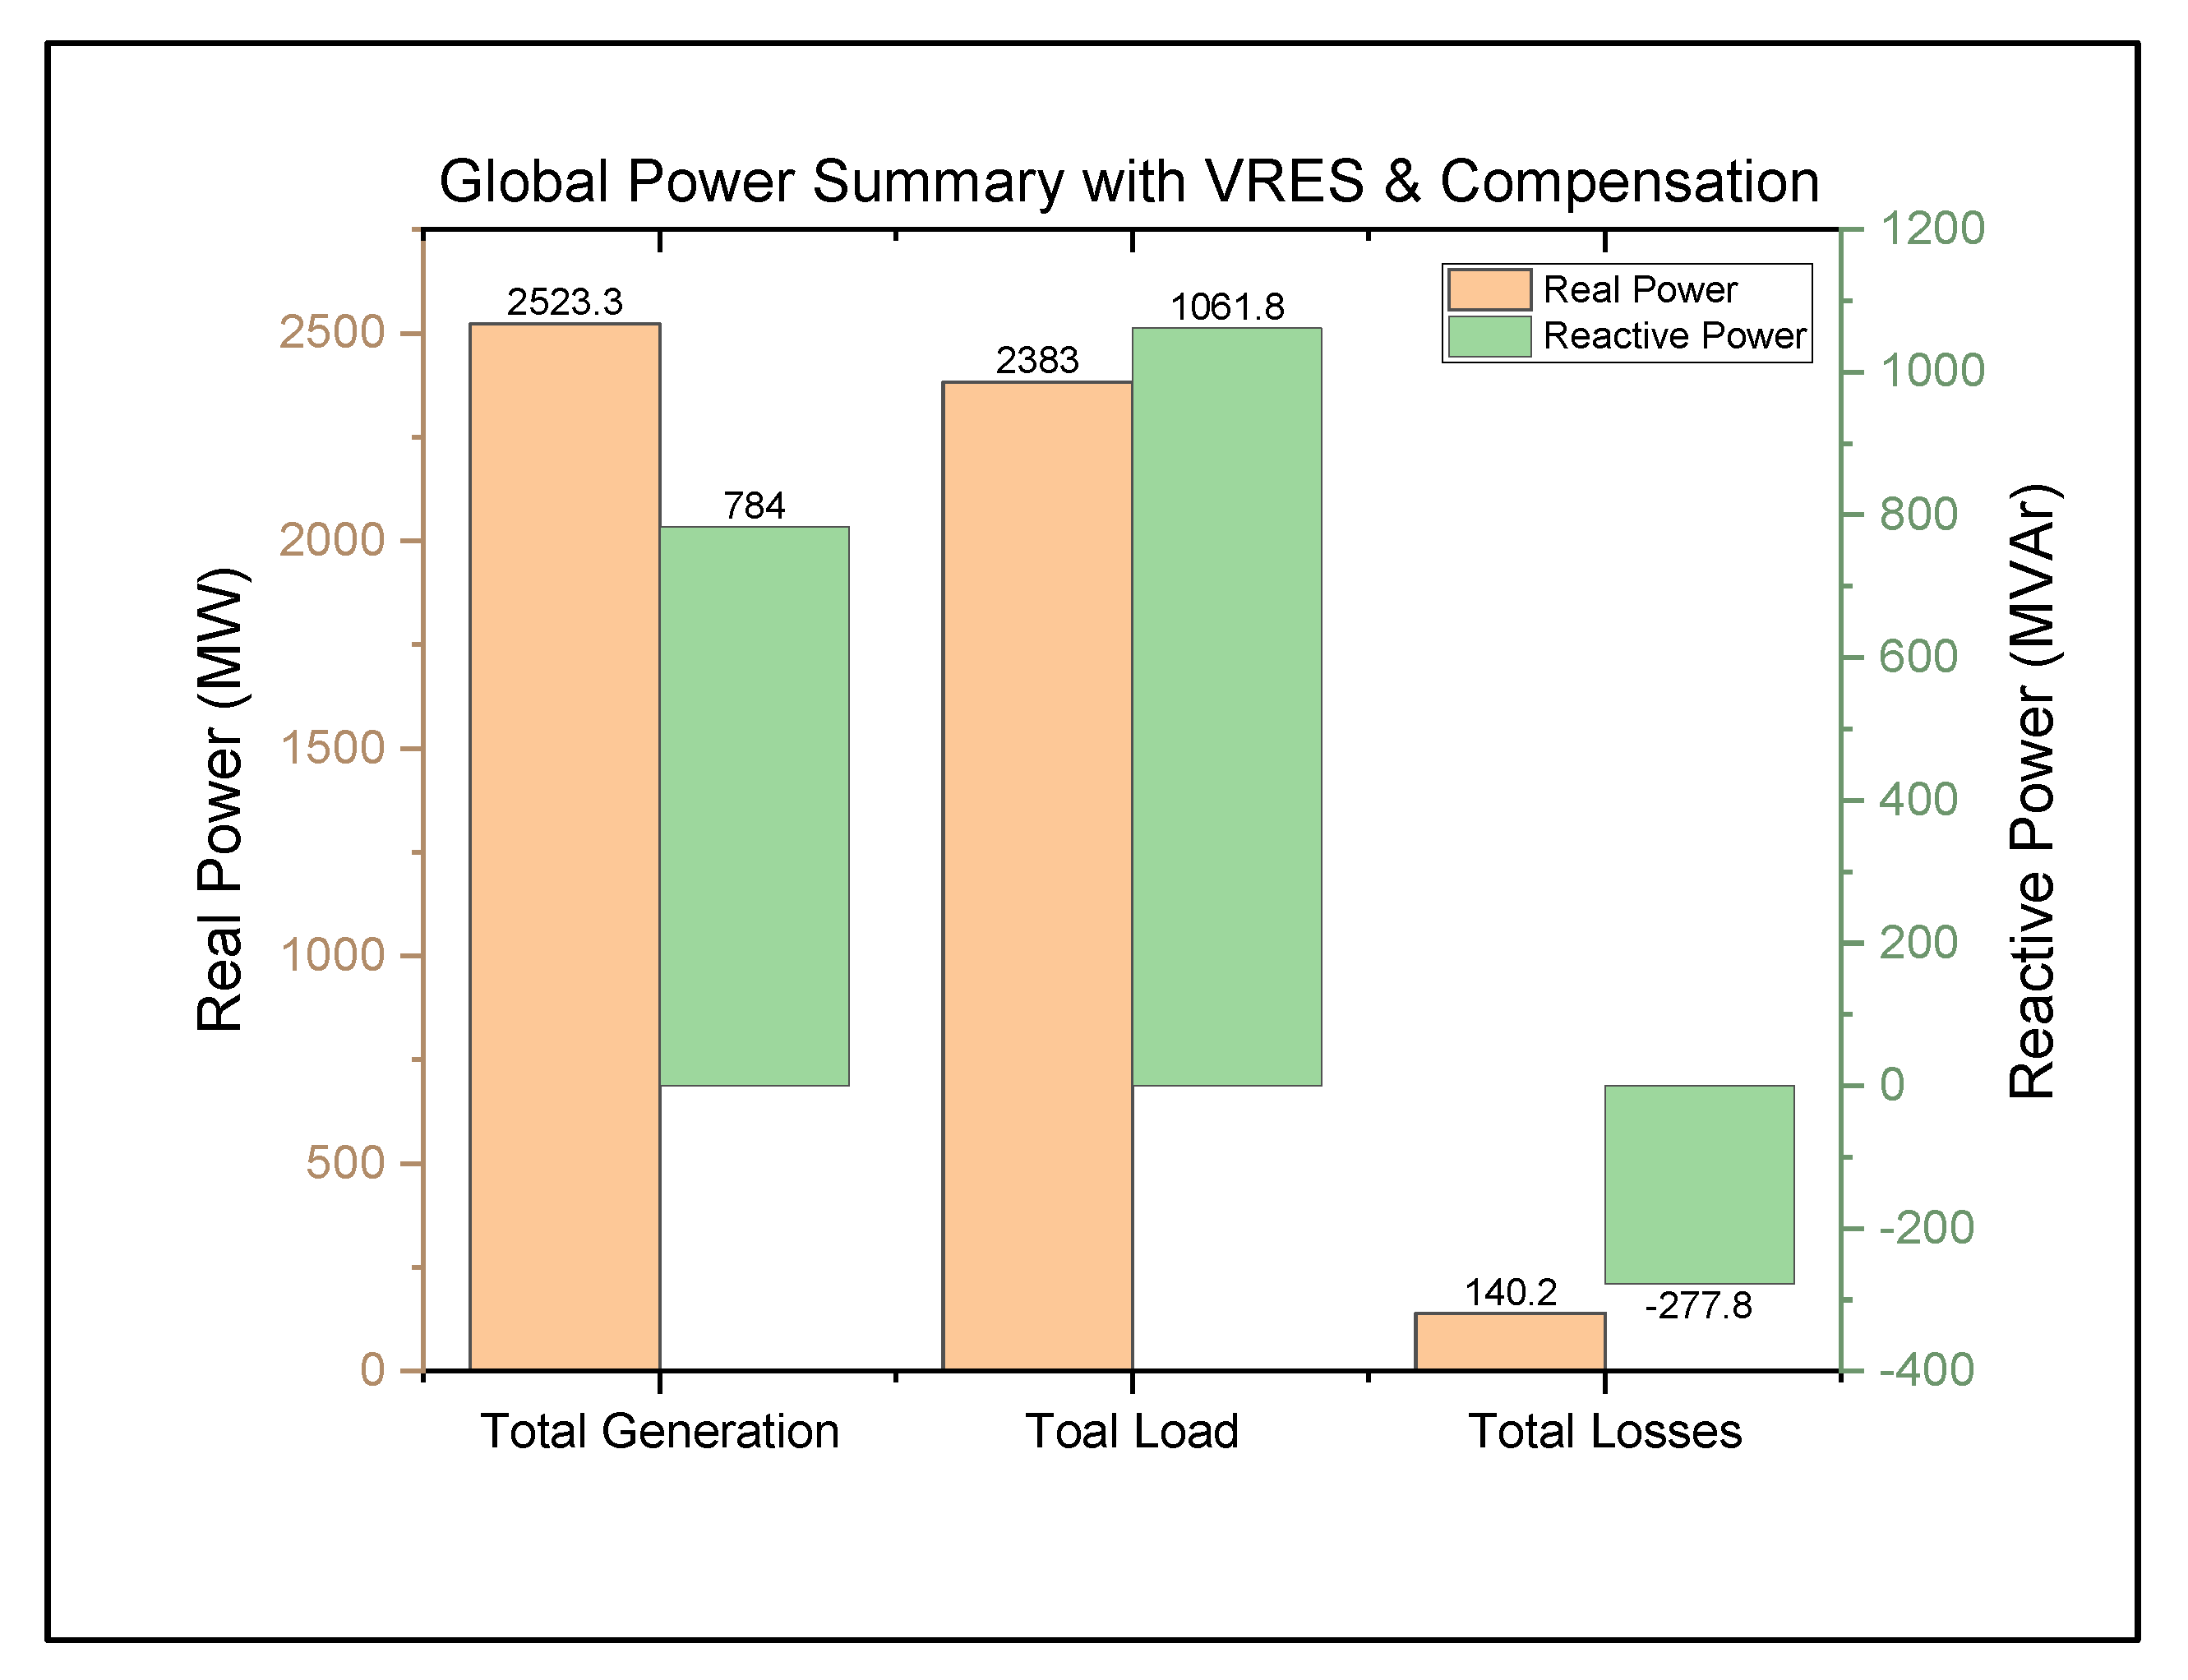
4.2.1. VRES Grid Impact Study
Analysis of Existing Network
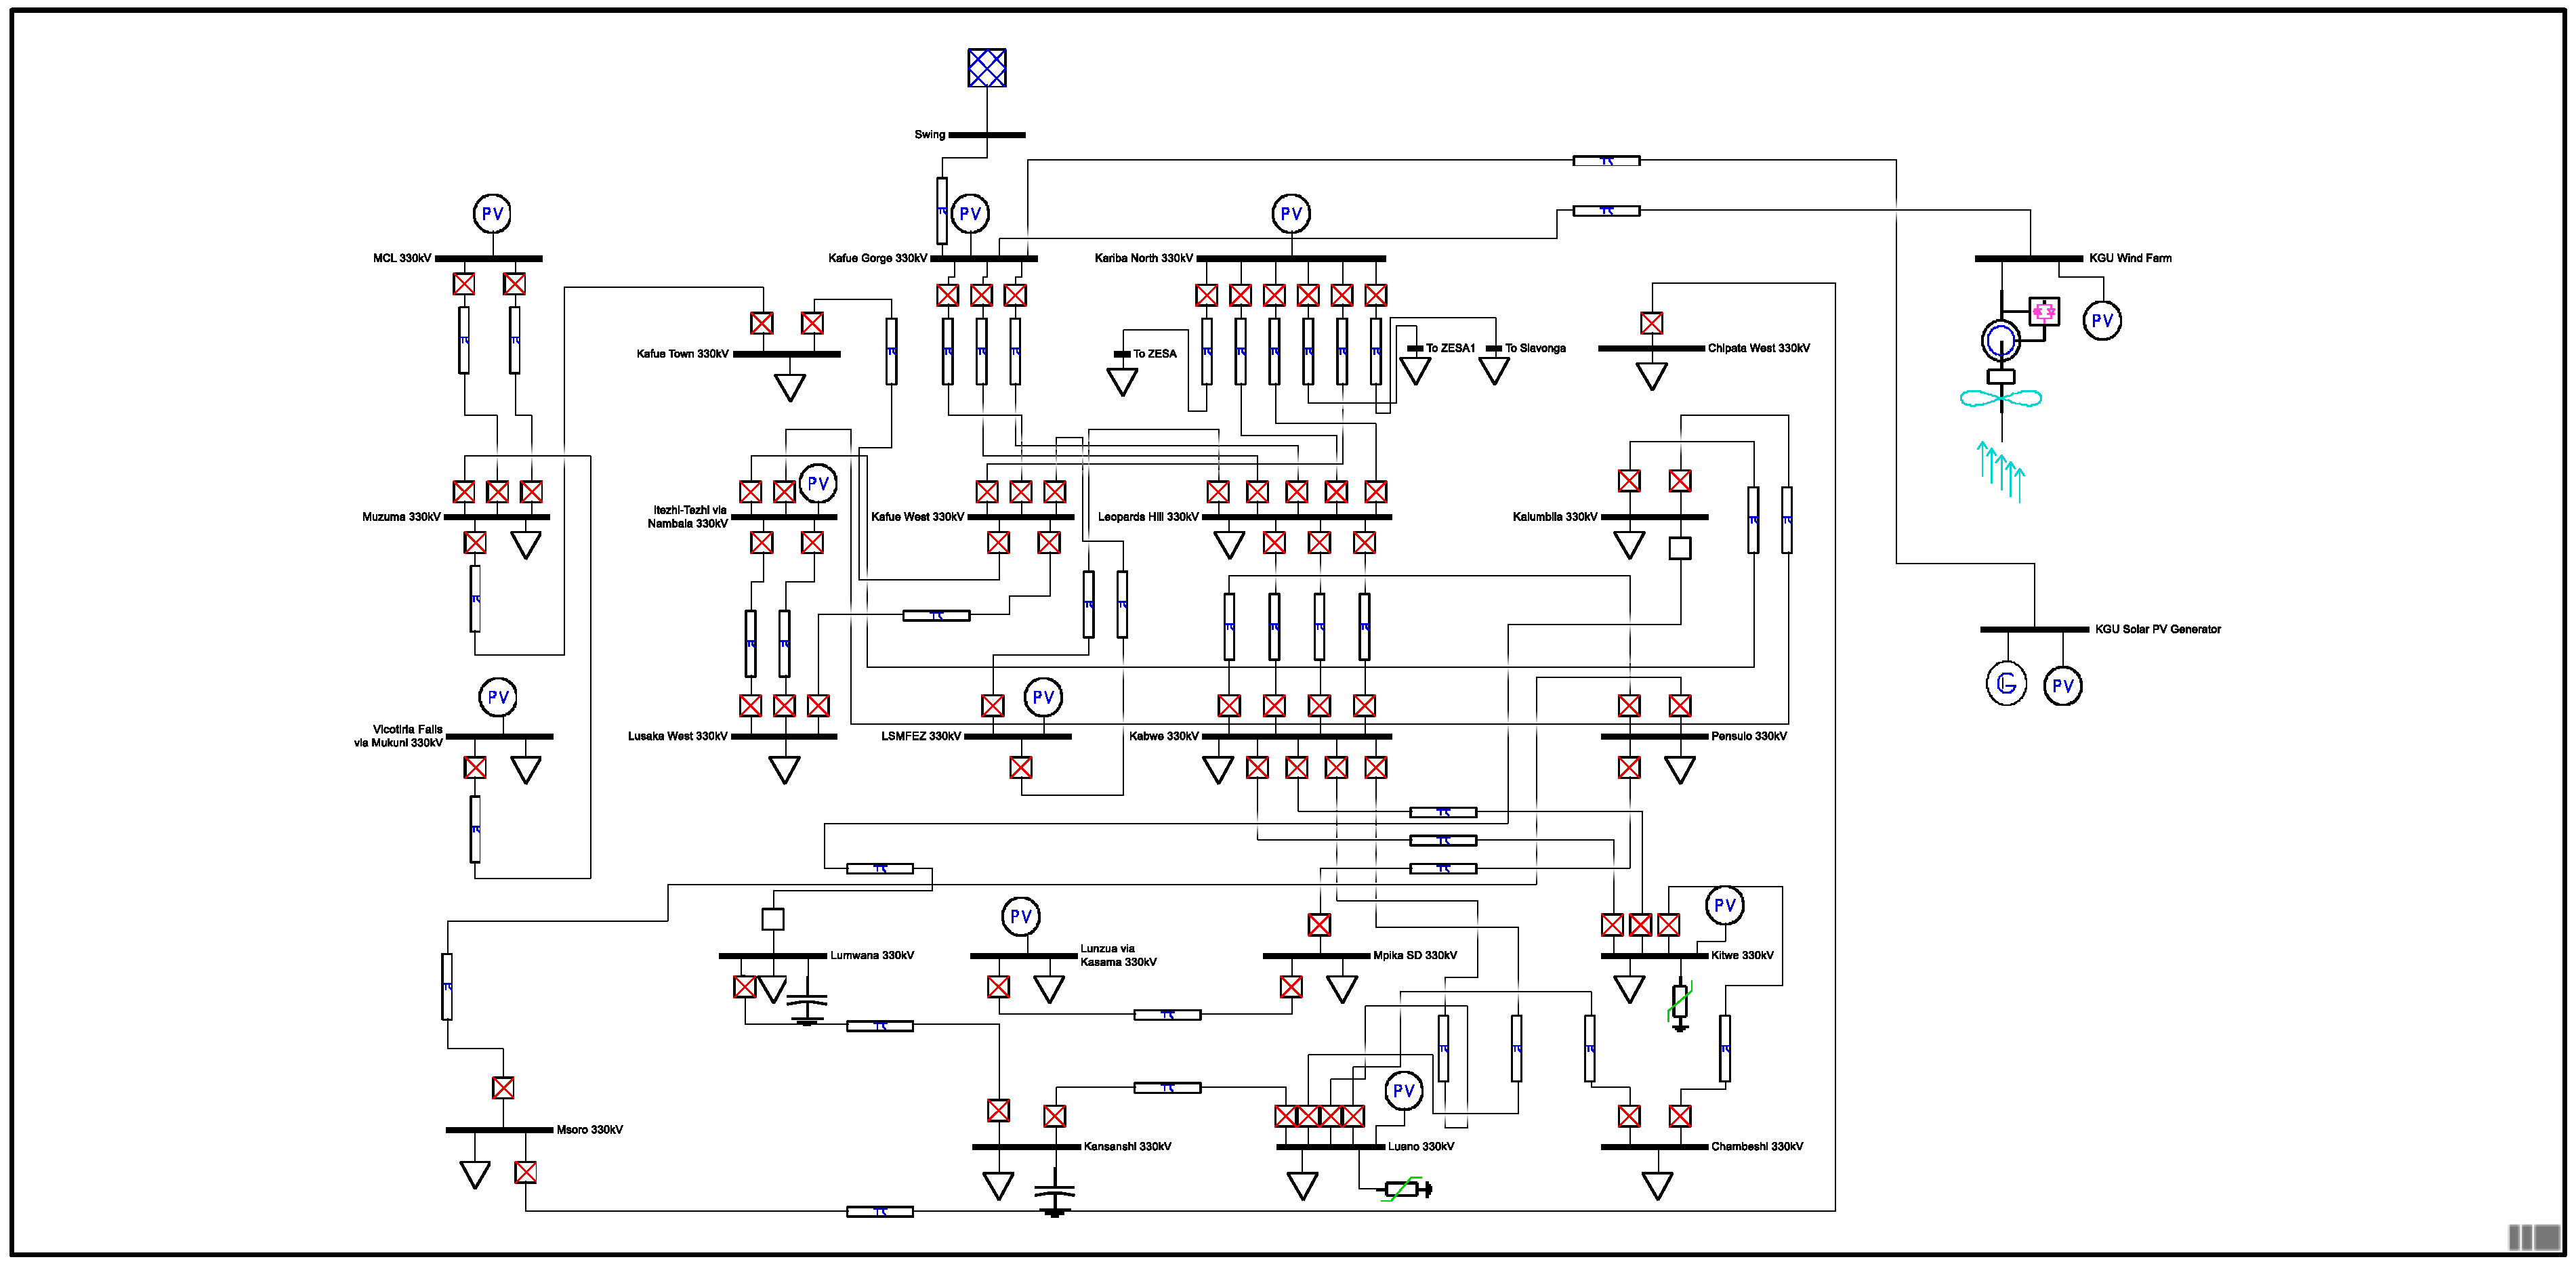
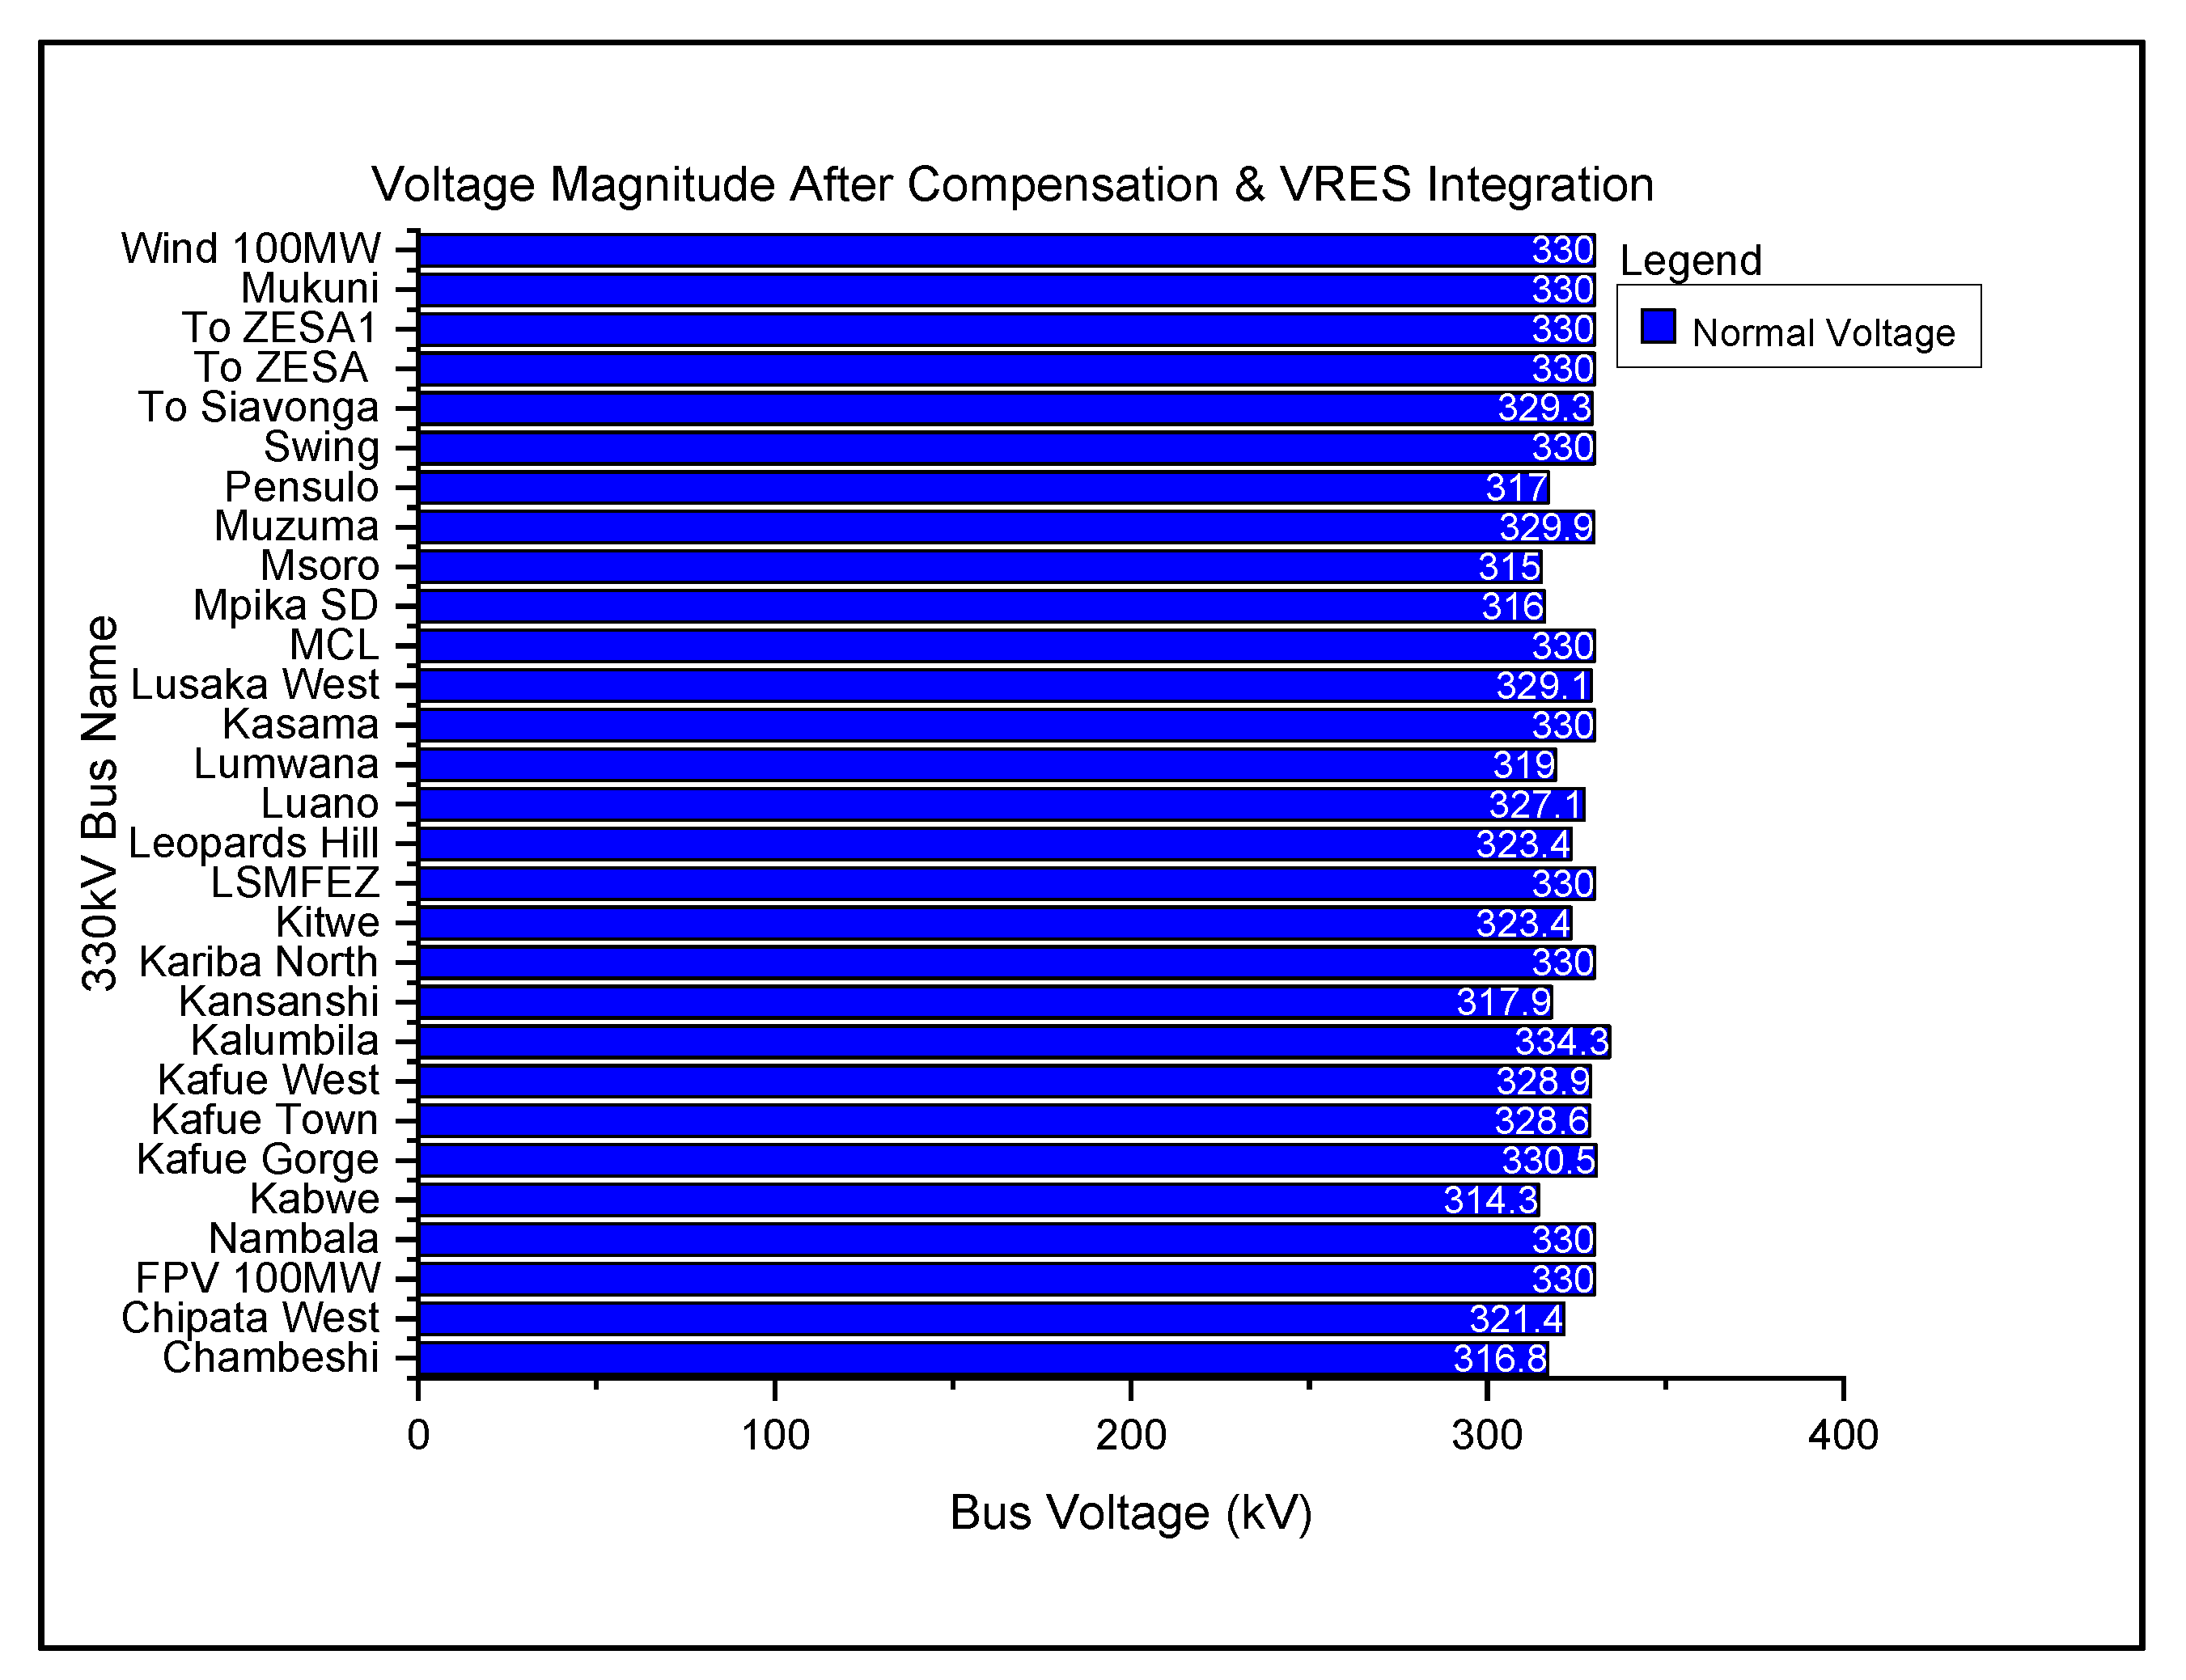
Analysis after VRES Integration
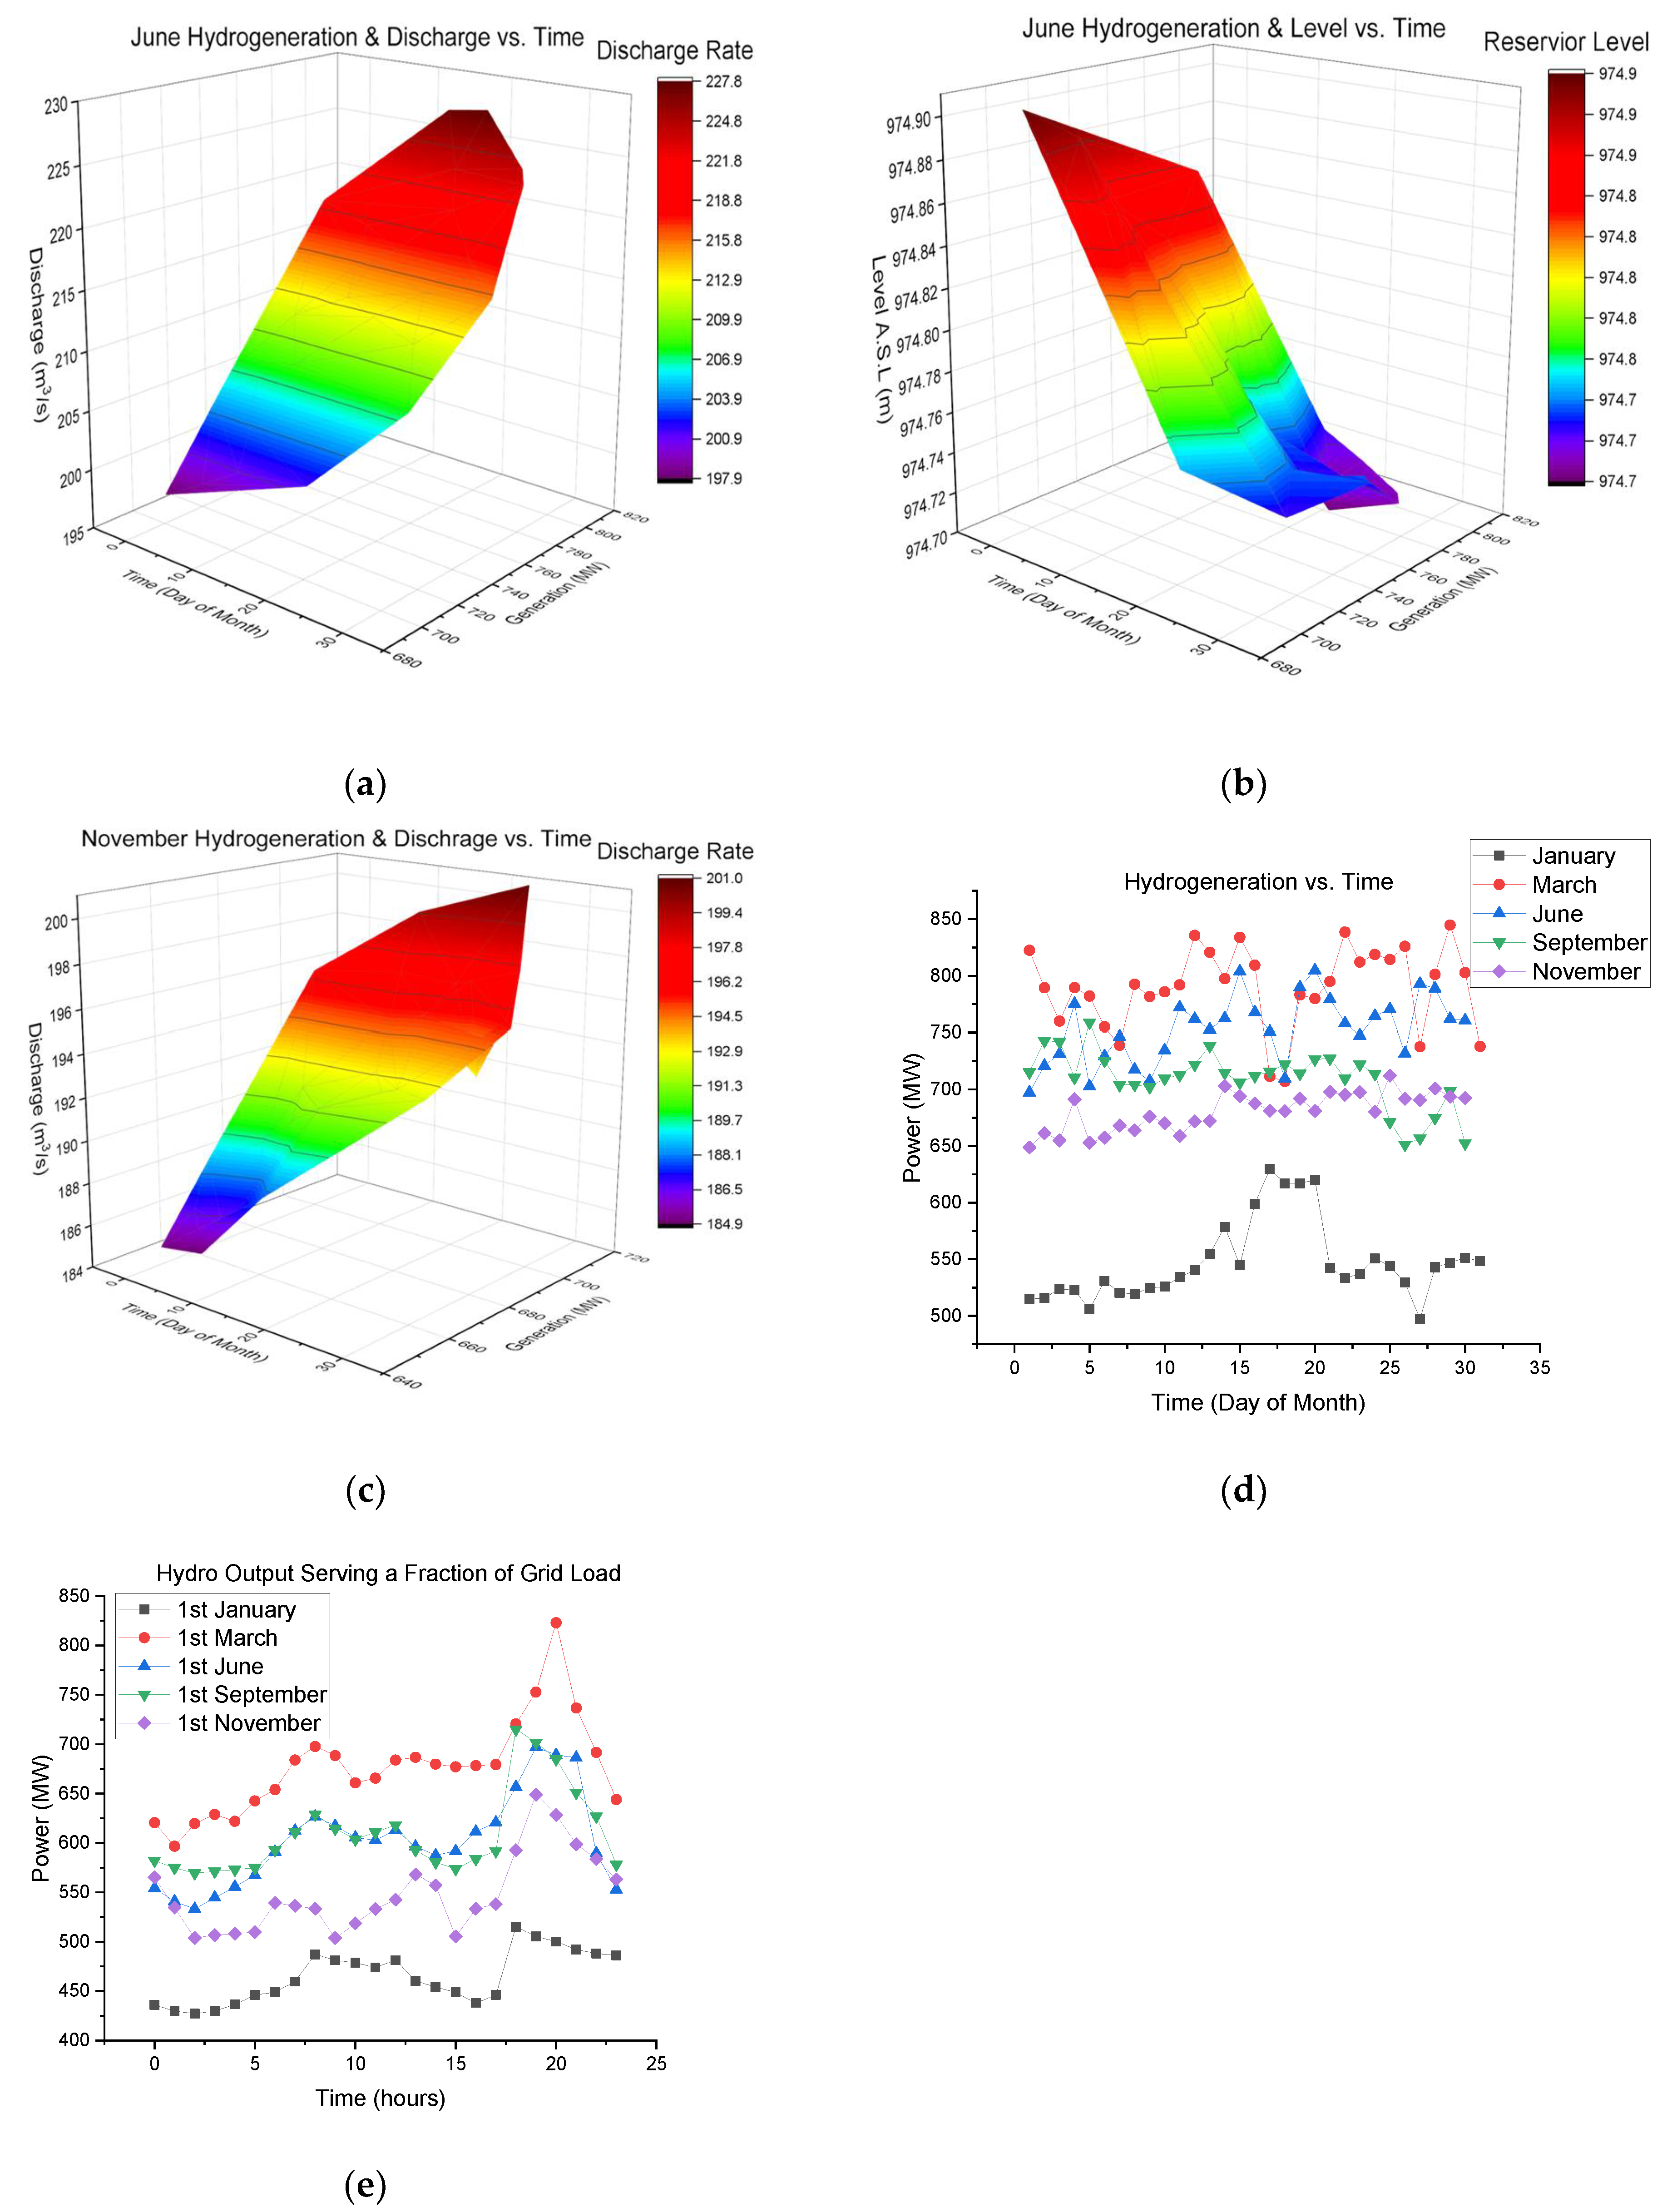
4.2.2. Hydro Modeling Results Analysis at KGU
4.2.3. VRES Modeling and Results Analysis
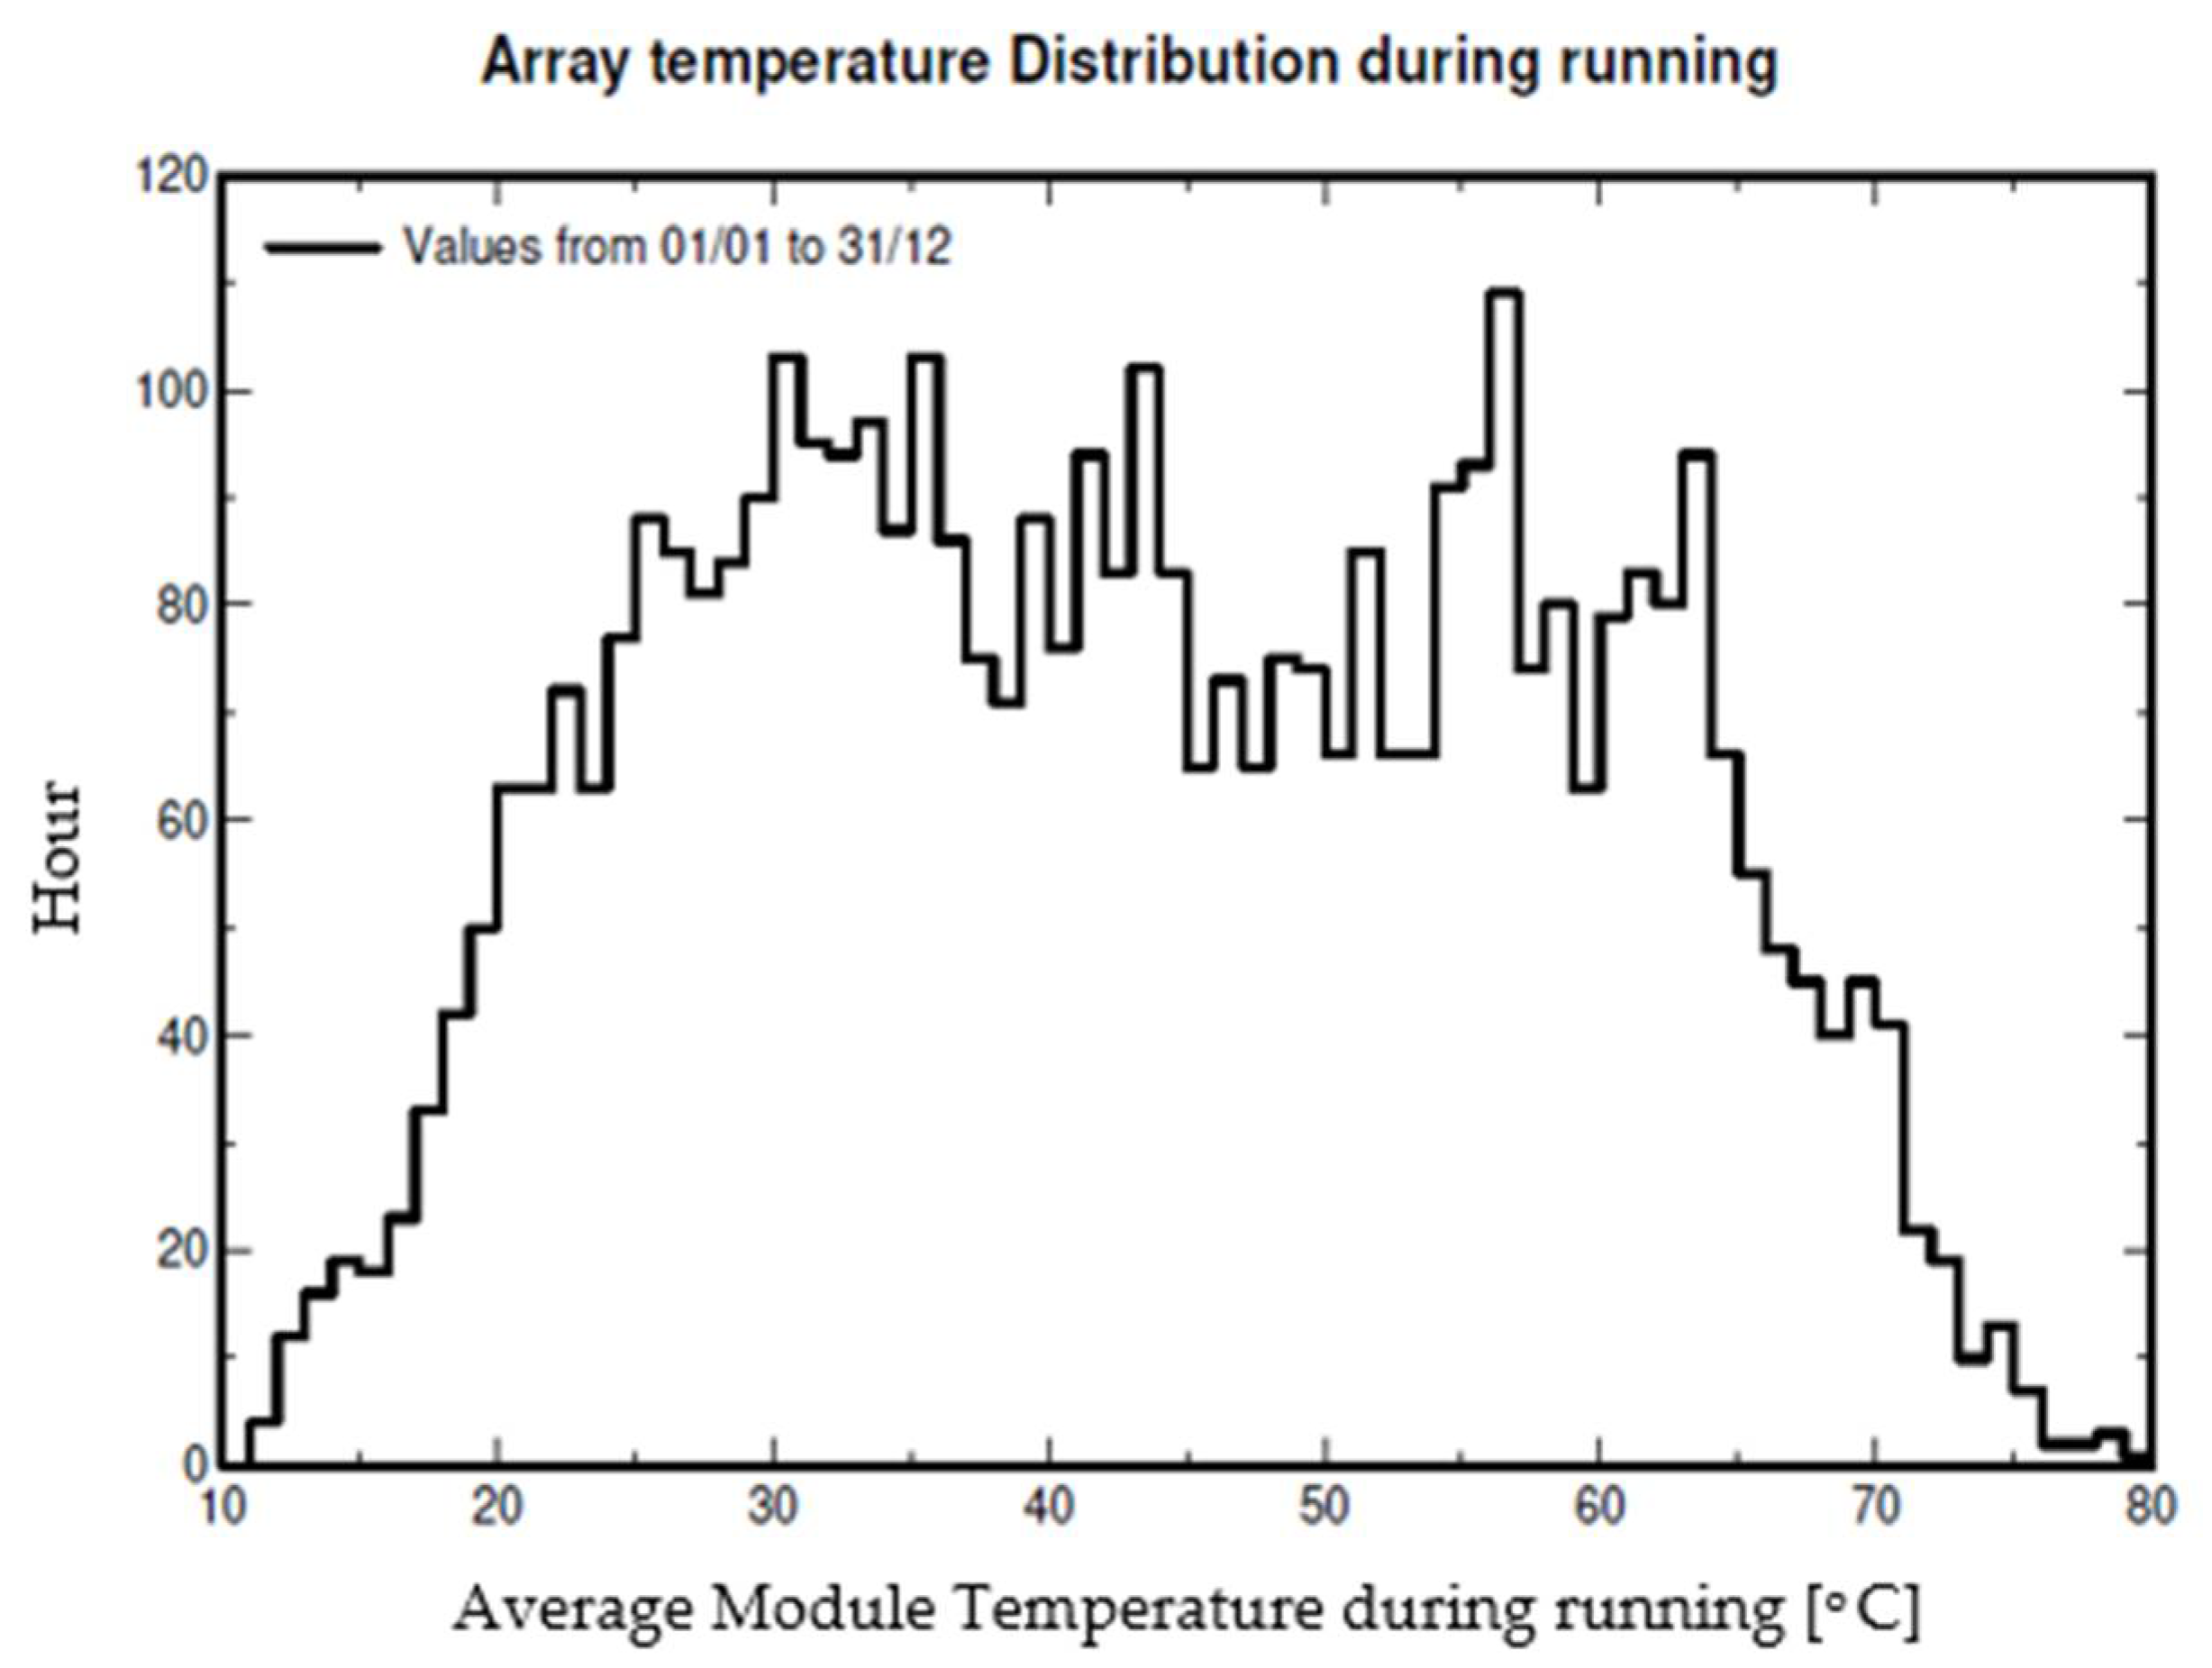
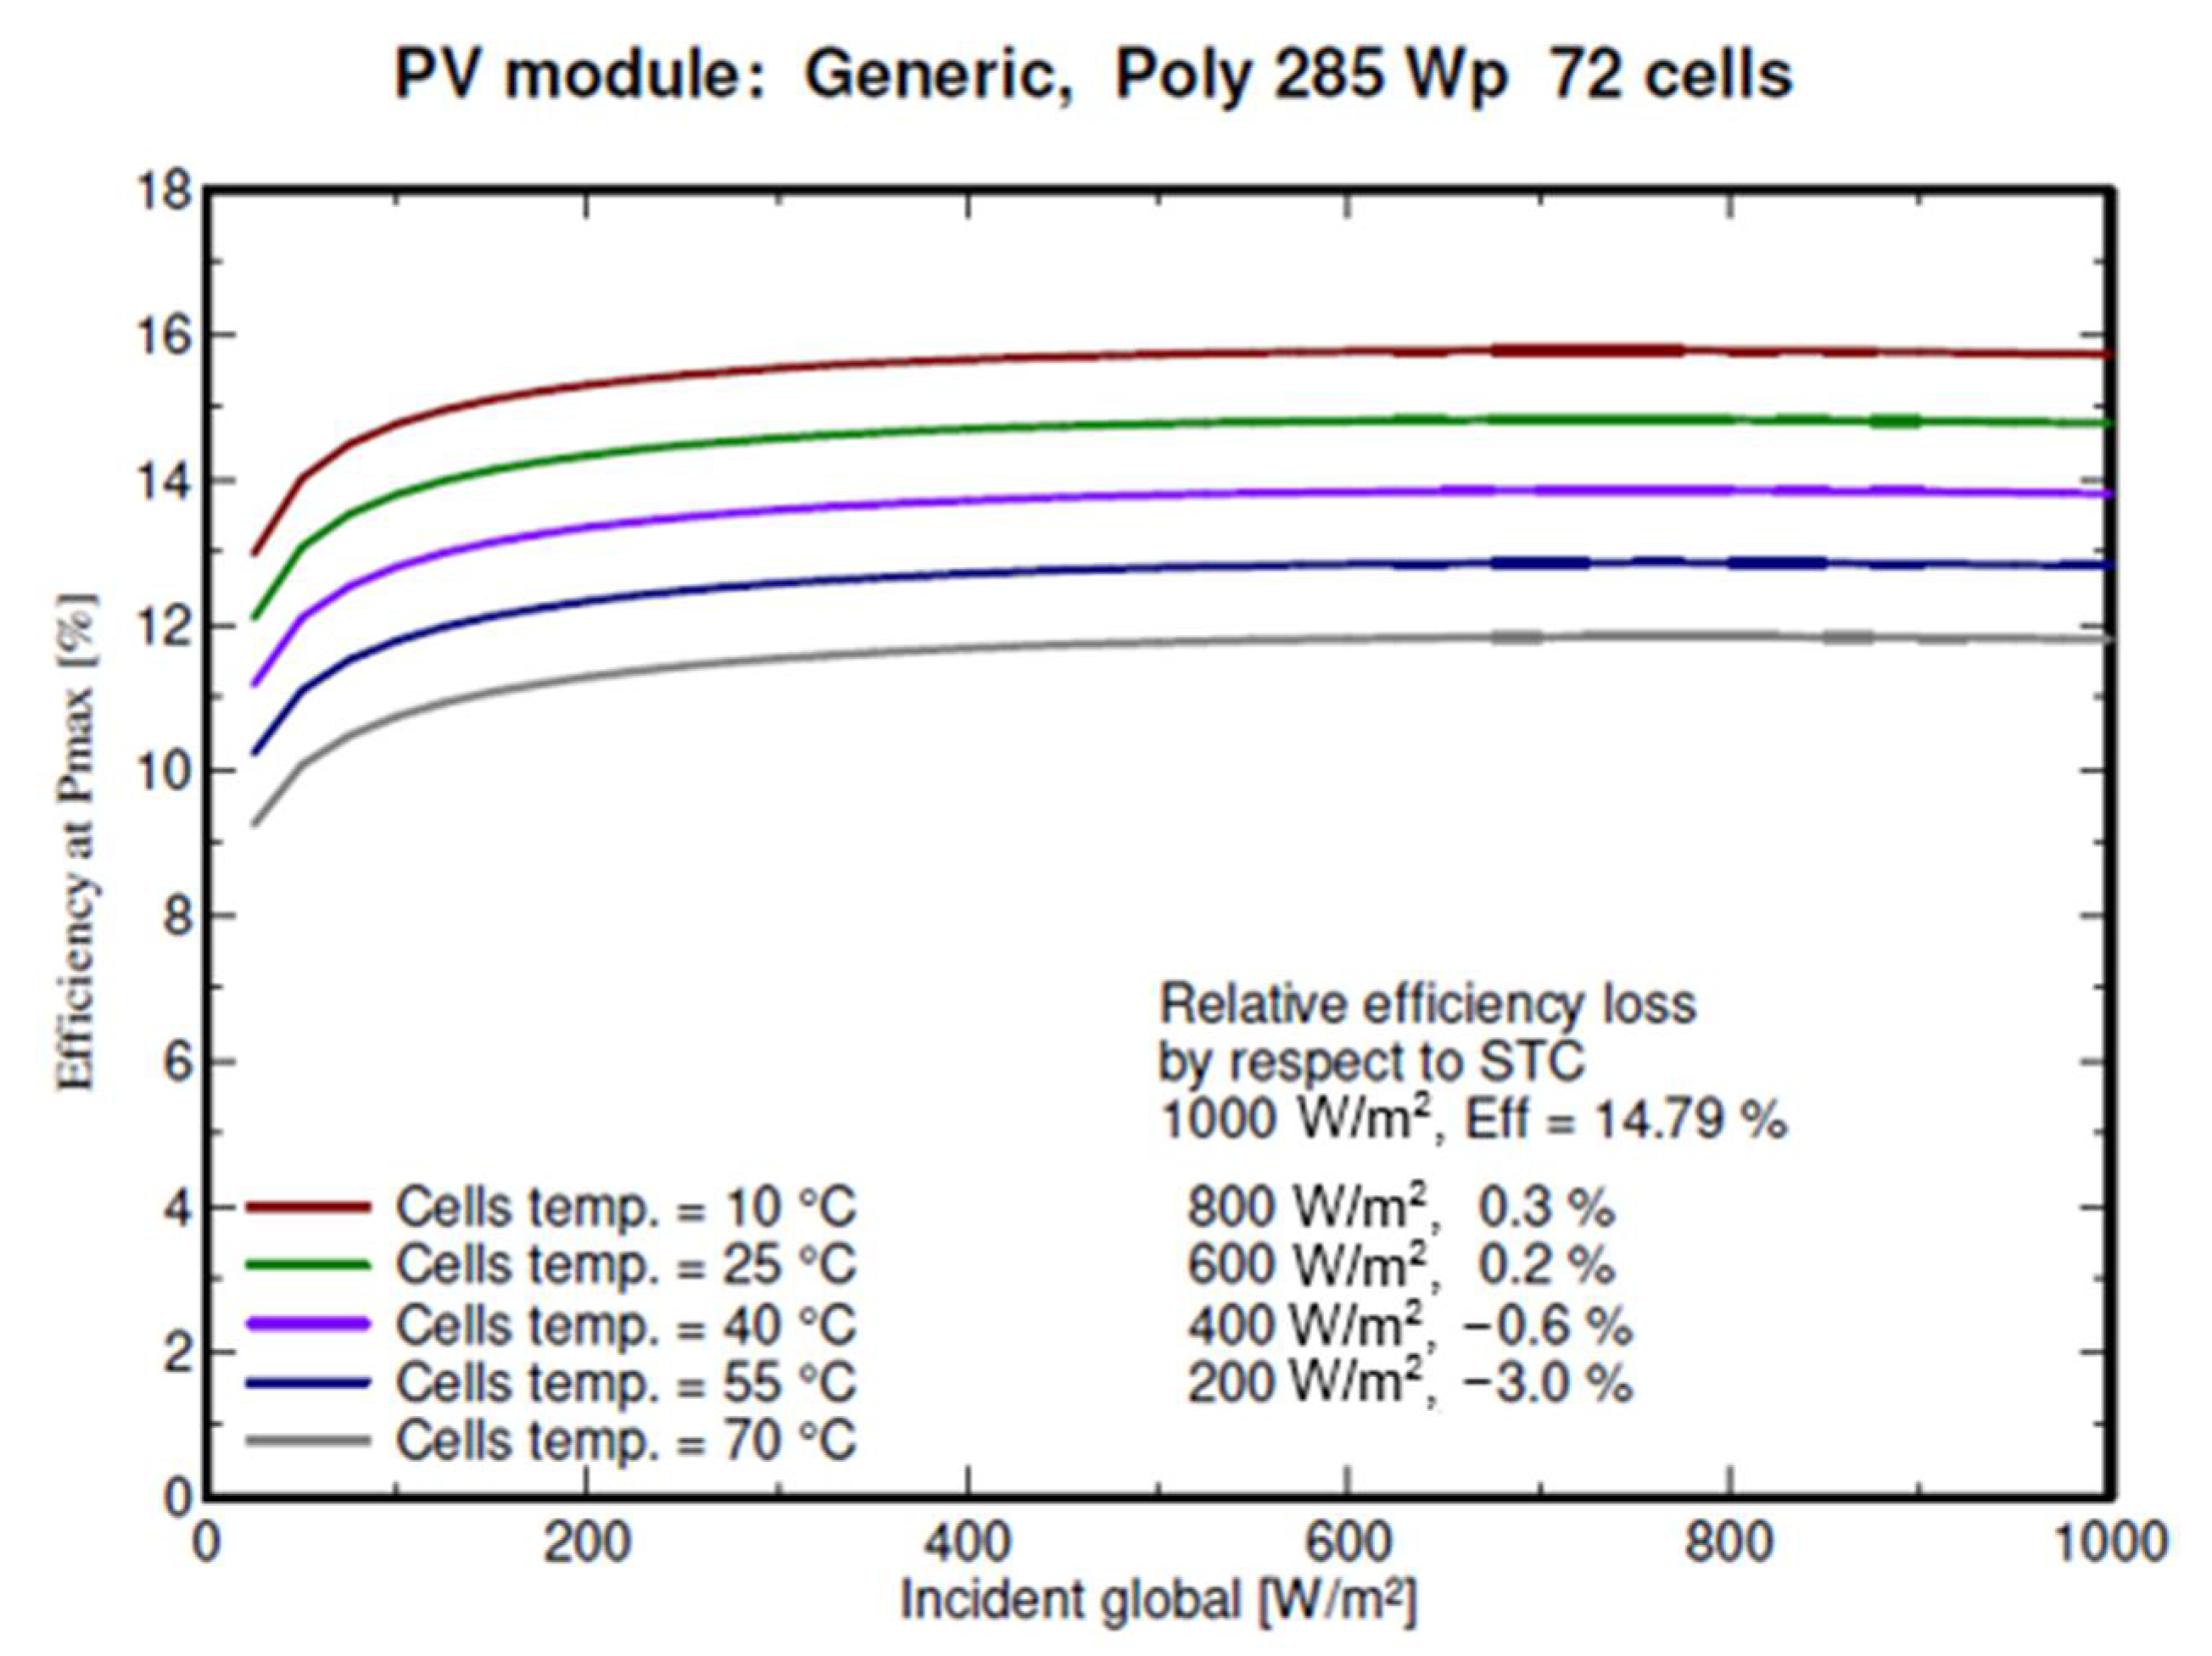
Floating PV
Onshore Wind
4.2.4. Optimal Dispatch of Hydro and VRES
Hybrid System Details
Optimal Daily Dispatch and Reservoir Water Saving
5. Conclusions
6. Recommendations
- ○
- An opportunity to conduct detailed financial and uncertainty analysis to cement project bankability.
- ○
- The conducting of pre-feasibility studies (i.e., bathymetry, environmental impact assessment, geotechnical and soil analysis of the reservoir/dam).
- ○
- The potential to widen the study scope to include all viable water bodies in the country (both natural and man-made).
- ○
- An opportunity to assess the grid impact at the other 9 ranked sites to ascertain overall impact on voltage stability and magnitude profile, network power losses, operating cost differential for different unit commitment scenarios. Moreover, there is the potential to conduct detailed network analysis to cover: N-1static security assessment, network fault level analysis and protection coordination, short-term and long-term frequency response, the effects of a spinning reserve, transient and dynamic stability performance, and voltage regulation during transience. Consequently, these studies will further provide the necessary technical requirements in the national grid code for large-scale VRES integration.
- ○
- Additionally, this study will pave the way for future research in optimizing the dispatch of VRES through an enhanced forecasting model for wind and PV (with the utilization of artificial intelligence and machine learning such as deep neural networks). This will help reduce power balancing costs for large-scale VRES integration.
Author Contributions
Funding
Institutional Review Board Statement
Informed Consent Statement
Data Availability Statement
Acknowledgments
Conflicts of Interest
Appendix A

| Suitability Score | ||||||||||||
|---|---|---|---|---|---|---|---|---|---|---|---|---|
| Part 1: Balanced Score Attribute Distribution [70,75,76,77,78,94,95,96,97,98,99,100,101,102,103]. | ||||||||||||
| Wind Potential (25% Relative Weight) | FPV Potential (35% Relative Weight) | Energy Export (20% Relative Weight) | Ease of Access (15% Relative Weight) | Demand (5% Rel. Weight) | ||||||||
| Number of Turbines | Capacity Factor (%) | Slope (%) | Area (km2) | Capacity Factor (%) | FPV Distance to Grid (km) | Wind Distance to Grid (km) | Grid Capacity (MVA) | Land Use | Land Ownership | Distance to Road (km) | Distance to Demand (km) | |
| High (100%) | >20 | >=40 | 0–<7 | >= 10 | >=14 | <=2 | 0–<=15 | >=700 | No current use | Customary /State | 0–4 | <=50 |
| Medium (75%) | >10–<=20 | >=35, < 40 | >=7–<14 | >=1, <10 | - | >=5, <2 | >15–<=30 | <700–>=400 | - | - | 4–8. | 50–100 |
| Low (50%) | >5–<=10 | >=30, <35 | >=14–<20 | >=0.1, <1 | - | >=7.5, < 5 | >30–<=45 | <400–>=100 | - | - | 8–12. | 100–150 |
| Lowest (25%) | >=1–<5 | >=26, <30 | >=20–<=30 | >= 0.004, <0.1 | - | <=10, < 7.5 | >45–<=60 | <100–>=1 | Agriculture | Private | 12–16. | 150–200 |
| Unsuitable | 0 | <26 | >30 | <0.004 | >10 | >60 | <1 | Protected/sensitive land | - | - | >=200 | |
| Part 2: Floating Photovoltaic (FPV) Attribute Score Distribution [70,75,76,77,78,94,95,96,97,98,99,100,101,102,103]. | ||||||||||||
| FPV Potential (60% Relative Weight) | Energy Export (20% Relative Weight) | Ease of Access (15% Relative Weight) | Demand (5% Relative Weight) | |||||||||
| Area (km2) | Capacity Factor (%) | FPV Distance to Grid (km) | Grid Capacity (MVA) | Land Use | Land Ownership | Distance to Road (km) | Distance to Demand (km) | |||||
| High (100%) | >= 10 | >=14 | <=2 | >=700 | No current use | Customary/State | 0–<=4 | <=50 | ||||
| Medium (75%) | >=1, <10 | >=5, <2 | <700–>=400 | - | - | >4–<=8. | >50–<=100 | |||||
| Low (50%) | >=0.1, <1 | >=7.5, < 5 | <400–>=100 | - | - | >8–<=12. | >100–<=150 | |||||
| Lowest (25%) | >= 0.004, <0.1 | <=10, < 7.5 | <100–>=1 | Agriculture | Private | >12–<=16. | >150–<=200 | |||||
| Unsuitable | <0.004 | >10 | <1 | Protected/sensitive land | - | - | >200 | |||||
| Part 3: Onshore Wind Attribute Score Distribution [70,75,76,77,78,94,95,96,97,98,99,100,101,102,103]. | ||||||||||||
| Wind Potential (60% Relative Weight) | Energy Export (20% Relative Weight) | Ease of Access (15% Relative Weight) | Demand (5% Relative Weight) | |||||||||
| Number of Turbines | Capacity Factor (%) | Slope (%) | Wind Distance to Grid (km) | Grid Capacity (MVA) | Land Use | Land Ownership | Distance to Road (km) | Distance to Demand (km) | ||||
| High (100%) | >20 | >=40 | 0–<7 | 0–<=15 | >=700 | No current use | Customary/State | 0–<=4 | <=50 | |||
| Medium (75%) | >10–<=20 | >=35, < 40 | >=7–<14 | >15–<=30 | <700–>=400 | - | - | >4–<=8. | 50–100 | |||
| Low (50%) | >5–<=10 | >=30, <35 | >=14–<20 | >30–<=45 | <400–>=100 | - | - | >8–<=12. | 100–150 | |||
| Lowest (25%) | >=1–<5 | >=26, <30 | >=20–<=30 | >45–<=60 | <100–>=1 | Agriculture | Private | >12–<=16. | 150–200 | |||
| Unsuitable | 0 | <26 | >30 | >60 | <1 | Protected/sensitive land | - | - | >=200 | |||
| Wind Potential (25% Weight) | FPV Potential (35% weight) | |||||||
|---|---|---|---|---|---|---|---|---|
| Score * Weight (10%) | Score * Weight (10%) | Score * Weight (5%) | ∑ | Score * Weight (17.5%) | Score * Weight (17.5%) | ∑ | ||
| Rank # | Name of Site | Number of Turbines | Capacity Factor | Slope | Wind Total | Area | Capacity Factor | FPV Total |
| =1′ | Itezhi-tezhi FPV/wind site | 10.0% | 7.5% | 5.0% | 22.5% | 17.5% | 17.5% | 35.0% |
| =2′ | KGU FPV/wind site | 10.0% | 7.5% | 3.8% | 21.3% | 13.1% | 17.5% | 30.6% |
| =3′ | KGL FPV/wind site | 10.0% | 10.0% | 5.0% | 25.0% | 8.8% | 17.5% | 26.3% |
| =3′ | Kariba FPV/wind site | 10.0% | 5.0% | 3.8% | 18.8% | 8.8% | 17.5% | 26.3% |
| =3′ | Lusiwasi FPV/ wind site | 10.0% | 5.0% | 5.0% | 20.0% | 17.5% | 17.5% | 35.0% |
| =6′ | Musonda FPV/wind site | 10.0% | 7.5% | 5.0% | 22.5% | 13.1% | 17.5% | 30.6% |
| =6′ | Mulungushi FPV/wind site | 10.0% | 7.5% | 5.0% | 22.5% | 13.1% | 17.5% | 30.6% |
| =8′ | Shiwangangu FPV/ wind site | 10.0% | 7.5% | 3.8% | 21.3% | 8.8% | 17.5% | 26.3% |
| =9′ | Lunsemfwa FPV/wind site | 10.0% | 10.0% | 5.0% | 25.0% | 4.4% | 17.5% | 21.9% |
| =10′ | Chishimba FPV/wind site | 10.0% | 5.0% | 5.0% | 20.0% | 4.4% | 17.5% | 21.9% |
| Energy Export (20% Weight) | Ease of Access (15% Weight) | Demand (5% Weight) | Site Total (100% Weight) | |||||||||
|---|---|---|---|---|---|---|---|---|---|---|---|---|
| Score * Weight (5%) | Score * Weight (5%) | Score * Weight (10%) | ∑ | Score * Weight (5%) | Score * Weight (5%) | Score * Weight (5%) | ∑ | Score * Weight (5%) | ∑ | ∑ | ||
| Rank# | Name of Site | FPV Distance to Grid | Wind Distance to Grid | Grid Capacity (10%) | Total | Land Use (5%) | Land Ownership | Distance to Road | Total | Distance to Demand | Demand Total | Score * Weight |
| =1′ | Itezhi-tezhi FPV/wind site | 5.0% | 2.5% | 5.0% | 12.5% | 5.0% | 5.0% | 5.0% | 15.0% | 5.0% | 5.0% | 90.0% |
| =2′ | KGU FPV/wind site | 5.0% | 3.8% | 10.0% | 18.8% | 5.0% | 5.0% | 1.3% | 11.3% | 5.0% | 5.0% | 86.9% |
| =3′ | KGL FPV/wind site | 2.5% | 2.5% | 10.0% | 15.0% | 5.0% | 5.0% | 3.8% | 13.8% | 5.0% | 5.0% | 85.0% |
| =3′ | Kariba FPV/wind site | 5.0% | 5.0% | 10.0% | 20.0% | 5.0% | 5.0% | 5.0% | 15.0% | 5.0% | 5.0% | 85.0% |
| =3′ | Lusiwasi FPV/ wind site | 5.0% | 5.0% | 2.5% | 12.5% | 5.0% | 5.0% | 5.0% | 15.0% | 2.5% | 2.5% | 85.0% |
| =6′ | Musonda FPV/wind site | 1.3% | 5.0% | 2.5% | 8.8% | 5.0% | 5.0% | 5.0% | 15.0% | 2.5% | 2.5% | 79.4% |
| =6′ | Mulungushi FPV/wind site | 2.5% | 5.0% | 2.5% | 10.0% | 5.0% | 5.0% | 3.8% | 13.8% | 2.5% | 2.5% | 79.4% |
| =8′ | Shiwangangu FPV/ wind site | 5.0% | 5.0% | 2.5% | 12.5% | 5.0% | 5.0% | 3.8% | 13.8% | 2.5% | 2.5% | 76.3% |
| =9′ | Lunsemfwa FPV/wind site | 5.0% | 1.3% | 2.5% | 8.8% | 5.0% | 5.0% | 5.0% | 15.0% | 2.5% | 2.5% | 73.1% |
| =10′ | Chishimba FPV/wind site | 5.0% | 3.8% | 2.5% | 11.3% | 5.0% | 5.0% | 5.0% | 15.0% | 2.5% | 2.5% | 70.6% |
Appendix B
| Base MVA | 100 | Shunt Compensation | |||||
| Station | Rating (MVAr) | ||||||
| Kitwe | 20 | ||||||
| 330kV Line Parameters | Lumwana | 20 | |||||
| R (p.u/km) | X (p.u/km) | B (p.u/km) | Kansanshi | 20 | |||
| 0.00004 | 0.000315 | 0.003708 | |||||
| SVCs | |||||||
| 220kV Line Parameters | Station | Rating (MVA) | |||||
| R (p.u/km) | X (p.u/km) | B (p.u/km) | Kitwe | 35 | |||
| 0.000115 | 0.000682 | 0.001701 | Luano | 80 | |||
| 132kV Line Parameters | |||||||
| R (p.u/km) | X (p.u/km) | B (p.u/km) | |||||
| 0.001224 | 0.002365 | 0.000486 | |||||
| FROM | TO | km | R(p.u) | X(p.u) | B(p.u) | Voltage Level (kV) | Rating (MVA) |
| Kafue Gorge | Leopards Hill | 47 | 0.00188 | 0.014805 | 0.174276 | 330 | 700 |
| Kafue Gorge | Kafue West | 43 | 0.00172 | 0.013545 | 0.159444 | 330 | 700 |
| Kariba North | Leopards Hill | 123 | 0.00492 | 0.038745 | 0.456084 | 330 | 700 |
| Leopards Hill | Kabwe | 97 | 0.00388 | 0.030555 | 0.359676 | 330 | 700 |
| Kabwe | Kitwe | 211 | 0.00844 | 0.066465 | 0.782388 | 330 | 700 |
| Kabwe | Luano | 247 | 0.00988 | 0.077805 | 0.915876 | 330 | 700 |
| Kabwe | Pensulo | 298 | 0.01192 | 0.09387 | 1.104984 | 330 | 700 |
| Kitwe | Luano | 40 | 0.0016 | 0.0126 | 0.14832 | 330 | 700 |
| Kitwe | Chambishi | 21.5 | 0.00086 | 0.0067725 | 0.079722 | 330 | 700 |
| Chambishi | Luano | 21.5 | 0.00086 | 0.0067725 | 0.079722 | 330 | 700 |
| Luano | Kansanshi | 196 | 0.00784 | 0.06174 | 0.726768 | 330 | 700 |
| Kansanshi | Lumwana | 72 | 0.00288 | 0.02268 | 0.266976 | 330 | 700 |
| Kafue West | Lusaka West | 51 | 0.00204 | 0.016065 | 0.189108 | 330 | 700 |
| Kafue West | Kafue Town | 3 | 0.00012 | 0.000945 | 0.011124 | 330 | 700 |
| Kafue West | Leopards Hill | 53 | 0.00212 | 0.016695 | 0.196524 | 330 | 700 |
| VicFalls | Muzuma | 159 | 0.018285 | 0.108438 | 0.270459 | 220 | 230 |
| Muzuma | Kafue Town | 189 | 0.021735 | 0.128898 | 0.321489 | 220 | 230 |
| Luano | Michelo | 44 | 0.00506 | 0.030008 | 0.074844 | 220 | 375 |
| Michelo | Karavia | 8 | 0.00092 | 0.005456 | 0.013608 | 220 | 375 |
| Leopards Hill | Roma | 28 | 0.034272 | 0.06622 | 0.013608 | 132 | 85 |
| Leopards Hill | Coventry | 28 | 0.034272 | 0.06622 | 0.013608 | 132 | 85 |
| Roma | Lusaka West | 21 | 0.025704 | 0.049665 | 0.010206 | 132 | 85 |
| Lusaka West | Roma | 21 | 0.025704 | 0.049665 | 0.010206 | 132 | 85 |
| Transformers | |||||||
| Station | Qty | x(p.u) | Rating | Ratio | |||
| Kafue Town | 1 | 0.185 | 60 | 220/88 | |||
| Kafue Town | 1 | 0.1707 | 60 | 330/88 | |||
| Lusaka West | 1 | 0.056 | 125 | 330/132 | |||
| Leopard Hill | 2 | 0.056 | 125 | 330/132 | |||
| Kitwe | 6 | 0.042 | 125 | 330/220 | |||
| Luano | 4 | 0.042 | 125 | 330/220 | |||
References
- World Bank Group, ESMAP, and SERIS. Where Sun Meets Water: Floating Solar Handbook for Practitioners; World Bank: Washington, DC, USA, 2019; Available online: https://www.esmap.org/where_sun_meets_water_handbook (accessed on 10 September 2020).
- Obane, H.; Nagai, Y.; Asano, K. Assessing land use and potential conflict in solar and onshore wind energy in Japan. Renew. Energy 2020, 160, 842–851. [Google Scholar] [CrossRef]
- Thi, N.D.A. The Evolution of Floating Solar Photovoltaics; Research Gate: Berlin, Germany, 2017. [Google Scholar]
- Trapani, K.; Santafé, M.R. A review of floating photovoltaic installations: 2007–2013. Prog. Photovolt. Res. Appl. 2014, 23, 524–532. [Google Scholar] [CrossRef] [Green Version]
- Ferrer-Gisbert, C.; Ferrán-Gozálvez, J.J.; Redón-Santafé, M.; Gisbert, P.F.; Sanchez-Romero, F.-J.; Torregrosa-Soler, J.B. A new photovoltaic floating cover system for water reservoirs. Renew. Energy 2013, 60, 63–70. [Google Scholar] [CrossRef] [Green Version]
- Mesbahi, M.; Minamino, S. Top 70 Floating Solar PV Plants. Available online: https://www.solarplaza.com/channels/top-10s/11761/top-70-floating-solar-pv-plants/ (accessed on 20 June 2020).
- Tsanova, T. Floating solar installs to top 1.5 GW in 2019. Available online: https://renewablesnow.com/news/to-the-point-floatingsolar-installs-to-top-15-gw-in-2019-613278/ (accessed on 27 May 2021).
- Ranjbaran, P.; Yousefi, H.; Gharehpetian, G.B.; Astaraei, F.R. A review on floating photovoltaic (FPV) power generation units. Renew. Sustain. Energy Rev. 2019, 110, 332–347. [Google Scholar] [CrossRef]
- Sulaeman, S.; Brown, E.; Quispe-Abad, R.; Müller, N. Floating PV system as an alternative pathway to the amazon dam underproduction. Renew. Sustain. Energy Rev. 2020, 135, 110082. [Google Scholar] [CrossRef]
- Oliveira-Pinto, S.; Stokkermans, J. Assessment of the potential of different floating solar technologies—Overview and analysis of different case studies. Energy Convers. Manag. 2020, 211, 112747. [Google Scholar] [CrossRef]
- Rosa-Clot, M. Floating PV Plants; Academic Press: Cambridge, MA, USA, 2020. [Google Scholar]
- Liu, H.; Krishna, V.; Leung, J.L.; Reindl, T.; Zhao, L. Field experience and performance analysis of floating PV technologies in the tropics. Prog. Photovolt. Res. Appl. 2018, 26, 957–967. [Google Scholar] [CrossRef]
- ZESCO Limited. Statement on Electricity Deficit. 2020. Available online: https://www.reuters.com/article/zambia-electricity/update-1-zambian-power-firm-zesco-says-electricity-deficit-growing-idUSL8N2B626D (accessed on 11 September 2020).
- Ministry of Energy (MOE). Official Opening of the Fifth Session of the Twelfth National Assembly by His Excellency, Mr. Edgar Chagwa Lungu, President of the Republic of Zambia on Friday 11 September 2020. Available online: https://www.moe.gov.zm/?wpfb_dl=82 (accessed on 11 September 2020).
- Stiubiener, U.; da Silva, T.C.; Trigoso, F.B.M.; Benedito, R.D.S.; Teixeira, J.C. PV power generation on hydro dam’s reservoirs in Brazil: A way to improve operational flexibility. Renew. Energy 2020, 150, 765–776. [Google Scholar] [CrossRef]
- Farfan, J.; Breyer, C. Combining Floating Solar Photovoltaic Power Plants and Hydropower Reservoirs: A Virtual Battery of Great Global Potential. Energy Procedia 2018, 155, 403–411. [Google Scholar] [CrossRef]
- Nordmann, T.; Vontobel, T.; Clavadetscher, L.; Boström, T.; Remlo, H. Large Scale Hybrid PV Hydro Electricity Production in Floating Devices on Water. Forest 2009, 1, 4189–4192. [Google Scholar] [CrossRef]
- Ming, B.; Liu, P.; Cheng, L.; Zhou, Y.; Wang, X. Optimal daily generation scheduling of large hydro–photovoltaic hybrid power plants. Energy Convers. Manag. 2018, 171, 528–540. [Google Scholar] [CrossRef]
- Spencer, R.S.; Macknick, J.; Aznar, A.; Warren, A.; Reese, M.O. Floating Photovoltaic Systems: Assessing the Technical Potential of Photovoltaic Systems on Man-Made Water Bodies in the Continental United States. Environ. Sci. Technol. 2018, 53, 1680–1689. [Google Scholar] [CrossRef]
- Serrano-González, J.; Lacal-Arántegui, R. Technological evolution of onshore wind turbines—A market-based analysis. Wind. Energy 2016, 19, 2171–2187. [Google Scholar] [CrossRef] [Green Version]
- Sliz-Szkliniarz, B.; Eberbach, J.; Hoffmann, B.; Fortin, M. Assessing the cost of onshore wind development scenarios: Modelling of spatial and temporal distribution of wind power for the case of Poland. Renew. Sustain. Energy Rev. 2019, 109, 514–531. [Google Scholar] [CrossRef]
- Ladenburg, J.; Hevia-Koch, P.; Petrović, S.; Knapp, L. The offshore-onshore conundrum: Preferences for wind energy considering spatial data in Denmark. Renew. Sustain. Energy Rev. 2020, 121, 109711. [Google Scholar] [CrossRef]
- Jin, X.; Rong, Y.; Zhong, X. Wind turbine manufacturing industry in China: Current situation and problems. Renew. Sustain. Energy Rev. 2014, 33, 729–735. [Google Scholar] [CrossRef]
- Hughes, F.M.; Anaya-Lara, O.; Ramtharan, G.; Jenkins, N.; Strbac, G. Influence of tower shadow and wind turbulence on the performance of power system stabilizers for DFIG-based wind farms. IEEE Trans. Energy Convers. 2008, 23, 519–528. [Google Scholar] [CrossRef]
- Liu, C.; Xu, D.; Zhu, N.; Blaabjerg, F.; Chen, M. DC-Voltage Fluctuation Elimination Through a DC-Capacitor Current Control for DFIG Converters Under Unbalanced Grid Voltage Conditions. IEEE Trans. Power Electron. 2012, 28, 3206–3218. [Google Scholar] [CrossRef]
- Jiang, L.; Chi, Y.; Qin, H.; Pei, Z.; Li, Q.; Liu, M.; Bai, J.; Wang, W.; Feng, S.; Kong, W.; et al. Wind energy in China. IEEE Power Energy Mag. 2011, 9, 36–46. [Google Scholar] [CrossRef]
- Feng, Y.; Lin, H.; Ho, S.L.; Yan, J.; Dong, J.; Fang, S.; Huang, Y. Overview of wind power generation in China: Status and development. Renew. Sustain. Energy Rev. 2015, 50, 847–858. [Google Scholar] [CrossRef]
- Vittal, E.; O’Malley, M.; Keane, A. Rotor Angle Stability with High Penetrations of Wind Generation. IEEE Trans. Power Syst. 2011, 27, 353–362. [Google Scholar] [CrossRef]
- Swarna, K.S.V.; Vinayagam, A.; Yang Khoo, S.; Stojcevski, A. Impacts of Integration of Wind and Solar PV in a Typical Power Network. In Proceedings of the 2015 International Conference on Sustainable Energy and Environmental Engineering, Shenzhen, China, 20–21 December 2015. [Google Scholar]
- International Renewable Energy Agency (IRENA). Renewables Readiness Assessment (RRA); IRENA: New York, NY, USA, 2013. [Google Scholar]
- ESMAP (World Bank). Wind Resource Mapping in Zambia—Mesoscale Wind Modelling Report, July 2015; World Bank: Washington, DC, USA, 2015. [Google Scholar]
- ESMAP (World Bank). Wind Resource Mapping in Zambia—12 Month Site Resource Report, May 2018; World Bank: Washington, DC, USA, 2018. [Google Scholar]
- CSO—Central Statistical Office, Republic of Zambia. 2019. Available online: https://knoema.com/atlas/sources/CSO-ZM (accessed on 27 May 2021).
- USAID Southern Africa Energy Program. Zambia Power Sector Assessment; USAID: Pretoria, South Africa, 2018.
- Chidumayo, E.N. Handbook on Miombo Ecology and Management; Stockholm Environmental Institute: Stockholm, Sweden, 1996. [Google Scholar]
- Shane, A.; Gheewala, S.H.; Fungtammasan, B.; Silalertruksa, T.; Bonnet, S.; Phiri, S. Bioenergy resource assessment for Zambia. Renew. Sustain. Energy Rev. 2016, 53, 93–104. [Google Scholar] [CrossRef]
- ZESCO. Zambia Electricity Supply Corporation. 2020. Available online: https://www.zesco.co.zm/ (accessed on 20 May 2021).
- Shah, R.; Mithulananthan, N.; Bansal, R.; Ramachandaramurthy, V. A review of key power system stability challenges for large-scale PV integration. Renew. Sustain. Energy Rev. 2015, 41, 1423–1436. [Google Scholar] [CrossRef]
- Ding, M.; Xu, Z.; Wang, W.; Wang, X.; Song, Y.; Chen, D. A review on China’s large-scale PV integration: Progress, challenges and recommendations. Renew. Sustain. Energy Rev. 2016, 53, 639–652. [Google Scholar] [CrossRef]
- Mararakanye, N.; Bekker, B. Renewable energy integration impacts within the context of generator type, penetration level and grid characteristics. Renew. Sustain. Energy Rev. 2019, 108, 441–451. [Google Scholar] [CrossRef]
- Li, J.; Liu, F.; Li, Z.; Shao, C.; Liu, X. Grid-side flexibility of power systems in integrating large-scale renewable generations: A critical review on concepts, formulations and solution approaches. Renew. Sustain. Energy Rev. 2018, 93, 272–284. [Google Scholar] [CrossRef] [Green Version]
- Matschoss, P.; Bayer, B.; Thomas, H.; Marian, A. The German incentive regulation and its practical impact on the grid integration of renewable energy systems. Renew. Energy 2018, 134, 727–738. [Google Scholar] [CrossRef]
- Rauf, H.; Gull, M.S.; Arshad, N. Complementing hydroelectric power with floating solar PV for daytime peak electricity demand. Renew. Energy 2020, 162, 1227–1242. [Google Scholar] [CrossRef]
- Chen, Y.; Wei, W.; Liu, F.; Mei, S. Distributionally robust hydro-thermal-wind economic dispatch. Appl. Energy 2016, 173, 511–519. [Google Scholar] [CrossRef]
- Deshmukh, M.; Deshmukh, S. Modeling of hybrid renewable energy systems. Renew. Sustain. Energy Rev. 2008, 12, 235–249. [Google Scholar] [CrossRef]
- Paska, J.; Biczel, P.; Kłos, M. Hybrid power systems—An effective way of utilising primary energy sources. Renew. Energy 2009, 34, 2414–2421. [Google Scholar] [CrossRef]
- Campana, P.E.; Li, H.; Yan, J. Dynamic modelling of a PV pumping system with special consideration on water demand. Appl. Energy 2013, 112, 635–645. [Google Scholar] [CrossRef] [Green Version]
- Glasnovic, Z.; Margeta, J. Optimal sizing of photovoltaic-hydro power plant. Prog. Photovolt. Res. Appl. 2009, 17, 542–553. [Google Scholar] [CrossRef]
- Chen, J.; Zhuang, Y.; Li, Y.; Wang, P.; Zhao, Y.; Zhang, C. Risk-aware short term hydro-wind-thermal scheduling using a probability interval optimization model. Appl. Energy 2017, 189, 534–554. [Google Scholar] [CrossRef]
- Bayón, L.; Grau, J.M.; Ruiz, M.; Suárez, P. A comparative economic study of two configurations of hydro-wind power plants. Energy 2016, 112, 8–16. [Google Scholar] [CrossRef]
- Portero, U.; Velázquez, S.; Carta, J.A. Sizing of a wind-hydro system using a reversible hydraulic facility with seawater. A case study in the Canary Islands. Energy Convers. Manag. 2015, 106, 1251–1263. [Google Scholar] [CrossRef]
- Wang, X.; Mei, Y.; Kong, Y.; Lin, Y.; Wang, H. Improved multi-objective model and analysis of the coordinated operation of a hydro-wind-photovoltaic system. Energy 2017, 134, 813–839. [Google Scholar] [CrossRef]
- Liu, Y.; Tan, S.; Jiang, C. Interval optimal scheduling of hydro-PV-wind hybrid system considering firm generation coordination. IET Renew. Power Gener. 2016, 11, 63–72. [Google Scholar] [CrossRef]
- Maronga, A.; Nyoni, K.J.; Tuohy, P.; Shane, A. Modelling and assessing CSP and PV systems technical and economic performances to supply power to a mining context in Zimbabwe. Energies 2021, 14, 3740. [Google Scholar] [CrossRef]
- Shabani, M.; Mahmoudimehr, J. Techno-economic role of PV tracking technology in a hybrid PV-hydroelectric standalone power system. Appl. Energy 2018, 212, 84–108. [Google Scholar] [CrossRef]
- Beluco, A.; de Souza, P.K.; Krenzinger, A. A method to evaluate the effect of complementarity in time between hydro and solar energy on the performance of hybrid hydro PV generating plants. Renew. Energy 2012, 45, 24–30. [Google Scholar] [CrossRef]
- François, B.; Borga, M.; Creutin, J.; Hingray, B.; Raynaud, D.; Sauterleute, J. Complementarity between solar and hydro power: Sensitivity study to climate characteristics in Northern-Italy. Renew. Energy 2016, 86, 543–553. [Google Scholar] [CrossRef]
- Kougias, I.; Szabo, S.; Monforti-Ferrario, F.; Huld, T.; Bodis, K. A methodology for optimization of the complementarity between small-hydropower plants and solar PV systems. Renew. Energy 2016, 87, 1023–1030. [Google Scholar] [CrossRef]
- Jurasz, J.; Ciapała, B. Integrating photovoltaics into energy systems by using a run-off-river power plant with pondage to smooth energy exchange with the power gird. Appl. Energy 2017, 198, 21–35. [Google Scholar] [CrossRef]
- Fang, W.; Huang, Q.; Huang, S.; Yang, J.; Meng, E.; Li, Y. Optimal sizing of utility-scale photovoltaic power generation complementarily operating with hydropower: A case study of the world’s largest hydro-photovoltaic plant. Energy Convers. Manag. 2017, 136, 161–172. [Google Scholar] [CrossRef]
- Chen, L.; Liu, Y. Scheduling strategy of hybrid wind-photovoltaic-hydro power generation system. In Proceedings of the International Conference on Sustainable Power Generation and Supply (SUPERGEN 2012), Hangzhou, China, 8–9 September 2012. [Google Scholar]
- Yang, X.; Wang, W.; Xue, B.; Huang, Q. On short-term united optimal operation of wind power, thermal power and waterpower. J. Hydroelectr. Eng. 2013, 4, 199–203. [Google Scholar]
- Yang, X.; Chen, Q.; Wang, M.; Zhang, L. Cooperating control for wind farm and hydro power plant based on the fruit fly optimization. Proc. Chin. Soc. Electr. Eng. 2017, 37, 5286–5293. [Google Scholar]
- Wei, P.; Liu, Y. The Integration of Wind-Solar-Hydropower Generation in Enabling Economic Robust Dispatch. Math. Probl. Eng. 2019, 2019, 4634131. [Google Scholar] [CrossRef]
- Dong, W.; Wang, Q.; Yang, L. A coordinated dispatching model for a distribution utility and virtual power plants with wind/photovoltaic/hydro generators. Autom. Electr. Power Syst. 2015, 39, 75–81. [Google Scholar]
- Zou, Y.; Yang, L. Synergetic dispatch models of a wind/PV/hydro virtual power plant based on representative scenario set. Power Syst. Technol. 2015, 39, 1855–1859. [Google Scholar]
- Liu, Y.; Guo, L.; Wang, C. Economic dispatch of microgrid based on two stage robust optimization. Proc. CSEE 2018, 38, 4013–4022. [Google Scholar]
- Reddy, S.S. Optimal scheduling of wind-thermal power system using clustered adaptive teaching learning based optimization. Electr. Eng. 2017, 99, 535–550. [Google Scholar] [CrossRef]
- Reddy, S.S.; Bijwe, P. Real time economic dispatch considering renewable energy resources. Renew. Energy 2015, 83, 1215–1226. [Google Scholar] [CrossRef]
- Ali, S.; Taweekun, J.; Techato, K.; Waewsak, J.; Gyawali, S. GIS based site suitability assessment for wind and solar farms in Songkhla, Thailand. Renew. Energy 2018, 132, 1360–1372. [Google Scholar] [CrossRef]
- Harper, M.; Anderson, B.; James, P.; Bahaj, A. Identifying suitable locations for onshore wind turbines using a GIS-MCDA approach. In Proceedings of the 16th International Conference on Sustainable Energy Technologies, Bologna, Italy, 17–20 July 2017. [Google Scholar]
- Sunak, Y.; Höfer, T.; Siddique, H.; Madlener, R.; De Doncker, R.W. A GIS-Based Decision Support System for the Optimal Siting of Wind Farm Projects; E.ON Energy Research Center: Aachen, Germany, 2015. [Google Scholar]
- Malczewski, J. GIS-based land-use suitability analysis: A critical overview. Prog. Plan. 2004, 62, 3–65. [Google Scholar] [CrossRef]
- Voivontas, D.; Assimacopoulos, D.; Mourelatos, A.; Corominas, J. Evaluation of Renewable Energy potential using a GIS decision support system. Renew. Energy 1998, 13, 333–344. [Google Scholar] [CrossRef]
- Baban, S.M.; Parry, T. Developing and applying a GIS-assisted approach to locating wind farms in the UK. Renew. Energy 2001, 24, 59–71. [Google Scholar] [CrossRef]
- Gigović, L.; Pamučar, D.; Božanić, D.; Ljubojević, S. Application of the GIS-DANP-MABAC multi-criteria model for selecting the location of wind farms: A case study of Vojvodina, Serbia. Renew. Energy 2017, 103, 501–521. [Google Scholar] [CrossRef]
- Watson, J.J.; Hudson, M.D. Regional Scale wind farm and solar farm suitability assessment using GIS-assisted multi-criteria evaluation. Landsc. Urban Plan. 2015, 138, 20–31. [Google Scholar] [CrossRef]
- Höfer, T.; Sunak, Y.; Siddique, H.; Madlener, R. Wind farm siting using a spatial Analytic Hierarchy Process approach: A case study of the Städteregion Aachen. Appl. Energy 2016, 163, 222–243. [Google Scholar] [CrossRef]
- Latinopoulos, D.; Kechagia, K. A GIS-based multi-criteria evaluation for wind farm site selection. A regional scale application in Greece. Renew. Energy 2015, 78, 550–560. [Google Scholar] [CrossRef]
- Uyan, M. GIS-based solar farms site selection using analytic hierarchy process (AHP) in Karapinar region, Konya/Turkey. Renew. Sustain. Energy Rev. 2013, 28, 11–17. [Google Scholar] [CrossRef]
- Aragonés-Beltrán, P.; Chaparro-González, F.; Pastor-Ferrando, J.; Rodríguez-Pozo, F. An ANP-based approach for the selection of photovoltaic solar power plant investment projects. Renew. Sustain. Energy Rev. 2010, 14, 249–264. [Google Scholar] [CrossRef]
- Rojas-Zerpa, J.C.; Yusta, J.M. Application of multicriteria decision methods for electric supply planning in rural and remote areas. Renew. Sustain. Energy Rev. 2015, 52, 557–571. [Google Scholar] [CrossRef]
- Campos-Guzmán, V.; García-Cáscales, M.S.; Espinosa, N.; Urbina, A. Life Cycle Analysis with Multi-Criteria Decision Making: A review of approaches for the sustainability evaluation of renewable energy technologies. Renew. Sustain. Energy Rev. 2019, 104, 343–366. [Google Scholar] [CrossRef]
- Rediske, G.; Siluk, J.C.M.; Michels, L.; Rigo, P.; Rosa, C.B.; Cugler, G. Multi-criteria decision-making model for assessment of large photovoltaic farms in Brazil. Energy 2020, 197, 117167. [Google Scholar] [CrossRef]
- Ridha, H.M.; Gomes, C.; Hizam, H.; Ahmadipour, M.; Heidari, A.A.; Chen, H. Multi-objective optimization and multi-criteria decision-making methods for optimal design of standalone photovoltaic system: A comprehensive review. Renew. Sustain. Energy Rev. 2011, 135, 110202. [Google Scholar] [CrossRef]
- Charabi, Y.; Gastli, A. PV site suitability analysis using GIS-based spatial fuzzy multi-criteria evaluation. Renew. Energy 2011, 36, 2554–2561. [Google Scholar] [CrossRef]
- Kim, S.; Lee, Y.; Moon, H.-R. Siting criteria and feasibility analysis for PV power generation projects using road facilities. Renew. Sustain. Energy Rev. 2018, 81, 3061–3069. [Google Scholar] [CrossRef]
- Dhiman, H.S.; Deb, D. Fuzzy TOPSIS and fuzzy COPRAS based multi-criteria decision making for hybrid wind farms. Energy 2020, 202, 117755. [Google Scholar] [CrossRef]
- Deveci, M.; Cali, U.; Kucuksari, S.; Erdogan, N. Interval type-2 fuzzy sets based multi-criteria decision-making model for offshore wind farm development in Ireland. Energy 2020, 198, 117317. [Google Scholar] [CrossRef]
- Mahdy, M.; Bahaj, A. Multi criteria decision analysis for offshore wind energy potential in Egypt. Renew. Energy 2018, 118, 278–289. [Google Scholar] [CrossRef]
- Noorollahi, Y.; Yousefi, H.; Mohammadi, M. Multi-criteria decision support system for wind farm site selection using GIS. Sustain. Energy Technol. Assess. 2016, 13, 38–50. [Google Scholar] [CrossRef]
- Moradi, S.; Yousefi, H.; Noorollahi, Y.; Rosso, D. Multi-criteria decision support system for wind farm site selection and sensitivity analysis: Case study of Alborz Province, Iran. Energy Strat. Rev. 2020, 29, 100478. [Google Scholar] [CrossRef]
- Cunden, T.S.; Doorga, J.; Lollchund, M.R.; Rughooputh, S.D. Multi-level constraints wind farms siting for a complex terrain in a tropical region using MCDM approach coupled with GIS. Energy 2020, 211, 118533. [Google Scholar] [CrossRef]
- Supciller, A.A.; Toprak, F. Selection of wind turbines with multi-criteria decision making techniques involving neutrosophic numbers: A case from Turkey. Energy 2020, 207, 118237. [Google Scholar] [CrossRef]
- Xu, Y.; Li, Y.; Zheng, L.; Cui, L.; Li, S.; Li, W.; Cai, Y. Site selection of wind farms using GIS and multi-criteria decision making method in Wafangdian, China. Energy 2020, 207, 118222. [Google Scholar] [CrossRef]
- Jangid, J.; Bera, A.K.; Joseph, M.; Singh, V.; Singh, T.; Pradhan, B.; Das, S. Potential zones identification for harvesting wind energy resources in desert region of India—A multi criteria evaluation approach using remote sensing and GIS. Renew. Sustain. Energy Rev. 2016, 65, 1–10. [Google Scholar] [CrossRef]
- Janke, J.R. Multicriteria GIS modeling of wind and solar farms in Colorado. Renew. Energy 2010, 35, 2228–2234. [Google Scholar] [CrossRef]
- Chimres, N.; Wongwises, S. Critical review of the current status of solar energy in Thailand. Renew. Sustain. Energy Rev. 2016, 58, 198–207. [Google Scholar] [CrossRef]
- Al Garni, H.Z.; Awasthi, A. Solar PV power plant site selection using a GIS-AHP based approach with application in Saudi Arabia. Appl. Energy 2017, 206, 1225–1240. [Google Scholar] [CrossRef]
- Krewitt, W.; Nitsch, J. The potential for electricity generation from on-shore wind energy under the constraints of nature conservation: A case study for two regions in Germany. Renew. Energy 2003, 28, 1645–1655. [Google Scholar] [CrossRef]
- Ho, C.; Sims, C.; Christian, J. Evaluation of Glare at the Ivanpah Solar Electric Generating System. Energy Procedia 2015, 69, 1296–1305. [Google Scholar] [CrossRef] [Green Version]
- Yue, C.-D.; Wang, S.-S. GIS-based evaluation of multifarious local renewable energy sources: A case study of the Chigu area of southwestern Taiwan. Energy Policy 2006, 34, 730–742. [Google Scholar] [CrossRef]
- Tanavud, C.; Yongchalermchai, C.; Bennui, A.; Densreeserekul, O. Assessment of flood risk in Hat Yai Municipality, Southern Thailand, using GIS. J. Nat. Disaster Sci. 2004, 26, 1–14. [Google Scholar] [CrossRef] [Green Version]
- Ghenai, C.; Albawab, M.; Bettayeb, M. Sustainability indicators for renewable energy systems using multi-criteria decision-making model and extended SWARA/ARAS hybrid method. Renew. Energy 2019, 146, 580–597. [Google Scholar] [CrossRef]
- Shao, M.; Han, Z.; Sun, J.; Xiao, C.; Zhang, S.; Zhao, Y. A review of multi-criteria decision making applications for renewable energy site selection. Renew. Energy 2020, 157, 377–403. [Google Scholar] [CrossRef]
- Van Rensburg, T.M.; Kelley, H.; Jeserich, N. What influences the probability of wind farm planning approval: Evidence from Ireland. Ecol. Econ. 2015, 111, 12–22. [Google Scholar] [CrossRef]
- Sichilalu, S.; Wamalwa, F.; Akinlabi, E.T. Optimal control of wind-hydrokinetic pumpback hydropower plant con-strained with ecological water flows. Renew. Energy 2019, 138, 54–69. [Google Scholar] [CrossRef]
- Asaduz-Zaman, M.; Rahaman, M.H.; Reza, M.S.; Islam, M.M. A Method for Distributed Generator Dispatch Strategy in Distribution Network. J. Electr. Eng. 2018, 6, 261–270. [Google Scholar] [CrossRef]
- Emmanuel, M.; Rayudu, R. Evolution of dispatchable photovoltaic system integration with the electric power network for smart grid applications: A review. Renew. Sustain. Energy Rev. 2017, 67, 207–224. [Google Scholar] [CrossRef]
- Loudiyi, K.; Berrada, A.; Svendsen, H.G.; Mentesidi, K. Grid code status for wind farms interconnection in Northern Africa and Spain: Descriptions and recommendations for Northern Africa. Renew. Sustain. Energy Rev. 2018, 81, 2584–2598. [Google Scholar] [CrossRef]
- Shafiullah, G.; Oo, A.M.; Ali, A.S.; Wolfs, P. Potential challenges of integrating large-scale wind energy into the power grid–A review. Renew. Sustain. Energy Rev. 2013, 20, 306–321. [Google Scholar] [CrossRef]
- Saqib, M.A.; Saleem, A.Z. Power-quality issues and the need for reactive-power compensation in the grid integration of wind power. Renew. Sustain. Energy Rev. 2015, 43, 51–64. [Google Scholar] [CrossRef]
- Rona, B.; Güler, O. Power system integration of wind farms and analysis of grid code requirements. Renew. Sustain. Energy Rev. 2015, 49, 100–107. [Google Scholar] [CrossRef]
- Mohseni, M.; Islam, S. Review of international grid codes for wind power integration: Diversity, technology and a case for global standard. Renew. Sustain. Energy Rev. 2012, 16, 3876–3890. [Google Scholar] [CrossRef]
- Shaker, H.; Zareipour, H.; Wood, D. Impacts of large-scale wind and solar power integration on California’s net electrical load. Renew. Sustain. Energy Rev. 2016, 58, 761–774. [Google Scholar] [CrossRef]
- Zappa, W.; Broek, M.V.D. Analysing the potential of integrating wind and solar power in Europe using spatial optimisation under various scenarios. Renew. Sustain. Energy Rev. 2018, 94, 1192–1216. [Google Scholar] [CrossRef]
- Viviescas, C.; Lima, L.; Diuana, F.A.; Vasquez, E.; Ludovique, C.; Silva, G.N.; Huback, V.; Magalar, L.; Szklo, A.; Lucena, A.F.; et al. Contribution of Variable Renewable Energy to increase energy security in Latin America: Complementarity and climate change impacts on wind and solar resources. Renew. Sustain. Energy Rev. 2019, 113, 109232. [Google Scholar] [CrossRef]
- Liu, L.; Wang, Z.; Wang, Y.; Wang, J.; Chang, R.; He, G.; Tang, W.; Gao, Z.; Li, J.; Liu, C.; et al. Optimizing wind/solar combinations at finer scales to mitigate renewable energy variability in China. Renew. Sustain. Energy Rev. 2020, 132, 110151. [Google Scholar] [CrossRef]
- Sterl, S.; Donk, P.; Willems, P.; Thiery, W. Turbines of the Caribbean: Decarbonising Suriname’s electricity mix through hydro-supported integration of wind power. Renew. Sustain. Energy Rev. 2020, 134, 110352. [Google Scholar] [CrossRef]
- Nghitevelekwa, K.; Bansal, R. A review of generation dispatch with large-scale photovoltaic systems. Renew. Sustain. Energy Rev. 2018, 81, 615–624. [Google Scholar] [CrossRef]
- Boqiang, R.; Chuanwen, J. A review on the economic dispatch and risk management considering wind power in the power market. Renew. Sustain. Energy Rev. 2009, 13, 2169–2174. [Google Scholar] [CrossRef]
- Cheng, C.; Liu, B.; Chau, K.-W.; Li, G.; Liao, S. China’s small hydropower and its dispatching management. Renew. Sustain. Energy Rev. 2015, 42, 43–55. [Google Scholar] [CrossRef]
- Das, H.S.; Yatim, A.; Tan, C.W.; Lau, K.Y. Proposition of a PV/tidal powered micro-hydro and diesel hybrid system: A southern Bangladesh focus. Renew. Sustain. Energy Rev. 2016, 53, 1137–1148. [Google Scholar] [CrossRef]
- Dallinger, B.; Schwabeneder, D.; Lettner, G.; Auer, H. Socio-economic benefit and profitability analyses of Austrian hydro storage power plants supporting increasing renewable electricity generation in Central Europe. Renew. Sustain. Energy Rev. 2019, 107, 482–496. [Google Scholar] [CrossRef]
- Schmidt, J.; Cancella, R.; Junior, A.O.P. The effect of windpower on long-term variability of combined hydro-wind resources: The case of Brazil. Renew. Sustain. Energy Rev. 2016, 55, 131–141. [Google Scholar] [CrossRef]
- Upadhyay, S.; Sharma, M. A review on configurations, control and sizing methodologies of hybrid energy systems. Renew. Sustain. Energy Rev. 2014, 38, 47–63. [Google Scholar] [CrossRef]
- Mukhopadhyay, B.; Das, D. Multi-objective dynamic and static reconfiguration with optimized allocation of PV-DG and battery energy storage system. Renew. Sustain. Energy Rev. 2020, 124, 109777. [Google Scholar] [CrossRef]
- Bird, L.; Lew, D.; Milligan, M.; Carlini, E.M.; Estanqueiro, A.; Flynn, D.; Gomez-Lazaro, E.; Holttinen, H.; Menemenlis, N.; Orths, A.; et al. Wind and solar energy curtailment: A review of international experience. Renew. Sustain. Energy Rev. 2016, 65, 577–586. [Google Scholar] [CrossRef] [Green Version]
- PVSyst Help Manual. Available online: https://www.pvsyst.com/help/ (accessed on 1 July 2020).
- RES4Africa. Integration of Variable Renewable Energy Sources in the National Electric System of Zambia. Available online: https://www.res4africa.org/wp-content/uploads/2020/10/R4AF-Integration-of-Variable-Renewable-Energy-Sources-in-the-National-Electric-System-of-Zambia.pdf (accessed on 30 June 2021).
- International Renewable Energy Agency—IRENA. Renewable Power Generation Costs in 2019; IRENA: Abu Dhabi, United Arab Emirates, 2020. [Google Scholar]


| Reservoir/Dam | Country | Dam Size (km2) | Hydropower (GW) | % Dam Area for FPV to Match Hydropower |
|---|---|---|---|---|
| Aswan Dam | Egypt | 5000 | 2.0 | <1 */<1(0.68) |
| Attaturk Dam | Turkey | 820 | 2.4 | 3 */5 |
| Bakun Dam | Malaysia | 690 | 2.4 | 3 */6 |
| Guri Dam | Venezuela | 4250 | 10.2 | 2 */4 |
| Itezhi-tezhi Dam | Zambia | 113 | 0.12 | 1 */2 |
| Kafue Gorge Upper | Zambia | 70 | 0.99 | 14 */24 |
| Kariba North Bank | Zambia | 4354 | 1.08 | <1 */<1(0.42) |
| Lake Volta | Ghana | 8500 | 1.0 | <1 */<1(0.2) |
| Narmada Dam | India | 375 | 1.5 | 4 */7 |
| Sobradinho Lake | Brazil | 4220 | 1.0 | <1 */<1(0.4) |
| No | Hydro Power Station | Coordinates | Rating (MW) | Owner | River | Country | Type | Note |
|---|---|---|---|---|---|---|---|---|
| 1 | Kafue Gorge Upper | 15°48′25.0″ S 28°25′16.0″ E | 990 | Zesco | Kafue | Zambia | Reservoir | Grid |
| 2 | Kariba North Bank | 16°31′20.0″ S 28°45′42.0″ E | 1080 | Zesco | Zambezi | Zambia | Reservoir | Grid |
| 3 | Kafue Gorge Lower | 15°53′46.0″ S 28°33′33.0″ E | 750 | Zesco | Kafue | Zambia | RoR | Grid |
| 4 | Itezhi-Tezhi | 15°45′55.0″ S 26°01′05.0″ E | 120 | Zesco/ITPC | Kafue | Zambia | Reservoir | Grid |
| 5 | Lusiwasi Upper | 12°59′18.2″ S 30°51′53.6″ E | 15 | Zesco | Lusiwasi | Zambia | Pondage | Grid |
| 6 | Lusiwasi Lower | 12°59′18.2″ S 30°51′53.6″ E | 12 | Zesco | Lusiwasi | Zambia | Pondage | Grid |
| 7 | Lunzua | 8°48′06.4″ S 31°20′18.3″ E | 14.8 | Zesco | Lunzua | Zambia | RoR | Grid |
| 8 | Musonda | 10°42′39.5″ S 28°48′23.1″ E | 10 | Zesco | Luongo | Zambia | RoR | Grid |
| 9 | Chishimba | 10°06′29.8″ S 30°55′02.7″ E | 6 | Zesco | Luombe | Zambia | RoR | Grid |
| 10 | Shiwangandu | 11°13′10.25″ S 31°45′0.61″ E | 1 | Zesco | Munshya | Zambia | RoR | Grid |
| 11 | Lunsemfwa Hydro | 14°29′33.7″ S 29°06′54.6″ E | 24 | LHPC | Lunsemfwa | Zambia | Reservoir | Grid |
| 12 | Mulungushi Hydro | 14°43′47.48″ S 28°50′39.22″ E | 32 | LHPC | Lunsemfwa | Zambia | Reservoir | Grid |
| 13 | Victoria Falls | 17°55′52.5″ S 25°51′37.9″ E | 108 | Zesco | Zambezi | Zambia | RoR | Grid |
| 14 | Zengamina | 11°07′26.0″ S 24°11′32.0″ E | 0.7 | NWZDT | Zambia | RoR | Off-Grid |
| ID # | Name of Site (FPV and Wind) | Screening Criteria (Yes/No) | ||||||
|---|---|---|---|---|---|---|---|---|
| Capacity Factor | Area | Distance to Protected Zone | Distance to Grid/Substation | Flicker and Noise Distance | Wind Speed (m/s) | Security Risk | ||
| Site 1 | KGU | Yes | Yes | Yes | Yes | Yes | Yes | Yes |
| Site 2 | Kariba | Yes | Yes | Yes | Yes | Yes | Yes | Yes |
| Site 3 | KGL FPV | Yes | Yes | Yes | Yes | Yes | Yes | Yes |
| Site 4 | Itezhi-Tezhi | Yes | Yes | Yes | Yes | Yes | Yes | Yes |
| Site 5 | Lusiwasi | Yes | Yes | Yes | Yes | Yes | Yes | Yes |
| Site 6 | Lunzua | Yes | No | Yes | Yes | Yes | Yes | Yes |
| Site 7 | Musonda | Yes | Yes | Yes | Yes | Yes | Yes | Yes |
| Site 8 | Chishimba | Yes | Yes | Yes | Yes | Yes | Yes | Yes |
| Site 9 | Shiwangandu | Yes | Yes | Yes | Yes | Yes | Yes | Yes |
| Site 10 | Lunsemfwa | Yes | Yes | Yes | Yes | Yes | Yes | Yes |
| Site 11 | Mulungushi | Yes | Yes | Yes | Yes | Yes | Yes | Yes |
| Site 12 | Victoria FPV | Yes | No | Yes | Yes | Yes | Yes | Yes |
| Site 13 | Zengamina | Yes | No | Yes | Yes | Yes | Yes | No |
| Wind Potential | FPV Potential | Energy Export | Ease of Access | Demand | Site Total | ||
|---|---|---|---|---|---|---|---|
| Score * (25% Weight) | Score * (35% Weight) | Score * (20% Weight) | Score * (15% Weight) | Score * (5% Weight) | (100% Weight) | ||
| Rank # | Name of Site | Wind ∑ | FPV ∑ | Export ∑ | Access ∑ | Demand ∑ | Score * Weight |
| =1 | Itezhi-tezhi FPV/wind site | 22.5% | 35.0% | 12.5% | 15.0% | 5.0% | 90.0% |
| =2 | KGU FPV/wind site | 21.3% | 30.6% | 18.8% | 11.3% | 5.0% | 86.9% |
| =3 | KGL FPV/wind site | 25.0% | 26.3% | 15.0% | 13.8% | 5.0% | 85.0% |
| =3 | Kariba FPV/wind site | 18.8% | 26.3% | 20.0% | 15.0% | 5.0% | 85.0% |
| =3 | Lusiwasi FPV/wind site | 20.0% | 35.0% | 12.5% | 15.0% | 2.5% | 85.0% |
| =6 | Musonda FPV/wind site | 22.5% | 30.6% | 8.8% | 15.0% | 2.5% | 79.4% |
| =6 | Mulungushi FPV/wind site | 22.5% | 30.6% | 10.0% | 13.8% | 2.5% | 79.4% |
| =8 | Shiwangangu FPV/wind site | 21.3% | 26.3% | 12.5% | 13.8% | 2.5% | 76.3% |
| =9 | Lunsemfwa FPV/wind site | 25.0% | 21.9% | 8.8% | 15.0% | 2.5% | 73.1% |
| =10 | Chishimba FPV/wind site | 20.0% | 21.9% | 11.3% | 15.0% | 2.5% | 70.6% |
| FPV (116 MWpdc/100 MWac) | Wind (100 MWac) | FPV + Wind | |
|---|---|---|---|
| CAPEX | GBP 80,233,200.00 | GBP 109,393,980.00 | GBP 189,627,180.00 |
| GBP 0.69/kWp | GBP 1.09/kWp | GBP 0.88/kWp | |
| OPEX | GBP 1,679,083.20 | GBP 2,00,000.00 | GBP 3,264,503.20 |
| GBP 0.017/kWp | GBP 0.02/kWp | GBP 0.017/kWp | |
| GWh/year | 214.4 (in PVSyst) @ 100 MWac output. 175 (Homerpro) @ 96 MWpac output. | 295 (in Renewables Ninja) @ 100 MW. 166 (in Homperpro) @ 75 MW output | 513 (PVSyst + Renewables Ninja). 341 (in Homerpro) |
Publisher’s Note: MDPI stays neutral with regard to jurisdictional claims in published maps and institutional affiliations. |
© 2021 by the authors. Licensee MDPI, Basel, Switzerland. This article is an open access article distributed under the terms and conditions of the Creative Commons Attribution (CC BY) license (https://creativecommons.org/licenses/by/4.0/).
Share and Cite
Nyoni, K.J.; Maronga, A.; Tuohy, P.G.; Shane, A. Hydro–Connected Floating PV Renewable Energy System and Onshore Wind Potential in Zambia. Energies 2021, 14, 5330. https://doi.org/10.3390/en14175330
Nyoni KJ, Maronga A, Tuohy PG, Shane A. Hydro–Connected Floating PV Renewable Energy System and Onshore Wind Potential in Zambia. Energies. 2021; 14(17):5330. https://doi.org/10.3390/en14175330
Chicago/Turabian StyleNyoni, Kumbuso Joshua, Anesu Maronga, Paul Gerard Tuohy, and Agabu Shane. 2021. "Hydro–Connected Floating PV Renewable Energy System and Onshore Wind Potential in Zambia" Energies 14, no. 17: 5330. https://doi.org/10.3390/en14175330
APA StyleNyoni, K. J., Maronga, A., Tuohy, P. G., & Shane, A. (2021). Hydro–Connected Floating PV Renewable Energy System and Onshore Wind Potential in Zambia. Energies, 14(17), 5330. https://doi.org/10.3390/en14175330