Article

Heuristic Methodology for Planning AC Rural Medium-Voltage Distribution Grids

by
Oscar Danilo Montoya
1,2,*,
Federico Martin Serra
3,
Cristian Hernan De Angelo
4,
Harold R. Chamorro
5,* and
Lazaro Alvarado-Barrios
6
1
Facultad de Ingeniería, Universidad Distrital Francisco José de Caldas, Bogotá 110231, Colombia
2
Laboratorio Inteligente de Energía, Universidad Tecnológica de Bolívar, Cartagena 131001, Colombia
3
Laboratorio de Control Automático (LCA), Facultad de Ingeniería y Ciencias Agropecuarias, Universidad Nacional de San Luis—CONICET, San Luis 5730, Argentina
4
Grupo de Electrónica Aplicada (GEA), Facultad de Ingeniería, Instituto de Investigaciones en Tecnologías Energéticas y Materiales (IITEMA)—CONICET, Universidad Nacional de Rio Cuarto, Córdoba 5800, Argentina
5
Department of Electrical Engineering at KTH, Royal Institute of Technology, SE-100 44 Stockholm, Sweden
6
Department of Engineering, Universidad Loyola Andalucía, 41704 Sevilla, Spain
*
Authors to whom correspondence should be addressed.
Energies 2021, 14(16), 5141; https://doi.org/10.3390/en14165141
Submission received: 21 June 2021 / Revised: 12 August 2021 / Accepted: 18 August 2021 / Published: 20 August 2021
(This article belongs to the Special Issue Rural Renewable Energy Utilization and Electrification)

Abstract

:
The optimal expansion of AC medium-voltage distribution grids for rural applications is addressed in this study from a heuristic perspective. The optimal routes of a distribution feeder are selected by applying the concept of a minimum spanning tree by limiting the number of branches that are connected to a substation (mixed-integer linear programming formulation). In order to choose the caliber of the conductors for the selected feeder routes, the maximum expected current that is absorbed by the loads is calculated, thereby defining the minimum thermal bound of the conductor caliber. With the topology and the initial selection of the conductors, a tabu search algorithm (TSA) is implemented to refine the solution with the help of a three-phase power flow simulation in MATLAB for three different load conditions, i.e., maximum, medium, and minimum consumption with values of 100%, 60%, and 30%, respectively. This helps in calculating the annual costs of the energy losses that will be summed with the investment cost in conductors for determining the final costs of the planning project. Numerical simulations in two test feeders comprising 9 and 25 nodes with one substation show the effectiveness of the proposed methodology regarding the final grid planning cost; in addition, the heuristic selection of the calibers using the minimum expected current absorbed by the loads provides at least 70% of the calibers that are contained in the final solution of the problem. This demonstrates the importance of using adequate starting points to potentiate metaheuristic optimizers such as the TSA.

1. Introduction

Electrical distribution networks correspond to a portion of the power system in charge of providing electrical services to residential, commercial, and industrial areas, which are mainly grouped in urban areas [1]. These grids are operated at medium-voltage and low-voltage levels and are typically built with radial configuration to minimize the investment costs; however, this configuration makes these grids produce high power losses (from 6 % to 18 % in the Colombian context) [2]. This situation is less promising when rural distribution networks are analyzed owing to the dispersion of the loads in conjunction with low power consumption [3]. Given that electricity services are conceived as public services around the world, the regulatory entities managing the electricity market have provided benefits to distribution companies, such as tax reductions or the inclusion of additional components in the energy price formula, to promote covering electrical services to rural areas. The goal is improving the quality of life of communities located far from urban areas [2].
The problem of optimal expansion planning of electrical distribution is part of mixed-integer nonlinear programming (MINLP) problems [4]. It includes the optimal selection of the distribution line routes, the selection of the size (caliber) of the conductors, the location and size of the existing and new substations, and the grid operative costs during the planning horizon [5,6]. Multiple optimization approaches have been proposed thus far to solve the distribution system planning problem; most of these approaches focus on urban network applications, some of which are briefly summarized next.
In [4], a formulation is proposed to solve the problem of optimal expansion planning in distribution networks by explicitly imposing the radiality constraint in the formulation. The resulting MINLP model was solved in the A Mathematical Programming Language (AMPL) environment by using a test feeder comprising 54 buses. The reported numerical results satisfy the planning requirements; however, the authors did not compare with other optimization methodologies based on metaheuristics or exact models, and the optimization model does not include different caliber options, which reduces the complexity owing to the reduction in the solution space size. In [7], the authors proposed a combination of a genetic algorithm with an ant-colony optimizer to plan distribution networks in medium-voltage applications. The evaluation of the methodology considers different caliber sizes in a small test feeder comprising 10 nodes; however, no comparison with exact or metaheuristic approaches was provided to demonstrate the efficiency of the methodology. In [8], the application of a genetic algorithm was presented to expand medium-voltage distribution networks. Numerical results were obtained in two test feeders composed of 13 and 30 buses. However, the grid topology is predefined by the utility, which reduces the size of the solution space and transforms the original distribution system planning problem into a problem of optimal selection of conductors in the distribution networks. In [6], the authors presented a multi-objective optimization model to plan distribution networks considering different objective functions, including investment costs, operating costs, and the level of non-supplied energy. Numerical results were tested in a distribution network composed of 54 buses; however, the authors considered the single-phase equivalent of the network in the formulation, and they did not compare with exact or metaheuristic approaches to validate their proposal. In [9], the authors presented an optimization methodology for planning distribution networks using a three-phase representation of the network by combining a genetic algorithm with the tabu search algorithm (TSA). The reported numerical results demonstrated the efficiency of the TSA approach in determining the set of calibers that must be assigned to the network once the grid topology is defined through a heuristic graph generator.
A complete review of the expansion planning problem in distribution networks, where different optimization methodologies and models are discussed, is presented in [3]. The authors discuss the inclusion of distributed generation and energy storage technologies in the context of the classical expansion planning problem. Numerical validation in a 54-bus system highlights the differences in the final solution plan in which different elements such as generators or energy storage devices were considered. A general characteristic of the previous optimization models is the simplification of the distribution system planning problem with single-phase equivalents. This simplification reduces the complexity of the optimization problem regarding the evaluation of the power flow problem because it does not consider possible load and impedance imbalances or loads with single-phase, two-phase, and three-phase connections, including Δ - and Y - connections [10].
In order to contribute beyond the previous studies available in the literature, we propose an easily implementable optimization algorithm to plan rural distribution grids that is composed of three stages and that can be applied to single-phase or three-phase distribution grids [9]. The first stage solves the problem of route selection by formulating the problem of minimum spanning tree (linear integer programming model) for minimizing the total length of the conductors [11,12]. The second stage uses the grid topology found in the previous stage to calculate the expected current in all the distribution line routes, which allows defining the initial calibers of the conductors. The third stage uses the calibers selected in the previous stage to initialize a TSA in order to determine the optimal set of calibers of the grid that minimizes the investment costs in conductors with the costs of energy losses during the planning horizon [13]. The main advantage of this heuristic procedure is that the initial solution obtained for a rural distribution grid with the application of the first two stages can be considered as the upper bound of the objective function, i.e., the maximum admissible grid costs, which implies that the TSA aims to reduce this function by exploring and exploiting the solution space. The TSA works in conjunction with a three-phase power-flow method that determines the grid operating conditions, i.e., the root-mean-square (RMS) of the current in lines and voltages in nodes, as well as the operative costs regarding the power losses during the planning horizon [10].
The rest of the paper is structured as follows: Section 2 presents the complete mathematical formulation for the problem of optimal expansion planning of electric distribution networks for rural applications. Section 3 presents the proposed planning methodology for AC distribution grids with a three-phase structure using the heuristic optimization procedure based on the three following stages: (i) selection of the grid topology, (ii) selection of initial calibers, and (iii) application of the TSA to refine the selection of the calibers. Section 4 presents the main characteristics of the test feeder, which is composed of 42 possible routes and 25 nodes including the substation node located at node 1, which will work with a line-to-line voltage of 13.2 kV. Section 5 presents the main numerical results achieved with the proposed heuristic planning optimization algorithm and their analysis and discussion. Section 6 presents the conclusions derived from this study and provides guidelines for future work.

2. Mathematical Modeling

The problem of optimal expansion of electrical distribution networks for rural applications can be formulated through a general MINLP model [4] for which its objective is to determine the optimal routes for feeding the loads, as well as the optimal sizes of the conductors in these routes [3]. The objective function considers the investments and operative costs for a year of operation. The complete structure of the mathematical model is presented below.

2.1. Objective Function

The objective function corresponds to the sum of the investment costs in conductors and the operative costs caused by power losses, i.e., A cost . The objective function can be formulated as follows: [9]:
min A cost = i a 1 + i a y ) 1 + i a y 1 i j L c C C 1 + C 2 + C 3 + C 4 ,
where C 1 represents the cost of changing an existing conductor in route i j ; C 2 represents the cost of constructing a line in route i j ; C 3 is the annual cost because of the energy dissipated by the resistive effect of conductors in route i j ; C 4 corresponds to the cost of disconnecting an existing conductor in route i j for leaving it out of service; i a is the discount rate to transform future values into present ones; i e represents the rate of energy increase; and y is the number of years considered in the planning horizon. Note that L and C are the sets that contain all possible distribution line routes and the types of calibers available for constructing the distribution lines.
The components in (1) have the following structure:
C 1 = L i j λ i j c 1 δ i j c e C C C C e δ i j e ,
C 2 = C N C c L i j λ i j c δ i j c 1 e C λ i j e ,
C 3 = L i j e C δ i j e t T 1 + i e 1 + i a t h H C kWh 1000 H h R i j , a b c c f F I i j , f h 2 ,
C 4 = C O C 1 c C δ i j c c C λ i j c ,
where L i j is the length of the route that connects nodes i and j; δ i j c is a binary variable that determines if the caliber type c is selected for route i j ; λ i j c is a parameter that determines whether there is ( λ i j c = 1 ) or there is not ( λ i j c = 0 ) a conductor type c in route i j ; C C C e represents the cost of changing a conductor type e in route i j ; C N C c represents the cost of installing a new conductor with caliber type c in route i j ; C kWh represents the cost of the energy losses; H h is the duration of the period of time h; R i j , a b c c is the resistance of the conductor type c connected in route i j ; I i j , f h is the RMS value of the current that flows in route i j at phase f at the period of time h; and C O C represents the cost of leaving an existing conductor out of service. Note that H is the set that contains the lengths of the periods of time in which a year was divided, F is the set that contains all the phases of the network, and T corresponds to the set that contains all the years of the planning horizon. Note that superscripts c and e are related to the caliber types available for installation.

2.2. Set of Constraints

The set of constraints regarding the planning and operation of AC electrical distribution grids requires the fulfillment of the power balance equations at each node and phase of the grid, including voltage regulation bounds and element capabilities. The constraints associated with the studied optimization problem are listed below. The active and reactive power balance constraints at each node take the following form [14]:
E Q u P k , f d , h , Q k , f d , h , V k , f h , θ k , f h = 0 , f F , h H , k N ,
where E Q u · corresponds to the nonlinear functions associated with the active and reactive power balances at each node [15]; P k , f d , h and Q k , f d , h are the active and reactive power demand values associated with node k at phase f in the period of time h; and V k , f h is the RMS value of the voltage at phase f at node k in the period of time h, where the voltage angle is defined as θ k , f h .
The voltage regulation bounds in all the nodes of the network can be constrained as follows:
V min V k , f h V max , f F , h H , k N
where V min and V max represent the minimum and maximum voltage bounds, respectively, allowed for all nodes of the network.
For conductors connected at route i j , it is necessary to revise their thermal bounds as follows:
I i j , f h c C δ i j c + λ i j c I c , max , f F , h H , i j L
where I c , max represents the maximum current allowed for a conductor with caliber type c.
Finally, to simplify the coordination of the protective devices, the topology of the grid must have a radial configuration, which can be ensured by the following constraint acting in conjunction with the power balance constraints (6):
i j L c C δ i j c + λ i j c = n s ,
where n represents the number of nodes of the grid and s is the number of substations.
Remark 1.
Note that the evaluation of the constraints (6) to (8) depends on the solution of a three-phase power problem, which is addressed in this study by using the matrix-based backward/forward approach reported in [16] to solve the phase-balancing problem.

3. Heuristic Solution Methodology

The problem of optimal planning of electrical distribution networks is a complex optimization problem with a MINLP structure (see previous section). This complicates its numerical solution with exact optimization methodologies [3]. For this reason, we propose a simple heuristic optimization methodology to address the problem of expansion planning of electrical distribution networks for rural applications [6]. This strategy can be used for grid operators to have an initial planning strategy of their grids by considering the minimum cost investment in conductors and an adequate balance between power-loss costs during a year of continuous operation. The proposed approach has three main aspects associated with its implementation: (i) selection of the grid topology; (ii) selection of the initial conductors’ size; and (iii) optimization of the grid calibers. Each of the aforementioned steps of the methodology is explained below.

3.1. Selection of the Grid Topology

The selection of the grid topology is essential for evaluating its electrical performance [17], i.e., voltage regulation, power losses, and loading factor in conductors, among others. To select the routes where conductors are installed, the classical minimum spanning tree model is used with the aim of minimizing the total length of the grid for calibers.
The problem of minimum spanning tree can be mathematically formulated as follows [18]:
min z 1 = k K l k x k ,
s . t . : k K C j k x k 1 , j V ,
k K x k = v 1 ,
x k 0 , 1 , k K .
where z 1 is the total length of the network; l k is the length of the route k; x k is the binary variable associated with the selection of route k ( x k = 1 ) or not ( x k = 0 ); C j k is the matrix that relates the route k with vertex j, being C j k = 1 if vertex j is connected to branch k and C j k = 0 otherwise; and v is the number of vertices in the graph. Note that K and V are the sets that contain all the routes and all the vertices that comprise the graph of the grid.
The mathematical model (10)–(13) has an integer structure, i.e., linear integer programming, which can be exactly solved with the branch and bound method [19] or with the constructive Kruskal algorithm [11].
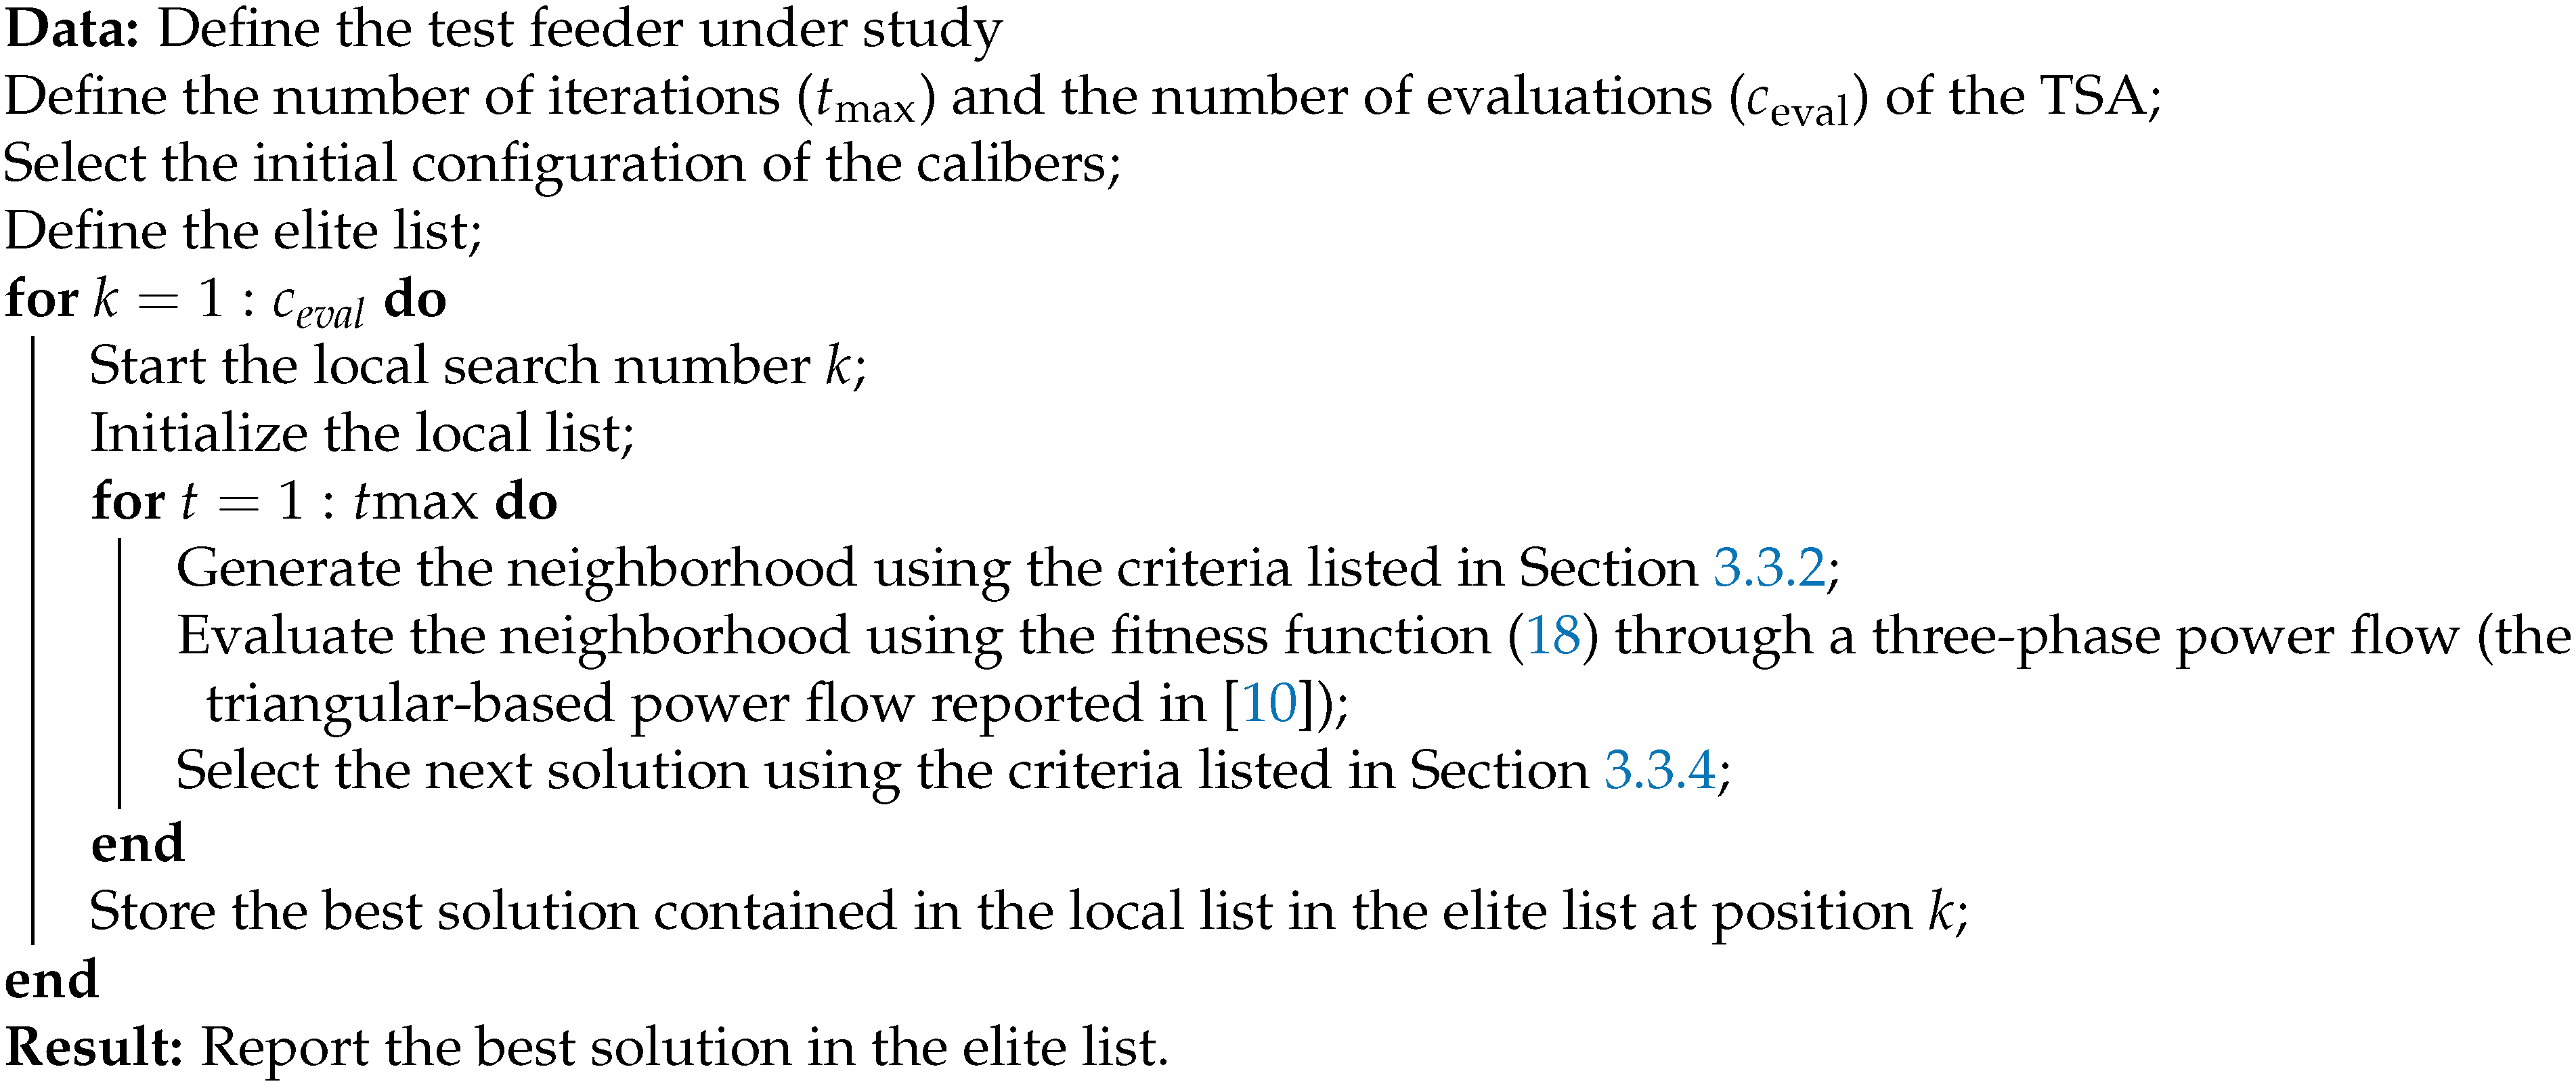
In order to exemplify the solution of the proposed model (10)–(13), consider the graph presented in Figure 1 with the lengths listed in Table 1.
The solution of the optimization model (10)–(13) in the general algebraic modeling system (GAMS) with the solver CPLEX produces the graph reported in Table 2.
Note that the objective function for this solution is z 1 = 5120 m ; however, at least three alternative solutions exist with the same length that can be easily obtained by using the Kruskal algorithm [11].
When one or more routes are required in the final solution, e.g., the number of routes connected to the substation, these can be assigned by setting x j = 1 in the optimization model (10)–(13).

3.2. Selection of the Initial Conductors’ Size

In order to select the initial caliber of the conductors in the distribution test feeder, we propose a heuristic approach based on the ideal currents absorbed by the loads and the radial graph obtained after solving the optimization model (10)–(13). The initial sizes of the conductors are set under the following assumptions:
  • All the loads are connected in three-phase form with balanced consumption.
  • The ideal currents consumed by the loads are calculated by using the nominal grid voltage V nom .
  • The current at each line is calculated by adding the currents consumed at the nodes downstream this line.
  • The selection of the conductor size for each line corresponds to the conductor with a thermal condition that does not exceed the 90 % of chargeability.
In order to exemplify the proposed methodology, consider the conductor sizes presented in Table 2; in addition, let us select node 1 as the substation source with a nominal voltage of 13.2 kV and the load consumption reported in Table 3.
In order to calculate the current, the following definition, applicable only to three-phase balanced systems, is used:
P 3 φ = 3 V L L I L cos ( θ ) ,
I L = P 3 φ 3 V L L cos ( θ ) ,
where P 3 φ is the three-phase active power consumption, V L L is the line-to-line voltage, I L is the line current, and θ is the angle of the power factor.
For the conducted numerical example, the currents calculated for each line and the caliber selection considered, with a maximum of 90 % of loadability, are presented in Table 4.
Note that in the case of a test system with unbalanced loads, the current is calculated per phase and added using phasors when the power factor at each phase is different. The current of the conductor is selected based on the current flowing in the phase with the highest load.

3.3. Optimization of the Grid Calibers

In order to evaluate the electrical performance of the initial grid topology, we considered three main load steps as follows: (i) the system is working under peak-load condition for 1000 h per year, i.e., 100% of the consumption in all the nodes; (ii) the demand behavior decreases until 60% of the peak-load condition during 6760 h; and (iii) the system works with minimum load, i.e., 30% of the peak load, for 1000 h [13]. Note that these percentages are typically provided by the distribution company as a function of the electrical behavior of existing grids [20].
At this stage, in order to optimize the size of the conductors, we propose a metaheuristic optimization approach, TSA, where the decision variables correspond to the caliber type that will be assigned to each line.
TSA is a metaheuristic optimization approach that explores and exploits the solution space by starting with an initial point provided by a heuristic algorithm that helps with the generation of the initial neighborhood using different criteria depending on the optimization problem under study [21,22]. The main characteristic of the TSA approach is that it is a trajectory search algorithm that works with local and global memories to guide exploration through the solution space, considering that it does not always follow the best local solution using prohibited so-called tabu movements. This helps reduce the possibility of getting stuck in local solutions [23].
The main aspects of the TSA for selecting calibers in radial distribution grids are discussed below [13].

3.3.1. Initial Solution

The TSA works using a trajectory of evolution that begins from an initial solution that is heuristically generated through constructive algorithms [24]. Here, we consider the configuration of the calibers defined in the previous stage as the initial solution (see Section 3.2). For the numerical example, the codification used for the TSA has the following structure:
Δ t = 1 , 5 , , c , , 3 , 2 ,
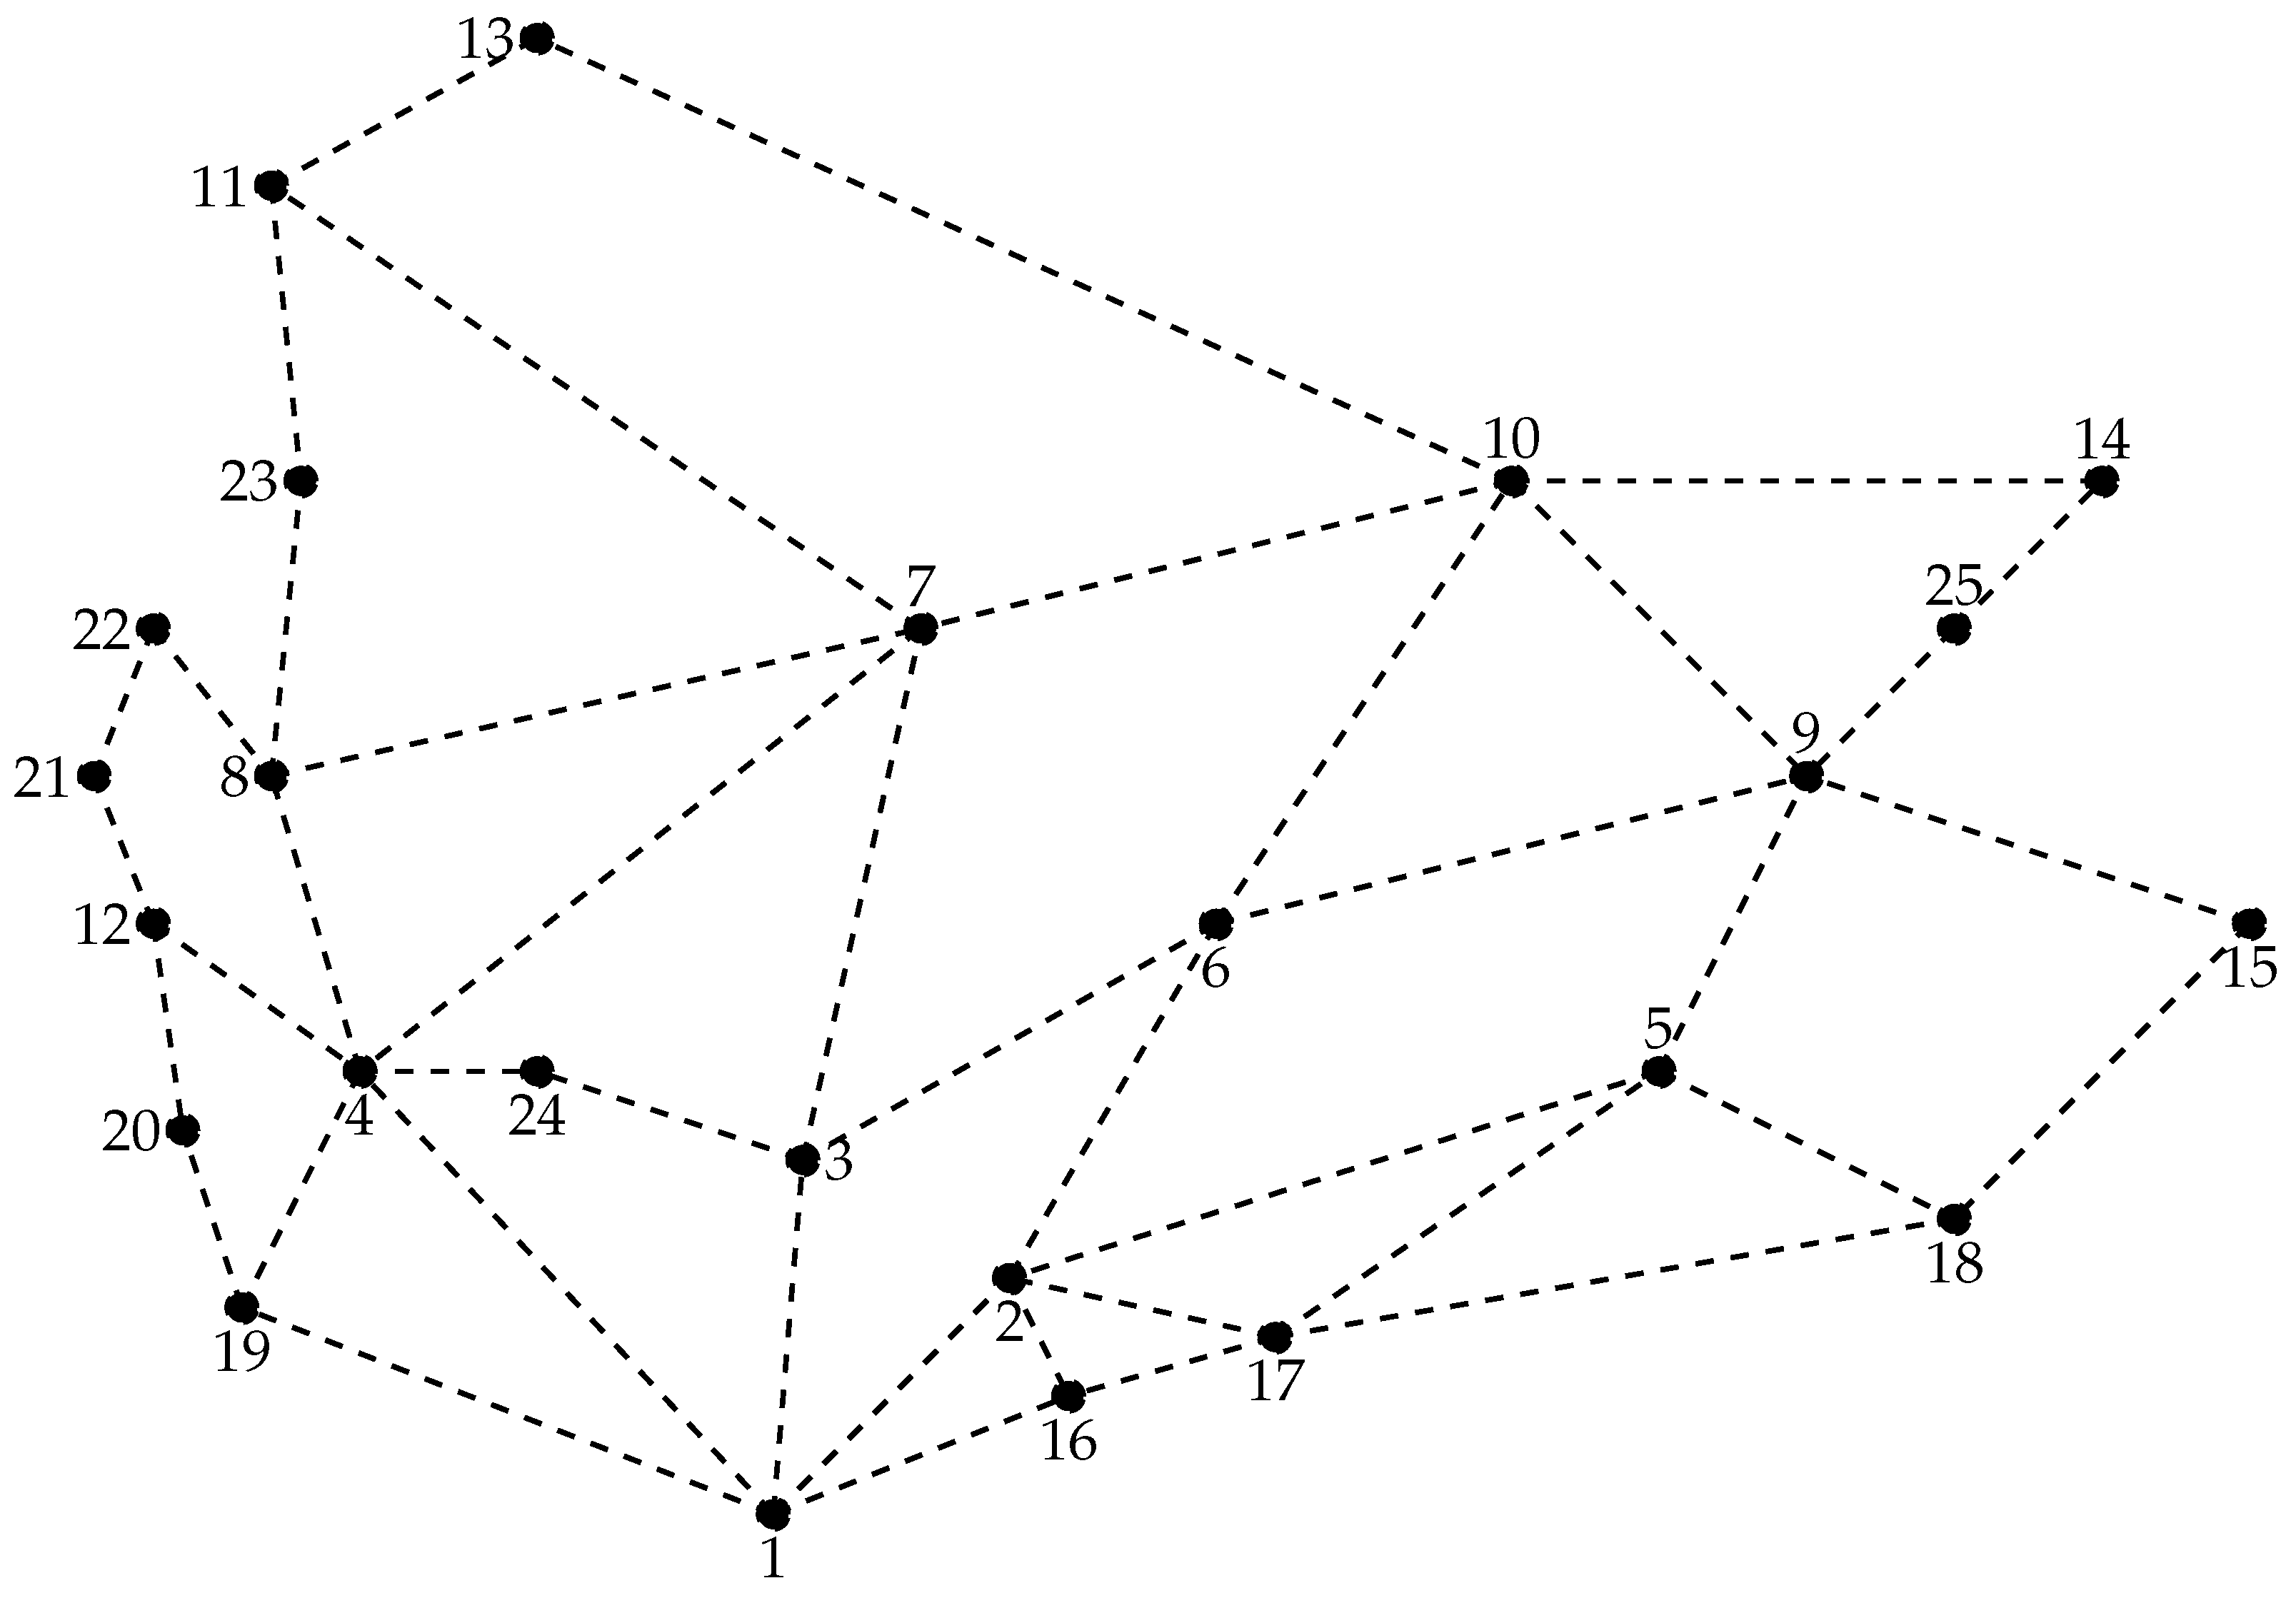
where c is the maximum number of calibers available (see the example in Table 4, where c is equal to 7). Note that for the numerical example defined in Figure 2, the codification (16) takes the following form.
Δ t = 6 , 1 , 3 , 1 , 7 , 4 , 1 , 1
The integer codification presented in Equation (17) helps with the computational implementation because, in general, the dimension of the decision vector is equal to the number of lines (l), i.e., 1 × l , while the binary codifications have a high dimension, which was 1 × l · c in the example for binary representation [13].

3.3.2. Generation of the Neighborhood

The evolution of the TSA is governed by the generation of a neighborhood around the current solution, i.e., Δ in Equation (17) [13]. In order to generate this neighborhood, we apply the following criteria:
A list with all the possible paths between the end nodes and the substation is created. Each of these paths is selected in a random manner, with one branch modifying its caliber; next, all the calibers in this path are revised and changed to ensure the telescopic condition of the feeder.
A list with the nodes that present the worse voltage regulation is formed. For each of the paths between these nodes and the substation, the caliber of the conductors is increased to the next value with superior current capability.
The branch with the lowest loadability factor is selected and its caliber is reduced; then, all the branches downstream are revised and modified to ensure the telescopic configuration of the feeder.
An arbitrary path from the substation of one end node is selected and all the calibers of this path are assigned to the same caliber; then, the branches that are connected with this path are revised to ensure the telescopic configuration of the grid.
Note that if the neighborhood built with the aforementioned criteria exceeds the predefined size k, then the list is reduced to have exactly k neighbors. However, if the size of the neighborhood is smaller than k, then the TSA works with this list in order to evolve through the solution space, which implies that the proposed TSA has the ability to work with a dynamic neighborhood with a size ranging from 2 to k neighbors [9].

3.3.3. Evaluation of the Neighborhood

The TSA implements an optimization metaheuristic strategy with the capability of exploring solution spaces with some grade of infeasibility. This implies that it works with a fitness function instead of an objective function. In order to evaluate the fitness function for each individual in the neighborhood, a three-phase power flow formulation based on the matrix-based power-flow formulation presented in [16] is used. The proposed fitness function has the following structure:
Z f = A cos t + α 1 max h , i j , f 0 , I i j , f h c C δ i j c + λ i j c I c , max α 2 min h , k , f 0 , V k , f h V min + α 2 max h , k , f 0 , V k , f h V max ,
where α 1 and α 2 are positive constants associated with the penalization regarding the violations of the current allowed in the conductor assigned to route i j and the violations of the maximum and minimum voltage regulation bounds, respectively. Note that the penalization approach adopted in this study corresponds to the differential method because the values in the fitness function depend on the RMS value of the voltage and current constraint violation [13]. In addition, when the solution is feasible, the fitness function is equal to the objective function.

3.3.4. Selection of the Next Solution

In order to select the next solution, i.e., Δ t + 1 , one of the following criteria is applied:
  • In order to select Δ t + 1 , the best neighbor in the current neighborhood is considered if it has the a better fitness function than the current solution Δ t . This corresponds to the application of the criterion in the TSA, known as the aspiration criterion.
  • If the aspiration criteria are not fulfilled, the selection of Δ t + 1 is associated with the individual in the neighborhood with less locked tabu attributes; this allows degradation in the objective function value that, in turn, allows the TSA to escape from the local optimal solutions in order to explore other promising solution regions.

3.3.5. Computational Implementation of the TSA

In order to summarize the main steps in the implementation of the TSA to select the subset of optimal calibers for a three-phase grid, Algorithm 1 is presented.
Algorithm 1: General implementation of the TSA to determine the optimal subset of calibers for all the routes in a three-phase symmetric distribution grid.
Energies 14 05141 i001

4. Test Feeders

In order to validate the proposed heuristic optimization methodology when it comes to addressing the problem of optimal design of rural AC distribution networks, the numerical examples presented in Section 3 and a test feeder composed of 25 nodes and 42 possible routes were taken into account. Information related to both test feeders is provided below.

4.1. Nine-Bus Test Feeder

This system corresponds to the same 9-bus test feeder employed in Section 3 for presenting the optimization methodology. This system is used to compare the proposed optimization methodology with the sine-cosine algorithm (SCA) reported in [25].

4.2. Twenty-Five-Bus Test Feeder

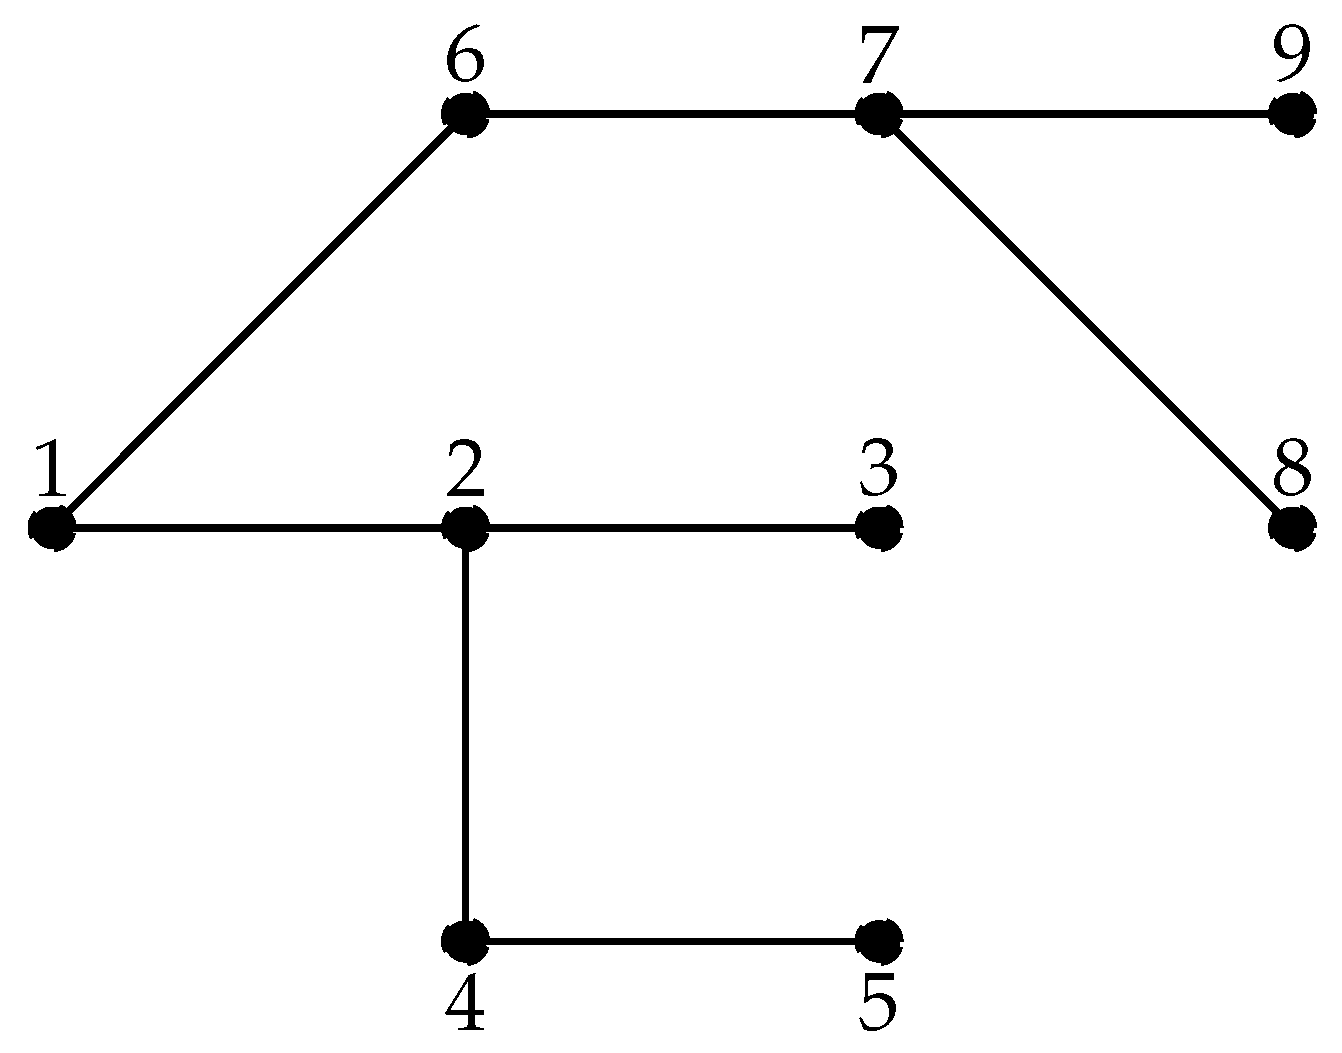
The 25-bus system is a three-phase network composed of 25 nodes and 42 possible routes to support the projected power consumption in 24 constant power loads. The main substation was assigned by the utility company; it is located at node 1 with a nominal line-to-line voltage of 13.2 kV. The electrical configuration of this test feeder is depicted in Figure 3.
The parametric information of the 25-bus system is summarized in Table 5 and Table 6, which include the projected load consumption and possible feeder routes. In addition, the relations among the branches and nodes are reported in Table 7.
Regarding the calibers available for installation in the 25-bus system, we considered the same list reported for the 9-bus system in Table 2.

5. Computational Implementation

In this section, all computational validations of the proposed heuristic optimization method for expanding electric distribution networks in rural zones are presented. These validations were carried out on a personal computer with AMD Ryzen 7 3700U, 2.3 GHz, 16-GB RAM, and with 64-bit Windows 10 Home Single Language using the MATLAB programming environment. Comparative analyses with the SCA were performed in order to validate the efficiency of the proposed approach. Each algorithm was evaluated through 10 repetitions with 100 iterations. The cost of energy losses considered in this study is USD/kWh 0.1390 ; this value was taken from Colombian utility in Bogotá city [26]. In addition, the unitary cost of the calibers considered for both test feeders are listed in Table 2.

5.1. Nine-Bus System

Next, we present the numerical results for the 9-bus system, both without and with the initial solution reported in Table 4 for the proposed TSA and the SCA.
The numerical results in Table 8 show that (i) the TSA has a better numerical performance than the SCA because, for both simulation cases, it finds better numerical solutions. When the initial solution is not considered, the TSA method obtains a final cost of USD 83,063.2614, i.e., USD 1863.7332 less than the SCA; when the initial solution based on the initial currents reported in Table 4 is considered, the TSA method finds a total cost of USD 81,117.2797, i.e., USD 1142.5543 less than the SCA. The (ii) SCA becomes stuck in the local optimum provided by the proposed heuristic methodology because the initial solution in Table 4 is the same as that obtained by this algorithm; this situation occurs because the SCA uses the modifications of all individuals as part of its evolution criteria based on the current and best solutions, thereby introducing large jumps through the solution space that hinders the exploration of promising solutions. The (iii) total processing time presented by the TSA is at least 50% better than the time reported by the SCA, which is important because the solution space in this optimization problem is c b (where c is the number of caliber options and b the number of branches). This amounts to 5,764,801 possible combinations, which implies that the TSA explores and exploits the solution space more efficiently than the SCA.
According to these results for the SCA and the demonstration that the TSA achieves better numerical performance in terms of objective function value and processing time, only the results of the proposed methodology will be discussed from this point on.
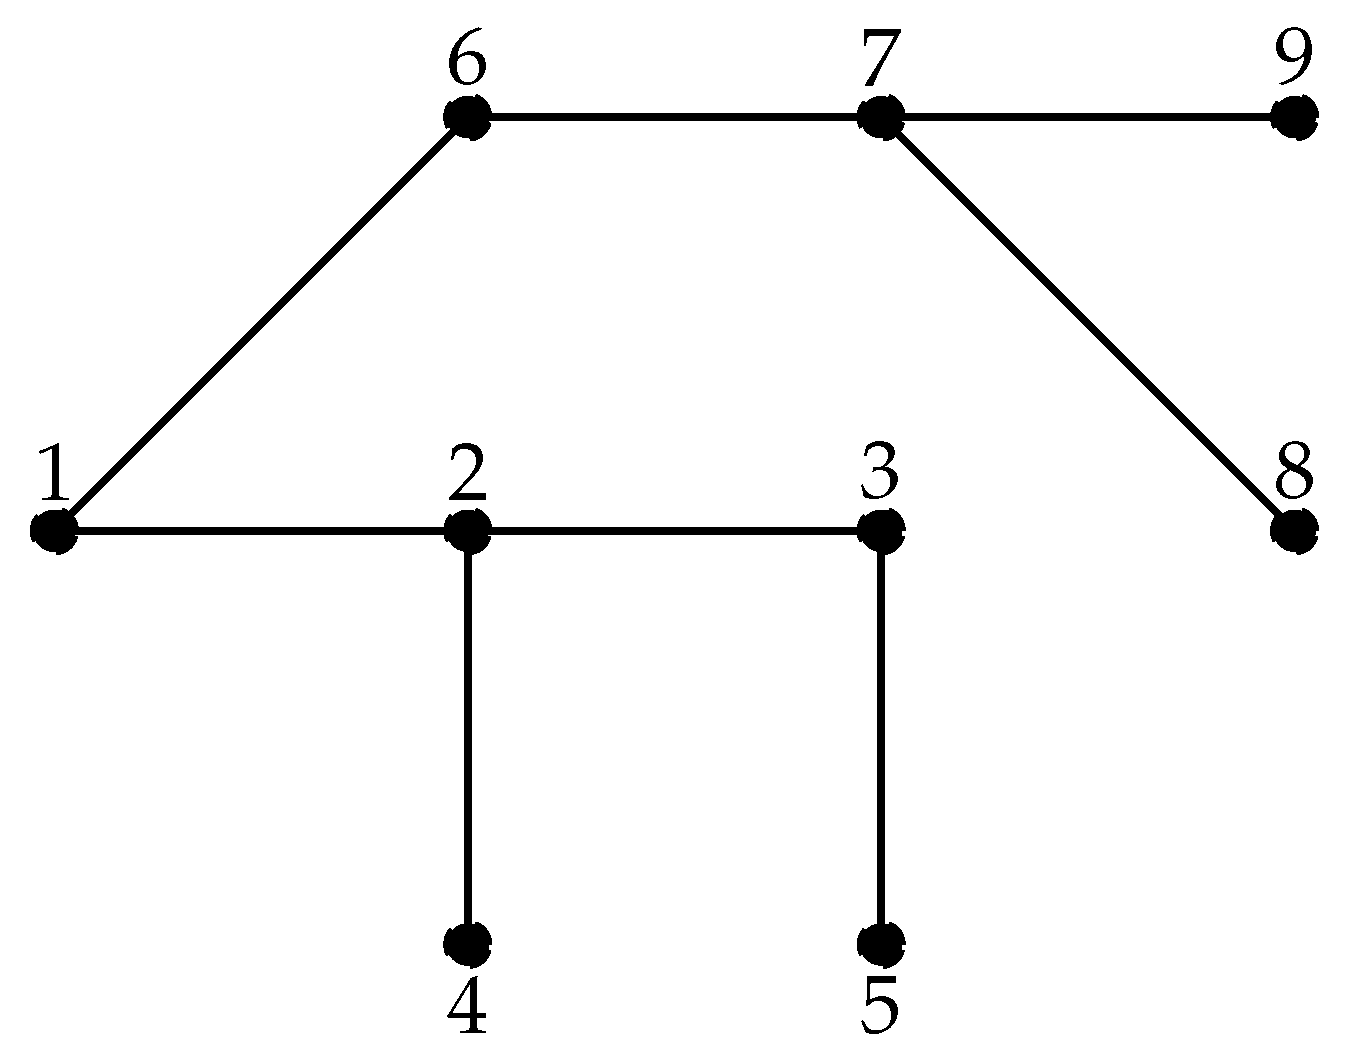
One of the additional grid configurations for the 9-bus system with the same length was also tested with the proposed TSA to show that the assignment of the initial set of calibers is indeed a good initial starting point for addressing the problem of optimal assignment of the calibers in three-phase networks. The electrical interconnection for this alternative topology is depicted in Figure 4.
The ideal current consumption for this topology is presented in Table 9 using the methodology proposed in Section 3. The currents in lines five to eight remain unaltered because the solution reported in Figure 2 and Figure 4 are identical for this part of the graph.
The numerical results obtained from the TSA for this new configuration of the 9-bus system are presented in Table 10. These results demonstrate that (i) the TSA without the initial configuration provided by the proposed methodology outputs a total cost of USD 82,530.0346, i.e., a solution with an additional cost of USD 1661.5465 when compared with the initial solution provided by the proposed heuristic algorithm; (ii) when the initial solution is used as the starting point of the TSA, the final cost reported by this algorithm is approximately USD 80,581.0708, i.e., an additional profit of USD 287.4173 ; and (iii) the final solution reported by the TSA only differs in route one with respect to the initial solution by increasing the caliber from six to seven, which increases the investment cost in conductors by approximately USD 600 and reduces the cost of the energy losses by approximately USD 887.4173 , thereby confirming the additional profit of USD 287.4173 .
The numerical results in Table 8 and Table 10 confirm the effectiveness of the proposed optimization methodology when the initial starting point (ideal currents) is used to start the exploration of the solution space. This is because, for the 10 evaluations of the TSA presented, the same optimal solution is achieved, which means an efficiency of 100% in contrast with efficiencies below 30% when the starting point was not used.
The remaining possible solutions for the 9-bus test feeder present higher investment costs because all the loads are connected consecutively without any derivation, which increases the calibers necessary to meet the total demand.

5.2. Twenty-Five-Bus System

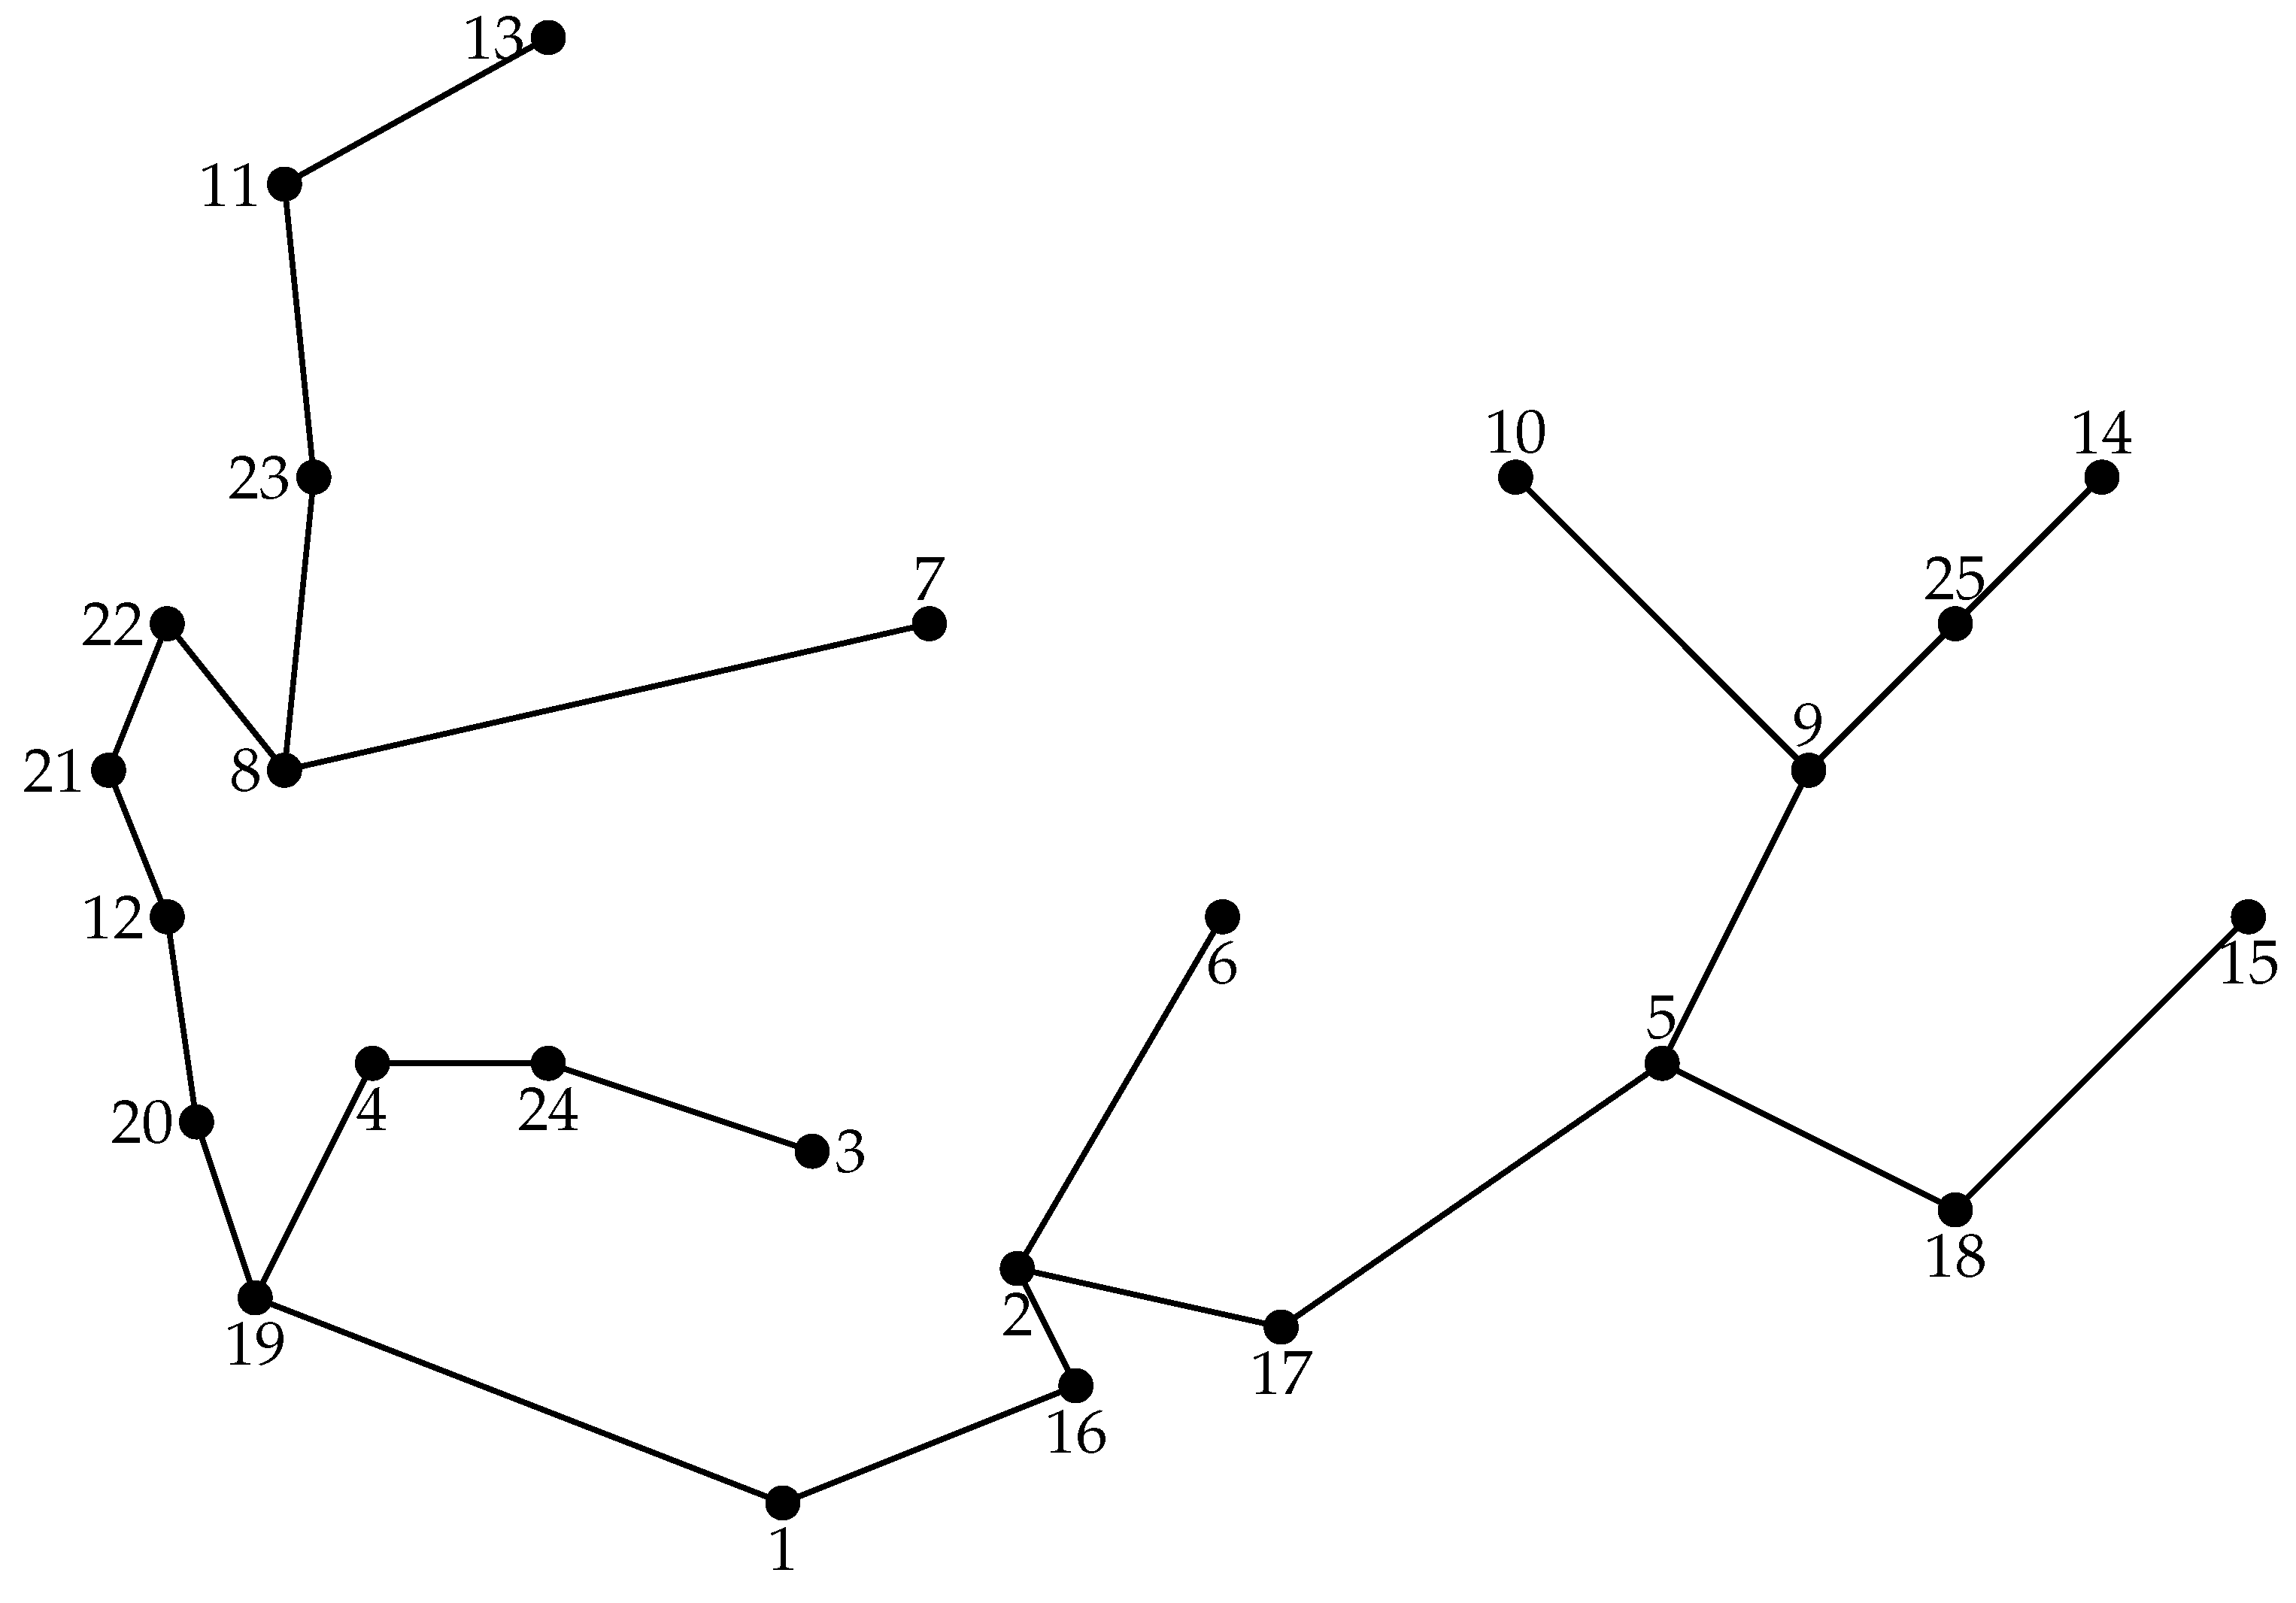
When the optimization methodology is applied to the 25-bus system with the 42 possible routes depicted in Figure 3, the optimal solution presents a minimum length of 23.65 km, which produces the final topology shown in Figure 5.
When the initial configuration of the calibers is assigned as the initial starting point of the TSA, the numerical results in Table 11 are obtained. This table presents the initial solution, as well as the minimum and maximum solutions after 100 consecutive evaluations. The average processing time in this simulation was approximately 64.62 s per evaluation. The active lines for this system are presented below.
Active lines 5 , 11 , 16 , 18 , 21 , 22 , 23 , 25 , 26 , 28 , 29 , 30 31 , 32 , 33 , 34 , 35 , 36 , 37 , 38 , 39 , 40 , 41 , 42
The numerical results in Table 11 show that (i) the best solution reported by the TSA has a total cost of USD 270,157.5108, which implies a reduction with respect to the initial condition of approximately 2.37 % , i.e., a gain of 6550.8734 dollars; (ii) the worst solution from the TSA presents a total cost of US$ 271,097.4154, which corresponds to a difference of USD 5610.9688 with respect to the initial condition, i.e., 2.03 % ; (iii) the differences among calibers in the best and worst solutions are located only in two branches, namely 11 and 25. This means a decrease in only one digit with respect to solutions one and two.
The main characteristic of both the optimal solution (i.e., solution one) and the starting point obtained by the heuristic algorithm (i.e., the initial condition) is that 20 routes remain with the same caliber and only four routes increase their calibers from 5 , 4 , 3 , 3 to 7 , 7 , 6 , 2 in lines 22 , 23 , 25 , 26 . This implies that the heuristic algorithm contributes with 83.33 % of the optimal solution, confirming the effectiveness of choosing a good starting point in the process of finding an optimal solution. In addition, the output of the TSA presents small variations among the extreme solutions, i.e., solutions one and two, after 100 consecutive iterations, with a difference smaller than 0.34 % . This also confirms that the starting point is indeed an adequate solution for the problem addressed in this study, and it can be improved with efficient optimization algorithms such as the TSA hereby presented. Note that the standard deviation obtained by the TSA for the results reported in Table 11 is USD 270.9677 . This implies that all the solutions are concentrated around the central solution, i.e., USD 270,648.1615, which is the minimum value reported by solution one and the maximum value reported by solution two.
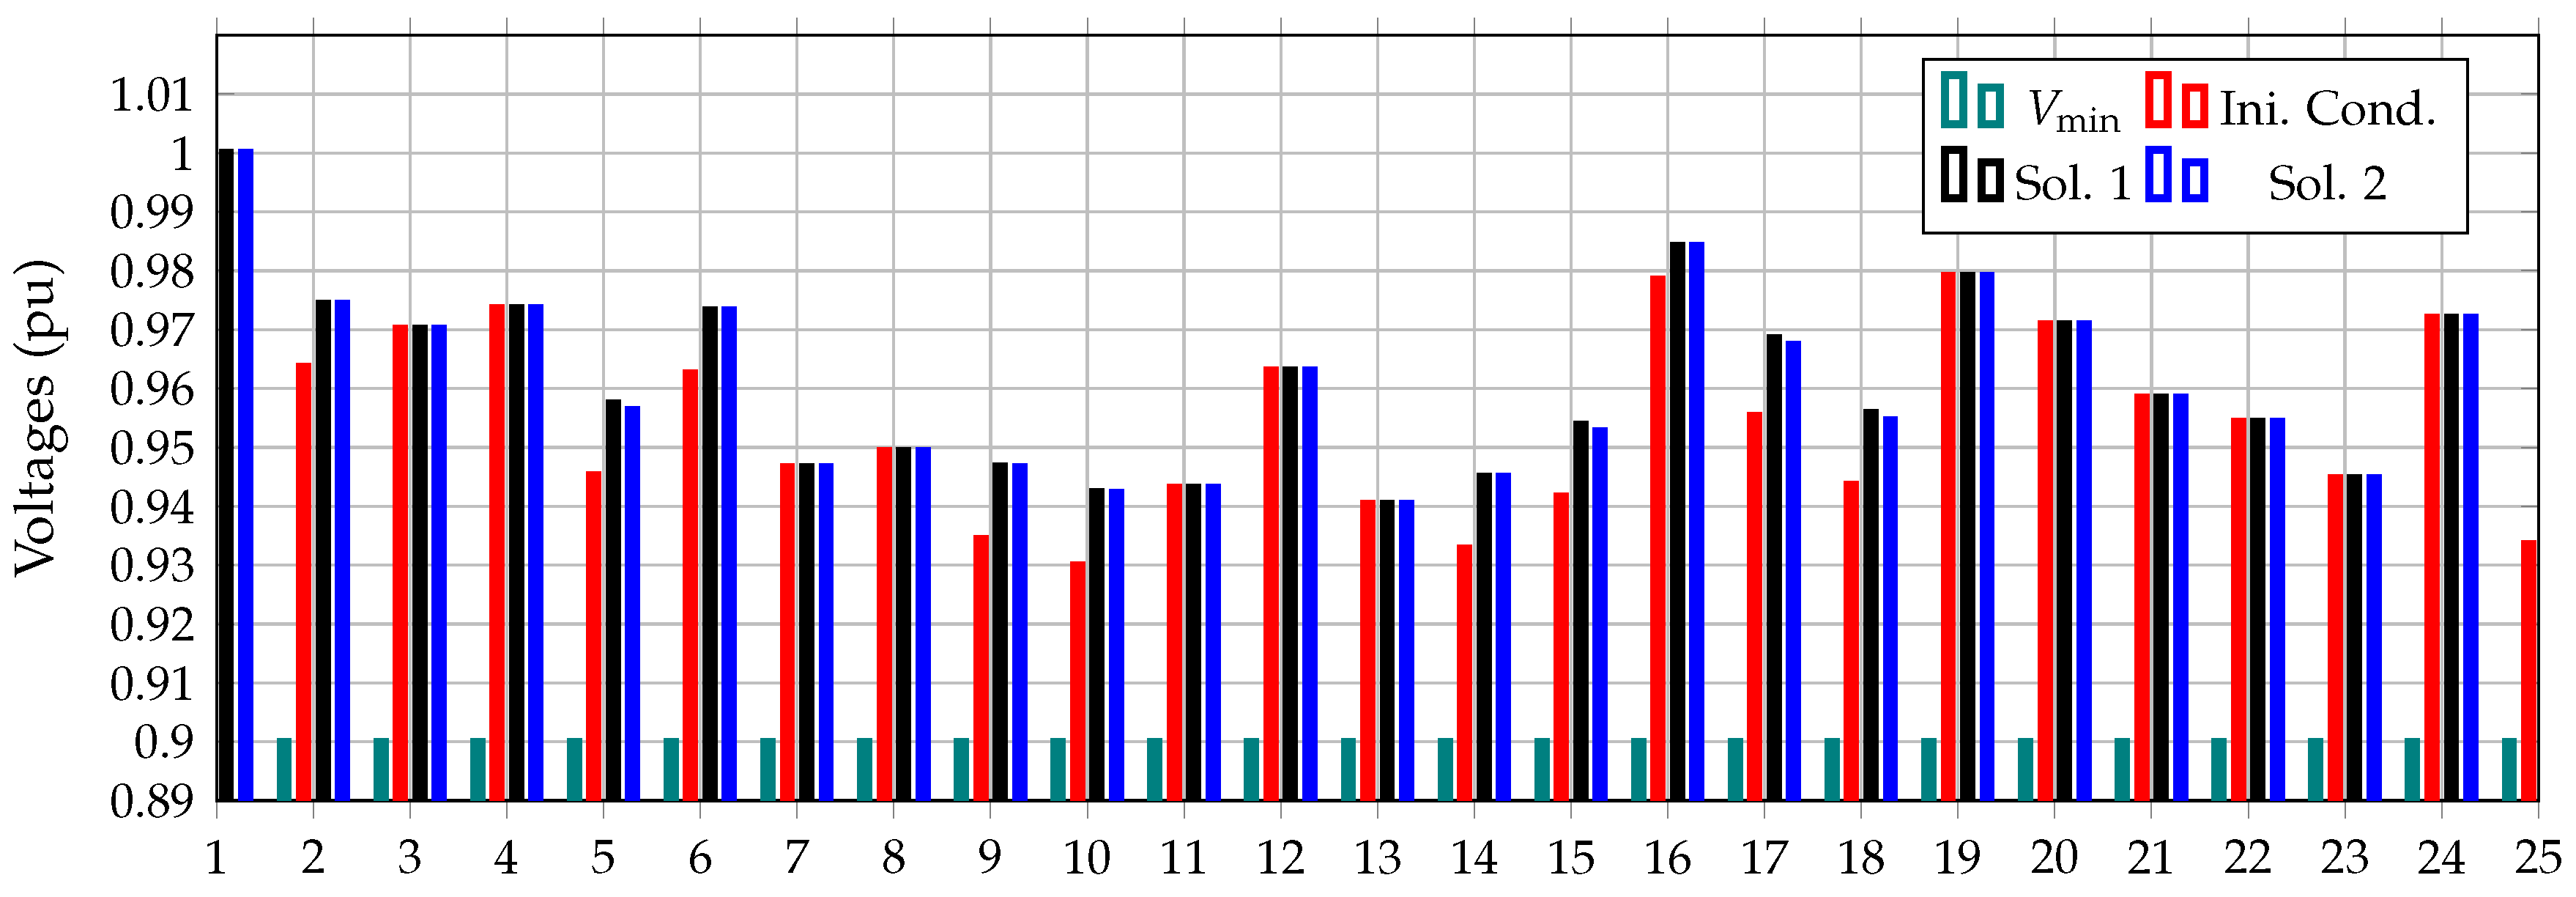
Figure 6 presents the voltage behavior of phase a (remember that the 25-bus system is symmetric) for all the solutions reported in Table 11.
The behavior of the voltage profile in Figure 6 shows that the minimum voltage values for solutions one and two occur at node 13, which is one of the end nodes of the network, with an RMS voltage of 0.9404 pu, as depicted in Figure 5. This result demonstrates that the regulation of the planned rural distribution network is less than or equal to 6%, with 16 of the 25 nodes with voltage regulations lower or equal to 5%.
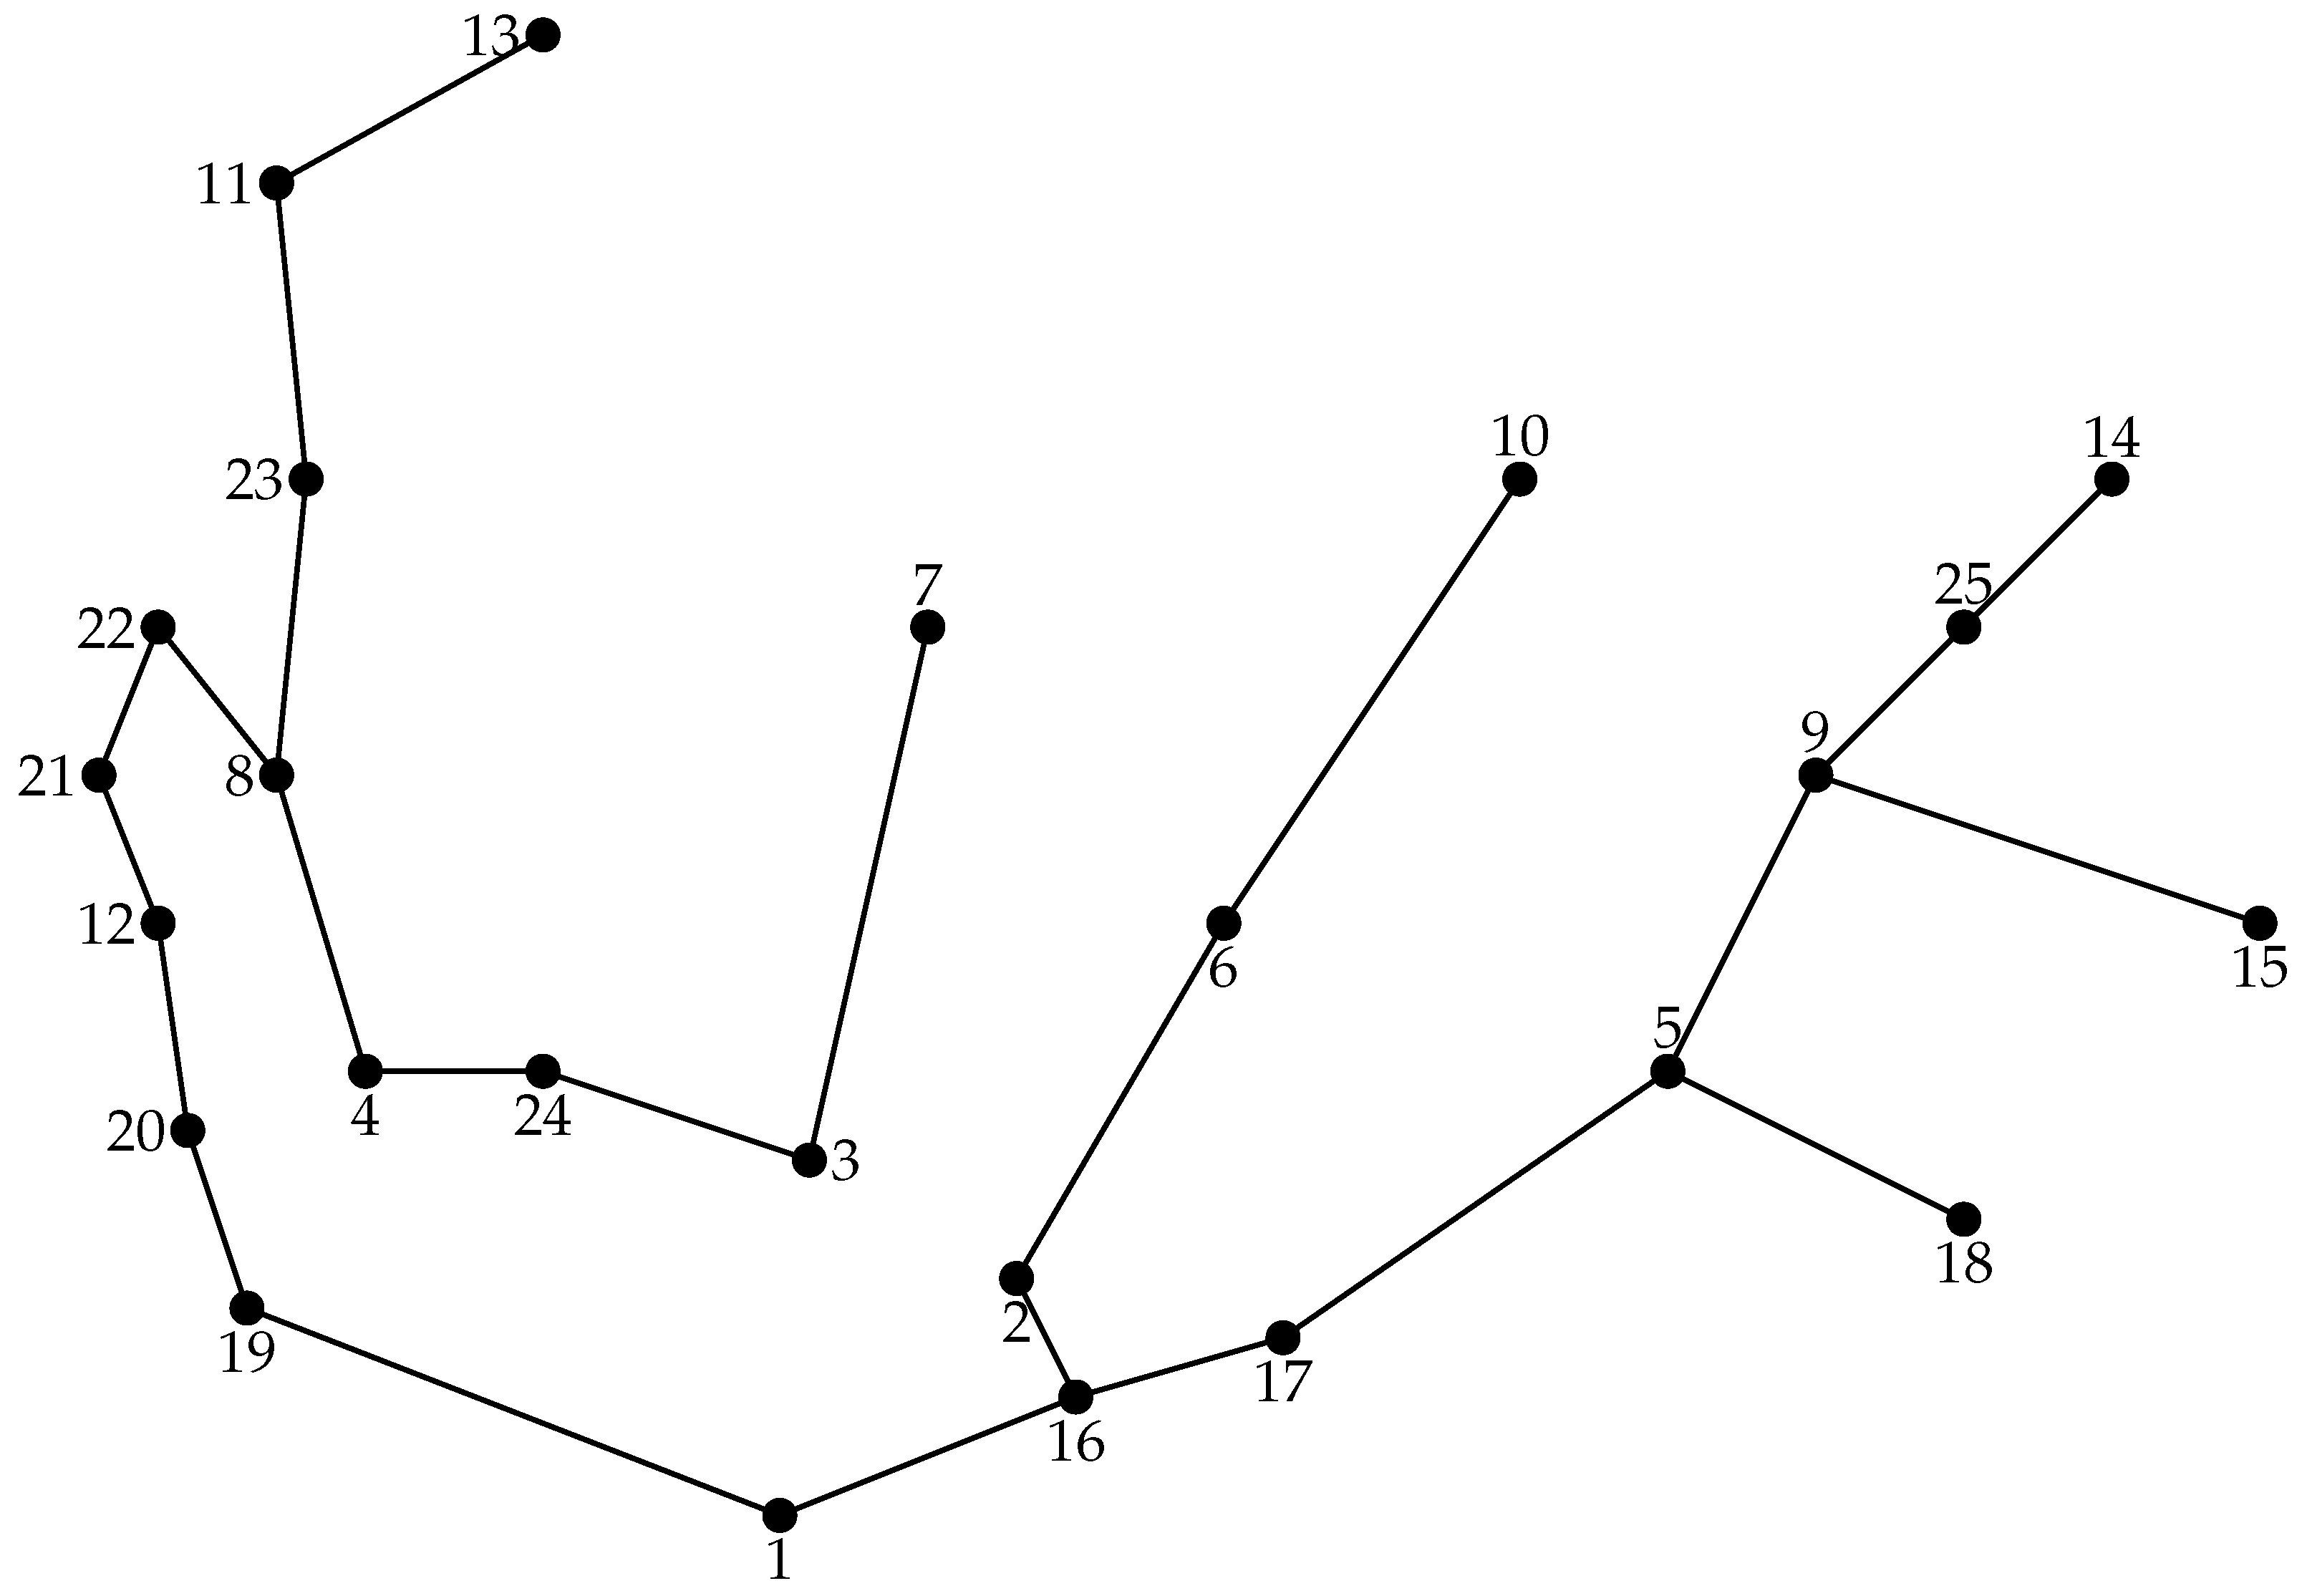
Next, we present an additional configuration for the 25-bus system in which the minimum length of the network is also 23.65 km, i.e., an alternative optimal solution for the MIP model (10)–(13). According to the electrical configurations in Figure 5 and Figure 7, 21 lines remain unaltered in both configurations, and only three routes suffer variations: 8-7 → 3-7, 9-10 → 6-10, and 15-18 → 9-15. The active lines in this alternative topology are listed below.
Active lines 5 , 7 , 9 , 11 , 13 , 17 , 21 , 22 , 23 , 24 , 26 , 28 , 30 32 , 33 , 34 , 35 , 36 , 37 , 38 , 39 , 40 , 41 , 42
When the TSA is applied to determine the optimal set of calibers for the alternative grid topology presented in Figure 7, the results presented in Table 12 are obtained.
The numerical results in Table 12 show that (i) the standard deviation among the 100 solutions obtained from the TSA is USD 640.2125, with a minimum value of USD 277,745.0448 given by solution one, a maximum value of USD 279,685.1245 defined by solution two, and a mean value of USD 278,987.2741; (ii) these numerical results demonstrate that for all of the consecutive evaluations, the TSA improves the initial configuration given by the ideal currents by at least USD 3819.5677 (see solution one); (iii) the difference among the best and worst solutions is approximately USD 1940.0797, which is caused by the increment in the cost of the energy losses defined by solution two resulting from the reduction in the investment in the calibers of the conductors; and (iv) a total of 17 lines remain with the same caliber of the initial condition for solution one, i.e., the initial condition provides 70.83 % of the configuration reported by solution one; this percentage increases to 95.83 % when solution two is analyzed because only one branch changes its caliber (see branch 22).
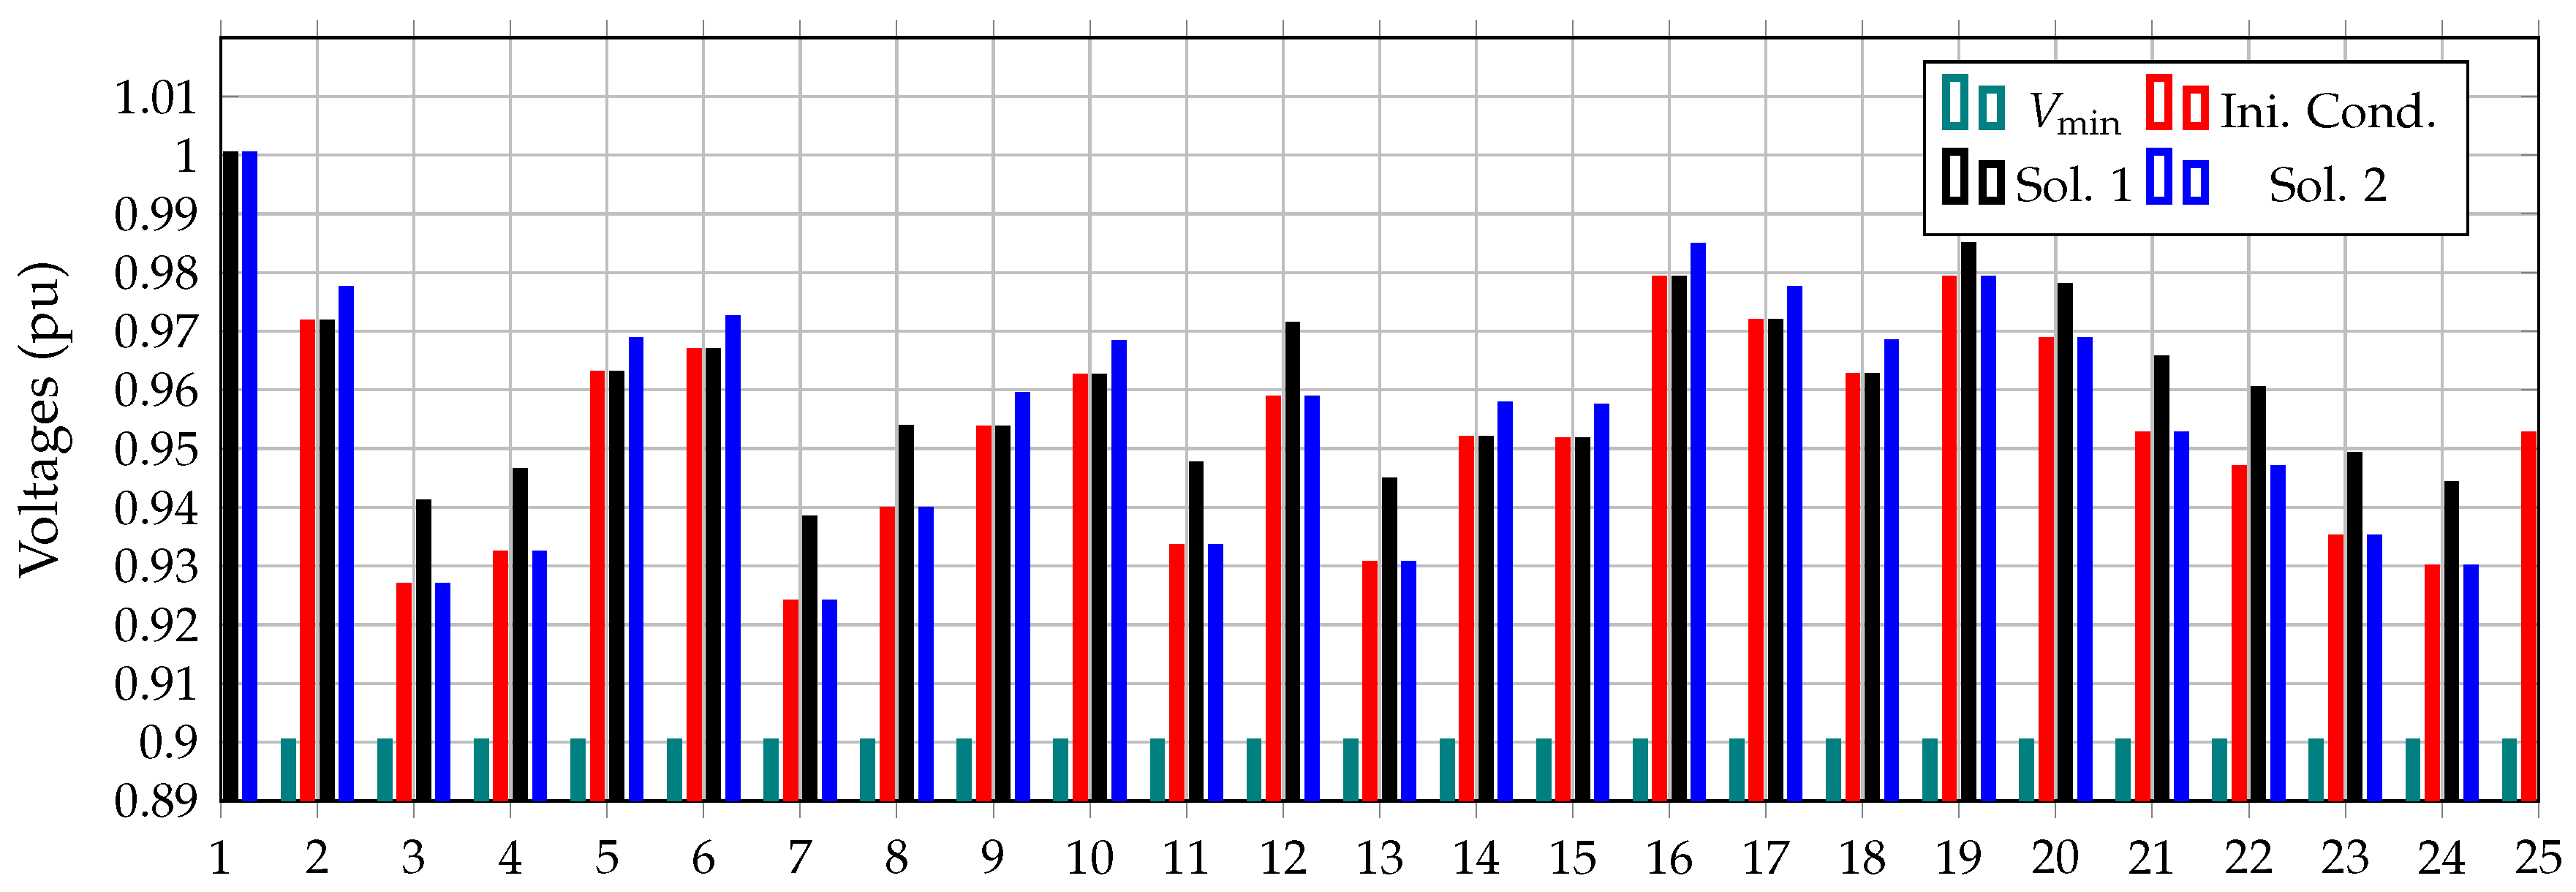
Figure 8 shows the voltage behavior of phase a (remember that the 25-bus system is symmetric) for all the solutions reported in Table 12.
The behavior of the voltage profiles in Figure 8 shows that (i) the initial configuration and solution two are superposed in all the minimum peaks, which is an expected behavior because only one caliber changed between both configurations; (ii) the best solution (solution one) presents a minimum value of 0.9379 pu at node 7, which corresponds to a final node in the grid configuration presented in Figure 7; and (iii) 95.83 % of the nodes in solution one presents a voltage regulation lower or equal to 6%, which is reduced to 83.33 % when the regulation bound is considered as 5%.
Comparing the possible electrical configurations for the 25-bus system in Figure 5 and Figure 7 based on the numerical results presented in Table 11 and Table 12, the following observations can be made:
All the solutions (without the starting points) produce annual costs between USD 270,157.5108 and USD 279,685.1245, which implies a difference of USD 9527.6136 , i.e., 3.41 % , using solution two presented in Table 12 as the base.
The initial configurations obtained by using the ideal current consumption provide at least 70 % of the optimal solution for both configurations. This demonstrates the effectiveness of the constructive algorithm to provide an adequate starting point to the TSA that allows improving it with small processing times, less than 70 s, in all the consecutive evaluations.
The behavior of the voltage profiles in both configurations confirms that the worst voltage regulation always occur in one of the ending nodes, while a maximum of 7% is achieved in all the results obtained for both configurations.

6. Conclusions and Future Work

The problem of optimal design of rural AC distribution networks was addressed in this study from a heuristic point of view. A mixed-integer programming model was used as a first step to define the best grid configuration considering the minimization of the total length of the conductors that will be required to cover all the loads with a radial configuration as the objective. The second stage makes use of the ideal current consumption per node assuming ideal voltage profiles to assign the initial calibers of the conductors. This provides a feasible solution to the planning problem that is refined by the application of a specialized TSA that improves the ideal solution by reducing the total grid costs. Numerical results demonstrate that in all the simulation cases, the initial solution provided by the heuristic algorithm is improved by the TSA; however, the final solution contains more than 70% of the calibers provided by the ideal current calculation, which confirms the efficiency of the proposed heuristic algorithm for providing an adequate initialization of the metaheuristic optimizer.
Comparison with the SCA for the 9-bus system demonstrates that the TSA presents a better numerical performance for solving the problem of optimal caliber selection in three-phase networks because its exploration steps produce soft movements through the solution space. This is not possible with the SCA, which introduces large jumps during the solution space exploration. This hinders finding good solutions to the targeted problem. In addition, the processing time of the TSA was at least 50% better than that of the SCA, which makes the former more attractive when the size of the solution space increases.
Different grid configurations with the same length were explored in both test feeders. The final objective function of the optimization plan presents small variations, which implies that it is necessary for the expert knowledge of the utility companies to obtain the best optimization plan as a function of their requirements and budget availability. However, the proposed heuristic optimization algorithm can be used as an initial step to evaluate the technical and economic feasibility of the possible grid expansion plans.
In future work, it will be possible to (i) implement an efficient optimization technique to generate grid configurations that provide better global optimization results in terms of the final costs of the plan; (ii) to apply different optimization techniques based on recently developed metaheuristics to obtain a subset of calibers for the distribution grid; and (iii) to reformulate the problem of the optimal selection of calibers in three-phase networks as a mixed-integer convex model that ensures finding the global optimum.

Author Contributions

Conceptualization, O.D.M., F.M.S., C.H.D.A., H.R.C. and L.A.-B.; Methodology, O.D.M., F.M.S., C.H.D.A., H.R.C. and L.A.-B.; Investigation, O.D.M., F.M.S., C.H.D.A., H.R.C. and L.A.-B.; Writing—review and editing, O.D.M., F.M.S., C.H.D.A., H.R.C. and L.A.-B. All authors have read and agreed to the published version of the manuscript.

Funding

This research received no external funding.

Institutional Review Board Statement

Not applicable.

Informed Consent Statement

Not applicable.

Data Availability Statement

No new data were created or analyzed in this study. Data sharing is not applicable to this article.

Acknowledgments

This work was supported in part by the Centro de Investigación y Desarrollo Científico de la Universidad Distrital Francisco José de Caldas under grant 1643-12-2020 associated with the project “Desarrollo de una metodología de optimización para la gestión óptima de recursos energéticos distribuidos en redes de distribución de energía eléctrica” and in part by the Dirección de Investigaciones de la Universidad Tecnológica de Bolívar under grant PS2020002 associated with the project “Ubicación óptima de bancos de capacitores de paso fijo en redes eléctricas de distribución para reducción de costos y pérdidas de energía: Aplicación de métodos exactos y metaheurísticos”.

Conflicts of Interest

The authors declare no conflict of interest.

Nomenclature

α 1 Positive constant associated with the violation of the current flow in the lines of the network USD/A
α 2 Positive constant associated with the violation of the voltages in the nodes of the network USD/V
L i j Length of the route that connects nodes i and j (km)
δ i j c Binary variable that determines if the caliber type c is selected for route i j
λ i j c Binary parameter that determines if there is or there is not a conductor type c in route  i j
C C C e Cost of changing a conductor type e in route i j (USD)
C N C c Cost of installing a new conductor type e in route i j (USD)
i a Interest rate to transform future values into net present values (%)
i a Interest rate associated with the increments in energy costs (%)
C kWh Cost of the energy losses (USD/kWh)
H h Duration of the period of time h (h)
R i j , a b c c Resistance of the conductor type c connected in route i j ( Ω )
I i j , f h RMS value of the current that flows in the route i j at phase f in the period of time h (A)
C O C Cost of leaving an existing conductor out of service (USD)
H Set that contains the lengths of the periods of time in which a year was divided
T Set that contains all the years of the planning horizon
F Set that contains all the phases of the grid
C 1 Represents the cost of changing an existing conductor in route i j (USD)
C 2 Represents the cost of constructing a line in route i j (USD)
C 3 Represents the annual cost because of the energy dissipated by the resistive effect of conductors in route i j (USD)
C 4 Corresponds to the cost of disconnecting an existing conductor in route i j to leave it out of service (USD)
L Denotes a set that contains all the possible routes in the distribution system graph
C Denotes a set that contains all the conductors’ calibers available for installation
yNumber of years considered in the planning horizon
E Q u · Nonlinear functions associated with the active and reactive power balances at each node
P k , f d , h Active power demand values associated with node k at phase f in the period of time h (W)
Q k , f d , h Reactive power demand values associated with node k at phase f in the period of time h (var)
V k , f h RMS value of the voltage at phase f at node k in the period of time h (V)
θ k , f h Angle of the voltage at phase f at node k in the period of time h (rad)
V min Minimum voltage regulation bound allowed for all nodes of the grid (V)
V max Maximum voltage regulation bound allowed for all nodes of the grid (V)
I c , max Maximum current bound allowed for a conductor with caliber type c (A)
nNumber of nodes of the network
sNumber of substations of the network

References

  1. Picard, J.L.; Aguado, I.; Cobos, N.G.; Fuster-Roig, V.; Quijano-López, A. Electric Distribution System Planning Methodology Considering Distributed Energy Resources: A Contribution towards Real Smart Grid Deployment. Energies 2021, 14, 1924. [Google Scholar] [CrossRef]
  2. Riaño, F.E.; Cruz, J.F.; Montoya, O.D.; Chamorro, H.R.; Alvarado-Barrios, L. Reduction of Losses and Operating Costs in Distribution Networks Using a Genetic Algorithm and Mathematical Optimization. Electronics 2021, 10, 419. [Google Scholar] [CrossRef]
  3. Li, R.; Wang, W.; Chen, Z.; Jiang, J.; Zhang, W. A Review of Optimal Planning Active Distribution System: Models, Methods, and Future Researches. Energies 2017, 10, 1715. [Google Scholar] [CrossRef] [Green Version]
  4. Lavorato, M.; Franco, J.F.; Rider, M.J.; Romero, R. Imposing Radiality Constraints in Distribution System Optimization Problems. IEEE Trans. Power Syst. 2012, 27, 172–180. [Google Scholar] [CrossRef]
  5. Farrag, M. A new model for distribution system planning. Int. J. Electr. Power Energy Syst. 1999, 21, 523–531. [Google Scholar] [CrossRef]
  6. Mejía-Solanilla, A.M.; Hincapié-Isaza, R.A.; Gallego-Rendón, R.A. Optimal planning of distribution systems considering multiple objectives: Investment cost, reliability and technical losses. Rev. Tecnura 2015, 19, 106. [Google Scholar] [CrossRef] [Green Version]
  7. Dong, Y.F.; Gu, J.H.; Li, N.N.; Hou, X.D.; Yan, W.L. Combination of Genetic Algorithm and Ant Colony Algorithm for Distribution Network Planning. In Proceedings of the 2007 IEEE International Conference on Machine Learning and Cybernetics, Hong Kong, China, 19–22 August 2007. [Google Scholar] [CrossRef]
  8. Kilyeni, S.; Barbulescu, C.; Simo, A.; Teslovan, R.; Oros, C. Genetic algorithm based distribution network expansion planning. In Proceedings of the 2014 IEEE 49th International Universities Power Engineering Conference (UPEC), Cluj-Napoca, Romania, 2–5 September 2014. [Google Scholar] [CrossRef]
  9. Montoya, O.D.; Grajales, A.; Hincapié, R.A.; Granada, M. A new approach to solve the distribution system planning problem considering automatic reclosers. Ing. Rev. Chil. Ing. 2017, 25, 415–429. [Google Scholar] [CrossRef] [Green Version]
  10. Montoya, O.D.; Giraldo, J.S.; Grisales-Noreña, L.F.; Chamorro, H.R.; Alvarado-Barrios, L. Accurate and Efficient Derivative-Free Three-Phase Power Flow Method for Unbalanced Distribution Networks. Computation 2021, 9, 61. [Google Scholar] [CrossRef]
  11. Mohamad, H.; Zalnidzham, W.I.F.W.; Salim, N.A.; Shahbudin, S.; Yasin, Z.M. Power system restoration in distribution network using minimum spanning tree—Kruskal’s algorithm. Indones. J. Electr. Eng. Comput. Sci. 2019, 16, 1–8. [Google Scholar] [CrossRef]
  12. Lavorato, M.; Rider, M.J.; Garcia, A.V.; Romero, R. Distribution network planning using a constructive heuristic algorithm. In Proceedings of the 2009 IEEE Power & Energy Society General Meeting, Calgary, AB, Canada, 26–30 July 2009. [Google Scholar] [CrossRef]
  13. Montoya, O.; Grajales, A.; Hincapié, R. Optimal selection of conductors in distribution systems using tabu search algorithm. Ing. Rev. Chil. Ing. 2018, 26, 283–295. [Google Scholar] [CrossRef] [Green Version]
  14. Granada, M.; Gallego-Rendón, R.A.; López-Lezama, J.M. Optimal Phase Balancing Planning for Loss Reduction in Distribution Systems using a Specialized Genetic Algorithm. Ing. Cienc. 2012, 8, 121–140. [Google Scholar] [CrossRef] [Green Version]
  15. Rao, B.; Kupzog, F.; Kozek, M. Three-Phase Unbalanced Optimal Power Flow Using Holomorphic Embedding Load Flow Method. Sustainability 2019, 11, 1774. [Google Scholar] [CrossRef] [Green Version]
  16. Cortés-Caicedo, B.; Avellaneda-Gómez, L.S.; Montoya, O.D.; Alvarado-Barrios, L.; Chamorro, H.R. Application of the Vortex Search Algorithm to the Phase-Balancing Problem in Distribution Systems. Energies 2021, 14, 1282. [Google Scholar] [CrossRef]
  17. Lavorato, M.; Rider, M.J.; Garcia, A.V.; Romero, R. A Constructive Heuristic Algorithm for Distribution System Planning. IEEE Trans. Power Syst. 2010, 25, 1734–1742. [Google Scholar] [CrossRef]
  18. Fan, N.; Golari, M. Integer Programming Formulations for Minimum Spanning Forests and Connected Components in Sparse Graphs. In Combinatorial Optimization and Applications; Springer International Publishing: New York, NY, USA, 2014; pp. 613–622. [Google Scholar] [CrossRef]
  19. Haouari, M.; Chaouachi, J.; Dror, M. Solving the generalized minimum spanning tree problem by a branch-and-bound algorithm. J. Oper. Res. Soc. 2005, 56, 382–389. [Google Scholar] [CrossRef]
  20. Malamaki, K.N.D.; Konstantinidis, I.; Demoulias, C.S. Analytical evaluation of the annual load duration curve of domestic prosumers. In Proceedings of the 2017 IEEE Manchester PowerTech, Manchester, UK, 18–22 June 2017. [Google Scholar] [CrossRef]
  21. Caserta, M. Tabu Search-Based Metaheuristic Algorithm for Large-scale Set Covering Problems. In Metaheuristics; Springer: New York, NY, USA, 2007; pp. 43–63. [Google Scholar] [CrossRef]
  22. Xing, L.; Liu, Y.; Li, H.; Wu, C.C.; Lin, W.C.; Chen, X. A Novel Tabu Search Algorithm for Multi-AGV Routing Problem. Mathematics 2020, 8, 279. [Google Scholar] [CrossRef] [Green Version]
  23. Tang, F.; Zhou, H.; Wu, Q.; Qin, H.; Jia, J.; Guo, K. A Tabu Search Algorithm for the Power System Islanding Problem. Energies 2015, 8, 11315–11341. [Google Scholar] [CrossRef] [Green Version]
  24. Lucay, F.; Gálvez, E.; Cisternas, L. Design of Flotation Circuits Using Tabu-Search Algorithms: Multispecies, Equipment Design, and Profitability Parameters. Minerals 2019, 9, 181. [Google Scholar] [CrossRef] [Green Version]
  25. Ismael, S.M.; Aleem, S.H.E.A.; Abdelaziz, A.Y. Optimal selection of conductors in Egyptian radial distribution systems using sine-cosine optimization algorithm. In Proceedings of the IEEE 2017 Nineteenth International Middle East Power Systems Conference (MEPCON), Cairo, Egypt, 19–21 December 2017. [Google Scholar] [CrossRef]
  26. Martínez-Gil, J.F.; Moyano-García, N.A.; Montoya, O.D.; Alarcon-Villamil, J.A. Optimal Selection of Conductors in Three-Phase Distribution Networks Using a Discrete Version of the Vortex Search Algorithm. Computation 2021, 9, 80. [Google Scholar] [CrossRef]
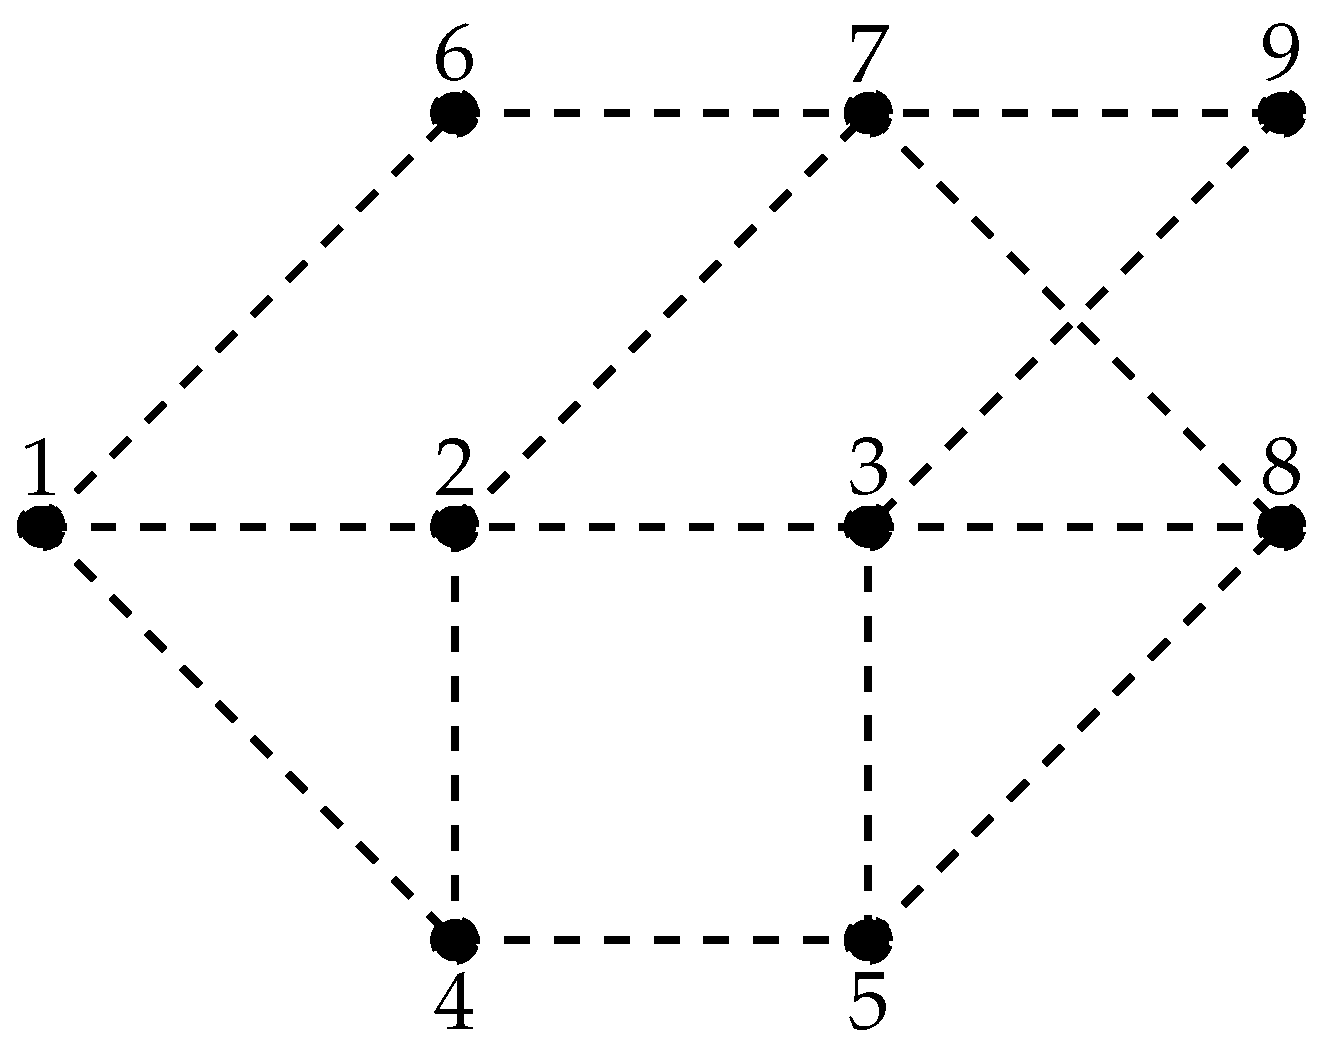
Figure 1. Possible routes of the distribution test feeder.
Energies 14 05141 g001
Figure 2. Possible routes of the distribution test feeder.
Energies 14 05141 g002
Figure 3. Possible routes of the 25-bus test feeder.
Energies 14 05141 g003
Figure 4. An alternative solution for the 9-bus system regarding optimal routes.
Energies 14 05141 g004
Figure 5. Selection of optimal routes for the 25-bus test feeder.
Energies 14 05141 g005
Figure 6. Voltage profiles in phase a for all the solutions reported in Table 11.
Energies 14 05141 g006
Figure 7. Alternative solution for routes of the 25-bus test feeder.
Energies 14 05141 g007
Figure 8. Voltage profiles in phase a for all the solutions reported in Table 12.
Energies 14 05141 g008
Table 1. Lengths for the routes in Figure 1.
RouteLength (m)RouteLength (m)
1-24003-8920
1-48503-9875
1-66004-5650
2-36505-81000
2-46506-7650
2-78257-8800
3-56507-9720
Table 2. Possible calibers for a numerical example.
CaliberCurrent (A)Costs (USD/km)Resistance ( Ω /km)Reactance ( Ω /km)
17515000.800.50
210020000.720.45
312527500.650.40
415030000.600.40
517535000.550.36
620042000.450.32
722547000.400.28
Table 3. Load consumption for a numerical example (lagging power factor of 0.9).
NodeLoad (kW)NodeLoad (kW)
285061500
37507500
49258850
5100091250
Table 4. Ideal current consumption for each route.
(Line) RouteCurrent (A)Caliber Selected(Line) RouteCurrent (A)Caliber Selected
(1) 1-2171.30976(5) 1-6199.25387
(2) 2-336.44891(6) 6-7126.35614
(3) 2-493.55213(7) 7-841.30871
(4) 4-548.59851(8) 7-960.74811
Table 5. Three-phase apparent power consumption at each node (lagging power factor of 0.90 ).
Node
Load (kVA)
Node
Load (kVA)
Node
Load (kVA)
Node
Load (kVA)
Node
Load (kVA)
Node
Load (kVA)
2 (625)3 (400)4 (250)5 (250)6 (125)7 (250)
8 (250)9 (625)10 (400)11 (250)12 (400)13 (250)
14 (250)15 (250)16 (375)17 (200)18 (100)19 (250)
20 (100)21 (150)22 (100)23 (200)24 (250)25 (75)
Table 6. Information of the possible feeder routes.
Branch
Length (km)
Branch
Length (km)
Branch
Length (km)
Branch
Length (km)
Branch
Length (km)
Branch
Length (km)
1 (2.10)2 (1.65)3 (2.20)4 (2.00)5 (1.50)6 (1.75)
7 (1.75)8 (1.75)9 (1.00)10 (1.00)11 (1.25)12 (1.50)
13 (1.75)14 (2.00)15 (2.00)16 (1.75)17 (1.25)18 (1.75)
19 (1.75)20 (2.75)21 (1.75)22 (1.50)23 (1.05)24 (0.75)
25 (1.05)26 (1.00)27 (1.50)28 (0.75)29 (1.25)30 (1.55)
31 (1.00)32 (0.75)33 (0.75)34 (0.50)35 (0.50)36 (1.05)
37 (0.50)38 (0.65)39 (0.75)40 (0.45)41 (0.50)42 (0.40)
Table 7. Relation among branches and nodes.
Branch
Nodes
Branch
Nodes
Branch
Nodes
Branch
Nodes
Branch
Nodes
Branch
Nodes
1 (1-2)2 (1-3)3 (1-4)4 (2-5)5 (2-6)6 (3-6)
7 (3-7)8 (4-7)9 (4-8)10 (4-12)11 (5-9)12 (6-9)
13 (6-10)14 (7-10)15 (7-11)16 (7-8)17 (9-15)18 (9-10)
19 (10-14)20 (10-13)21 (11-13)22 (1-16)23 (2-16)24 (16-17)
25 (2-17)26 (5-17)27 (17-18)28 (5-18)29 (15-18)30 (1-19)
31 (4-19)32 (19-20)33 (12-20)34 (12-21)35 (21-22)36 (8-23)
37 (11-23)38 (8-22)39 (3-24)40 (9-25)41 (14-25)42 (4-24)
Table 8. Numerical results for the 9-bus system.
MethodType of CalibersCost of Calibers (USD)Cost of Losses (USD) A cost (USD)Time (s)
Without initial condition
TSA 6 , 2 , 2 , 2 , 7 , 4 , 1 , 1 45,173.261437,89083,063.261412.20
SCA 5 , 2 , 2 , 1 , 7 , 6 , 2 , 2 44,231.994640,69584,926.994628.73
With initial condition
Ini. Cond. 6 , 1 , 3 , 1 , 7 , 4 , 1 , 1 44,857.334037,402.5082,259.8340
TSA 7 , 1 , 2 , 1 , 7 , 4 , 1 , 1 44,577.279736,54081,117.279714.35
SCA 6 , 1 , 3 , 1 , 7 , 4 , 1 , 1 44,857.334037,402.5082,259.834028.76
Table 9. Ideal current consumption of each route in the alternative solution for the 9-bus system.
(Line) RouteCurrent (A)Caliber Selected(Line) RouteCurrent (A)Caliber Selected
(1) 1-2171.30976(5) 1-6199.25387
(2) 2-385.04742(6) 6-7126.35614
(3) 2-444.95361(7) 7-841.30871
(4) 3-548.59851(8) 7-960.74811
Table 10. Numerical results for the 9-bus system with the alternative configuration.
MethodType of CalibersCost of Calibers (USD)Cost of Losses (USD) A cost (USD)Time (s)
Without initial condition
TSA 7 , 2 , 1 , 1 , 7 , 5 , 2 , 2 42,735.034639,79582,530.034612.13
With initial condition
Ini. Cond. 6 , 2 , 1 , 1 , 7 , 4 , 1 , 1 44,928.488135,94080,868.4881
TSA 7 , 2 , 1 , 1 , 7 , 4 , 1 , 1 44,041.070836,54080,581.070814.41
Table 11. Numerical results for the 25-bus system.
MethodType of CalibersCost of Calibers (USD)Cost of Losses (USD) A cost (USD)
Ini. Cond. 1 , 1 , 1 , 1 , 1 , 5 , 4 , 3 , 3 , 1 , 1 , 5 1 , 2 , 2 , 1 , 1 , 1 , 1 , 1 , 1 , 1 , 1 , 1 138,445.8843138,262.50276,708.3843
Sol. 1 (min) 1 , 1 , 1 , 1 , 1 , 7 , 7 , 6 , 2 , 1 , 1 , 5 1 , 2 , 2 , 1 , 1 , 1 , 1 , 1 , 1 , 1 , 1 , 1 120,127.5108150,030270,157.5108
Sol. 2 (max) 1 , 2 , 1 , 1 , 1 , 7 , 7 , 5 , 2 , 1 , 1 , 5 1 , 2 , 2 , 1 , 1 , 1 , 1 , 1 , 1 , 1 , 1 , 1 120,767.4154150,330271,097.4154
Table 12. Numerical results for the alternative 25-bus system.
MethodType of CalibersCost of Calibers (USD)Cost of Losses (USD) A cost (USD)
Ini. Cond. 1 , 1 , 1 , 1 , 1 , 1 , 1 , 5 , 1 , 2 , 2 , 1 5 , 4 , 4 , 3 , 3 , 1 , 1 , 3 , 1 , 1 , 1 , 1 143,217.1922140,287.50283,504.6922
Sol. 1 (min) 1 , 1 , 1 , 1 , 1 , 1 , 1 , 5 , 1 , 2 , 2 , 2 7 , 7 , 7 , 4 , 4 , 1 , 1 , 4 , 1 , 1 , 1 , 1 122,990.0448154,755277,745.0448
Sol. 2 (max) 1 , 1 , 1 , 1 , 1 , 1 , 1 , 7 , 1 , 2 , 2 , 1 5 , 4 , 4 , 3 , 3 , 1 , 1 , 3 , 1 , 1 , 1 , 1 133,997.6245145,687.50279,685.1245
Publisher’s Note: MDPI stays neutral with regard to jurisdictional claims in published maps and institutional affiliations.