Article

Machine Learning-Based Fault Detection and Diagnosis of Faulty Power Connections of Induction Machines

Faculty of Engineering, Mondragon Unibertsitatea, 20500 Arrasate-Mondragón, Gipuzkoa, Spain
*
Author to whom correspondence should be addressed.
Energies 2021, 14(16), 4886; https://doi.org/10.3390/en14164886
Submission received: 20 June 2021 / Revised: 2 August 2021 / Accepted: 3 August 2021 / Published: 10 August 2021
(This article belongs to the Special Issue Early Detection of Faults in Induction Motors)

Abstract

:
Induction machines have been key components in the industrial sector for decades, owing to different characteristics such as their simplicity, robustness, high energy efficiency and reliability. However, due to the stress and harsh working conditions they are subjected to in many applications, they are prone to suffering different breakdowns. Among the most common failure modes, bearing failures and stator winding failures can be found. To a lesser extent, High Resistance Connections (HRC) have also been investigated. Motor power connection failure mechanisms may be due to human errors while assembling the different parts of the system. Moreover, they are not only limited to HRC, there may also be cases of opposite wiring connections or open-phase faults in motor power terminals. Because of that, companies in industry are interested in diagnosing these failure modes in order to overcome human errors. This article presents a machine learning (ML) based fault diagnosis strategy to help maintenance assistants on identifying faults in the power connections of induction machines. Specifically, a strategy for failure modes such as high resistance connections, single phasing faults and opposite wiring connections has been designed. In this case, as field data under the aforementioned faulty events are scarce in industry, a simulation-driven ML-based fault diagnosis strategy has been implemented. Hence, training data for the ML algorithm has been generated via Software-in-the-Loop simulations, to train the machine learning models.

1. Introduction

Induction motors (IM), especially squirrel cage motors, constitute the core of many electric drives. They are widely used in industrial applications such as machining tools, electric vehicles and railway traction systems. Their simplicity, robustness and ease of maintenance have made them popular in industry. However, like any component, they are not totally free from failures. Therefore, in the last decades, numerous studies have been carried out analysing their failure modes, their probabilities of happening and proposing fault detection and diagnosis (FDD) strategies.
From the point of view of a generic electric drive, the electric machine can be defined as one of the main subsystems together with the invert block, the power source and the sensors. Bearing in mind this schema, it is worth summarizing the different failure modes that may appear in these subsystems due to the influence they can have on the behaviour of the induction machine. Regarding the inverter, the main failure modes can be summarized regarding power semiconductors (MOSFET, IGBT, Diode) and electrolytic filtering capacitors faults. When referring to semiconductors, the most typical faults are short- and open-circuit faults. The former is normally considered a destructive fault because of its high overcurrent effects, therefore, it typically requires the adoption of actions to shut down the drive immediately. The latter, which usually leads to complete or partial losses of the current at the exit of the inverter, is not usually classified as catastrophic. This means that these faults can remain undetected for a long time since the entire system can continue to operate in a degraded mode, so, it is interesting to develop health management strategies to detect the anomalies in advance [1,2,3,4,5]. In the case of the electrolytic capacitors that usually make up the DC link, the most frequent failure mode tends to be the ageing of the component because of operating in hard working conditions. This mainly leads to the variation of the capacitance (C) and the equivalent series resistance (ESR) which may cause not fulfilling the tasks of maintaining a constant DC voltage value, neither protecting power converters from over-voltages and sudden drops in the energy voltage source, nor presenting a high impedance against the harmonics generated by the inverter [6,7,8]. Concerning the sensors, they are usually used for control and protection tasks of the electric drive. However, when they operate in harsh working environments, they sometimes become prone to failure, causing abnormal operation of the electrical machine, reducing the efficiency of the traction force, or even causing an emergency stop. The most common failure modes can be summarized in gain or offset in the measurement or direct disconnection of the device, as they can be understood in [3,9,10,11,12].
Focussing on the electric machine subsystem, as summarised in [13,14,15,16], the failure modes of induction motors can be grouped into stator failures and rotor failures. Among the most common stator failures, stator winding short-circuits (in their different modes), vibration problems and phase connection failures can be found. The most common rotor failures are bar breakages, rotor misalignments or bearing problems, either due to bearing failures, lack of lubrication or misalignment. As a result, several FDD strategies have been proposed for these types of problems in different applications [17], such as electric vehicles, railway traction drives or renewable energy systems.
On the one hand, model-based techniques are usually used for the identification of motor parameters in order to monitor their deviation from the nominal values [18,19,20,21]. On the other hand, in the field of signal-based methods, there are alternatives such as the Park’s Vector monitoring for stator short-circuit [22,23], stator imbalance [24] and rotor bar breakage [25] detection. However, the most widely used technique in induction motor FDD has been the frequency analysis of phase currents. This frequency analysis known as Motor Current Signature Analysis (MCSA) is the most popular one [26,27,28,29].
In recent years, the emergence of Industry 4.0 and the use of artificial intelligence methods, such as machine learning (ML) or deep learning (DL) have led to the development of data-driven FDD techniques. ML or DL have been used as a complement to the aforementioned techniques to help in the classification and prediction of failure modes. For example, there are many examples that use vibration or current measurements to diagnose stator and rotor failures [30,31,32,33,34,35]. Article [36] presents an extensive review of the application of data-driven methods for electric drives.
However, among all the IM failure modes, the one that has perhaps been studied the least is motor wiring or connection failures. It is worth mentioning that failure modes such as open-phase, High Resistance Connections or opposite-phase wiring in IM connections are usually catastrophic. In other words, although these failure modes are not frequent, when they occur, the maintenance tasks become very costly because most of the time the rolling stock must be stopped and the electric machine must be repaired. Furthermore, in the majority of cases, they is often a link to human errors during manufacture, resulting in incorrectly tightened terminals or poor wirings. In an industrial context, there are situations where due to manufacturing or maintenance mistakes, current imbalance and opposite-phase wiring problems can occur. For example, when a faulty inverter is replaced in a depot, the wiring can be deficiently installed and faulty equipment is put in service. As a result, they are considered high-cost, low-probability cases.
For example, the detection of HRC has been approached using different techniques. Thermal imaging can be a useful and effective technique for manual inspections [37]. However, it can be costly and difficult to automatise. During the last decades, online detection methods have been developed mainly based on resistance estimation or current sequence analysis. The first method consists of estimating the resistance by injecting voltage pulses with the inverter already installed in the drive, as proposed in [38]. The authors of this paper propose to measure the voltage between the neutral point of the motor and the negative of the DC-link. The main disadvantage of this method is the need for an additional sensor, as well as the fact that the neutral point is usually not accessible. In [39], the authors use the same method but without additional sensors. They inject two voltage vectors and with the measurements of their respective currents calculate the phase resistance. It is mentioned that with this method the effect of inverter nonlinearities on the estimation can be eliminated. Furthermore, ref. [40] proposes a similar method but while compensating for the effect of the inverter by pre-calculating the voltage drop across the semiconductors. The second method proposes to detect the negative sequence of currents due to system unbalance. In [41,42], the authors develop an induction motor model taking into account the effect of HRC and stator short circuits. From these models, a negative sequence of current and voltage due to unbalance can be estimated and used as a fault indicator. They also make an effort to be able to identify the specific failure mode (HRC or short-circuit). Furthermore, in [43] a similar technique is presented, but this time the drive control strategy is used to calculate the negative sequence and to implement a fault-tolerant control.
As far as open-circuit faults are concerned, few papers refer to the detection of this failure mode when it occurs at the motor connection. However, the effect of this failure mode is similar regardless of whether it occurs in the wiring, the inverter or the motor. Therefore, the techniques proposed in the literature could be used for all of them. Park’s Vector Approach is one of the most widely used methods [44]. In [45,46,47], condition monitoring using this technique is proposed to detect open-circuit faults in inverters. The same fault is detected in [48] by calculating indicators from the mean value of the currents. Moreover, there are also model-based techniques, such as the one presented in [49], where a model is proposed and validated, which takes into account open-circuit faults in the phases and in the wiring.
All these strategies need to be executed at high frequency and usually embedded in the controller of the drive. This can be challenging in some applications such as electric transportation or renewable energy systems, where controller memory and computational capacity is limited. Furthermore, increasing the cost of a drive by adding FDD functionalities is not justified nowadays, especially in view of the rise of communication and cloud-based technologies. As mentioned in [36], FDD strategy trends show that data-driven methodologies based on ML or DL have emerged as a valid solution for electric drives. As an example, several publications show the application of ML or DL for the detection of faults in stator, rotor and bearings [32,50,51,52]. In the case of HRCs in electric motors, ref. [53] shows the training, validation and testing of an artificial neural network. It can be said that this is an evolution of the classical negative/zero sequence technique, where the neural network models the healthy state and classifies faulty states.
In applications such as a railway traction, fault detection and isolation is more difficult due to the composition of the system. Usually, a rolling stock is composed by several inverter boxes that can feed more than one induction motor in parallel (see Figure 1). As an example, a train can have six motors, each of them controlled in pairs by three controllers/inverters. Thus, when the driver sets a general torque command for the whole traction chain, the motors are controlled independently dividing the total command by the number of inverters. As a result, in some failure modes, this structure can be defined as catastrophic, because even if there is a faulty motor in the total 6, the rest ones will keep working. As the rotor of the motor and the axle of the boogie are coupled mechanically, even if the motor is faulty, the rotor will continue turning due to the train inertia. While the control unit tries to control the torque of the motor, high overcurrent and overvoltages can generate irreversible failures.
Seeing the potential that ML and DL techniques have had on other failure modes, this paper proposes a data-driven strategy for the detection and classification of HRC, open-phase and opposite-phase wiring faults in induction machines implemented in railway applications. For this, a Software-in-the-Loop (SiL) simulation platform is used in order to generate the data to train the ML models. Concretely, the SiL simulation replicates the behaviour of an electric drive from a tram traction application. The rest of the paper is organized as follows: Section 2 introduces the SiL platform used for data generation. Afterwards, Section 3 presents the development of the ML-based fault diagnosis strategy. Step-by-step data preprocessing, feature engineering and ML model training and testing are explained. Finally, Section 4 presents the main conclusions of the work.

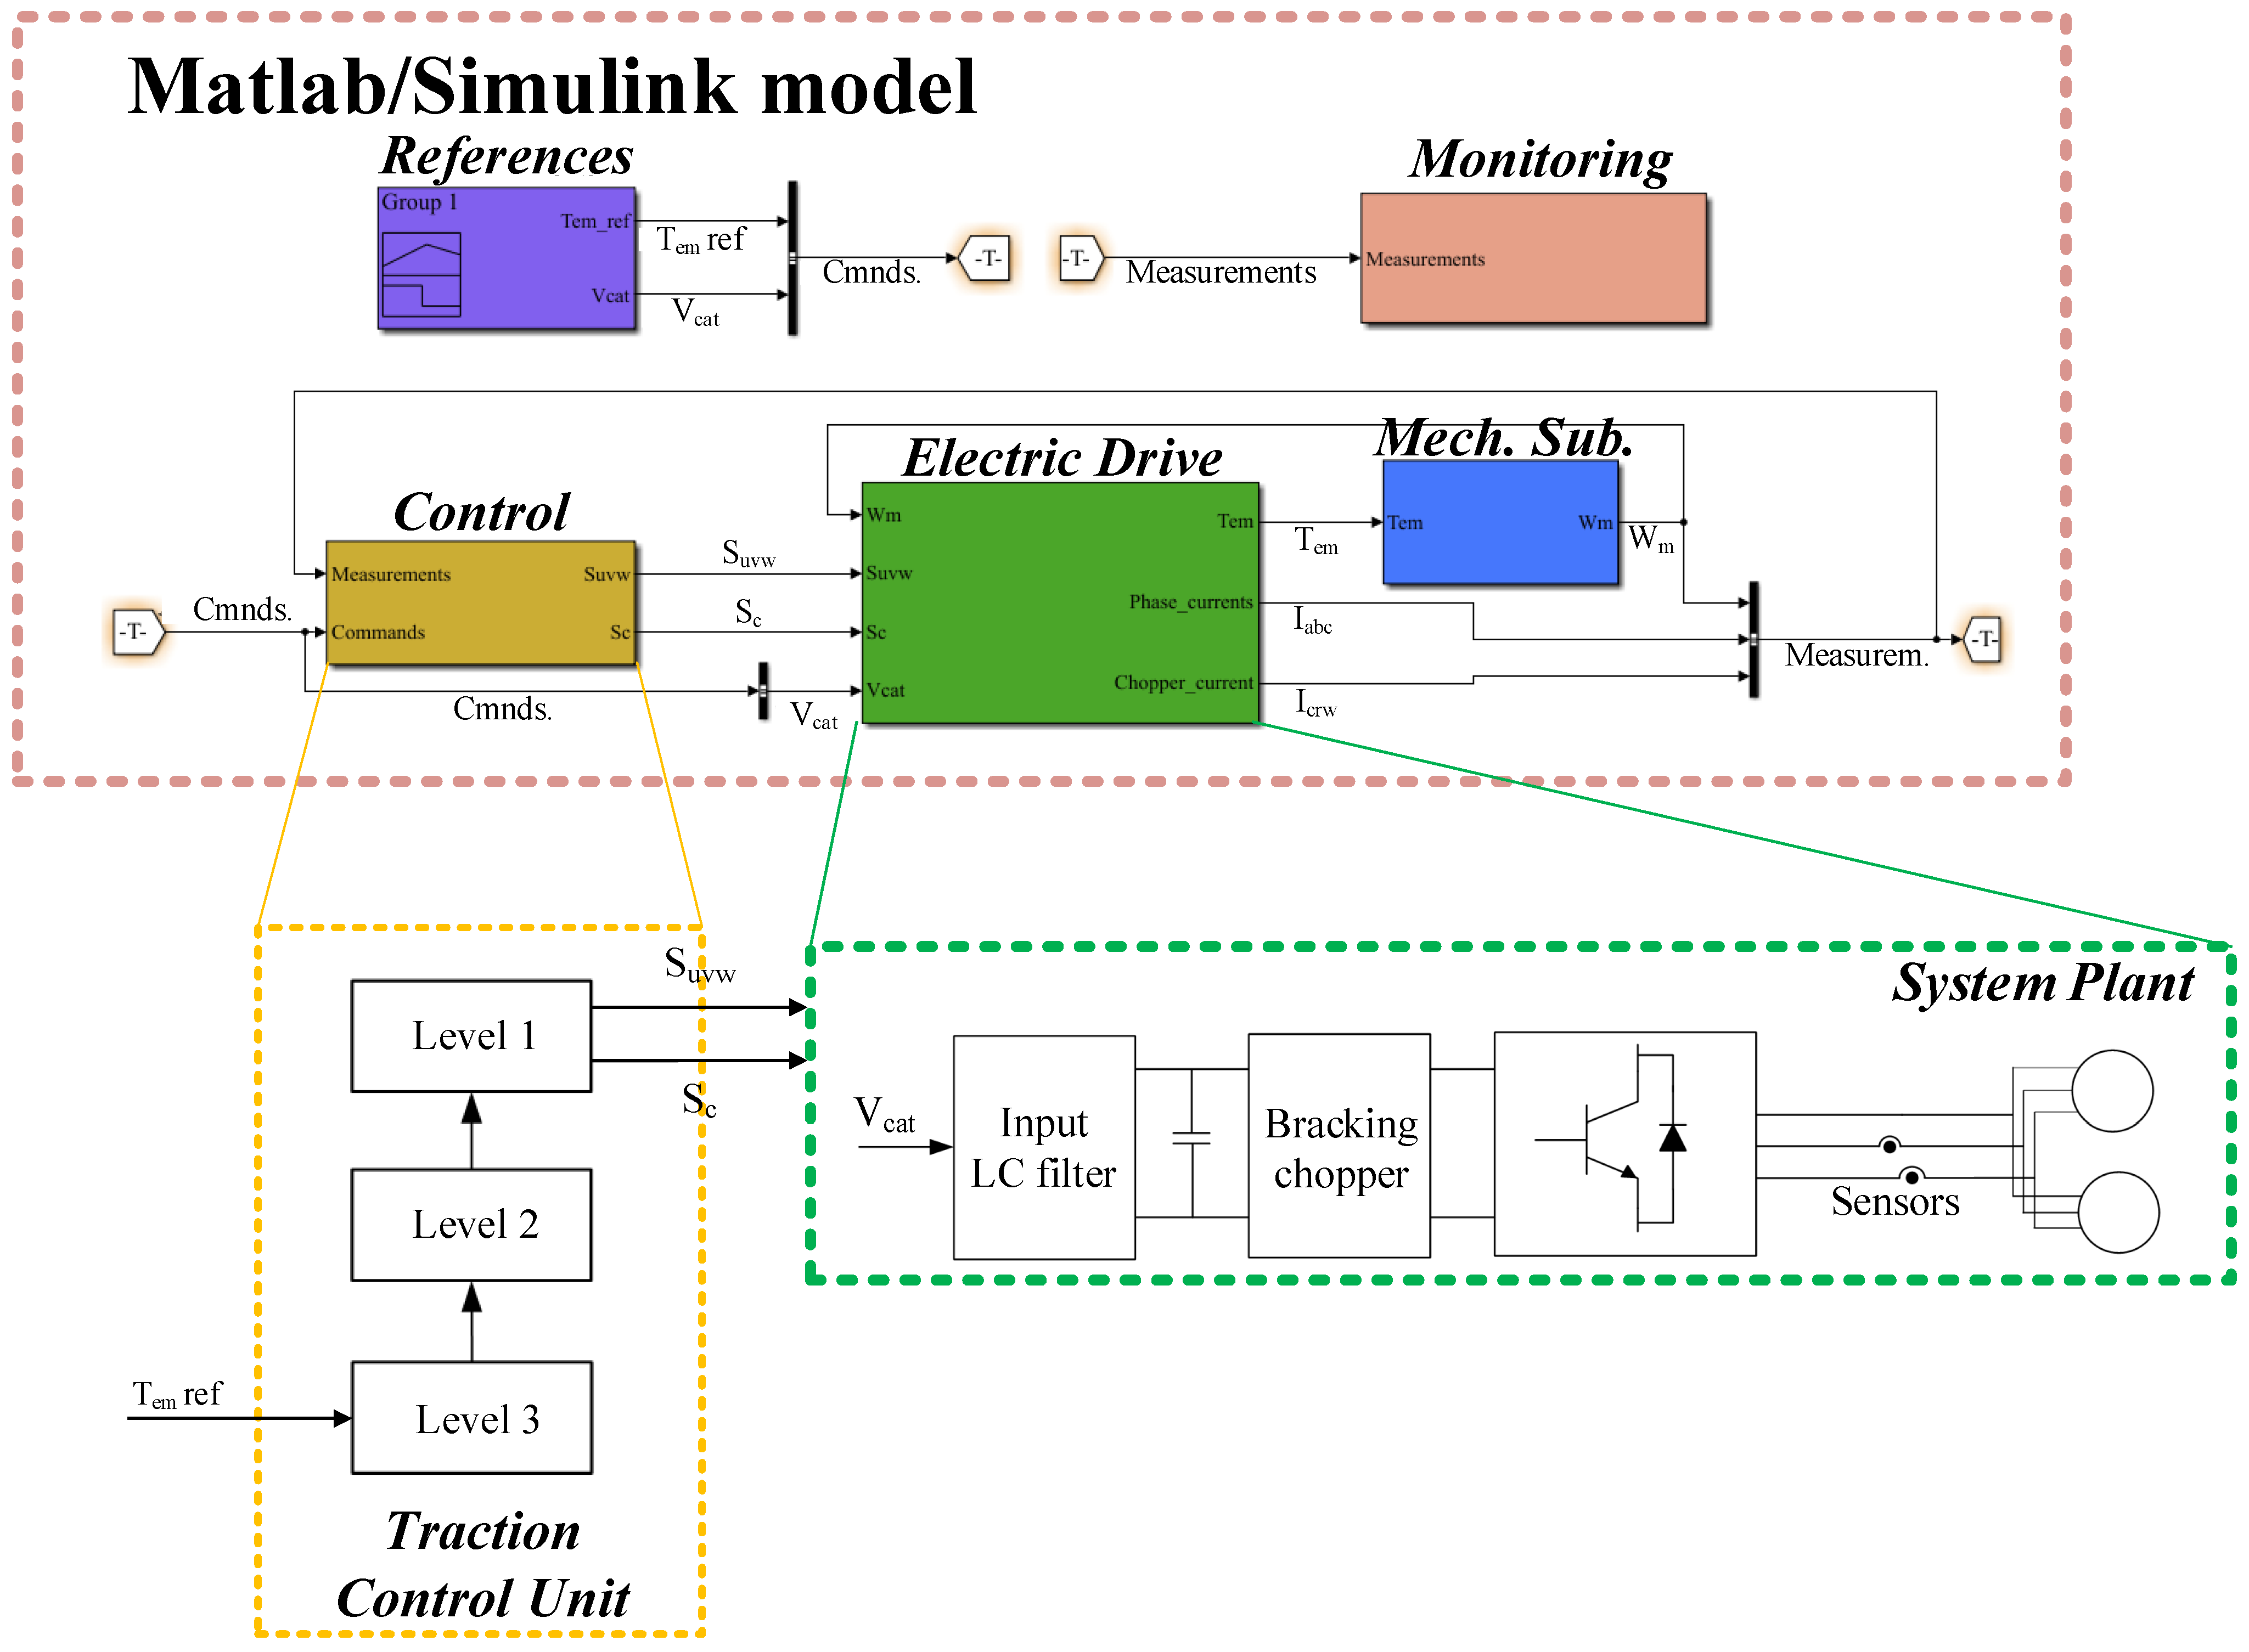
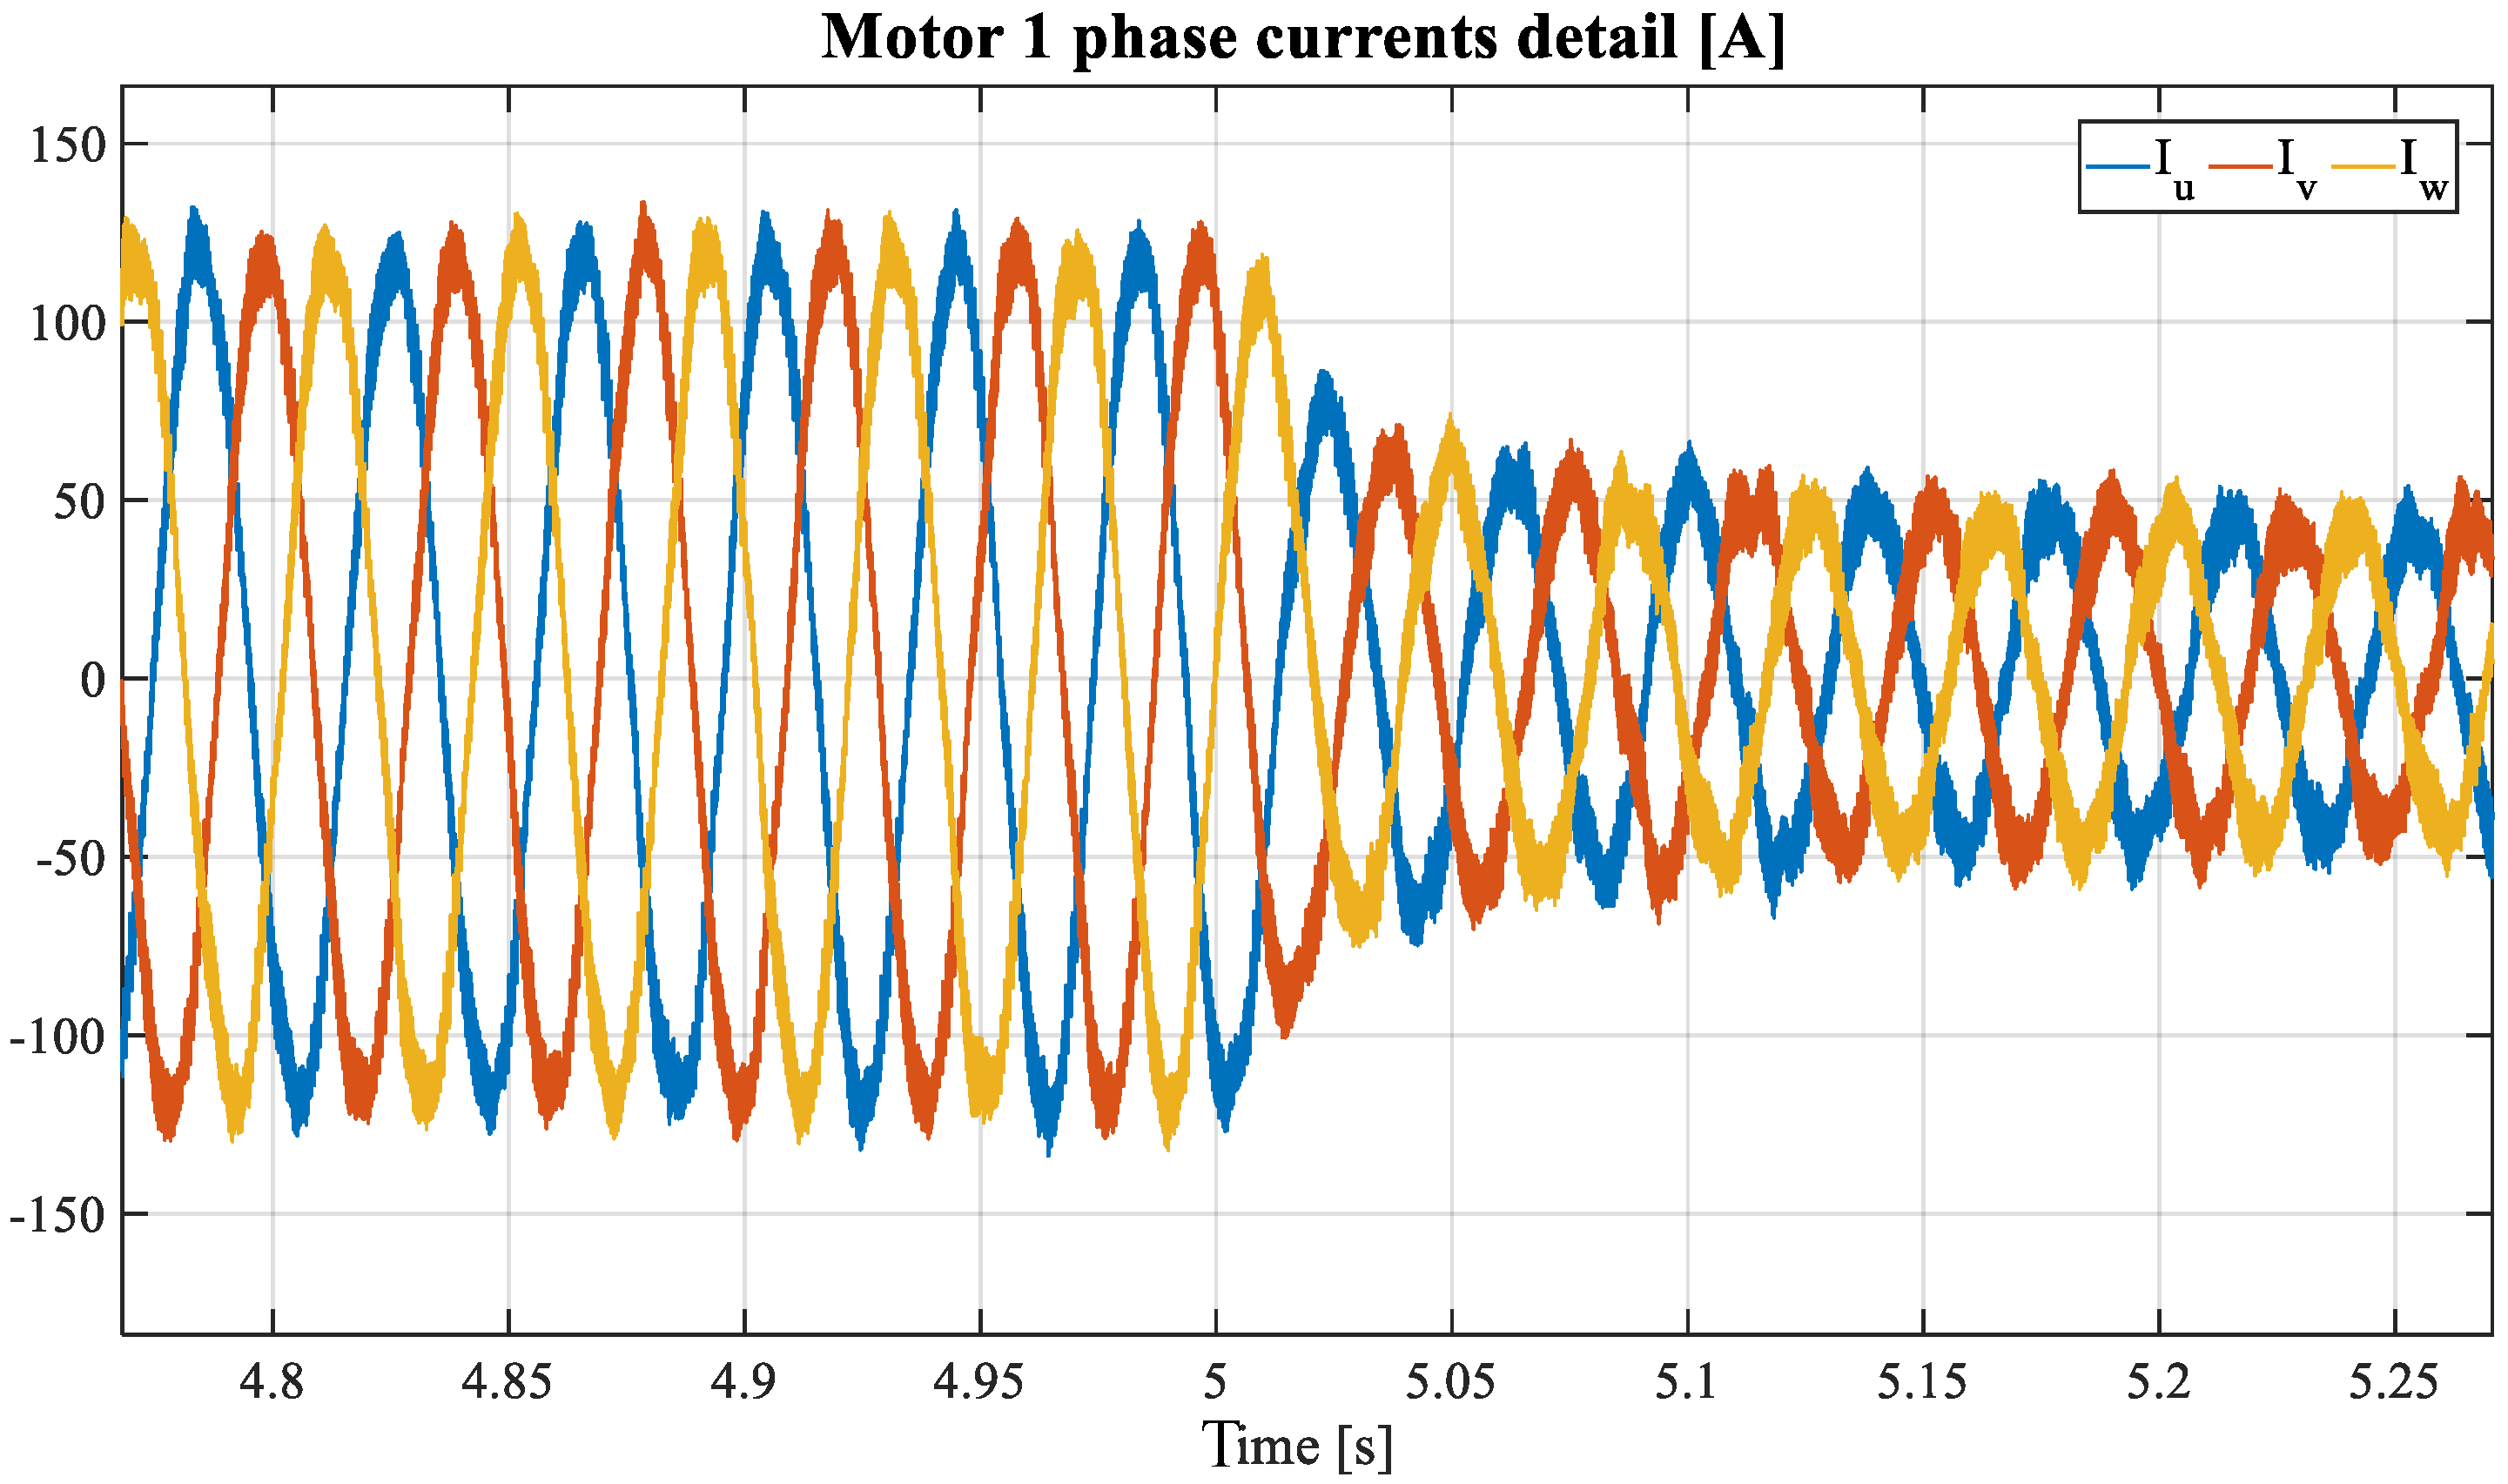
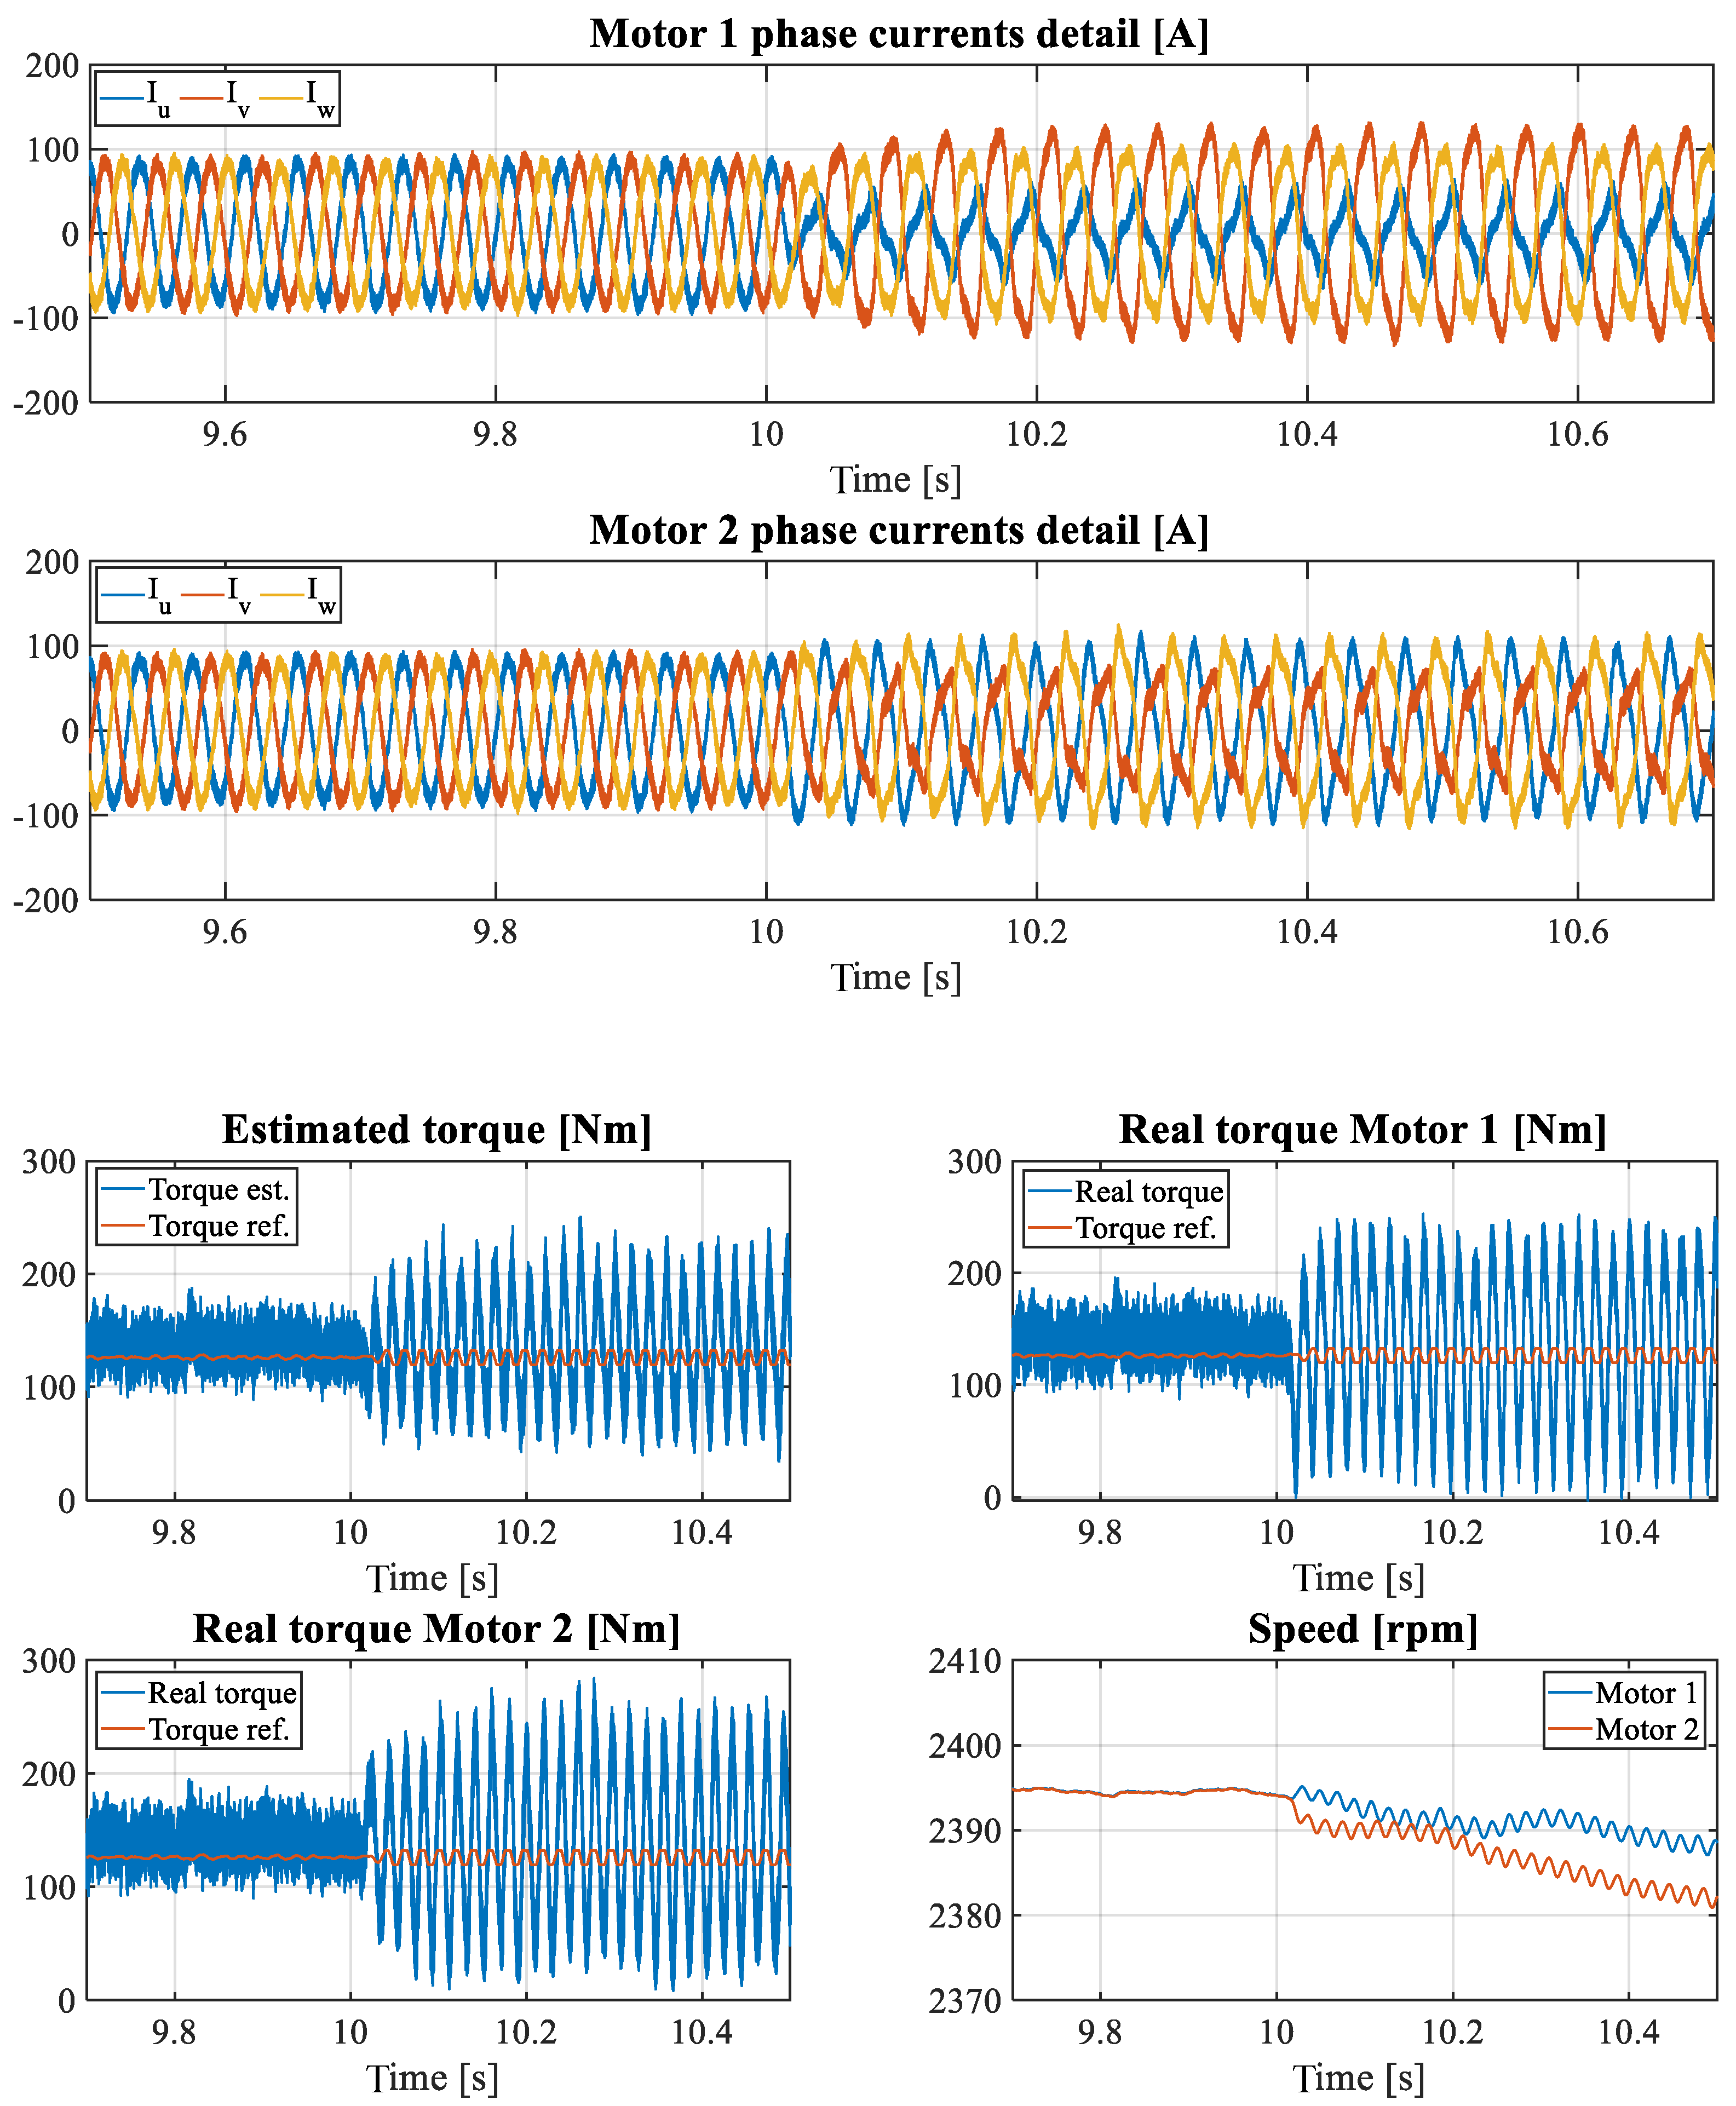
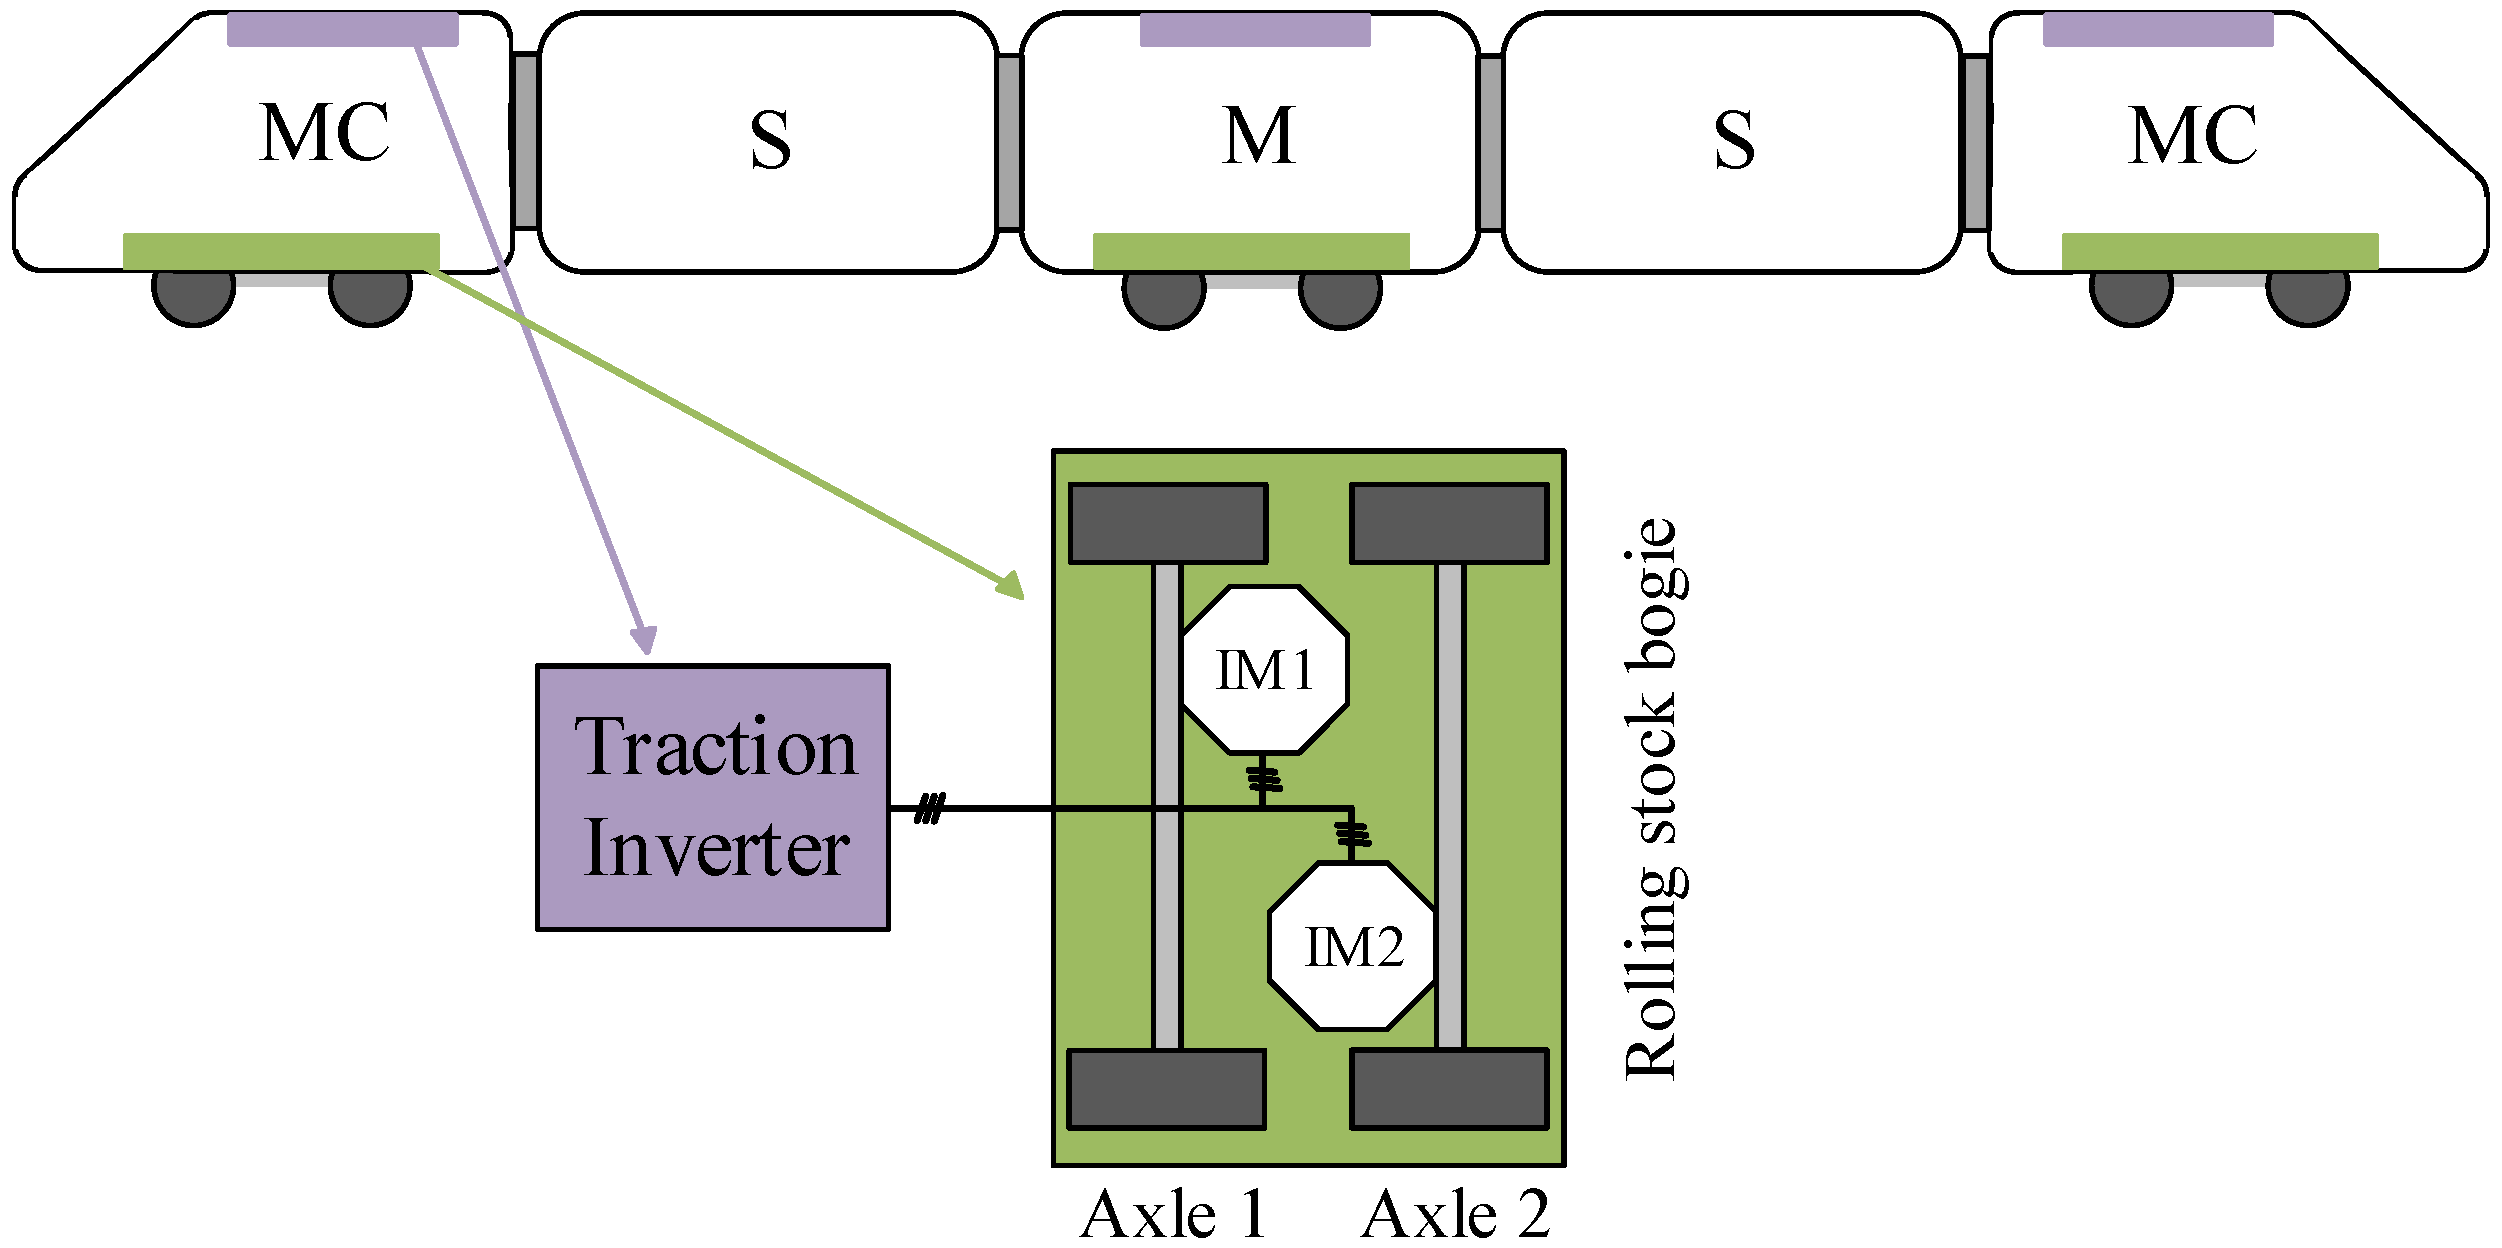
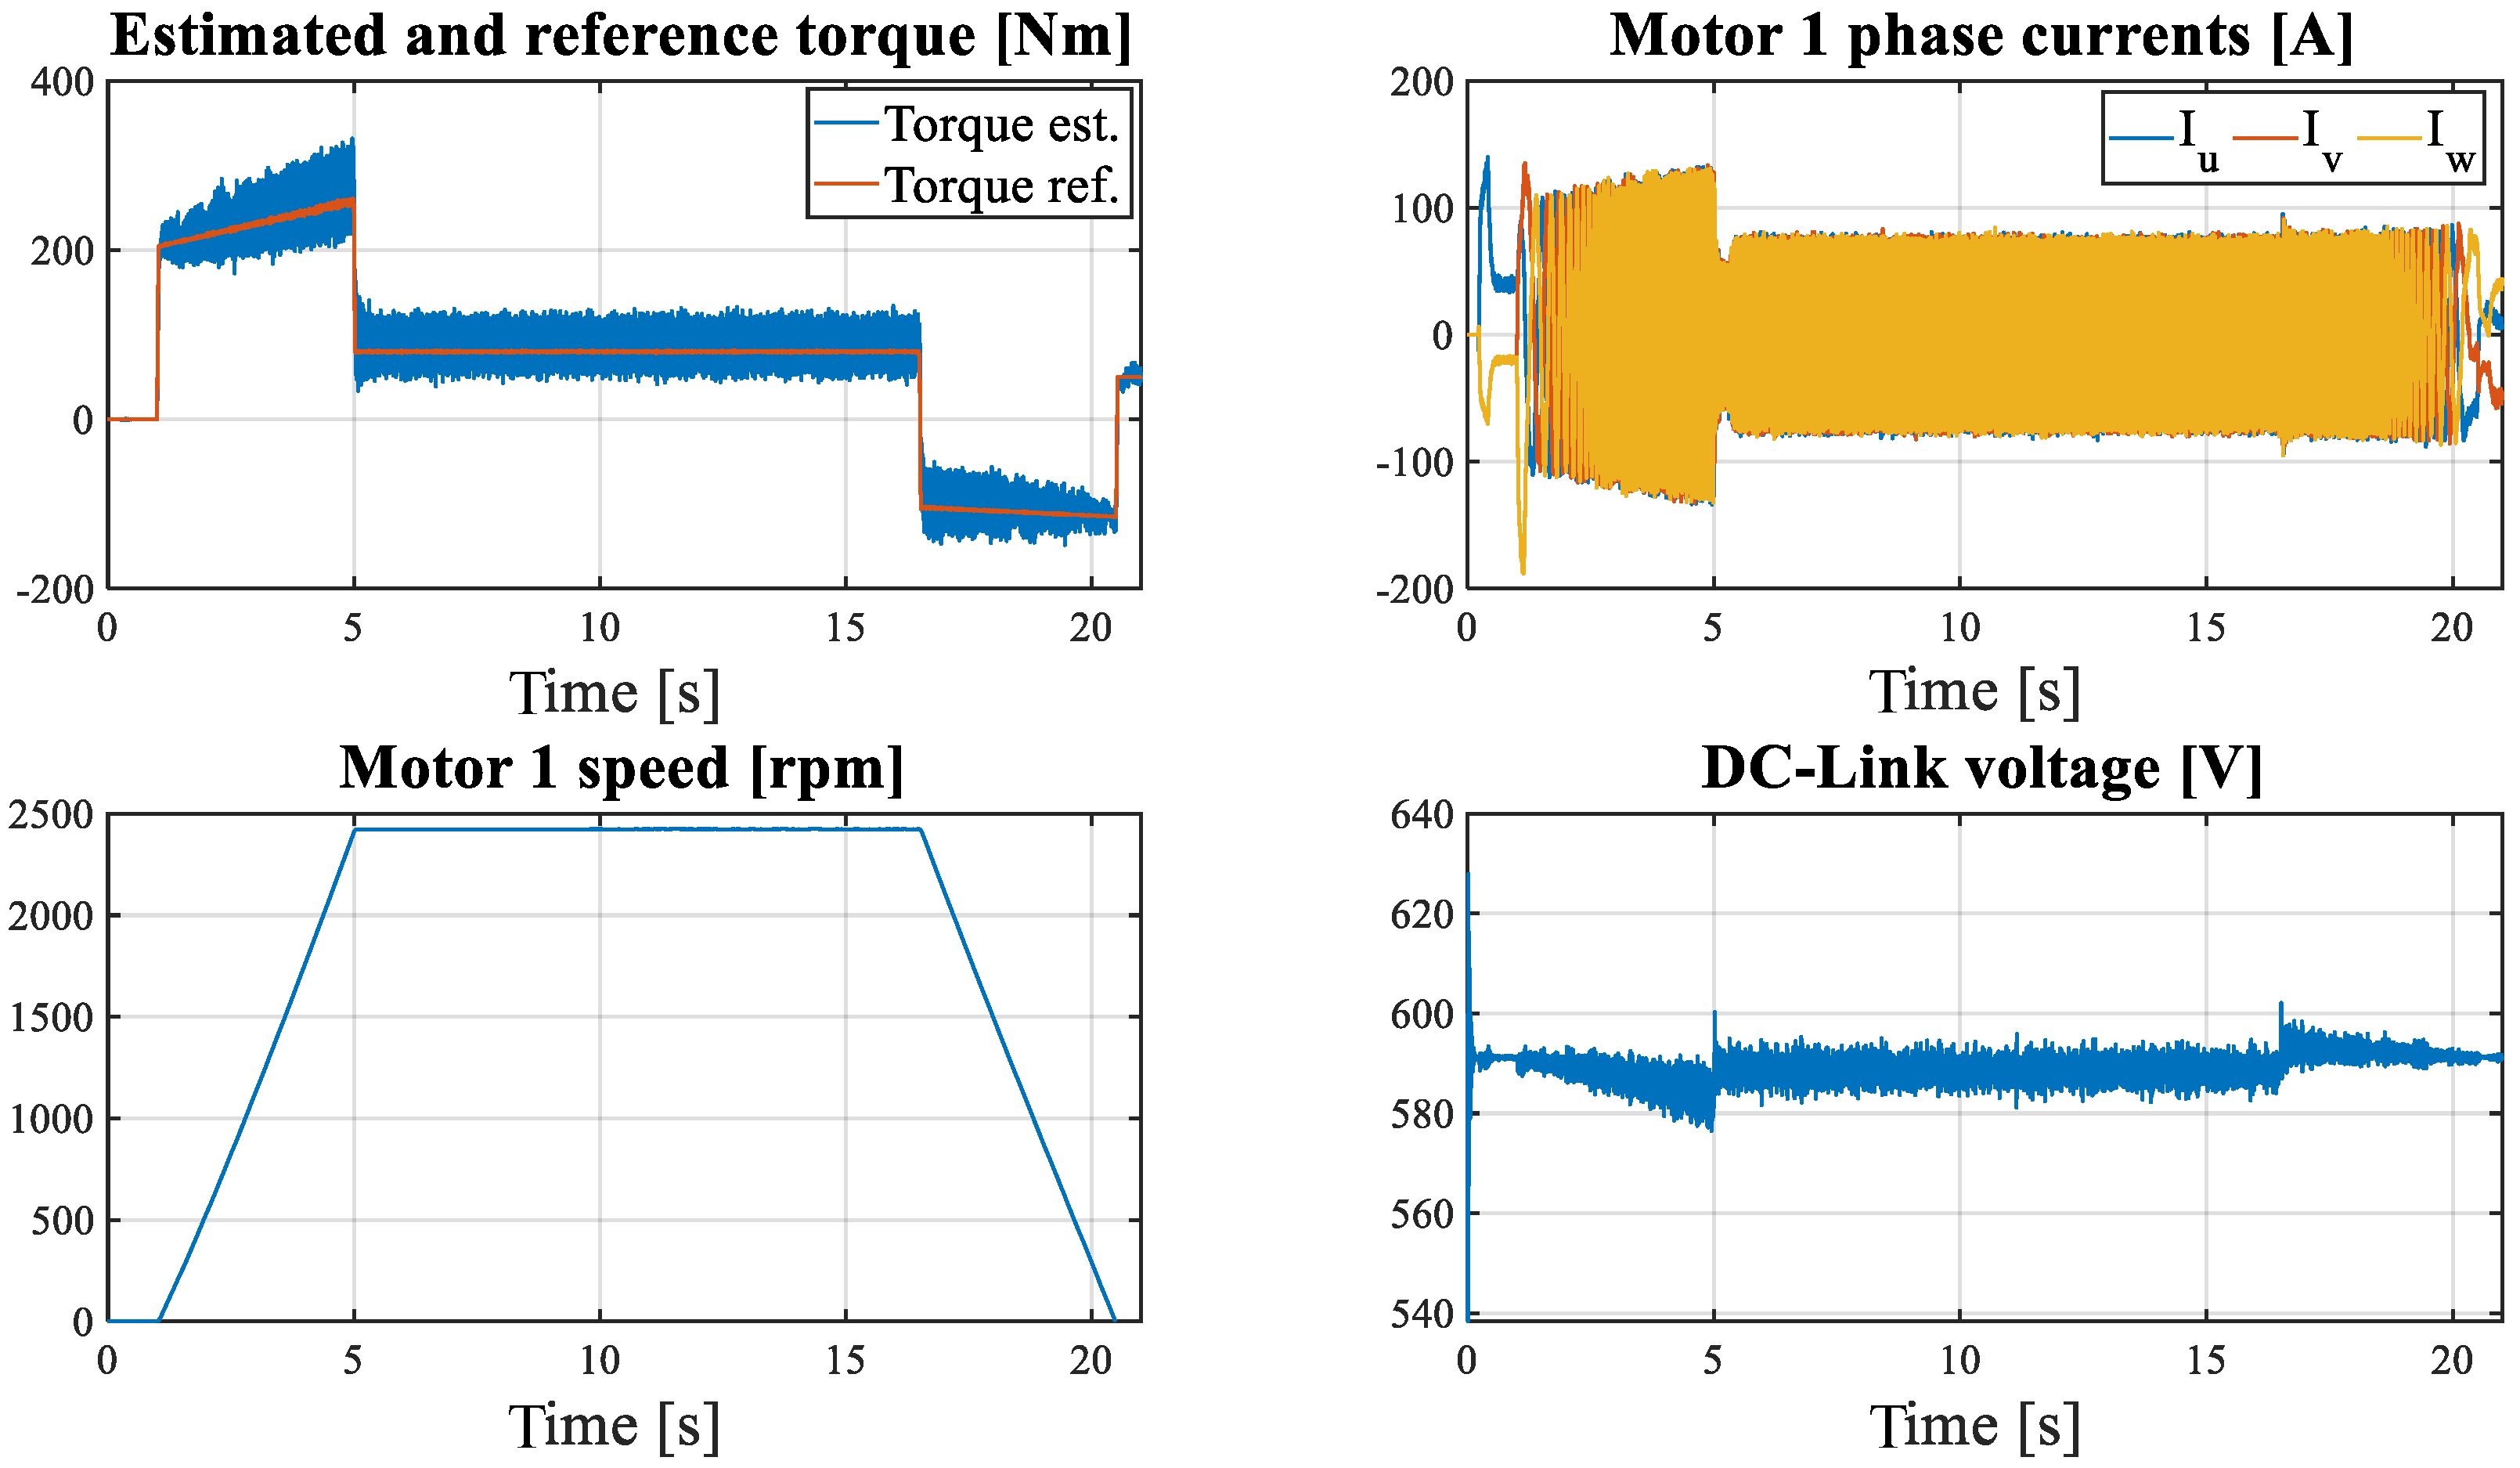
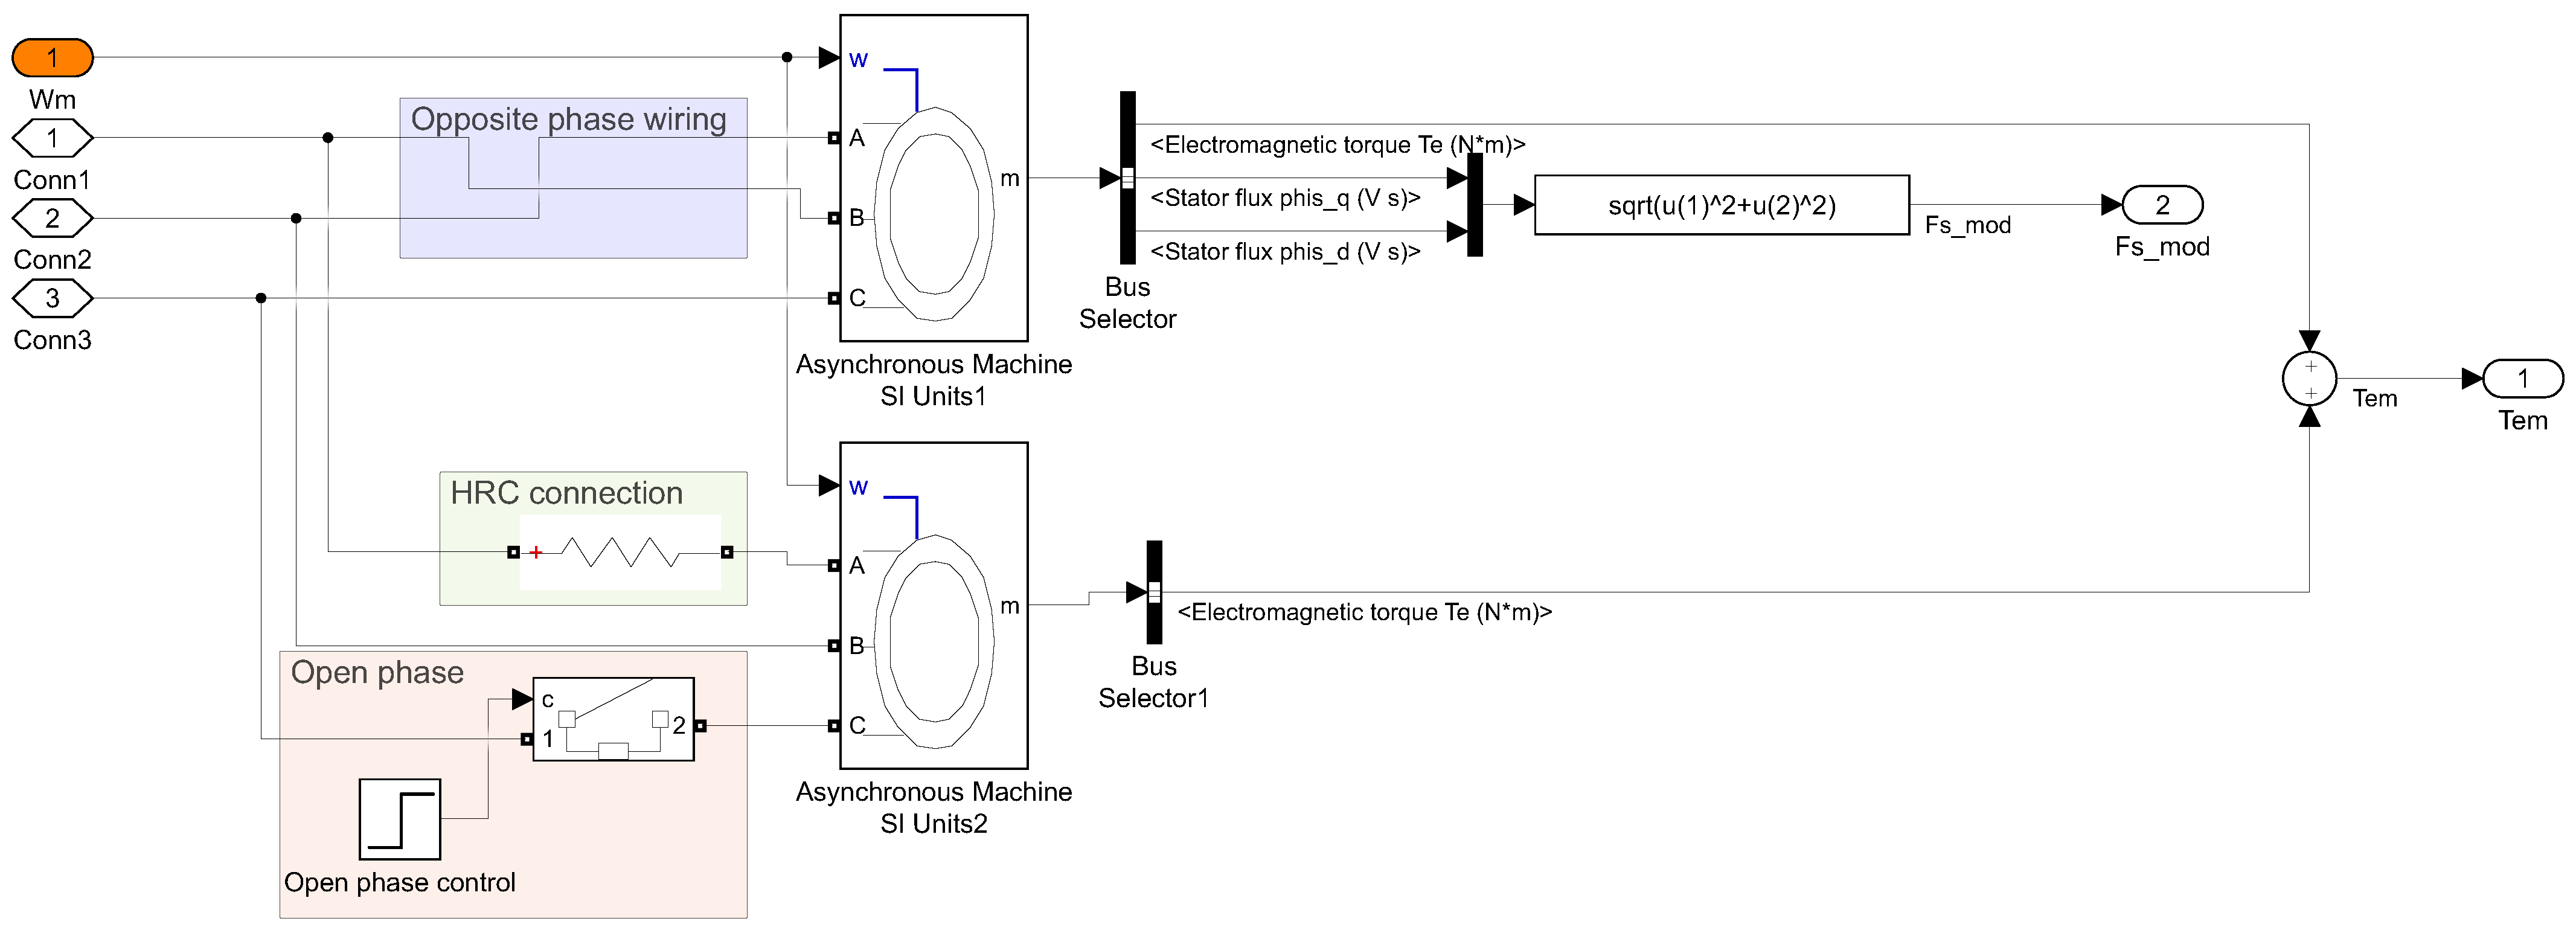
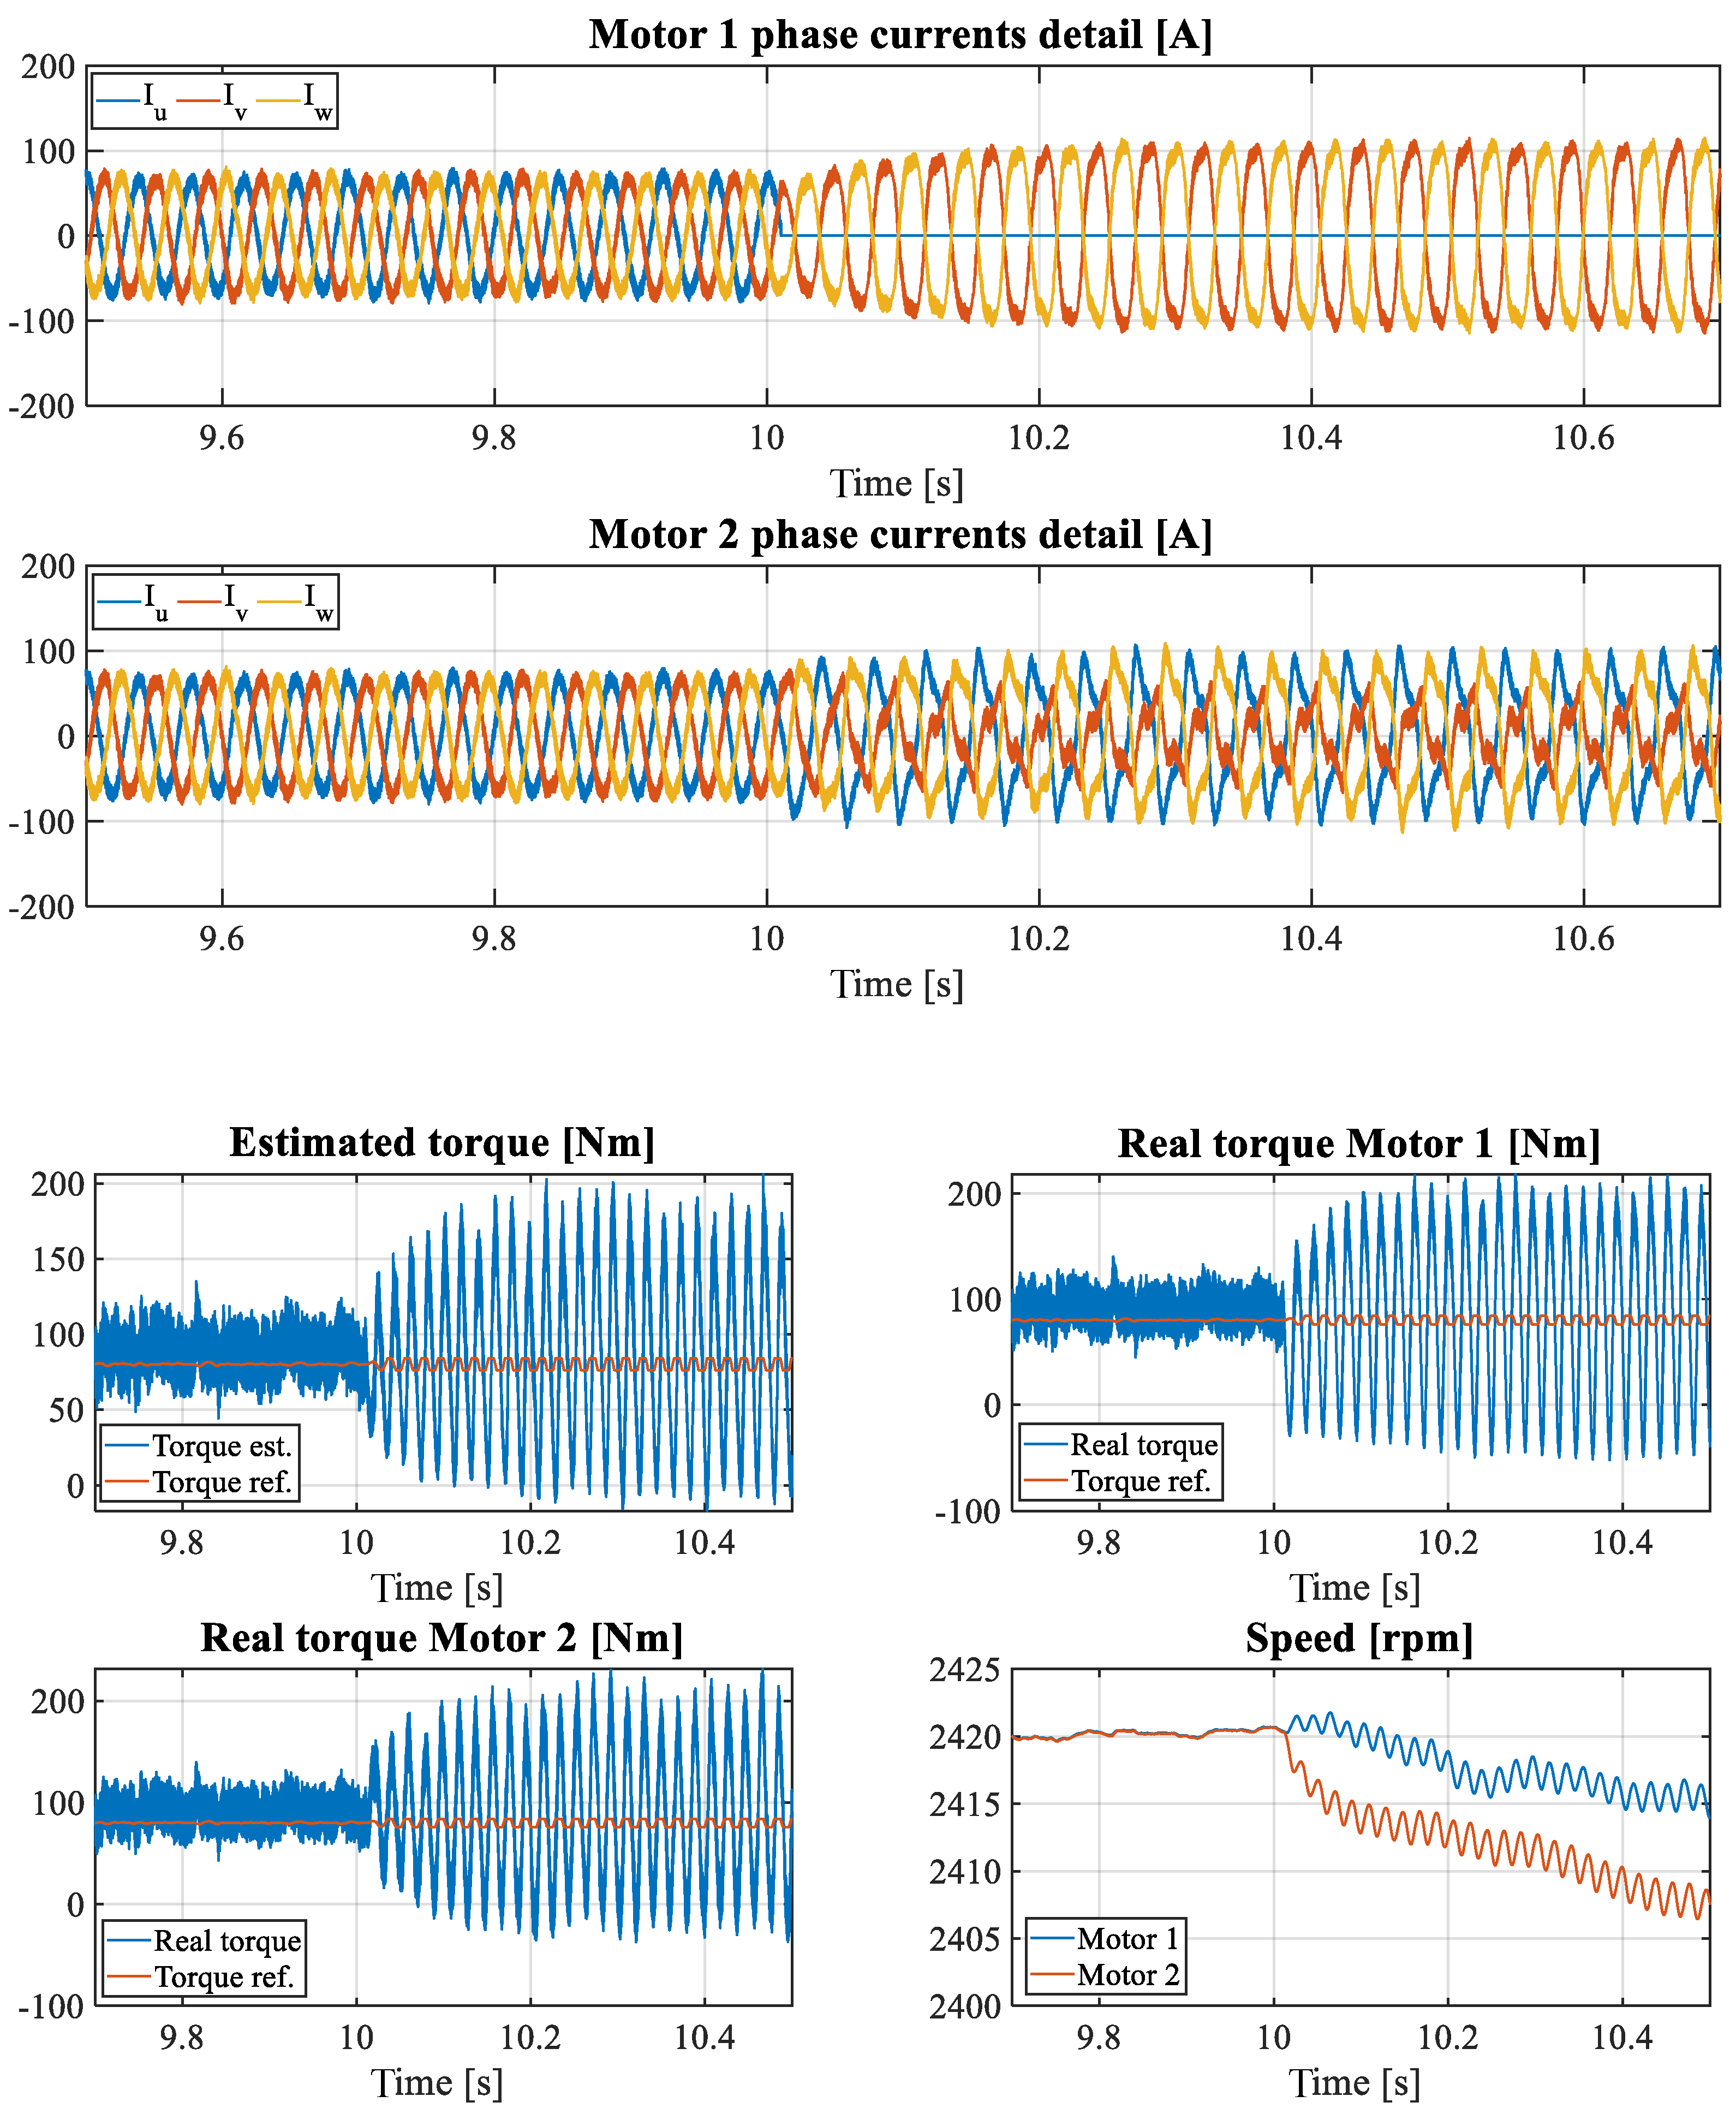
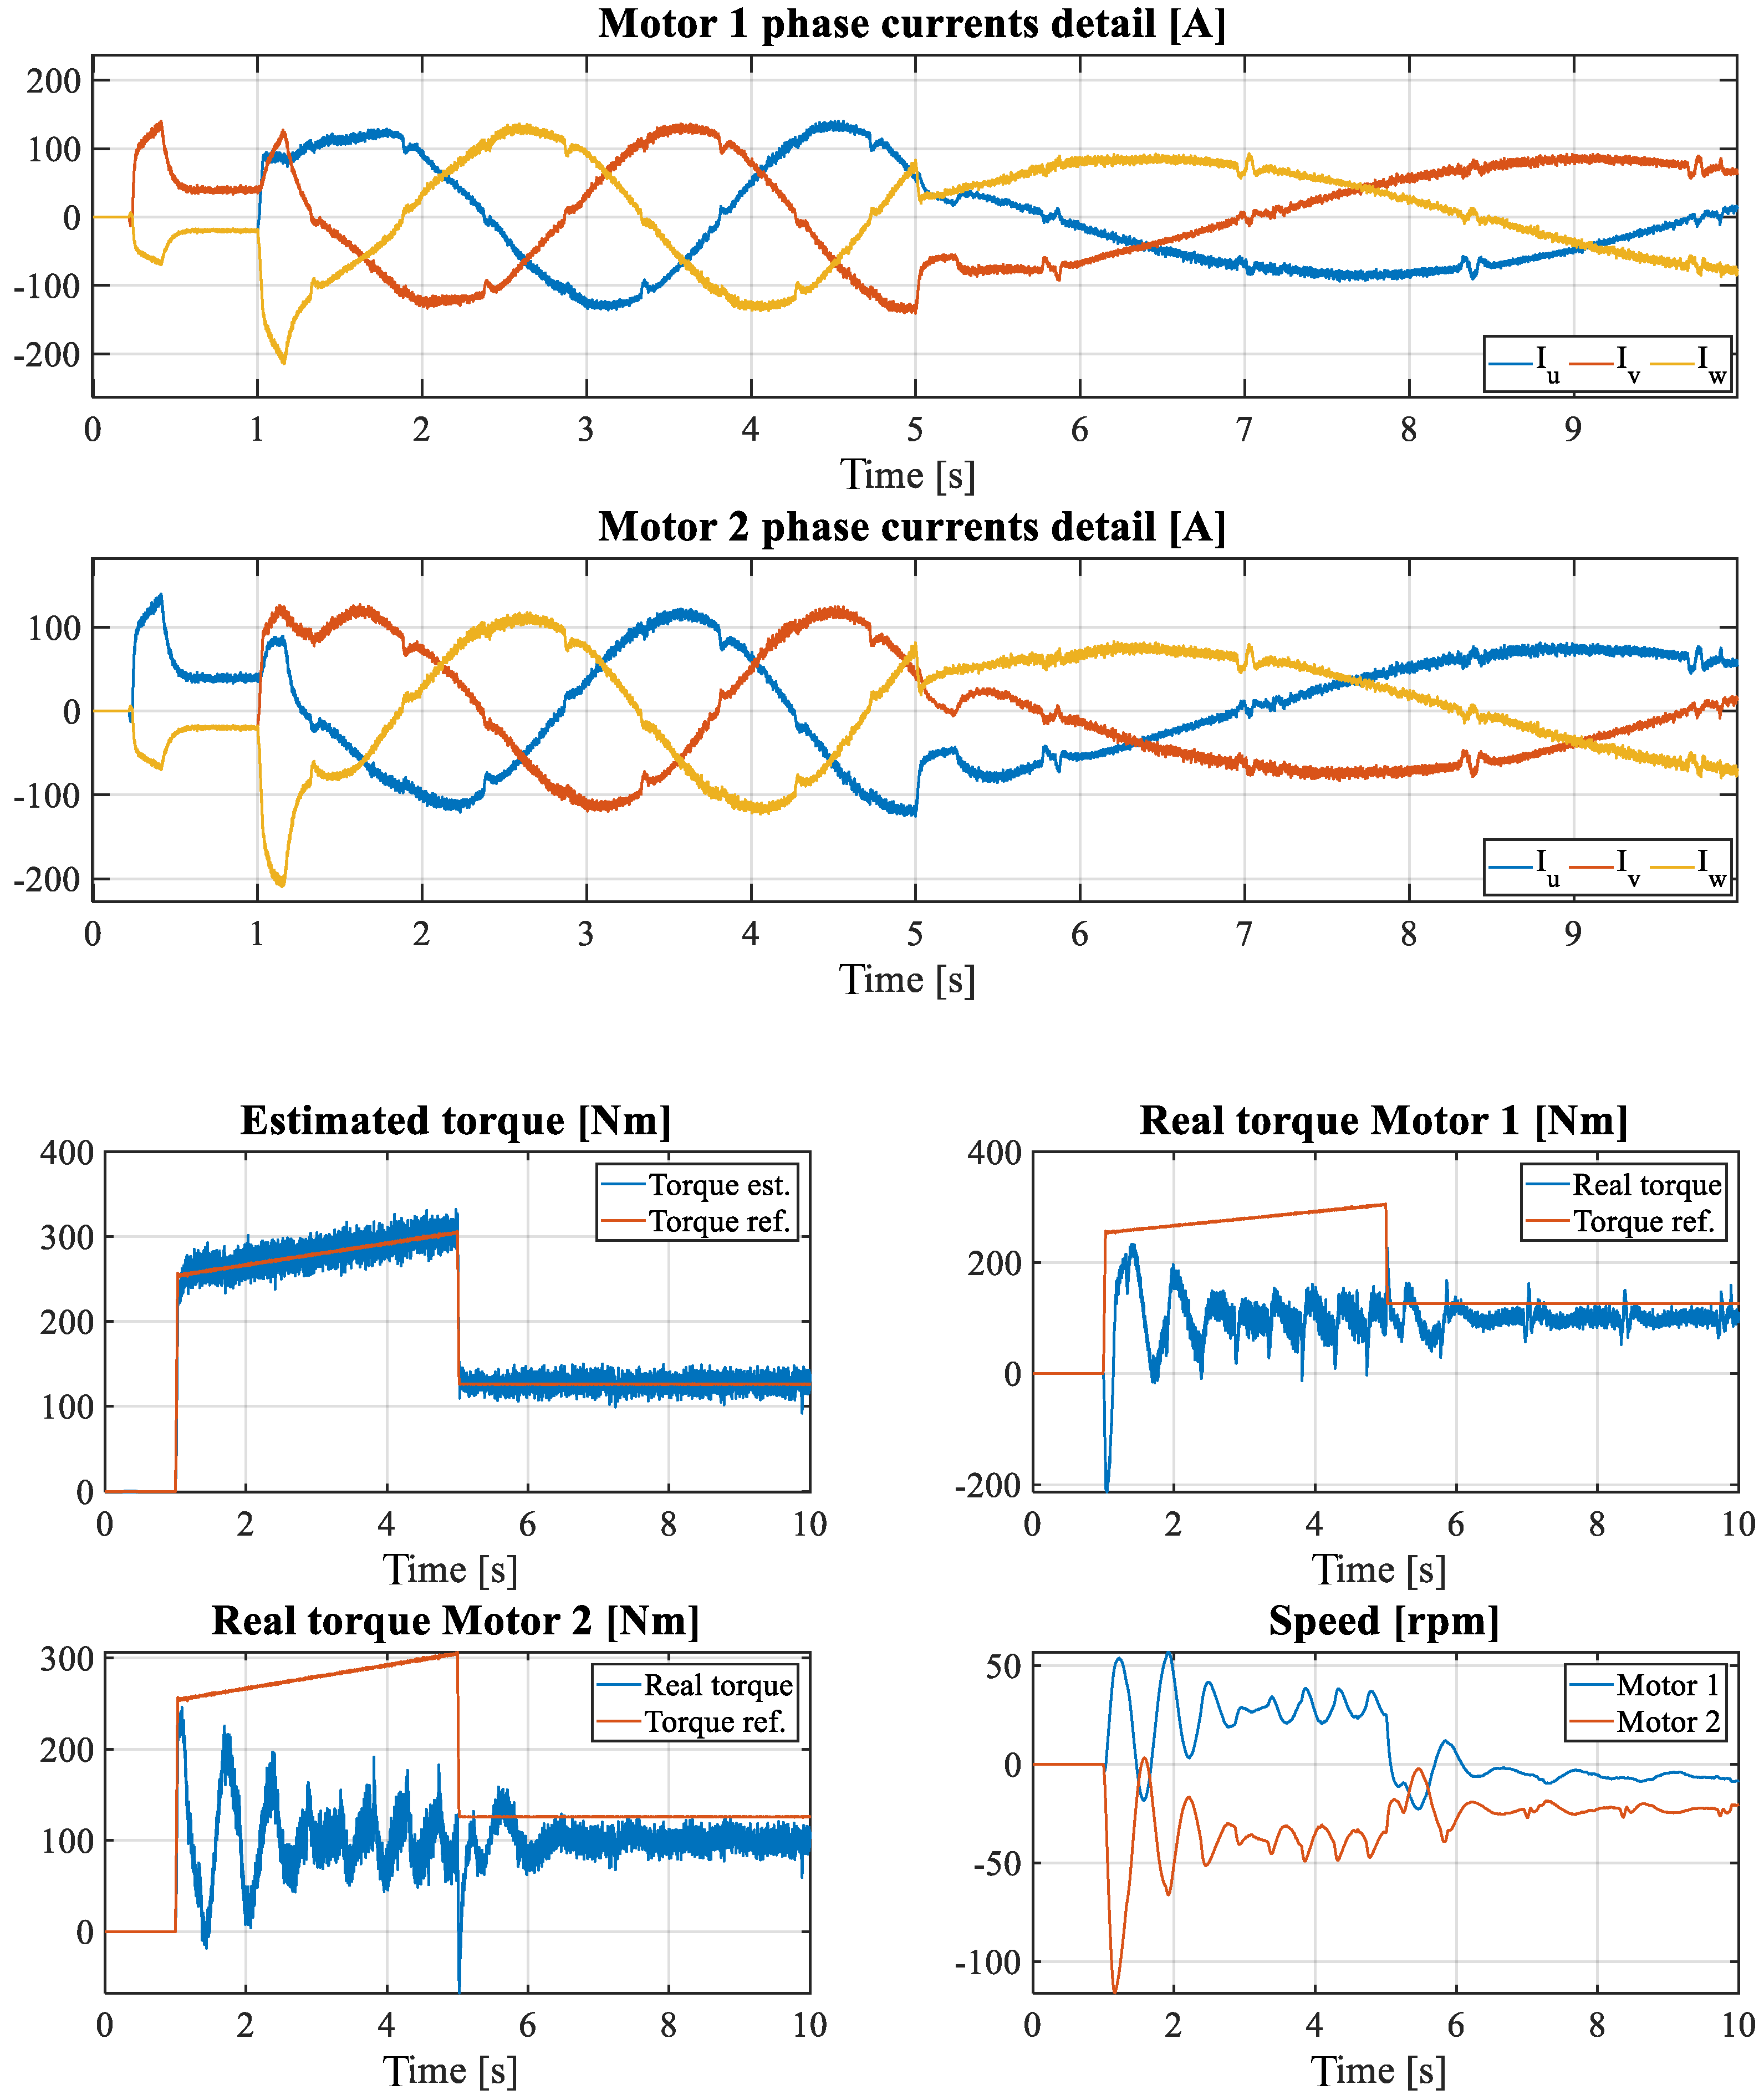
2. SiL Simulation-Based Data Generation

As it has been mentioned before, one of the challenges in developing data-driven strategies for FDD is data availability. Electric machines are designed not to fail, so it is difficult to find a sufficient volume of information to allow reliable training, validation and testing of ML algorithms. Hence, data from healthy machine operation is available in abundance, while data from representative faulty operating conditions is limited. That is why, in many applications it is very common to deal with unbalanced datasets [54]. Furthermore, still nowadays, little field datasets from real industrial applications are available. Normally, implementing an effective data acquisition approach can be interpreted as expensive, as well as time-consuming. As a result, this data scarcity and imbalance has become an important drawback when trying to design data-driven condition monitoring strategies, specially those based on Machine Learning and Deep Learning.
In order to overcome these limitations, one of the used techniques is to generate the training dataset via simulations. In a digital environment, simulation-driven synthetic data generation is used to emulate conditions that are not easily available in existing field data, such as different working conditions, specific failure modes, etc. Therefore, in the present work, a SIL simulation platform developed in Matlab/Simulink platform, has been used to obtain synthetic data on the effects of deficient connections in induction motors. Specifically, it emulates the operation of a 160 kW electric traction drive from a railway traction application with two induction motors connected in parallel. It is worth mentioning that this platform has been validated by our industrial partner, using it in the development of railway traction systems. Furthermore, the results of the platform in healthy cases were previously compared with laboratory results. At the same time, both its nominal behaviour and the fault insertion block have been discussed in other publications of our research group [55,56,57].
The Matlab/Simulink platform consists of several blocks that simulate the operation of an electric drive (see Figure 2). The plant of this electric drive is composed of an input stage (contactors, filter and braking crowbar), a three-phase inverter and two induction motors fed in parallel. Moreover, the mechanical system is simplified to an inertia and a static load. It is worth mentioning that power electronics and traction motors can be simulated either using basic blocks from Simulink or Simscape blocks, depending on the required accuracy and simulation speed.
The control functionalities are integrated following the Software-in-the-Loop strategy. Here, the control software used in the real device is embedded into the simulation so that its operation is as close as possible to the real application. Concretely, the TCU is built with three different control levels. In control level 3, the references for the control strategy of level 2 are calculated. Typically, level 2 implements some variant of vector control, so torque and flux references are obtained first in level 3. In this level, other control functionalities, such as bus voltage control or torque reference limitations, can be activated. Once level 2 obtains the voltage references for the inverter, in level 1, modulation strategies calculate the switching states for the inverter and the crowbar. It is worth mentioning that the vector control of the IM is an average control, because two motors are fed in parallel with only one inverter and one current sensor per inverter phase. Therefore, the measured current is the total current flowing from the inverter.
This platform allows the control strategy to be validated in different scenarios. As a result, and with the aim of analysing the effects of power connection faults, first a set of baseline healthy simulations has been defined. Torque is controlled following a predefined profile in order to obtain the desired acceleration and deceleration rates, as well as target speed. In this case, 3 target speed profiles have been simulated in the conditions shown in Table 1.
Figure 3 shows the torque, phase currents, speed and DC-link voltage for a 2400 rpm target speed and 50 Nm load torque simulation environment. Furthermore, Figure 4 shows the detail of the phase currents.
Using the baseline simulations shown previously, power connection failures have been injected in the plant model. In particular, HRC faults, open-phase faults and opposite-phase wiring connection faults were simulated. Thanks to the use of Simulink’s Simscape toolbox, these faults can be easily injected in the simulation. As it is shown in Figure 5, the HRC was emulated connecting a series resistor in a phase of the motor, while the other two faults were provoked by changing directly the motor connections.
Using this modified model and the operation conditions described in Table 1, faulty operation scenarios were simulated. In total, 72 simulations were launched for the generation of faulty data (6 scenarios, with 3 fault modes injected at 4 different instants). In this way, a database of 355 million samples at 50 μ s was created.
In the following lines, some of the simulation results are presented. Figure 6 shows the different signals obtained from the simulation while causing an open-phase fault in the induction motor number 1. Looking at the IM-1 phase currents, phase A is disconnected and, as a consequence, the rest of the phase currents increase. As it was mentioned before, the vector control of the motors is an average control as two motors are fed in parallel with only one inverter. Hence, any failure in one of the motors causes the abnormal operation of the other one. At the same time, current imbalance causes torque oscillations due to the current measurement feedback and the vector control structure. It is important to remark that the high value of the load inertia filters torque oscillations mitigating them in the speed (bottom right graph). Therefore, as the simulation does not implement any speed control loop, when the fault occurs, the average value of the real torque and the speed decrease. In the real application, this speed loss would be compensated by the user increasing the torque command.
In the case of HRC, it can be said that it is a less severe version of the open-phase failure. Current imbalance is translated to the torque as low frequency oscillations, as it is presented in Figure 7.
Finally, in the opposite-phase wiring mode (see Figure 8), since there is a closed torque control loop, it sets the current necessary for the estimated torque to follow the reference. However, as one of the motors is wired incorrectly, the actual torques of the motors do not follow the reference and the target speed is not achieved.
In the following sections, the development of the data-driven FDD strategy for the detection and classification of these fault modes will be presented. However, as it was shown previously, the HRC and the open-phase faults have similar effects in terms of torque oscillations, speed deviations and current in the healthy motor, therefore, they will be grouped in the same cluster, labelled as current imbalance. Therefore, the main task of the FDD strategy is to distinguish current imbalance and opposite-phase wiring anomalies from the healthy behaviour.

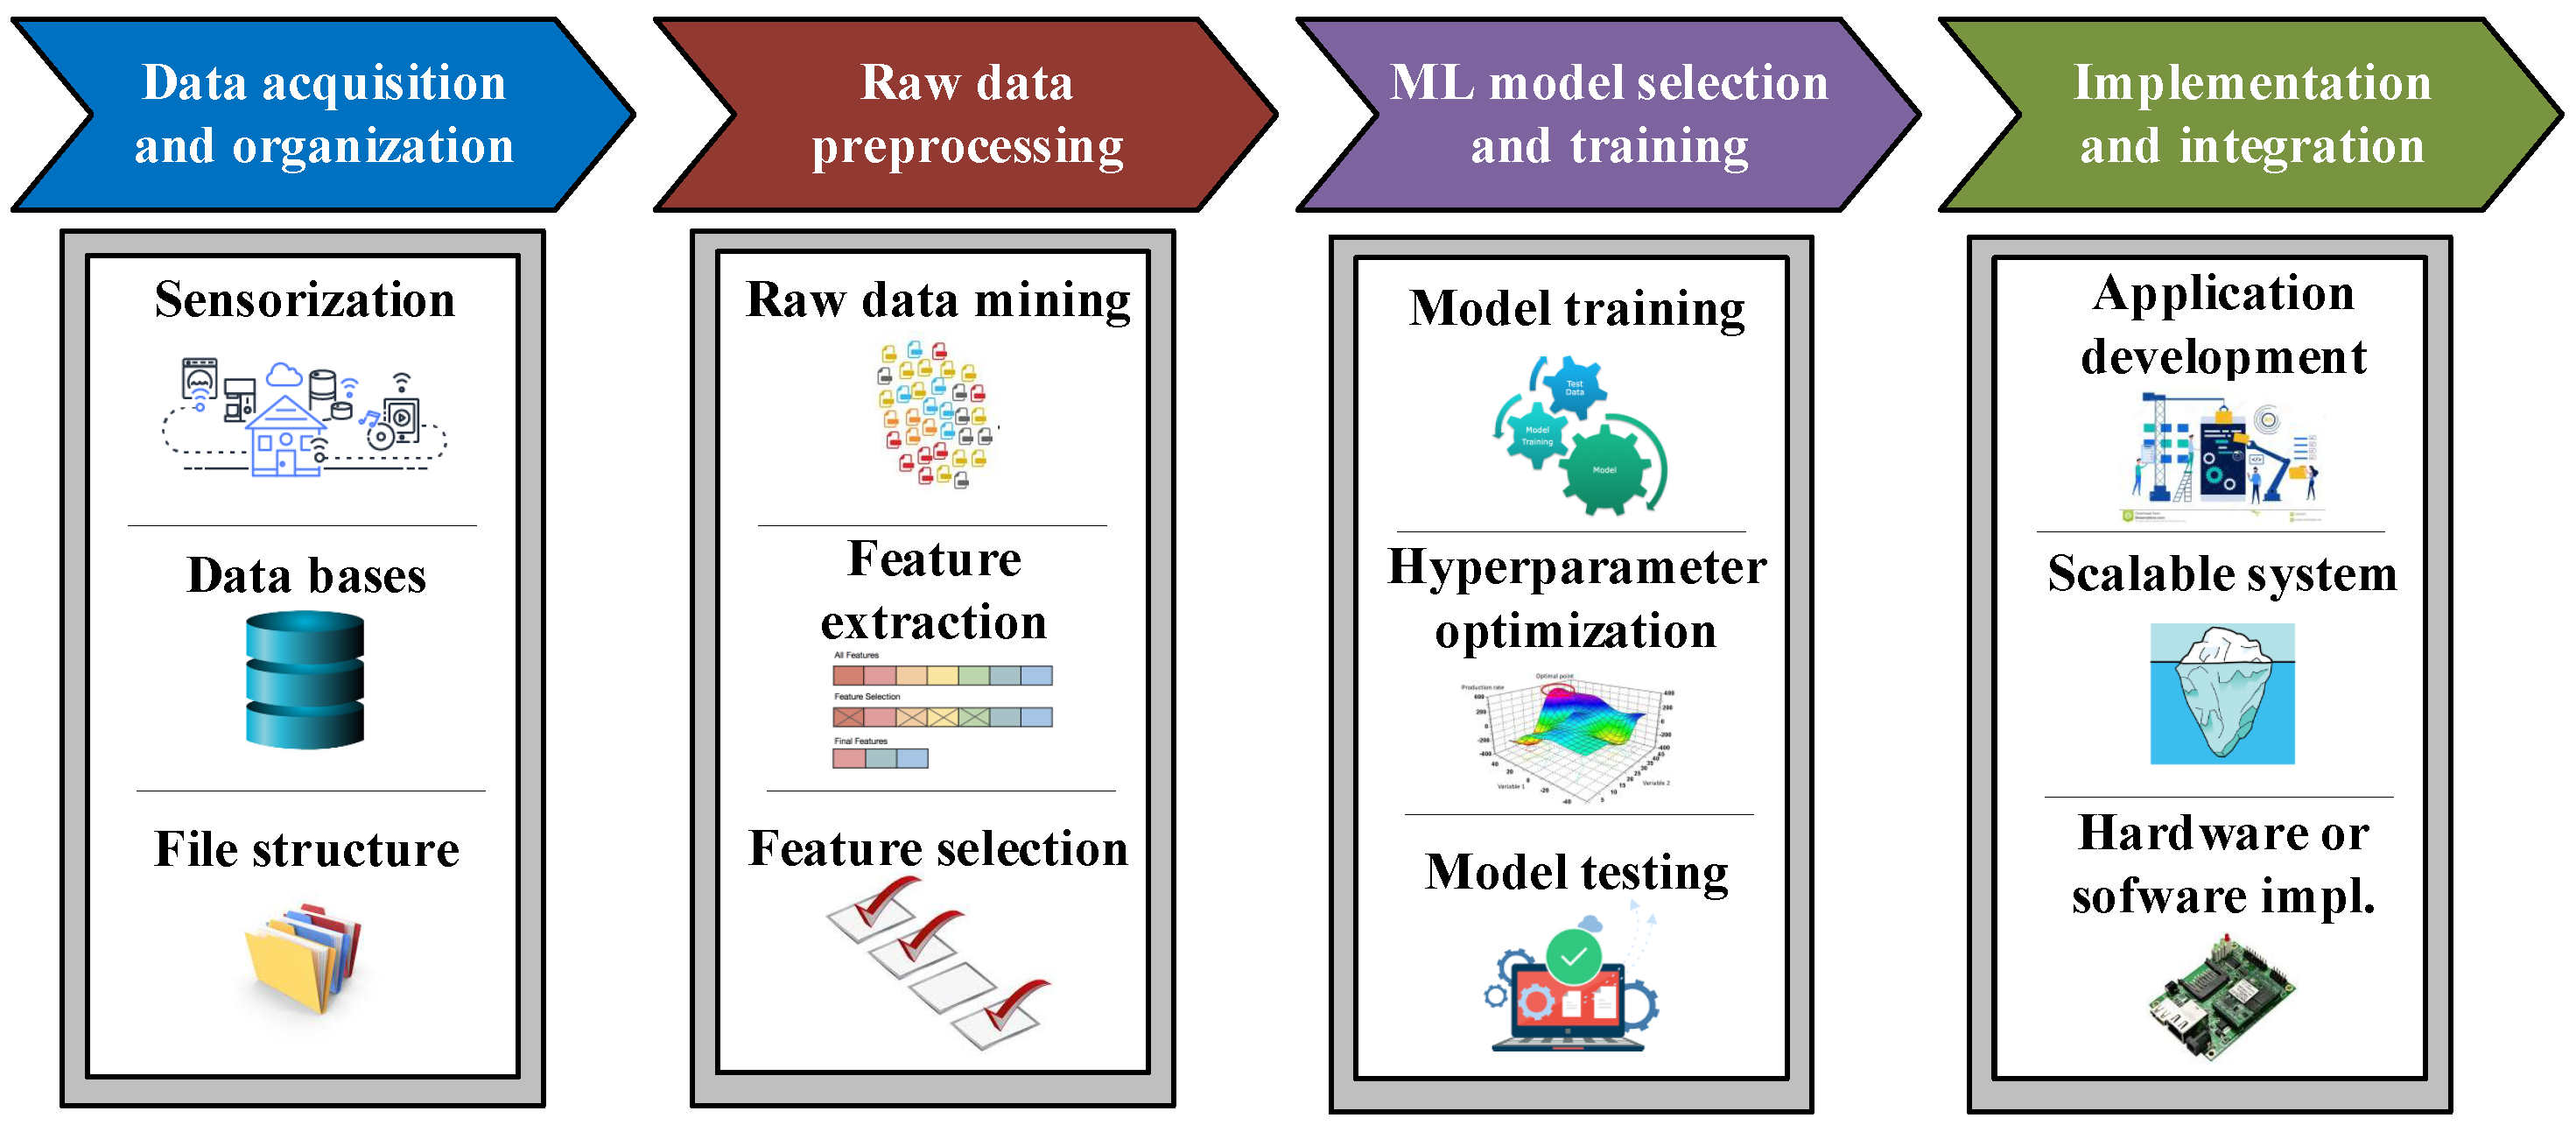
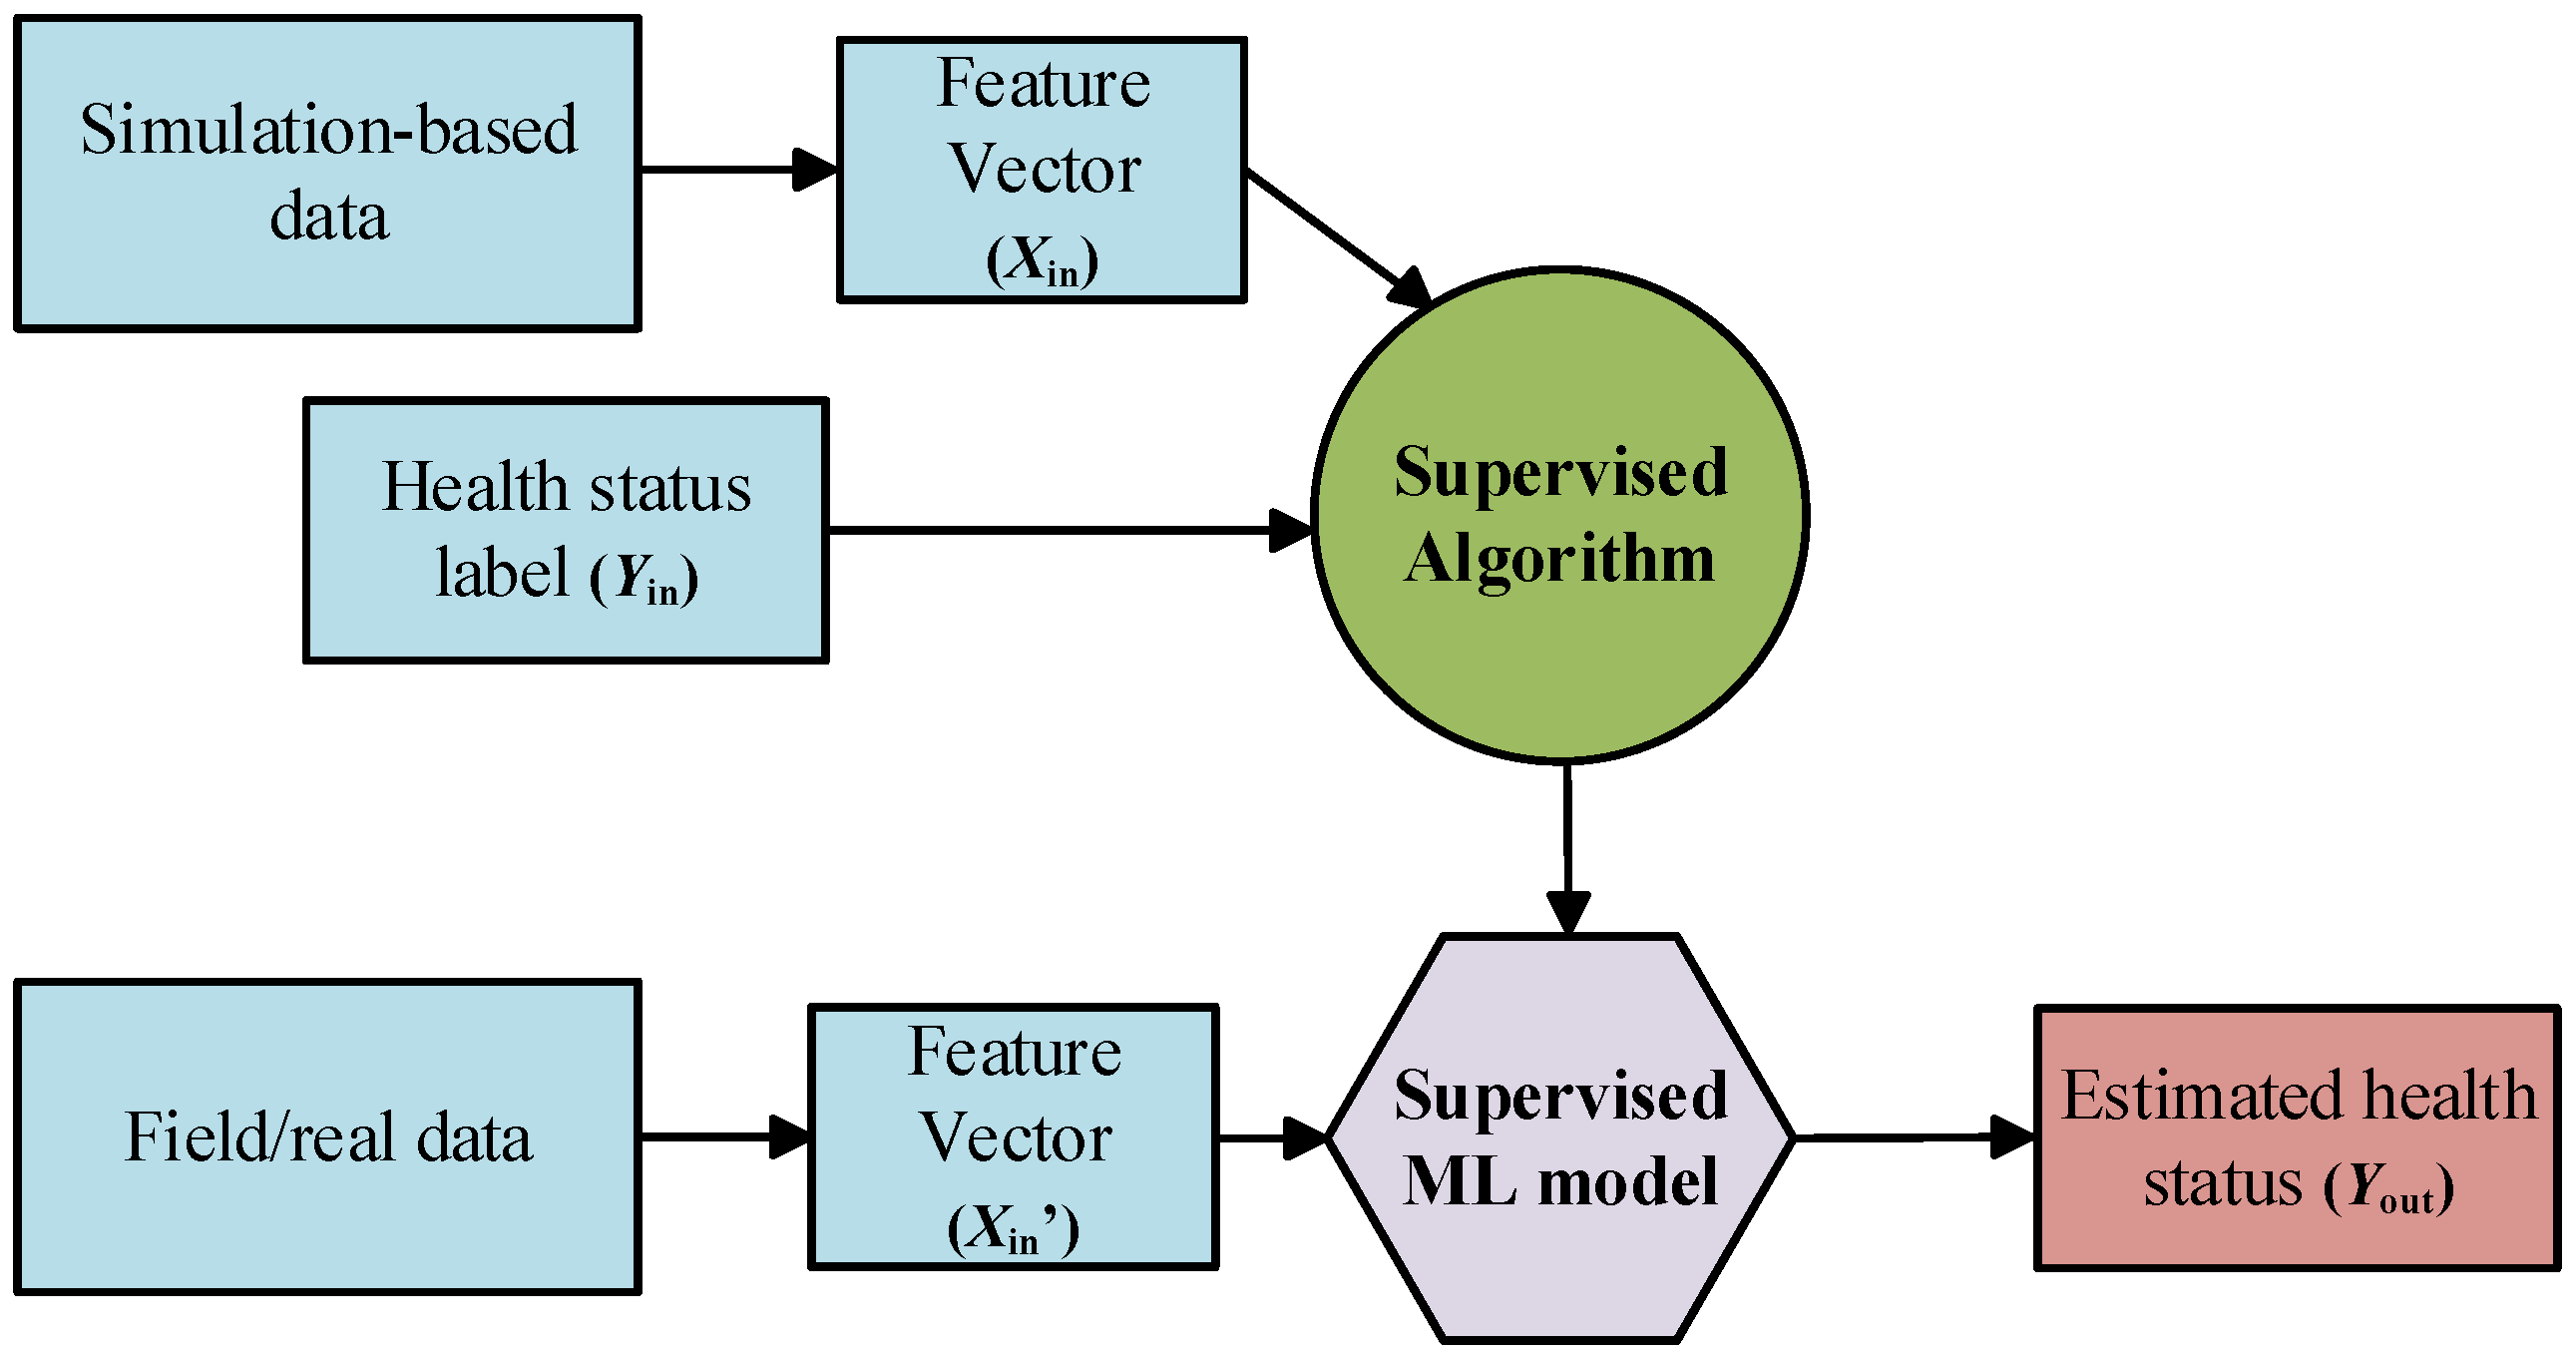
3. ML-Based Fault Diagnosis Strategy

Once the synthetic data have been generated, it is time to develop the machine learning-based fault diagnosis strategy for induction machines power connection failures. As mentioned in Section 1, these approaches developed via data-driven strategies seek to generate computer systems capable of performing tasks that normally require human intelligence, through artificial intelligence. In this research, the analysis of the health status of induction machine power connexions is proposed by differentiating the aforementioned failure modes from the healthy behaviour. For this, the synthetic data acquired from the simulation platform were used to train and validate ML classification algorithms, in order to categorise the different health status in groups.
In this way, it is important to mention that in order to implement these data-driven solutions efficiently, a specific and standardized ML workflow is generally put into practice. As it can be seen in Figure 9, it is not only based on selecting and optimizing the ML algorithm, but it also consists of carrying out different tasks, such as the acquisition and organization of raw data, the raw data preprocessing and the implementation and integration of the algorithm in the application [58,59,60].
Thus, in this section, the main steps of this workflow have been developed and optimized taking into account the application requirements. The solution should be able to distinguish the healthy behaviour from the opposite-phase wiring faults and the current imbalance faults. Furthermore, false positives should be avoided. It has to be taken into account that a false positive could cause an unnecessary maintenance shutdown of the equipment, which in applications such as railway could cause important availability and economic losses.
In addition, it is important to mention that one of the main advantages of simulations is their flexibility to create faulty environments, since different failure modes can be injected. Therefore, the supervised ML method becomes an effective alternative to face this classification problem. In these cases, the task of labelling data samples becomes much easier, owing to the fact that the exact failure injection time and even its characteristics are known. In a real application environment, the labelling task is much more time-consuming, as it demands considerable expert knowledge. Figure 10 shows schematically the Supervised ML approach.
In supervised ML methods, a certain label ( Y i n ) is attached to each training dataset sample ( X i n ) with information about their momentary state of health. Therefore, it is easier to interpret the output predictions ( Y o u t ) of the ML model from the new unseen dataset ( X i n ). Specifically, in this article, a three-class classification ML algorithm was trained. Although in Section 1 more than three health statuses are explained, in a first approximation the open-phase fault and the HRC fault are unified due to their similar effects in phase current imbalance. Therefore, these are the different health status labels that the supervised ML algorithm should differentiate: healthy (H), current imbalance (CI) and opposite-phase wiring fault (OPW).
Moreover, before starting with each of the stages from the ML workflow, it is worth mentioning that Amazon Web Services (AWS) is the cloud service platform where the fault diagnosis approach was developed. Apart from the development of the FDD strategy, a secondary objective of the work has been to use commercial cloud-based tools. The use of these tools has several advantages: the management of big datasets is easier (than with software such as Matlab) and the proposed solution will be closer to a future industrial implementation. Figure 11 shows the architecture of the platform for development of the data-driven FDD strategy.

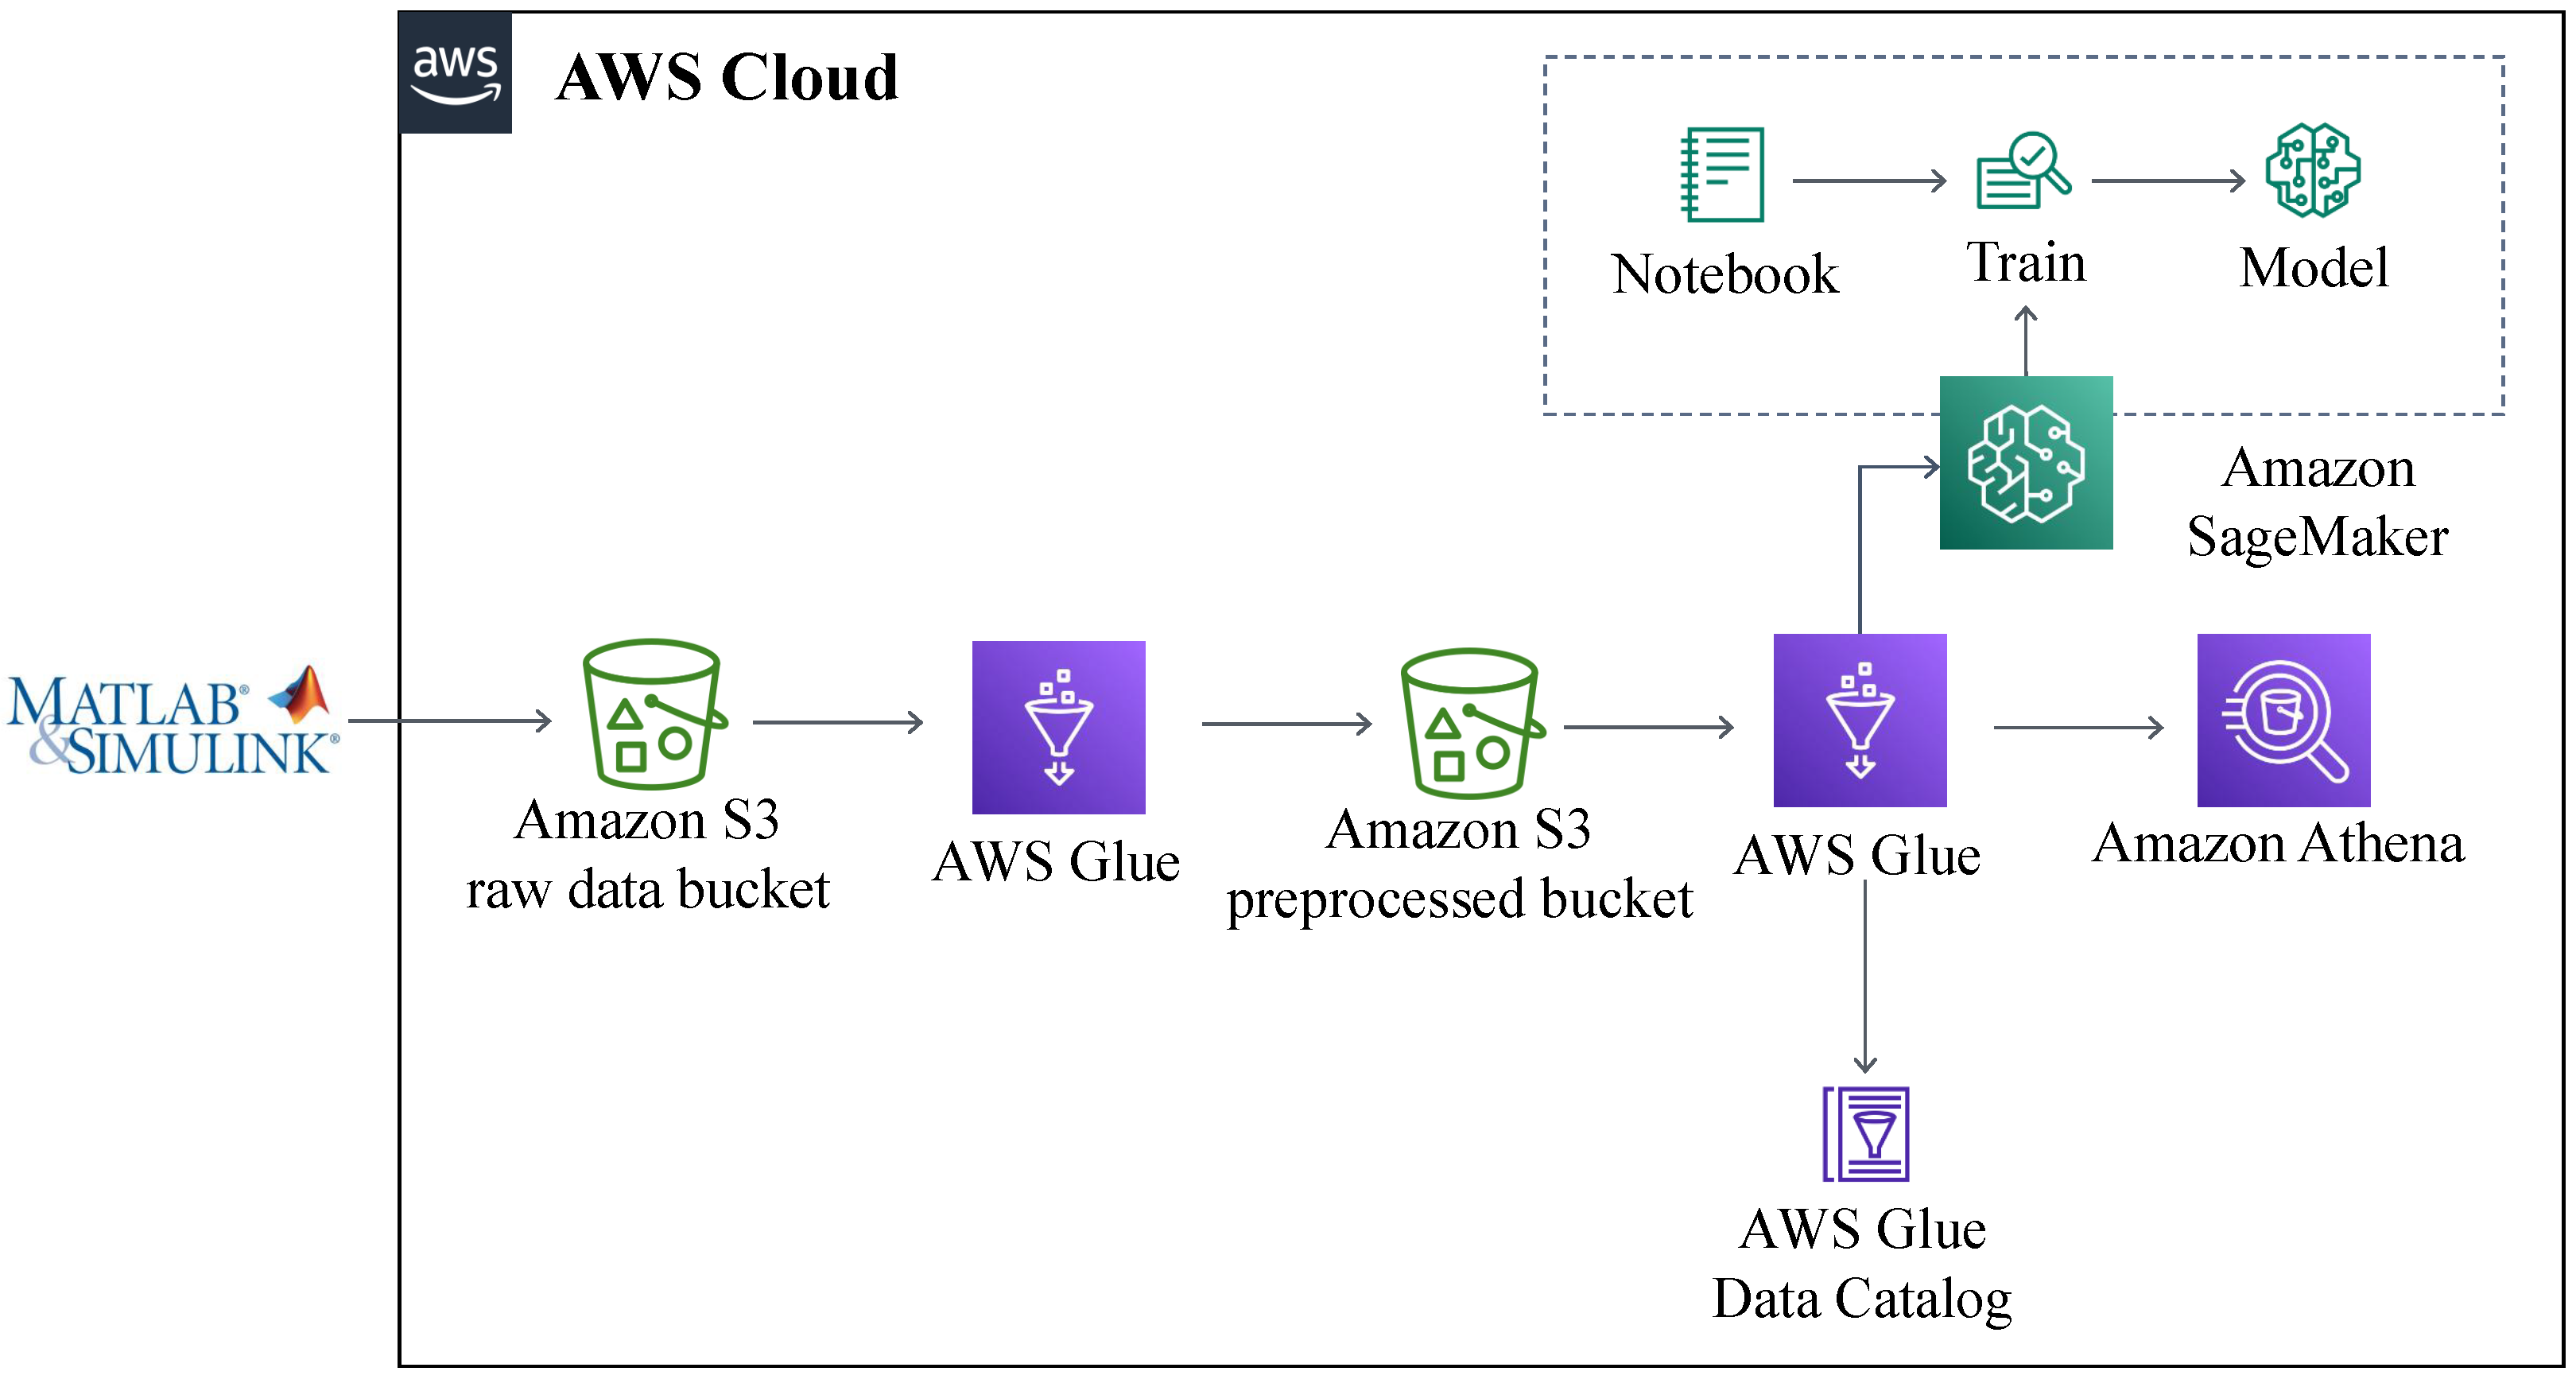
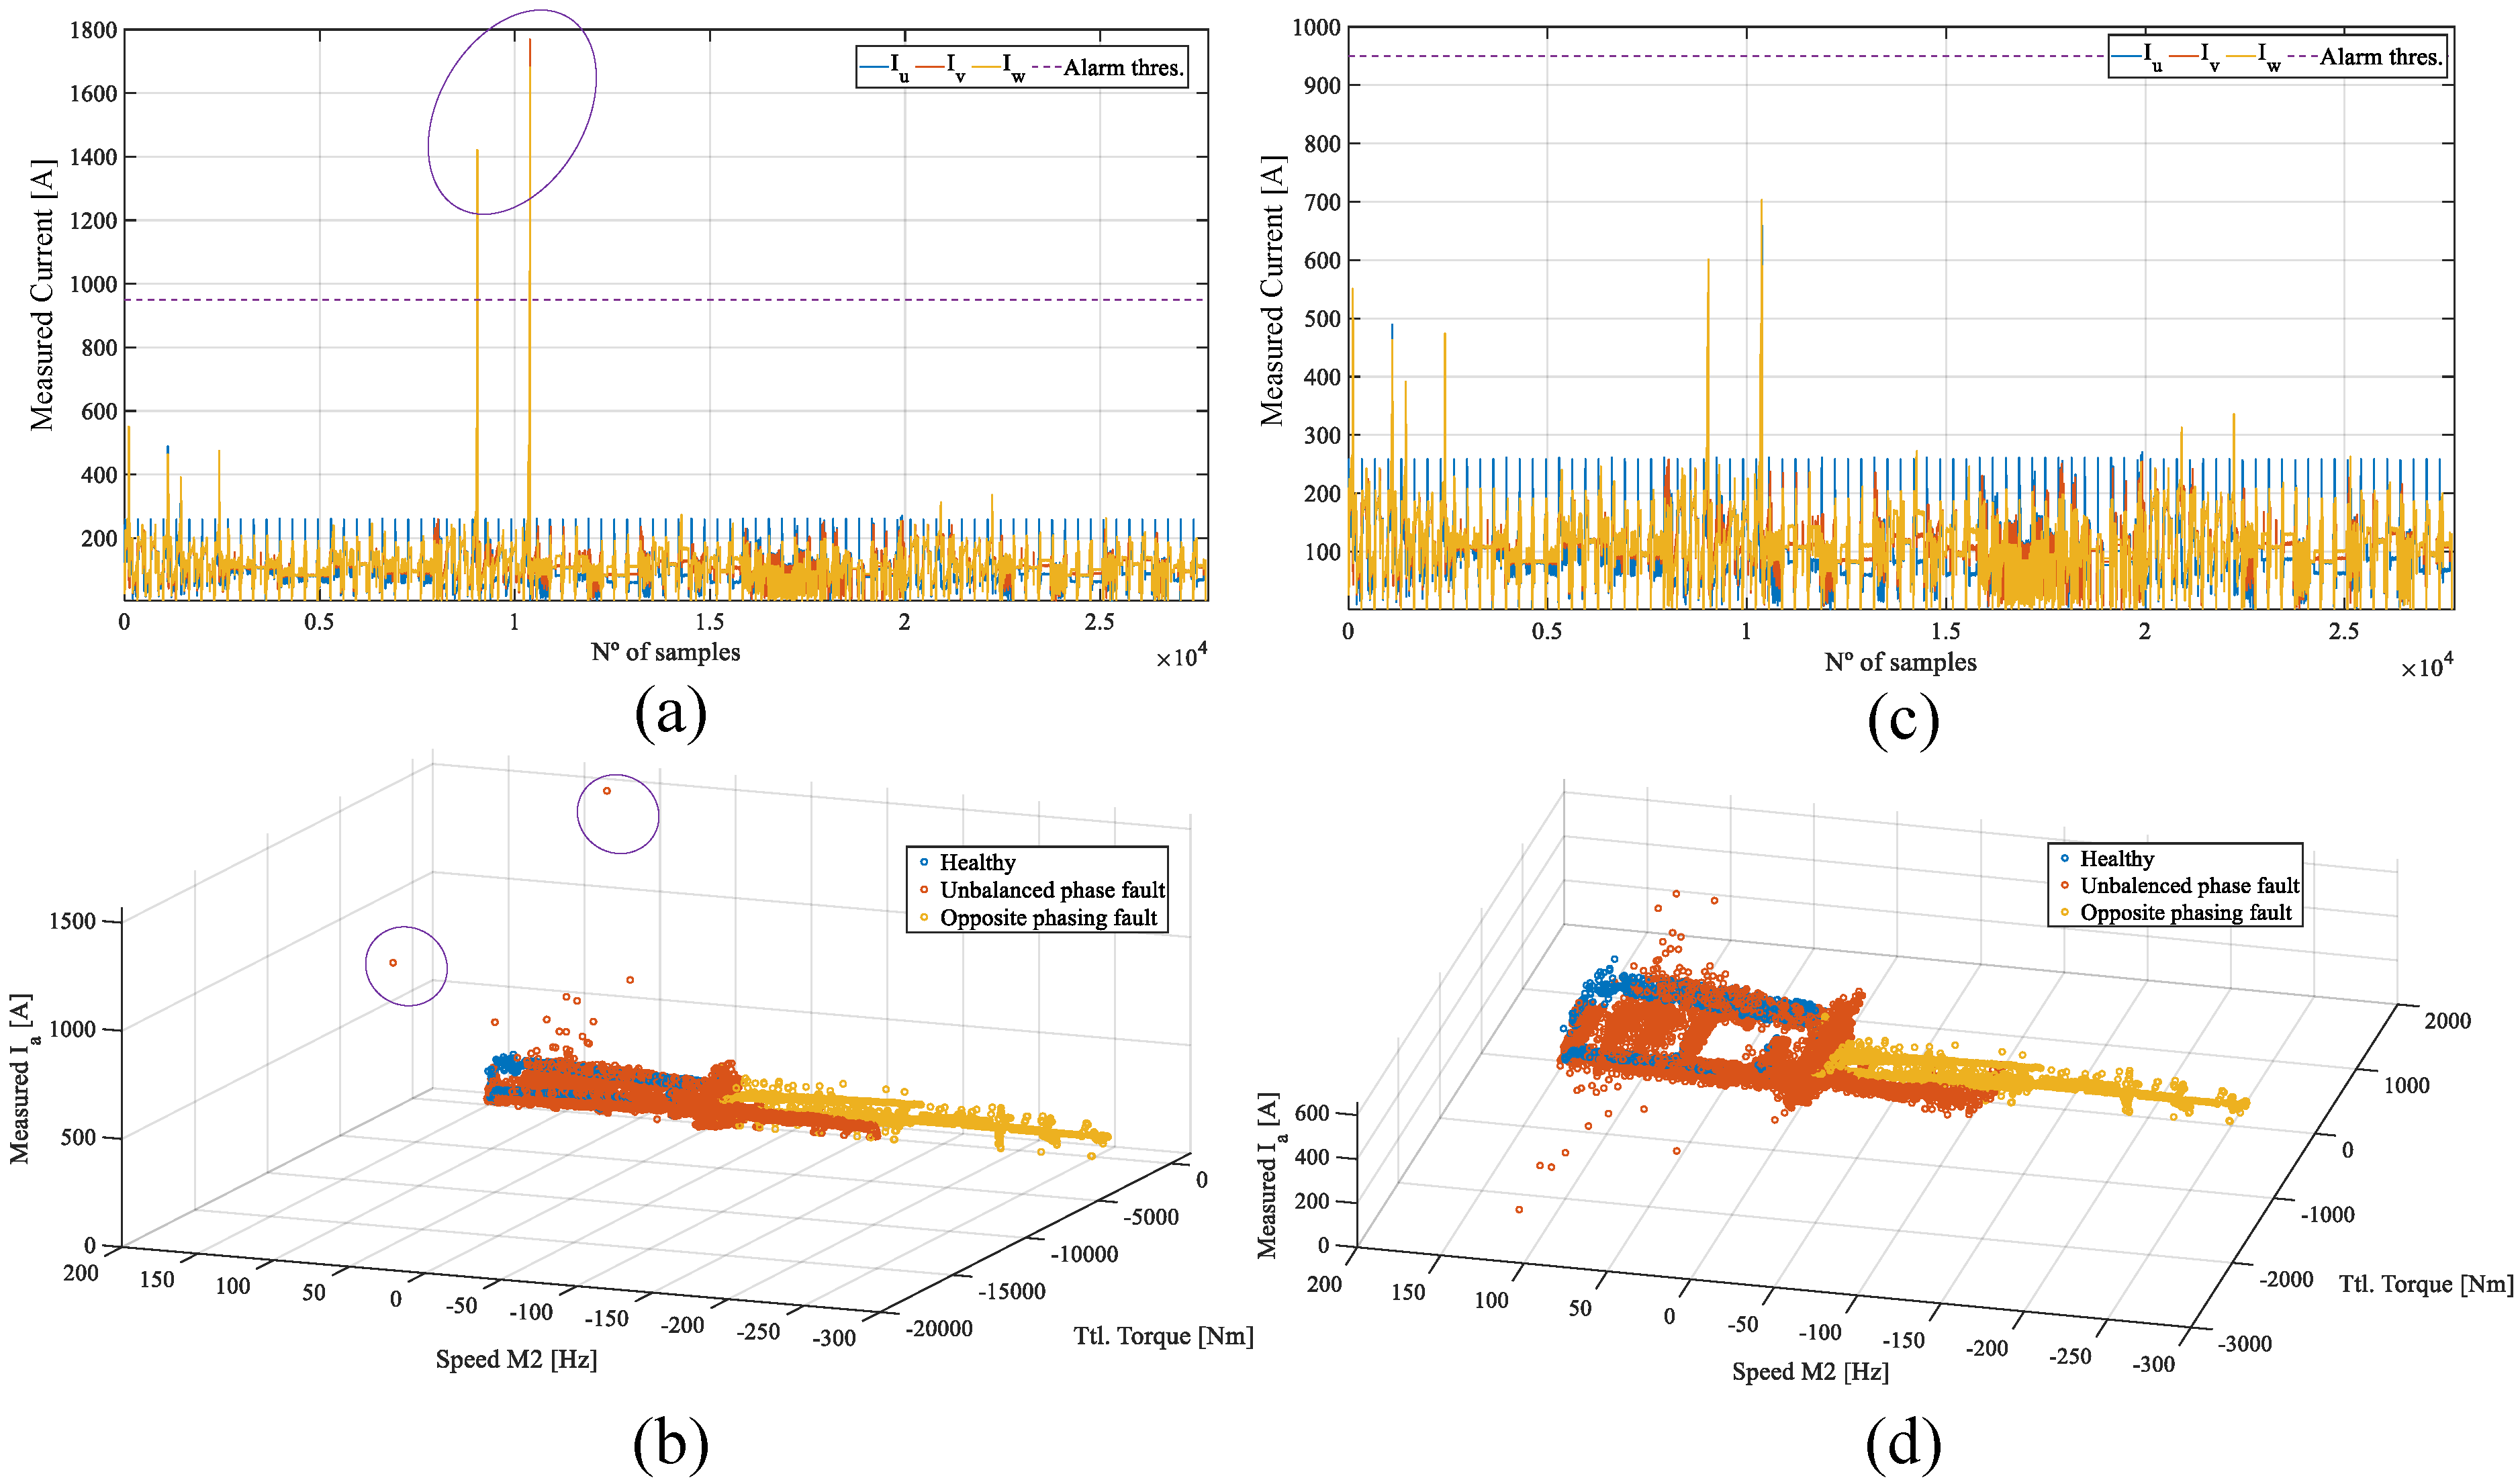
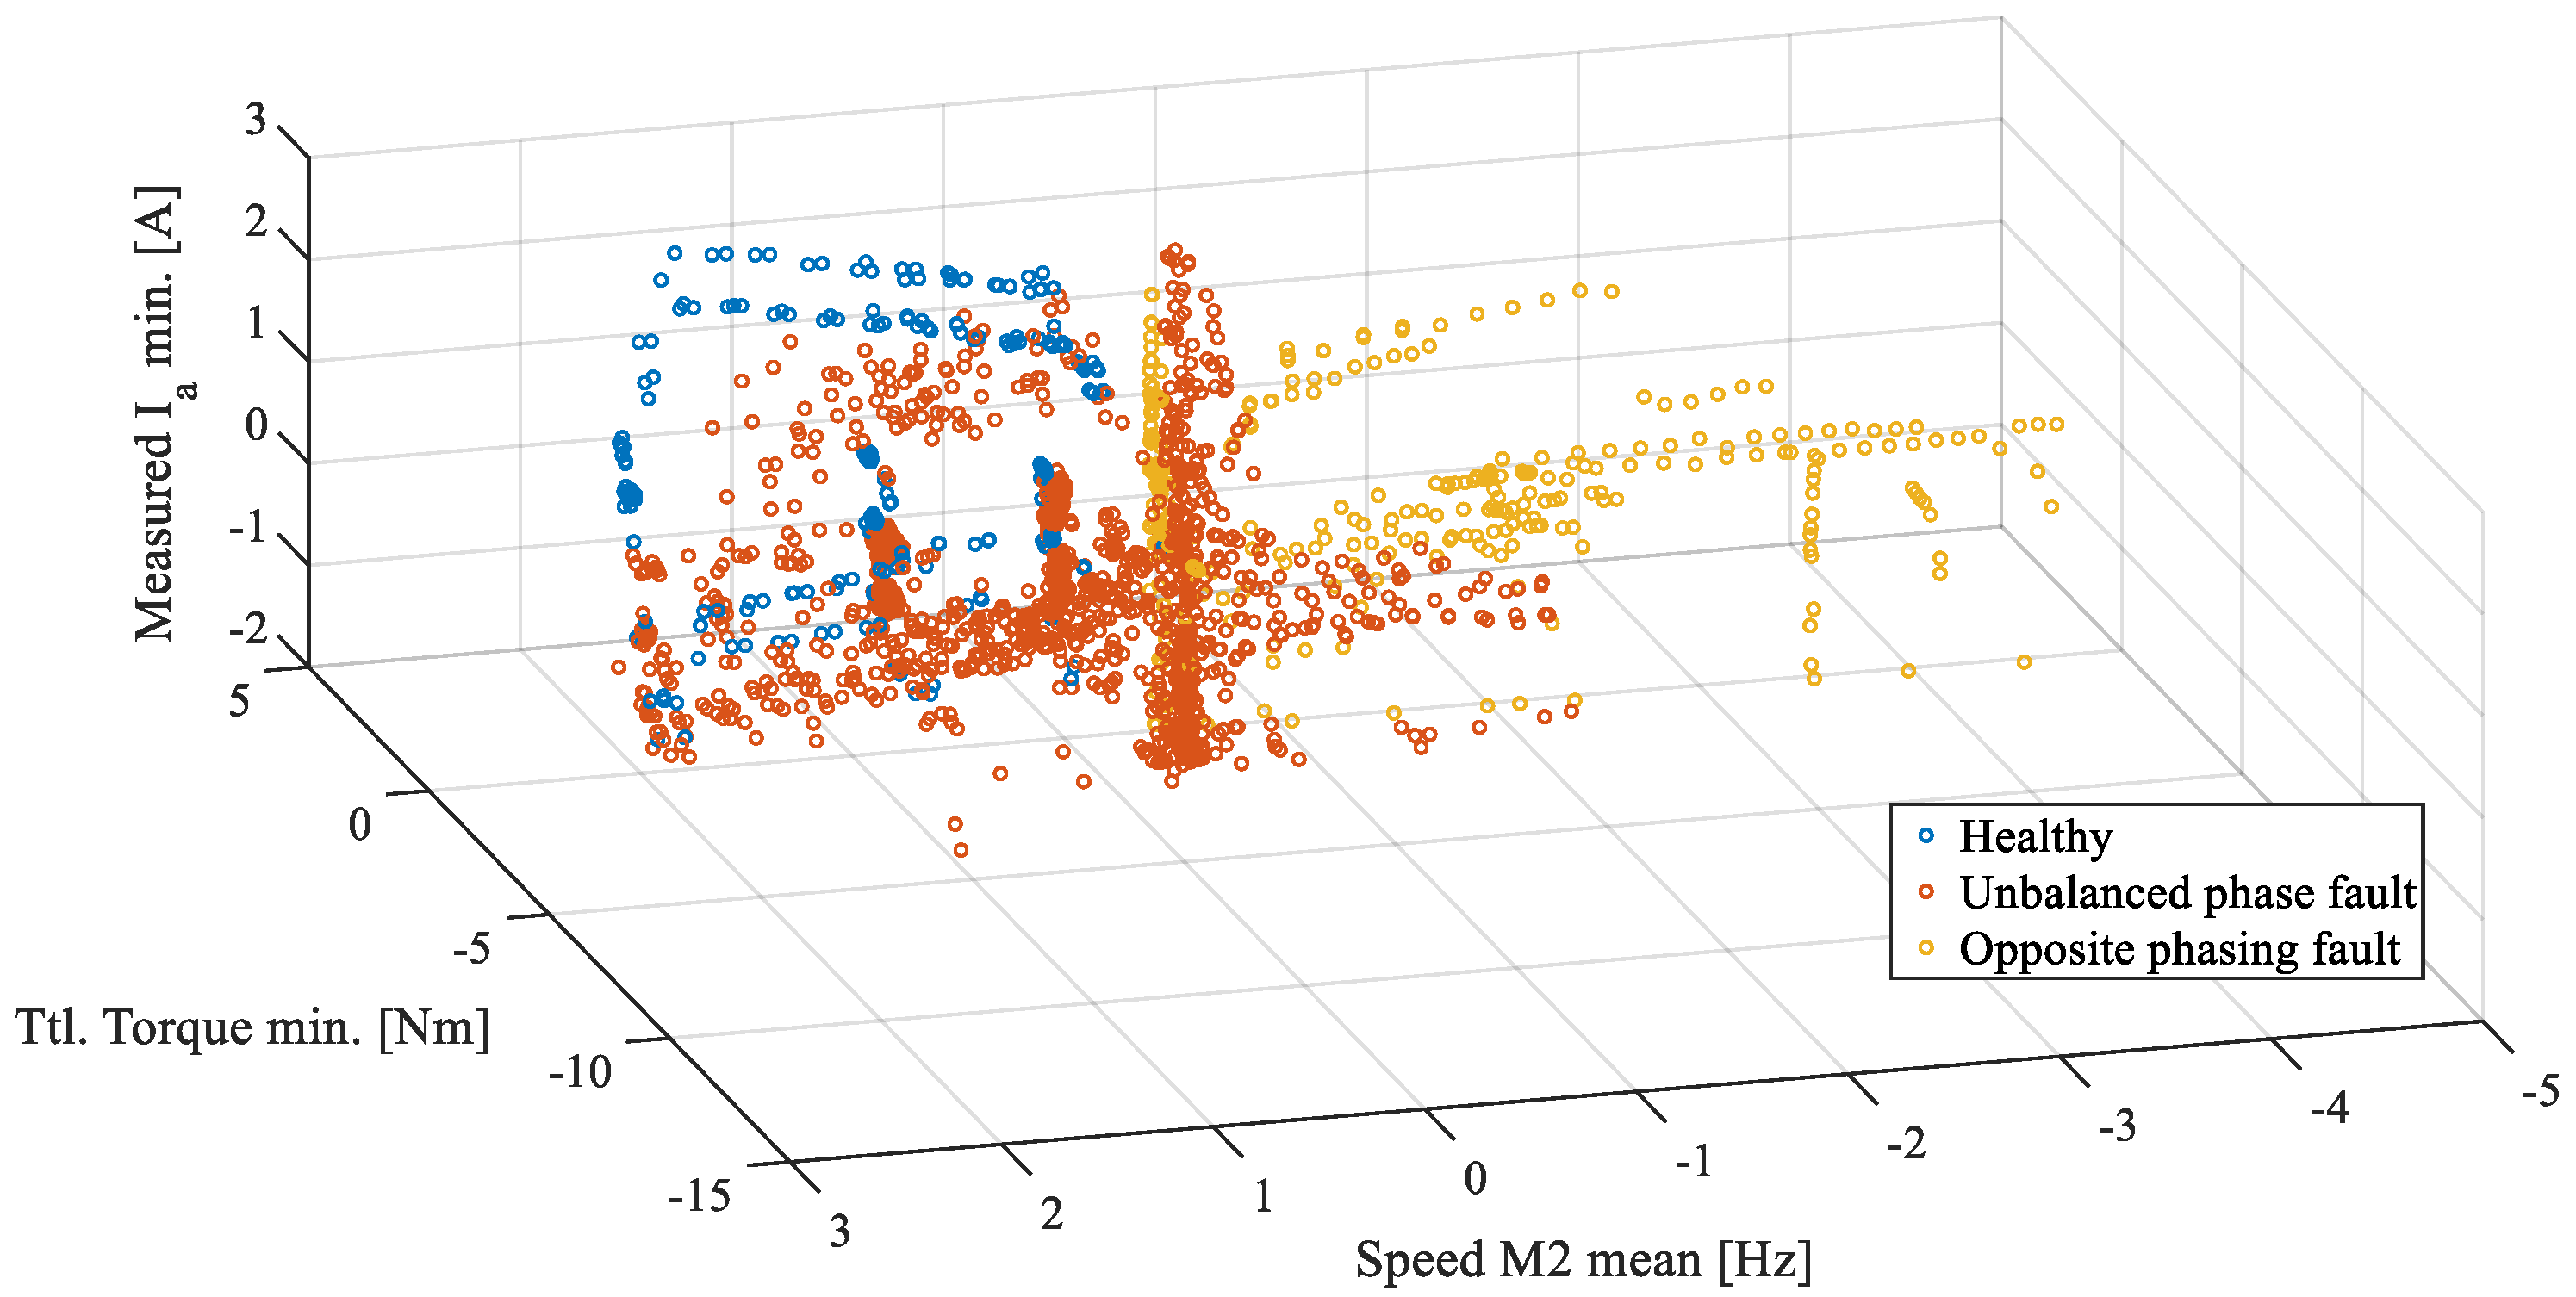
3.1. Data Acquisition and Organization

As mentioned before, simulated data should be generated in the a way that is as similar as possible to how it is acquired in the real application, in terms of recorded variables, sampling frequency and acquisition mode (average, RMS, etc.) Therefore, output data from simulation must be modified to replicate a real application environment.
As an example, the simulation explained previously runs at 50 μ s. Therefore, it provides many different variables with a 20 kHz sampling rate. However, in a real application, not all the variables are accessible, nor is the acquisition frequency that high. In this research, 11 variables that can be recorded in real applications were downsampled at a 64 ms rate, replicating the limitation of sensors installed in real applications. Table 2 shows a summary of the recorded variables from the simulation. Consequently, the complete raw dataset contains approximately 27,700 samples per each variable.
Finally, all the signals were saved in .csv files. In each of these files, an acceleration/deceleration profile with different health status and fault injection times was recorded. These .csv files were uploaded to AWS platform, specifically to the AWS S3 service which is an object storage service that offers industry-leading scalability, data availability, security and performance.

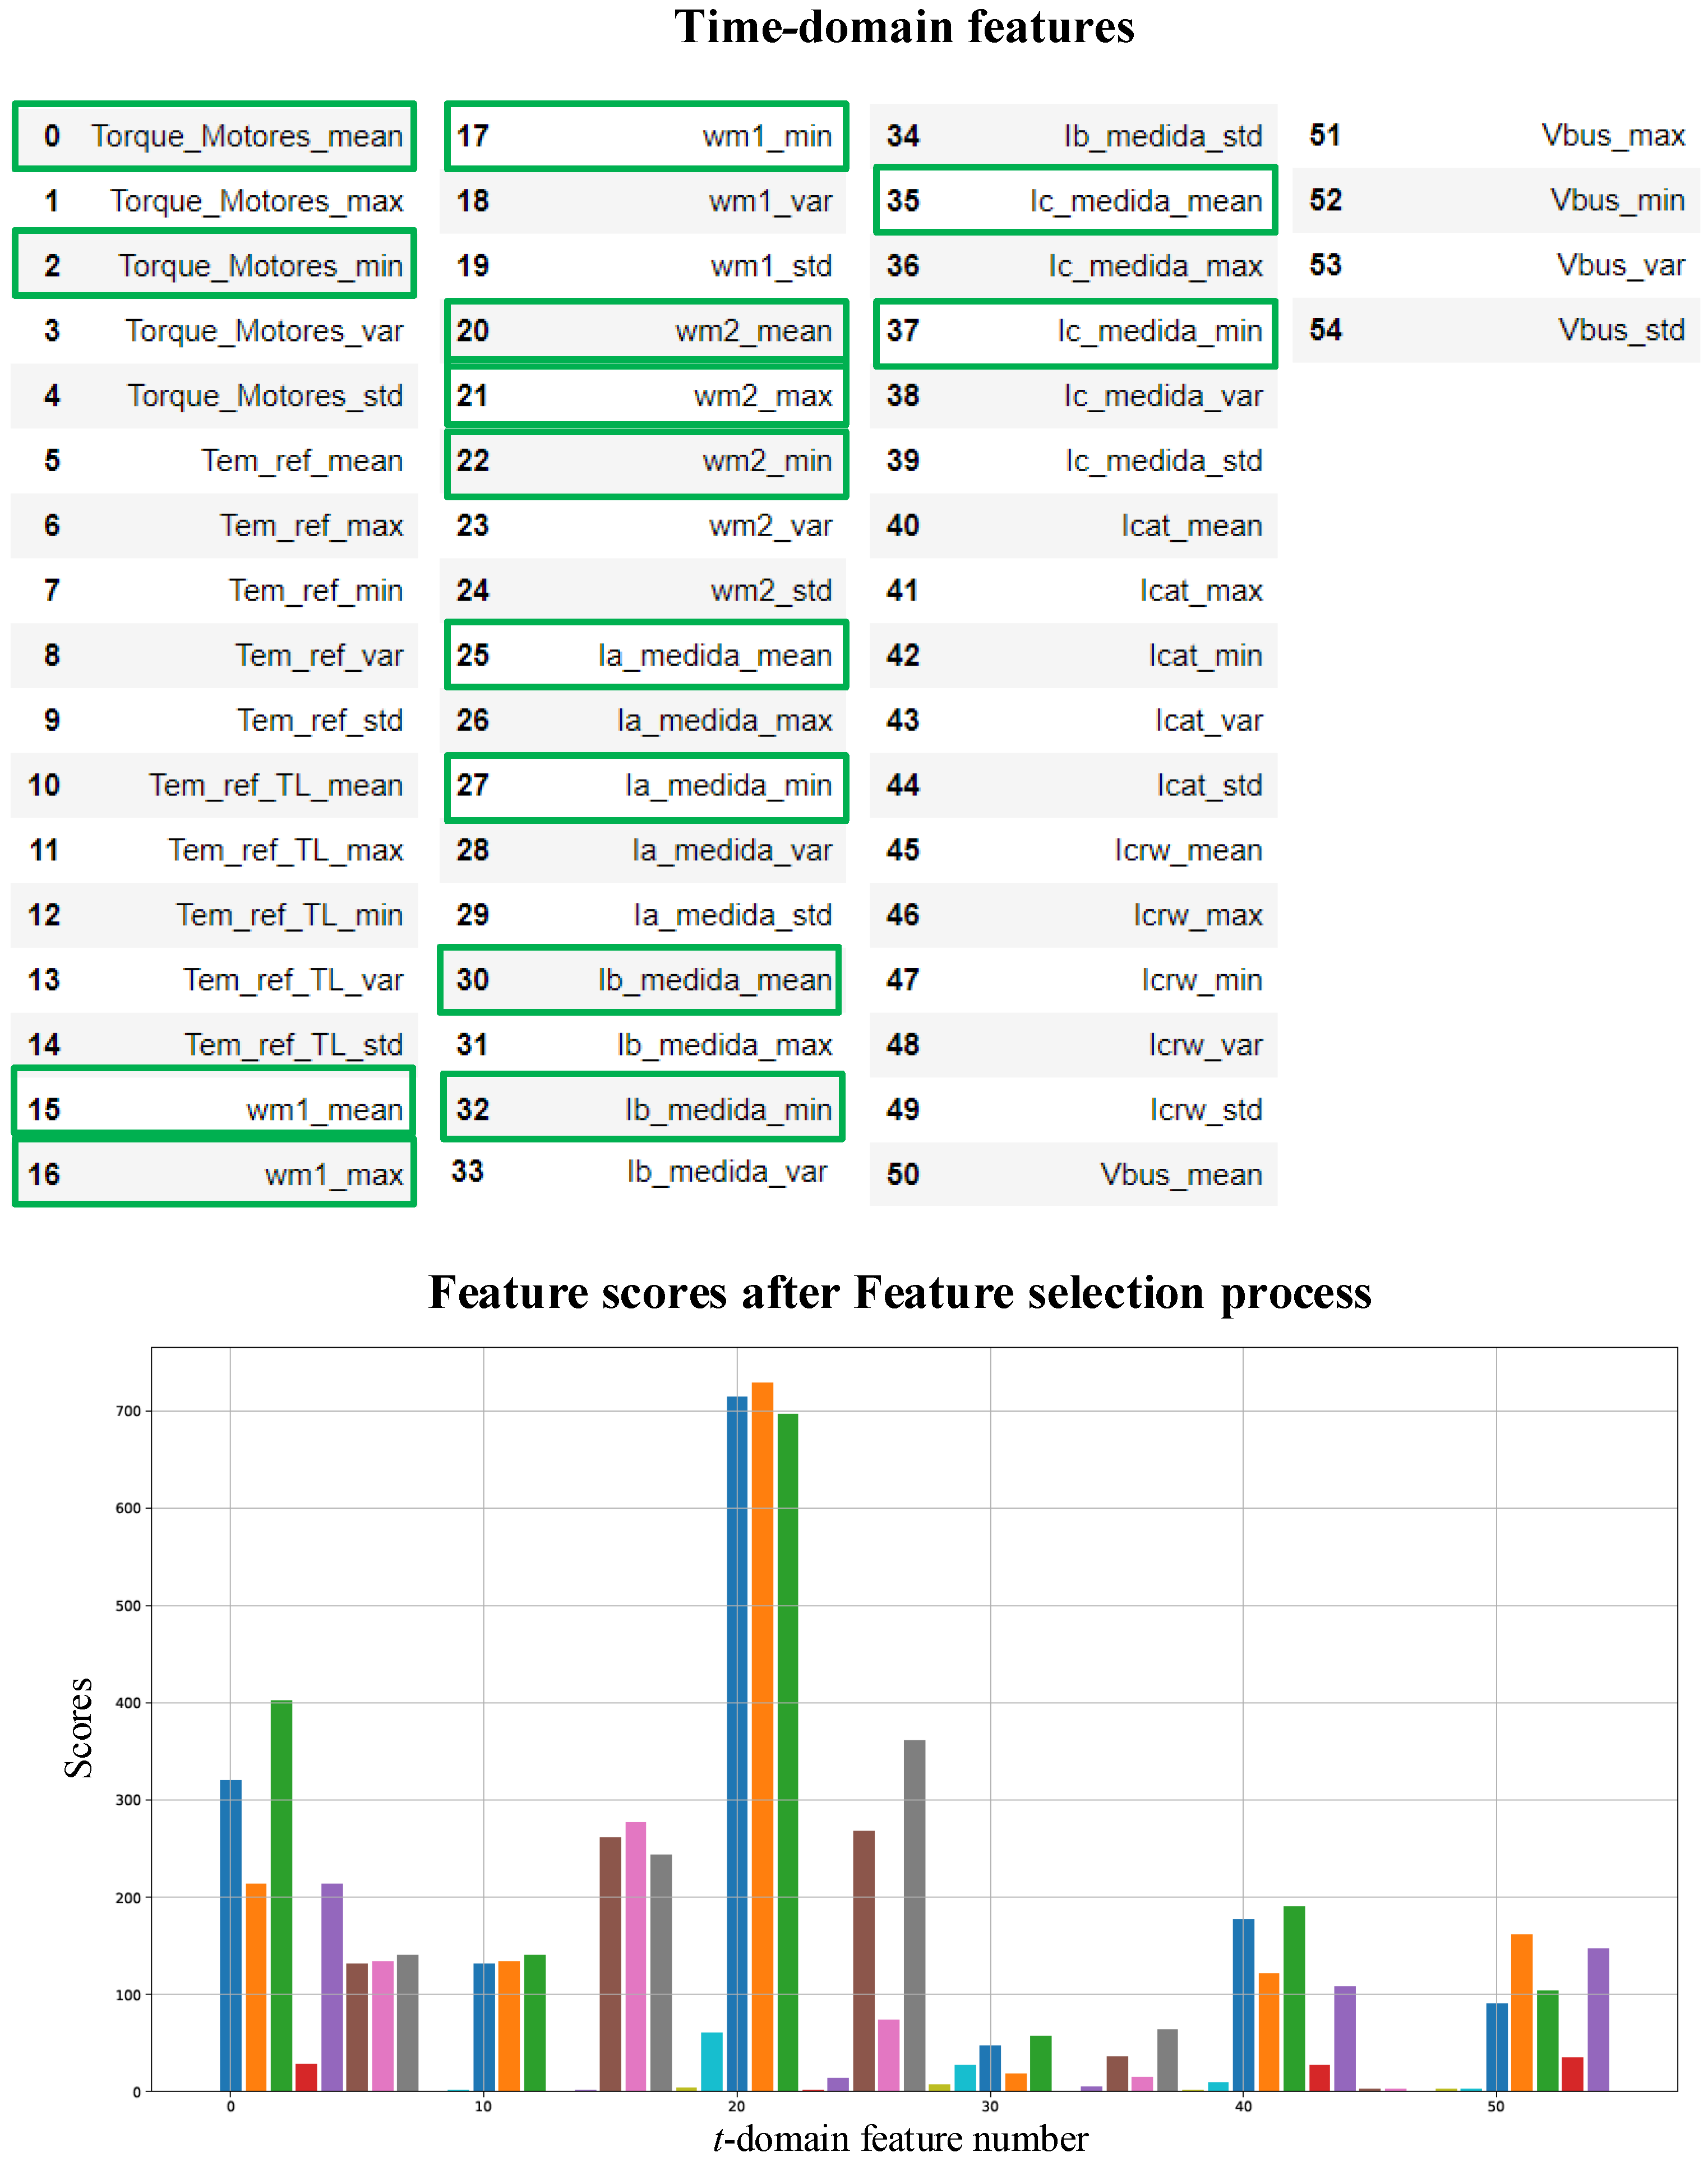
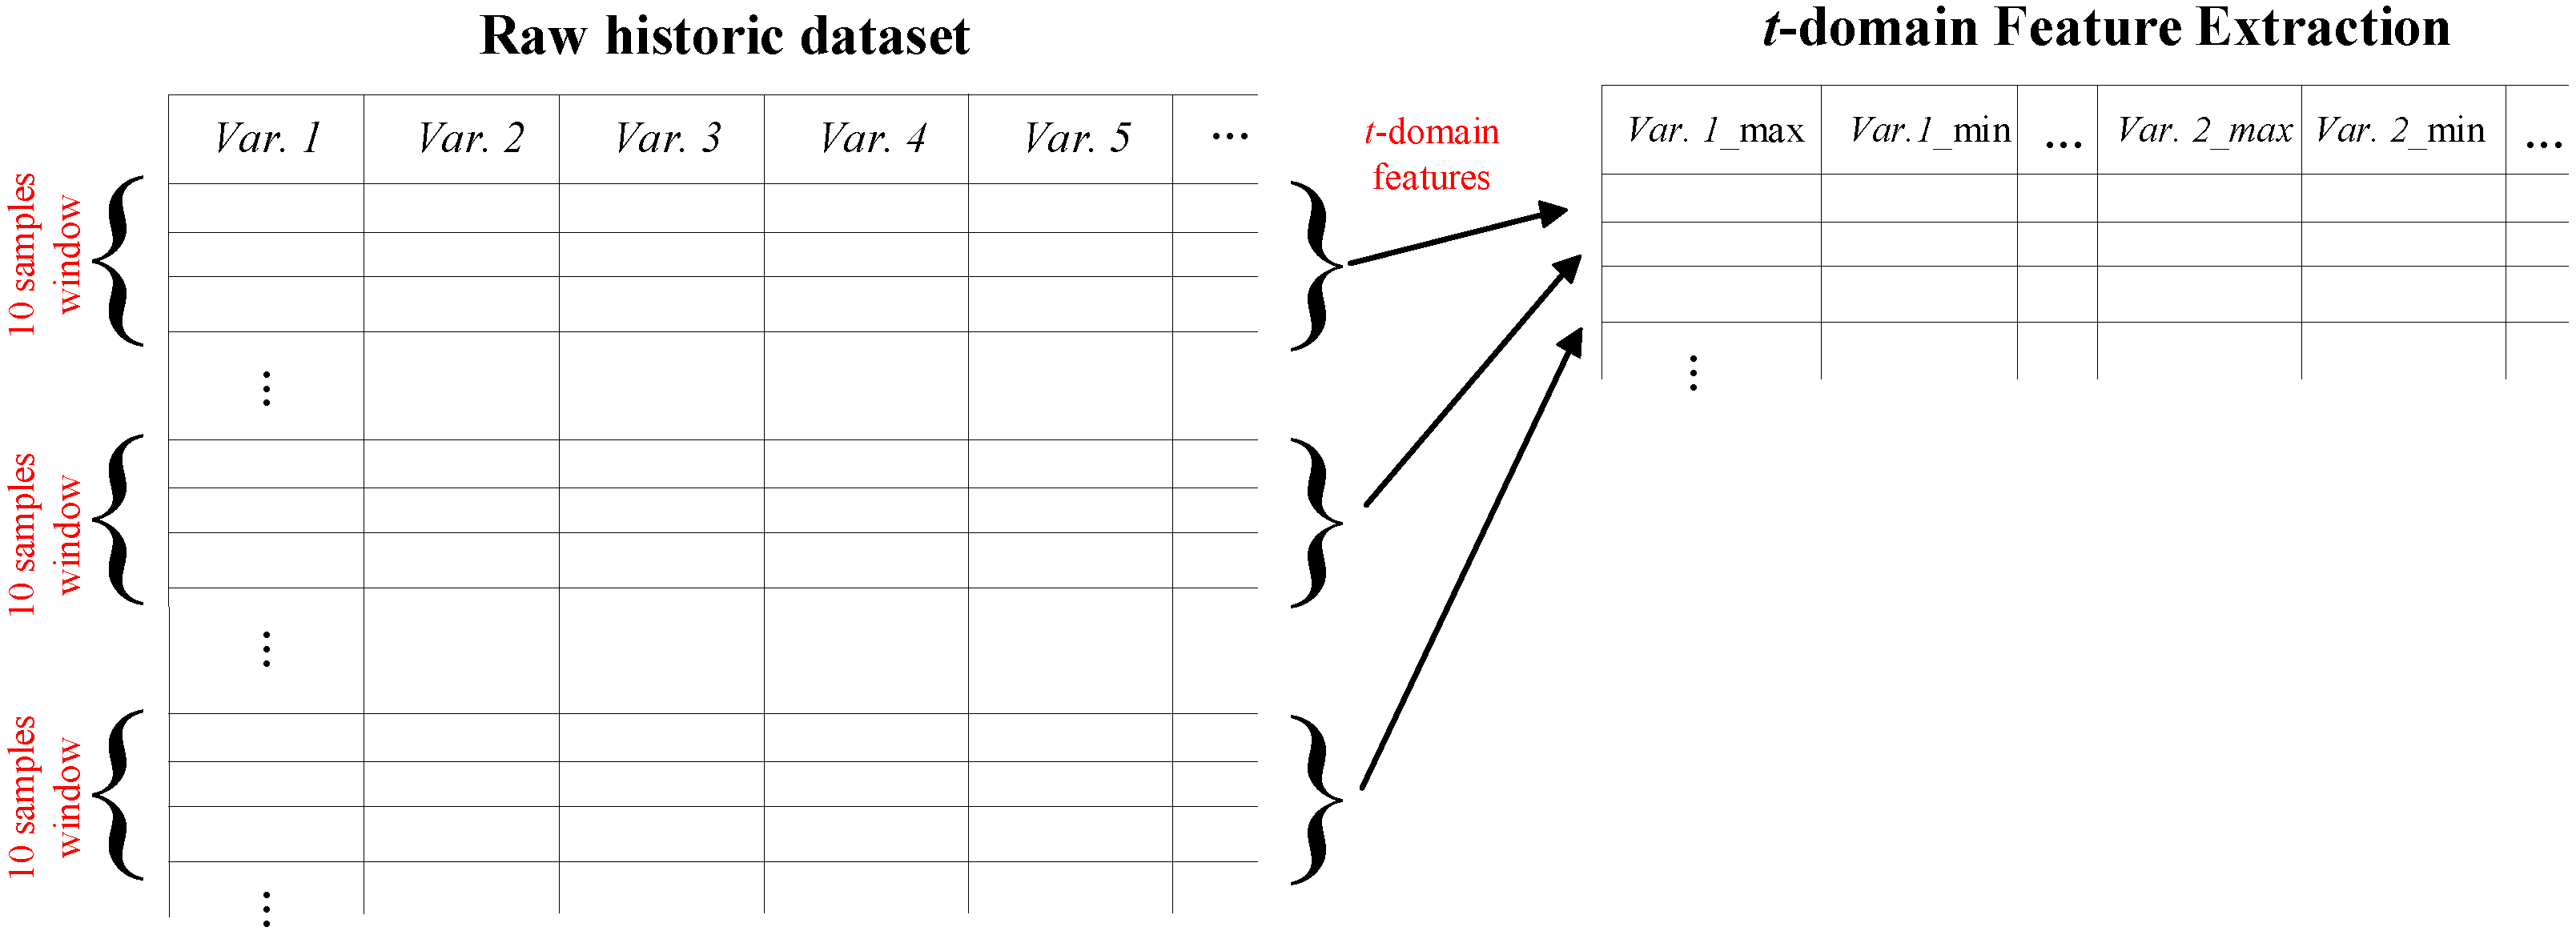
3.2. Raw Data Preprocessing

After acquiring and organizing the raw data in AWS S3 service, the next step is preprocessing it. That means cleaning and manipulating the raw data to train different machine learning algorithms. This stage is normally divided into two levels of preprocessing—on the one hand, the general preprocessing and, on the other hand, the feature engineering. To do this, the raw dataset was exploited with the AWS SageMaker service.
As for general preprocessing, it involves data cleaning, which consists of filtering messy data, detecting outliers and missing values, applying standardization [61,62] and even segmentation [63,64]. However, since the raw data source for this research is a simulation platform, it can be said that cleaning tasks are not as necessary as they are for the data from a real application environment.
As an example of the general preprocessing, a search for outliers was performed. Therefore, different samples that can distort the training dataset were removed, as can be seen in Figure 12.
Furthermore, the entire independent set of variables was normalized, using Z-score normalization [61,62], which rescales independent variables with a zero mean and unit-variance range, as shown in Equation (1):
Z score = x i t μ i σ i
where Z-score is the normalized instance, μ i and σ i are the mean value and standard deviation of the ith acquired variable, respectively.
After cleaning the raw data, feature engineering is applied to extract important information from the dataset, in order to efficiently feed the ML algorithms. In particular, feature engineering can be divided into two main tasks, feature extraction (FE) and feature selection (FS).
The main goal of feature extraction is to transform raw data into numerical features, while preserving important information from the original data set. This can be done manually by calculating features in domains such as time, frequency or time-frequency, or automatically by applying modifications such as principal component analysis (PCA), linear discriminant analysis (LDA), etc. In this research, 5 time-domain features were extracted per each of the 11 initially recorded variables with a dynamic window, jumping each 10 samples. These new statistical features are maximum, minimum, mean, variance and standard deviation. As a result, from having a raw dataset matrix of 11 variables with 27,700 samples each, now we have 55 time-domain features with 2770 samples. This FE operation is explained in Figure 13.
Then, feature selection is implemented, which means ranking the importance of the extracted features by applying certain evaluation criteria, while discarding the less important ones. In this article, the SelectKBest function with the F-test filter method from sklearn library in Python was implemented. Therefore, the best 14 statistical features were selected to train the ML algorithms. Figure 14 shows a list of the selected feature names, as well as a barplot with the different scores of the features.
At the end of this ML workflow step, the definitive dataset which will be used to train and test the ML algorithms is obtained. Figure 15 shows a 3D scatterplot of the distribution of three important features from the definitive dataset. In blue the healthy samples are shown, in red the instances with unbalanced phase fault, and finally, in yellow the samples with opposite-phase faults. If a physical interpretation of the different clusters is created, it can be seen that while the samples with nominal health status (blue) have positive speed values and stable ranges of torque and phase current, for both the samples with failure due to imbalance and opposite connection phasing this is not the case. Regarding the first fault mode (red), it can be seen that the variance of both the torque and the current is considerable. This is due to the effect of the appearance of the phase current ripple that translates into torque vibrations due to the control strategy. In the case of the opposite connection phasing fault (yellow), the clearest effect can be seen in the speed, which in the majority of the samples contains negative values without normalizing, as well as in the mechanical torque, which never reaches the reference.
Although the different classes can be differentiated visually by colours, the classification task of new unseen instances should be performed by a previously trained ML algorithm. Therefore, the main objective of this preprocessing step is to improve the separability of classes as much as possible to facilitate the training process.

3.3. ML Model Selection and Training

The third step of this workflow consists of choosing the Machine Learning topology, as well as training and validating the algorithm to leave it ready to be integrated into the required application. For that, it is helpful to rely on the specific procedure shown in Figure 16.
In the Model Selection phase, an empirical comparison of different algorithms from the same topology is carried out and the one with the best results is selected. This phase is divided into two basic tasks. On the one hand, in the former (Model Learning), algorithms with similar characteristics (supervised, unsupervised, semi-supervised) are trained with the training sub-dataset. That is to say, adjusting the internal parameters of each algorithm to efficiently estimate the outputs. In this way, four different algorithms have been trained in these research: logistic regression (LR), support vector machine (SVM), random forest (RF), and k-nearest neighbors (k-NN). On the other hand, the second task (Model Validation) requires optimizing the hyperparameters, as well as validating the different algorithms with the validation sub-dataset. When we refer to validation, we think of evaluating the performance of the algorithms by different criteria. In this research, as we have been working with supervised classification algorithms, the evaluation criterion applied is the confusion matrix. From here, accuracies and precision values were analysed to select the best algorithm. When speaking about accuracy, we refer to the percentage of the correct classified values over the total classified samples. Regarding precision, it quantifies the ability to classify the real positive samples correctly. It is worth mentioning that, given that the analysed failure modes are considered catastrophic (when one of these failures occurs, the entire system must be stopped to guarantee safety), within the misclassified samples those classified as false negative are more important than the false positives.
Finally, in the Model Assessment phase, the trained and selected algorithm is tested with new unseen data. If this last evaluation is positive, the ML model is supposed to be ready to implement in the respective application.
In addition, it is important to have in mind that the most efficient way to perform this training and testing process is to use independent sub-datasets at each stage. Therefore, in this research, the dataset obtained from the preprocessing step of the workflow has been split into three sub-datasets, namely, training, validation and testing sub-datasets. As a result, 70% of the initial dataset was used for the Model Selection step and the remaining 30%—for the Model Assessment step.
The results obtained during the whole process of the ML workflow are collected in Table 3.
Regarding the accuracy of the algorithms, it is clear that this increases, on the one hand, when preprocessing the raw data and, on the other hand, when optimizing the hyperparameters of the algorithms. As a result, best values while classifying healthy, current unbalanced and opposite-phase wiring health status have been obtained with the random forest algorithm, with 98.5% accuracy. In terms of precision, something similar happens. The algorithm which classified fewer samples as false positive is also random forest, with 97.6% accuracy. Therefore, the trained, validated and tested RF model was selected at the end of the training/testing process.

4. Conclusions

This article presents a ML-based FDD strategy for induction motor High Resistance Connection faults, open-phase faults and opposite-phase wiring faults. In order to develop this strategy, and due to the lack of faulty samples from field working conditions, these data were generated using a Matlab/Simulink-based Software-in-the-Loop simulation. To this end, these synthetic samples were used for training, validating and testing different algorithms, such as logistic regression, support vector machine, random forest and k-nearest neighbours. Previously, raw data preprocessing tasks, as well as feature extraction and selection methods have been performed to improve the efficiency of the ML workflow. The best results were obtained by optimizing the random forest ML algorithm, reaching values of 98.5% for accuracy, and 97.6% for precision. Among all the available metrics for the evaluation of the ML algorithms, the false positive rate was prioritized, taking into account the cost of maintenance shutdowns which can occur in industry.
As it was shown, the proposed method is capable of distinguishing the unbalanced operation of the motor from opposite wiring problems. This will improve future maintenance tasks, since the algorithm could guide the process of failure detection and isolation, even preventing further damages. A data-driven approach has been applied in failure modes that were previously approached using model-based or signal-based methods. Moreover, the proposed solution was designed and implemented using the Amazon Web Services cloud service, reducing the adaptation time for future industrial applications. With regard to future lines of research, firstly, work must be done to improve the separability of classes by means of advanced feature engineering techniques. In addition, the validation of this method with Hardware-in-the-Loop, laboratory and field data will be performed.

Author Contributions

Conceptualization: D.G.-J. and J.d.-O.; investigation: D.G.-J. and J.d.-O.; methodology: D.G.-J. and J.d.-O.; formal analysis: J.P. and F.G.; project administration: J.P.; validation: D.G.-J. and J.d.-O.; writing—original draft: D.G.-J. and J.d.-O.; writing—review and editing: J.d.-O., J.P., I.S. and F.G. All authors have read and agreed to the published version of the manuscript.

Funding

This research received no external funding.

Institutional Review Board Statement

Not applicable.

Informed Consent Statement

Not applicable.

Data Availability Statement

Not applicable.

Acknowledgments

This research work was supported by CAF Power & Automation. The authors are thankful to the colleagues from CAF P&A, who provided material and expertise that greatly assisted the research.

Conflicts of Interest

The authors declare no conflict of interest.

Abbreviations

The following abbreviations are used in this manuscript:
IMInduction Machine
FDDFault Detection and Diagnosis
MLMachine Learning
DLDeep Learning
HRCHigh Resistive Connection
SiLSoftware-in-the-Loop
TCUTraction Control Unit
AWSAmazon Web Services
RMSRoot Mean Square
LRLogistic Regression
SVMSupport Vector Machine
kNNk-Nearest Neighbours
RFRandom Forest

References

  1. Riera-Guasp, M.; Antonino-Daviu, J.A.; Capolino, G.A. Advances in electrical machine, power electronic, and drive condition monitoring and fault detection: State of the art. IEEE Trans. Ind. Electron. 2015, 62, 1746–1759. [Google Scholar] [CrossRef]
  2. Li, Z.; Gao, Y.; Zhang, X.; Wang, B.; Ma, H. A Model-Data-Hybrid-Driven Diagnosis Method for Open-Switch Faults in Power Converters. IEEE Trans. Power Electron. 2020, 36, 4965–4970. [Google Scholar] [CrossRef]
  3. Gou, B.; Xu, Y.; Xia, Y.; Deng, Q.; Ge, X. An Online Data-driven Method for Simultaneous Diagnosis of IGBT and Current Sensor Fault of 3-Phase PWM Inverter in Induction Motor Drives. IEEE Trans. Power Electron. 2020, 35, 13281–13294. [Google Scholar] [CrossRef]
  4. Oh, H.; Han, B.; Mccluskey, P.; Han, C.; Youn, B.D. Physics-of-Failure, Condition Monitoring, and Prognostics of IGBT Modules: A Review. IEEE Trans. Power Electron. 2015, 30, 2413–2426. [Google Scholar] [CrossRef]
  5. Wang, H.; Blaabjerg, F. Reliability of capacitors for DC-link applications in power electronic converters—An overview. IEEE Trans. Ind. Appl. 2014, 50, 3569–3578. [Google Scholar] [CrossRef] [Green Version]
  6. Liao, L.; Gao, H.; He, Y.; Xu, X.; Lin, Z.; Chen, Y.; You, F. Fault Diagnosis of Capacitance Aging in DC Link Capacitors of Voltage Source Inverters Using Evidence Reasoning Rule. Math. Probl. Eng. 2020. [Google Scholar] [CrossRef]
  7. Khelif, M.A.; Bendiabdellah, A.; Cherif, B.D.E. Short-circuit fault diagnosis of the DC-Link capacitor and its impact on an electrical drive system. Int. J. Electr. Comput. Eng. 2020, 10, 2807–2814. [Google Scholar] [CrossRef]
  8. Imam, A.M.; Divan, D.M.; Harley, R.G.; Habetler, T.G. Real-time condition monitoring of the electrolytic capacitors for power electronics applications. In Proceedings of the IEEE Applied Power Electronics Conference and Exposition—APEC, Anaheim, CA, USA, 25 February–1 March 2007. [Google Scholar] [CrossRef]
  9. Dybkowski, M.; Klimkowski, K. Artificial neural network application for current sensors fault detection in the vector controlled induction motor drive. Sensors 2019, 19, 571. [Google Scholar] [CrossRef] [PubMed] [Green Version]
  10. Gou, B.; Xu, Y.; Xia, Y.; Wilson, G.; Liu, S. An Intelligent Time-adaptive Data-driven Method for Sensor Fault Diagnosis in Induction Motor Drive System. IEEE Trans. Ind. Electron. 2018, 66, 9817–9827. [Google Scholar] [CrossRef]
  11. Chen, H.; Jiang, B.; Lu, N. Data-Driven Incipient Sensor Fault Estimation with Application in Inverter of High-Speed Railway. Math. Probl. Eng. 2017. [Google Scholar] [CrossRef] [Green Version]
  12. Mohammadhassani, A.; Teymouri, A.; Mehrizi-Sani, A.; Tehrani, K. Performance Evaluation of an Inverter-Based Microgrid under Cyberattacks. In Proceedings of the SOSE 2020—IEEE 15th International Conference of System of Systems Engineering, Budapest, Hungary, 2–4 June 2020. [Google Scholar] [CrossRef]
  13. Singh, G.K.; Al Kazzaz, S.A.S. Induction machine drive condition monitoring and diagnostic research—A survey. Electr. Power Syst. Res. 2003, 64, 145–158. [Google Scholar] [CrossRef]
  14. Henao, H.; Capolino, G.A.; Fernandez-Cabanas, M.; Filippetti, F.; Bruzzese, C.; Strangas, E.; Pusca, R.; Estima, J.; Riera-Guasp, M.; Hedayati-Kia, S. Trends in fault diagnosis for electrical machines: A review of diagnostic techniques. IEEE Ind. Electron. Mag. 2014, 8, 31–42. [Google Scholar] [CrossRef]
  15. Liang, X. Condition monitoring techniques for induction motors. In Proceedings of the 2017 IEEE Industry Applications Society Annual Meeting, IAS 2017, Cincinnati, OH, USA, 1–5 October 2017. [Google Scholar] [CrossRef]
  16. Basak, D.; Tiwari, A.; Das, S.P. Fault diagnosis and condition monitoring of electrical machines—A review. In Proceedings of the IEEE International Conference on Industrial Technology, Mumbai, India, 15–17 December 2006. [Google Scholar] [CrossRef]
  17. Garramiola, F.; Poza, J.; Madina, P.; del Olmo, J.; Almandoz, G. A Review in fault diagnosis and Health Assessment for Railway traction drives. Appl. Sci. 2018, 8, 2475. [Google Scholar] [CrossRef] [Green Version]
  18. Isermann, R. Model-based fault detection and diagnosis: Status and applications. IFAC Proc. Vol. 2004, 37, 49–60. [Google Scholar] [CrossRef]
  19. Duvvuri, S.S. Model-Based Bearing Fault Detection in Induction Motors under Speed Varying Conditions. In Proceedings of the India International Conference on Power Electronics, IICPE, Jaipur, India, 13–15 December 2018. [Google Scholar] [CrossRef]
  20. Duvvuri, S.S.; Detroja, K. Model-based stator interturn short-circuit fault detection and diagnosis in induction motors. In Proceedings of the 2015 7th International Conference on Information Technology and Electrical Engineering: Envisioning the Trend of Computer, Information and Engineering, ICITEE 2015, Chiang Mai, Thailand, 29–30 October 2015. [Google Scholar] [CrossRef]
  21. Karami, F.; Poshtan, J.; Poshtan, M. Model-based fault detection in induction Motors. In Proceedings of the IEEE International Conference on Control Applications, Yokohama, Japan, 8–10 September 2010. [Google Scholar] [CrossRef]
  22. Cruz, S.; Cardoso, A. Stator winding fault diagnosis in three-phase synchronous and asynchronous motors, by the extended Park’s vector approach. IEEE Trans. Ind. Appl. 2001, 37, 1227–1233. [Google Scholar] [CrossRef]
  23. Marques Cardoso, A.; Cruz, S.; Fonseca, D. Inter-turn stator winding fault diagnosis in three-phase induction motors, by Park’s vector approach. IEEE Trans. Energy Convers. 1999, 14, 595–598. [Google Scholar] [CrossRef]
  24. Nejjari, H.; Benbouzid, M. Monitoring and diagnosis of induction motors electrical faults using a current Park’s vector pattern learning approach. IEEE Trans. Ind. Appl. 2000, 36, 730–735. [Google Scholar] [CrossRef]
  25. Acosta, G.; Verucchi, C.; Gelso, E. A current monitoring system for diagnosing electrical failures in induction motors. Mech. Syst. Signal Process. 2006, 20, 953–965. [Google Scholar] [CrossRef]
  26. Bruzzese, C.; Honorati, O.; Santini, E. Rotor bars breakage in railway traction squirrel cage induction motors and diagnosis by MCSA technique Part I: Accurate fault simulations and spectral analyses. In Proceedings of the 2005 5th IEEE International Symposium on Diagnostics for Electric Machines, Power Electronics and Drives, Vienna, Austria, 7–9 September 2005; pp. 1–6. [Google Scholar] [CrossRef]
  27. Boccaletti, C.; Bruzzese, C.; Honorati, O.; Santini, E. Rotor bars breakage in railway traction squirrel cage induction motors and diagnosis by MCSA technique Part II: Theoretical arrangements for fault-related current sidebands. In Proceedings of the 2005 5th IEEE International Symposium on Diagnostics for Electric Machines, Power Electronics and Drives, Vienna, Austria, 7–9 September 2005; pp. 1–6. [Google Scholar] [CrossRef]
  28. Thomson, W.; Rankin, D.; Dorrell, D. On-line current monitoring to diagnose airgap eccentricity in large three-phase induction motors-industrial case histories verify the predictions. IEEE Trans. Energy Convers. 1999, 14, 1372–1378. [Google Scholar] [CrossRef]
  29. Zhang, P.; Du, Y.; Habetler, T.G.; Lu, B. A Survey of Condition Monitoring and Protection Methods for Medium-Voltage Induction Motors. IEEE Trans. Ind. Appl. 2011, 47, 34–46. [Google Scholar] [CrossRef]
  30. Gou, X.; Bian, C.; Zeng, F.; Xu, Q.; Wang, W.; Yang, S. A Data-Driven Smart Fault Diagnosis Method for Electric Motor. In Proceedings of the 2018 IEEE International Conference on Software Quality, Reliability and Security Companion (QRS-C), Lisbon, Portugal, 16–20 July 2018; pp. 250–257. [Google Scholar] [CrossRef]
  31. Shao, S.Y.; Sun, W.J.; Yan, R.Q.; Wang, P.; Gao, R.X. A Deep Learning Approach for Fault Diagnosis of Induction Motors in Manufacturing. Chin. J. Mech. Eng. 2017, 30, 1347–1356. [Google Scholar] [CrossRef] [Green Version]
  32. Saucedo-Dorantes, J.J.; Delgado-Prieto, M.; Osornio-Rios, R.A.; De Jesus Romero-Troncoso, R. Multifault Diagnosis Method Applied to an Electric Machine Based on High-Dimensional Feature Reduction. IEEE Trans. Ind. Appl. 2017, 53, 3086–3097. [Google Scholar] [CrossRef] [Green Version]
  33. Langarica, S.; Ruffelmacher, C.; Nunez, F. An Industrial Internet Application for Real-Time Fault Diagnosis in Industrial Motors. IEEE Trans. Autom. Sci. Eng. 2019, 17, 284–295. [Google Scholar] [CrossRef]
  34. Zhang, W.; Li, C.; Peng, G.; Chen, Y.; Zhang, Z. A deep convolutional neural network with new training methods for bearing fault diagnosis under noisy environment and different working load. Mech. Syst. Signal Process. 2018, 100, 439–453. [Google Scholar] [CrossRef]
  35. Alwan, H.O.; Farhan, N.M.; Sabbagh, Q.S.A. Detection of Static Air-Gap Eccentricity in Three Phase induction Motor by Using Artificial Neural Network (ANN). Int. J. Eng. Res. Appl. 2017, 7, 15–23. [Google Scholar] [CrossRef]
  36. Gonzalez-Jimenez, D.; del-Olmo, J.; Poza, J.; Garramiola, F.; Madina, P. Data-Driven Fault Diagnosis for Electric Drives: A Review. Sensors 2021, 21, 4024. [Google Scholar] [CrossRef] [PubMed]
  37. Barański, M.; Polak, M. Thermal diagnostic in electrical machines. Prz. Elektrotech. 2011, 33, 305–308. [Google Scholar]
  38. de la Barrera, P.M.; Bossio, G.R.; Solsona, J.A. High-Resistance Connection Detection in Induction Motor Drives Using Signal Injection. IEEE Trans. Ind. Electron. 2014, 61, 3563–3573. [Google Scholar] [CrossRef]
  39. Stojčić, G.; Wolbank, T.M. Detecting high-resistance connection asymmetries in inverter fed AC drive systems. In Proceedings of the 2013 9th IEEE International Symposium on Diagnostics for Electric Machines, Power Electronics and Drives (SDEMPED), Valencia, Spain, 27–30 August 2013; pp. 227–232. [Google Scholar] [CrossRef]
  40. Lee, S.B.; Yang, J.; Hong, J.; Yoo, J.Y.; Kim, B.; Lee, K.; Yun, J.; Kim, M.; Lee, K.W.; Wiedenbrug, E.J.; et al. A New Strategy for Condition Monitoring of Adjustable Speed Induction Machine Drive Systems. IEEE Trans. Power Electron. 2011, 26, 389–398. [Google Scholar] [CrossRef]
  41. Yun, J.; Cho, J.; Lee, S.B.; Yoo, J.Y. Online Detection of High-Resistance Connections in the Incoming Electrical Circuit for Induction Motors. IEEE Trans. Ind. Appl. 2009, 45, 694–702. [Google Scholar] [CrossRef]
  42. Yun, J.; Lee, K.; Lee, K.W.; Lee, S.B.; Yoo, J.Y. Detection and Classification of Stator Turn Faults and High-Resistance Electrical Connections for Induction Machines. IEEE Trans. Ind. Appl. 2009, 45, 666–675. [Google Scholar] [CrossRef]
  43. Mengoni, M.; Zarri, L.; Tani, A.; Gritli, Y.; Serra, G.; Filippetti, F.; Casadei, D. Online Detection of High-Resistance Connections in Multiphase Induction Machines. IEEE Trans. Power Electron. 2015, 30, 4505–4513. [Google Scholar] [CrossRef]
  44. Leandro, E.; de Lacerda de Oliveira, L.E.; da Silva, J.G.B.; Lambert-Torresm, G.; da Silv, L.E.B. Predictive Maintenance by Electrical Signature Analysis to Induction Motors. Induction Mot. Model. Control 2012. [Google Scholar] [CrossRef] [Green Version]
  45. Rothenhagen, K.; Fuchs, F. Performance of diagnosis methods for IGBT open circuit faults in three phase voltage source inverters for AC variable speed drives. In Proceedings of the 2005 European Conference on Power Electronics and Applications, Dresden, Germany, 11–14 September 2005. [Google Scholar] [CrossRef]
  46. Guan, Y.; Sun, D.; He, Y. Mean Current Vector Based Online Real-Time Fault Diagnosis for Voltage Source Inverter fed Induction Motor Drives. In Proceedings of the 2007 IEEE International Electric Machines Drives Conference, Antalya, Turkey, 3–5 May 2007; Volume 2, pp. 1114–1118. [Google Scholar] [CrossRef]
  47. Trabelsi, M.; Boussak, M.; Gossa, M. Multiple IGBTs open circuit faults diagnosis in voltage source inverter fed induction motor using modified slope method. In Proceedings of the XIX International Conference on Electrical Machines—ICEM 2010, Rome, Italy, 6–8 September 2010; pp. 1–6. [Google Scholar] [CrossRef]
  48. Estima, J.O.; Marques Cardoso, A.J. A New Algorithm for Real-Time Multiple Open-Circuit Fault Diagnosis in Voltage-Fed PWM Motor Drives by the Reference Current Errors. IEEE Trans. Ind. Electron. 2013, 60, 3496–3505. [Google Scholar] [CrossRef]
  49. Thomsen, J.; Kallesoe, C. Stator fault modeling in induction motors. In Proceedings of the International Symposium on Power Electronics, Electrical Drives, Automation and Motion, 2006. SPEEDAM 2006, Taormina, Italy, 23–26 May 2006; pp. 1275–1280. [Google Scholar] [CrossRef]
  50. Martin-Diaz, I.; Morinigo-Sotelo, D.; Duque-Perez, O.; Romero-Troncoso, R.J. An Experimental Comparative Evaluation of Machine Learning Techniques for Motor Fault Diagnosis Under Various Operating Conditions. IEEE Trans. Ind. Appl. 2018, 54, 2215–2224. [Google Scholar] [CrossRef]
  51. Godoy, W.; Silva, I.; Goedtel, A.; Palácios, R.H.C.; Lopes, T.D. Application of intelligent tools to detect and classify broken rotor bars in three-phase induction motors fed by an inverter. IET Electr. Power Appl. 2016, 10, 430–439. [Google Scholar] [CrossRef]
  52. Martins, J.F.; Ferno Pires, V.; Pires, A.J. Unsupervised Neural-Network-Based Algorithm for an On-Line Diagnosis of Three-Phase Induction Motor Stator Fault. IEEE Trans. Ind. Electron. 2007, 54, 259–264. [Google Scholar] [CrossRef]
  53. Colby, R. Detection of high-resistance motor connections using symmetrical component analysis and neural network models. In Proceedings of the 4th IEEE International Symposium on Diagnostics for Electric Machines, Power Electronics and Drives, SDEMPED 2003, Atlanta, GA, USA, 24–26 August 2003; pp. 2–6. [Google Scholar] [CrossRef]
  54. Lee, J.; Singh, J.; Azamfar, M.; Pandhare, V. Chapter 8—Industrial AI and predictive analytics for smart manufacturing systems. In Smart Manufacturing; Soroush, M., Baldea, M., Edgar, T.F., Eds.; Elsevier: Amsterdam, The Netherlands, 2020; pp. 213–244. [Google Scholar] [CrossRef]
  55. Garramiola, F.; del-Olmo, J.; Poza, J.; Madina, P.; Almandoz, G. Integral sensor fault detection and isolation for railway traction drive. Sensors 2018, 18, 1543. [Google Scholar] [CrossRef] [PubMed] [Green Version]
  56. Garramiola, F.; Poza, J.; Madina, P.; del-Olmo, J.; Ugalde, G. A Hybrid Sensor Fault Diagnosis for Maintenance in Railway Traction Drives. Sensors 2020, 20, 962. [Google Scholar] [CrossRef] [PubMed] [Green Version]
  57. del Olmo, J.; Garramiola, F.; Poza, J.; Almandoz, G. Model-Based Fault Analysis for Railway Traction Systems. Mod. Railw. Eng. 2018. [Google Scholar] [CrossRef] [Green Version]
  58. MathWorks. Mastering Machine Learning A Step-by-Step Guide with MATLAB; Technical Report; MathWorks: Natick, MA, USA, 2018. [Google Scholar]
  59. Zhong, K.; Han, M.; Han, B. Data-driven based fault prognosis for industrial systems: A concise overview. IEEE/CAA J. Autom. Sin. 2019, 7, 330–345. [Google Scholar] [CrossRef]
  60. Bikov, E.; Boyko, P.; Sokolov, E.; Yarotsky, D. Railway incident ranking with machine learning. In Proceedings of the 16th IEEE International Conference on Machine Learning and Applications, ICMLA 2017, Cancun, Mexico, 18–21 December 2017; pp. 601–606. [Google Scholar] [CrossRef]
  61. Melendez, I.; Doelling, R.; Bringmann, O. Self-supervised Multi-stage Estimation of Remaining Useful Life for Electric Drive Units. In Proceedings of the 2019 IEEE International Conference on Big Data (Big Data), Los Angeles, CA, USA, 9–12 December 2019; pp. 4402–4411. [Google Scholar] [CrossRef]
  62. Xue, Z.Y.; Li, M.S.; Xiahou, K.S.; Ji, T.Y.; Wu, Q.H. A Data-Driven Diagnosis Method of Open-Circuit Switch Faults for PMSG-Based Wind Generation System. In Proceedings of the 2019 IEEE 12th International Symposium on Diagnostics for Electrical Machines, Power Electronics and Drives, SDEMPED 2019, Toulouse, France, 27–30 August 2019. [Google Scholar] [CrossRef]
  63. Xu, Z.; Hu, J.; Hu, C.; Nadarajan, S.; Goh, C.K.; Gupta, A. Data-Driven Fault Detection of Electrical Machine. In Proceedings of the 2018 15th International Conference on Control, Automation, Robotics and Vision, ICARCV 2018, Singapore, 18–21 November 2018; pp. 515–520. [Google Scholar] [CrossRef]
  64. Shi, W.; Lu, N.; Jiang, B.; Zhi, Y.; Xu, Z. An Unsupervised Anomaly Detection Method Based on Density Peak Clustering for Rail Vehicle Door System. In Proceedings of the 2019 Chinese Control And Decision Conference (CCDC), Nanchang, China, 3–5 June 2019; pp. 1954–1959. [Google Scholar]
Figure 1. Schematic of the two induction motors in parallel structure from a railway application.
Energies 14 04886 g001
Figure 2. Schematic of the Matlab/Simulink based SiL simulation platform of a tram application for synthetic data generation.
Energies 14 04886 g002
Figure 3. Torque, speed, phase currents and DC-link voltage signals at 2400 rpm and 50 Nm load (healthy state).
Energies 14 04886 g003
Figure 4. IM phase currents detail at 2400 rpm and 50 Nm load (healthy state).
Energies 14 04886 g004
Figure 5. IM power connection faults modelled in the SiL platform.
Energies 14 04886 g005
Figure 6. Phase currents of motor 1 and motor 2 at 2400 rpm and 50 Nm load (open-phase fault at t = 10 s).
Energies 14 04886 g006
Figure 7. Phase currents of motor 1 and motor 2 at 2400 rpm and 100 Nm load (HRC/unbalanced fault at t = 10 s).
Energies 14 04886 g007
Figure 8. Phase currents of motor 1 and motor 2 at 2400 rpm and 100 Nm load (opposite-phase wiring fault at t = 0 s).
Energies 14 04886 g008
Figure 9. Standardized workflow to apply effectively machine learning approaches.
Energies 14 04886 g009
Figure 10. Schematic of the supervised ML methodology.
Energies 14 04886 g010
Figure 11. Data pipeline for the ML-based FDD strategy developed in Amazon Web Services.
Energies 14 04886 g011
Figure 12. Example of outlier detection tasks. The outliers circled in purple were removed. (a) IM phase currents plot with outliers. (b) Scatterplot of the raw dataset with outliers. (c) IM phase currents plot without outliers. (d) Scatterplot of the raw dataset without outliers.
Energies 14 04886 g012
Figure 13. Schematic of the time-domain feature extraction method.
Energies 14 04886 g013
Figure 14. Scores of the feature selection step and list of t-domain features.
Energies 14 04886 g014
Figure 15. 3D scatterplot after applying raw dataset preprocessing step from the ML workflow.
Energies 14 04886 g015
Figure 16. Training/testing process for a machine learning algorithm.
Energies 14 04886 g016
Table 1. Simulation scenarios for faulty data generation.
Speed Ref. [rpm]Load Torque [Nm]
90050
100
240050
100
450050
100
Table 2. Recorded variables from the SiL simulation platform.
Variable NameAcq. Freq [ms]Acq. ModeExplanation
Torque_Motores64Inst.Sum of the two parallel IM torques [Nm]
Tem_ref64Inst.Torque reference for each of the IMs [Nm]
Tem_ref_TL64Inst.Torque reference after control limitations [Nm]
wm164Inst.Speed of IM1 [Hz]
wm264Inst.Speed of IM2 [Hz]
Ia_medida64RMSTotal output current of the inverter in phase A [A]
Ib_medida64RMSTotal output current of the inverter in phase B [A]
Ic_medida64RMSTotal output current of the inverter in phase C [A]
Icat64Inst.Input measured current to the system [A]
Icrw64Inst.Crowbar current [A]
Vbus64Inst.BUS voltage [V]
Table 3. Accuracy and Precision results of the different algorithms during different steps of the ML workflow.
StepsAccuracy [(TP + TN)/(Total Samples)]Precision [TP/(TP + FP)]
LRSVMRFk-NNLRSVMRFk-NN
Training with raw dataset0.7190.8060.9670.9380.7530.8310.9780.932
Training with t-domain features0.8480.9210.9750.9330.8720.9230.9820.933
Optimized algorithms testing0.9230.9670.9850.9420.9110.9530.9760.934
Publisher’s Note: MDPI stays neutral with regard to jurisdictional claims in published maps and institutional affiliations.

