Article

Addressing the Effect of Social Acceptance on the Distribution of Wind Energy Plants and the Transmission Grid in Germany

by
Franziska Flachsbarth
*,
Marion Wingenbach
and
Matthias Koch
Öko-Institut e.V., Merzhauser Straße 173, 79100 Freiburg, Germany
*
Author to whom correspondence should be addressed.
Energies 2021, 14(16), 4824; https://doi.org/10.3390/en14164824
Submission received: 17 July 2021 / Revised: 3 August 2021 / Accepted: 4 August 2021 / Published: 7 August 2021

Abstract

:
Social acceptance is increasingly becoming a limiting factor in implementing the energy transition in Germany. From today’s perspective, the expansion of wind energy and future transmission grids is only somewhat a technical or economic challenge rather than a social one. Since political decisions on the energy system transformation are often derived from findings of energy system modeling, it seems necessary to increasingly integrate the effects of socio-ecological aspects, such as acceptance issues in energy models. In this paper, an approach is introduced to address effects of social acceptance in energy system models by comparing the influence of different distribution scenarios of wind energy in Germany on the expansion need for future transmission lines. The results show that a socio-ecologic distribution of onshore wind installations according to a balanced burden of the German society does not reduce the grid expansion need significantly compared to an economic siting. An actual reduction of planned transmission grids could just be achieved by a more decentral scenario, including decentral market design. The sensitivity of regionalization is an opportunity to consider local acceptance issues within energy system models and should move more into focus inside the procedure of the current grid development process in Germany.

1. Introduction

The challenges of climate change, sustainable development and energy supply security have been met with policies to increase the share of renewable energy sources and the implementation of global and local emission reduction targets. The existence of these targets highlights that the global transformation of energy systems is not only necessary, but also internationally accepted, scientifically confirmed and politically pursued. The shift to energy systems with a high proportion of renewable technologies will play a significant role in such a transformation [1]. The technical and economic feasibility of a 100 percent renewable electricity supply system for Germany has been widely confirmed [2]. The remaining question is how the transformation will be achieved. Wind energy, as a relatively cost-efficient technology with high expansion potential, plays a significant role for this transformation in Germany [2]. The expansion of renewable generation plants is accompanied by the need to further expand the power grid, for example to transport wind power produced in the north to southern regions with high consumption.
A wide range of energy models have been developed over the past decade to enable the planning and analysis of future energy systems. An overview of these models and the available approaches to classify them can for example be found in [3]. As well as simulation and optimization methods, which are predominantly used in current models [3,4], there are agent-based approaches and methods using neuronal networks or fuzzy theories [5,6]. The results from the models depend on their functionality and the specific choice of input parameters [7].
Energy system models face a number of challenges. The most important ones are details in time and space that need to be considered, energy systems’ increasing complexity, the need for improvements in transparency and the integration of social factors [8]. The majority of these challenges have already been addressed [9]. The challenge of high resolution in time can be dealt with by analyzing just one specific sector, independent of the remaining energy system. The challenge of spatial detail is met by using geographical information systems (GIS) to allocate regional energy demands or potential analyses [10]. To meet the challenge of increasing complexity open source is a suitable approach [7]. A simplified representation of system components combined with transparency increases the comprehensibility of complex models and helps to identify uncertainties [11,12]. The knowledge gained from modelling is often used for political recommendations and therefore needs to be comprehensible. Furthermore, the lack of transparency leads to a limited reproducibility of models and model results [13].
The major upcoming challenge in energy system modelling, with no clear solution yet, is the integration of social factors, such as local acceptance [8,14,15,16]. The acceptance of local energy projects is becoming a major limiting factor in the German energy transition, despite existing political targets and general support of renewable energies [17,18]. Local constraints need to be considered in the planning of future locations of energy plants. The challenge is to link social research with energy system modelling by including qualitative data in quantitative models [19]. This challenge can be met by using energy scenarios to include qualitative criteria as input parameters in energy system models. An interdisciplinary scenario development process can provide an opportunity to consider social and ecological circumstances, besides technical and economic criteria.
Generally, scenarios vary in their methodology and type, though there are two dominating types: forecasting scenarios, which are explorative, using past trends to define a possible future without considering if the result is desired or not, and backcasting scenarios, which are normative, defining a specific goal at the beginning and using the scenario to show how and to what extent this goal is achievable [20]. However, scenarios represent just a range of possible future paths within fixed boundaries rather than forecasts or predictions [21]. As the scenario settings have a significant effect on model results they need to be comprehensible and transparent to be used in political decision making [22].
Researchers use both quantitative and qualitative approaches for scenario development. In quantitative approaches numerical figures, based on simplifications and assumptions, are used to describe future developments [23]. Qualitative approaches use mainly participatory methods such as interviews and stakeholder workshops to create images of the future (storylines) [24,25]. Qualitative scenarios mostly describe social, political and cultural developments, reflecting the view of participating stakeholders [26]. This kind of scenario is usually not reproducible because of the underlying individual perspectives and limitedly quantifiable factors, such as emotions and human behavior. However, the probability of realizing desired future developments is especially influenced by such social dimensions. Yet although current energy scenarios show economic and technical detail, they often lack ecological and social aspects [14,25]. In a comparison of 30 energy scenarios [27], the authors come to the result that today’s scenarios, in the presentation of possible development paths, overlap considerably and do not cover the entire range of possible future developments. Different world views, revolutions or turning points, which are completely different future visions of the energy system, are not considered in current studies. Instead, the use of standardized approaches has led to a clouded imagination and perception of reality, while a focus on more complex forward-looking factors was prevented [28].
The importance of including socioeconomic analysis into energy system modelling is illustrated by the existence and development of interdisciplinary approaches. Such approaches consider for example the combination of classical energy models with scenarios based on interviews [29] or the influence of different stakeholders on aspects of future energy systems [30,31]. An approach to link qualitative storylines and quantitative modelling is cross-impact balance (CIB) analysis, which validates the internal consistency of storylines with the help of expert knowledge [32]. Other research projects build upon CIB to develop scenarios including sustainability criteria, social barriers or political feasibility, e.g., [33]. While various approaches link quantitative energy system modelling with qualitative scenario development, local societal concerns are still neglected. Possible societal future scenarios are just described on a global scale, local ecological or societal circumstances are absent from the qualitative dimension used in energy scenario development.
Local acceptance of energy infrastructure, particularly the case of wind energy development and electricity grid expansion, is researched widely by social science. Due to the increasing public awareness for landscape preservation, an increasing demand for participation and various additional influencing parameters, wind energy expansion has become a debate in several countries. Societal reactions to wind energy should not just be perceived as a constraint for the transition to its use, but local circumstances need to be integrated in the planning process of future energy systems with high ratios of renewable energy [34]. In case of the required electricity grid expansion, conflicts often occur about the route of planned projects or questions about the need of specific grid expansion projects in general [35]. The debate about transmission grid expansion includes arguments for more decentralized electricity systems to increase participation and acceptance by reducing the number of transmission expansion projects needed [36,37]. However, next to the costs of such systems the potential for real participation needs to be discussed in more detail [38]. In [39] a conceptual approach evaluates chances and risks of high degrees of grid autarky, coming to the conclusion that support schemes serve as a good basis for self-supplying regions. In addition, it is questionable whether subnational autarky is even feasible due to the need of new renewable energy installation in densely populated areas [40].
In this paper, a methodology is implemented to analyze the transmission grid expansion required in Germany for an economic, socio-ecologic or decentralized distribution of onshore wind energy plants. The social acceptance of wind energy is being addressed by distributing future onshore wind energy plants based on a balanced burden for all German districts. The decentralized distribution approach does not address social acceptance explicitly but locates future onshore wind plants close to the places of consumption. The social acceptance of transmission grids is addressed by assessing the possibility of reducing the grid expansion need in Germany on the basis of socio-ecologic or decentralized onshore wind distribution as compared to a distribution on economic grounds.

2. Methodology and Data

The analysis in this paper is based on a combination of results from two different research projects realized by Öko-Institut in Freiburg and Europa Universität in Flensburg (University of Flensburg). In the research project “Transparenz Stromnetze” (transparency of electricity grids) [41,42], Öko-Institut developed a transmission grid expansion algorithm to implement just a specific selection of the total number of planned grid expansion projects in Germany. The selection of the required grid lines depends on the defined scenarios as regards the expansion and regional siting of conventional and renewable electricity generation installations. In the research project “VerNetzen” [43] the University of Flensburg developed socio-ecologic wind expansion scenarios based on an equal burden for all German districts (Landkreise). Based upon the results of these two research projects the grid expansion algorithm developed is applied in this analysis to three different scenarios, differing mainly in the regional distribution of onshore wind energy plants in Germany until 2030. The database of potential siting areas of future wind energy plants has been compared and adjusted between Öko-Institut and University of Flensburg in the research project “BuerGen” [44]. In the following the three wind expansion scenarios-economic, socio-ecologic and decentralized—are described, followed by the analysis of the grid expansion need that depends on the chosen scenario.

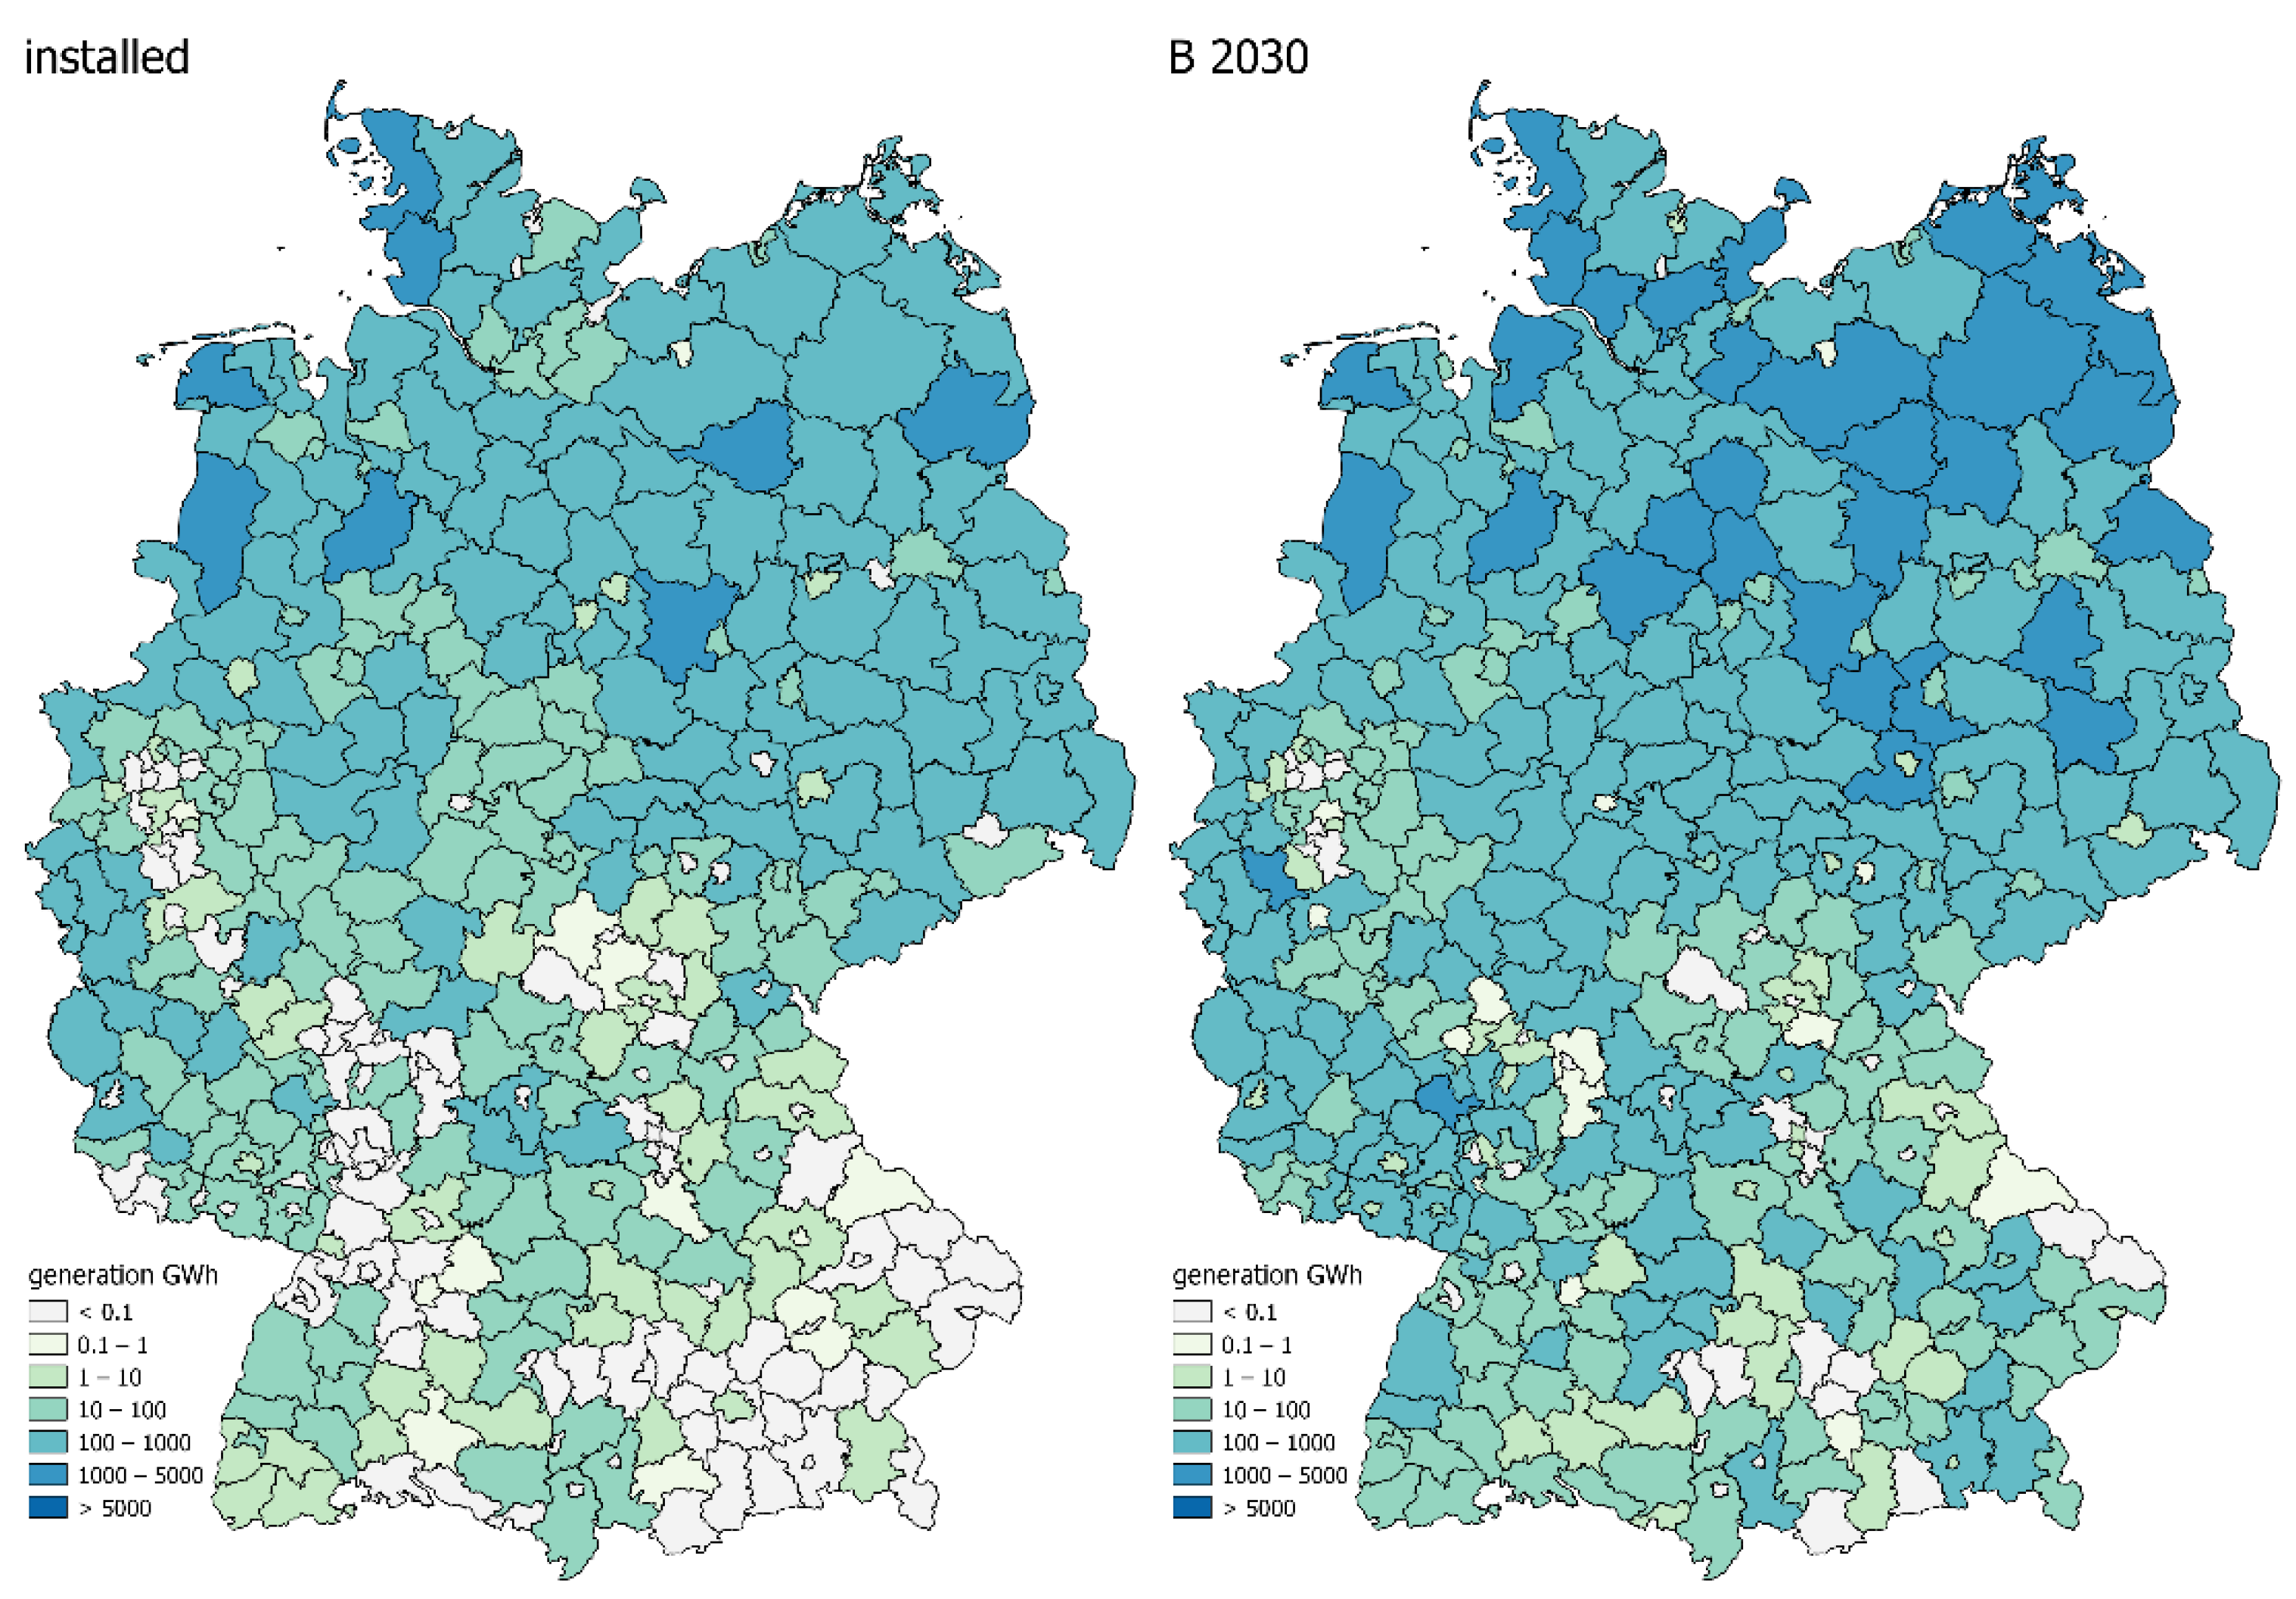
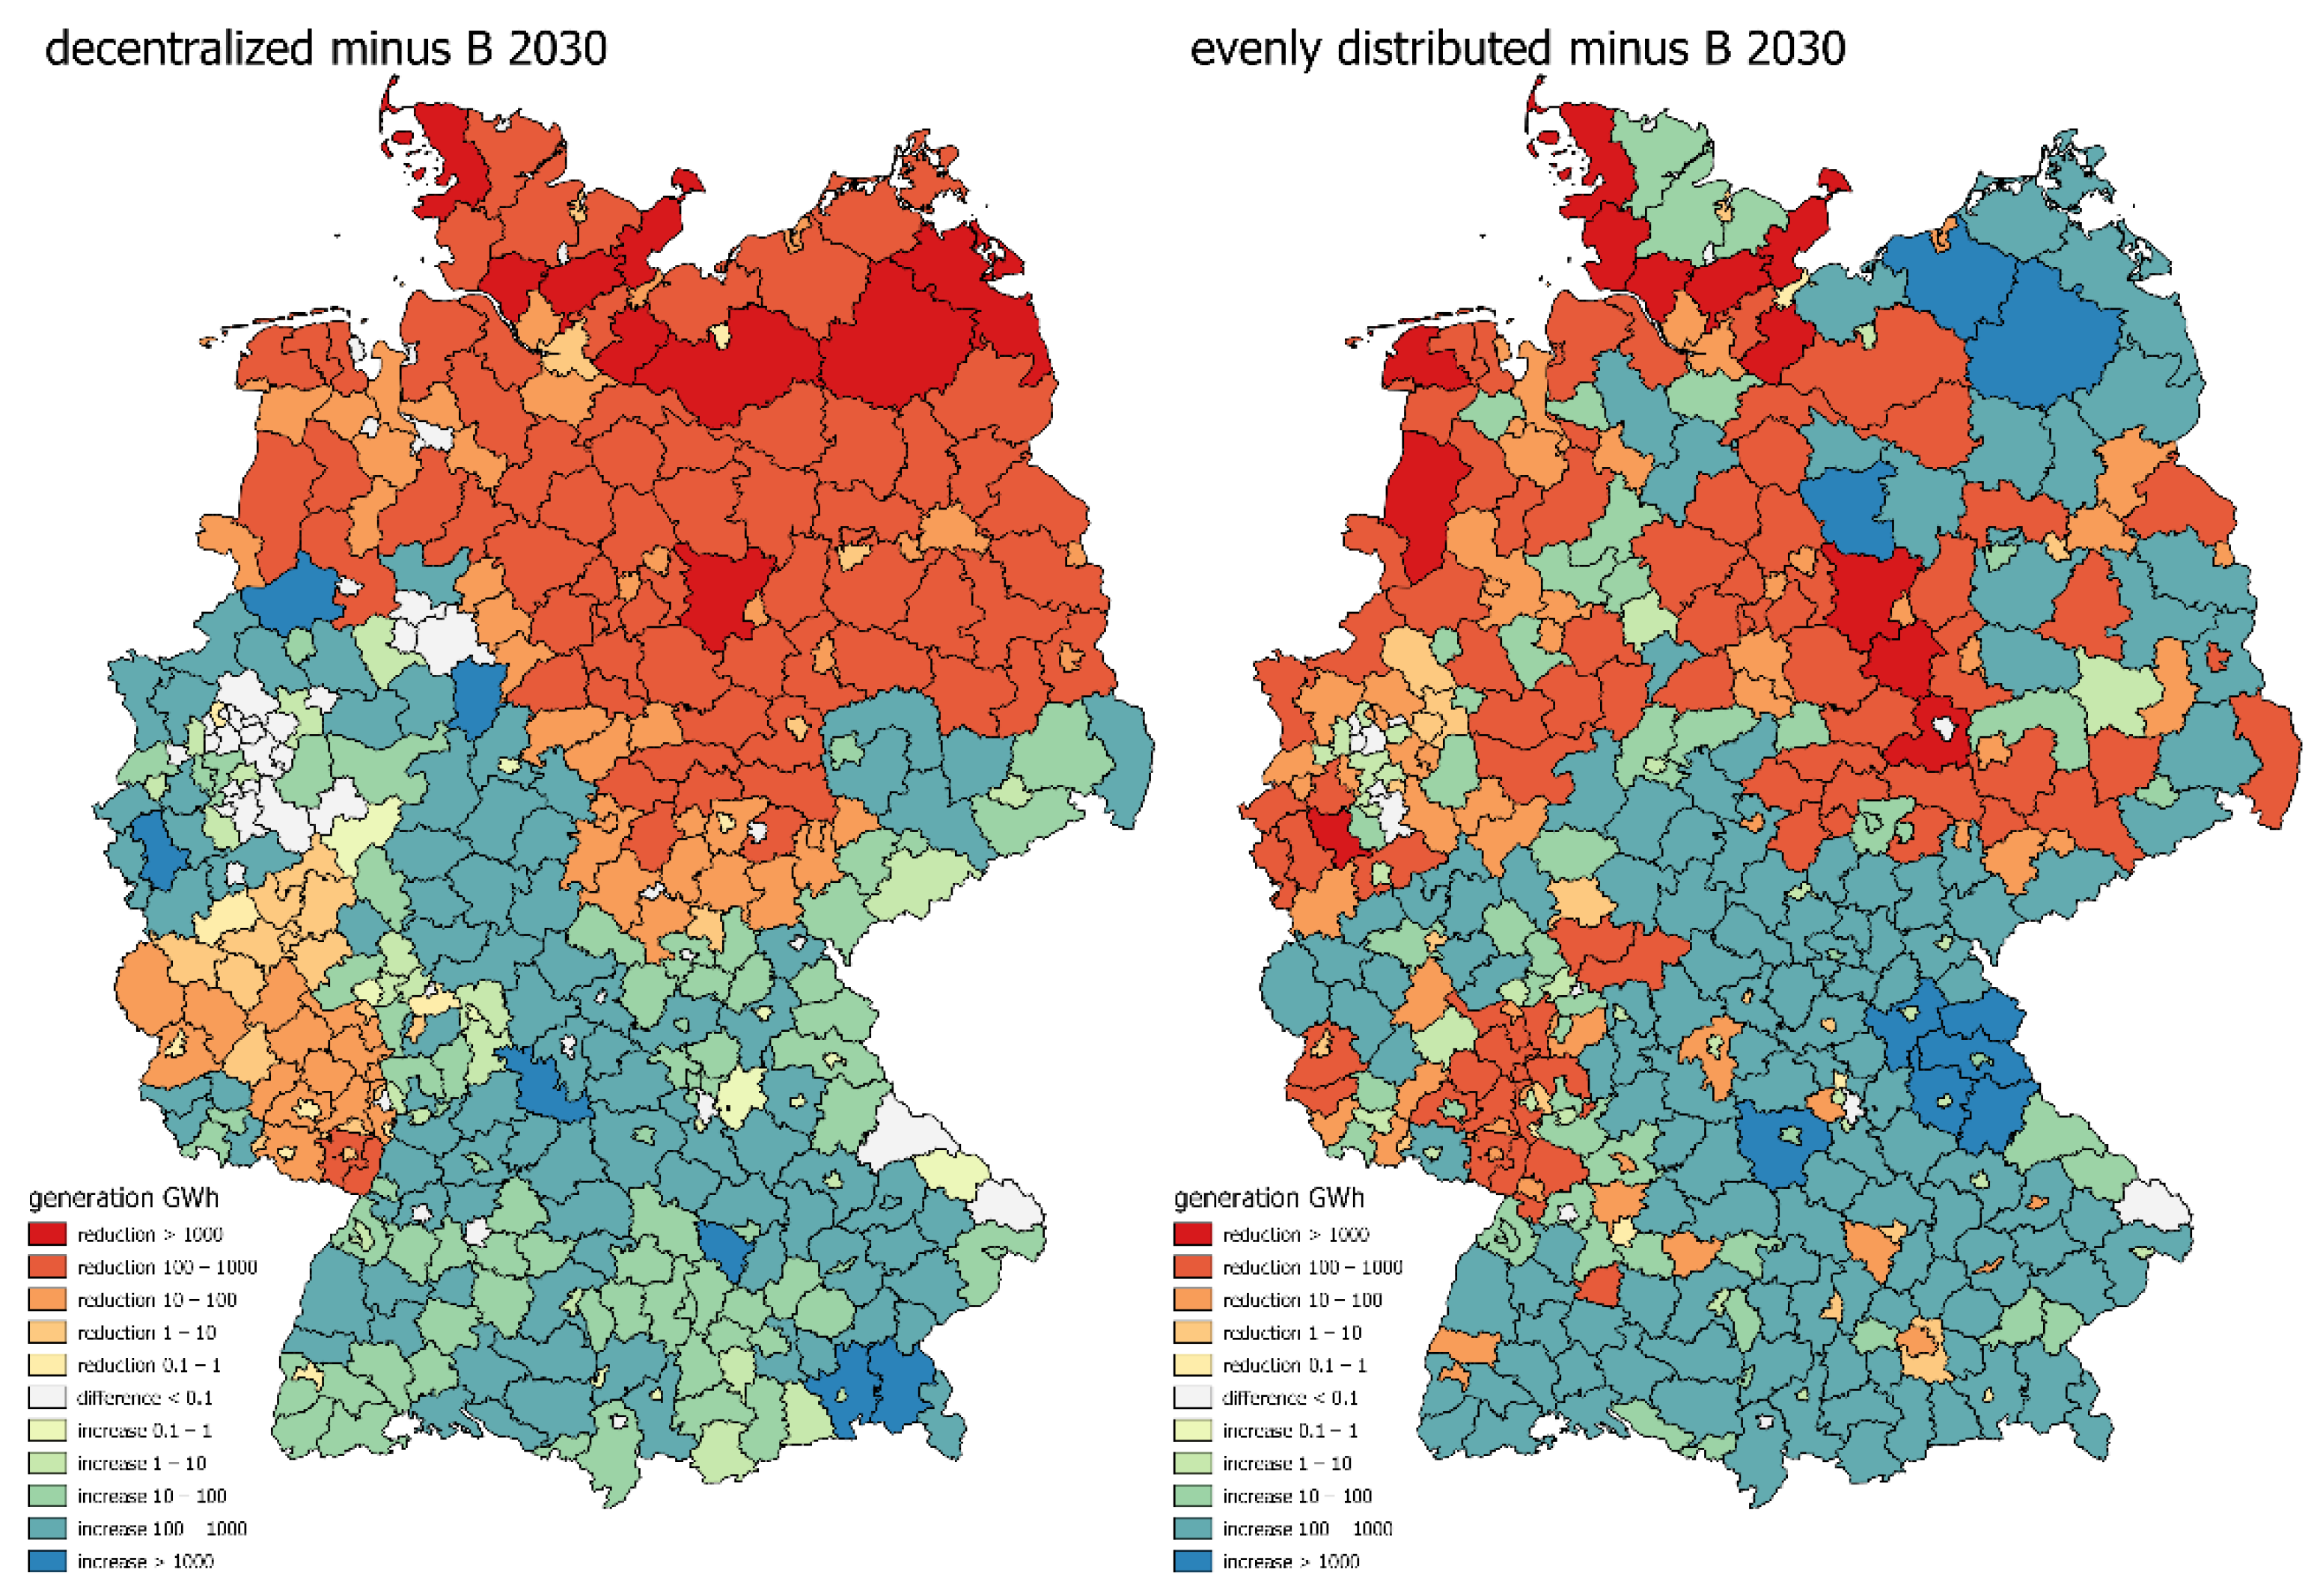
2.1. Wind Distribution Scenarios

The economic distribution of onshore wind power plants is based on the specifications for the German federal states in scenario B 2017–2030 of the national grid development plan (NEP) [45]. The planned onshore wind installations are distributed inside the federal states based on wind categories (one to five). The most efficient areas (with wind category one) are used at first, followed by areas with lower wind speeds. Based on the onshore wind production of 49 TWh in 2012, further 76 TWh are distributed mainly in northern and eastern federal states to reach the defined scenario target of 125 TWh onshore wind production in 2030.
The socio-ecologic wind expansion scenario was developed at University of Flensburg and is based on a defined “burden level” as an indicator for the socio-ecological burden placed on society due to onshore wind energy plants. The burden level is based on an analysis of parameters influencing local acceptance of onshore wind energy, which was assessed within the research project “VerNetzen” [43]. Due to the high number of wind energy projects the analysis of influencing factors was not carried out at individual project level, but at the higher level such as federal states, districts, planning regions and communities. The results were structured according to four categories [46]: technical-economic (installed wind power, expansion potential, wind conditions), socio-economic (information on regional structures, citizen wind farms, energy cooperatives, trade tax revenue), social-ecological (type of land use, nature and recreational areas, further infrastructural burdens) and political-institutional (political commitment, structure and specific features of regional planning). Regional statistics, data of federal ministries, publications on acceptance research, local media (e.g., local newspapers and TV reports) and reports from regional planning authorities and state ministries formed the basis of the research. In addition, a stakeholder analysis was carried out, including one focus group, four expert interviews and nine interviews with stakeholders from interest groups and planning authorities. In total, the analysis within the research project “VerNetzen” covers 12 (out of Germany’s 16) federal states and 27 planning regions, 48 districts and 181 municipalities. The findings of this project which identified parameters influencing local acceptance of wind energy are published in [43]. For the definition of a regional burden level, the parameters analyzed were grouped into the following categories: landscape and regional scenery, health issues, nature conservation, height of power plants, experience with wind energy so far and participation.
The range of criteria that emerged from the investigation was reviewed for key parameters regarding possible aggregations or reductions. The level of information should be retained, but it should be less region or project specific and be more general. The transferability of parameters from the object of investigation to, for example, all administrative districts in Germany is an important quality feature which would enable the use of key parameters to model the future German electricity system. As key parameters would be included in long-term scenarios, they should also be relevant in the future. The key parameters were selected on a qualitative basis. The results of the analysis of influencing factors on the social acceptance of wind energy were checked for possible standardization and transferability to all German districts. To support the qualitative selection of key parameters, additional correlation analyses were carried out based on geographical data of protected areas in Germany and regional statistical information about the environment, population, land use, tourism and taxes [47].
According to the influencing factors described, a correlation between social acceptance and the area used for wind energy can be identified. Many factors that have a negative influence on acceptance are related to the use of the available regional space. Nature reserves, nature parks, forests, bird protection areas and recreational areas for tourism describe the type and manner of a certain land use. Irrespective of whether nature reserves or forests are available as potential areas for the construction of wind energy plants, these areas, together with recreational and landscape preservation areas, are often taken as arguments against wind energy plants. Health arguments can also be seen as issues concerning space, as they are usually based on distance regulations. This results in a connection between land possibly available for wind energy and the area available for other uses for the local population. From both an ecological and social perspective, the design of regional land use can have an influence on the acceptance of wind energy. The relevance of the area used for wind energy also plays a role at the level of federal state, since targets for the expansion of wind energy are often described in terms of the percentage of the total area of the state.
In addition to the above-mentioned influencing factors regarding land use, the study showed that the involvement of the population plays a central role in the social acceptance of wind energy projects. A lack of participation can lead to problems not only at project level but even at the level of regional planning. Participation comprises formal or informal participation measures, visible as the number of concerns submitted in a planning approval process or as a measure of the activities of citizens’ initiatives in the implementation of wind farms that have already been approved. The involvement of the population can be implemented through participation in the planning process or as a benefit for the population. Such a benefit can be created with financial participation concepts for the residents, tax revenues at the community level, up to concrete financial shares of the local population in projects. To represent the population of a region, the statistical value of population density can be used.
The two indicators chosen for the definition of a burden level are the density of occupied land area for wind energy plants and the population density per district. The socio-ecologic potential area for onshore wind energy plants lies between the present burden level, calculated with the occupied area of existing wind parks and the maximum burden level, calculated by using the entire potential area.
A o c c u p i e d ,   i = P i a i ,       i R ,
b p r e s e n t ,   i = A o c c u p i e d ,   i A r e g i o n ,   i p i ,       i R ,
b m a x ,   i = A m a x ,   i A r e g i o n ,   i p i ,       i R ,
Aoccupied km2 Occupied potential area
P MW Wind capacity installed, e.g., present, max or scenario
a km2/MW Specific area used per wind capacity
R—Set of regions
b inhabitant/km2 Burden level
Amax km2 Total potential area
Aregion km2 Area of the region
p inhabitant/km2 Population density
The burden level was used to determine a balanced distribution of wind energy generation within Germany. Therefore, the technical (and economic) potential area, which is suitable for wind onshore installations is limited by the balanced burden level. No German district can surpass the balanced burden level, to assure a socio-ecologic distribution of wind installations. In regions without sufficient space to reach the balanced burden level, the expansion was limited by its total potential area to its maximum burden level.
b   i = b b a l = P b a l , i A r e g i o n , i a i   p i ,       i R b a l ,
b   i = b m a x , i ,       i { R |   b b a l > b m a x , i }
The socio-ecological distribution of the total wind production of 125 TWh in 2030 leads to a balanced burden level of 0.8 inhabitants per square kilometer. Districts with limited potential areas show lower burden levels, as they cannot reach the balanced burden, even by using the entire potential area for wind energy plants. Further information about the development of the burden level and the distribution algorithm can be found in [47,48].
The decentralized distribution follows the rule of balancing the residual load inside defined regions [42,49]. Therefore, the expansion of onshore wind as well as the regionalization of photovoltaics takes place mainly in grid regions with high electricity demands. In some regions with high loads the available potential area for wind energy is used entirely. Restrictions in local onshore wind potentials, such as the 10H rule in Bavaria which leads to a strong reduction of the onshore wind potential of about 4.2 GW there, are not considered. The total amount of 125 TWh wind onshore generation is distributed over the total German potential area for the year 2030 such as in the economic scenario and the socio-ecological scenario.
The following figures show the annual wind electricity production for each German district, depending on the wind distribution scenario (economic, socio-ecologic, decentralized). The colored scale shows the electricity production, whereby the color white shows a production of less than 0.1 GWh and dark blue of more than 5 TWh for one year. On the left side, Figure 1 shows the district specific wind production of 49 TWh for the wind power park in the year 2012, as a basis for the respective expansion methods. The right map shows the wind production per district for the economic scenario, following the scenario B 2030 of the grid development plan. The additional installation of 76 TWh to reach 125 TWh wind onshore production occurs predominantly in northern and eastern Germany.
For the decentralized scenario (distribution close to electricity demand) and the socio-ecologic scenario (even distribution based upon an equal burden level in all districts), the same wind electricity production level as in the economic B 2030 scenario of 125 TWh is assumed. Figure 2 shows the change of produced GWh wind electricity in a decentralized approach (left side) and a socio-ecologic approach (right side) compared to an economic distribution of future wind energy plants.
A decentralized distribution of wind power plants leads to a reduction of electricity production in north-eastern districts and in Rhineland-Palatinate in western Germany of 45 TWh in total (orange and red districts in left map of Figure 2). Regions with high electricity demand incur a rise of 45 TWh of wind production, such as North Rhine-Westphalia, Hesse, Saxony, Bavaria and Baden-Wuerttemberg (green and blue districts in left map of Figure 2).
In the socio-ecologic evenly distributed scenario, 52 TWh of wind production are relocated compared to the economic scenario B 2030. The wind production is reduced in some northern, eastern and western regions with high wind speeds and in regions with high population densities such as North Rhine-Westphalia and southern districts (orange and red districts in right map of Figure 2). In accordance with the consideration of homogenous burden levels, the evenly distributed scenario leads to a higher wind energy production in regions with lower population levels and larger areas appropriate for the siting of future wind energy installations and in some districts with poorer wind conditions in Bavaria and Baden-Wuerttemberg (green and blue districts in right map of Figure 2).

2.2. Market Dispatch

The market dispatch is calculated with the energy system model PowerFlex-Grid [50], which has been developed and used at Öko-Institut.
For the economic and the socio-ecological scenario the market dispatch of electricity is based on a European-wide optimization. The main function of the market dispatch minimizes the overall generation costs of electricity and the European market is only limited by Net Transfer Capacities (NTCs) between the different countries. In contrast to the European-wide market dispatch, the dispatch of electricity generation and the demand follow a decentralized approach in the decentralized scenario. The decentralized dispatch consists of three steps:
  • Step 1: Local dispatch at the level of governmental districts, excluding large power plants with more than 150 MW electrical capacity and oil-fired power plants. There is no electrical interconnection between governmental districts.
  • Step 2: Local dispatch at the level of federal states, based on power plant and storage dispatch from step 1 as minimum restriction. There is no electrical interconnection between federal states. Furthermore, a CO2-emission cap of 120 million tons for the German electricity sector must be considered.
  • Step 3: European-wide dispatch based on power plant and storage dispatch from step 2 as minimum restriction. Furthermore, a CO2-emission cap of 120 million tons for the German electricity sector has to be considered.
Due to these extensive modifications of the current market design, local electricity generation as well as local storage of electricity is strongly supported. Furthermore, electricity generation from so far unused coal-fired power plants in Germany to cover the remaining demand in Germany (step 2) and Europe (step 3) is limited by the CO2-emission cap.
In addition to the decentralized market dispatch and the optimal distribution of onshore wind and photovoltaics to smoothen the residual load in different regions, the decentralized scenario includes a lower electricity demand of about 5% compared to the economic and the socio-ecological scenario. The resulting hourly net node feed-ins from the dispatch optimization are one data input for the following grid expansion method.

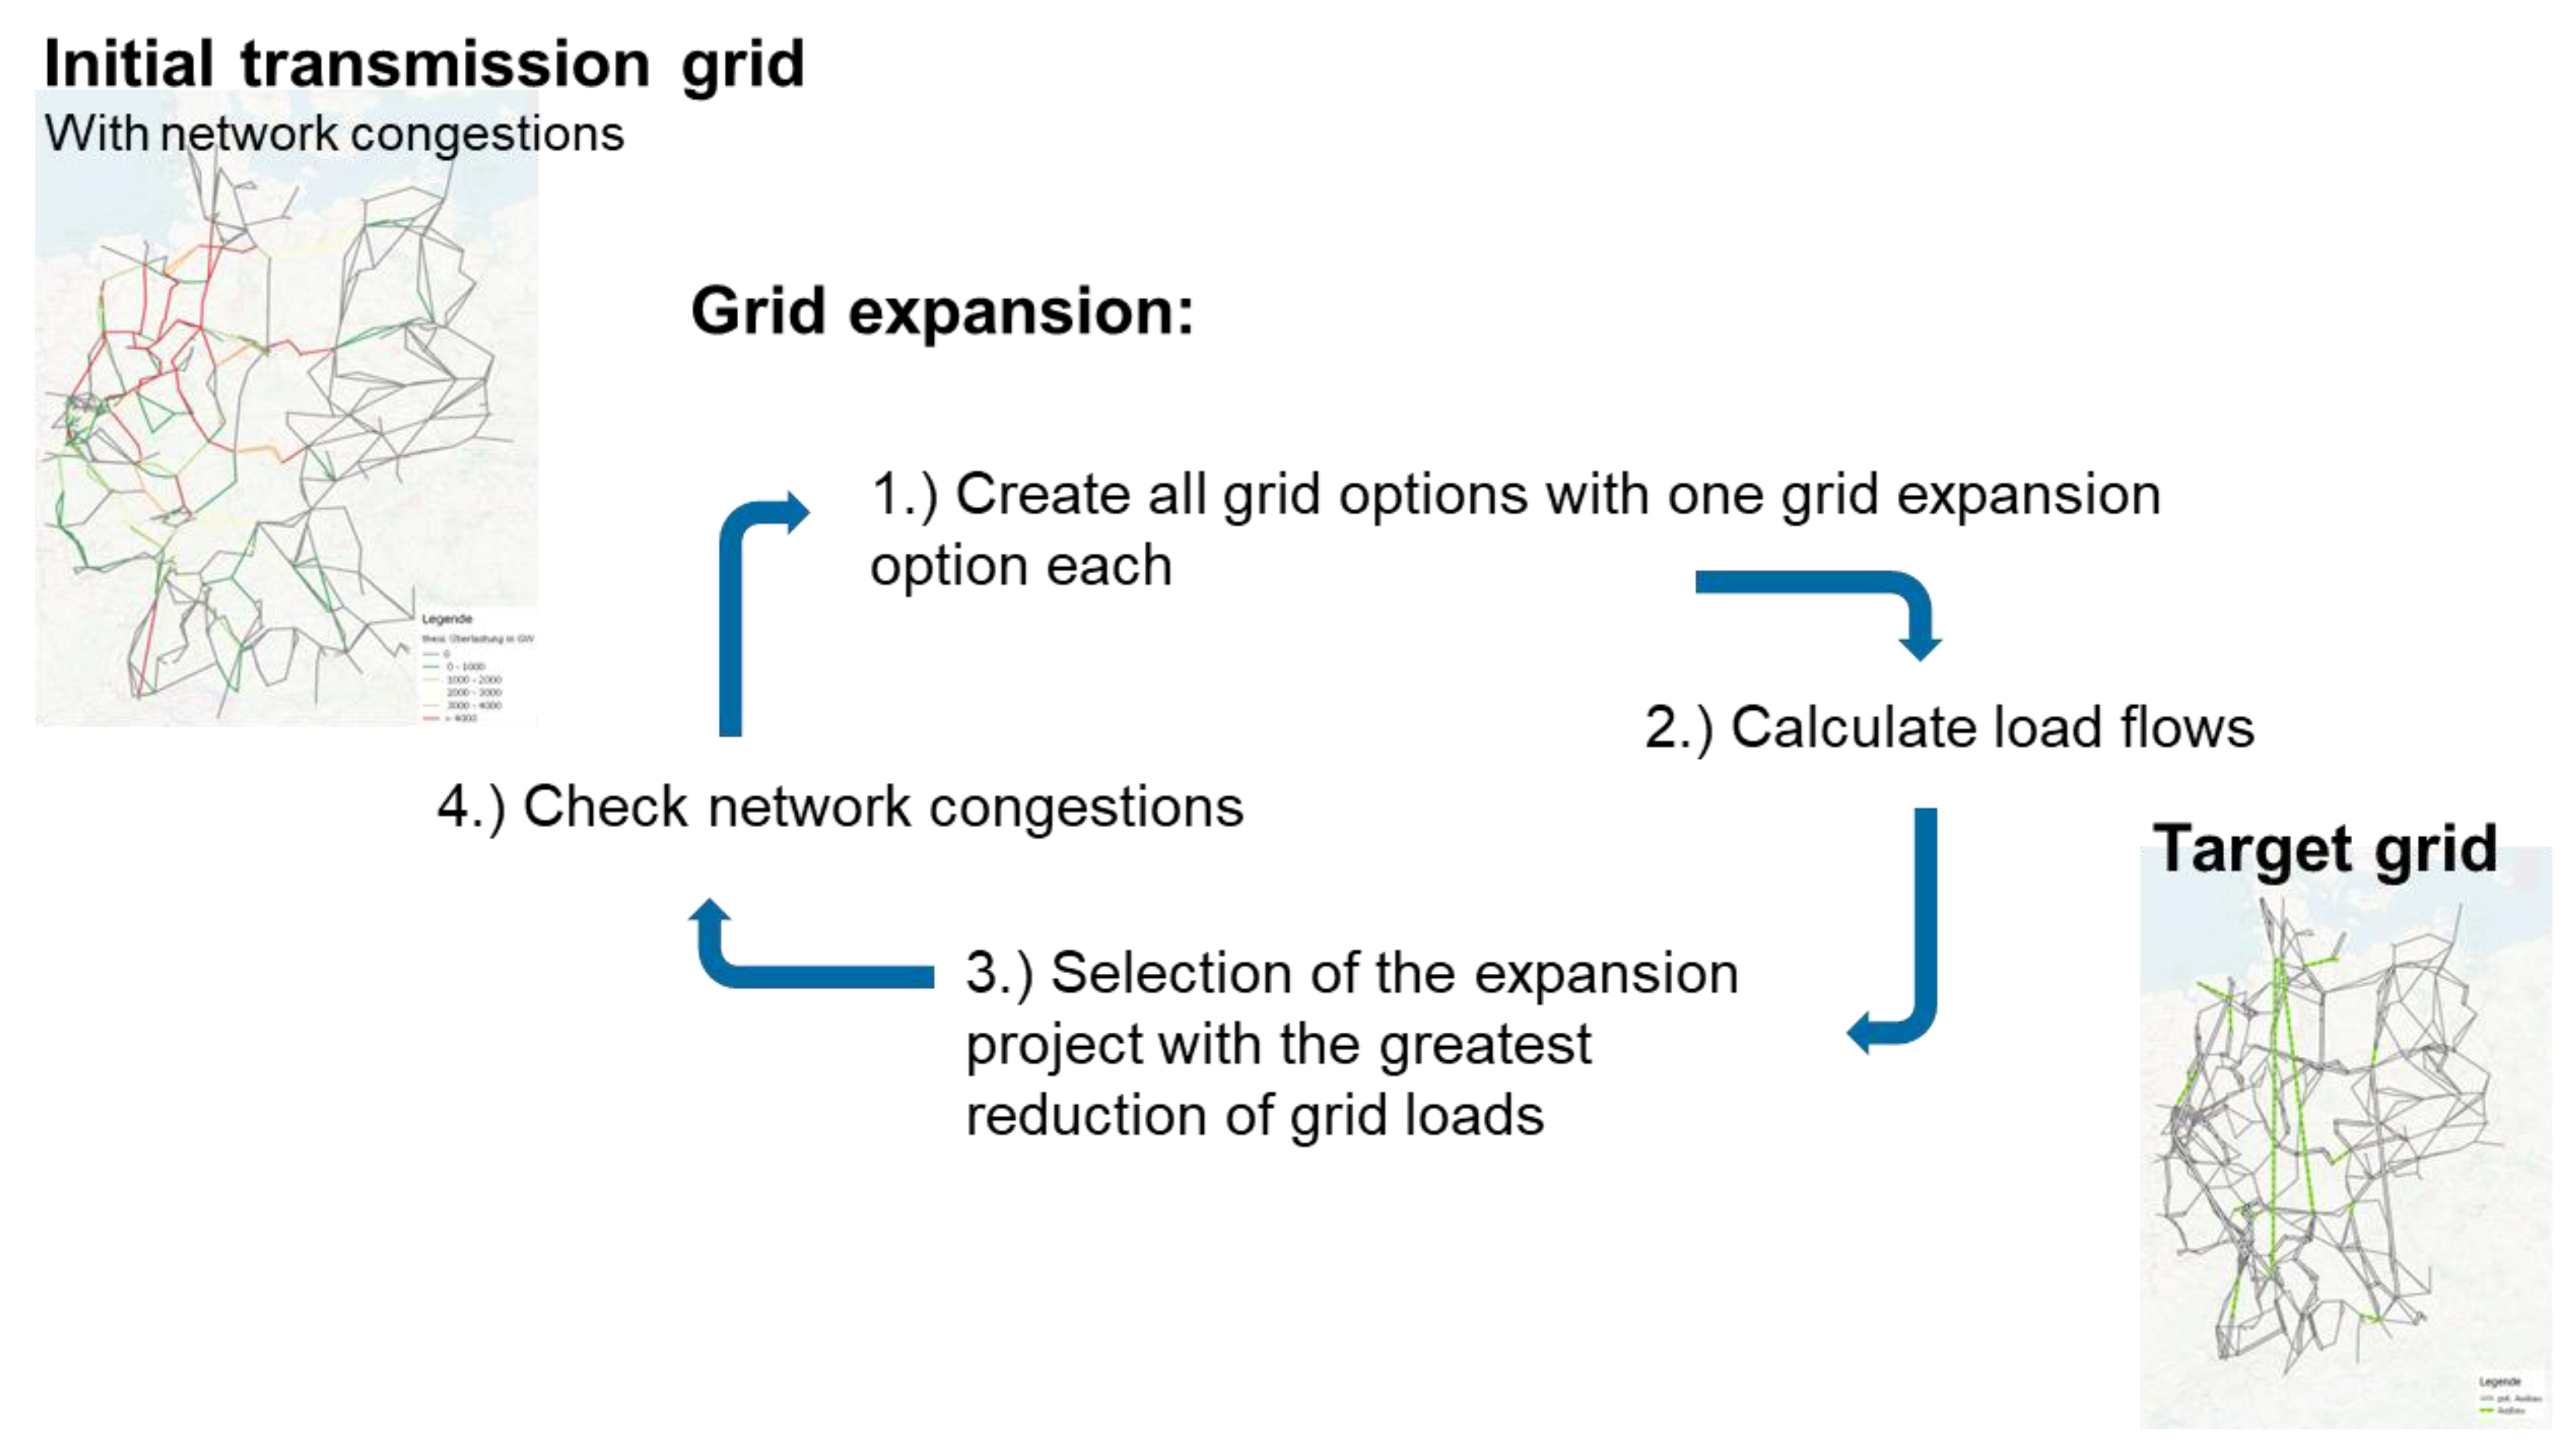
2.3. Grid Expansion Need

Based on the energy system model PowerFlex-Grid, a method has been developed to iteratively build new transmission lines according to a defined pool of planned grid expansion projects. The iterative grid expansion method gives the opportunity to estimate:
  • how many grid expansion projects need to be implemented to solve existing thermal congestions;
  • to what extent the variation of scenario assumptions influences the transmission grid expansion need;
  • which specific grid expansion projects of the defined pool grid development measures are needed, independent of the chosen scenario.
For the iterative grid expansion an initial transmission network is defined, which represents the topology and the features of the German electricity grid. The initial grid includes at least the transmission lines currently installed, and it can be expanded by network expansion measures already under construction or defined as societal consensus. The second data set is defined as several potential network expansion measures that can be added to the starting network. This data record can, for example, contain all the power grid development measures that were identified as extension measures in a scenario of the German grid development plan, and which are not part of the starting grid.
In addition, at the beginning of the iterative network expansion, the use of the starting network is required (top left in Figure 3). This is the result of a PowerFlex-Grid run prior to the iteration: With the help of the electricity market model, the market-driven actions of the electricity market players are determined at each hour of the scenario year, e.g., the regional renewable electricity feed-in, the block-unit power plant and storage uses, the use of flexibility options and electricity exchange with the neighboring countries. The hourly net node feed-ins and the load flow on the individual lines result from the electricity demand and electricity generation regionalized at extra-high voltage nodes.
Then the iterative network expansion begins, which consists of a total of four steps: In the first step, all possible network variants are formed. A grid variant consists of the respective starting grid and an allowed grid expansion measure from the grid expansion pool. In the second step, the resulting load flows are calculated including the overall overload for each of these grids while the netted node feed-ins from the upstream electricity market modelling are not changed. In the third step, the grid expansion project with the highest grid relief is selected. Finally, the fourth step checks whether the grid overload falls below the required threshold value. If the abort criterion is not yet reached, the first step is repeated and a new iteration run begins. The network expansion pool now no longer contains the previously selected network expansion project.
Once the network congestion falls below the required threshold value, the overload has been reduced to an acceptable level and there is no further need for network expansion. The iterative network expansion algorithm is terminated. The generated network is called the “target grid” (bottom right in Figure 3). The network-relieving effect can be measured by various key figures. Within the framework of this project, the hourly grid overloads o l , t on all lines for the entire year are added up as the termination criterion O . In the calculation of this key figure every network congestion is equally weighted-regardless of whether it occurs on a long or short line.
  O   = t = 1 8760 l = 1 n o l , t ,
The chosen key figure O is comparable to the “overload indices” of the German Federal Network Agency (Bundesnetzagentur) used for the evaluation process of grid expansion measures (“proof of effectiveness”). The complete evaluation process of the German Federal Network Agency includes further steps and criteria such as for example necessity and n-1 security [51].
The “construction” of a network expansion measure affects several network elements. If line l 1 is built in iteration round 1 and line l 2 was the next best network expansion alternative, then line l 3 may prove to be more suitable after line l 1 has been included in the network topology. By iteration, the next best decision can be selected based on the decisions already made. But there is still the risk of path dependencies:
If only one line is built, l 1 is proven to be the best solution, but what if the combination of l 2 + l 3 has a significantly higher effect on reducing the network congestion, while there is no line left to support the effect of l 1 ? Therefore, the iterative network expansion includes a check of path dependency: When a grid expansion decision is taken, there is still the calculation of the second and third best solution kept. In the next round, it is calculated if the network congestion can be more reduced by keeping the best or switching to the second (or third) best solution of the previous round.

3. Results

In the following section the results of the iterative network expansion will be discussed. The economic scenario “NEP B 2030” could be misunderstood as a review of the network expansion requirements defined by the transmission system operators in the German grid development plan (NEP). However, the results cannot be compared with the grid expansion requirements defined in the NEP for the following reasons:
  • The calculation of the load flow is simplified. It is assumed that there is no voltage drop between two substations and that the active resistance of a line is significantly lower than the reactance, so that no line losses occur and no reactive power must be transported.
  • The termination criterion of the iterative network expansion focuses on the aggregated annual overload of all individual lines. An analysis of the remaining maximum line overloads is then performed. The NEP does not provide an exact indication of the termination criterion used to determine the need for network expansion [52].
  • To determine the complete network expansion requirement, an (n-1) analysis should be performed after the thermal overloads have been eliminated.
  • The starting network differs from the NEP. Due to the path dependency this can lead to different results.
Due to these deviations, this analysis has been limited to the assumption that the grid expansion requirement determined in the scenario “NEP B 2030” can serve as a reference. Based on this reference, it can then be determined whether less or more network expansion is required in a decentralized or equally distributed scenario. The number of network expansion projects and the route kilometers are output key performance indicators. However, the resulting target networks cannot easily be compared with the NEP due to the restrictions listed.
The final overview will also show which network expansion projects are selected independent of the scenarios. This can be an indicator for so-called “no regret” measures, i.e., a measure that is of overarching benefit to the electricity system regardless of the chosen transformation path of the German energy transition.

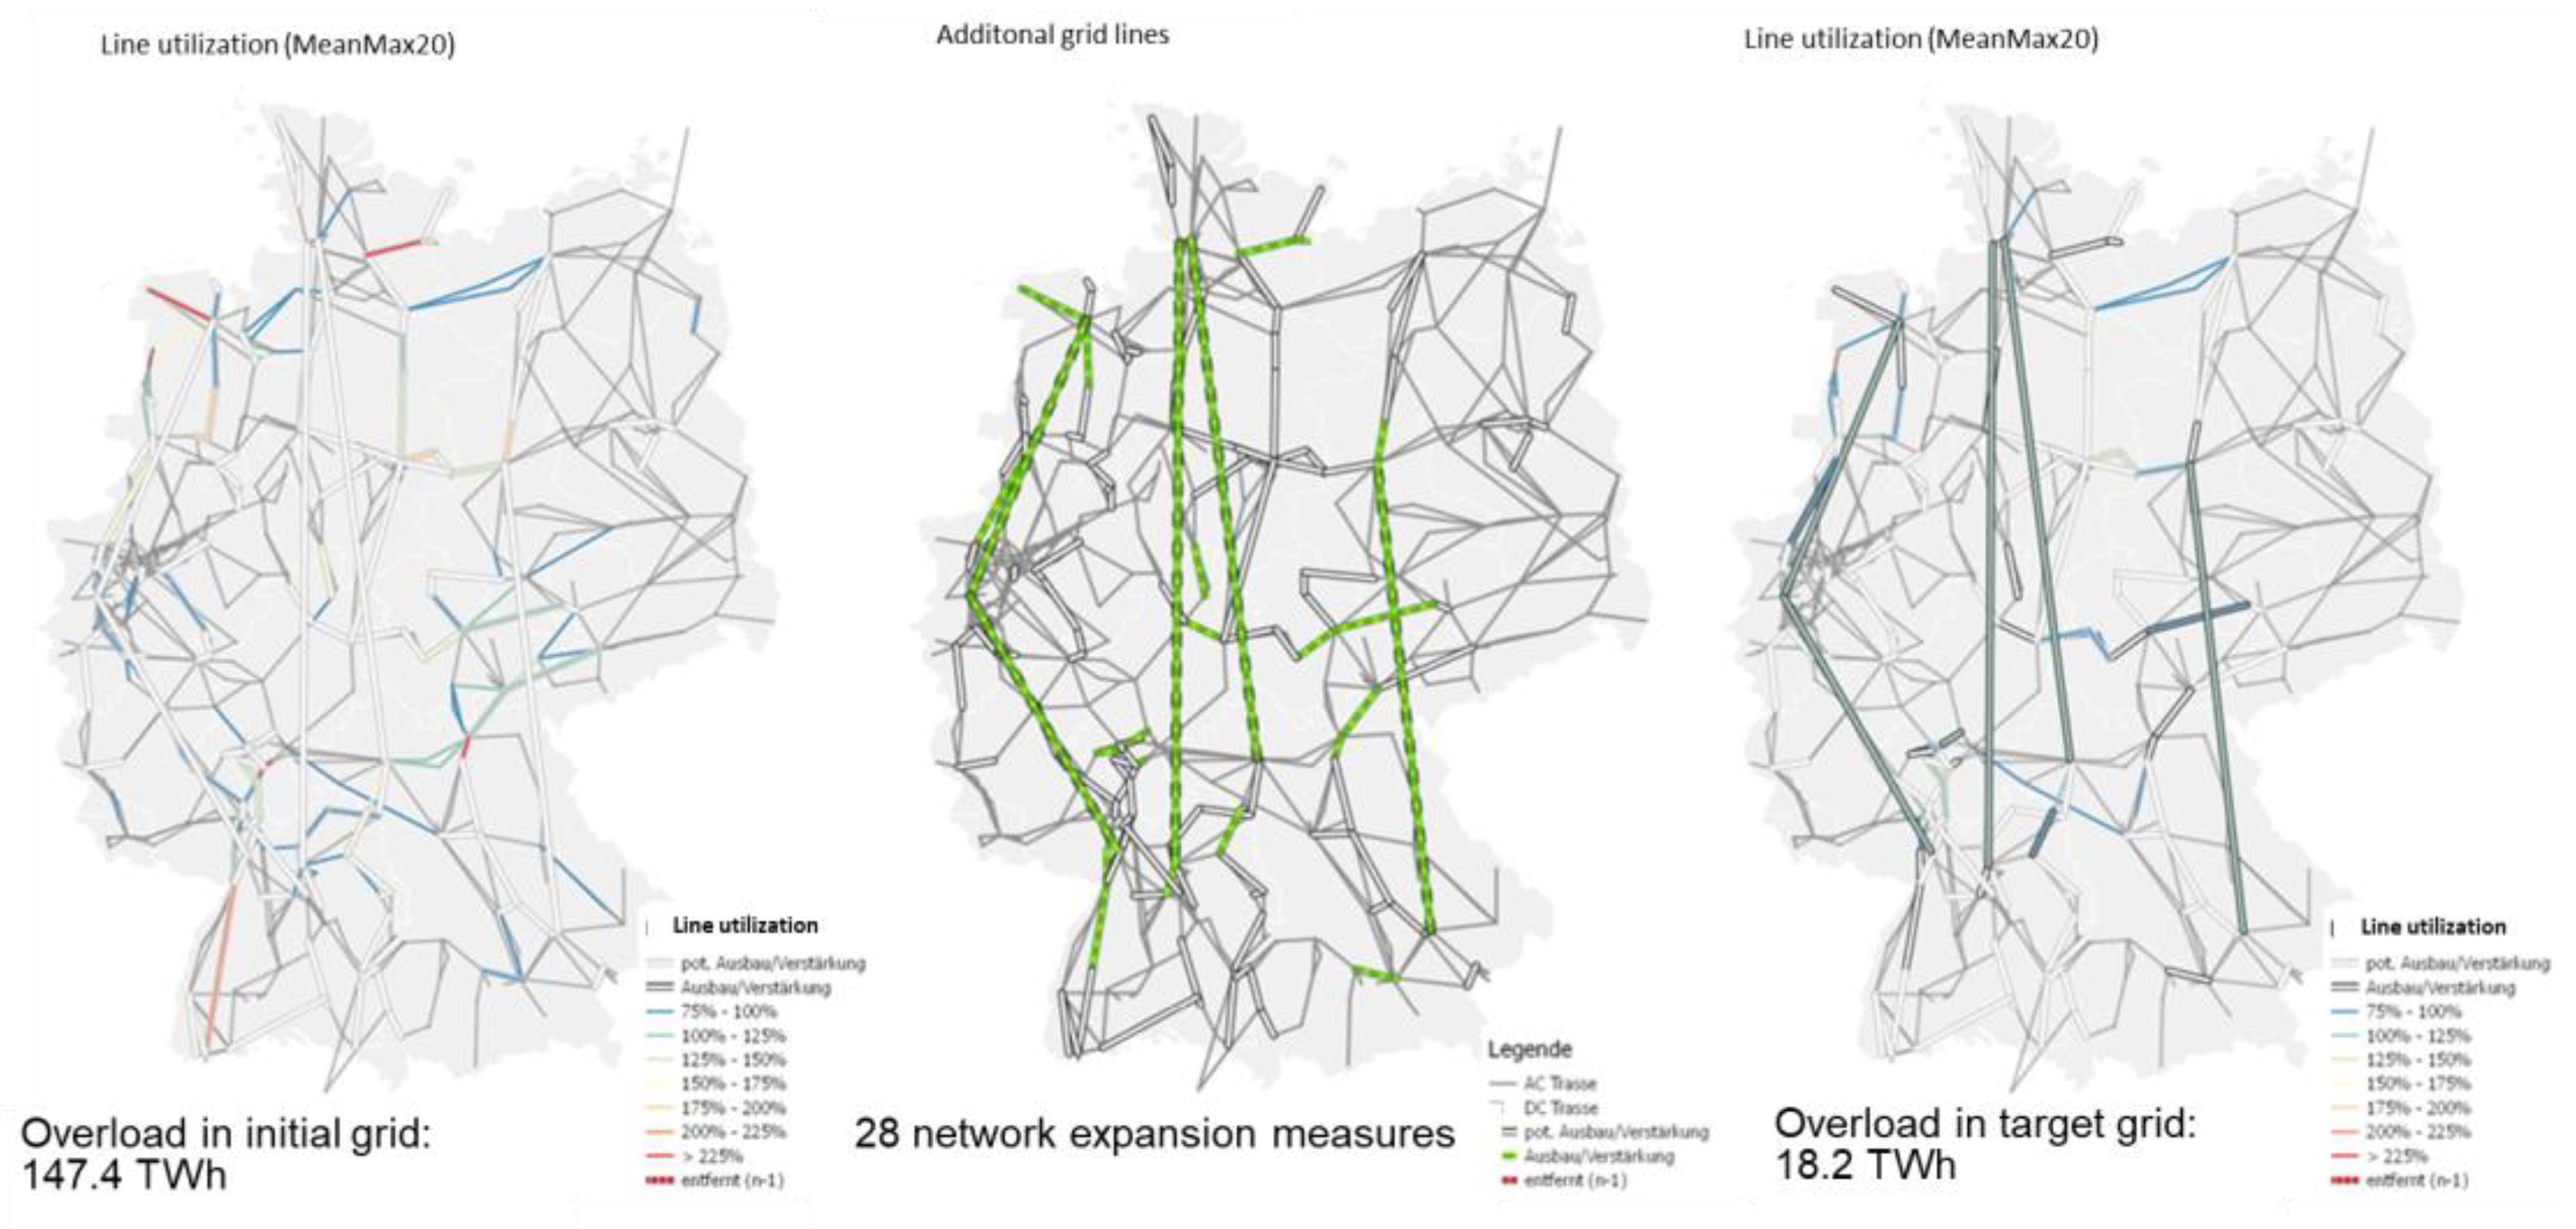
3.1. Economic Scenario-Grid Expansion Need

The electricity market modelling for the economic “NEP 2030” scenario is based on the scenario framework of the grid development plan version 2017 [53]. The net node feed-ins resulting from the modelling runs for 2030 are given as input for the calculation of the own target grid with the iterative grid expansion. In the economic scenario, 28 grid expansion projects are selected and added to the conventional grid expansion portfolio until the termination criterion is reached. In the starting grid, a total grid overload of 147.4 TWh was determined. After the 28 line expansion projects were added, the total overload was reduced to 18.2 TWh. All DC corridors available as expansion options are used. In Figure 4, the 28 selected grid expansion projects are marked in green in the middle map. These 28 network expansion projects correspond to a line expansion requirement of 2833 line kilometers.
In addition, Figure 4 shows the line load in the starting network (left map) and in the target network (right map) for the indicator “mean max 20”. This indicator was developed in the project “Transparenz Stromnetze” [42] and is defined as the route-specific mean value over the maximum 20% of the hourly line load of a year. The utilization of the individual lines is highlighted in color in Figure 4. For example, a line highlighted in red has a load factor of more than 225% regarding the “mean max 20” code, while a line highlighted in orange has a load factor of between 175% and 225%. A line is highlighted in blue if the “mean max 20” has a utilization of between 75% and 100%, if it is below 75% the line is displayed in gray. For the indicator “mean max 20” it becomes clear that the overloads in the starting network no longer occur in the target network.
Since the dimensioning of the power grid is related to the maximum line-specific overloads, a comparison of the occurring maximum loads on the individual lines is necessary in addition to considering the indicator “mean max 20”. In this case, the target network shows significantly higher overloads on the individual lines compared to the real NEP target network of the transmission grid operators. It is also clear that the NEP target network is more robust than the economic scenario B 2030 defined here: In our own target network, 90 lines are overloaded to a maximum, in the NEP target network, thermal overload greater than 100% occurs only on about 30 lines. The remaining high overloads occur on comparatively short line sections.
It can be concluded that the own target network as a result of the iterative network expansion with the construction of 28 lines or 2833 line kilometers largely eliminates the thermal overloads of the starting network. The new lines can be interpreted as having the greatest effect on reducing thermal overloads in the existing network for this scenario. Thermal overloads remain, especially on short sections of the route, which would have to be reduced by further network expansion steps.
The identified need for network expansion is limited exclusively to ensuring an (n-0)-safe network. To guarantee (n-1) safety, further network expansion is required and it should be examined whether the abort criterion of the iterative network expansion can be extended accordingly.

3.2. Socio-Ecologic Scenario-Grid Expansion Need

Using the starting grid, a total grid overload of 108.6 TWh was calculated for the hourly net node feed-in resulting from the electricity market modelling. Due to the modified distribution of the wind onshore plants alone, the grid overload in the starting grid could be reduced by about one third compared to the economic distribution. After the addition of 23 line expansion projects, the total overload was reduced from 108.6 TWh in the starting grid to 17.9 TWh in the target grid. In Figure 5, the 23 grid expansion projects selected are marked in green in the middle map. The five DC corridors available as expansion options were all implemented, and the 23 network expansion projects correspond to a line expansion requirement of 2547 line kilometers. Figure 5 also shows the line load in the starting network (left map) and in the target network (right map) for the indicator “mean max 20”. It becomes evident that the congestion in the starting network no longer occurs in the target network.
The maximum utilization rates occurring on the individual lines of the own target network in the scenario “equally distributed” are comparable with those in the economic scenario “NEP B 2030”. In comparison to the NEP target network, however, 93 lines show an overload greater than 100% and the maximum overload on a single line is also higher than the NEP target network (270%) at 327%. Compared to the economic target network, the maximum thermal overload in the equally distributed target network is higher and affects three times as many lines.
The comparison of the own target grids for the “economic” and “socio-ecologic” scenarios allows for the following conclusions as to the extent to which a more even distribution of wind onshore plants affects the identified grid expansion requirements:
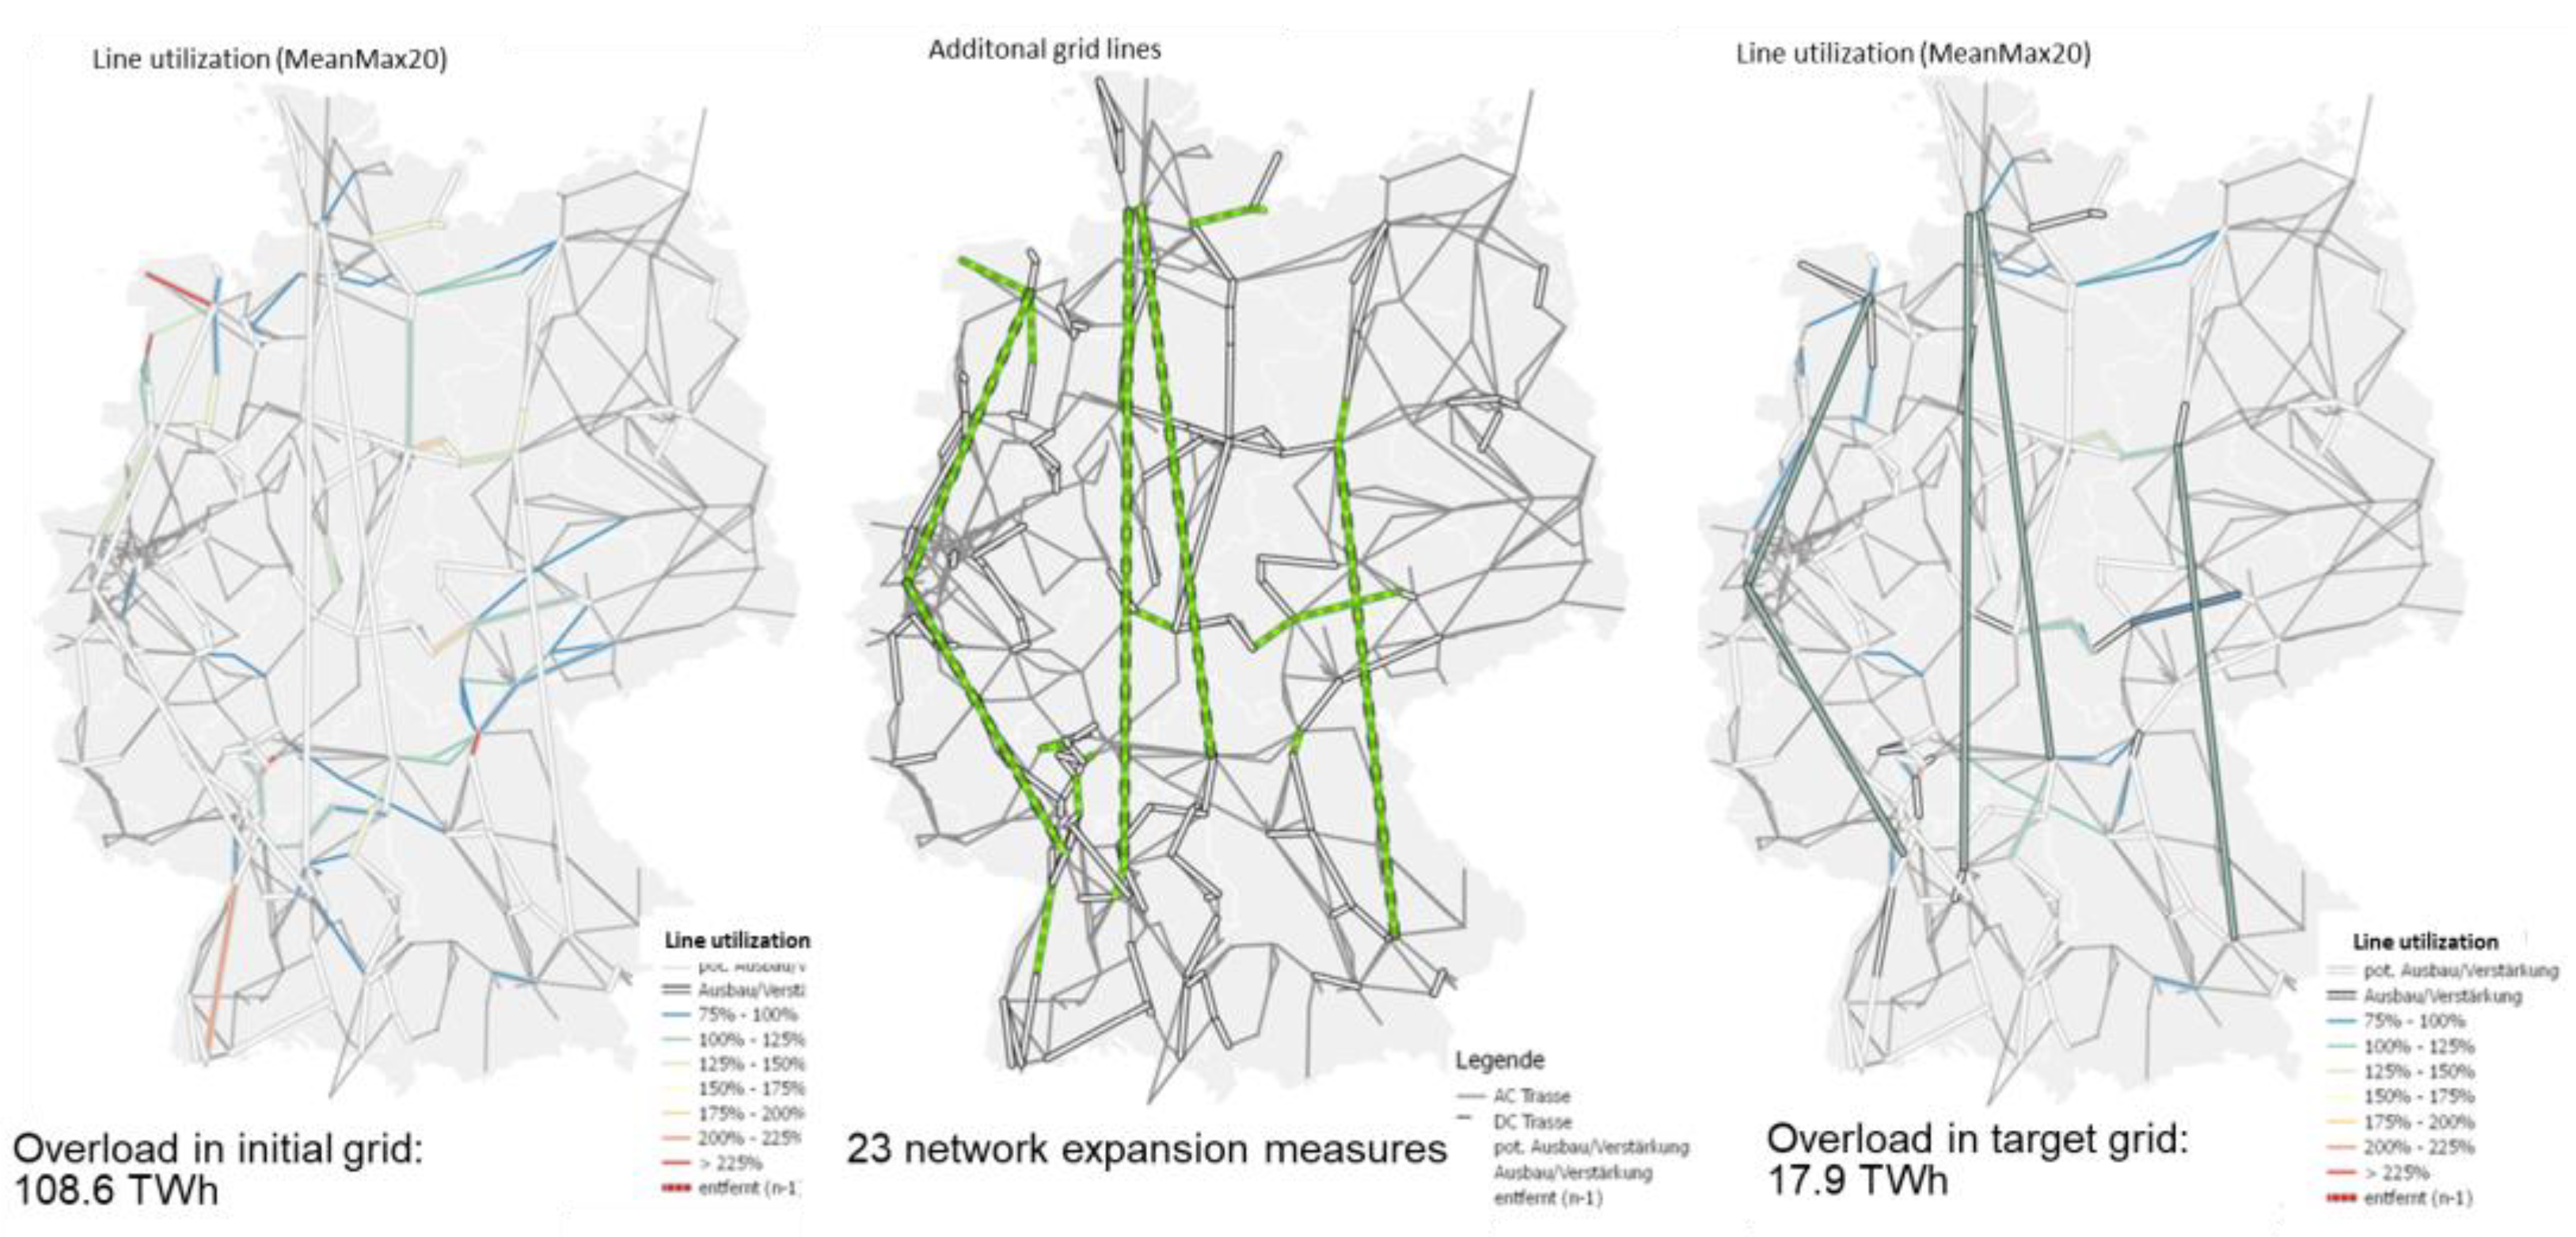
  • With regard to the network expansion requirement identified by means of the iterative network expansion, the evenly distributed socio-ecologic scenario with the requirement for 23 lines or 2547 line kilometers has a slightly lower network expansion requirement than the economic scenario (28 network expansion projects, 2833 line kilometers).
  • The equal distribution of wind-onshore plants regarding the criterion “degree of load” thus leads to an approximately 10% lower network expansion requirement than an economically optimized distribution of wind-onshore plants.
  • The remaining maximum overloads of individual lines are largely comparable in the own target networks.

3.3. Decentralized Scenario-Grid Expansion Need

The electricity market modelling for the decentralized scenario does not only include a pre-optimized load-related addition of wind onshore and PV plants, but also a three-stage procedure for a primarily local and regional balancing of generation and consumption in the sense of a cellular approach. It should be noted that the scenario used here is based on very far-reaching assumptions. For example, the regional distribution of renewable energies close to the load leads to a very high concentration of these plants near the main points of consumption, and the primarily decentralized use of plants would require considerable changes in the market design, which could have a variety of effects, including electricity prices for end consumers. The implementation of these model assumptions in practice would therefore represent a substantial challenge.
In the case of the primarily regional load coverage assumed, it should be borne in mind that decentralized balancing also takes place when there is no grid bottleneck in the electricity grid. This means that it both aims to avoid future grid expansion, and can lead to existing lines not being used as much as possible [42]. The resulting netted node feed-in thus differs significantly from the economic scenario and the socio-ecologic distribution.
Using the initial grid, a total grid overload of 58.5 TWh was calculated for the hourly net node feed-in resulting from the electricity market modelling. Thanks to the optimized construction of wind onshore and PV plants close to the load and the primarily local and regional balancing of generation and consumption, the grid congestion in the starting grid was reduced by around two thirds compared to the economic scenario and by around half compared to the socio-ecologic scenario. In the decentralized scenario, only six grid expansion projects are selected and added until the termination criterion is reached. Two of these grid expansion measures are DC corridors. Following the addition of these six line expansion projects, the total grid overload will decrease from 58.5 TWh in the starting grid to 16.4 TWh in the target grid. The selected network expansion projects add up to a total line expansion requirement of 975 route kilometers. In Figure 6, the six selected grid expansion projects are marked in green in the middle map.
The maximum loads occurring on the individual lines of the own target network are less significant in the “decentralized” scenario than in the socio-ecologic and the economic scenario. In comparison to the NEP target network, however, 70 lines show an overload greater than 100% and the maximum overload on a single line is 315%, which is also higher than the NEP target network (270%).

4. Discussion

In a future world that largely corresponds to the economic scenario NEP B 2030 of the grid development plan, DC lines prove to be particularly relevant for reducing thermal overloads in the power grid. Without them, or without appropriate substitutes in the AC grid, no bottleneck-free grid can be guaranteed for the scenario. The need for grid expansion is particularly driven by the construction of wind power plants in northern Germany and the demand for electricity in southern Germany.
For the socio-ecological scenario, it was shown that a distribution of wind-onshore plants based upon a local burden level has a reducing effect on the need for grid expansion compared to an economically optimized site selection, as specified in the economic scenario. The course of the added lines follows the economic scenario, although at a reduced level regarding the total annual line overload. The lower need for grid expansion is due to an economically suboptimal choice of location for wind power plants.
The decentralized scenario requires significantly less grid expansion than the economic and the socio-ecological scenario. The low need for grid expansion is contrasted by a high concentration of wind power plants close to the main points of consumption and considerable changes in market design due to the primarily decentralized use of plants.
In general, it can be stated that at the beginning of the iterative network expansion, the total annual line congestion decreases strongly and then at a certain point decreases no longer. This effect becomes particularly clear when comparing not the cumulative line length, but the number of lines added. As a working hypothesis, it is assumed that some of these lines do not have a positive effect on the selected termination criterion but are necessary to achieve (n-1) safety. In addition, after reaching the termination criterion, maximum line loads of more than 100% remain on about 60 to 90 lines of the own target network, whereas this is only the case with 30 lines in the NEP target network.
Further research needs to be undertaken if the (n-1) criterion is included in the iterative network expansion. This criterion must be further developed so that the target network is (n-1) secure. In addition, the abort criterion of the algorithm should be varied to improve the results. The abort criterion could, for example, consider the maximum line loads on individual lines additionally. If we squared the resulting overloads and tried to minimize them, high overloads on single power lines would be avoided first which might be preferable.
The line length or the costs of line construction could also be considered when selecting the next network expansion element, so that the line with the highest benefit per line kilometer or per line cost is selected. The parameter “line kilometer” can also be an indicator of land use.
Following grid development, an investment comparison should be made between saved grid expansion on the one hand and additional investment requirements elsewhere, e.g., for additional wind turbines due to economically less efficient locations.
It is important to note here, that the described scenarios do not illustrate the acceptance of wind energy within German regions but give a methodologic approach to address possible effects due to societal circumstances within energy system models. Within this research the actual acceptance of the developed “socio-ecologic” distribution of wind energy plants on the basis of an equal distribution of the “burden” has not been evaluated. It cannot be stated that an equal burden level would increase social acceptance, it is mainly an approach to assess the effect of a hypothetical “fair” distribution of wind installations on the energy system. The described burden level is based on only two parameters and should be extended by more data representing societal concerns. Therefore, more qualitative analysis and data collection throughout all German regions is needed. The here described approach does only tackle the distribution of wind energy. For a holistic approach to analyze the influence of local acceptance on the energy transition, other technologies such as photovoltaic or biomass need to be considered as well. The developed burden level can be used as a methodological basis to be extended to other technologies. As present acceptance issues particularly occur concerning the installations of wind energy or transmission grids, the approach to only address these technologies seems appropriate to develop a first way to tackle socio-ecologic issues in general within energy system models.
In current discussions about central or decentral energy systems, decentral approaches are often told to be more accepted by the society. A decentral distribution of renewable plants does however not consider per se societal aspects. Concerning the acceptance of wind energy, a socio-ecologic distribution approach might have stronger positive impact on local acceptance than the location of installations close to electricity consumption. Regarding the grid expansion need, the results show that an actual reduction of the grid expansion need can only be achieved by a throughout decentral approach including regional market optimizations.

5. Conclusions

Political decisions on the design of the future energy system are often based on simulation results. The methodology developed here offers a first approach to enable considering local socio-ecological aspects in simulation calculations in addition to technical and economic criteria. Thus, social concerns can be integrated into technical-economically oriented political decisions.
The results have shown that the regional distribution of future wind energy plants can play a significant role for the need of new electricity transmission lines in Germany. The equal distribution of future wind energy plants in the socio-ecologic scenario regarding a balanced burden level in all German districts, led to a grid expansion need which is 10% lower than an economic distribution. Hence it does not differ significantly from the economic scenario, and thus the officially pursued grid expansion in the grid development plan. A natural interpretation of this result leads to the conclusion that the grid expansion projects currently planned in Germany are mostly needed, even if future wind energy plants are distributed on less efficient sites on a more equal scale with regard to socio-ecologic circumstances. The consideration of local socio-ecologic criteria and a possible associated redistribution of future generation technologies need not necessarily lead to modified network planning. Accordingly, it may be worthwhile to use less efficient locations for reasons such as acceptance since this can further advance the energy transition and might only cause limited disadvantages from an economic perspective.
The results of the decentralized scenario are not directly comparable to the economic and the socio-ecological scenario. In addition to the different distribution of onshore wind, major constraints concerning the decentralized market dispatch as well as the optimized regionalization of photovoltaics and the reduction of electricity demand must be taken into account. On the one hand, the required grid expansion is significantly reduced in the decentralized scenario compared to the economic and the socio-ecological scenario. However, on the other hand, electricity generation becomes more expensive due to the assumed market rules, and additional wind power capacity is needed due to less efficient locations for onshore wind plants.
The results show to what extent the regional distribution of generation plants can influence the future grid expansion. The socio-ecologic scenario provides an opportunity to consider the effect of local acceptance issues within the current planning framework while maintaining the focus of an economic energy transition. The regionalization of onshore wind represents a sensitive parameter influencing grid expansion planning. This sensitivity should move more into focus inside the procedure of the current grid development plan by varying the distribution of renewable installations within Germany. For the consideration of acceptance in energy system models the here described approach to include socio-ecologic aspects in the scenario process by distributing power plants concerning local burden levels shows an opportunity to include qualitative dimensions in quantitative energy system models. The effect of the, compared to the economic scenario, less efficient locations of future wind power plants on the energy system and the needed grid expansion is relatively small regarding a 100% renewable energy system in Germany until 2050. For an actual reduction of the planned grid expansion projects in Germany there is not just a more regional siting of wind power plants of importance, but likewise the share of solar power and especially the level of optimization (within regions or on EU level). To what extend decentral approaches for a German energy system until 2050 are more accepted within the society and how far the reduction of grid expansion does increase the acceptance cannot be answered within this analysis.
Future work on this research line could improve the iterative grid expansion algorithm by integrating the (n-1) criterion as well as varying the termination criterion. Another goal is to generalize this method in order to be able to transfer it to other renewable energies and storage capacities. To this end, an investigation of the actual social acceptance of other renewable energies would also be helpful. Regarding the definition of potential areas for wind energy plants, future work should focus on land use conflicts and the potential of repowering. In order to better integrate acceptance aspects into the planning process, a simplified methodology might be of interest. Finally, there will be some remaining inequities resulting from the distribution of renewables, storage capacities and the electricity grid. How these should be addressed needs to be discussed.

Author Contributions

Conceptualization, M.W., F.F. and M.K.; methodology, F.F., M.W. and M.K.; software, F.F. and M.W.; validation, M.K.; writing-original draft preparation, M.W.; writing-review and editing, F.F. and M.K.; visualization, F.F. All authors have read and agreed to the published version of the manuscript.

Funding

This research was funded by Federal Ministry of Education and Research in the funding program “Environmentally and Socially Compatible Transformation of the Energy”, grant number 01UN1701A.

Institutional Review Board Statement

Not applicable.

Informed Consent Statement

Not applicable.

Data Availability Statement

Not applicable.

Acknowledgments

We acknowledge the support of Christian Winger, Martin Soethe, Melanie Degel and Clemens Wingenbach who helped to develop the basic idea in previous projects.

Conflicts of Interest

The authors declare no conflict of interest.

References

  1. Lund, H.; Mathiesen, B.V. Energy system analysis of 100% renewable energy systems—The case of Denmark in years 2030 and 2050. Energy 2009, 34, 524–531. [Google Scholar] [CrossRef]
  2. Bundesregierung, D. Bilanz zur Energiewende. Berlin. 2015. Available online: https://www.bundesregierung.de/resource/blob/974430/438096/18fd7dc41876b13597a1fd151c186cb9/2015-03-23-bilanz-energiewende-2015-data.pdf?download=1 (accessed on 6 August 2021).
  3. Ommen, T.; Markussen, W.B.; Elmegaard, B. Comparison of linear, mixed integer and non-linear programming methods in energy system dispatch modelling. Energy 2014, 74, 109–118. [Google Scholar] [CrossRef]
  4. Baños, R.; Manzano-Agugliaro, F.; Montoya, F.G.; Gil, C.; Alcayde, A.; Gómez, J. Optimization methods applied to renewable and sustainable energy: A review. Renew. Sustain. Energy Rev. 2011, 15, 1753–1766. [Google Scholar] [CrossRef]
  5. Jebaraj, S.; Iniyan, S. A review of energy models. Renew. Sustain. Energy Rev. 2006, 10, 281–311. [Google Scholar] [CrossRef]
  6. Bale, C.S.E.; Varga, L.; Foxon, T.J. Energy and complexity: New ways forward. Appl. Energy 2015, 138, 150–159. [Google Scholar] [CrossRef] [Green Version]
  7. Pfenninger, S.; Hirth, L.; Schlecht, I.; Schmid, E.; Wiese, F.; Brown, T.; Davis, C.; Gidden, M.; Heinrichs, H.; Heuberger, C.; et al. Opening the black box of energy modelling: Strategies and lessons learned. Energy Strategy Rev. 2018, 19, 63–71. [Google Scholar] [CrossRef]
  8. Pfenninger, S.; Hawkes, A.; Keirstead, J. Energy systems modeling for twenty-first century energy challenges. Renew. Sustain. Energy Rev. 2014, 33, 74–86. [Google Scholar] [CrossRef]
  9. Lopion, P.; Markewitz, P.; Robinius, M.; Stolten, D. A review of current challenges and trends in energy systems modeling. Renew. Sustain. Energy Rev. 2018, 96, 156–166. [Google Scholar] [CrossRef]
  10. Hausl, S.; Biberacher, M. Räumliche Aspekte in der regionalen Energiesystemoptimierung. In Geoinformationssysteme. Beiträge zum 17. Münchner Fortbildungsseminar 2012; Wichmann: Karlsruhe, Germany, 2012; pp. 290–305. [Google Scholar]
  11. Hanson, B.; Sugden, A.; Alberts, B. Making Data Maximally Available. Science 2011, 331, 649. [Google Scholar] [CrossRef] [Green Version]
  12. DeCarolis, J.F.; Babaee, S.; Li, B.; Kanungo, S. Modelling to generate alternatives with an energy system optimization model. Environ. Model. Softw. 2016, 79, 300–310. [Google Scholar] [CrossRef] [Green Version]
  13. Fehr, J.; Heiland, J.; Himpe, C.; Saak, J. Best practices for replicability, reproducibility and reusability of computer-based experiments exemplified by model reduction software. AIMS Math. 2016, 1, 261–281. [Google Scholar] [CrossRef]
  14. Mai, T.; Logan, J.; Blair, N.; Sullivan, P.; Bazilian, M. RE-ASSUME—A Decision Maker’s Guide to Evaluating Energy Scenarios, Modeling, and Assumptions. 2013. Available online: http://iea-retd.org/wp-content/uploads/2013/07/RE-ASSUME_IEA-RETD_2013.pdf (accessed on 6 August 2021).
  15. Sovacool, B.K. What are we doing here? Analyzing fifteen years of energy scholarship and proposing a social science research agenda. Energy Res. Soc. Sci. 2014, 1, 1–29. [Google Scholar] [CrossRef]
  16. Enevoldsen, P.; Sovacool, B.K. Examining the social acceptance of wind energy: Practical guidelines for onshore wind project development in France. Renew. Sustain. Energy Rev. 2016, 53, 178–184. [Google Scholar] [CrossRef]
  17. Wüstenhagen, R.; Wolsink, M.; Bürer, M.J. Social acceptance of renewable energy innovation: An introduction to the concept. Energy Policy 2007, 35, 2683–2691. [Google Scholar] [CrossRef] [Green Version]
  18. AEE. Akzeptanzumfrage 2015: Die deutsche Bevölkerung will mehr Erneuerbare Energien. 2015. Available online: https://www.unendlich-viel-energie.de/media/file/416.AEE_RenewsKompakt_Akzeptanzumfrage2015.pdf (accessed on 6 August 2021).
  19. Sovacool, B.K. Energy studies need social science. Nature 2014, 511, 529–530. [Google Scholar] [CrossRef]
  20. Börjeson, L.; Höjer, M.; Dreborg, K.-H.; Ekvall, T.; Finnveden, G. Scenario types and techniques: Towards a user’s guide. Futures 2006, 38, 723–739. [Google Scholar] [CrossRef]
  21. Dieckhoff, C.; Eberspächer, A. Consulting with Energy Scenarios—Requirements for Scientific Policy Advice. 2016. Available online: https://www.researchgate.net/publication/298208270_Consulting_with_energy_scenarios_Requirements_for_scientific_policy_advice/link/56e6c77008ae65dd4cc1cf5e/download (accessed on 6 August 2021).
  22. acatech. Mit Energieszenarien gut Beraten. Anforderungen an Wissenschaftliche Politikberatung. 2015. Available online: https://www.leopoldina.org/uploads/tx_leopublication/2015_12_Stellungnahme_Energieszenarien.pdf (accessed on 6 August 2021).
  23. Varho, V.; Tapio, P. Combining the qualitative and quantitative with the Q2 scenario technique—The case of transport and climate. Technol. Forecast. Soc. Chang. 2013, 80, 611–630. [Google Scholar] [CrossRef]
  24. Dieckhoff, C.; Appelrath, H.-J.; Fischedick, M.; Grunwald, A.; Höffler, F.; Mayer, C.; Weimer-Jehle, W. Zur Interpretation von Energieszenarien (Schriftenreihe Energiesysteme der Zukunft), München. 2014. Available online: http://www.leopoldina.org/uploads/tx_leopublication/2014_ESYS_Energieszenarien.pdf (accessed on 6 August 2021).
  25. Schubert, D.K.J.; Thuß, S.; Möst, D. Does political and social feasibility matter in energy scenarios? Energy Res. Soc. Sci. 2015, 7, 43–54. [Google Scholar] [CrossRef]
  26. Söderholm, P.; Hildingsson, R.; Johansson, B.; Khan, J.; Wilhelmsson, F. Governing the transition to low-carbon futures: A critical survey of energy scenarios for 2050. Futures 2011, 43, 1105–1116. [Google Scholar] [CrossRef]
  27. Laugs, G.A.H.; Moll, H.C. A review of the bandwidth and environmental discourses of future energy scenarios: Shades of green and gray. Renew. Sustain. Energy Rev. 2017, 67, 520–530. [Google Scholar] [CrossRef]
  28. Jefferson, M. Closing the gap between energy research and modelling, the social sciences, and modern realities. Energy Res. Soc. Sci. 2014, 4, 42–52. [Google Scholar] [CrossRef]
  29. Trutnevyte, E.; Stauffacher, M.; Schlegel, M.; Scholz, R.W. Context-Specific Energy Strategies: Coupling Energy System Visions with Feasible Implementation Scenarios. Environ. Sci. Technol. 2012, 46, 9240–9248. [Google Scholar] [CrossRef]
  30. Hughes, N.; Strachan, N.; Gross, R. The structure of uncertainty in future low carbon pathways. Energy Policy 2013, 52, 45–54. [Google Scholar] [CrossRef]
  31. Fragnière, E.; Kanala, R.; Moresino, F.; Reveiu, A.; Smeureanu, I. Coupling techno-economic energy models with behavioral approaches. Oper. Res. 2017, 17, 633–647. [Google Scholar] [CrossRef] [Green Version]
  32. Weimer-Jehle, W. Cross-impact balances: A system-theoretical approach to cross-impact analysis. Technol. Forecast. Soc. Chang. 2006, 73, 334–361. [Google Scholar] [CrossRef]
  33. Fortes, P.; Alvarenga, A.; Seixas, J.; Rodrigues, S. Long-term energy scenarios: Bridging the gap between socio-economic storylines and energy modeling. Technol. Forecast. Soc. Chang. 2014, 91, 161–178. [Google Scholar] [CrossRef]
  34. Aitken, M. Why we still don’t understand the social aspects of wind power: A critique of key assumptions within the literature. Energy Policy 2010, 38, 1834–1841. [Google Scholar] [CrossRef]
  35. Fink, S.; Bartels, J.-E.; Hagendorf, W.; Klinger, N. Determinants of subnational party positions on electricity grid expansion in Germany: Economic over political interests. Util. Policy 2019, 58, 145–157. [Google Scholar] [CrossRef]
  36. Schmid, E.; Knopf, B.; Pechan, A. Putting an energy system transformation into practice: The case of the German Energiewende. Energy Res. Soc. Sci. 2016, 11, 263–275. [Google Scholar] [CrossRef]
  37. Lilliestam, J.; Hanger, S. Shades of green: Centralisation, decentralisation and controversy among European renewable electricity visions. Energy Res. Soc. Sci. 2016, 17, 20–29. [Google Scholar] [CrossRef] [Green Version]
  38. Bauknecht, D.; Funcke, S.; Vogel, M. Is small beautiful? A framework for assessing decentralised electricity systems. Renew. Sustain. Energy Rev. 2020, 118, 109543. [Google Scholar] [CrossRef]
  39. Senkpiel, C.; Shammugam, S.; Biener, W.; Hussein, N.S.; Kost, C.; Kreifels, N.; Hauser, W. Concept of evaluating chances and risks of grid autarky. In Proceedings of the 13th INternational Conference on the European Energy Market (EEM), Porto, Portugal, 6–9 June 2016; pp. 1–5. [Google Scholar] [CrossRef]
  40. Tröndle, T.; Pfenninger, S.; Lilliestam, J. Home-made or imported: On the possibility for renewable electricity autarky on all scales in Europe. Energy Strategy Rev. 2019, 26, 100388. [Google Scholar] [CrossRef]
  41. Timpe, C.; Bauknecht, D.; Flachsbarth, F.; Koch, M. Transparenz Stromnetze-Szenarienbericht. 2017. Available online: https://www.transparenz-stromnetze.de/fileadmin/downloads/Oeko-Institut__2018__Ergebnisbericht_Szenarien.pdf (accessed on 6 August 2021).
  42. Timpe, C.; Bauknecht, D.; Flachsbarth, F.; Koch, M. Transparenz Stromnetze-Stakeholder-Diskurs und Modellierung zum Netzausbau und Alternativen. 2018. Available online: https://www.transparenz-stromnetze.de/fileadmin/downloads/Oeko-Institut_2018_Transparenz_Stromnetze.pdf (accessed on 6 August 2021).
  43. Degel, M.; Christ, M.; Grünert, J.; Becker, L.; Wingenbach, C.; Soethe, M.; Bunke, W.-D.; Mester, K.; Wiese, F. VerNetzen: Sozial-ökologische und Technisch-Ökonomische Modellierung von Entwicklungspfaden der Energiewende; Projektabschlussbericht. 2016. Available online: http://www.uni-flensburg.de/fileadmin/content/abteilungen/industrial/dokumente/downloads/veroeffentlichungen/forschungsergebnisse/vernetzen-2016-endbericht-online.pdf (accessed on 6 August 2021).
  44. Koch, M.; Flachsbarth, F.; Winger, C.; Timpe, C.; Christ, M.; Söthe, M.; Wingenbach, C.; Hilpert, S.; Degel, M.; Brummer, V.; et al. Perspektiven der Bürgerbeteiligung an der Energiewende unter Berücksichtigung von Verteilungsfragen: Modul 3: Berücksichtigung Gesellschaftlicher Faktoren bei der Entwicklung der Stromnetze. 2018. Available online: https://www.oeko.de/fileadmin/oekodoc/Endbericht-BuergEn-Stromnetze.pdf (accessed on 6 August 2021).
  45. 50Hertz Transmission GmbH; Amprion GmbH; TenneT TSO GmbH; TransnetBW GmbH. Netzentwicklungsplan Strom 2030, Version 2017. 2016. Available online: https://www.netzentwicklungsplan.de/sites/default/files/paragraphs-files/NEP_2030_1_Entwurf_Teil1_0.pdf (accessed on 6 August 2021).
  46. Becker, S.; Bues, A.; Neumann, M. Die Analyse Lokaler Energiepolitischer Konflikte und das Entstehen Neuer Organisationsformen: Theoretische Zugänge und Aktuelle Herausforsderungen. EnerLOG Working Paper, Erkner/Freiburg/Potsdam: Leibniz-Institut für Regionalentwicklung und Strukturplanung/Local Governments for Sustainability/ZukunftsAgentur Brandenburg. 2014. Available online: https://www.researchgate.net/publication/289523454_Die_Analyse_lokaler_energiepolitischer_Konflikte_und_das_Entstehen_neuer_Organisationsformen_Theoretische_Zugange_und_aktuelle_Herausforderungen/link/568e637f08ae78cc0515e21e/download (accessed on 6 August 2021).
  47. Wingenbach, M. Integration Sozial-Ökologischer Faktoren in die Energiesystemmodellierung am Beispiel von Entwicklungspfaden für den Windenergieausbau in Deutschland. Ph.D. Dissertation, Europa-Universität Flensburg, Flensburg, Germany, 2018. Available online: https://www.zhb-flensburg.de/dissert/wingenbach/ (accessed on 6 August 2021).
  48. Christ, M.; Soethe, M.; Degel, M.; Wingenbach, C. Wind energy scenarios for the simulation of the German power system until 2050: The effect of social and ecological factors: IV. In Advances and New Trends in Environmental Informatics. Stability, Continuity, Innovation; Wohlgemuth, V., Fuchs-Kittowski, F., Wittmann, J., Eds.; Springer: Cham, Switzerland, 2016; pp. 167–180. [Google Scholar]
  49. Künle, E.; Wildgrube, T.; Zinke, J.; Koch, M.; Timpe, C.; Poganietz, W.-R.; Weiss, A. ENSURE—Neue EnergieNetzStruktURen für die Energiewende: Ergebnisbericht zu Meilenstein 1.3 "Modellbasierte Szenarienanalyse". 2019. Available online: https://www.oeko.de/forschung-beratung/projekte/pr-details/verbundvorhaben-ensure-neue-energienetzstrukturen-fuer-die-energiewende (accessed on 6 August 2021).
  50. Koch, M.; Flachsbarth, F.; Bauknecht, D.; Heinemann, C.; Ritter, D.; Winger, C.; Timpe, C.; Gandor, M.; Klingenberg, T.; Tröschel, M. Dispatch of Flexibility Options, Grid Infrastructure and Integration of Renewable Energies Within a Decentralized Electricity System. In Advances in Energy System Optimization: Proceedings of the First International Symposium on Energy System Optimization; Bertsch, V., Fichtner, W., Heuveline, V., Leibfried, T., Eds.; Birkhäuser: Cham, Switzerland, 2017; pp. 67–86. ISBN 978-3-319-51794-0. [Google Scholar]
  51. Bundesnetzagentur. Bestätigung Netzentwicklungsplan 2019–2030: Bedarfsermittlung 2019–2030, Bonn. 2019. Available online: https://data.netzausbau.de/2030-2019/NEP/NEP2019-2030_Bestaetigung.pdf (accessed on 6 August 2021).
  52. 50Hertz Transmission; Amprion; TenneT TSO; TransnetBW. Methodenbeschreibung der Maßnahmenbewertung: Begleitdokument zum Netzentwicklungsplan Strom 2025, Version 2015. 2016. Available online: https://www.netzentwicklungsplan.de/sites/default/files/paragraphs-files/Begleitdokument_NEP_2025_Massnahmenbewertung.pdf (accessed on 6 August 2021).
  53. 50Hertz Transmission; Amprion; TenneT TSO GmbH; TransnetBW. Netzentwicklungsplan Strom 2030, Version 2017: 2. Entwurf der Übertragungsnetzbetreiber, Berlin, Dortmund, Bayreuth, Stuttgart. 2017. Available online: https://www.netzentwicklungsplan.de/sites/default/files/paragraphs-files/NEP_2030_2_Entwurf_Teil1.pdf (accessed on 6 August 2021).
Figure 1. Comparison of annual wind electricity production in German districts in 2012 (left) and in the economic distribution scenario (right) [44].
Energies 14 04824 g001
Figure 2. Change in annual wind electricity production in German districts in decentralized distribution (left) and in socio-ecologic distribution (right) in comparison to economic distribution [44].
Energies 14 04824 g002
Figure 3. Sequence of iterative network expansion in the PowerFlex-Grid Model [44].
Energies 14 04824 g003
Figure 4. Results of iterative grid expansion for economic distribution scenario “NEP B 2030”.
Energies 14 04824 g004
Figure 5. Results of iterative grid expansion for socio-ecologic distribution scenario.
Energies 14 04824 g005
Figure 6. Results of iterative grid expansion for decentralized distribution scenario.
Energies 14 04824 g006
Publisher’s Note: MDPI stays neutral with regard to jurisdictional claims in published maps and institutional affiliations.

