Article

Efficiency Comparison of DC and AC Coupling Solutions for Large-Scale PV+BESS Power Plants

1
Department of Electrical, Electronic and Information Engineering, University of Bologna, 40136 Bologna, Italy
2
NHOA, 20158 Milano, Italy
*
Author to whom correspondence should be addressed.
Energies 2021, 14(16), 4823; https://doi.org/10.3390/en14164823
Submission received: 26 May 2021 / Revised: 3 July 2021 / Accepted: 2 August 2021 / Published: 7 August 2021
(This article belongs to the Special Issue Photovoltaic Generation Systems and Power Conditioning)

Abstract

:
In large-scale photovoltaic (PV) power plants, the integration of a battery energy storage system (BESS) permits a more flexible operation, allowing the plant to support grid stability. In hybrid PV+BESS plants, the storage system can be integrated by using different power conversion system (PCS) layouts and different charge–discharge strategies. In the AC-coupling layout, the BESS is connected to the ac-side of the system through an additional inverter. In the DC-coupling layout, the BESS is connected to the dc-side, with or without a dedicated dc–dc converter, and no additional inverter is needed. Referring to a 288 MWp PV plant with a 275 MWh BESS, this paper compares the PCS efficiency between AC- and DC-coupling solutions. The power injected into the grid is obtained considering providing primary power-frequency regulation services. A charging and discharging strategy of the BESS is proposed to ensure cyclic battery energy shifting. The power flows in the different components of the system that are obtained under realistic operating conditions, and total energy losses and annual average efficiency are calculated accordingly. Finally, results show a higher efficiency of DC-coupling compared to the AC-coupling layout.

Graphical Abstract

1. Introduction

Grid-connected PV plants are non-dispatchable energy sources that are controlled in order to inject the maximum available power into the grid. Due to their operating characteristics, PV plants cannot usually provide the control and regulation services that conventional sources can do and, moreover, can impact the voltage and the stability of the electrical system [1,2,3]. For example, in PV plants with sizes up to hundreds of MW, the unstable weather can cause deep power dips and high ramp-rate [4]. Therefore, the system operator employs power from programmable sources (generally thermal plants using pollutant sources) to control the system’s operation and preserve the grid stability. The integration of a battery energy storage system permits a more flexible operation of the PV plants with a much-reduced impact on safe grid operation [5]. A typical PV+BESS power plant, in fact, consists of multiple PV arrays, power electronic converters, and storage units which can contribute to grid stability and reliability through sophisticated grid-friendly controls [6,7], thus supplementing (or even replacing in the long term) conventional generators [8]. In particular, the development of advanced power controls can enable PV to become a provider of a wide range of grid services, including spinning reserves, load following, voltage support, ramping control, frequency response, and variability smoothing. The BESS allows decoupling the PV power from the power that the plant injects into the grid. It is hence possible to modulate the grid power without reducing the generated PV power, or to keep constant the power injection to the grid even if the PV availability drops. Possible support functions that a hybrid PV+BESS plant can provide to the grid without involving curtailment of the PV generation are described, among others, in [9,10,11,12,13,14,15,16,17,18].
In grid-connected PV plants, power is generated at the dc-side and is conveyed, through a power conversion system, to the AC grid. Large-scale PV plants reach the size of hundreds of MW by using multiple inverters and PV generator modules. In hybrid PV+BESS plants, the storage system can be integrated by using different layouts [19,20,21]. In the AC-coupling layout, the BESS is connected to the ac-side of the system through an additional inverter. In the DC-coupling layout, the BESS is connected to the dc-side, with or without a dedicated dc–dc converter, and no additional inverter is needed.
The investigation of the advantages and disadvantages of the different layouts (AC vs. DC coupling) has attracted the interest of companies [20,22,23]. Several works exist now in the literature that analyzes and compare the performance of the AC-coupling and DC-coupling solutions. However, few works provide a quantitative comparison in terms of PCS efficiency. Several works exist now in the literature that analyzes and compare the performance of the AC-coupling and DC-coupling solutions. The costs and benefits of the different PV+BESS layouts are compared in the report of the national renewable energy laboratory [19], which evaluated the technical and economic performance of PV plus storage power plants. In the report, a PV power plant of 65 MWp with 30 MW/120 MWh of BESS is considered as a case study for comparison. The net revenues are calculated by hourly price and considering the following dispatching strategy: the battery charging occurs in the early morning when prices are lowest, and the stored energy is injected into the grid (battery discharging) during the late afternoon and early evening when prices are highest. The conclusions show a slightly higher benefit/cost ratio for the DC-coupling compared to the AC-coupling. However, the quantitative comparison in terms of energy losses and power conversion system efficiency was not covered in this document.
Another comparison of the benefit/cost ratio is provided in [24] with similar conclusions. This study provides a model to optimize energy storage operation in systems with AC and DC coupled configurations. The results show an approximately 2 percent increase in benefit/cost for DC-coupling than AC-coupling. However, even if conversion losses are included in the benefit/cost calculation, a quantitative and qualitative analysis of the losses performance and efficiency of the PCS is not provided. Moreover, not all possible DC-coupling solutions are considered for comparison.
In reference [25], the authors provided a reliability analysis of a 160 kW/1500 V PV system with a DC- or AC-coupled BESS operating in PV power smoothing and ramp-rate regulation mode. The results show that compared with the AC-coupled configuration, the DC-coupled configuration has a shorter lifetime period and lower reliability. On the other hand, the paper [26] shows that the DC-coupled configuration better performs in terms of component-, converter- and system-level reliability. However, no comparison on PCS efficiency was provided in both references.
In reference [27], a loss model of a DC-coupled PV+BESS plant was developed, and the power losses of a commercially available DC-coupled PV-battery converter system were analyzed. However, the examined DC-coupled layout refers to a low power system (5.2 kW of PV power), whose power profiles are more similar to a domestic or stand-alone system. Furthermore, a comparison with the AC-coupled PCS efficiency was not provided.
In reference [28], a DC-coupling solution that utilizes a single battery dc–dc converter capable of simultaneously operating as a charge controller and a maximum power point tracking (MPPT) device was analyzed. The battery coupling solution in [28] is similar to the DC-coupling analyzed in this paper. A multi-MW power plant of 14 MWp of PV and a 1 MW/2 MWh of BESS is considered a case study, but consideration about the PCS efficiency and comparisons with the AC-coupling counterpart was not provided.
In the reference [29], a dc-coupled energy storage system connected to the bus-dc of the grid-tied PV inverter through a dedicated dc–dc converter was analyzed. The results showed that the storage system leads to reduced clipping losses. Even if an average estimation of the PCS’s conversion efficiency is analyzed considering the different possible paths of the power flows, a quantitative comparison of the efficiency and losses power profile among the different solutions was not covered in this paper.
Finally, to the best of the authors’ knowledge, no article presents a quantitative comparison in terms of conversion losses and efficiency of different AC- and DC-coupling solutions for battery integration in large utility-scale PV power plants.
The purpose of this work was to analyze and compare the losses that involve three different solutions of power conversion system architectures in hybrid multi-MW grid-connected PV+BESS plants during ordinary daily operation. To achieve this, a 288 MW PV power plant with a 92.2 MW/275.2 MWh BESS, capable of contributing primary frequency response and energy shifting services to the grid, was considered as a case study. The energy flows that involve the PCSs during the plant’s operation were quantitatively analyzed, and the performance of the different solutions in terms of loss and efficiency were evaluated and compared. The analysis was carried out under different daily and seasonal irradiance conditions, and annual efficiency data were compared for the different connection layouts.
The paper is organized as follows: the main characteristics of the case study used for the efficiency comparison are resumed in Section 2; the three different PCS layouts that are considered to integrate the energy storage system into the PV plant are described in Section 3; Section 4 presents the methodology used to calculate the power flows of the plant during daily operation in grid support mode (primary frequency reserve and energy shifting); Section 5 resumes the method and data used to calculate the losses in each conversion stage; the numerical results in terms of power flow, losses and efficiency are reported and discussed in Section 6. Concluding remarks are finally drawn in Section 7.

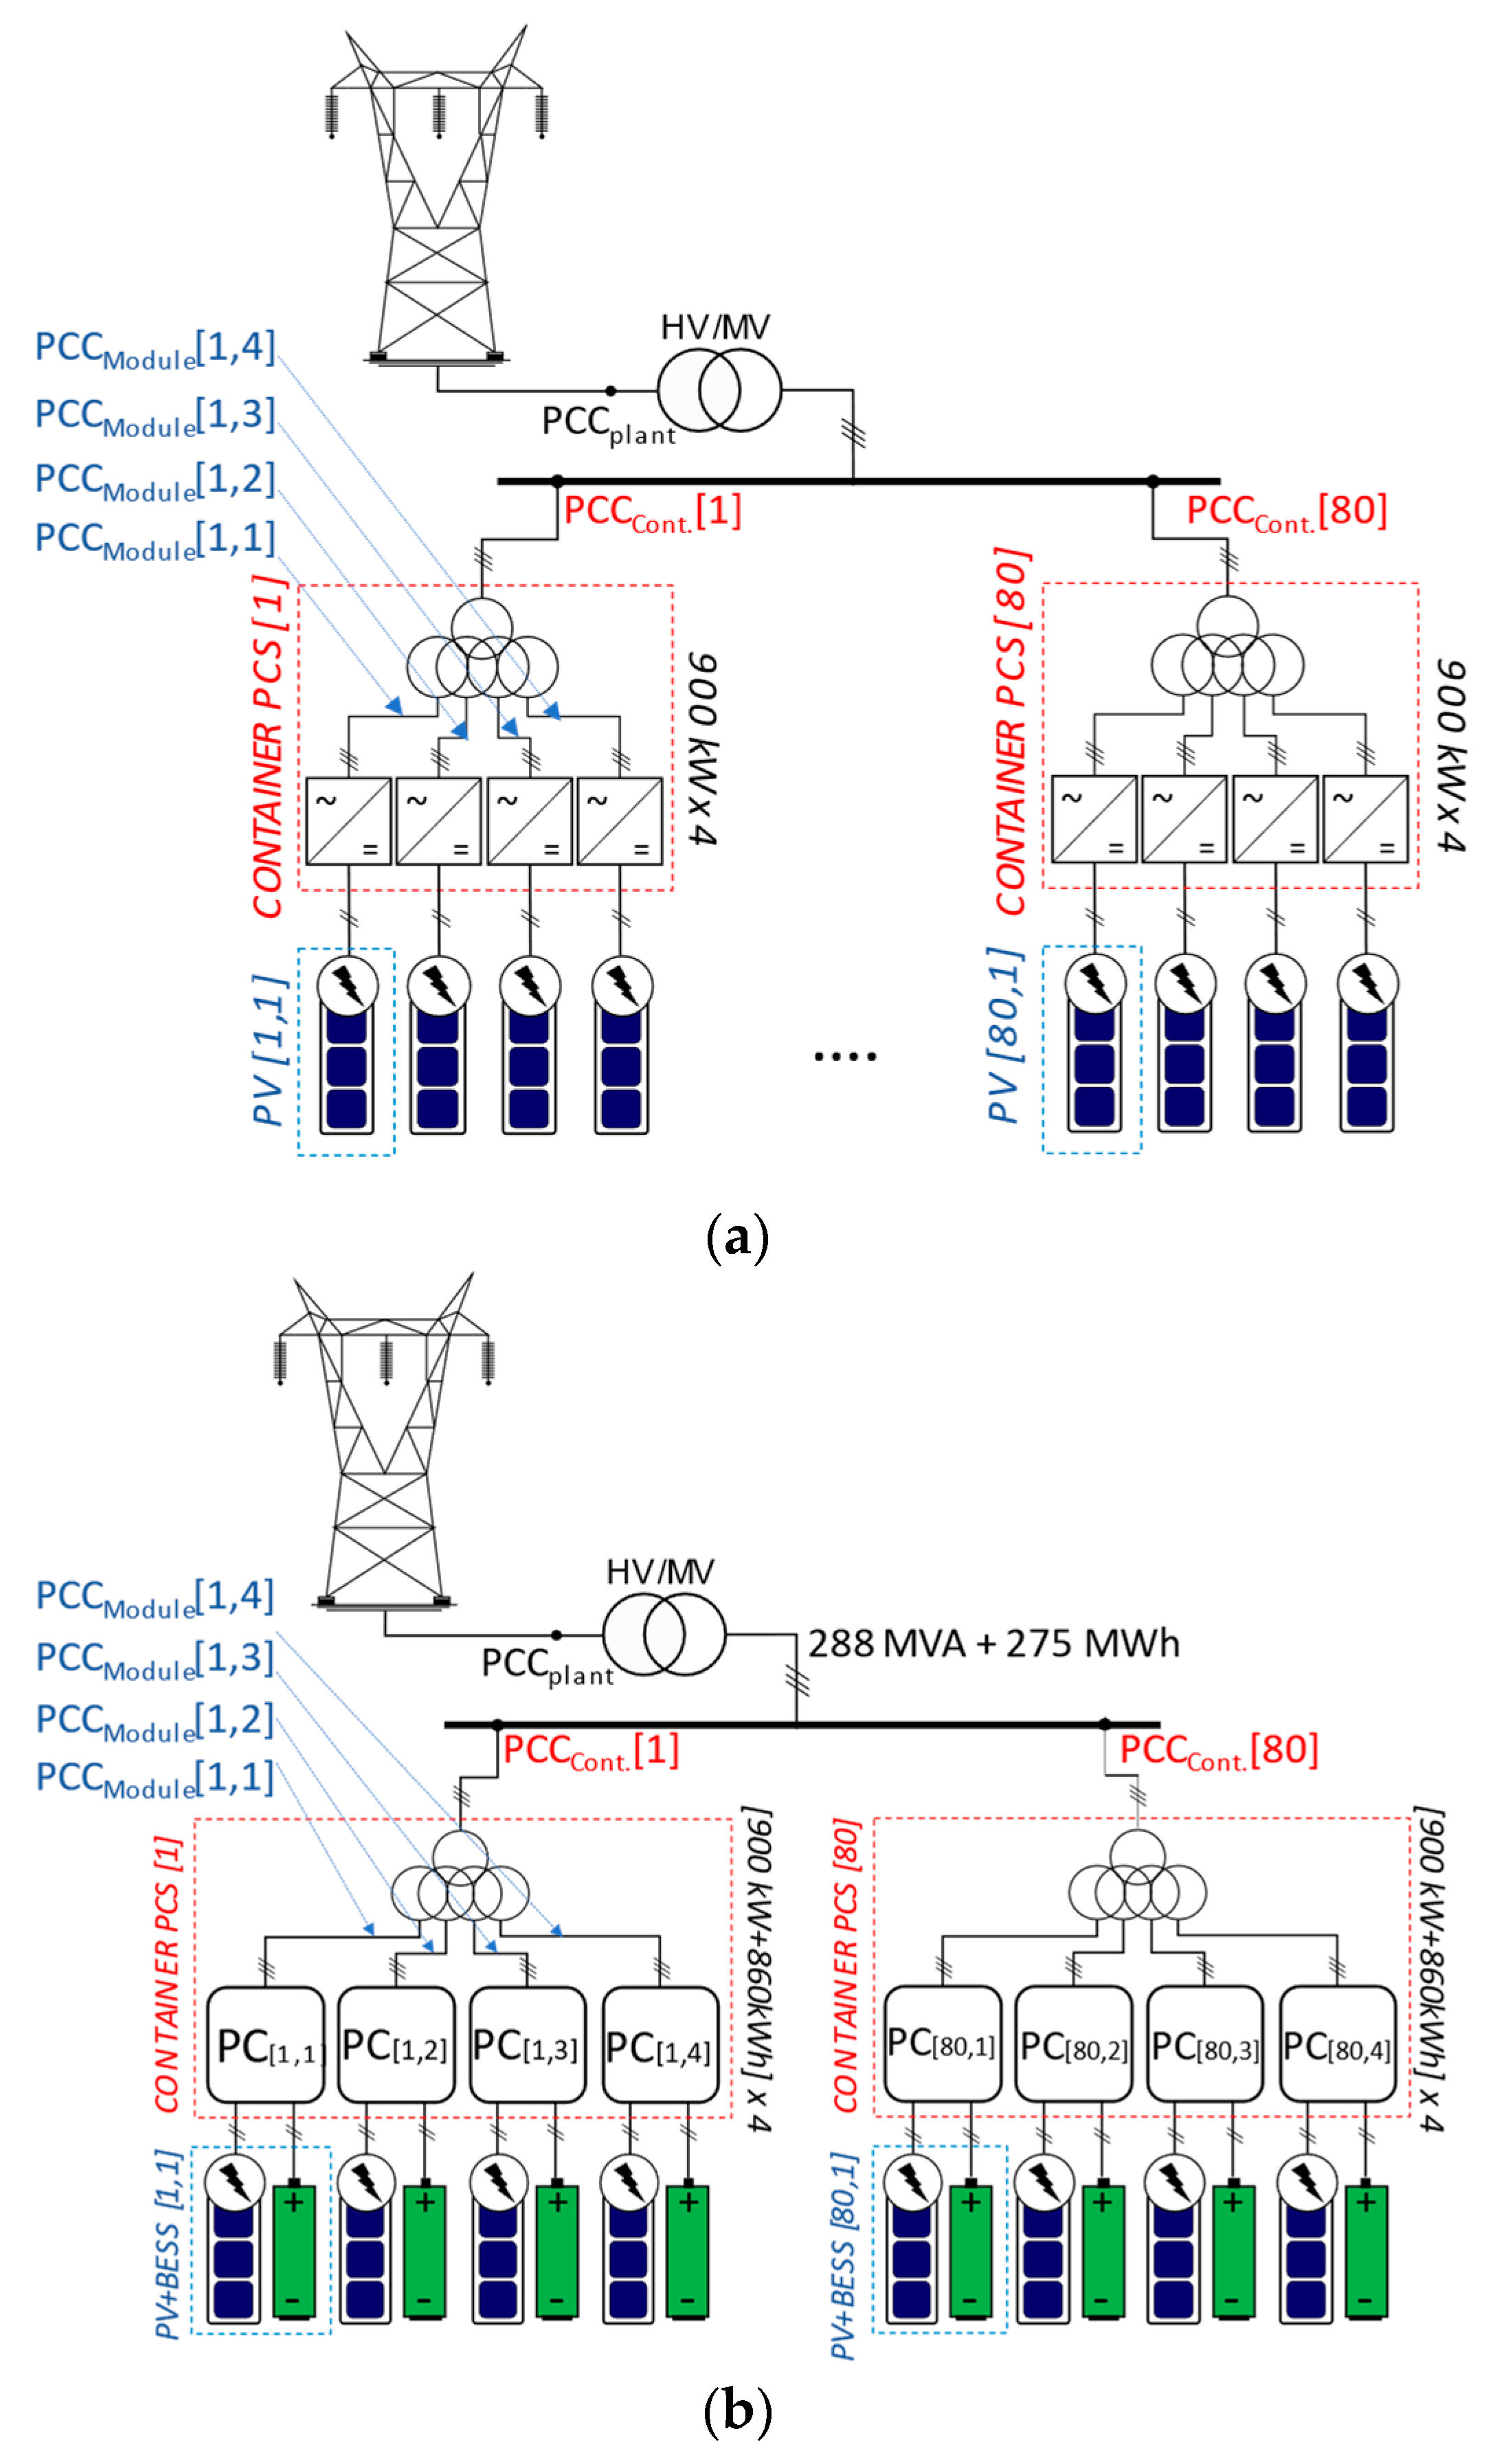
2. The Case Study: A 288 MW PV Plant with 92.2 MW/275.2 MWh Integrated BESS

A 288 MW power PV plant with a 92.2 MW/275.2 MWh battery storage capacity is introduced in this section as a case study. The general characteristics of the plant are discussed in the following. The typical size of PV inverters usually employed in large hybrid PV plants is up to 5 MW. The DC voltage of the inverter is generally in the range of 900 V d c –1500 V d c (PV side), and the output AC voltage is in the range of 400 V a c ÷ 690 V a c [30] Large-scale PV plants reach the size of hundreds of MW by using multiple inverters and PV generator modules. In this reference case study, the low voltage (LV) AC output of more inverters is connected to a single multi-winding transformer that steps up the voltage to the medium voltage (MV) level, in the range of 15,000 V a c –20,000 V a c . The transformer may consist of one single grid-side winding with four secondary windings connected to the inverters. A containerized solution was used: the PCS container involves one single multi-winding transformer and four PV inverters. In Figure 1a, the schematic of the 288 MWp PV plant used as a case study is shown. The plant is made of 80 PCS containers. Each PCS includes four inverters modules with a 900 kVA rating, connected to the multi-winding transformer. Both the inverters and the transformer are three-phase. Different architectures can be considered for integrating the 92.2 MW/275.2 MWh BESS system in the PV power plant, which is analyzed in detail in the following. However, no matter the solution chosen, maintaining the modular approach is essential for the correct design, assembling, operation, and maintenance of the power plant. For this reason, the total BESS capacity of 92.2 MW/275.2 MWh is subdivided into 320 ( 4 × 80 ) battery modules with 288 kW/860 kWh rating, to be individually coupled with the 900 kW PV modules via the power converters. The BESS can consist of various battery cell technologies. Popular battery technologies include Lithium-ion (Li-ion), Lead–Acid (PbA), and Nickel–Metal Hydride (Ni–MH) [31]. Among these, Li-ion batteries have become the prevailing technology used in large BESS [32], as the system described in this paper, due to the higher energy density, the higher round trip efficiency, the longer life span, the fast response time, and the decrease in cost seen in recent years [33,34,35].
The schematic of the modularized PV+BESS solution is shown in Figure 1b. In Figure 1a,b PCC P l a n t denotes the point of common coupling (PCC) of the total plant, and PCC C o n t . [ i ] (with i [1:80]) denotes the PCC of the single PCS container. Similarly, it is possible to define the PCC of the single PV module (a) or the PCC of the hybrid PV+BESS module (b). The point of common coupling of the module is denoted with PCC M o d u l e [ i , j ] in Figure 1a,b, where i refers to the container’s number and j is the module’s number ( j [1:4]).

3. BESS Coupling Topologies
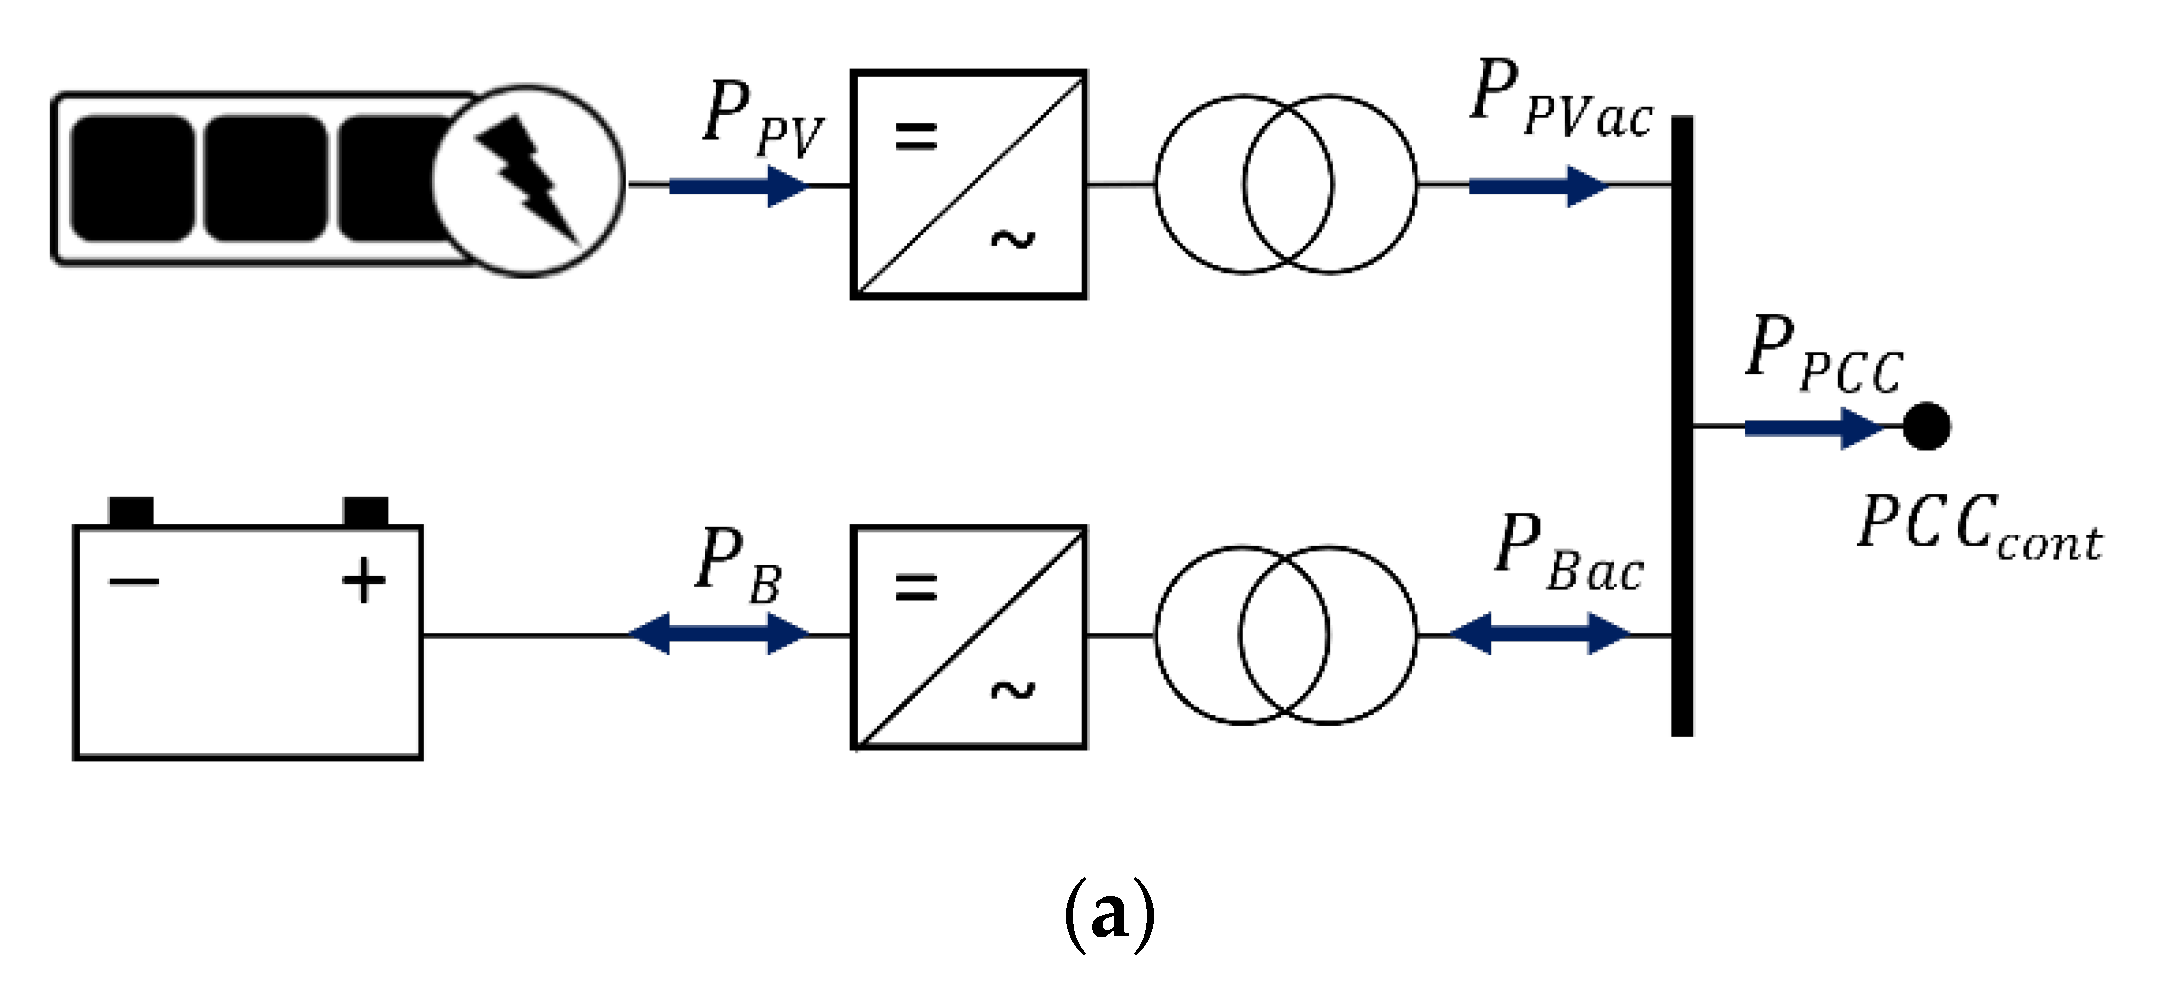
Three different PCS architectures can be considered for connecting the BESS modules. Each PCS architecture refers to a single PV/Battery module and involves the power converters and the (part of the) transformer connected to the PCC C o n t . More in particular, as shown in Figure 1b, the PCS of one single PV/Battery module only considers one single secondary-winding of the multi-winding transformer. Furthermore, for comparing the different layouts, in the following, it is assumed that the PCS also includes the primary winding of the transformer. Thus, the single PCS modules under analysis consist of the power electronics and the equivalent transformer (two winding) that allow the coupling of the PV/Battery modules with the MV side of the plant transformer. The three different PCS layouts are schematized in Figure 2 and are discussed in detail in the following. The size of each element of the PCS system according to the architecture considered is summarized in Table 1.

3.1. AC-Coupling

The AC-coupling architecture employs two distinct inverters for connecting a PV and a BESS module, as is shown in Figure 2a. Both inverters are connected to the PCC C o n t . using two winding (per phase) transformers. The PV inverter sets the MPPT operation and conveys the power to the ac-side unidirectionally. The BESS converter controls the battery power flows operating in the inverter or the rectifier mode. It is worth noting that due to the use of two separate inverter systems, this configuration allows both a distributed BESS system, which can be used for the modular configuration of the whole plant, as discussed in this paper, and a concentrated system where the overall BESS power is conveyed in unique point, that can even be far from the PV plant. For these reasons, the BESS in the AC-coupling could be designed with different modularity, such as 80 PCS containers of 1.15 MW/3.44 MWh each.

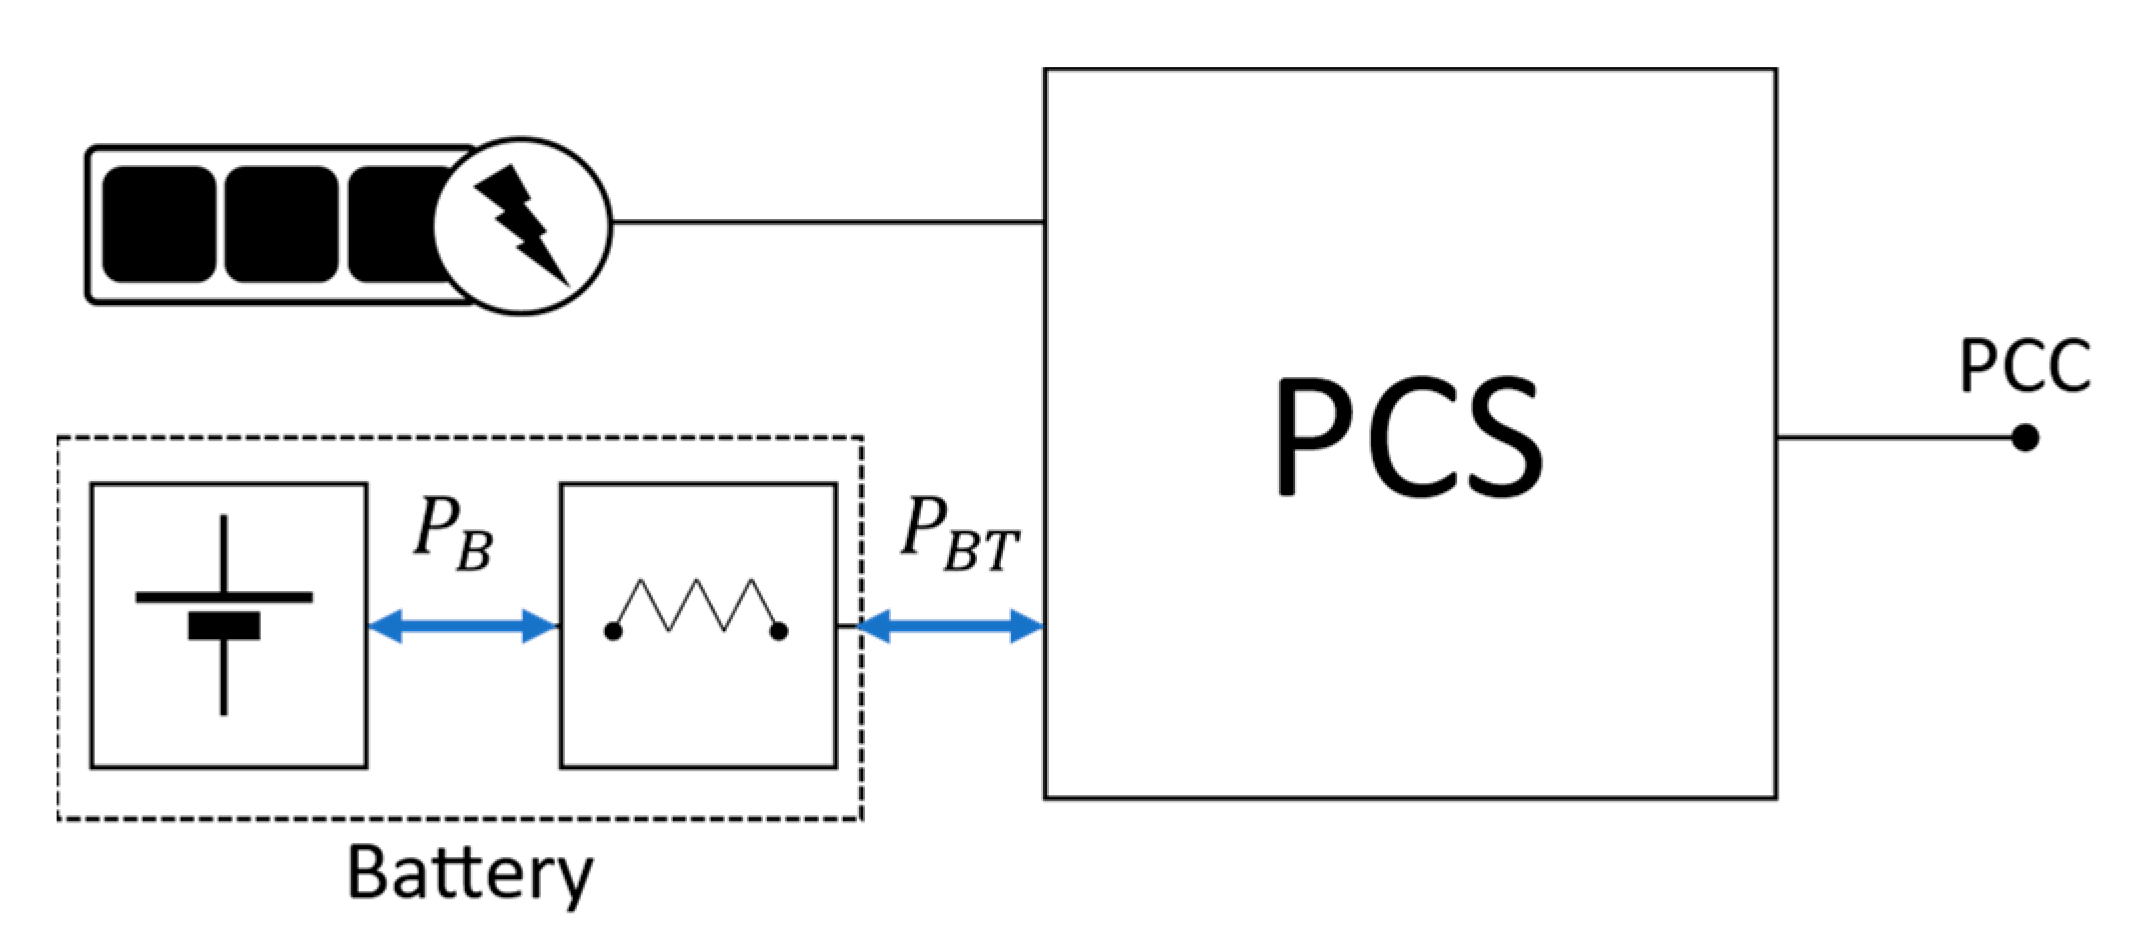
3.2. DC-Coupling/BESS-Side

The DC coupling architecture with the dc–dc converter on the battery side (DC-coupling/BESS-side in brief) only employs one inverter per module, as is shown in Figure 2b. A dc–dc converter connects the battery module to the dc bus. The inverter controls the power conveyed to the converter’s PCC (ac-side), regulating the current from the bus-dc. The dc–dc converter manages the bus-dc voltage to allow the PV to work in MPPT conditions, and it must allow the bidirectional power flow from BESS to PCC (battery discharging) and from PCC to BESS (battery charging). This architecture only applies to distributed storage systems because the BESS module must be connected to the dc-side of each PV inverter.

3.3. DC-Coupling/PV-Side

The DC coupling architecture with the dc–dc converter on the PV side (DC-coupling/PV-side in brief) is shown in Figure 2c. It only employs one inverter connecting the storage module to the module’s PCC. The PV strings are connected to the dc-link through a dc–dc converter. The dc–dc converter manages the PV voltage to work in MPPT conditions; meanwhile, the inverter manages the power supplied to the PCC and, consequently, the battery power. This architecture only applies to distributed storage systems because the BESS module must be connected to the dc side of each inverter.

4. Plant’s Power Flows Analysis

In order to investigate the efficiency of the three different architectures, the power flows managed by the PCS in each conversion stage need to be identified. The PV-generated power ( P PV ) depends on daily irradiance and temperature. On the other hand, the plant’s output power, which is the power measured on the PCC side ( P PCC ), depends on the grid demand and system’s characteristics. Finally, the BESS power ( P B ) is obtained by the power balance in Equation (1).
P PCC = P PV + P B
Note that the load convention is used for defining the grid power; hence a positive value of P PCC indicates a power absorbed by the grid. This is the only possible case as no possible power flow from the grid to the plant is considered in this paper. On the opposite, the generator convention is used for defining P PV and P B , hence a positive value indicates a generated power and a negative value an absorbed power (possible for the battery only). The battery operates in charging mode when the PV power is higher than the output PCC power (generation higher than grid demands); otherwise, it operates in discharging mode.

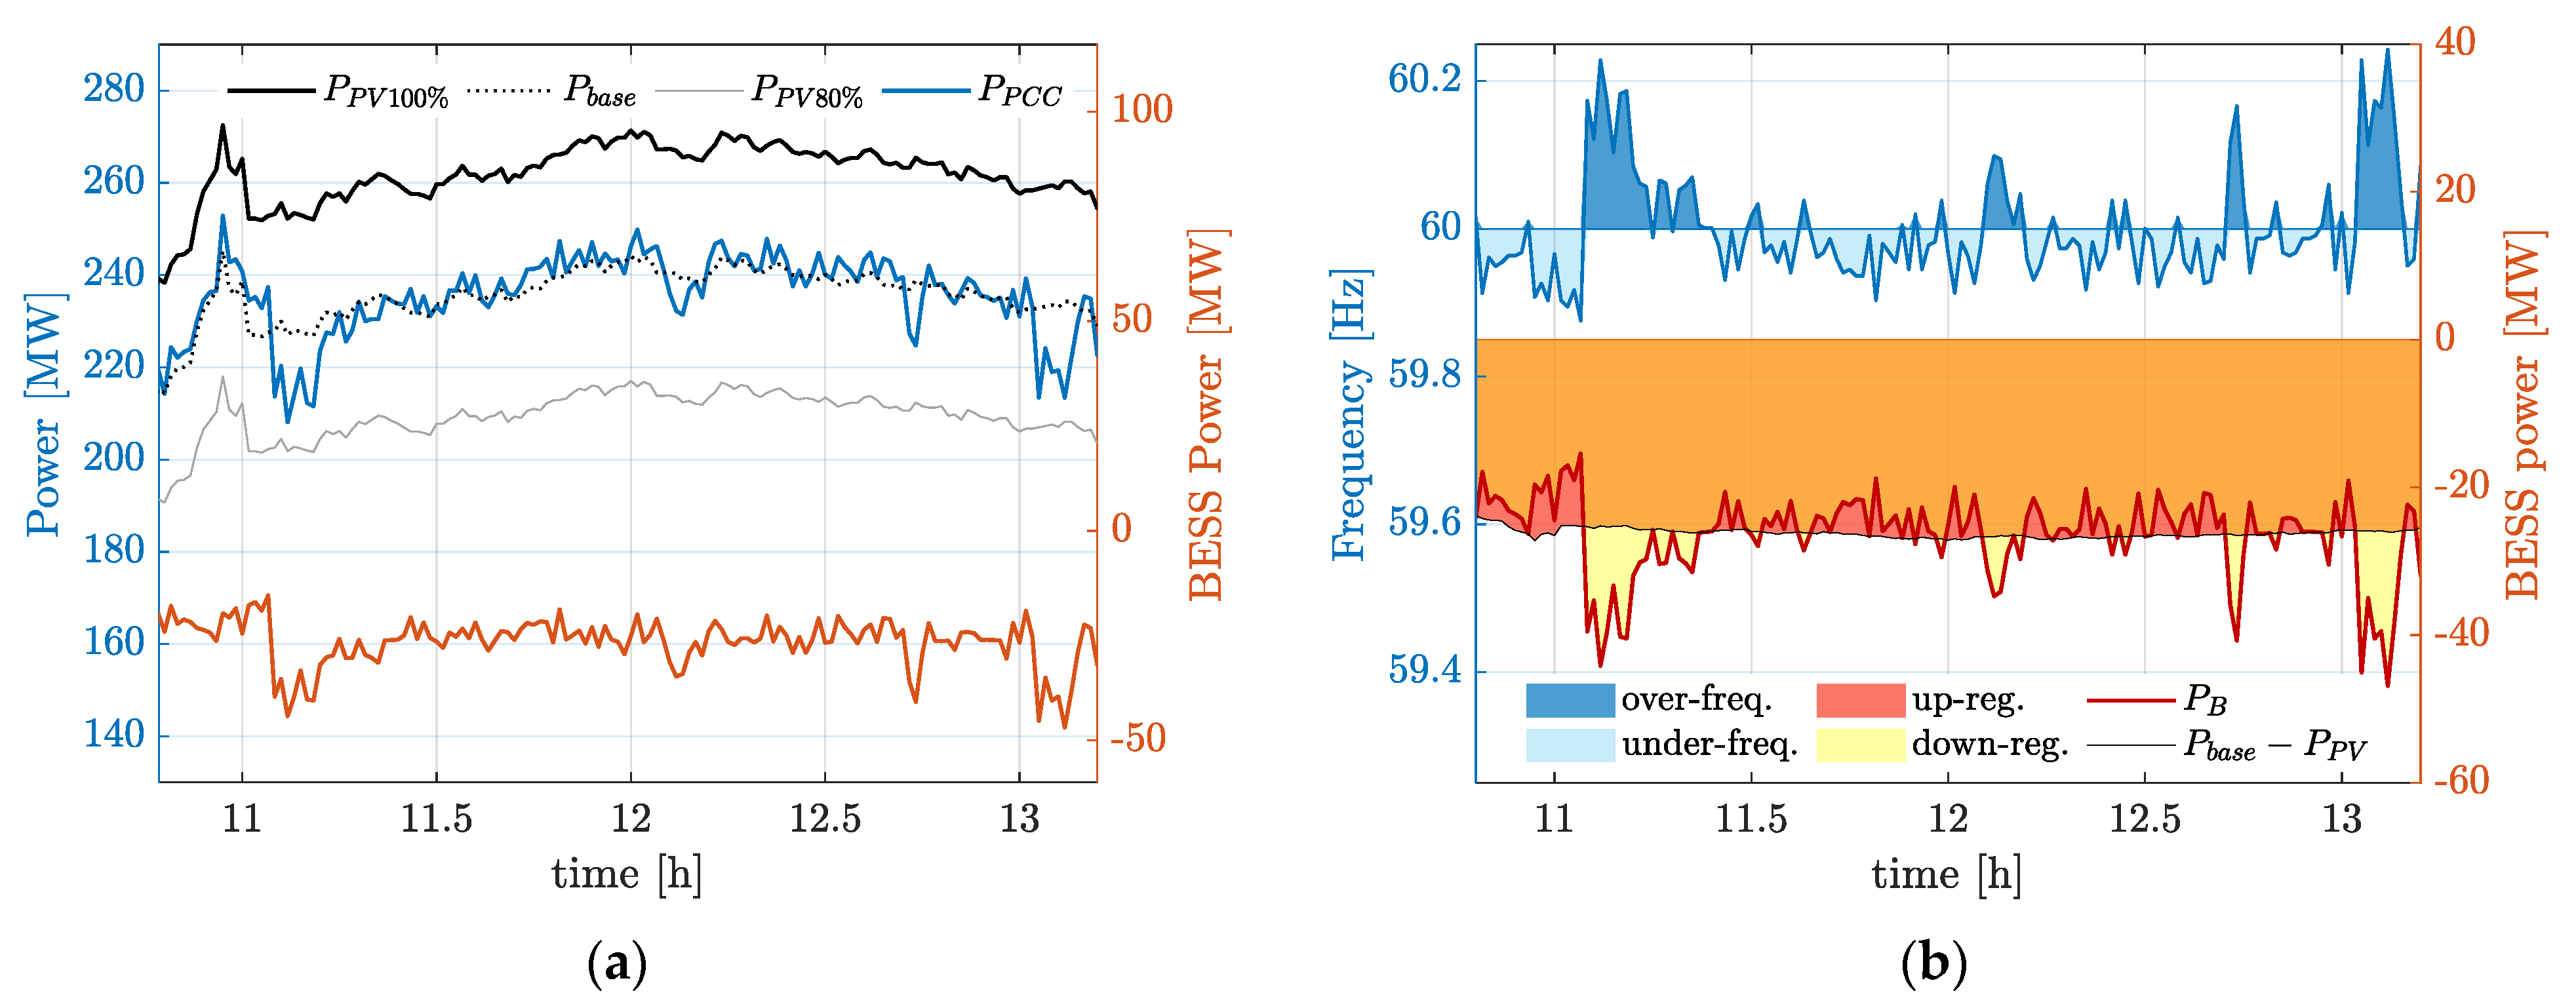
4.1. Primary Frequency Reserve Operation and BESS Charging

In this paper, it is assumed that the PV+BESS plant operates in a weak grid system. In particular, operating conditions and management procedures as those applying in the power system of the Puerto Rico island are considered. Weak grid, or in general weak connection points, are most commonly found in sparsely populated rural or remote areas, islands, or countries with under-developed electricity infrastructure [36]. This grid includes a relatively small number of power sources and loads, compared to a conventional transnational interconnected grid, so any unexpected imbalance between load and generation can induce significant voltage and frequency excursions and requires appropriate procedures to be dealt with [10]. In fact, as an isolated island system, the Puerto Rico power system has a lower inertial constant compared to large interconnected power systems. During peak daytime hours, when solar penetration is high and has displaced conventional generation, the available inertia from spinning mass is even lower because PV generation, unlike conventional generators, does not have any rotating mechanical parts to replace inertia losses [6]. The rate of change of frequency (RoCoF) depends upon the magnitude of the power imbalance (e.g., PV generation droops because of unstable weather conditions) and the total inertia of the system. The lower the system’s inertia is, the higher the RoCoF is during an imbalance event to the extent that system security may be endangered. Thus, a faster response time of active power reserve activation to stabilize the system is required [37]. On the other hand, PV systems, with no mechanical contribution and a small time-constant (fast response), also have a significant capability to participate in frequency support, as reported in [6].
In fact, according to the Puerto Rico electric power authority (PREPA) [38], large grid-tied PV facilities provide an immediate primary frequency response (PFR), similar to the governor response of conventional generation, by adjusting their real power output. The change in real power must be proportional to the deviation of frequency from the nominal value. The control of the PV plant should be able to provide both for up- and down-regulation. The real power response to frequency deviations should be similar to, or more responsive than, the 5% droop used by conventional generators.
The frequency droop is the percent change in frequency normalized against the percent change in the regulating power output, multiplied by 100. A 5% frequency droop response means that a 5% frequency deviation on the system would result in a 100% change in regulating the power capacity of the generating unit [6]. The droop curve proposed by PREPA is shown in Figure 3 and is used in this paper to calculate the PCC power of the considered PV plant. According to the PREPA grid code and references [8,9], 10% of the available PV power must be reserved both for up and down-regulation. Therefore, in nominal conditions, the plant is set to operate at a curtailed power level ( P b a s e ) that is 90% of the available PV power. The nominal grid frequency is f n = 60 Hz. The PCC power value depends on the frequency error Δ f = ( f f n ) , where f is the measured frequency value. A deadband of ± 0.012 Hz is applied to the primary frequency response, so regulation only begins when the frequency is higher than the upper threshold ( f 1 = 60.012 Hz) or lower than the lower threshold ( f 2 = 59.988 Hz). The droop characteristic reaches a plateau when the frequency error reaches the value of Δ f = ± 0.300 Hz (±0.5% of f n ). In over-frequency conditions, when the frequency is higher than the threshold f 3 = 60.3 Hz, the plant’s power output is lowered by 10%, corresponding to 80% of the available PV power. On the other side, in under-frequency conditions, when the frequency is lower than the threshold f 4 = 59.7 Hz, the plant’s power output is increased by 10%, corresponding to 100% of the available PV power.
The considered daily profile of frequency with a 1-min resolution is shown in Figure 4a. The percentage occurrence of different frequency values obtained from the daily data of Figure 4a is shown in Figure 4b. In both these graphs, the key frequency values of the droop characteristic are pointed out: the nominal frequency ( f n ); the deadband limits ( f 1 and f 2 ); the frequency thresholds where the regulating power reaches the bounds   ( f 3 and f 4 ).
Figure 5 shows an example of the PFR power profile of the plant during about 2 h, obtained according to the PFR droop characteristic of Figure 3 and the frequency data of Figure 4a. Referring to the left-axis of Figure 5a, the black line is the available PV power P PV . The black dotted line represents the base power, which is 90% of the available P PV power. Based on the frequency excursion, the PCC power may deviate from the base value providing up- and down-reserve, thus creating the output power profile reported with the blue line in Figure 5a (named P PCC ). The grey line in Figure 5a depicts the minimum admissible value of P PCC that is equal to 80% of P PV .
Since the probability distribution of frequency (see Figure 4b) is practically symmetrical with respect to the nominal value, the average output power profile of the plant is coincident with the base power of 90% of P PV , as confirmed in Figure 5. This means that about 10% of the energy generated is not transferred to the grid. This surplus energy is stored in the battery. As a result, the BESS is charged during daytime hours. Furthermore, since according to Figure 4b, the probability of occurrence of an under-frequency event with f < f 4 is very low; the PCC instant power is always lower than 100% of the PV power. This implies that, according to Equation (1), a continuous power flow always occurs toward the battery during day hours. The red line (right axis) of Figure 5a shows the resulting battery power flow. Figure 5b shows the role of the energy storage during the daytime PFR operation of the plant. The base power sets a battery power value that does not depend on the grid frequency and is given by P b a s e P PV (10% of PV availability, black line). In case of under-frequency occurrence, the power absorbed by the storage system (red line) decreases. On the other hand, in over-frequency conditions, the charging battery power increase according to the PFR droop curve. The PFR operation could also be obtained without a BESS by reducing and modulating the PV generation but to the expense of MPPT operation. However, by introducing a storage system, the PV+BESS plant is capable of providing both up- and down-reserve without modulating the PV power, maximizing the exploitation of the PV source (MPPT operation is assured).
To exploit the BESS capacity, it is necessary to ensure cyclic working conditions, in which the batteries must be completely charged and discharged during a 24-h cycle. A discharge strategy for the battery must then be planned after daily hours, which restores the initial SOC value at the beginning of the next day. This discharge strategy, which is obtained by assuming that the battery provides ramp rate support during sunset hours, is discussed in the next subsection.

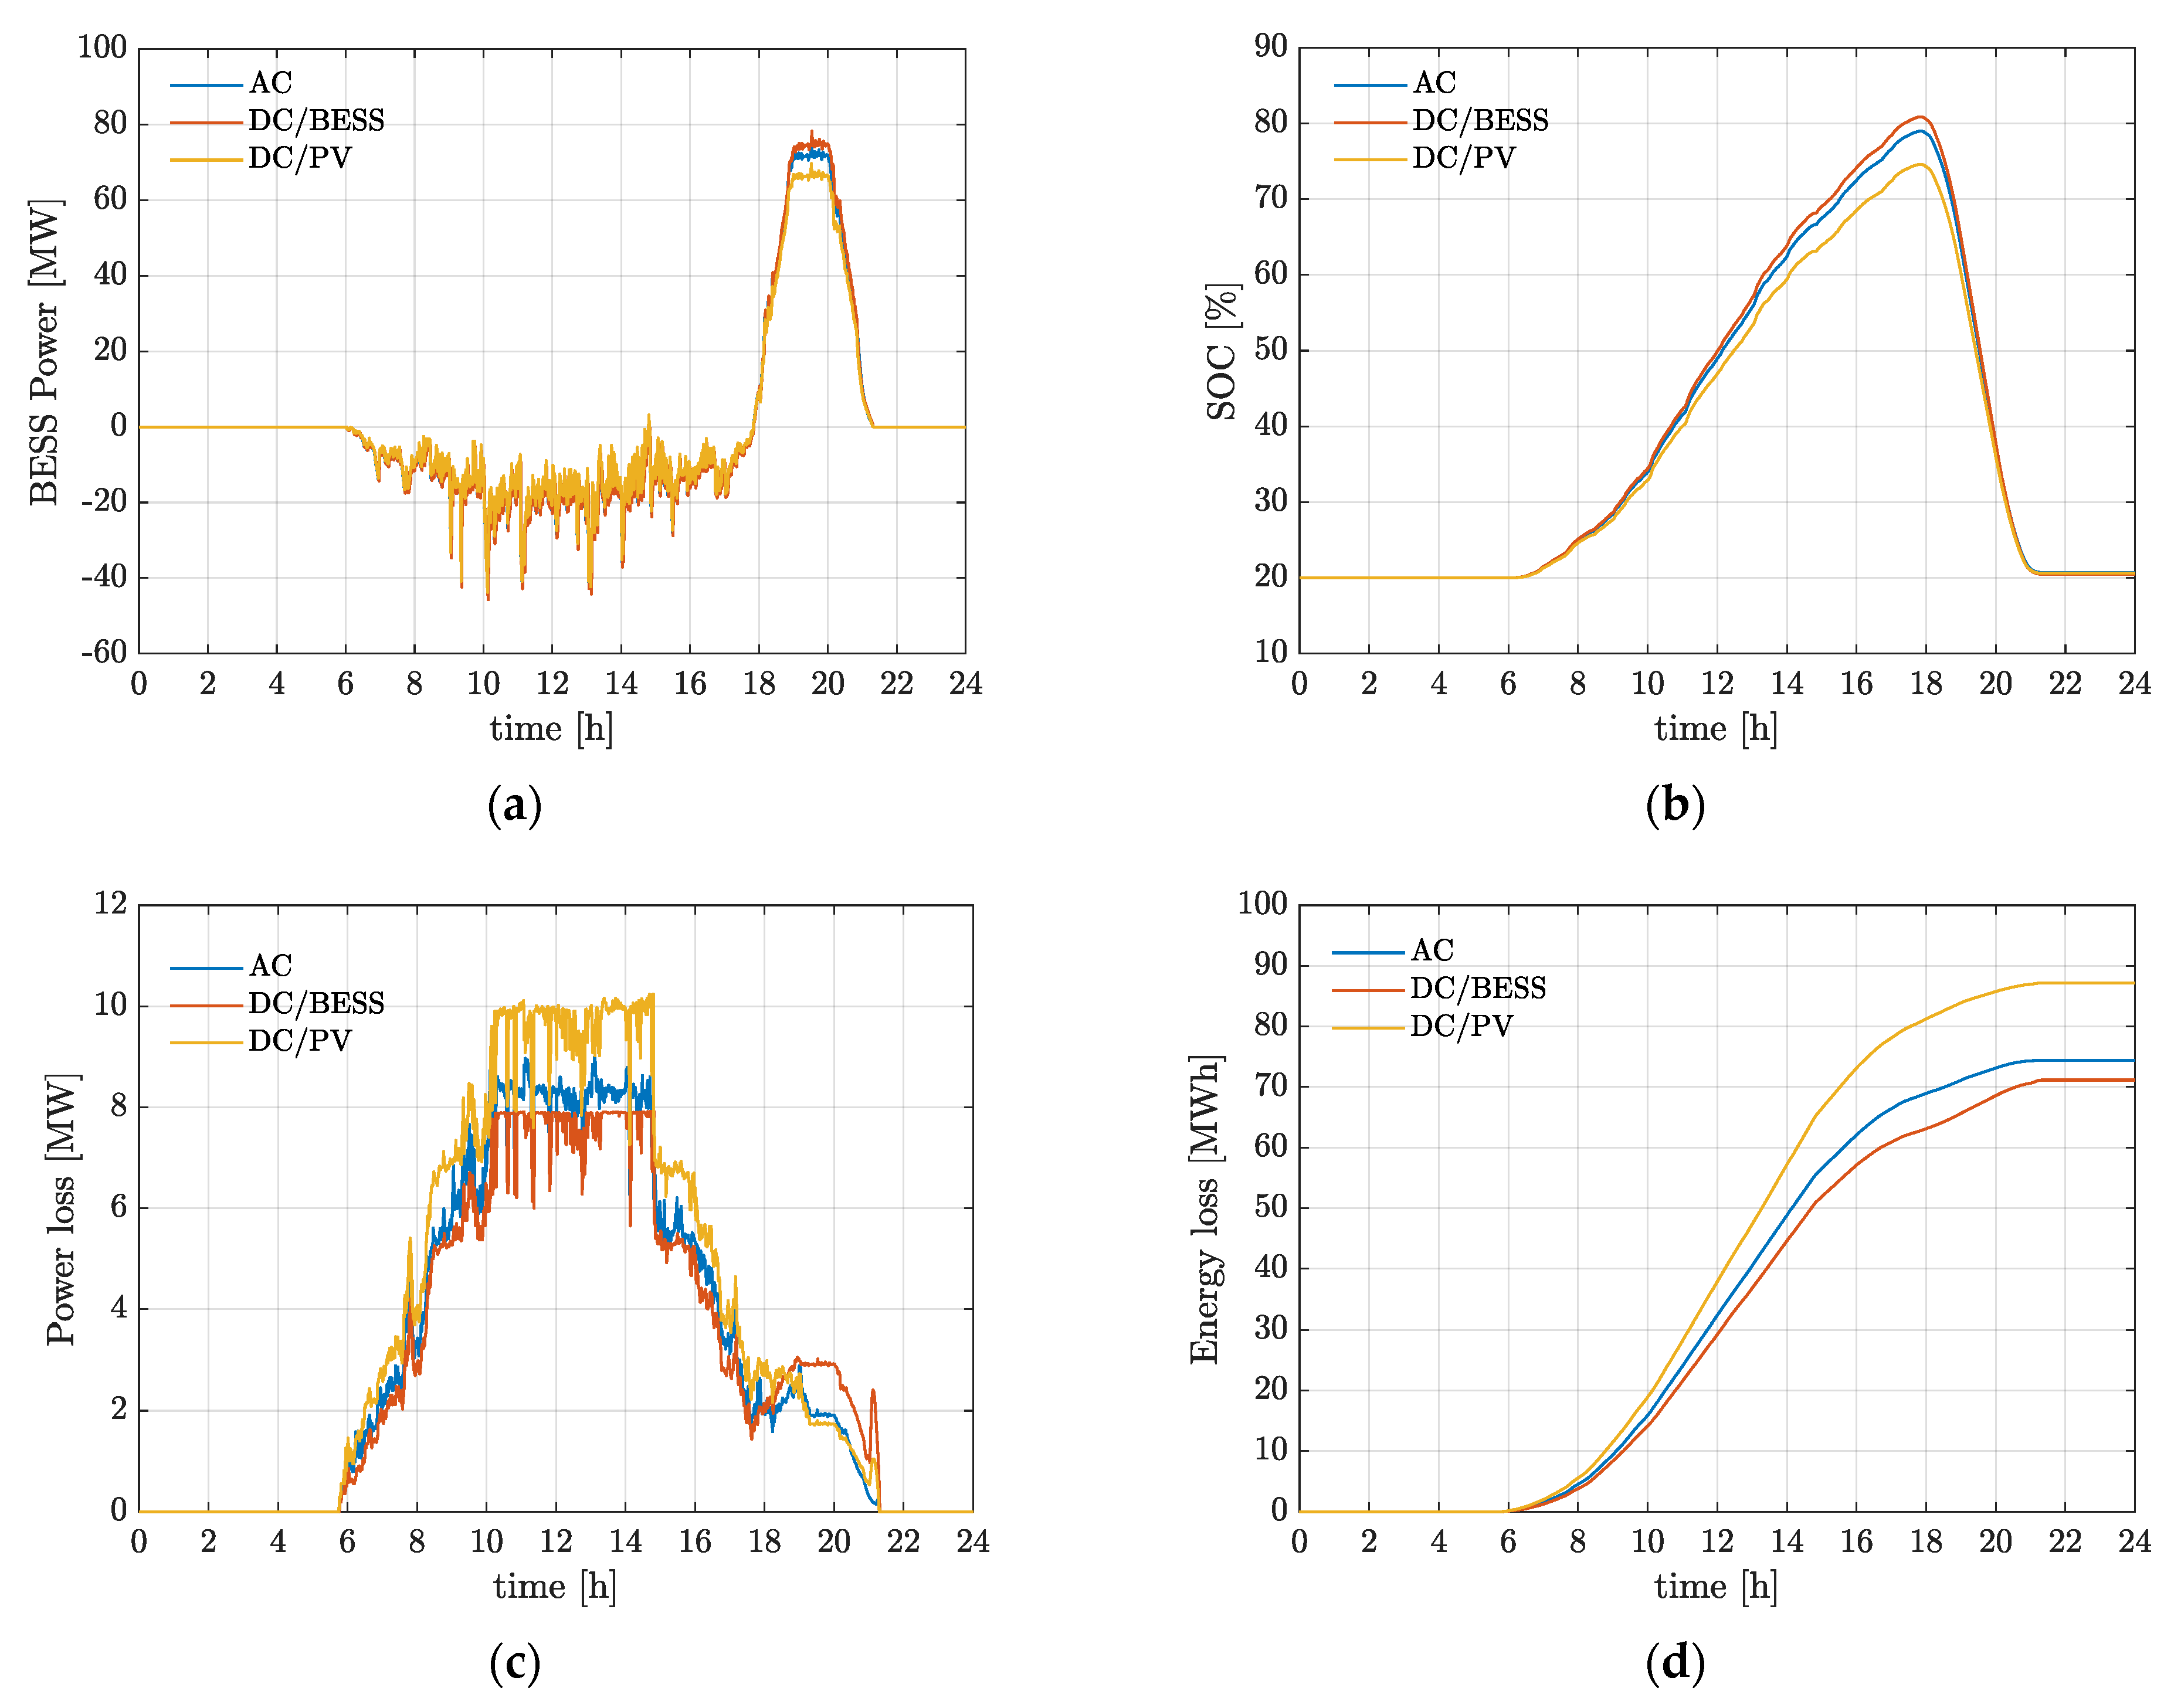
4.2. Discharging Strategy of the BESS

As previously shown, due to the fact that the lower bound f4 of the droop characteristics, corresponding to 100% of PV power conveyed to the grid, is very seldomly reached, the BESS is charged during daytime hours. A discharge strategy must then be planned for allowing the battery to operate in cyclic conditions. In this paper, we assume that in the evening, and in particular during sunset hours, the batteries start the discharging process to deliver the stored energy to the grid. This process is generally referred to as energy shifting (ES).
The scheduling of the power that the BESS should supply during the energy shifting depends on different factors, such as the BESS and PV size, the PCC load profile, the seasonal and daily irradiance, and, finally, the type of services that the plant provides. In power systems where a substantial amount of solar source is installed, the amount of power that must be generated from programmable sources (mainly thermal power plants) rapidly increases during sunset and reaches the peak in the mid-evening hours. As it is shown in [39], the higher the penetration of solar power, the higher the ramp rate of the programmable power during sunset hours. This phenomenon (which is referred to as the “duck curve” due to the power profile resembling a duck’s silhouette) is typical in electric systems with high penetration of RES. The excessive ramp rate of thermal power requires the inefficient operation of thermal power plants at reduced power and is mitigated by operating the PV+BESS power plant in energy shifting mode, that is, discharging the battery during evening hours.
To assure appropriate operation, lifetime, and safety, a minimum and maximum value of SOC that can be reached by the battery system need to be considered. A value of S O C m i n = 20% and S O C m a x = 90% are used. This operating range is typical for large battery systems, as the one considered in this paper [40]. The cyclic operation of the BESS implies that the battery is completely discharged (at the lower bound allowed) at the end of the day; hence, the following equation holds:
S O C ( 24 ) S O C ( 0 ) S O C m i n
where S O C ( 24 ) is the SOC at time t = 24 : 00 and S O C ( 0 ) is the SOC value 24 h before, that is, at t = 0 : 00 . Since the allowed SOC range is between 20% and 90%, the maximum energy ( E B ) , which could be stored in the BESS and supplied to the grid during evening hours, is 70% of E B m a x ( E B = 192 MWh). The trapezoidal power profile shown in Figure 6a is assumed for the scheduled BESS power during the evening energy shifting (discharge). In particular, constant power is scheduled from 19:00 to 20:00, while downward power rate is applied after 20:00 and the same upward ramp rate is applied to start around 18:00 ( t E S s t a r t ) for reaching the planned power, thus generating the trapezoidal profile shown. The area under the BESS power curve represents the energy E B ( s u p p l i e d ) supplied to the grid. It is worth pointing out that the curve of Figure 6a holds under the assumption that S O C ( t E S s t a r t ) = S O C m a x . In case that S O C ( t E S s t a r t ) < S O C m a x the scheduled battery power is scaled by a factor k [ 0 : 1 ] defined as:
k = S O C ( t E S s t a r t ) S O C m i n S O C m a x S O C m i n
We point out that during the energy shifting, the BESS also participates in the primary frequency regulation according to the same procedure described in Section 4.1 (i.e., the delivered power is regulated between 80% and 100% of the planned power, following the droop characteristic of Figure 3). Accordingly, the energy that the battery provides to the grid is, on average, 90% of scheduled. Hence, in order to exploit all the available capacity of the batteries, the scheduled profile of the BESS power is designed to obtain 90 % E B ( s u p p l i e d ) = 70 % E B m a x , while the maximum power allowed during discharge remains equal to 92 MW.
Figure 6b shows the power flows of the hybrid plant during three consecutive spring days with different irradiance obtained according to the criteria depicted above. The shifting effect of the delivered power is evident from the plots of Figure 6c,d, showing the battery power and SOC profiles, respectively. Finally, the SOC’s plot (Figure 6d) confirms the cyclic operation of the battery.

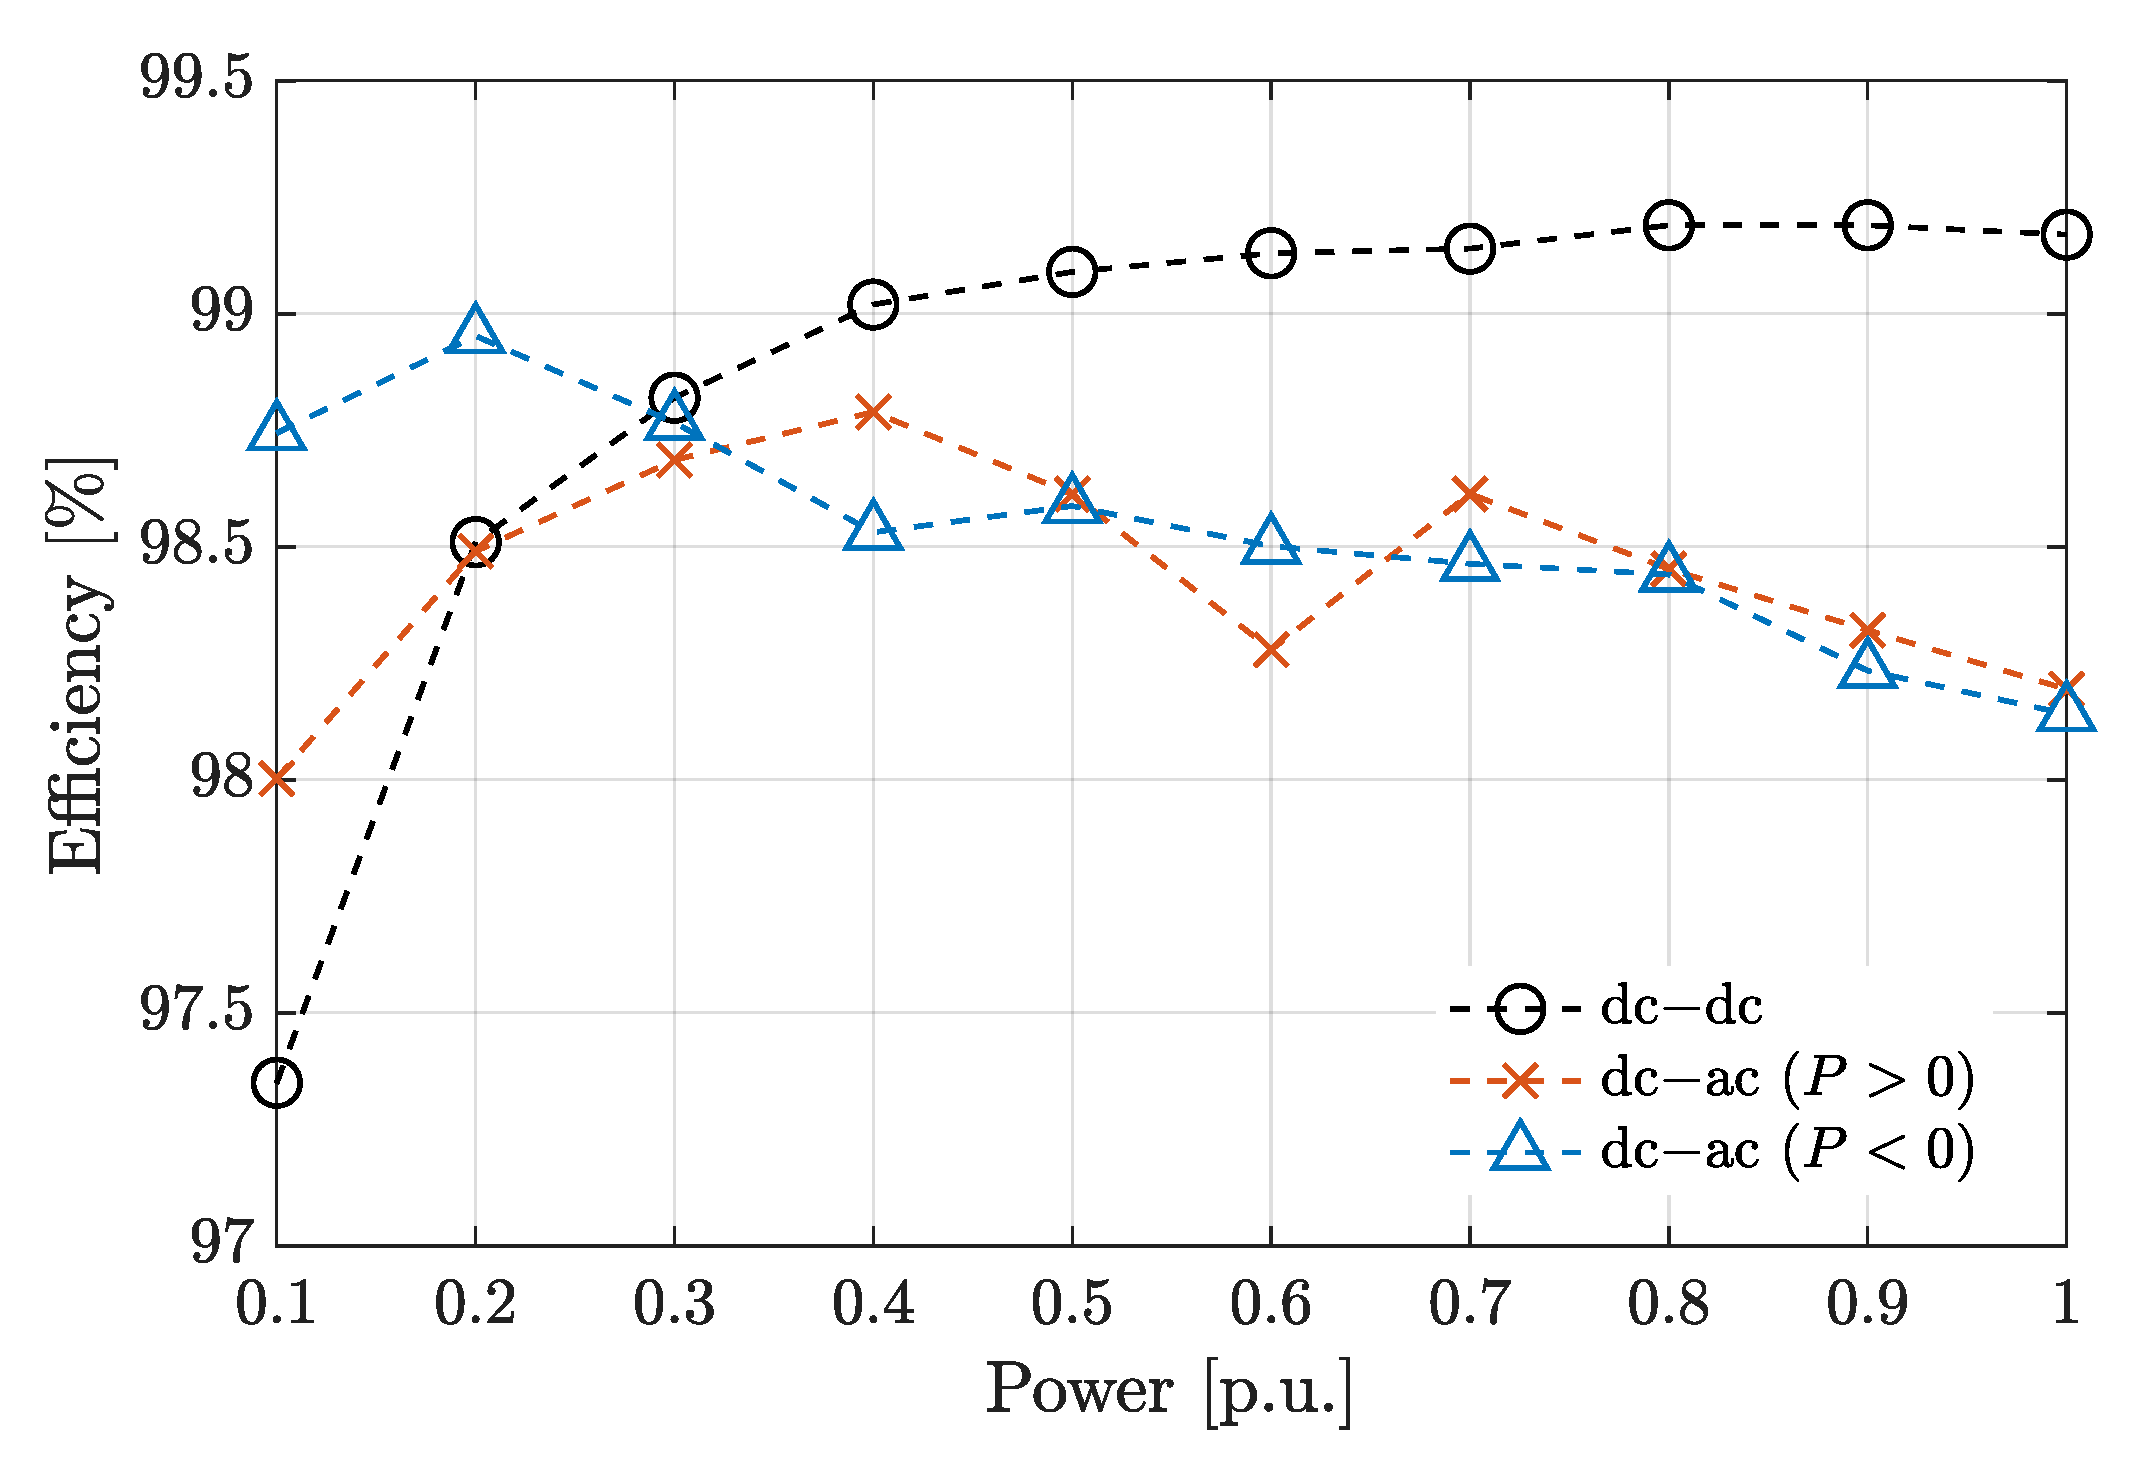
5. Plant’s Loss and Efficiency Calculation

In order to compare the performance of the three different PCS layouts, the daily energy efficiency of the plant is defined in Equation (4), where E PCC is the daily energy that the plant provides to the grid at the PCC, E PV is the daily energy that is generated by the PV, and Δ E B is the daily energy that is stored in the BESS compared to the day before. The value of Δ E B is null in perfect cyclic operation ( S O C ( 0 ) = S O C ( 24 ) ). We recall the load convention is used for defining the power PCC of the grid, and the generator convention is used for defining the power of the PV and BESS. According to Equation (4), a daily efficiency of 100% would be obtained for the plant if all the energy produced by the PV modules that are not stored in the battery were delivered to the grid. Of course, a lower efficiency is obtained in practice due to the loss of the various conversion stages, which depends on the layout considered for the PCS.
η = 0 24 P PCC ( t ) d t 0 24 P PV ( t ) d t + 0 24 P B ( t ) d t = E PCC E PV + Δ E B
To evaluate the energy efficiency, the power losses occurring in the power components, that is, transformers, dc–dc converters, and inverters, need to be evaluated.
The efficiency of the dc–dc converters and inverters is shown in Figure 7 as a function of the power normalized with respect to the converters’ rating reported in Table 1. As for the inverters, the values shown in Figure 5 are obtained by in-field measurement of the input and output power (source ENGIE Eps internal document). The efficiency of the dc–dc converter shown in Figure 7 is given by [41,42]. As for the transformer, a constant efficiency η T , independent on the power, is assumed. This is obtained by assuming, according to the datasheet [43], V c c = 6%, and by considering a power factor c o s ( φ ) = 0.95 along with the rating in Table 1. According to Figure 2, both AC and DC coupling architecture include the container transformers that connect the net power output to the MV grid. An efficiency η T P V = 98.68% is obtained for this transformer. However, the AC coupling layout also employs a second transformer connected to the BESS. This transformer manages a reduced peak power and has a lower efficiency η T B = 98.43% (generally, transformer efficiency increases as the size increases).
The intrinsic efficiency of the battery storage (i.e., at the cell terminals) is not considered in this calculation. Of course, this leads to an overestimation of the overall system’s efficiency. However, since the power flow of batteries is the same for all the considered layouts, this does not affect the results of the comparison in terms of energy losses that occur in the PCSs. However, for more details, Appendix A provides efficiency comparisons of the three layouts, including the round-trip battery losses.
During the daily operation of the PV+BESS plant, different power flows can occur between PV, grid, and BESS, regardless of the layout of the PCS. However, as it can be deduced from Figure 2, the number of conversion stages involved in the power flows depend on the PCS’s layout. For example, when power flows from PV to PCC, the AC-coupling and the DC-coupling/BESS side layouts involve two conversion stages (inverter and transformer), whereas the DC-coupling/PV-side involves three conversion stages (dc–dc converter, inverter, and transformer) and is less efficient. On the other hand, when power flows from BESS to PCC, the less efficient layout is the DC-coupling/BESS side coupling because it presents one conversion stage more than the others. Similarly, different conversion stage number and efficiency is obtained for the three layouts when the power flow from PV to BESS is considered (in this case the worst-performing layout is the AC-coupling since it involves two converters and two transformers). The count of the conversion stages and the efficiency for each layout, and the different power flows are resumed in Table 2.
The daily energy loss E L for each layout can be calculated based on the power losses P L ( t ) during plant’s operation as follows.
E L = 0 24 P L ( t ) d t
where P L is given by the difference between the input and output power of the conversion stage. The input and output power of each conversion stage is shown in Figure 8.
For the three layouts. Based on the symbols of Figure 8a, the power flows and energy losses of the AC-coupling layout are expressed by:
E L = 0 24 ( P PV P PV a c ) d t + 0 24 | P B P B a c | d t
P B a c = { ( η i n v B   η T B ) P B ,     d i s c h a r g i n g 1 η i n v B   η T B P B ,     c h a r g i n g
P PV a c = ( η i n v PV   η T P V ) P PV
P PCC = P PV a c + P B a c
Based on the symbols of Figure 8b, the power flows and energy losses of the DC-coupling/BESS-side layout are expressed by:
E L = 0 24 ( P PCC d c P PCC ) d t + 0 24 | P B P B d c | d t
P B d c = { η d c d c P B ,     d i s c h a r g i n g 1 η d c d c P B ,     c h a r g i n g
P PCC d c = P PV + P B d c
P PCC = ( η i n v η T ) P PCC d c
Finally, based on the symbols of Figure 8c, the power flows and energy losses of the DC-coupling/PV-side layout are calculated by the following equations:
E L = 0 24 ( P PCC d c P PCC ) d t + 0 24 ( P PV P PV d c ) d t
P B = P PCC d c P PV d c
P PV d c = η d c d c P PV
P PCC = ( η i n v   η T ) P PCC d c
The daily energy losses of the AC-coupling, DC/BESS-side, and DC/PV-side layout are calculated by means of Equations (6), (10) and (14), respectively. For example, focusing on AC-coupling, P PV a c is the PV power net of the conversion losses (ac-side) and is affected by the inverter and transformer efficiencies (Equation (8)). The second term of the right side of Equation (6) refers to the energy loss in the BESS leg of the system, where P B a c is the battery power that is measured on the ac-side. Since the batteries’ power flows are bidirectional, the difference between P B and P B a c can be positive or negative. Hence, the absolute value appears in the BESS term of Equation (6). According to the generator convention used, P B a c is calculated by Equation (7) during charging and discharging. Finally, the PCC power is given by Equation (9). Based on the nomenclature and definitions introduced, the performance of the three layouts in terms of losses and efficiency is carried out in the next section.

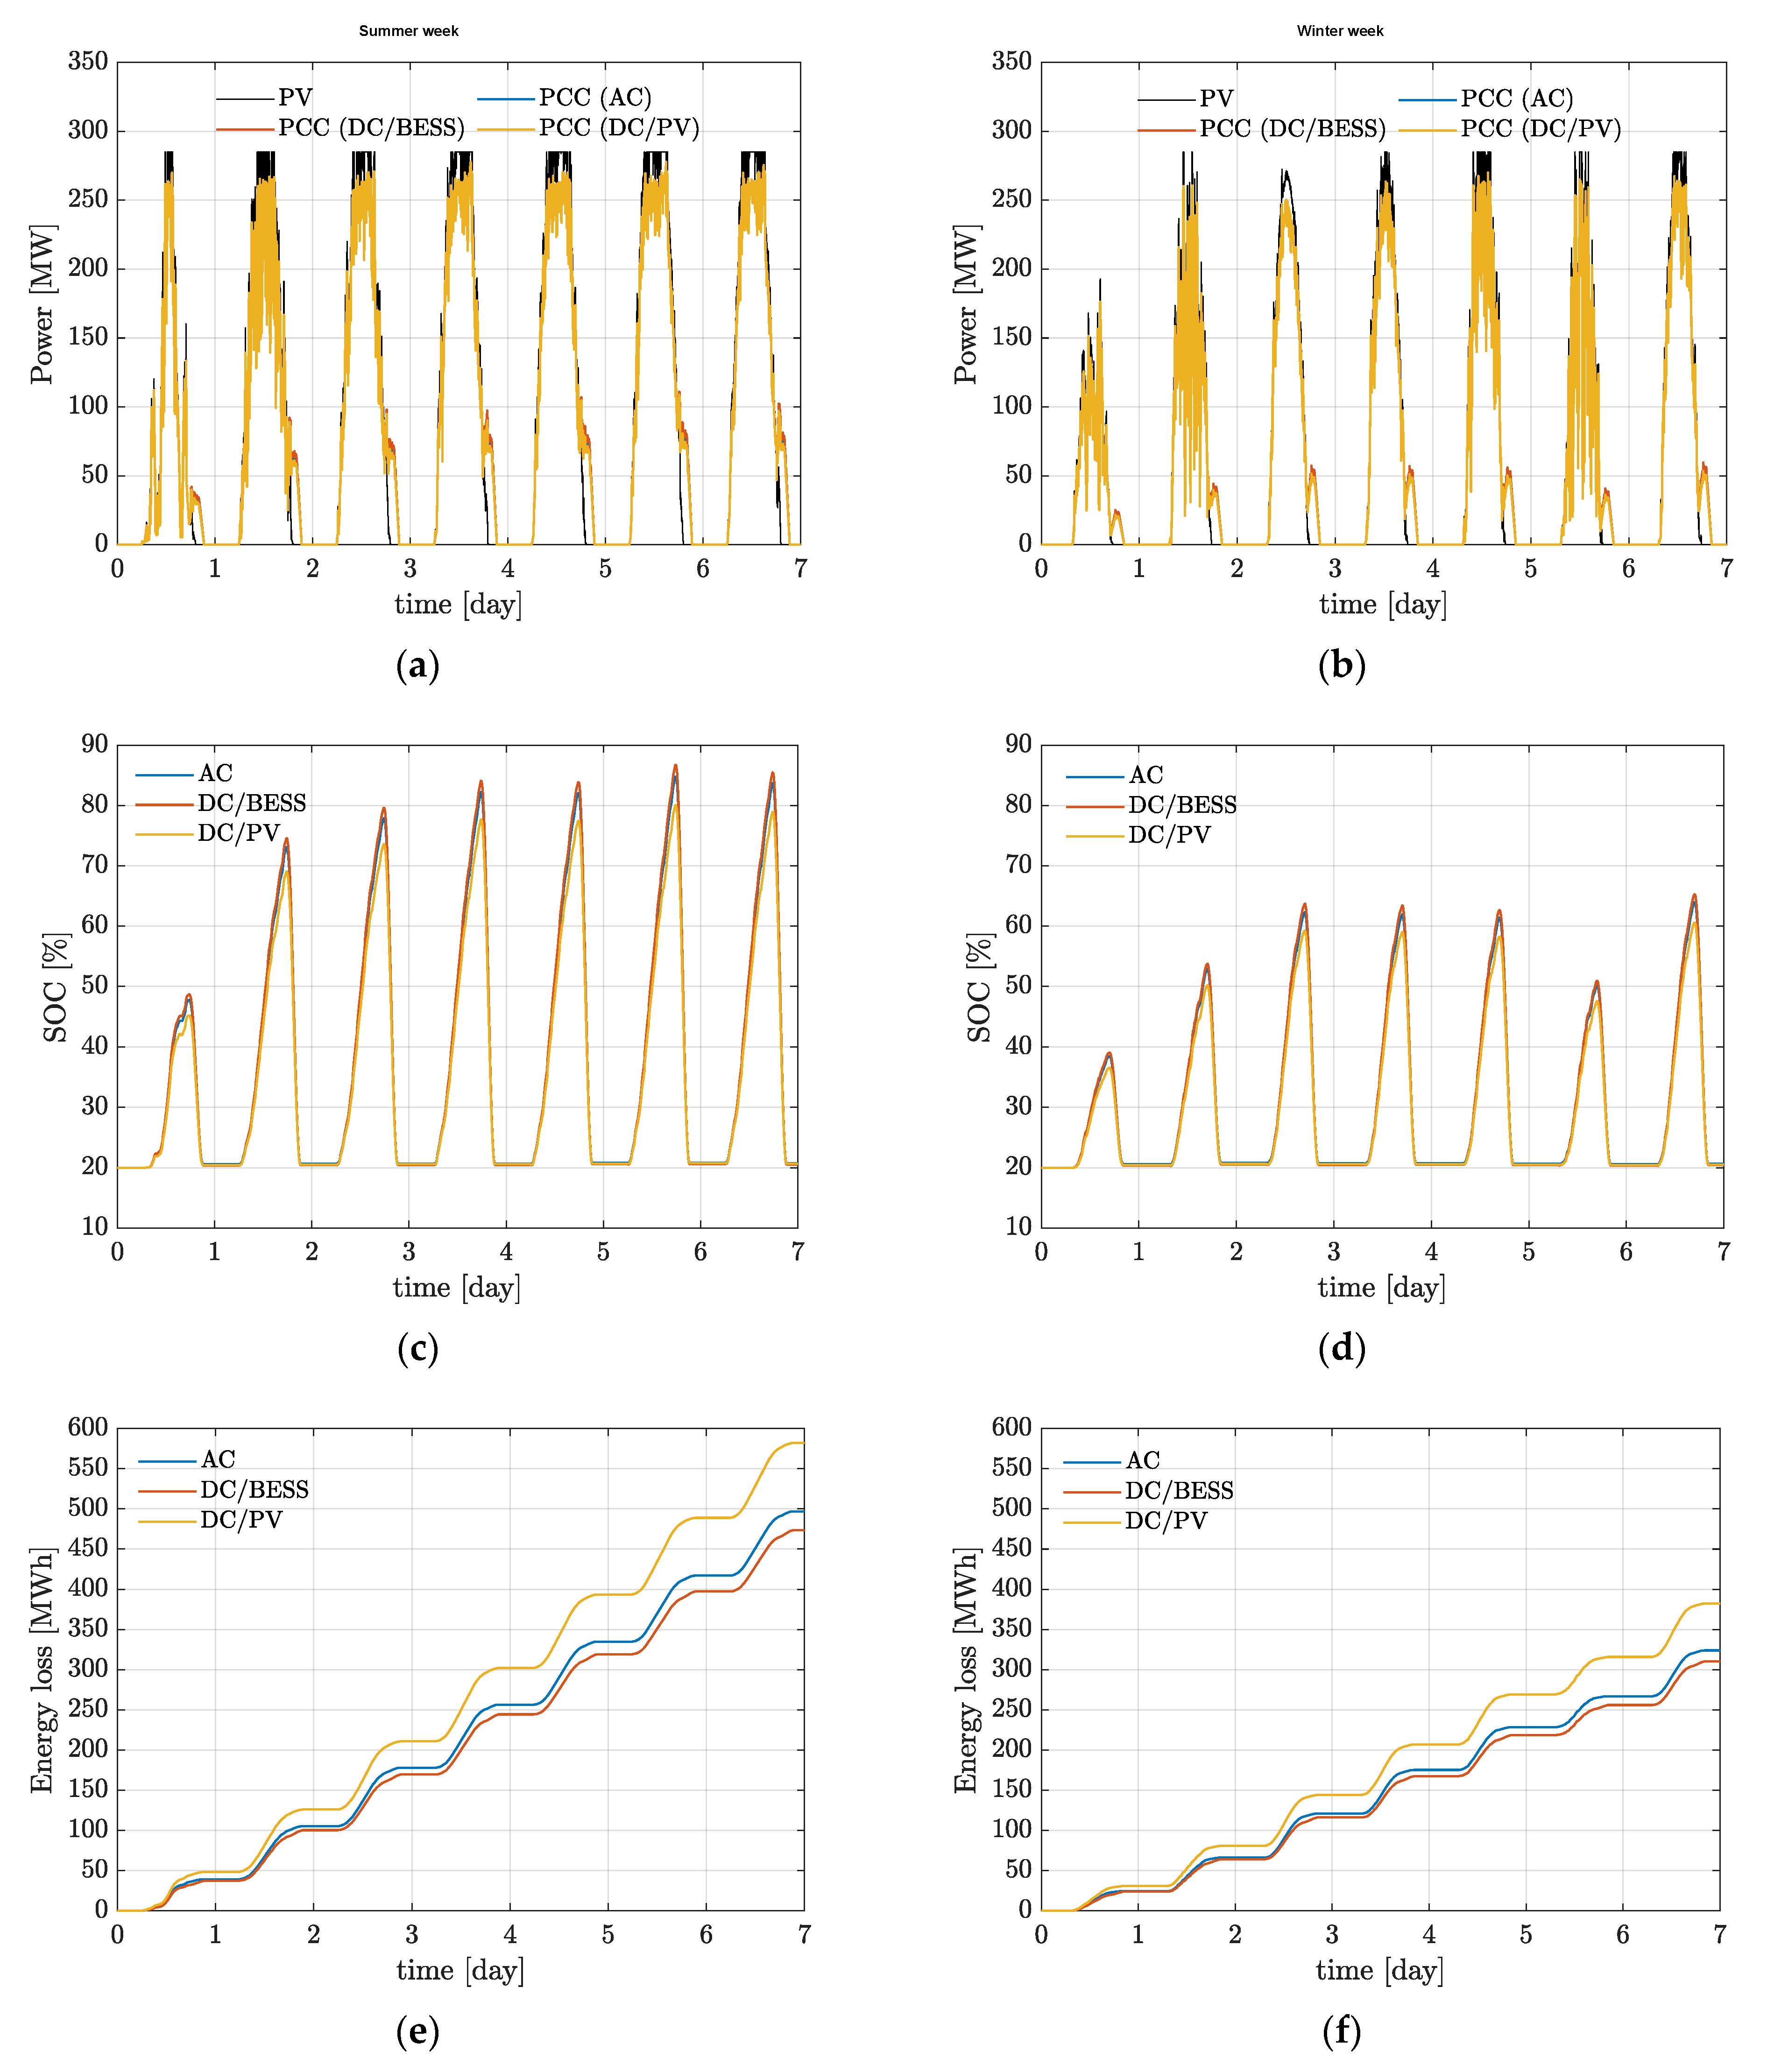
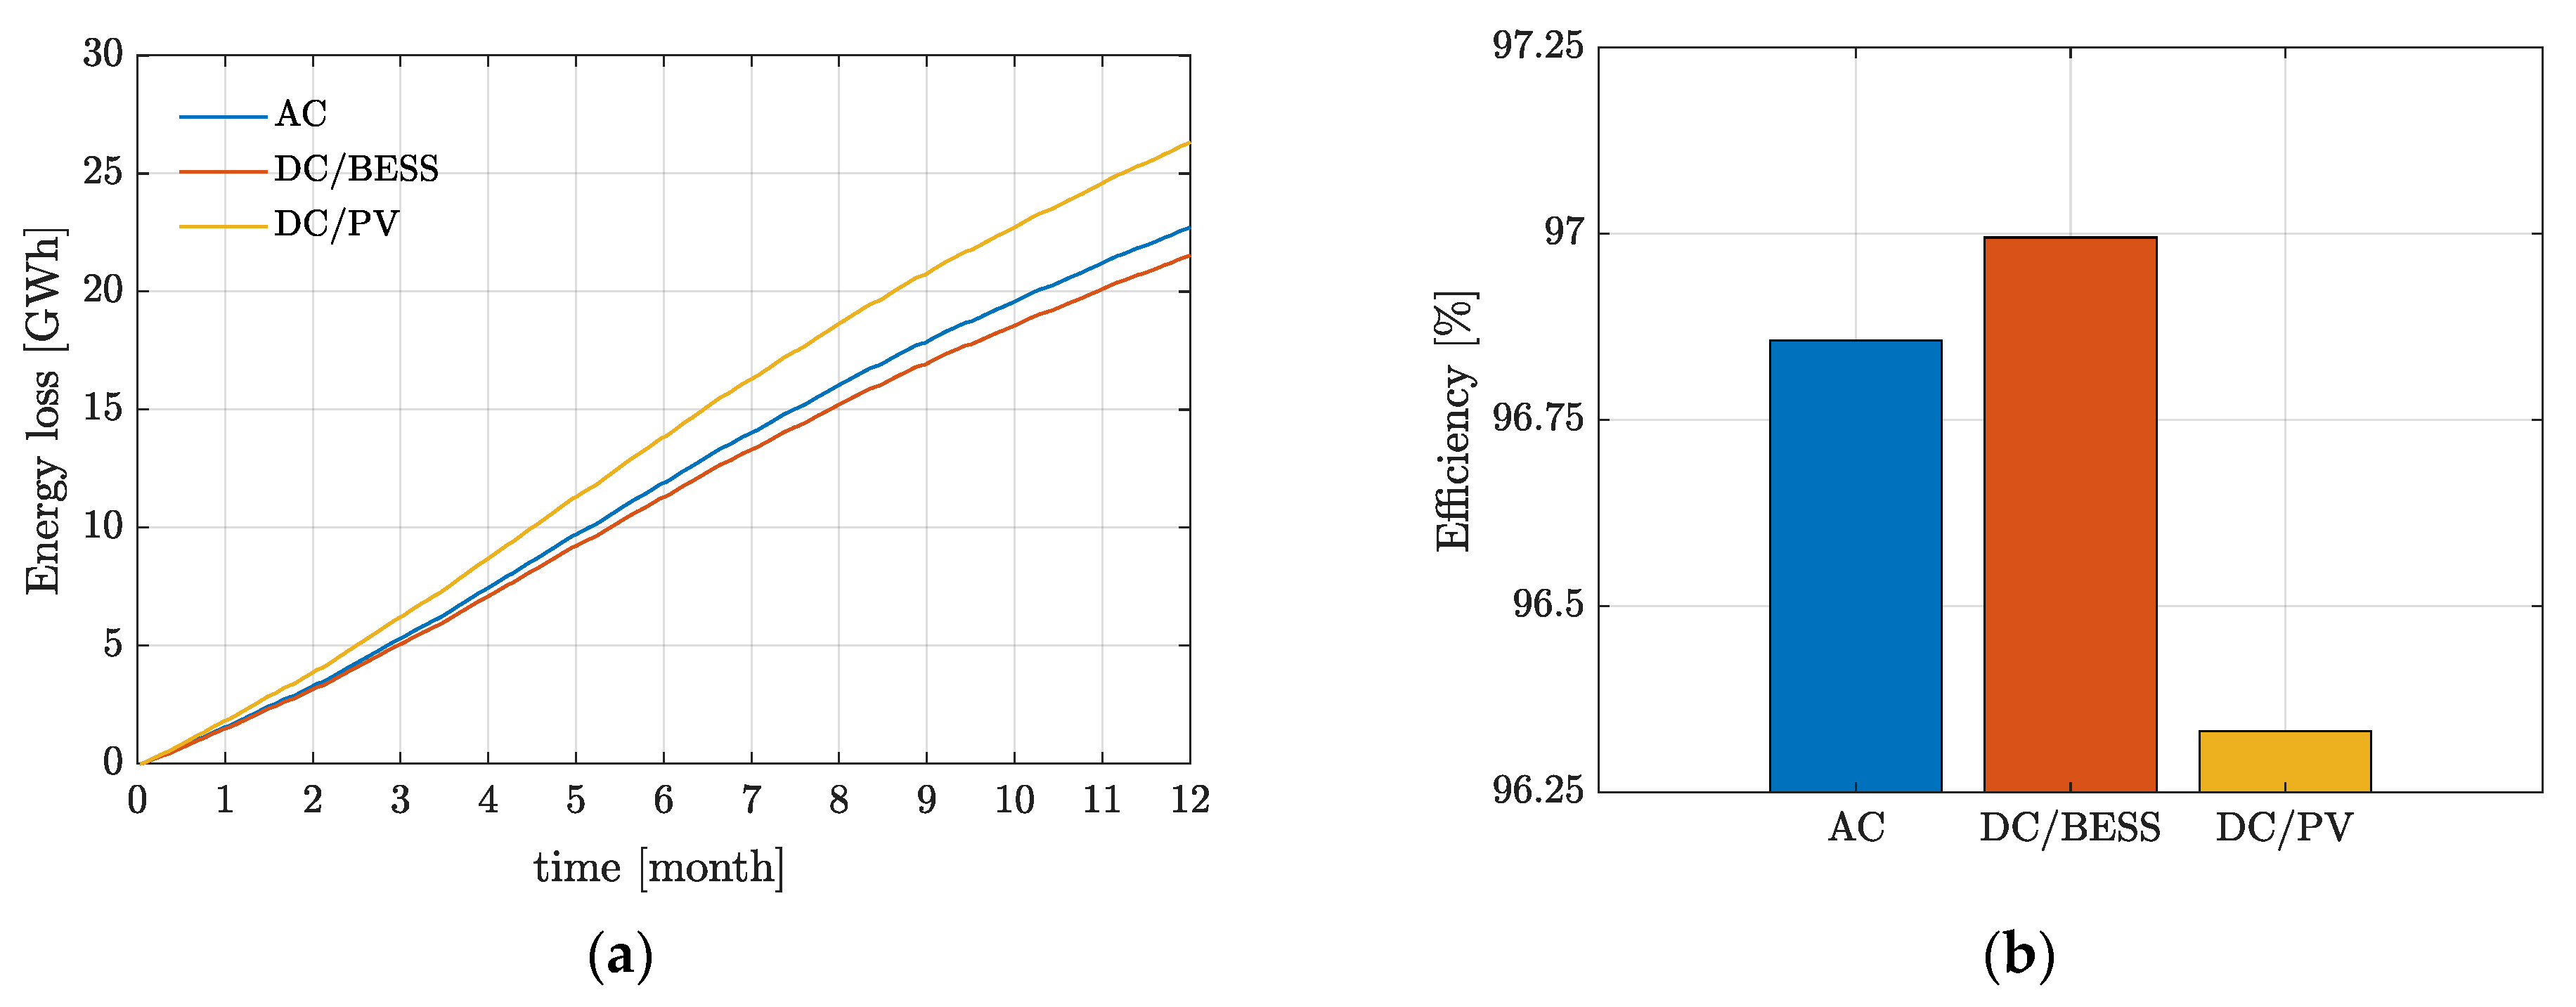
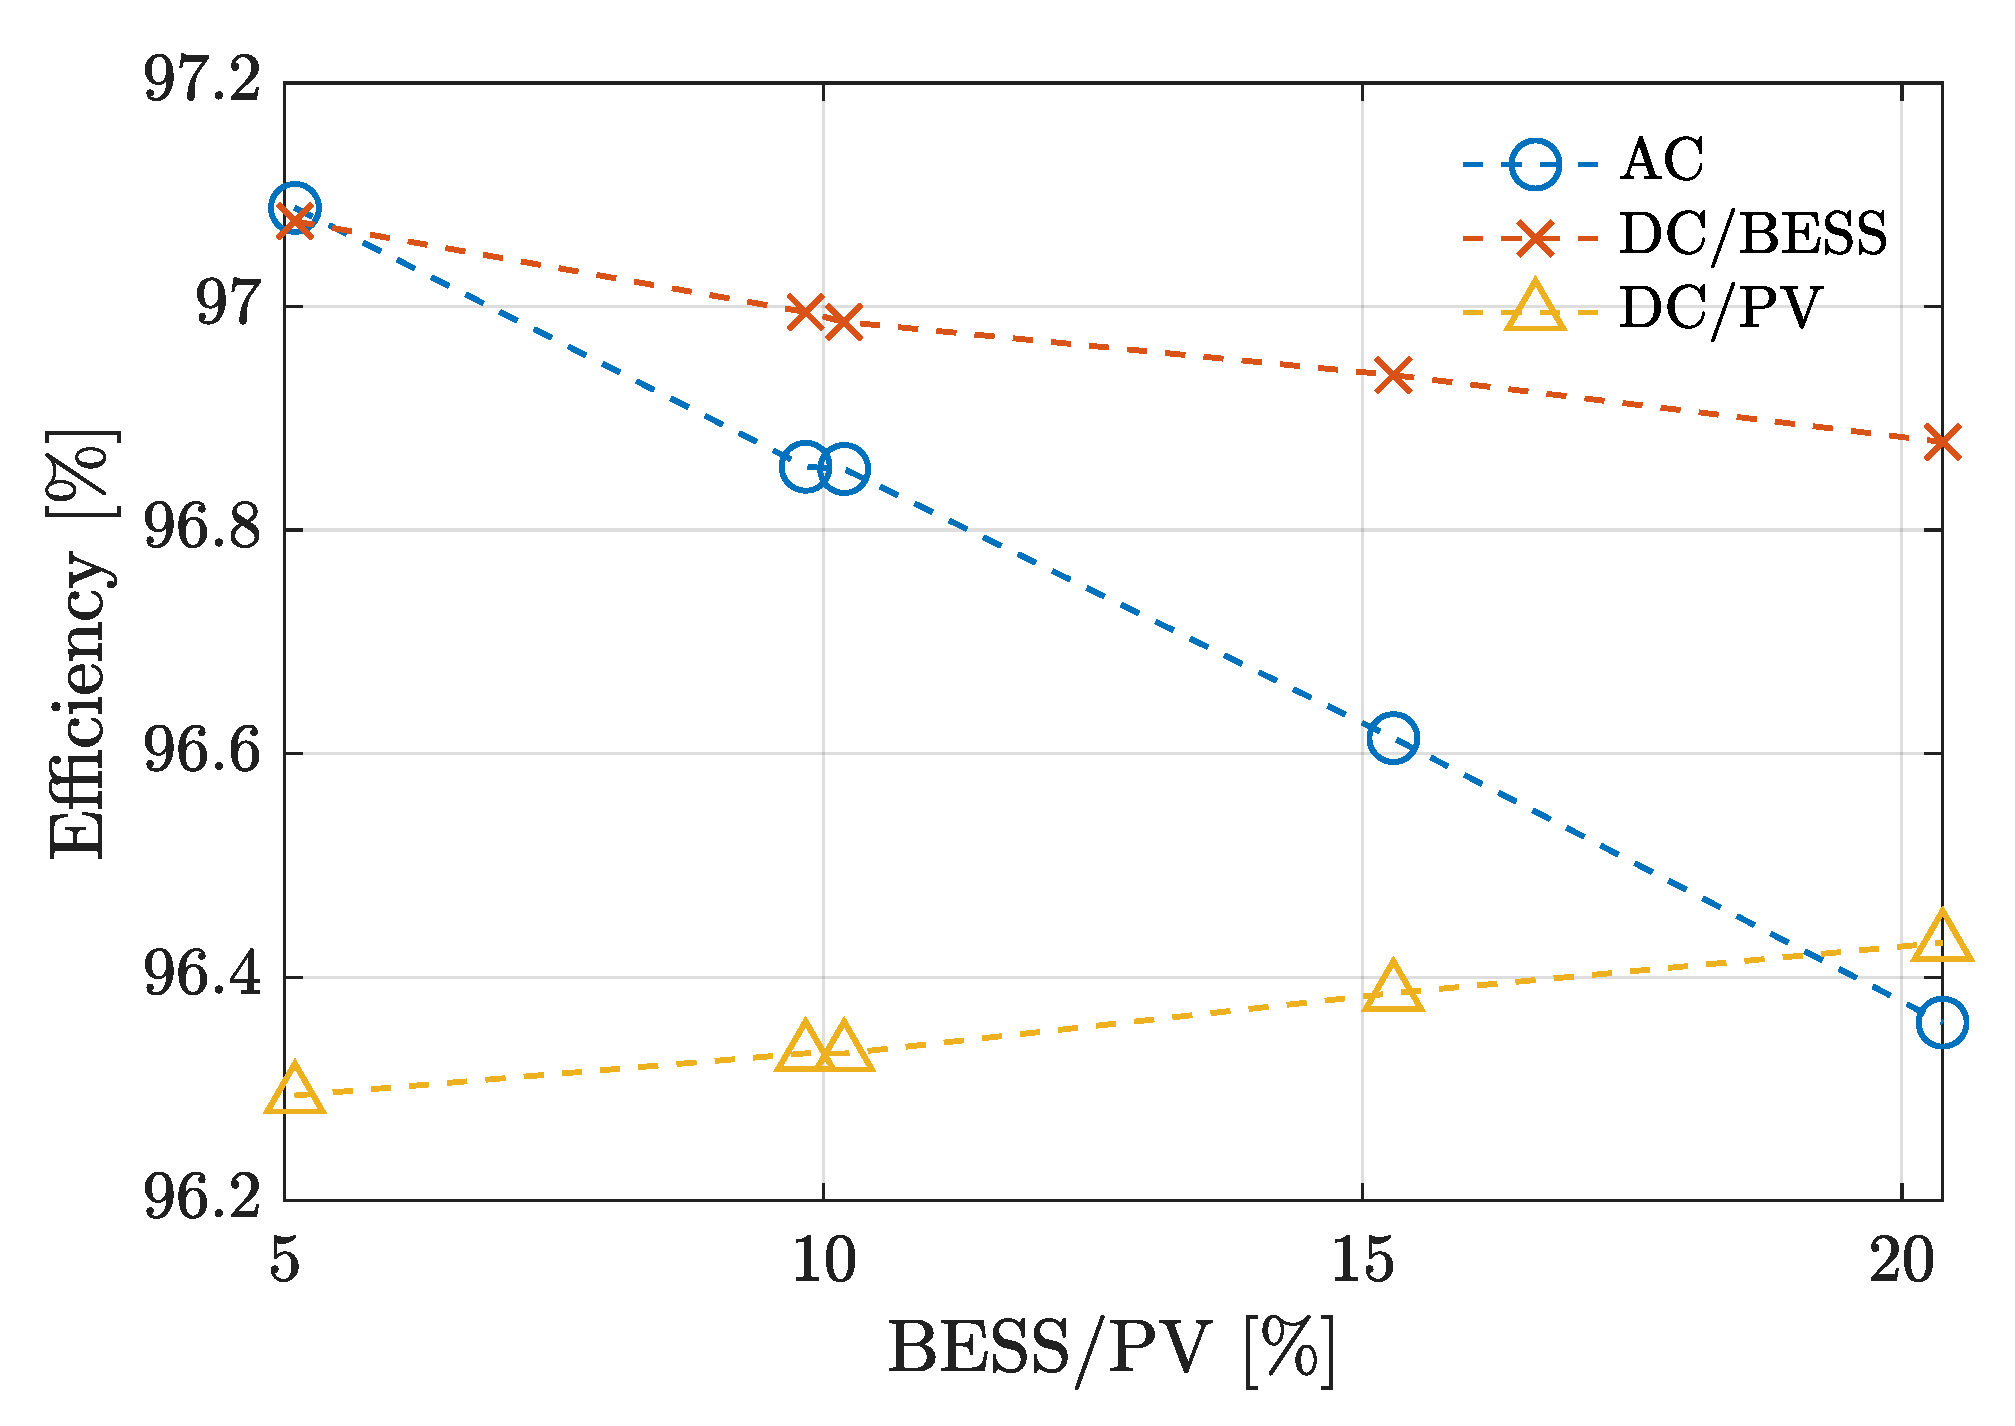
6. Results and Discussion

This section shows the simulation results of the reference PV+BESS plant described in Section 2. The calculation is carried out in MATLAB/Simulink and runs with a one-minute resolution. Figure 9 shows the power delivered to the grid for the three layouts during one typical summer day. The generated PV power, which is common for all the layouts, is also shown in the figure. As discussed in Section 4 all layouts deliver, on average, 90% of the available PV power to the grid during daytime hours and use the 10% excess power to charge the battery. The energy stored during the day is delivered to the grid in evening hours (energy shifting), as can be seen in the figure. At a first glance, no substantial difference can be appreciated in the delivered power profile of the three layouts.
A substantial difference indeed exists in terms of loss and overall efficiency, which can be appreciated by a more careful analysis of the results. The battery power of each layout during the simulated 24 h is shown in Figure 10a. The corresponding profile of SOC is shown in Figure 10b. The overall power loss (MW), i.e., the loss occurring in all conversion stages, is shown in Figure 10c. The corresponding energy loss (MWh) is finally shown in Figure 10d.
It can be seen from Figure 10c that during the daytime, the DC-coupling/BESS-side layout shows less loss compared to the AC-coupling due to the reduced conversion stages (1 versus 4) involving the power flow from PV to the battery. As a result, a higher SOC, corresponding to higher stored energy, is reached with the DC–BESS layout during daytime (see Figure 10b). On the other hand, during the evening hours, the energy only flows from the battery to the grid, and the DC-coupling/BESS-side presents the highest losses due to one more conversion stage. However, avoided losses of the AC-coupling during discharge (two versus three converter stages) are less than increased losses during charge (four versus one converter stages); hence lower overall energy losses are obtained with the DC-coupling/BESS during the day cycle as it can be seen in Figure 10d.
The worst performing layout in terms of losses is the DC-coupling/PV-side, as can be seen from the plots in Figure 11. This layout is, along with the AC coupling, the most efficient during energy shifting in the evening hours (battery discharge) since it only presents two conversion stages. However, the amount of energy involved in the energy shifting is only about 10% of the daily PV energy. The main of the energy, which is 90% of the PV energy, follow the PV-to-grid path and involves three conversion stage (compared to two conversion stage only for the other two layouts), thus production the highest overall losses shown in Figure 10b,c.
The PV power data used in this study are obtained by a one-year measurement with a one-minute resolution from a power plant located in Central America The impact of the different daily and seasonal irradiance conditions on the system’s loss, and efficiency is evaluated in the following. In Figure 11, the grid power (Figure 11a,b) and the battery SOC (Figure 11c,d) of the three different layouts during one week in two different periods of the year are shown. The figure confirms the cyclic operation of the battery during all days, regardless of the available PV power. The energy losses of the three different layouts are also shown in Figure 11e,f.
It can be seen that the DC-coupling/BESS-side remains the best performing layout in terms of loss and efficiency in all irradiance conditions. In particular, the total energy loss of the DC-coupling/BESS-side in a summer week is about 470 MWh, while 23 MWh (4.9%) and 110 MWh (23.4%) more losses are obtained for the AC-coupling and DC-coupling/PV-side layouts, respectively. The winter week simulation follows a similar trend, with 310 MWh total energy loss for the DC-coupling/BESS-side, 14 MWh (4.5%) more losses for the AC-coupling, and 72 MWh (22.2%) more losses for DC-coupling/PV-side.
To allow a quantitative comparison of the performance of the three systems in all operating conditions, the values (MWh) of the PV energy, PCC energy, BESS energy, and total energy loss are reported in Table 3 for three days with different irradiance conditions: the low-irradiance condition (in which the PV produces 779.8 MWh in total), the mean-irradiance condition (with the PV producing 1957.9 MWh), and the high-irradiance condition (with the PV producing 2398.1 MWh).
Finally, the annual energy loss and efficiency obtained by simulating an operating time of one year are shown in Figure 12a,b, respectively. The one-year analysis confirms the trend reported by the one-day and weekly simulations. The most efficient layout is the DC-coupling/BESS-side, which presents 21.48 GWh of losses per year and has an average annual efficiency of 97.02 % . The losses of the AC-coupling are 22.67 GWh per year ( + 1190 MWh), corresponding to an annual average efficiency of 96.86 % . The worst performing layout is the DC-coupling/PV-side with 26.26 GWh losses per year ( + 4780 MWh) and annual average efficiency of 96.34 % .
As pointed out in the previous discussion, the efficiency of the layouts is affected by the amount of energy involving the BESS compared to the available PV energy. Below, an efficiency comparison of the three layouts is carried out, considering different ratios between the BESS energy and PV energy. In particular, the previous one-year simulation is run, considering the same battery capacity of 275 MWh, for different values of the PV plant rating (MWp), and efficiency is calculated as a function of the BESS/PV ratio, which is defined as the percentage amount of daily energy operated by the battery (70% of the nominal capacity) and the daily PV generated energy. The same irradiance conditions, same frequency profile, same deadband ( ± 0.012   Hz ), and same frequency thresholds ( ± 0.3   Hz ) are considered for calculating the PCC power according to the PFR method described in Section 4.1. The same bounds of the allowable SOC interval (20% and 90%) are also used. On the other hand, the drop of the PFR is changed based on the considered PV plant rating (MWp) for ensuring that the allowed storage capacity of the battery is fully exploited in all considered cases. In other words, the higher the battery capacity with respect to the average daily PV production (the higher BESS/PV ratio), the higher the regulating power (in the percentage of the PV power) that the plant can provide.
The assumed settings of the PFR in all the considered cases are resumed in Table 4. Table 4 also includes the reference case discussed above (275 MWh/288 MWp). It is noteworthy that the size considered for the PCSs is scaled according to the PV power, so to leave the efficiency of each conversion system unchanged. The average annual efficiency obtained for the different BESS/PV ratios of Table 4 is shown in Figure 13. The results show that under low BESS/PV ratios, the difference in terms of total efficiency between the AC-coupling and the DC-coupling/BESS-side decreases (while their overall efficiency slightly increases). These two layouts approximately present the same losses and efficiency value if BESS/PV ≤ 5%. The gap of efficiency of the AC-coupling layout with respect to the DC-coupling/BESS-side constantly increases with increasing the BESS/PV ratio. For the BESS/PV ratios of around 20%, both DC-coupling layouts present higher efficiency than AC-coupling (the latter becomes even less efficient than the DC-coupling/PV-side).

7. Conclusions

The efficiency comparison of three different layouts of power conversion systems that can be used in large PV+BESS power plants providing primary frequency reserve and energy shifting service to the grid was carried out. The proposed method can be applied to PCS with different sizes, power ratings, and components’ numbers. AC-coupling and DC-coupling layouts were investigated, and a utility-scale plant with 288 MWp PV power and 92.2 MW/275.2 MWh of total battery capacity was considered as a case study. The power flows in the different components of the system were calculated under realistic operating conditions and total energy losses, and annual average efficiency was calculated accordingly. It was found that under the same input–output condition (irradiance, PFR, and dispatching settings), the best performing PCS layout is DC-coupling with dc–dc converter at the battery side, presenting an annual average efficiency of 97.02 % , followed by the AC-coupling presenting annual average efficiency of 96.86 % . The worst performing layout is the DC-coupling with dc–dc converter at the PV-side, with an annual average efficiency of 96.34 % . The different performances were related to the different number of conversion stages involving the energy flow from PV to battery during PFR service in day hours and from battery to grid during energy shifting in evening hours. It was also shown that by increasing the storage capacity of the battery with respect to average daily PV production, the losses of the AC coupling layout increase, and the advantage of adopting the DC-coupling with dc–dc converter at the battery side becomes even greater.

Author Contributions

Conceptualization, F.L.F., A.M., P.R. and G.G.; methodology, F.L.F. and A.M.; software, F.L.F.; validation, F.L.F., A.M., P.R. and G.G.; formal analysis, F.L.F., A.M., P.R. and G.G.; investigation, F.L.F.; data curation, F.L.F., A.M., P.R. and G.G.; writing—original draft preparation, F.L.F. and A.M.; writing—review and editing, F.L.F., A.M., P.R. and G.G.; visualization, F.L.F., A.M. and P.R.; supervision, A.M., P.R. and G.G. All authors have read and agreed to the published version of the manuscript.

Funding

This work was supported by the project ENERGYNIUS (ENERGY Networks Integration for Urban Systems), funded by POR-FESR Region Emilia-Romagna (Italy) 2014–2020.

Data Availability Statement

The original contributions presented in the study are included in the article material, further inquiries can be directed to the corresponding author.

Conflicts of Interest

The authors declare no conflict of interest.

Appendix A

The purpose of this work was to analyze and compare the losses that involve three different power conversion system architectures in hybrid PV+BESS large power plants. Focusing on the PCS, the comparison was carried out considering the power flows converted in each PCS’s element (dc–dc converter, dc–ac converter, and transformer). In fact, the PCS is the only element of the power plant that changes among the three examined layouts. Of course, without considering the battery round trip efficiency, an overestimation of the overall system’s efficiency is obtained. On the other hand, focusing only on the PCS efficiency (without considering the battery’s one), it is possible to estimate and compare with more accuracy and sensitivity the loss performance of the PCSs. Moreover, the BESS can consist of different cell technologies, and accordingly, the round trip battery efficiency strongly depends on the used chemistry. However, this appendix aims to provide an estimation of the total efficiency, also considering the battery round trip losses in the calculation. For these reasons, simulations were carried out, including the battery efficiency in the total losses calculation.
Considering assuming a LiFePO technology, the battery efficiency data are provided by the reference [44] and the reports in [34]. As shown in the reference documents, the battery energy efficiency ( η B ) is defined as the ratio between discharge energy and charge energy and depends on the charging–discharging rate. The annual average C-rate under the operating condition of the plant is less than 0.1 C. Reference [44] reports the efficiency from 4 C ( η B = 88%) down to 0.25 C ( η B = 98%), showing that the efficiency monotonically increases when the C-rate decreases. The battery losses can be introduced in the calculation of the layout’s efficiency. As shown in Figure A1, it is possible to consider the battery as a system composed of an ideal subsystem and a subsystem that introduces the battery conversion losses.
Figure A1. Power flow that involves the battery considering the round trip conversion losses.
Energies 14 04823 g0a1
Referring to Figure A1, the following equations hold:
E B l o s s = 0 24 | P B P B T | d t
P B = { η B c h P B T ,     c h a r g i n g . 1 η B d i s P B T ,     d i s c h a r g i n g .
where η B c h and η B d i s are the charging and discharging efficiency of the battery, P B T is the BESS power measured at the battery cell terminals, and P B is the power ideally measured inside the cell, e.g., to the net of conversion losses during the charging. However, the battery round trip efficiency refers to the cyclic operation, and it considers both the charging and discharging process. Since the annual average C-rate is considered, it is possible to assume the following equation that relates the round trip efficiency with the charging and discharging efficiency:
η B c h = η B d i s = η B
The battery losses are included in the calculation of the whole losses and efficiency, and the obtained results are shown in Table A1.
Table A1. PCS+BESS efficiency as a function of the round trip battery efficiency.
PCS+BESS Efficiency
Battery Round Trip EfficiencyAC-CouplingDC/BESS
Coupling
DC/PV
Coupling
Average C-Rate (LiFePO)
100%96.86%97.02%96.34%≤0.25 C
98%96.75%96.92%96.24%
95%96.56%96.71%96.05%0.25 < C-rate ≤ 4
90%96.22%96.37%95.75%
85%95.89%96.03%95.44%
80%95.56%95.69%95.14%>4 C
Table A1 shows that, despite the overall system’s efficiency decrease with the decrease in the battery round trip efficiency, the ranking of the three different layouts remains unchanged (1st DC/BESS, 2nd AC, and 3rd DC/PV). We report that percentage difference among efficiency values decrease with the decrease in the battery efficiency due to the lower value of η B compared to the PCS efficiency. The final efficiency is more weighted by the battery losses, and the sensitivity of the efficiency parameter as a function of the PCS layout decreases accordingly. Moreover, considering the average C-rate with which the battery works (0.08 C) may be possible to also assume η B around or higher than 98%, and the error introduced is less relevant.

References

  1. Liu, X.; Aichhorn, A.; Liu, L.; Li, H. Coordinated control of distributed energy storage system with tap changer transformers for voltage rise mitigation under high photovoltaic penetration. IEEE Trans. Smart Grid 2012, 3, 897–906. [Google Scholar] [CrossRef]
  2. Luo, C.; Ooi, B.T. Frequency deviation of thermal power plants due to wind farms. IEEE Trans. Energy Convers. 2006, 21, 708–716. [Google Scholar] [CrossRef]
  3. Kroposki, B.; Johnson, B.; Zhang, Y.; Gevorgian, V.; Denholm, P.; Hodge, B.M.; Hannegan, B. Achieving a 100% renewable grid: Operating electric power systems with extremely high levels of variable renewable energy. IEEE Power Energy Mag. 2017, 15, 61–73. [Google Scholar] [CrossRef]
  4. Chamana, M.; Chowdhury, B.H.; Jahanbakhsh, F. Distributed control of voltage regulating devices in the presence of high PV penetration to mitigate ramp-rate issues. IEEE Trans. Smart Grid 2018, 9, 1086–1095. [Google Scholar] [CrossRef]
  5. Datta, U.; Kalam, A.; Shi, J. Battery energy storage system control for mitigating PV penetration impact on primary frequency control and state-of-charge recovery. IEEE Trans. Sustain. Energy 2020, 11, 746–757. [Google Scholar] [CrossRef] [Green Version]
  6. Gevorgian, V.; O’Neill, B. Advanced Grid-Friendly Controls Demonstration Project for Utility-Scale PV Power Plants; NREL: Golden, CO, USA, 2016. [Google Scholar]
  7. Gevorgian, V.; Booth, S. Review of PREPA Technical Requirements for Interconnecting Wind and Solar Generation; NREL: Golden, CO, USA, 2013. [Google Scholar]
  8. Loutan, C.; Klauer, P.; Chowdhury, S.; Hall, S.; Morjaria, M.; Chadliev, V.; Milam, N.; Milan, C.; Gevorgian, V. Demonstration of Essential Reliability Services by a 300-MW Solar Photovoltaic Power Plant; NREL: Golden, CO, USA, 2017. [Google Scholar]
  9. Miller, N.; Manz, D.; Roedel, J.; Marken, P.; Kronbeck, E. Utility scale battery energy storage systems. In Proceedings of the IEEE PES General Meeting, PES 2010, Minneapolis, MN, USA, 26 July 2010; pp. 1–7. [Google Scholar]
  10. Muñoz-Cruzado-Alba, J.; Rojas, C.; Kouro, S.; Galván Díez, E. Power production losses study by frequency regulation in weak-grid-connected utility-scale photovoltaic plants. Energies 2016, 9, 317. [Google Scholar] [CrossRef] [Green Version]
  11. Díaz-González, F.; Sumper, A.; Gomis-Bellmunt, O. Energy Storage in Power Systems; Díaz-González, F., Sumper, A., Gomis-Bellmunt, O., Eds.; John Wiley & Sons Ltd.: Chichester, UK, 2016; ISBN 9781118971291. [Google Scholar]
  12. Han, Z.; Luo, G.; Song, X.; Yang, C.; Zhang, L.; Jia, Y.; Zhao, Z.; Jin, Y. Research on the dispatch proportion of battery capacity in photovoltaic primary frequency control. In Proceedings of the 2019 3rd IEEE Conference on Energy Internet and Energy System Integration: Ubiquitous Energy Network Connecting Everything, Changsha, China, 8–10 November 2019; Institute of Electrical and Electronics Engineers: Piscataway, NJ, USA, 2019; pp. 1098–1103. [Google Scholar]
  13. Barchi, G.; Pierro, M.; Moser, D. Predictive energy control strategy for peak shaving and shifting using BESS and PV generation applied to the retail sector. Electronics 2019, 8, 526. [Google Scholar] [CrossRef] [Green Version]
  14. Solar Power Europe. Grid Intelligent Solar Unleashing the Full Potential of Utility-Scale Solar Generation in Europe; Solar Power Europe: Brussels, Belgium, 2019. [Google Scholar]
  15. International Renewable Energy Agency. Utility-Scale Batteries Innovation Landscape Brief; International Renewable Energy Agency: Abu Dhabi, United Arab Emirates, 2019; ISBN 978-92-9260-139-3. [Google Scholar]
  16. Abdelrazek, S.A.; Kamalasadan, S. Integrated PV capacity firming and energy time shift battery energy storage management using energy-oriented optimization. IEEE Trans. Ind. Appl. 2016, 52, 2607–2617. [Google Scholar] [CrossRef]
  17. Ahmed, M.; Kamalasadan, S. Energy storage PV capacity firming with forecasted power reference and optimal error minimization. In Proceedings of the 2015 North American Power Symposium, Charlotte, NC, USA, 4–6 October 2015; Institute of Electrical and Electronics Engineers: Piscataway, NJ, USA, 2015; pp. 1–6. [Google Scholar]
  18. Yang, Y.; Kim, K.A.; Blaabjerg, F.; Sangwongwanich, A. Flexible active power control of PV systems. In Advances in Grid-Connected Photovoltaic Power Conversion Systems; Elsevier: Amsterdam, The Netherlands, 2019; pp. 153–185. [Google Scholar]
  19. Denholm, P.; Eichman, J.; Margolis, R. Evaluating the Technical and Economic Performance of PV Plus Storage Power Plants; NREL: Golden, CO, USA, 2017. [Google Scholar]
  20. Dynapower AC vs. DC Coupling for Solar Plus Energy Storage Projects|Dynapower. Available online: https://www.dynapower.com/ac-vs-dc-coupled-solar-plus-storage/ (accessed on 27 January 2021).
  21. Go Big, Go DC: An In-Depth Look at DC-Coupled Solar-Plus-Storage|Energy Storage News. Available online: https://www.energy-storage.news/blogs/go-big-go-dc-an-in-depth-look-at-dc-coupled-solar-plus-storage (accessed on 27 January 2021).
  22. Fluence a Battery for Hire: AC vs. DC Coupling for Solar + Energy Storage Projects. Available online: https://blog.fluenceenergy.com/energy-storage-ac-dc-coupled-solar (accessed on 27 January 2021).
  23. Sterling & Wilson why Large-Scale Solar Alone no Longer Makes Sense. Available online: https://www.pv-magazine.com/webinars/why-large-scale-solar-alone-no-longer-makes-sense/ (accessed on 27 January 2021).
  24. DiOrio, N.; Denholm, P.; Hobbs, W.B. A model for evaluating the configuration and dispatch of PV plus battery power plants. Appl. Energy 2020, 262, 114465. [Google Scholar] [CrossRef]
  25. He, J.; Yang, Y.; Vinnikov, D. Energy storage for 1500 V photovoltaic systems: A comparative reliability analysis of DC- and AC-coupling. Energies 2020, 13, 3355. [Google Scholar] [CrossRef]
  26. Sandelic, M.; Sangwongwanich, A.; Blaabjerg, F. Reliability evaluation of PV systems with integrated battery energy storage systems: DC-coupled and AC-coupled configurations. Electronics 2019, 8, 1059. [Google Scholar] [CrossRef] [Green Version]
  27. Despeghel, J.; Tant, J.; Driesen, J. Loss model for improved efficiency characterization of DC coupled PV-battery system converters. In Proceedings of the IECON Proceedings (Industrial Electronics Conference), Lisbon, Portugal, 14–17 October 2019; IEEE Computer Society: Washington, DC, USA, 2019; pp. 4740–4745. [Google Scholar]
  28. Akeyo, O.; Rallabandi, V.; Jewell, N.; Ionel, D.M. The design and analysis of large solar PV farm configurations with DC-connected battery systems. IEEE Trans. Ind. Appl. 2020, 56, 2903–2912. [Google Scholar] [CrossRef]
  29. Müller, N.; Kouro, S.; Zanchetta, P.; Wheeler, P.; Bittner, G.; Girardi, F. Energy storage sizing strategy for grid-tied PV plants under power clipping limitations. Energies 2019, 12, 1812. [Google Scholar] [CrossRef] [Green Version]
  30. Central Inverter PVS980-58. Available online: https://www.fimer.com/sites/default/files/FIMER_PVS980-58-from4348to5000_EN_RevB__0.pdf (accessed on 24 May 2021).
  31. Asian Development Bank. Handbook on Battery Energy Storage System; Asian Development Bank: Mandaluyong, Philippines, 2018; ISBN 9789292614706. [Google Scholar]
  32. HITACHI ABB Battery Energy Storage System PQpluSTM. Available online: https://www.hitachiabb-powergrids.com/it/it/offering/product-and-system/energystorage/pqplus (accessed on 3 July 2021).
  33. World Bank Group Economic Analysis of Battery Energy Storage Systems. Available online: https://openknowledge.worldbank.org/bitstream/handle/10986/33971/Economic-Analysis-of-Battery-Energy-Storage-Systems.pdf?sequence=1&isAllowed=y (accessed on 3 July 2021).
  34. ITP Renewables Reports—Lithium Ion Battery Test Centre. Available online: https://batterytestcentre.com.au/reports/ (accessed on 3 July 2021).
  35. Kosmadakis, I.E.; Elmasides, C.; Koulinas, G.; Tsagarakis, K.P. Energy unit cost assessment of six photovoltaic-battery configurations. Renew. Energy 2021, 173, 24–41. [Google Scholar] [CrossRef]
  36. Susanto, J.; Shahnia, F.; Ludwig, D. A framework to technically evaluate integration of utility-scale photovoltaic plants to weak power distribution systems. Appl. Energy 2018, 231, 207–221. [Google Scholar] [CrossRef]
  37. European Network of Transmission System Operators for Electricity (ENTSO-E). Inertia and Rate of Change of Frequency (RoCoF); European Network of Transmission System Operators for Electricity (ENTSO-E): Brussels, Belgium, 2020. [Google Scholar]
  38. Puerto Rico Electric Power Authority’s Minimum Technical Renewables Interconnection Requirements—ESIG. Available online: https://www.esig.energy/wiki-main-page/puerto-rico-electric-power-authority-s-minimum-technical-renewables-interconnection-requirements/#Frequency_Response.2FRegulationRegulation (accessed on 27 January 2021).
  39. Denholm, P.; O’Connell, M.; Brinkman, G.; Jorgenson, J. Overgeneration from Solar Energy in California: A Field Guide to the Duck Chart; NREL: Golden, CO, USA, 2015. [Google Scholar]
  40. Mathews, I.; Xu, B.; He, W.; Barreto, V.; Buonassisi, T.; Peters, I.M. Technoeconomic model of second-life batteries for utility-scale solar considering calendar and cycle aging. Appl. Energy 2020, 269, 115127. [Google Scholar] [CrossRef]
  41. Stieneker, M.; Mortimer, B.J.; Averous, N.R.; Stagge, H.; de Doncker, R.W. Optimum design of medium-voltage DC collector grids depending on the offshore-wind-park power. In Proceedings of the PEMWA 2014—2014 IEEE Symposium on Power Electronics and Machines for Wind and Water Applications, Milwaukee, WI, USA, 24–26 July 2014; Institute of Electrical and Electronics Engineers: Piscataway, NJ, USA, 2014; pp. 1–8. [Google Scholar]
  42. Morandi, A.; Gholizad, B.; Stieneker, M.; Stagge, H.; de Doncker, R.W. Technical and economical evaluation of DC high-temperature superconductor solutions for the grid connection of offshore wind parks. IEEE Trans. Appl. Supercond. 2016, 26, 1–10. [Google Scholar] [CrossRef]
  43. Italweber Electra General Catalougue. Available online: www.italweberelettra.it (accessed on 27 January 2021).
  44. Stan, A.I.; Swierczynski, M.; Stroe, D.I.; Teodorescu, R.; Andreasen, S.J.; Moth, K. A comparative study of lithium ion to lead acid batteries for use in UPS applications. In Proceedings of the INTELEC, International Telecommunications Energy Conference, Vancuver, BC, USA, 28 September–2 October 2014; Institute of Electrical and Electronics Engineers: Piscataway, NJ, USA, 2014; pp. 1–8. [Google Scholar]
Figure 1. (a) A modular 288 MWp PV power plant made of 80 separate PCS, each including 4 PV inverter modules with a 900 kVA rating. (b) Modular integration of the 92.2 MW/275.2 MWh BESS into the 288 MW PV plant.
Energies 14 04823 g001
Figure 2. Possible coupling architecture for PV and BESS modules: (a) AC-coupling; (b) DC-coupling/BESS-side; (c) DC-coupling/PV-side.
Energies 14 04823 g002
Figure 3. PV facility droop characteristic for PFR in Puerto Rico (PREPA).
Energies 14 04823 g003
Figure 4. Reference frequency data: (a) one-day frequency profile; (b) occurrence probability of the frequency excursion.
Energies 14 04823 g004
Figure 4. Result of PFR on the plant’s power flows. (a) on the left axis: black—100% of PPV; dot black— P b a s e (90% of P PV ); blue— P PCC ; grey—80% of P PV ; on the right axis: red—BESS power. (b) on the left axis: grid frequency with an over- (blue area) and under-frequency (light-blue area) occurrences. On the right axis, the battery power profile (red) and the battery “base” power (black). The red area depicts the provided upward energy reserve, and the yellow area depicts the downward reserve.
Energies 14 04823 g005
Figure 6. Reference power flows: (a) PV power profile (black) and battery scheduled power for energy shifting operation (red) with k = 1; (b) PV power and PCC power demand (red) obtained by PFR and ES operating; (c) Battery power flow, daytime charging (negative power) and evening discharging (positive power); (d) battery SOC profile.
Energies 14 04823 g006
Figure 7. Power efficiency of the PCS components: Inverters and dc–dc converters. The efficiencies are functions of the normalized rating power.
Energies 14 04823 g007
Figure 8. Power flows that involve the three different layouts: (a) AC coupling; (b) DC-coupling/BESS-side; (c) DC-coupling/PV-side.
Energies 14 04823 g008aEnergies 14 04823 g008b
Figure 9. Delivered grid power of the three different layouts during one typical summer day.
Energies 14 04823 g009
Figure 10. Typical summer day simulation result: (a) battery power profiles, (b) battery SOC; (c) overall system power loss, (d) overall system energy loss.
Energies 14 04823 g010
Figure 11. Power and SOC profiles for the three different layouts during typical summer and winter weeks. (a) grid power during summer week, (b) grid power during winter week, (c) battery SOC during summer week, (d) battery SOC during winter week, (e) total energy loss during summer week, (f) total energy loss during a winter week.
Energies 14 04823 g011
Figure 12. Comparison of total energy losses in one year (a) and annual efficiency (b) for the three different layouts.
Energies 14 04823 g012
Figure 13. Layout efficiency as a function of the BESS/PV daily energy ratio.
Energies 14 04823 g013
Table 1. Data of the case study of PV+BESS plant components in Figure 2.
Single ModuleTotal Plant (320 Modules)
LayoutACDC–BESSDC–PVACDC–BESSDC–PV
PV[MW]0.9000.9000.900288288288
BESS (energy)[MWh]0.8600.8600.860275.2275.2275.2
BESS (power)[MW]0.2880.2880.28892.292.292.2
transf.[MVA]1.2001.2001.200384384384
BESS-transf.[MVA]0.400--128--
inverter[MVA]0.9000.9000.900288288288
BESS-inverter[MVA]0.288--92.2--
dc–dc conv.[MW]-0.2880.900-92.2288
Table 2. Power efficiency and conversion stages based on power flow directions, where η i n v PV and η i n v B are the efficiencies of the PV and BESS inverter, η T P V and η T B are the efficiencies of the PV and BESS transformers for the AC coupling layout. On the other hand, η i n v is the inverter efficiency, η d c d c is the dc–dc converter efficiency and η T is the transformer efficiency for both DC-coupling layouts.
AC-CouplingDC-Coupling (BESS)DC Coupling (PV)
Power FlowN° Conv. StagesPath EfficiencyN° Conv. StagesPath EfficiencyN° Conv. StagesPath Efficiency
from PV to Grid2 η i n v PV   η T P V 2 η i n v   η T 3 η d c d c   η i n v   η T
From PV to BESS4 η i n v PV   η T P V   η T B   η i n v B 1 η d c d c 1 η d c d c
From BESS to grid2 η i n v B   η T B 3 η d c d c   η i n v   η T 2 η i n v   η T
Table 3. Energy values (MWh) refer to the system’s elements. The results consider three different initial PV conditions: low, mean, and high irradiance.
Low-IrradianceMean-IrradianceHigh-Irradiance
ACDC/BESSDC/PVACDC/BESSDC/PVACDC/BESSDC/PV
E PV 779.81957.92398.1
E PCC 753.6754.9747.61894.21897.41884.32312.02316.52300.5
Δ E B −1.6−0.9−1.2−2.2−1.5−1.8−12.5−11.4−10.8
E L 24.523.931.0161.558.971.773.679.186.7
η96.8%96.9%96.0%96.8%97.0%96.3%96.9%97.1%96.4%
Table 4. The setting of the primary frequency reserve operation for different BESS/PV ratios. In all cases, the same energy capacity (275 MWh of nominal capacity) is considered while the PV rating changes.
PV Rating
[MWp]
PV Energy
[MWh/Day]
BESS/PV
[%]
PFR   P b a s e
[ %   of   P PV ]
PFR Reserve
[ %   of   P PV ]
5503916595±5
28819589.890±10
27518691090±10
183130515.385±15
13797920.480±20
Publisher’s Note: MDPI stays neutral with regard to jurisdictional claims in published maps and institutional affiliations.

