Article

Parameters Influencing on Electric Vehicle Range

by
Emilia M. Szumska
and
Rafał S. Jurecki
*
Department of Automotive Engineering and Transport, Faculty of Mechatronics and Mechanical Engineering, Kielce University of Technology, Ave. Tysiąclecia Państwa Polskiego 7, 25-314 Kielce, Poland
*
Author to whom correspondence should be addressed.
Energies 2021, 14(16), 4821; https://doi.org/10.3390/en14164821
Submission received: 29 June 2021 / Revised: 30 July 2021 / Accepted: 4 August 2021 / Published: 7 August 2021
(This article belongs to the Special Issue Vehicle and Traffic Safety)

Abstract

:
There is a range of anxiety-related phenomena among users and potential buyers of electric vehicles. Chief among them is the fear of the vehicle stopping and its users getting “stuck” before reaching their designated destination. The limited range of an electric vehicle makes EV users worry that the battery will drain while driving and the vehicle will stall on the road. It is therefore important to know the factors that could further reduce the range during daily vehicle operation. The purpose of this study was to determine the effect of selected parameters on a battery’s depth of discharge (DOD). In a simulation study of an electric vehicle, the effects of the driving cycle, ambient temperature, load, and initial state of charge of the accumulator on the energy consumption pattern and a battery’s depth of discharge (DOD) were analyzed. The simulation results confirmed that the route taken has the highest impact on energy consumption. The presented results show how significantly the operating conditions of an electric vehicle affect the energy life. This translates into an electric vehicle’s range.

1. Introduction

Electric vehicles are now widely available. They can be found in virtually every vehicle category, from small passenger cars to SUVs, and sports cars to light duty vehicles. EVs are easy to find in the offerings of most car companies. In recent years, corporations have emerged that specialize in producing electric vehicles only, such as Tesla. In the last quarter of 2020, electric vehicles accounted for 16.5% of all newly registered passenger cars in the EU. Overall, in 2020, the share of newly registered electric vehicles was 10.5% of all new vehicles in the EU [1]. However, when looking at the number of all passenger cars in use in the EU, EVs only represent 0.2% [2]. The highest share of electric vehicles is in Norway, at 56%. The largest number of electric vehicles is in China, at 2.4 million [3,4]. Car sharing companies have sprung up in many major cities, offering only electric vehicles. According to the results of the analyses presented in [5,6], the number of people using this type of service is growing. The number of electric taxis is also gradually increasing. Many taxi companies have decided to purchase electric or hybrid vehicles [7,8,9,10,11]. An example for many cities can be found in Amsterdam (The Netherlands), where a taxi company has decided to replace its entire fleet of vehicles with electric ones by 2025 [12]. The largest number of e-taxis is in Beijing, China [13,14].
Compared to vehicles with a combustion engine, electric vehicles have many advantages. The main and undeniable one is the zero emission of harmful compounds at the place of their use. Electric vehicles also emit less noise while driving. In the low-speed range up to 50 km/h, it can be up to 7 dB(A) depending on the vehicle speed [15,16,17,18]. The noise generated by an electric vehicle in city traffic reaches 40–60 dB(A). For comparison, a passenger car powered by an internal combustion engine emits an average of 60–70 dB(A) in city traffic.
Another advantage is the much lower cost of ownership of electric vehicles compared to vehicles with internal combustion engines. As shown by the results of TCO analyses presented in [19,20,21,22], the running costs of electric vehicles are much lower than those of internal combustion vehicles.
One of the advantages of EVs is the much higher efficiency of the electric power train compared to conventional drives equipped with internal combustion engines. It is estimated that the efficiency of the electric power train is 90–98% [23,24,25]. In vehicles with a conventional power train, where the energy source is the internal combustion engine, the energy from fuel combustion is thermal energy, which is then converted into mechanical energy. It is estimated that the efficiency of energy transfer from the source (internal combustion engine) to the driving wheels in conventional propulsion is 42–45% [26,27,28]. In addition, the torque generated by the electric motor is available almost from zero rotational speed. This allows the parameters of the electric motor driving the vehicle to be selected in such a way as to ensure that the driving speed can be changed within the required range without the use of an additional transmission. This reduces the mechanical losses of the drive system. When stationary, e.g., in traffic, electric motors do not run, do not require sustained operation, and therefore do not generate losses associated with motor idling [29,30]. When operating in generator mode, the electric motor can recover some of its kinetic energy during braking. This energy is used to additionally recharge the battery. In vehicles powered solely by internal combustion engines, during braking, the energy is dissipated into the environment in the form of heat and thus irretrievably lost.
Despite their many significant advantages, electric vehicles also have disadvantages. Undoubtedly, one of them is the cost of buying an EV. The price of a small electric car is often close to that of a premium class conventional car. To prevent this, many states offer subsidies or other incentives to willing buyers, such as free parking in city centers, free entry into cities, or the ability to drive using bus lanes.
Another disadvantage of electric vehicles is the long battery charging time. Depending on the charging method, it is several hours. The availability of charging stations and points is limited in many countries. In small towns especially, charging infrastructure is still not sufficiently developed. In many countries this problem also applies to the availability of charging stations along highways and freeways.
The disadvantage of most electric vehicles is also the short range on a single charge. Depending on battery capacity and operating conditions, electric vehicles can cover up to 400 km on a single charge (e.g., Nissan Leaf, Renault Zoe, BMW i3 120 Ah), while vehicles equipped with internal combustion engines, depending on fuel tank capacity, can cover a much longer distance on a single fill-up.
The issue of short range is one of the barriers to the spread of electric vehicles. The phenomenon of range anxiety has been reported among EV users and those considering their purchases. Although the on-board computer displays the estimated range of the vehicle, there are situations on the road that cannot be predicted. Users or potential buyers are concerned that the battery will run down before the end of the journey or that there is no charging point in the area.
When reviewing the literature on the topic of electric vehicle range, many papers include research and analysis of the impact of factors that limit the range of electric vehicles. These include operating conditions, driver’s driving style, ambient temperature, vehicle load, etc. Many works are devoted to studying the energy efficiency of EVs in a specific driving cycle. Ongoing research is also aimed at adapting the control strategy for energy flow during braking between mechanical brakes and the energy recovery system. This makes it possible to extract as much energy as possible during braking.
The purpose of this paper is to present the factors and problems associated with electric vehicle coverage and to review previous research. The second part of the paper presents the methodology of a simulation study of an electric vehicle, in which the effects of driving cycle, energy level in the accumulator, ambient temperature, and load on the energy consumption of an electric vehicle were analyzed. This paper is a prelude to an experimental study aimed at investigating and understanding the factors affecting the range of an electric vehicle under real-world conditions.

2. Range Anxiety

Range anxiety is the travel anxiety and stress experienced by the driver of an electric vehicle caused by decreasing or low energy in the battery. It is the fear of the vehicle stopping and its users getting “stuck” before reaching their designated destination [31]. What distinguishes the concern about the range of electric vehicles from the classic problems associated with the use of vehicles powered by conventional fuels is the fear of not being able to find a charging station in time. Using vehicles with internal combustion engines, finding a refueling station during a long journey is not a problem.
For electric vehicle users, there is a concern that when traveling to areas of the city or regions unfamiliar to them, drivers will not encounter available EV chargers along their route. What is important is that many EV users have no experience using a public EV charger. In fact, most EV owners charge their vehicles primarily at home or at their place of work.
The authors of the paper [32] noted that range anxiety is expressed on four levels:
  • Cognitive level: manifested by negative beliefs related to the range, e.g., fear of running out of energy and not being able to reach the destination.
  • Emotional level: causing, e.g., anxiety, nervousness, or fear in the situation.
  • Behavioral level: expressed by a change in a driver’s behavior that reduces immediate anxiety by increasing feelings of safety and control. Demonstrated, for example, by certain actions such as changing driving style to save energy or frequently checking the on-board computer readouts (for range, energy level, position), or even aggressive behavior manifested, for example, by tapping fingers on the steering wheel, shouting, honking, or aggressive gestures.
  • Physiological level: manifested in the body’s response to the situation, e.g., increased blood pressure, heart rate, heart rate variability, cortisol level, pupil diameter, respiratory rate, etc.
Based on the results of the survey presented in [33], the most frequent behaviors of electric vehicle drivers experiencing range anxiety were limiting the speed, changing the driving style, and searching for a nearby charging point. The actual behavior change represents the instability of the driver’s behavior under stress and is intended to reduce the risk of getting stuck when traveling. To conserve energy and increase range, drivers choose to reduce speed.
In light of the frequent discussion of this psychological phenomenon, many studies have sought an empirical understanding of electric vehicle drivers’ range anxiety. The results confirm that visualizing the energy level in the accumulator contributes to anxiety in some drivers. Electric vehicle drivers feel uncomfortable when the battery charge drops below a comfortable threshold subjectively accepted by the vehicle user. The paper [34] presents the results of an experiment in which participants were asked to drive a 19-mile distance in an electric vehicle. One half of the participants drove a vehicle with a low energy level in the accumulator (30%) and the other with a fully charged battery. The authors conclude that low initial SOC has a significant effect on range anxiety, trust in the vehicle, and driving behavior.
Based on the experimental results, the authors of the paper [35] noted that range anxiety increases when the driver observes a decreasing energy level in the battery while driving. This situation makes it impossible for the driver to predict how far he can still travel with the remaining energy level. In the paper [36], it was shown that the anxiety of electric vehicle drivers increases when the energy level in the battery drops below 50% of its capacity. Based on the surveys presented in [37], a significant number of respondents stated that charging should be performed at 30% energy level in the battery.
Referring to the literature, reducing perceived anxiety in electric vehicle users can be achieved in two ways. The first way is to increase the nominal range, e.g., by using batteries with higher energy capacity or replacing the electric vehicle with REV (extended-range electric vehicles) or plug-in hybrids (HEV plug-in). The second way is to develop the charging infrastructure by increasing the number of fast charging stations so that they are as easily accessible as gas stations.
Many researchers conduct intensive research on information systems for electric vehicle drivers. The have developed applications and systems that warn of the need to charge the battery, inform drivers about the location of the nearest charging station, or allow drivers to determine whether the battery will need to be recharged on the planned route [38,39,40,41]. In a survey presented in [37], participants stated that the distance between charging stations should be on average 0.12 km less than the distance between traditional gas stations. According to the respondents, the preferred distance between charging points should be 5 km. A lot of work has gone into the proper siting of charging stations so that they are easily accessible to electric vehicle users. To develop a network of charging stations, the researchers used methods such as linear programming [42,43], genetic algorithm [44,45], location approach [46], and fuzzy neural network [47].
To reduce the charging time for electric vehicles, the authors of [48,49] suggested that in addition to charging stations for electric vehicle users, battery swap points should be widely available where users can swap a discharged battery for a fully charged one. This solution would eliminate the long battery charging time.
Technology that relies on inductive coils embedded in the road lanes would allow the battery to be charged while driving. Installed on highways, this solution would allow electric vehicles to be more mobile and help alleviate range concerns. However, this is a solution of the future, as weight deployment of this technology seems difficult and very expensive.

3. Factors Affecting the Range of an Electric Vehicle

The range of an electric vehicle is understood as the distance the vehicle can travel before the battery has to be recharged. The range of the car depends on the amount of energy in the batteries and the unit consumption. Higher energy consumption due to additional factors shortens the range a vehicle can cover on a single battery charge. The range of an electric vehicle depends on a large number of factors.
According to [50], the range of electric vehicles generally depends on three main classes of factors: vehicle design, driver’s driving style and use conditions. Some parameters are invariable, e.g., vehicle type, gearbox type, number of seats, weight of electric drive, weight and type of battery, road infrastructure, and availability of battery charging infrastructure.
Other parameters such as the battery’s state of charge (SOC), state of health (SOH), driver’s behavior, traffic volume, weather factors, etc. are subject to change. The EV range reported by manufacturers is directly related to a linear estimate of the maximum range that can be achieved by an electric vehicle, based on a real-time estimate of the battery’s state of charge [51].
In [52], it was shown that the weight of the vehicle and the energy capacity of the batteries have a major influence on the range of an electric vehicle. When an electric vehicle has a high-capacity battery pack and is used for short distances, it is less efficient than a vehicle with a low-capacity battery. The results of the experiment presented in [53] show that the estimated average range of an electric vehicle without additional load during acceleration to 100 km/h over a distance of 5 km was 97.01 km, and an additional load of 270 kg reduced the range by 8.2%. Driving a car with an extra load also reduces the average speed. Based on the results of the study presented in [54], it was estimated that the actual energy consumption of electric vehicles increases by 60% and 40%, respectively, with each doubling of the vehicle weight, but only by 5% with each doubling of the rated power of the electric motor.
Iclodean et al.l. in work [55] present simulation studies of an electric vehicle equipped with batteries of the same energy capacity based on different battery technologies: Li-Ion, Na-NiCl2, Ni-MH, Li-S. Simulation studies were conducted based on an actual velocity profile. The results show that among all the battery technologies tested, equipping the vehicle with Na-NiCl2 sodium-nickel batteries had the lowest average energy consumption. On the other hand, the highest average energy consumption was recorded when the vehicle was equipped with Li-S lithium-sulphur batteries. The authors of [53] conclude that an increase in the capacity of the batteries of an electric vehicle may deteriorate the vehicle acceleration parameters, increase its operating costs, and reduce the cargo space when batteries of the same technology are used.
Electric vehicles have the ability to recover some of the energy in the braking process. The braking system converts kinetic energy during braking into electrical energy via the electric motor, which then acts as a power generator. In this way, part of the energy that is converted into heat during braking in a conventional vehicle, in this case in the form of electricity, can be recovered and stored in batteries and then used to propel the vehicle. The proportions of power sharing between the braking torque for energy recovery and the friction torque in the braking system are determined by data exchange between the controllers of the power train and the braking system. During deceleration of the vehicle, energy recovery can only be performed to a certain limit of vehicle speed proportional to the rotational speed of the electric motor. If the electric motor reaches the torque limit, the torque must be continuously reduced by mechanical elements as the rotational speed is reduced. The braking system of an electric vehicle should be so configured that some energy is recovered by the electric motor when the accelerator pedal is released.
There are two main strategies for sharing braking energy between a regenerative braking system and a mechanical braking system. The parallel braking strategy involves the simultaneous operation of the energy recovery system and the mechanical brakes. This is a relatively simple braking strategy but provides the lowest energy recovery. The series strategy envisages that the energy recovery system is activated first, and the mechanical brakes are applied only when the maximum level of recoverable electrical energy related to the kinetic energy of the vehicle is exceeded. Many researchers have undertaken to improve the performance of the energy recovery system by developing strategies for distributing the braking force between the mechanical brakes and the regenerative braking system. Examples can be found in [56,57,58], among others. The results presented in [59] show a significant effect of speed, deceleration, and vehicle weight on the value of energy recovered during braking. Road test results presented in [60] showed that under urban traffic conditions, regenerative braking covers almost 23% of the driving time, with the level of regeneration highly dependent on the driver’s driving technique.
Driving conditions and the velocity profile used also affect the level of energy consumption and thus the range of an electric vehicle. Each route is characterized by certain parameters, including length, infrastructure, speed limits, and topography. On urban routes, the time of day is additionally important due to varying traffic volumes and congestion. The results presented in [61,62,63,64], among others, show that the type of route covered can have a significant impact on the level of energy needed to complete it. In [65], it was shown that driving on a road with varying road gradients significantly affects the changes in instantaneous power consumed by the vehicle and SOC parameters, and this translates into vehicle range.
The energy values obtained from the representative driving cycles used in the approval tests do not reflect the energy level obtained in real driving conditions. Based on the results presented in [66], the energy values obtained in the standardized cycles (FTP72, FTP75, JC 08, Japan10, NRDC, ECE-15) compared to the energy consumption in real driving conditions differ by 9.65–21.17% compared to the energy consumption in real driving conditions. To accurately estimate the energy consumption and driving range of electric vehicles under real-world road conditions, it is best to construct representative driving cycles typical of a city or region.
The ambient temperature also indirectly affects the range of an electric vehicle. This is due to the need to power additional equipment: at high temperatures—air conditioning, at low temperatures—the cabin ventilation and heating system. In the results of operational tests of electric drive vehicles with different battery energy capacity presented in [67,68,69], with respect to a temperature of 20 °C, driving with air conditioning turned on causes an increase in energy consumption. The results presented in the paper [70] show that using full cabin heating in winter conditions at −20 °C can reduce the range by up to 60%.
In addition to the parameters mentioned above, the range of the electric vehicle is also influenced by the driving style, infrastructure design, traffic intensity, and weather.
Driving style reflects the way the driver habitually drives. The way the vehicle is driven has a significant impact on the energy consumption of a vehicle with both electric and conventional drive systems. In the case of electric vehicles, energy consumption is associated with range. Many studies have confirmed that aggressive driving styles record higher values of energy consumption than drivers driving calmly. Aggressive driving reflects abrupt road maneuvers, rapid acceleration, and hard braking. Large oscillations in the driving speed have a negative impact on the energy consumption of electric vehicles. The greater the oscillation, the greater the energy consumption. As shown in [71], aggressive driving with high-speed oscillations may contribute to an increase in energy consumption by as much as 53%. On the basis of research on energy consumption in various traffic conditions during rush hours, the authors of the study [72] found that aggressive drivers cause on average 43% higher energy consumption compared to non-aggressive drivers. In addition, in lower traffic intensity, aggressive drivers cause 41.5% higher average energy consumption than calm drivers. It is also interesting that longer use of an electric vehicle contributes to a change in driving style. The research results presented in [73] show that after six months of use of an EV, as many as 73% of electric vehicle drivers changed their driving style. The use of an electric car made drivers change their driving style in terms of lower speed, less aggression, and more economical driving.
The type of road, road conditions, and elements of road infrastructure also determine the parameters of the vehicle’s motion [74,75], and thus affect energy consumption. Curved road sections, speed limits, traffic-calming measures, and the arrangement of intersections with traffic lights all influence energy consumption through acceleration forces caused by numerous stops and accelerations. The results presented in [76] show that the average energy consumption in heavy traffic conditions is 15.6% higher than in smooth driving conditions.
Weather conditions also affect energy consumption. In the simulation results presented above it was shown that the ambient temperature has a great impact on the energy consumption of electric vehicle. It was shown in [71] that wind influences energy consumption in different ways for different driving speeds. Based on simulation studies, it was found that, with a strong headwind of 100 km/h, the energy consumption was nearly three times higher than in no wind conditions. The authors of the work [77] showed that electricity consumption is much higher in winter. Based on the research, it has been shown that the energy consumption of an electric vehicle increases by about 34% in relation to summer conditions. This means that, for countries where the winter season is relatively long, this translates into a shorter range of the electric vehicle in that period.

4. Range Estimation Models in Electric Vehicles

Many researchers have attempted to develop methods to predict range with the remaining energy level in the battery. Generally, to estimate the range, the energy control system relies on information regarding the current energy level of the battery, the energy value of a fully charged battery, and the energy consumption of additional loads, such as air conditioning. There are two main methods of range estimation for electric vehicles: history-based estimation and model-based estimation.
Range estimation methods may be based on historical energy consumption data calculated from a vehicle’s dynamic parameters acquired during a journey or from the last journey. These data are used to predict vehicle range based on the energy remaining in the battery. The predicted energy consumption is estimated as the average energy consumption of the last kilometers driven. This method does not take into account the influence of actual driving style, or road and environmental conditions. Estimation based on historical data has limited accuracy but has the advantage of not including a model. The method of estimating range based on historical data is used in current commercially available electric vehicles. In the case of Tesla’s Model 3, the mobile application displays two types of range, either an average range based on last-mile energy consumption data of 10, 25, or 50 km, or one determined by temporary range, taking into account the last few kilometers driven. In the case of the Renault Zoe, the remaining range is calculated based on the average consumption of the last 200 km. In the case of the Nissan Leaf, the range is estimated based on the average energy consumption of previously completed trips [78,79].
Many researchers have attempted to improve range estimation strategies based on historical data by inputting planned route data or current weather conditions. In [80], the predicted future power demand of an electric vehicle is determined based on the energy consumption history, acceleration and speed, and road information from a previously downloaded map. In [81], a method for estimating SOC and range is proposed considering the location-dependent operating conditions and power transmission efficiency of the power train. The electric vehicle range estimation model developed in [82] is a hybrid structure system combining a physical equation-based model with empirical data of the future driving profile and the vehicle’s historical dynamic parameters.
In model-based estimation, a mathematical model is developed in which some dependent variables are expressed as functions of the independent variables. Model-based range estimation was developed to improve accuracy by estimating future energy consumption and thus range after predicting the future travel velocity profile. This approach is broken down into two steps. The first step is to predict the future velocity profile considering the route information and speed limits from GPS data. In the second step, the dynamic parameters of the vehicle and driving style are taken into account. In this method, the range is calculated while driving and may change [83]. Model-based range estimation has developed methods such as:
  • Contour positioning system (CPS): Based on the current geographical location, the route parameters are taken to calculate the required force and torque for the route, and then the energy to be released from the battery is estimated [84,85].
  • Dynamic range estimator (DRE): In addition to the route parameters, the driver’s behavior is taken into account for estimating the energy consumption. This is represented by the acceleration value and the efficiency of the driver, and the use of additional electric auxiliary equipment (e.g., air-conditioning) [83,86,87].
  • Big data analysis. This includes a mathematical model that involves a complex process of examining large data sets to discover certain patterns, correlations, or trends that are used to estimate some assumed variable. In estimating the range of an electric vehicle using this method, three steps are distinguished: (1) determining the route profile based on GPS data; (2) estimating the battery life considering the relationship of internal resistance and SOH; (3) estimating the energy consumption based on the selected route and the energy capacity of the battery, and calculating the range based on these values [88].
  • Probabilistic estimation maps: Energy consumption is predicted as a random variable, and the probability of reaching the destination is obtained by estimating the energy required for the trip based on route parameters and the driver’s behavior [89,90].
Less computational effort is required in estimating electric vehicle range using mathematical models than physical models, but they are less accurate because they are based on statistical and probability methods.

5. Methodology of Simulation

5.1. Vehicle

The electric vehicle model was created in AVL Cruise. The vehicle was equipped with an electric motor with a maximum power of 102 kW at 3000 rpm rotational speed and a 45 kWh battery with a maximum power of 160 kW. The powertrain has a single-ratio transmission, with a gear ratio of 6.058. Table 1 presents the vehicle’s technical parameters.
The electric vehicle model has regenerative braking capability, based on the velocity profile. The parallel regenerative braking strategy consists of a simultaneous operation of the electric and mechanical brakes. The energy recovered is limited by the current limitation of the electric motor and battery. The energy control system calculates the electric motor load signal in both traction and recuperation modes.
In the vehicle, the components of the electric power train are cooled by a coolant. The piping system is distributed to take heat away from the main components. The heat generated by the electric machine is transferred to cooling channels symmetrically distributed around the circumference of the stator. There are plates between battery cells, made up of channels, through which coolant flows to protect the battery pack from overheating. The simulations did not take into account the impact of additional energy consumers, such as air conditioning, audio system, heated windows, and mirrors, on the energy consumption of an electric vehicle.

5.2. Driving Cycles

A driving cycle is a velocity profile recorded as a function of time or distance that reflects the conditions of a vehicle on the streets of a particular city, region, or route. It is a sequence of repeating modules, containing phases of acceleration, constant driving speed, braking, and stopping. The following factors have an important influence on the shape of the cycle:
  • Infrastructure, e.g., location and position of traffic lights, types of intersection, location of bus stops, road type (urban, suburban, highway).
  • Vertical profile of the route.
  • Traffic volume.
  • Dynamic properties of the car.
Driving cycles standardized by legislators are used in approval tests for passenger cars and light-duty trucks. The laboratory tests of vehicles are carried out on a chassis dynamometer and reflect urban road conditions. As a result of the experiment, the emission of toxic compounds and fuel consumption in the velocity profile are obtained [91,92,93,94].
Until recently, the NEDC (New European Driving Cycle) was in force in the EU. NEDC has recently been replaced by the WLTC (Worldwide Harmonized Light Vehicles Test Cycle). The WLTC was developed based on velocity profiles of actual trips under traffic conditions characteristic of cities in Europe, Japan, and India [95]. In the United States, the FTP-75 (Federal Test Procedure) is used for approval testing of passenger cars and light trucks. This cycle includes four tests: FTP-75 which mimics inner city traffic conditions, HWFET which reflects highway driving conditions, SFTP US06 which imitates aggressive driving style, and the optional SFTP SC03 test which allows researchers to examine the impact of the air conditioning system on engine performance and emissions.
In many works and projects, driving cycles developed for a specific city or region can be found, called real-world driving cycles. These cycles are created from recorded velocity profiles while driving. Many papers have been devoted to the methodology of driving cycle development. Examples of a driving cycle developed exclusively for electric vehicles can be found in [96,97], among others. Vehicle tests conducted on the basis of a velocity profile reflecting the traffic conditions of a given city make it possible to estimate more precisely the values of energy and fuel consumption, as well as the level of emission of harmful exhaust compounds for specific traffic conditions.
Two NEDC or EPA (Environmental Protection Agency) tests are typically used to determine the range of an electric vehicle during testing. The range determined acc. to EPA is 30% shorter than the range determined using NEDC. It is worth noting that air conditioning, audio system, heated windows, windshield wipers, and other electrical devices that affect energy consumption are not run in the vehicles during testing.
In this paper, three cycles were used for simulation studies: The NEDC and WLTC and a cycle containing a velocity profile reflecting highway driving. The NEDC and WLTC cycles cover urban and extra-urban driving. The parameters of the analyzed cycles are presented in Table 2.
The NEDC cycle takes 1180 s and measures 11 km. In the part reflecting urban driving, the cycle is formed by modules consisting of stopping, accelerating, driving at constant speed, and braking. In this section, the vehicle accelerates to a maximum velocity of 50 km/h. The urban part accounts for about 66% of the cycle. In the test stage reflecting extra-urban driving, there are no stops, and the vehicle accelerates to a maximum velocity of 120 km/h. The average cycle velocity is 34 km/h. The proportion of stops in the cycle is 23%. The velocity profile for the NEDC cycle is shown in Figure 1.
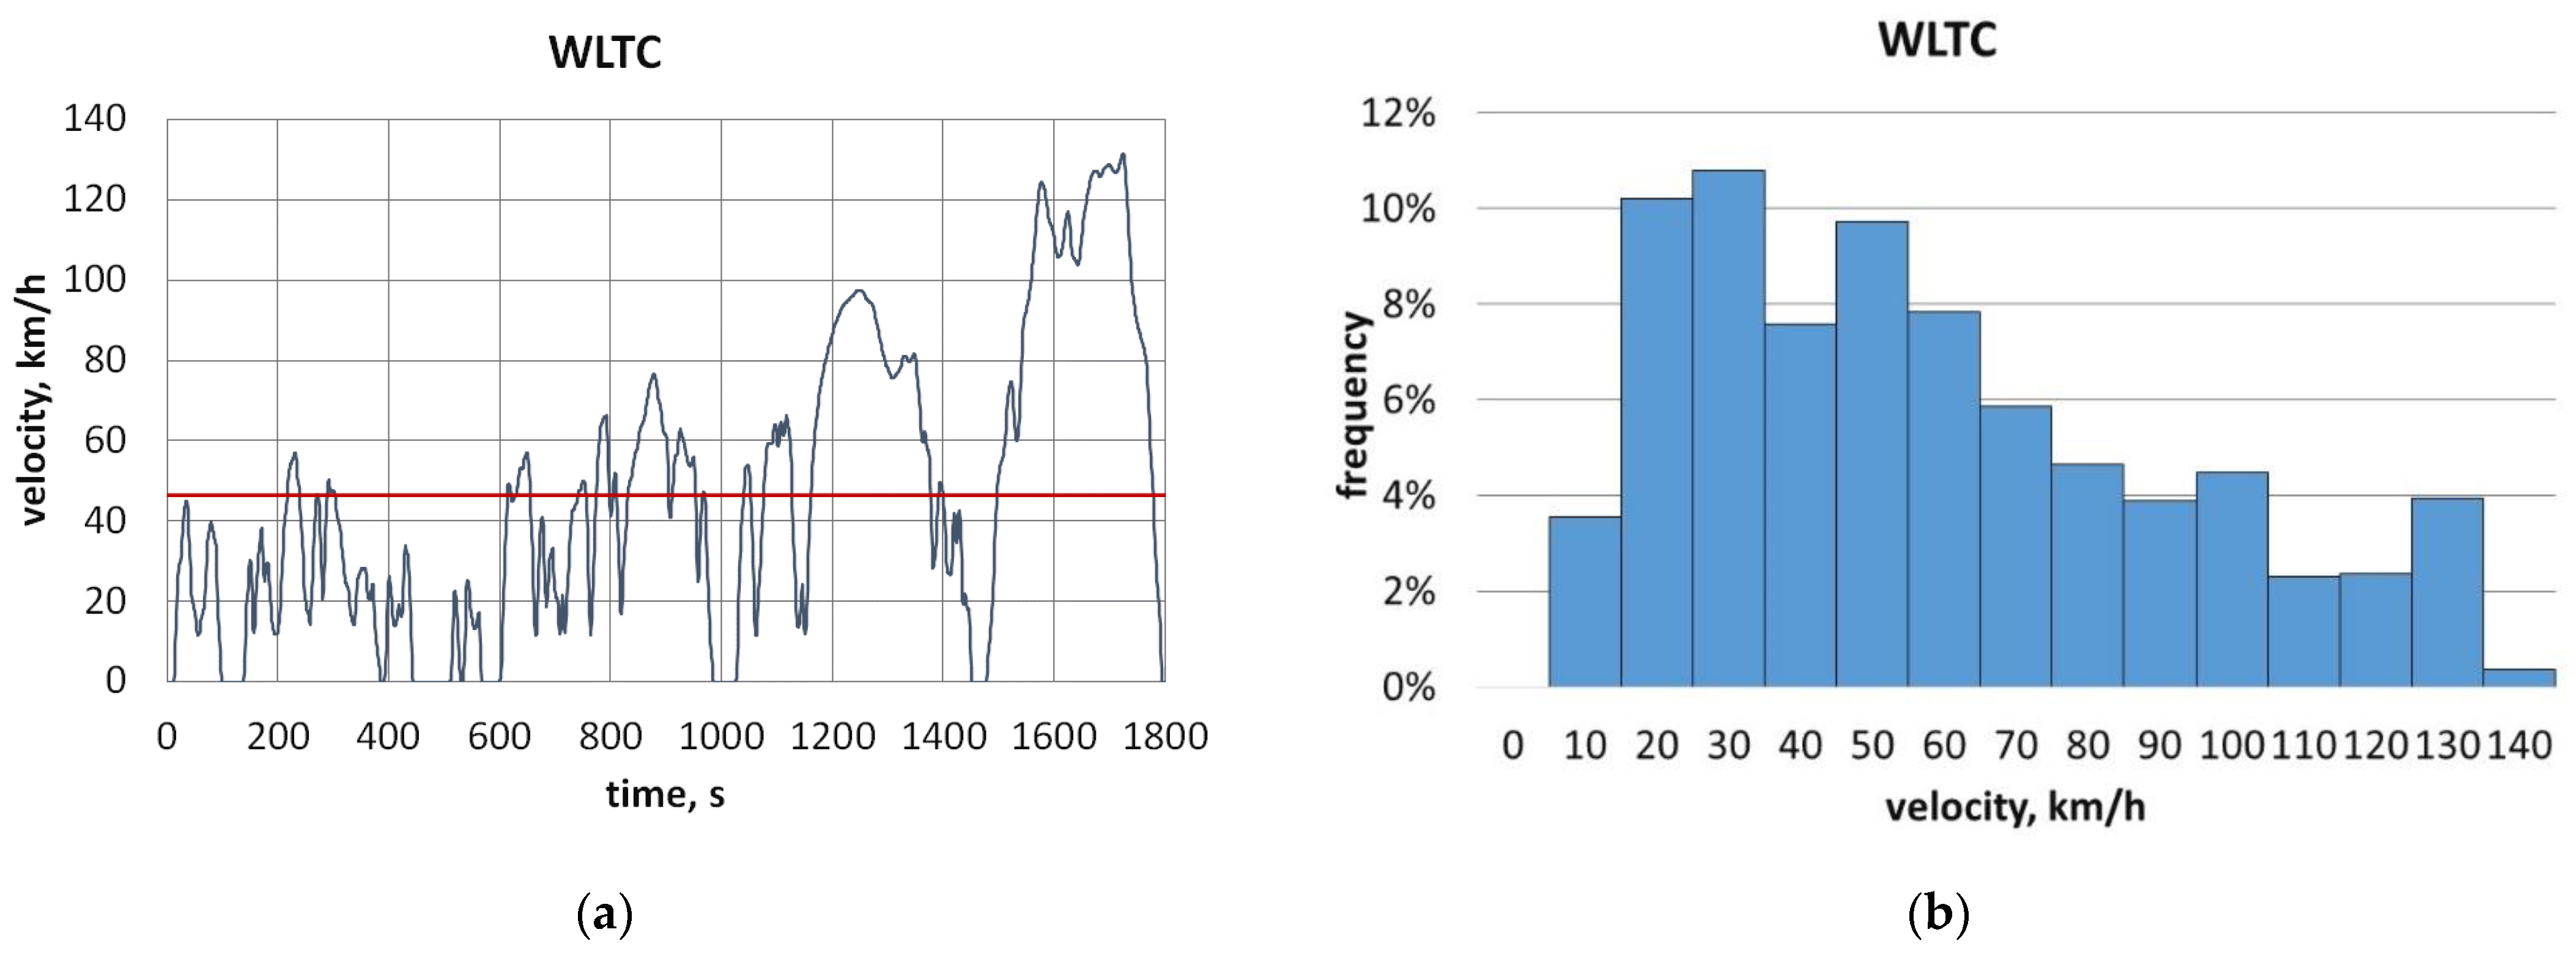
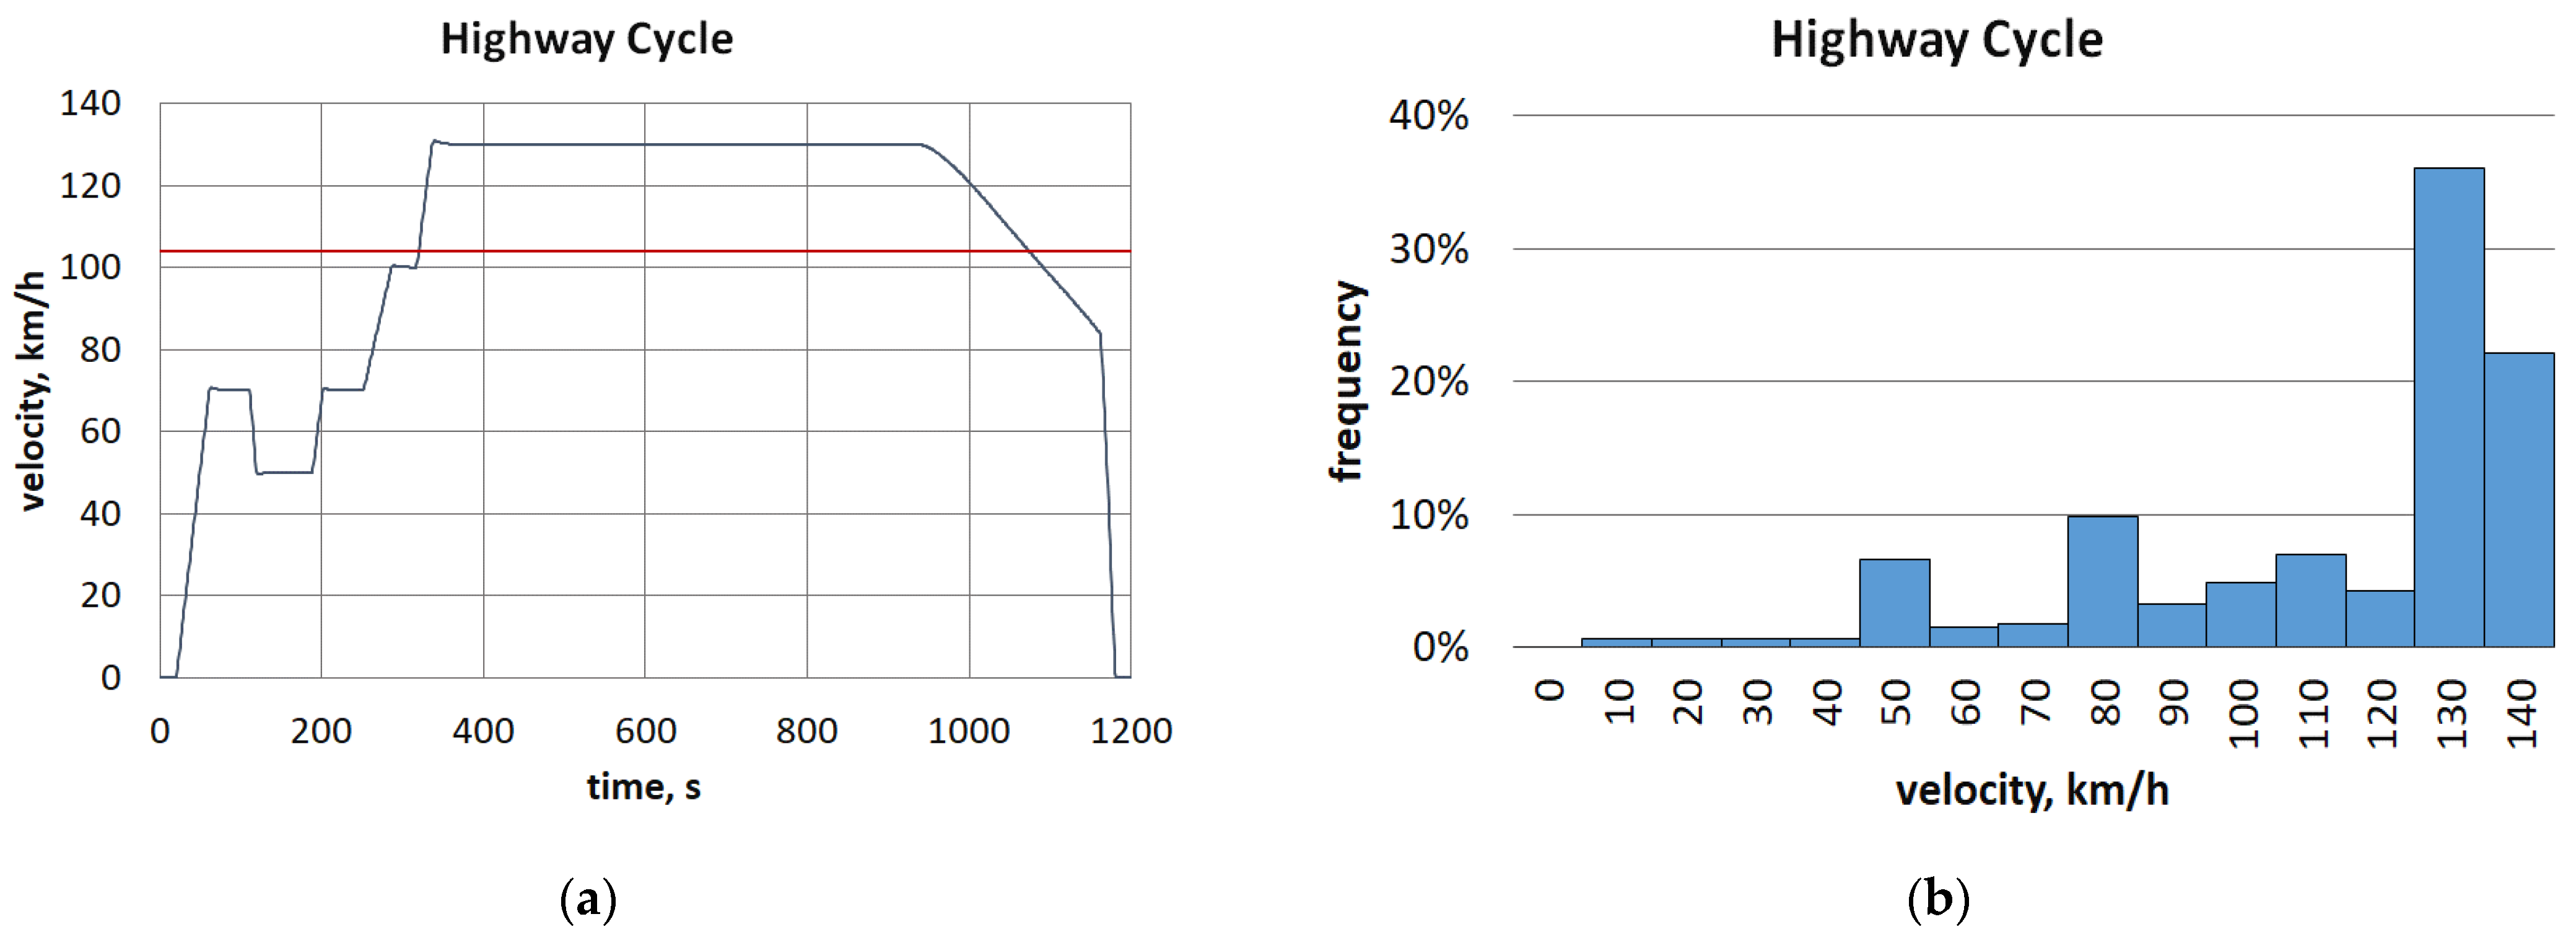
The WLTC (Figure 2) driving cycle is divided into four parts, corresponding to different driving velocities: low, medium, high, and very high. It is more dynamic than NEDC and has a velocity profile that is more similar to the actual driving cycle. The length of the test is 23.25 km. The maximum velocity of the cycle is 131 km/h and the average velocity is 46.5 km/h. The share of stopping in the whole cycle is 13%. The urban driving portion of the cycle accounts for 52%. The Highway Cycle takes 1200 s and measures 35 km. The average cycle speed is 104 km. The vehicle accelerates to a maximum of 131 km/h. The cycle velocity profile is shown in Figure 3.

5.3. AVL Cruise Vehicle Simulation Program

AVL Cruise software (2020, AVL—Advanced Simulation Technologies, Graz, Austria) was used in the simulation studies. The program allows the modeling and simulation of vehicles equipped with different types of power trains. The vehicle model available in the program is a system built of interconnected subsystems, namely vehicle components and drive components. The program allows researchers to:
  • obtain a reliable and accurate fuel consumption forecast of the developed vehicle;
  • analyze energy flow, power distribution, and losses in the power train, from the power source to the wheels;
  • find the optimum balance between fuel consumption, emissions, and the drive’s traction properties;
  • analyze torsional vibrations of flexible chassis (under dynamic load);
  • analyze temperature distribution in power train components.
When creating a vehicle model in AVL Cruise, the user has the opportunity to use an extensive library of real vehicles and power train components with their parameters and characteristics. It is possible to create one’s own vehicle or power train model in AVL Cruise M. The developed vehicle can then be entered into AVL Cruise, where a simulation is performed. During the simulation, it is possible to select additional equipment in the vehicle (such as air conditioning or power steering), the influence of external conditions, i.e., wind force, ambient or road temperature, and to generate a random driving cycle, which may include driving in urban, suburban, or highway conditions.
Simulation calculations are performed using a mixed, backward/forward procedure. This enables effective and more efficient estimation of the influence of input parameter values on the efficiency of power train components. All possible combinations of variables are performed in the calculation. As a result of the simulation, the user is provided with values for fuel consumption, emissions and vehicle efficiency, maximum climbing ability and acceleration times, as well as graphs and performance characteristics of drive components.
Simulation studies enable quick and easy analysis of the influence of selected factors on the efficiency of the vehicle and drive components.

6. Results

In the simulation studies conducted, an electric passenger car was analyzed under various driving conditions. During the simulation, the vehicle was tested:
  • in three driving cycles with different traffic dynamics (NEDC, WLTC, highway cycle);
  • at different initial battery charge levels (40%, 50%, 60%, 70%, 80%, 90%, 100%);
  • at different loads (50, 100, 150, 200, 250 kg);
  • at different ambient temperatures (−20 °C, −10 °C, 0 °C, 10 °C, 20 °C, 40 °C).
During the analyses, the influence of the factors listed above on the energy level in the accumulator (SOC; state of charge), the degree of accumulator discharge (DOD; depth of discharge), total energy consumption, and average energy consumption were investigated.
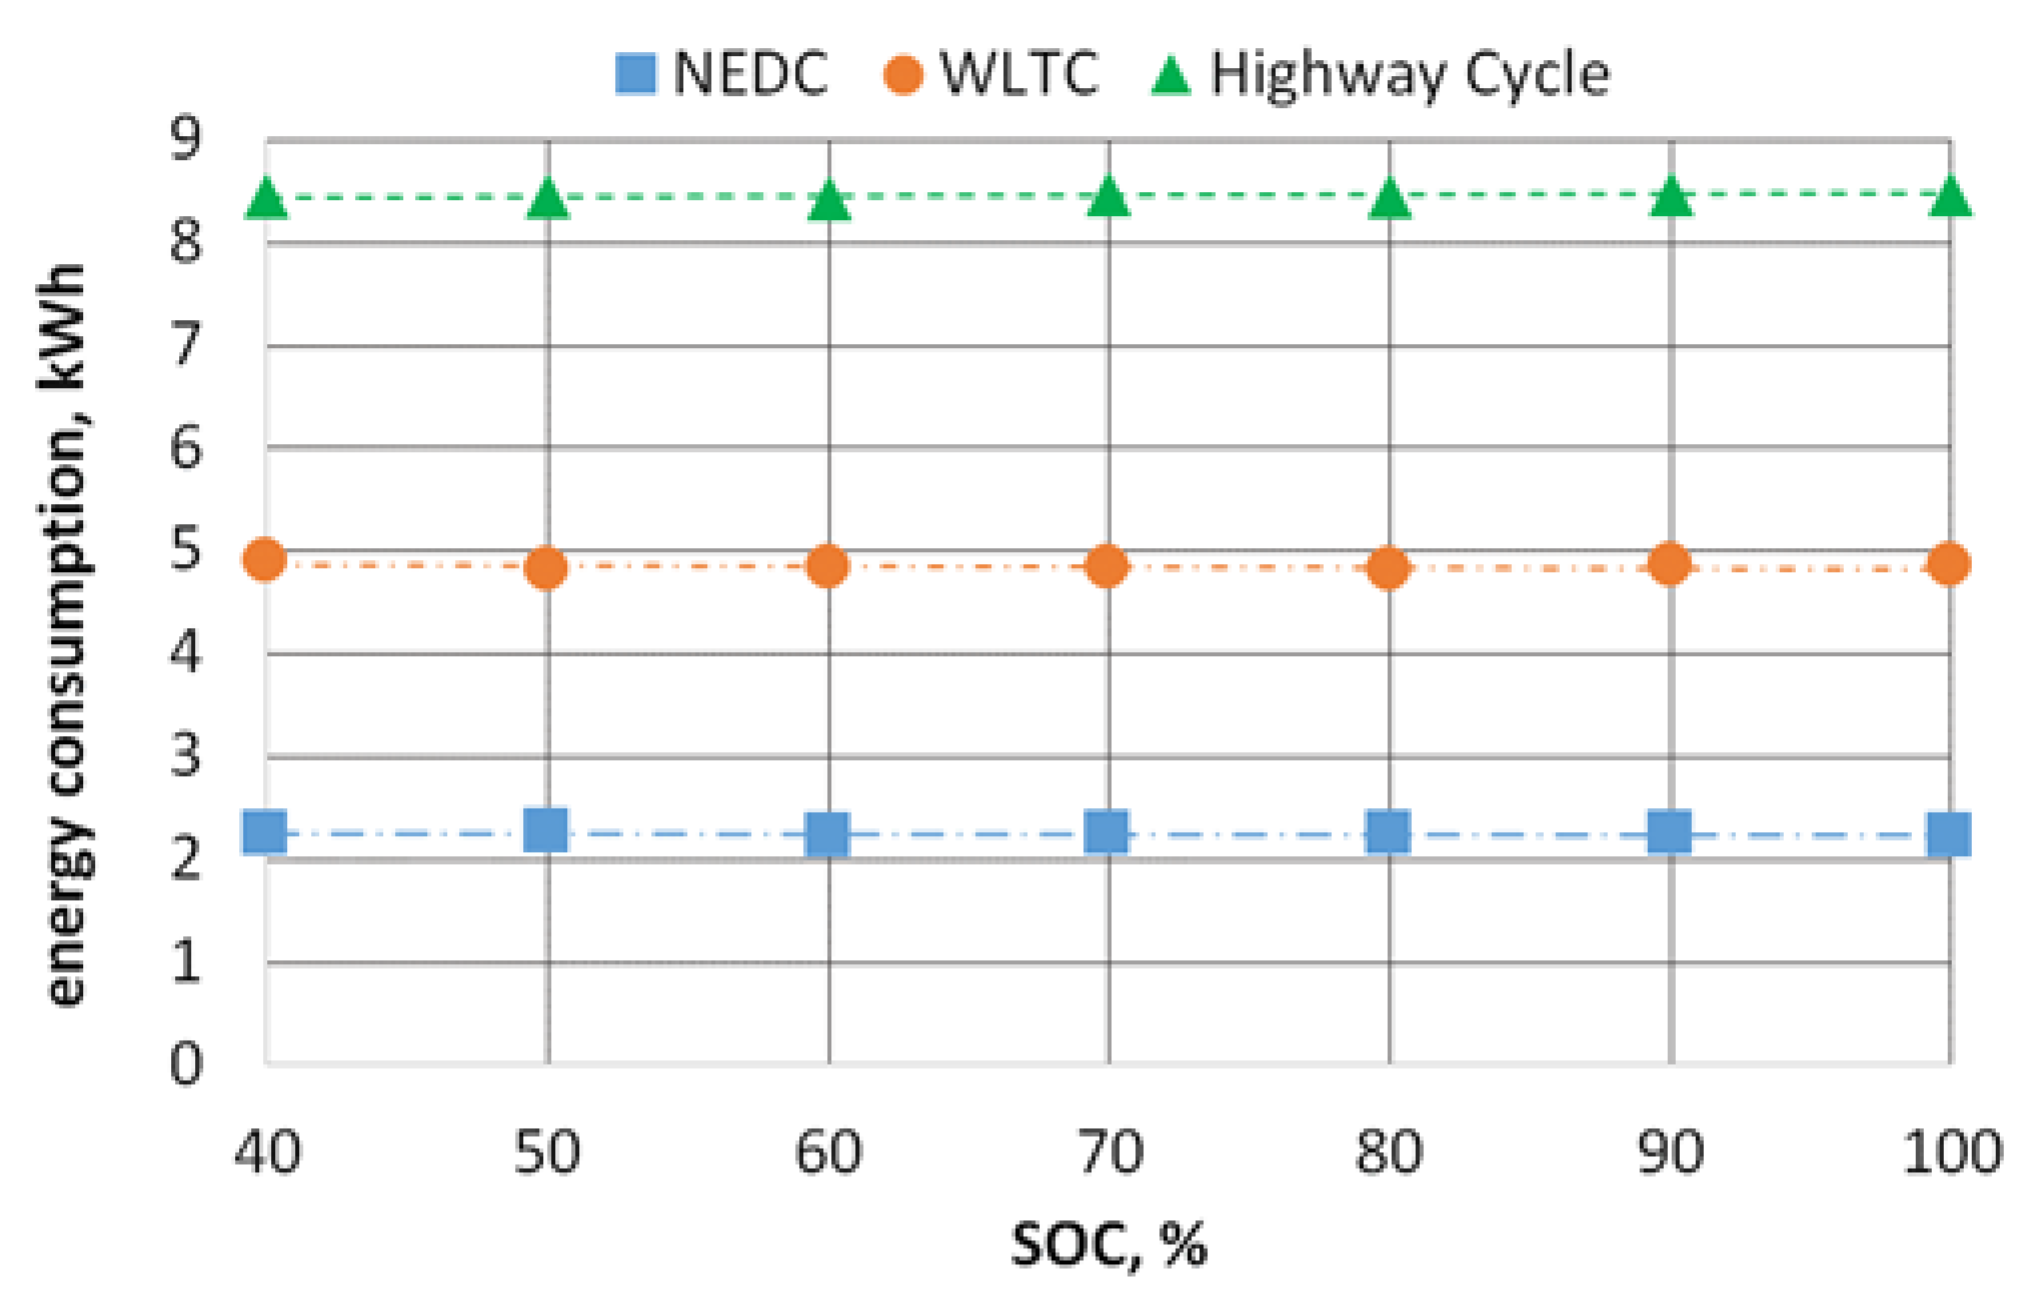
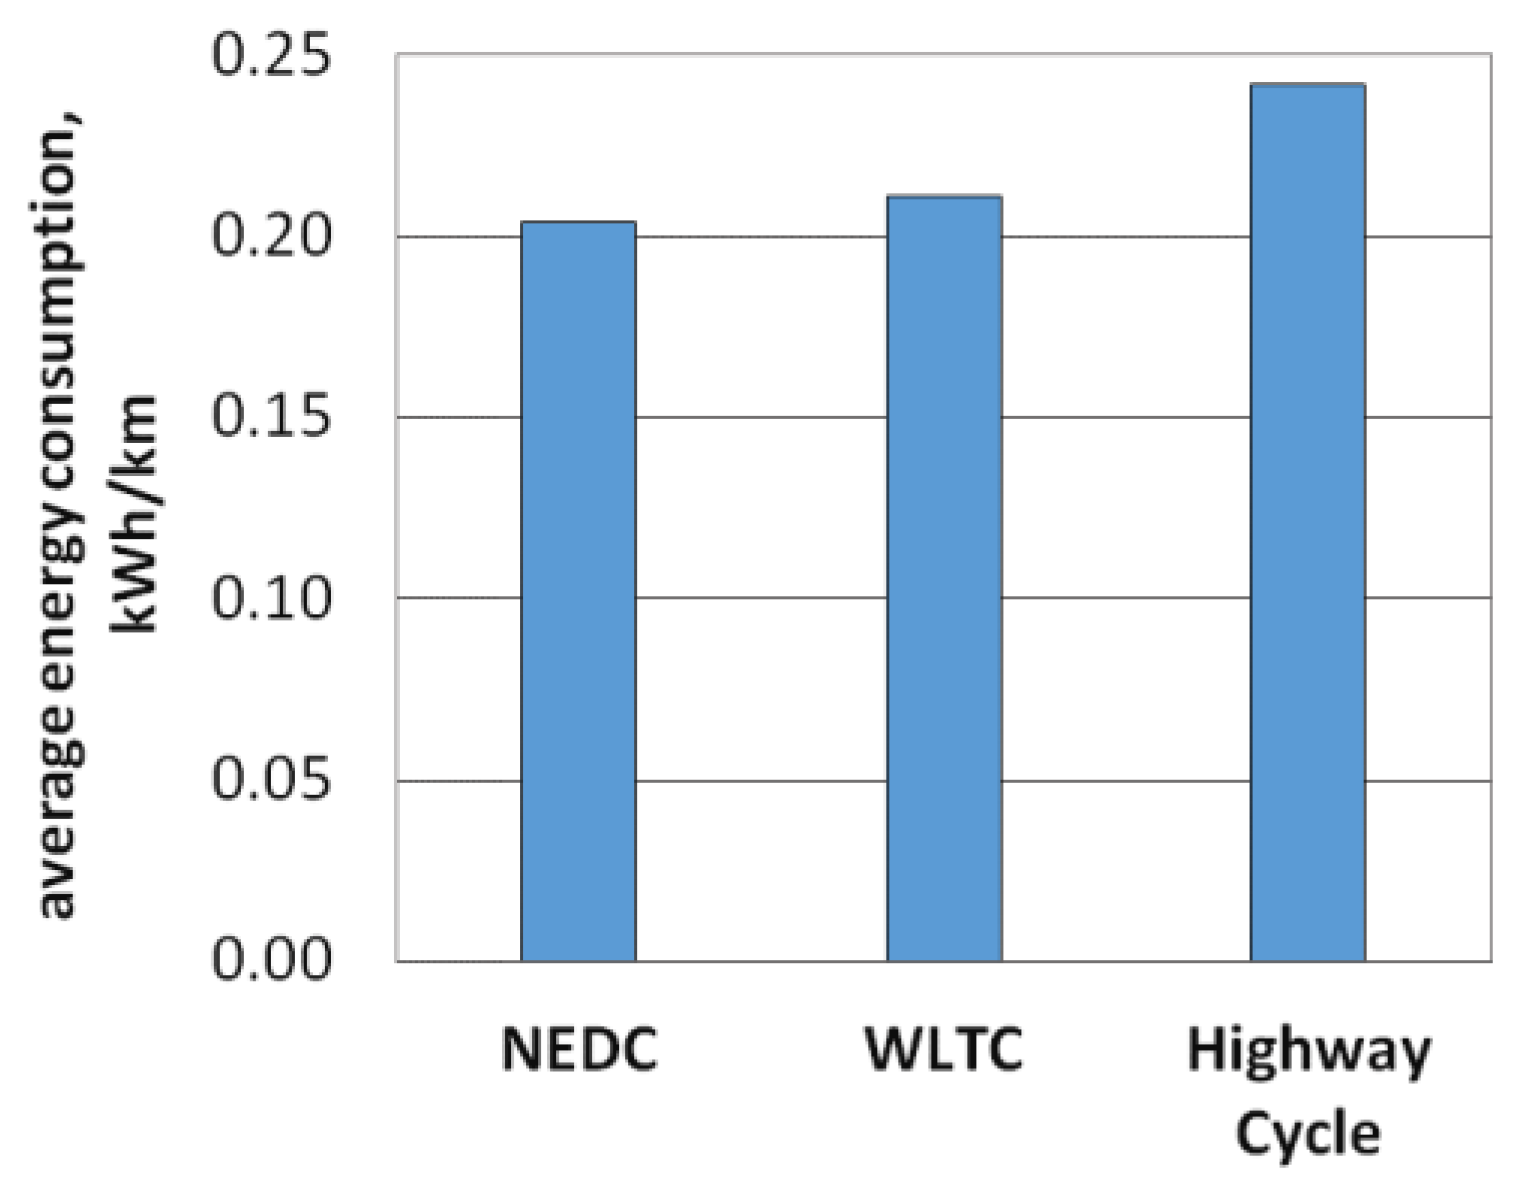
In the simulation studies conducted, three driving cycles were analyzed. The NEDC and WLTC cycles cover urban and suburban driving, and the highway cycle reflects highway driving. The energy consumption of the electric vehicle during the analyzed cycles is shown in Figure 4. Simulation studies were conducted with a constant ambient temperature of 20 °C and a constant load of 50 kg. The impact of the driving cycle has a significant impact on energy consumption. It is noticeable that the higher the speed of travel, the greater the amount of energy required to maintain it. As the simulation results show, the highest average energy consumption was recorded in the cycle reflecting highway driving. The energy expended to cover a 35 km stretch on a highway is about 8.6 kWh. In cycles combining urban and extra-urban driving, energy consumption is significantly lower. Energy consumption in the NEDC cycle was approximately 2.2 kWh. In the WLTC cycle, characterized by a more dynamic velocity profile, the energy consumption was about 4.8 kWh. It is worth noting that the WLTC cycle is about twice as long as the NEDC cycle. Converting this energy into 1 km of distance traveled, it can be seen that the tests carried out yielded: 0.2, 0.21, and 0.24 kWh/km, respectively. The average energy consumption per km is shown in Figure 5.
The values of the average energy consumption in the analyzed cycles are similar. The lowest average energy consumption was recorded on the NEDC cycle. The highest average energy consumption was recorded by the electric vehicle in a cycle reflecting highway driving. It is worth noting that the differences in the values of the average energy consumption in these two cycles are not high, as they are only 16%. The course of the battery’s state of charge for different initial state of charge values in the selected cycles is shown in Figure 6.
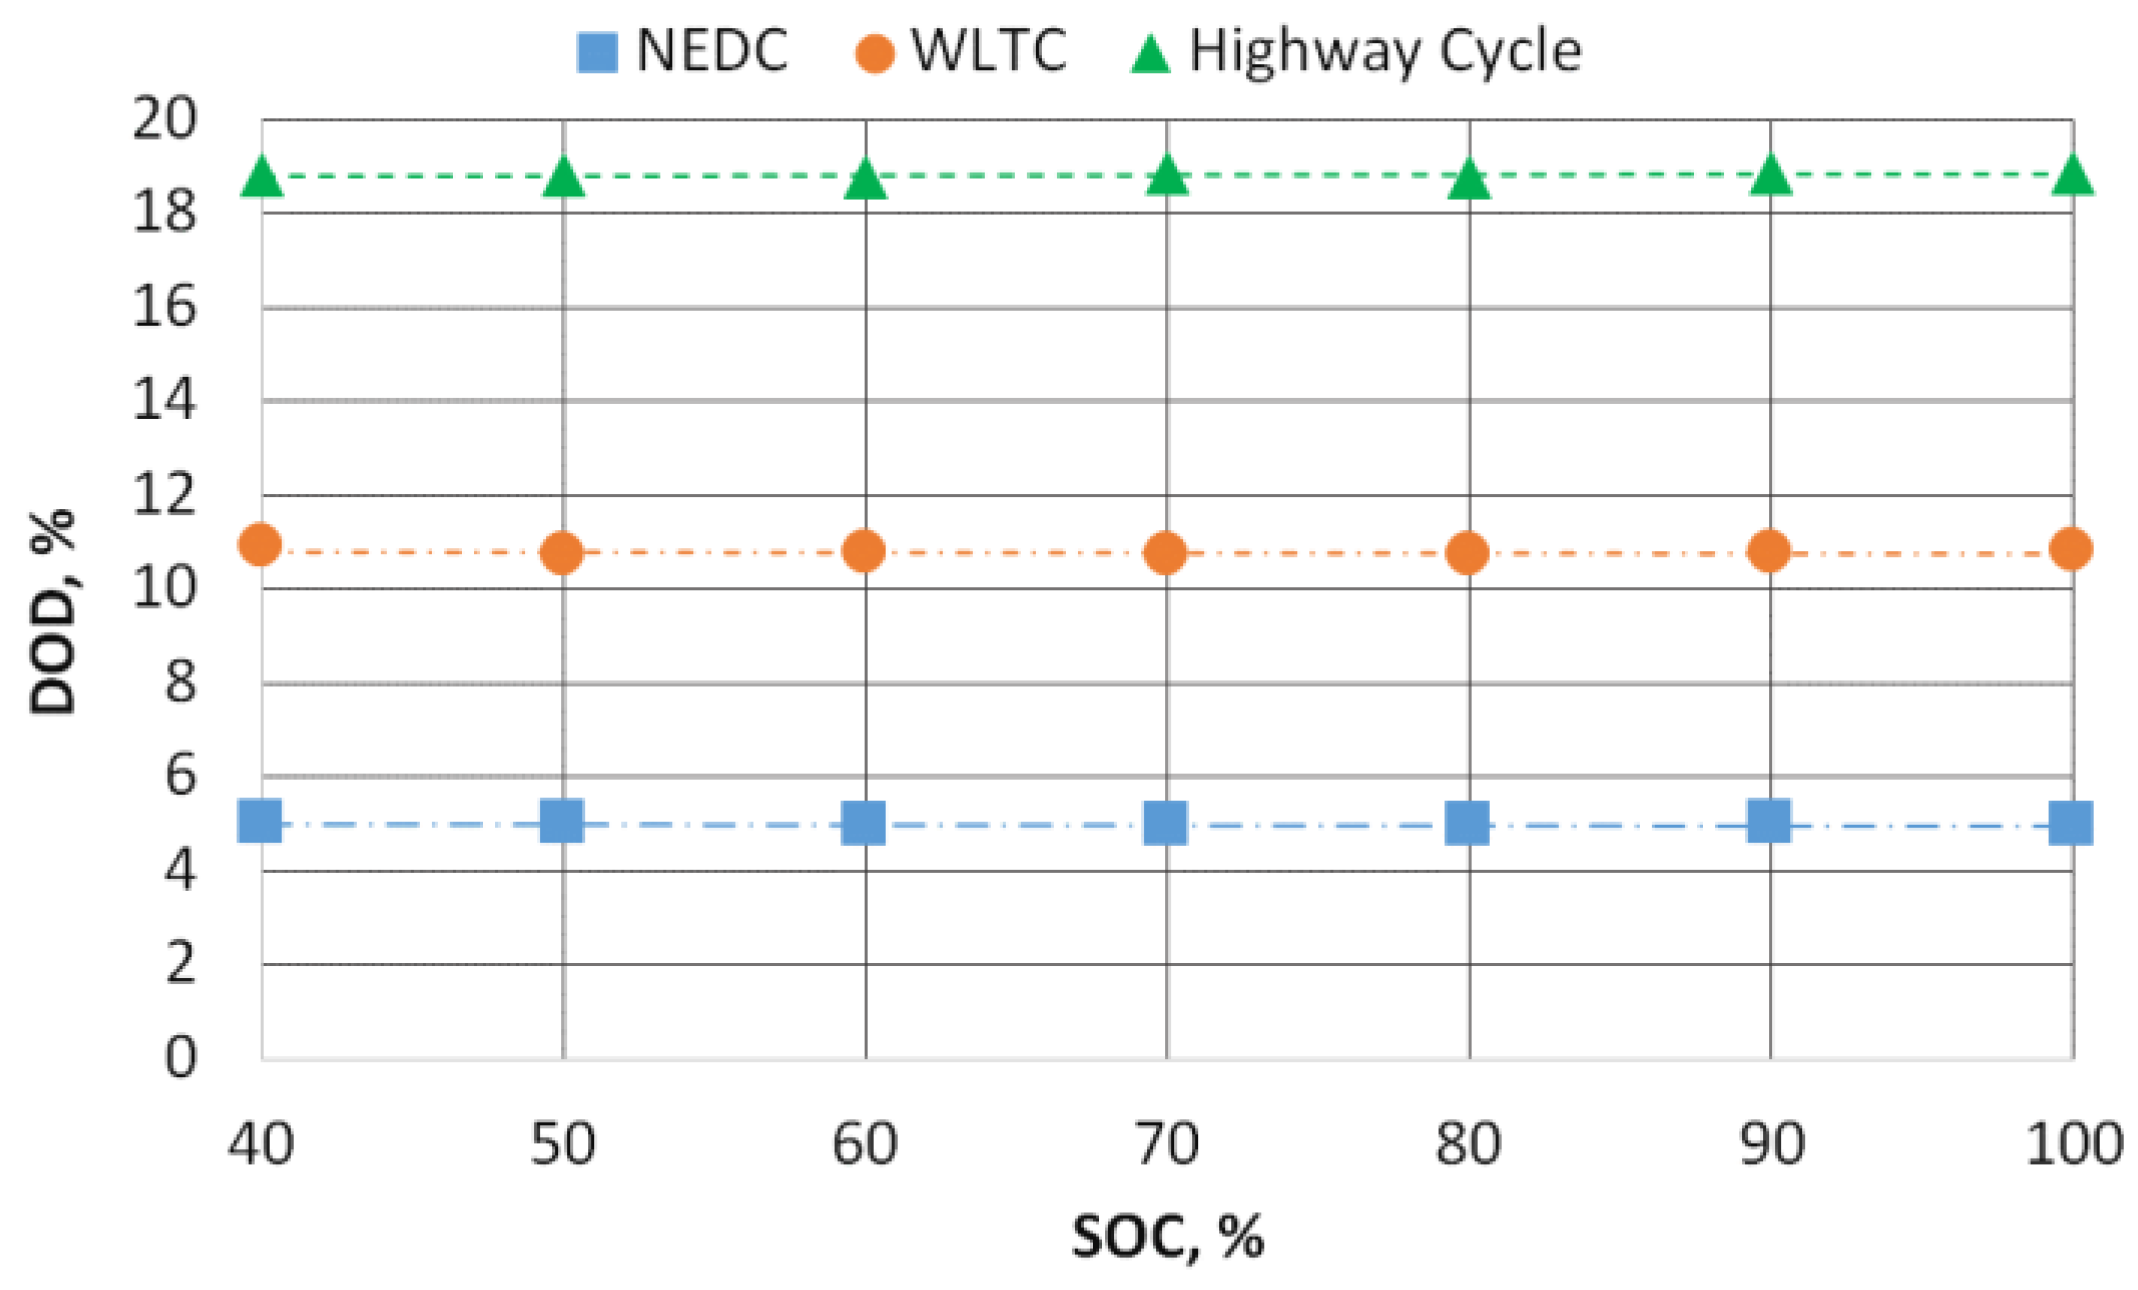
As can be seen from the courses of the state of charge (SOC) for the NEDC and WLTC cycles, there were no sudden drops in energy during city driving. It can be seen that energy consumption increases, especially in the part of the cycle reflecting non-urban driving. This is when the vehicle is accelerated to higher velocities, resulting in a higher demand for energy, causing the energy level in the accumulator to drop. In order to determine the effect of the implemented cycle at different levels of state of charge (SOC), the depth of discharge value was used. Its value during the analyzed driving cycles is shown in Figure 7.
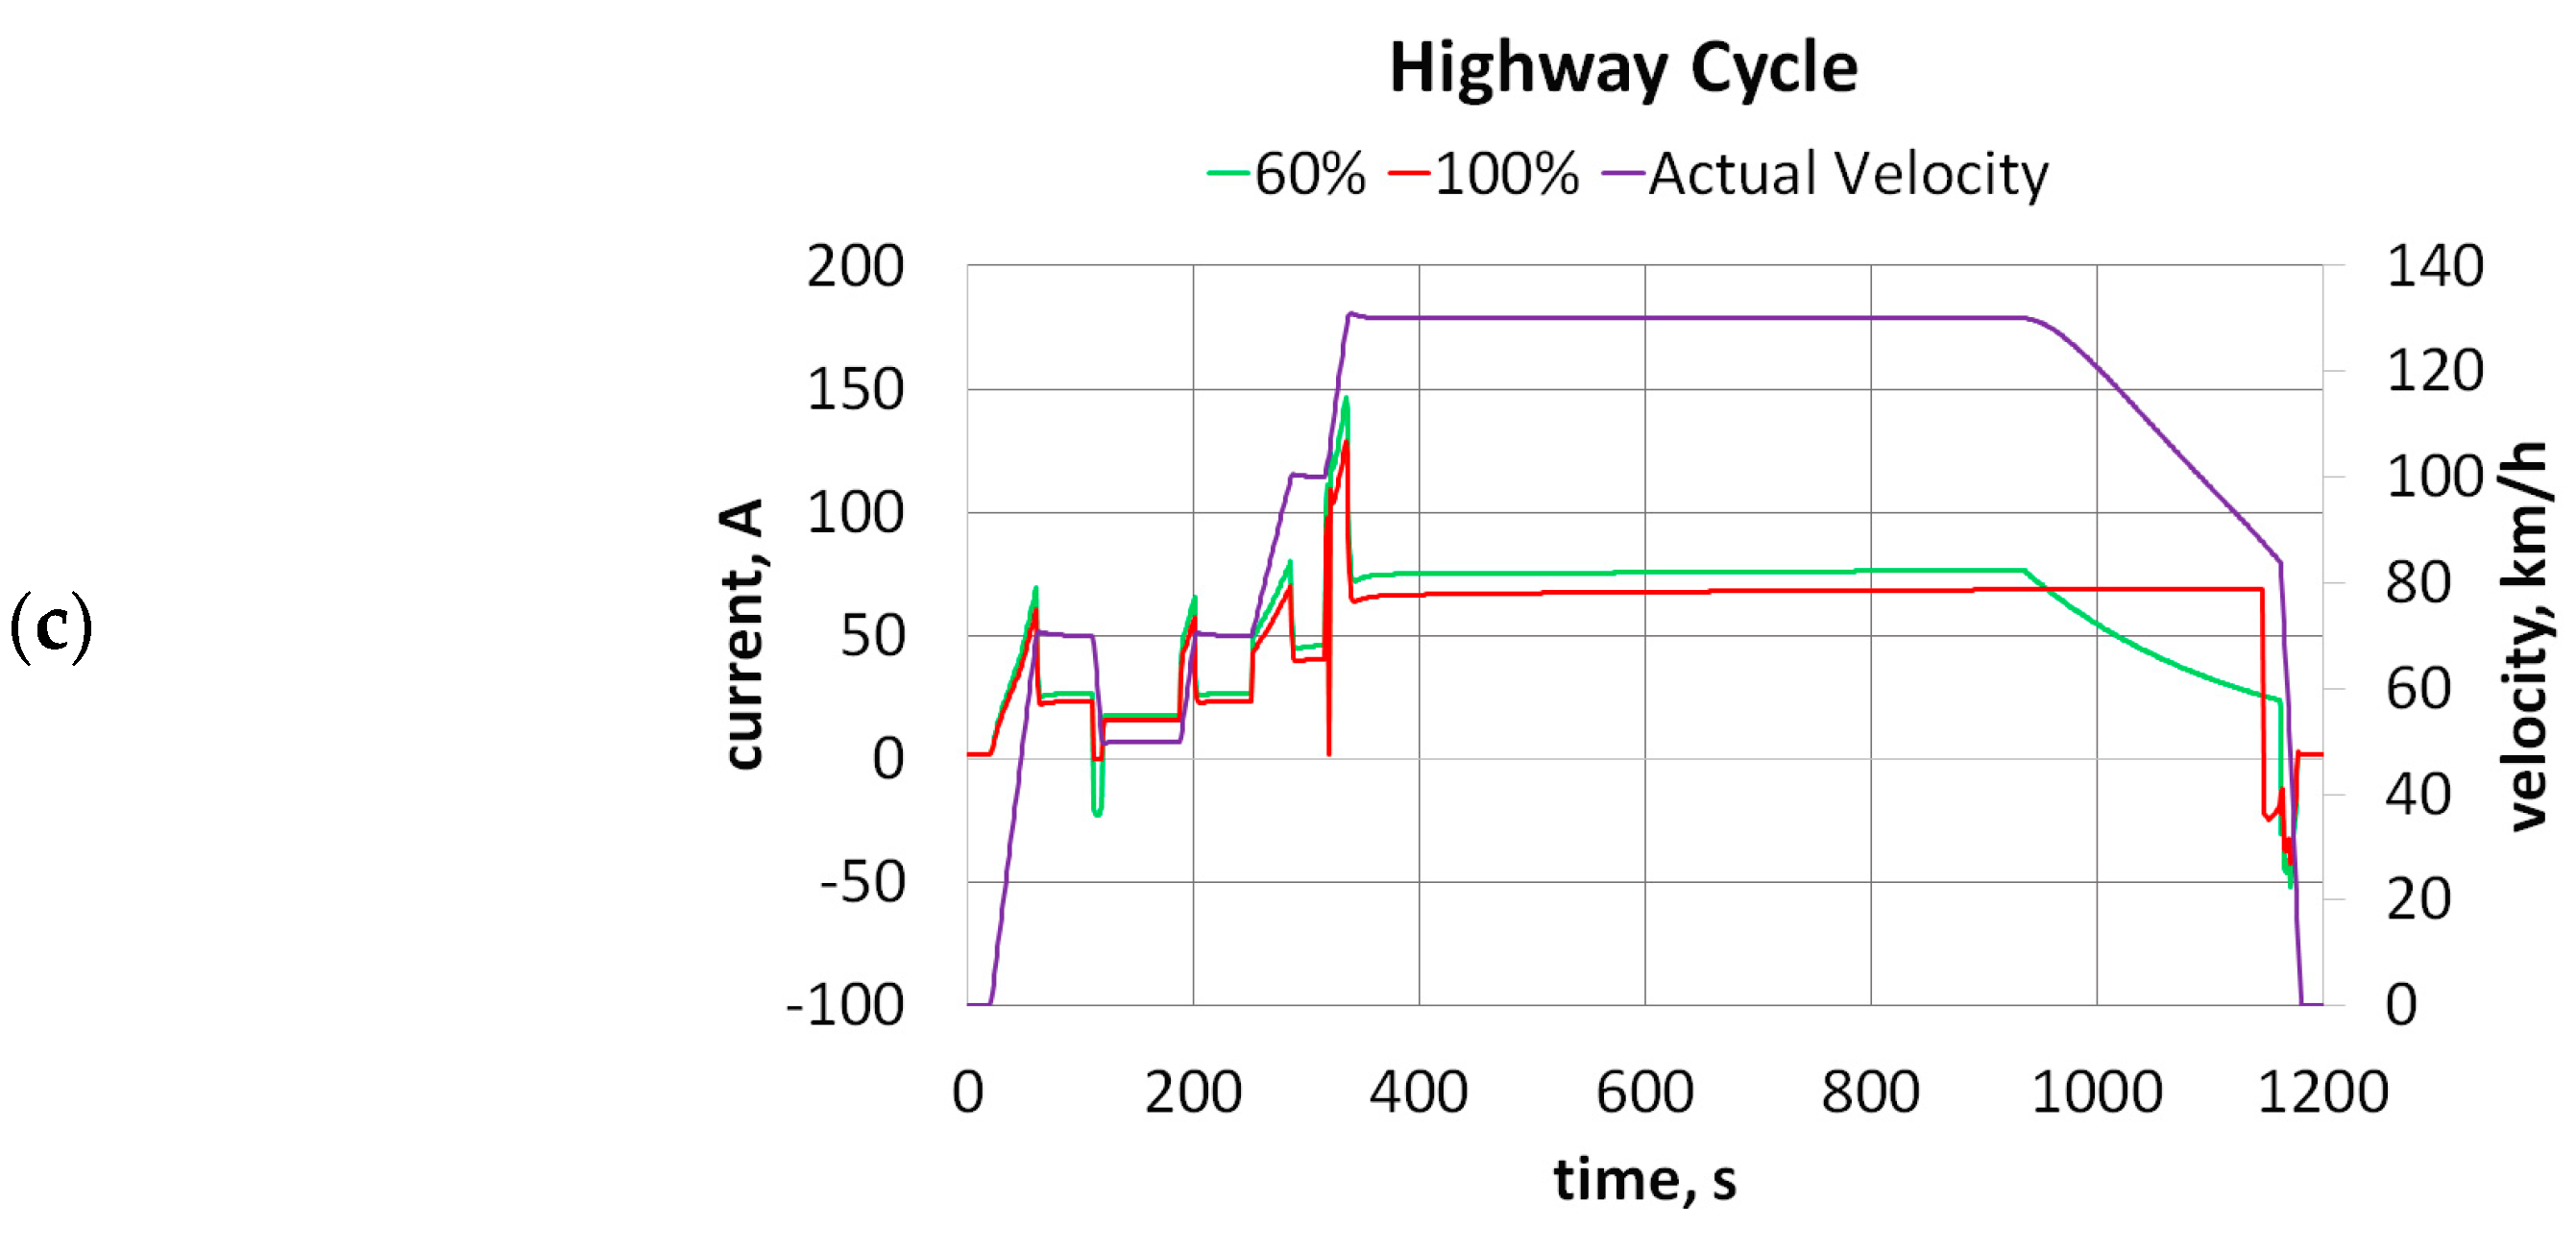
Depending on the initial state of charge of the battery, the drop in energy level after completing the NEDC cycle is 4.94–5.02% and in the WLTC cycle it is 10.72–10.91%. The depth of discharge of the battery after a cycle reflecting highway driving is 18.74–18.85%. Thus, it can be confirmed that, regardless of the initial state of charge of the battery, its level of discharge is dependent on how the route is taken. Figure 8 shows the battery current waveform for the analyzed driving cycles at initial state of charge of 60% and 100%.
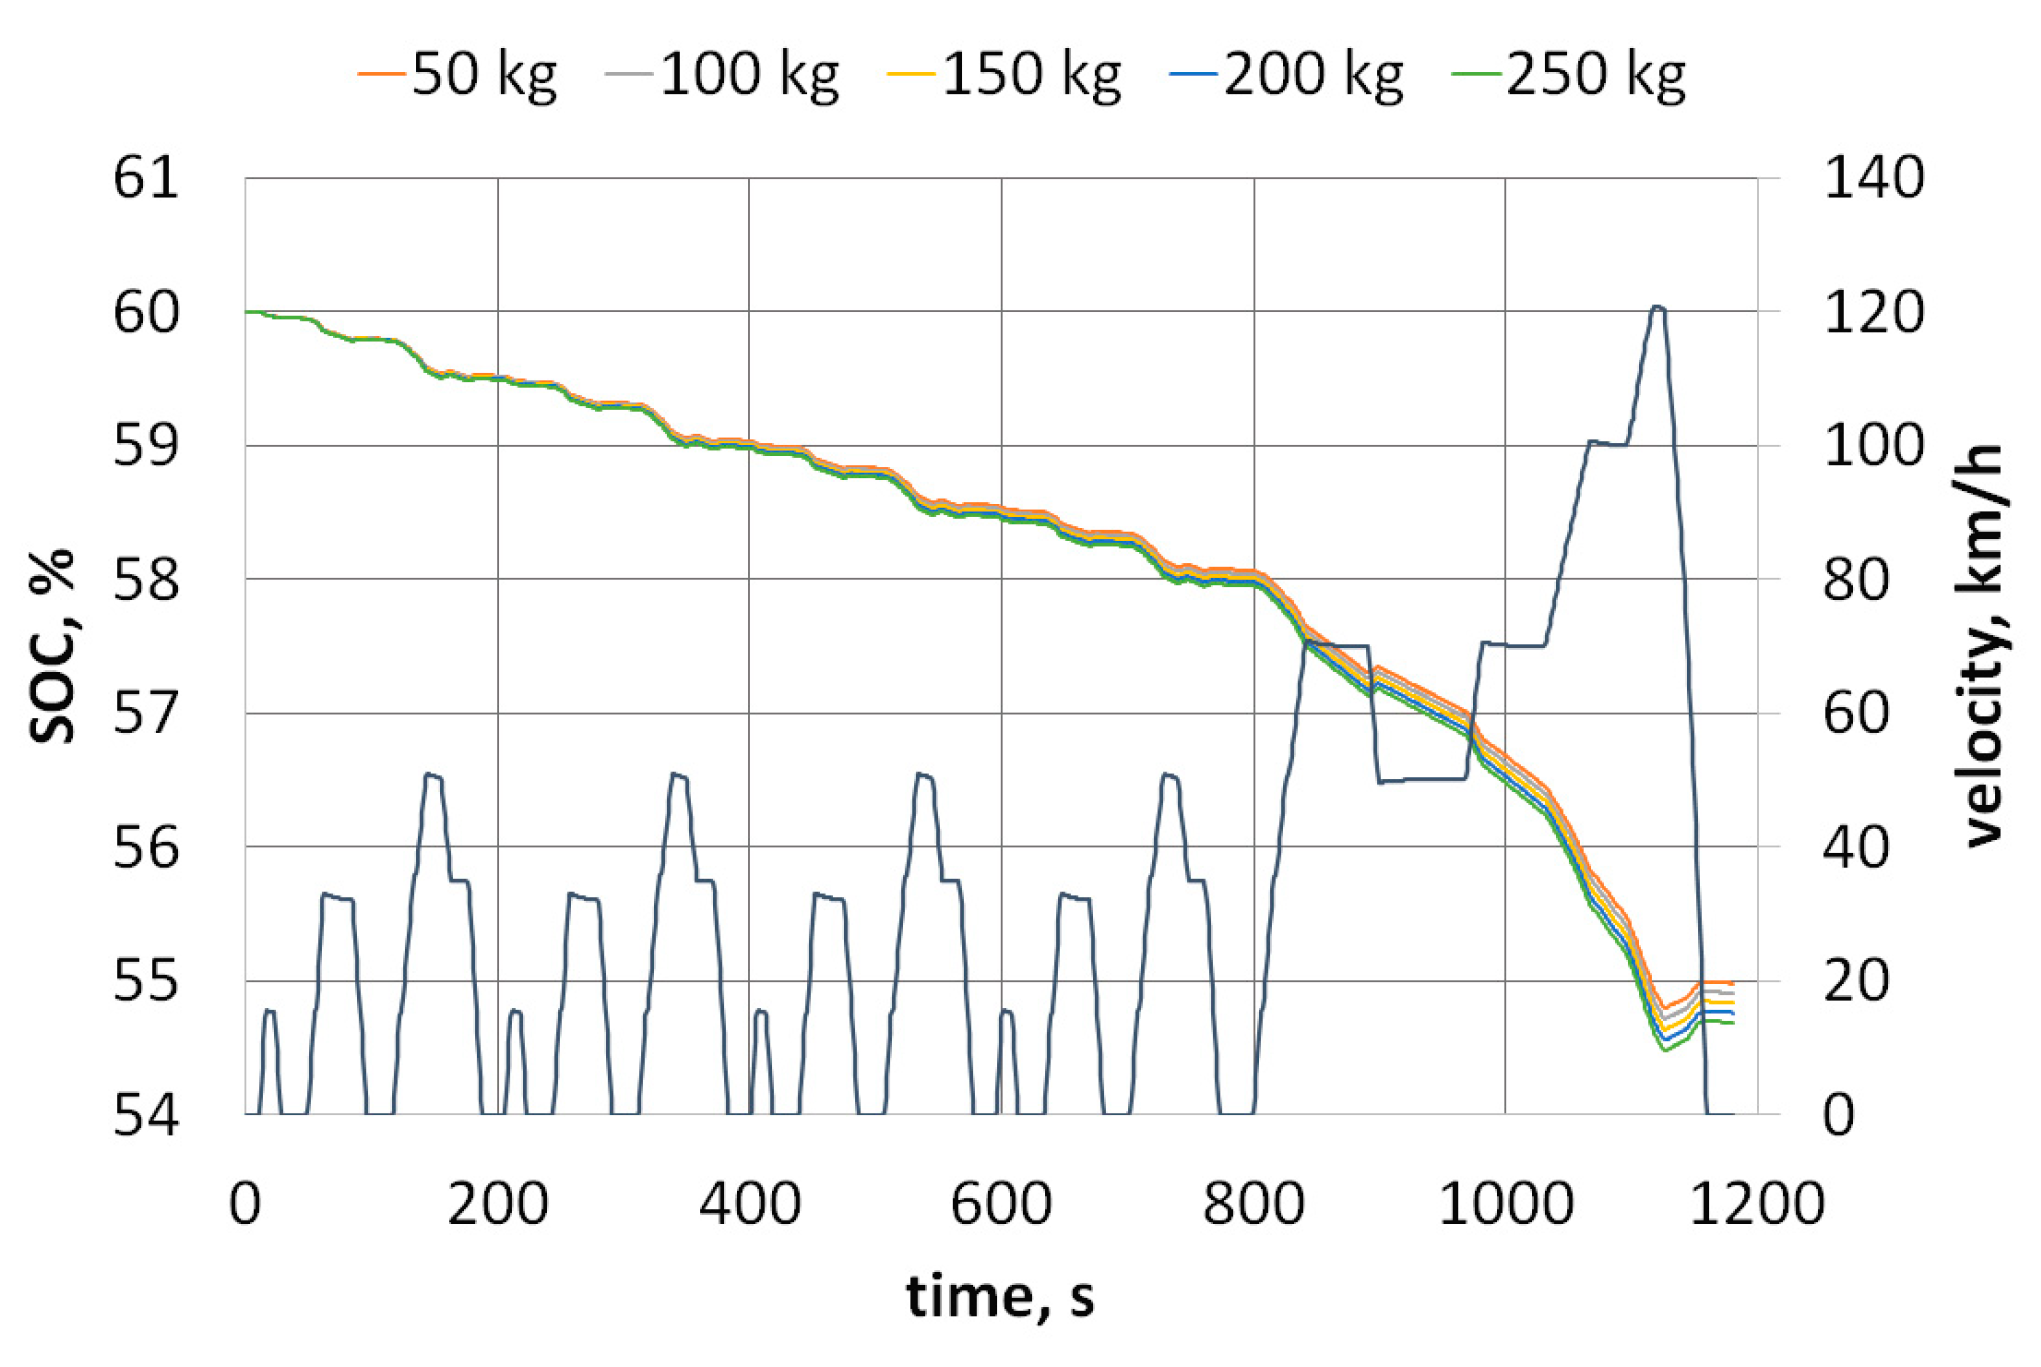
The current waveform directly depends on the speed changes implemented. During acceleration a current of 150 A is drawn, and it is possible to charge with a current of more than 50 A during braking. Electric vehicles have the possibility to recover part of the energy during braking. However, this is determined by the energy level in the accumulator and the power of the electric machine in generator mode. The battery management system (BMS) decides how much energy can be directed to the accumulator. As presented in Figure 9, a fully charged battery (SOC 100%) is not able to store any more recovered energy. Only when the energy level is below 80% can the battery be recharged. If the energy level is, for example, 60%, then the accumulator can accept much more recuperated energy.
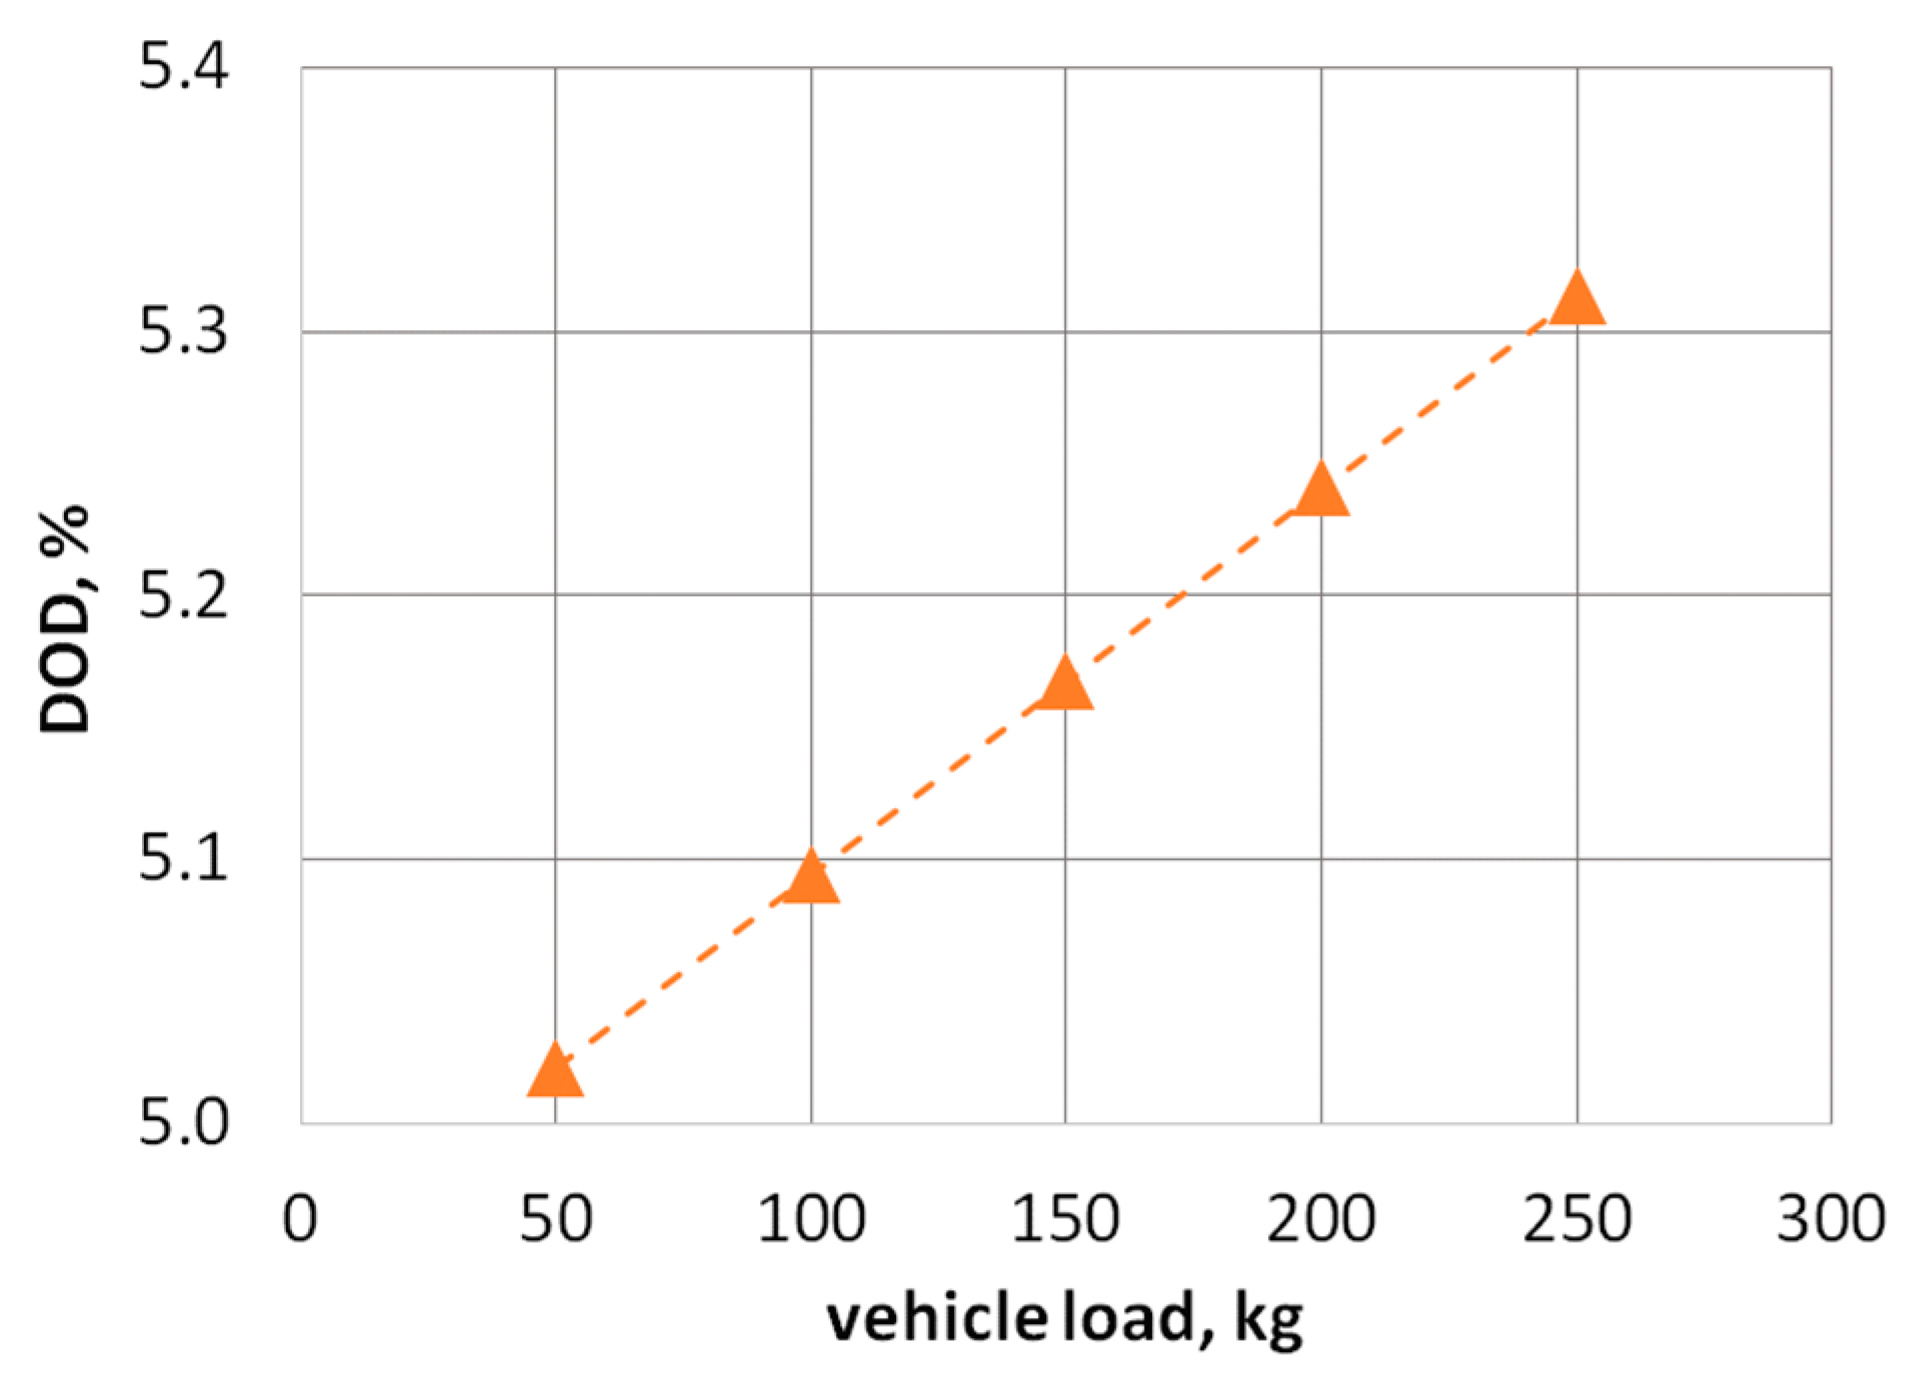
The efficiency of the electric power train is affected by the weight of the vehicle. The higher the load, the more energy the vehicle needs to overcome the resistance to motion. Figure 8 shows the level of discharge of a battery pack during the NEDC cycle at different vehicle load levels, and Figure 10 shows the depth of discharge of the battery. The initial state of charge of the accumulator was 60%, the ambient temperature was 20 °C, and the vehicle load was 50 kg.
From the simulation results, it can be concluded that the load and weight of the vehicle significantly affect the energy consumption. With a vehicle load of 250 kg, energy consumption is 7% higher than with a load of 50 kg. The higher the load, the higher the energy consumption. By considering the level of depth of discharge of the accumulator at the analyzed loads, it can be concluded that this is a linear relationship.
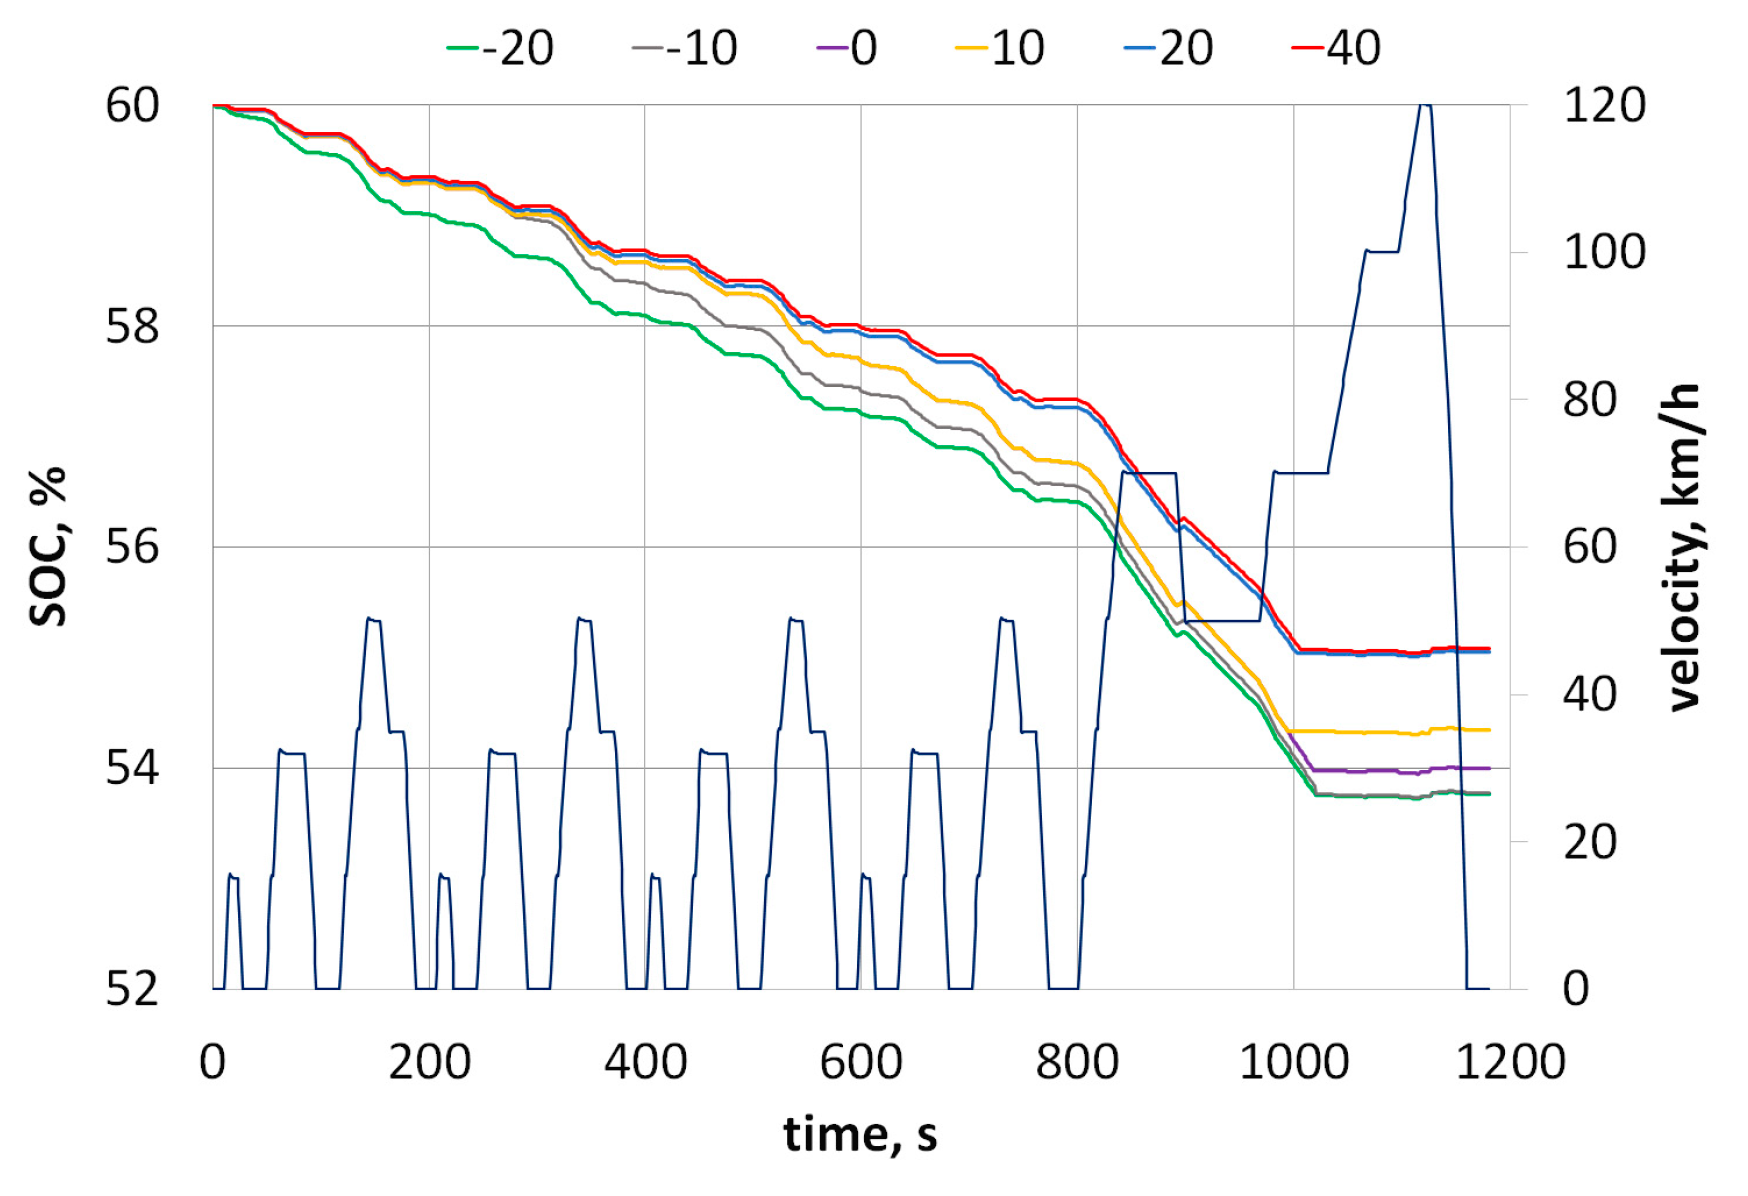
The battery state of charge at the temperatures considered is shown in Figure 11.
An important issue related to the energy consumption of an electric vehicle is also the influence of the ambient temperature. In this study, the effect of ambient temperature on the energy consumption of the NEDC cycle was investigated at the following ambient temperatures: −20 °C, −10 °C, 0 °C, 10 °C, 20 °C, 40 °C. The initial battery’s state of charge was 60%. In the study, it was assumed that the set ambient temperature is also the temperature of the battery.
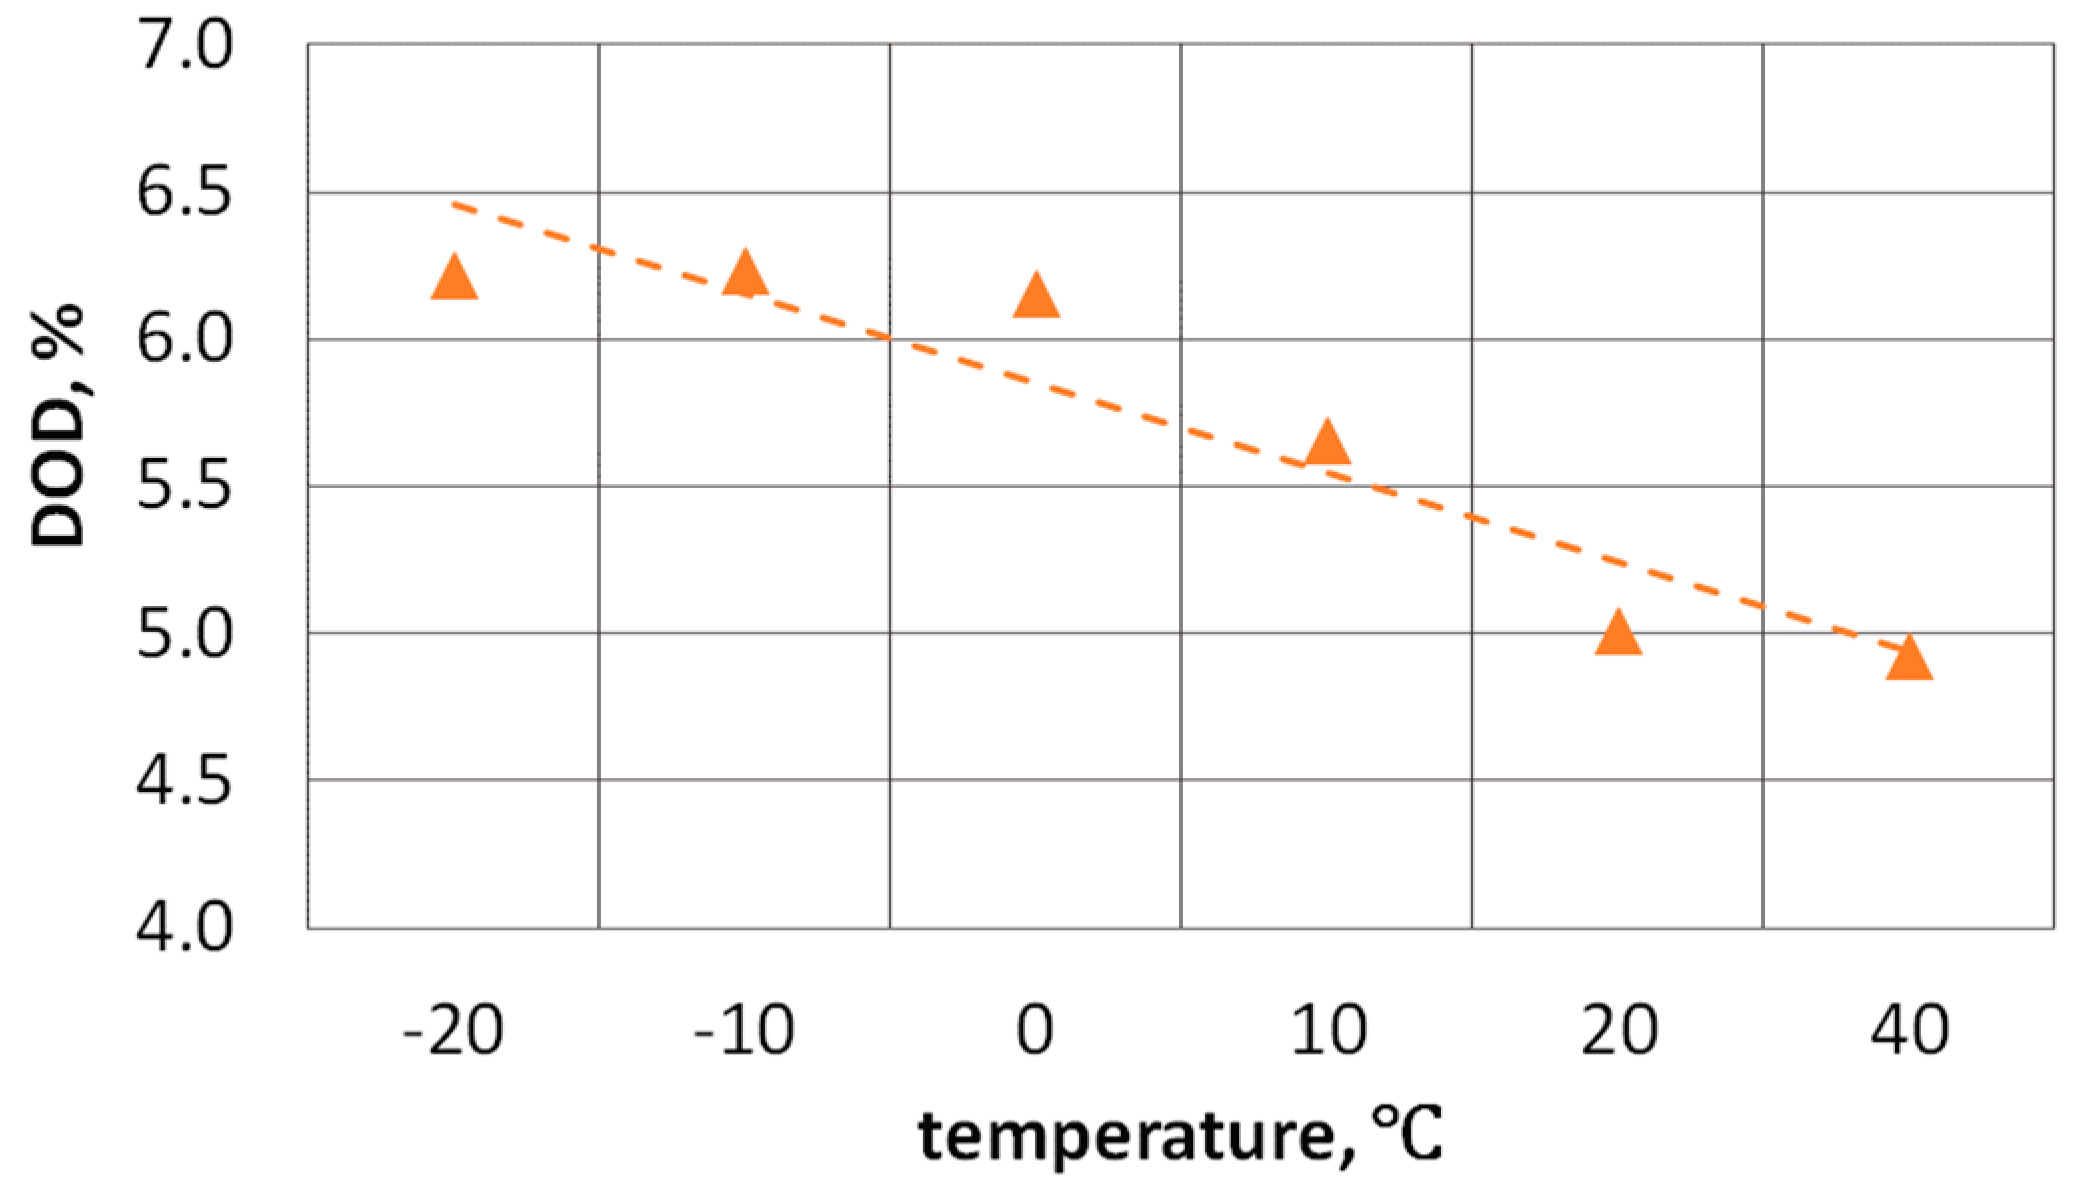
From the simulation results shown in the graphs, it is clear that temperature has a significant impact on the energy consumption level. In the case of a temperature of 40 °C, the battery’s level of discharge after performing the NEDC cycle is similar to the course at 20 °C. The energy level of the battery at temperatures below 0 °C is 24% lower compared to the test results at 20 °C. At a temperature of 10 °C, these differences are 13%. The depth of discharge of the battery at selected temperatures on the NEDC cycle is shown in Figure 12.
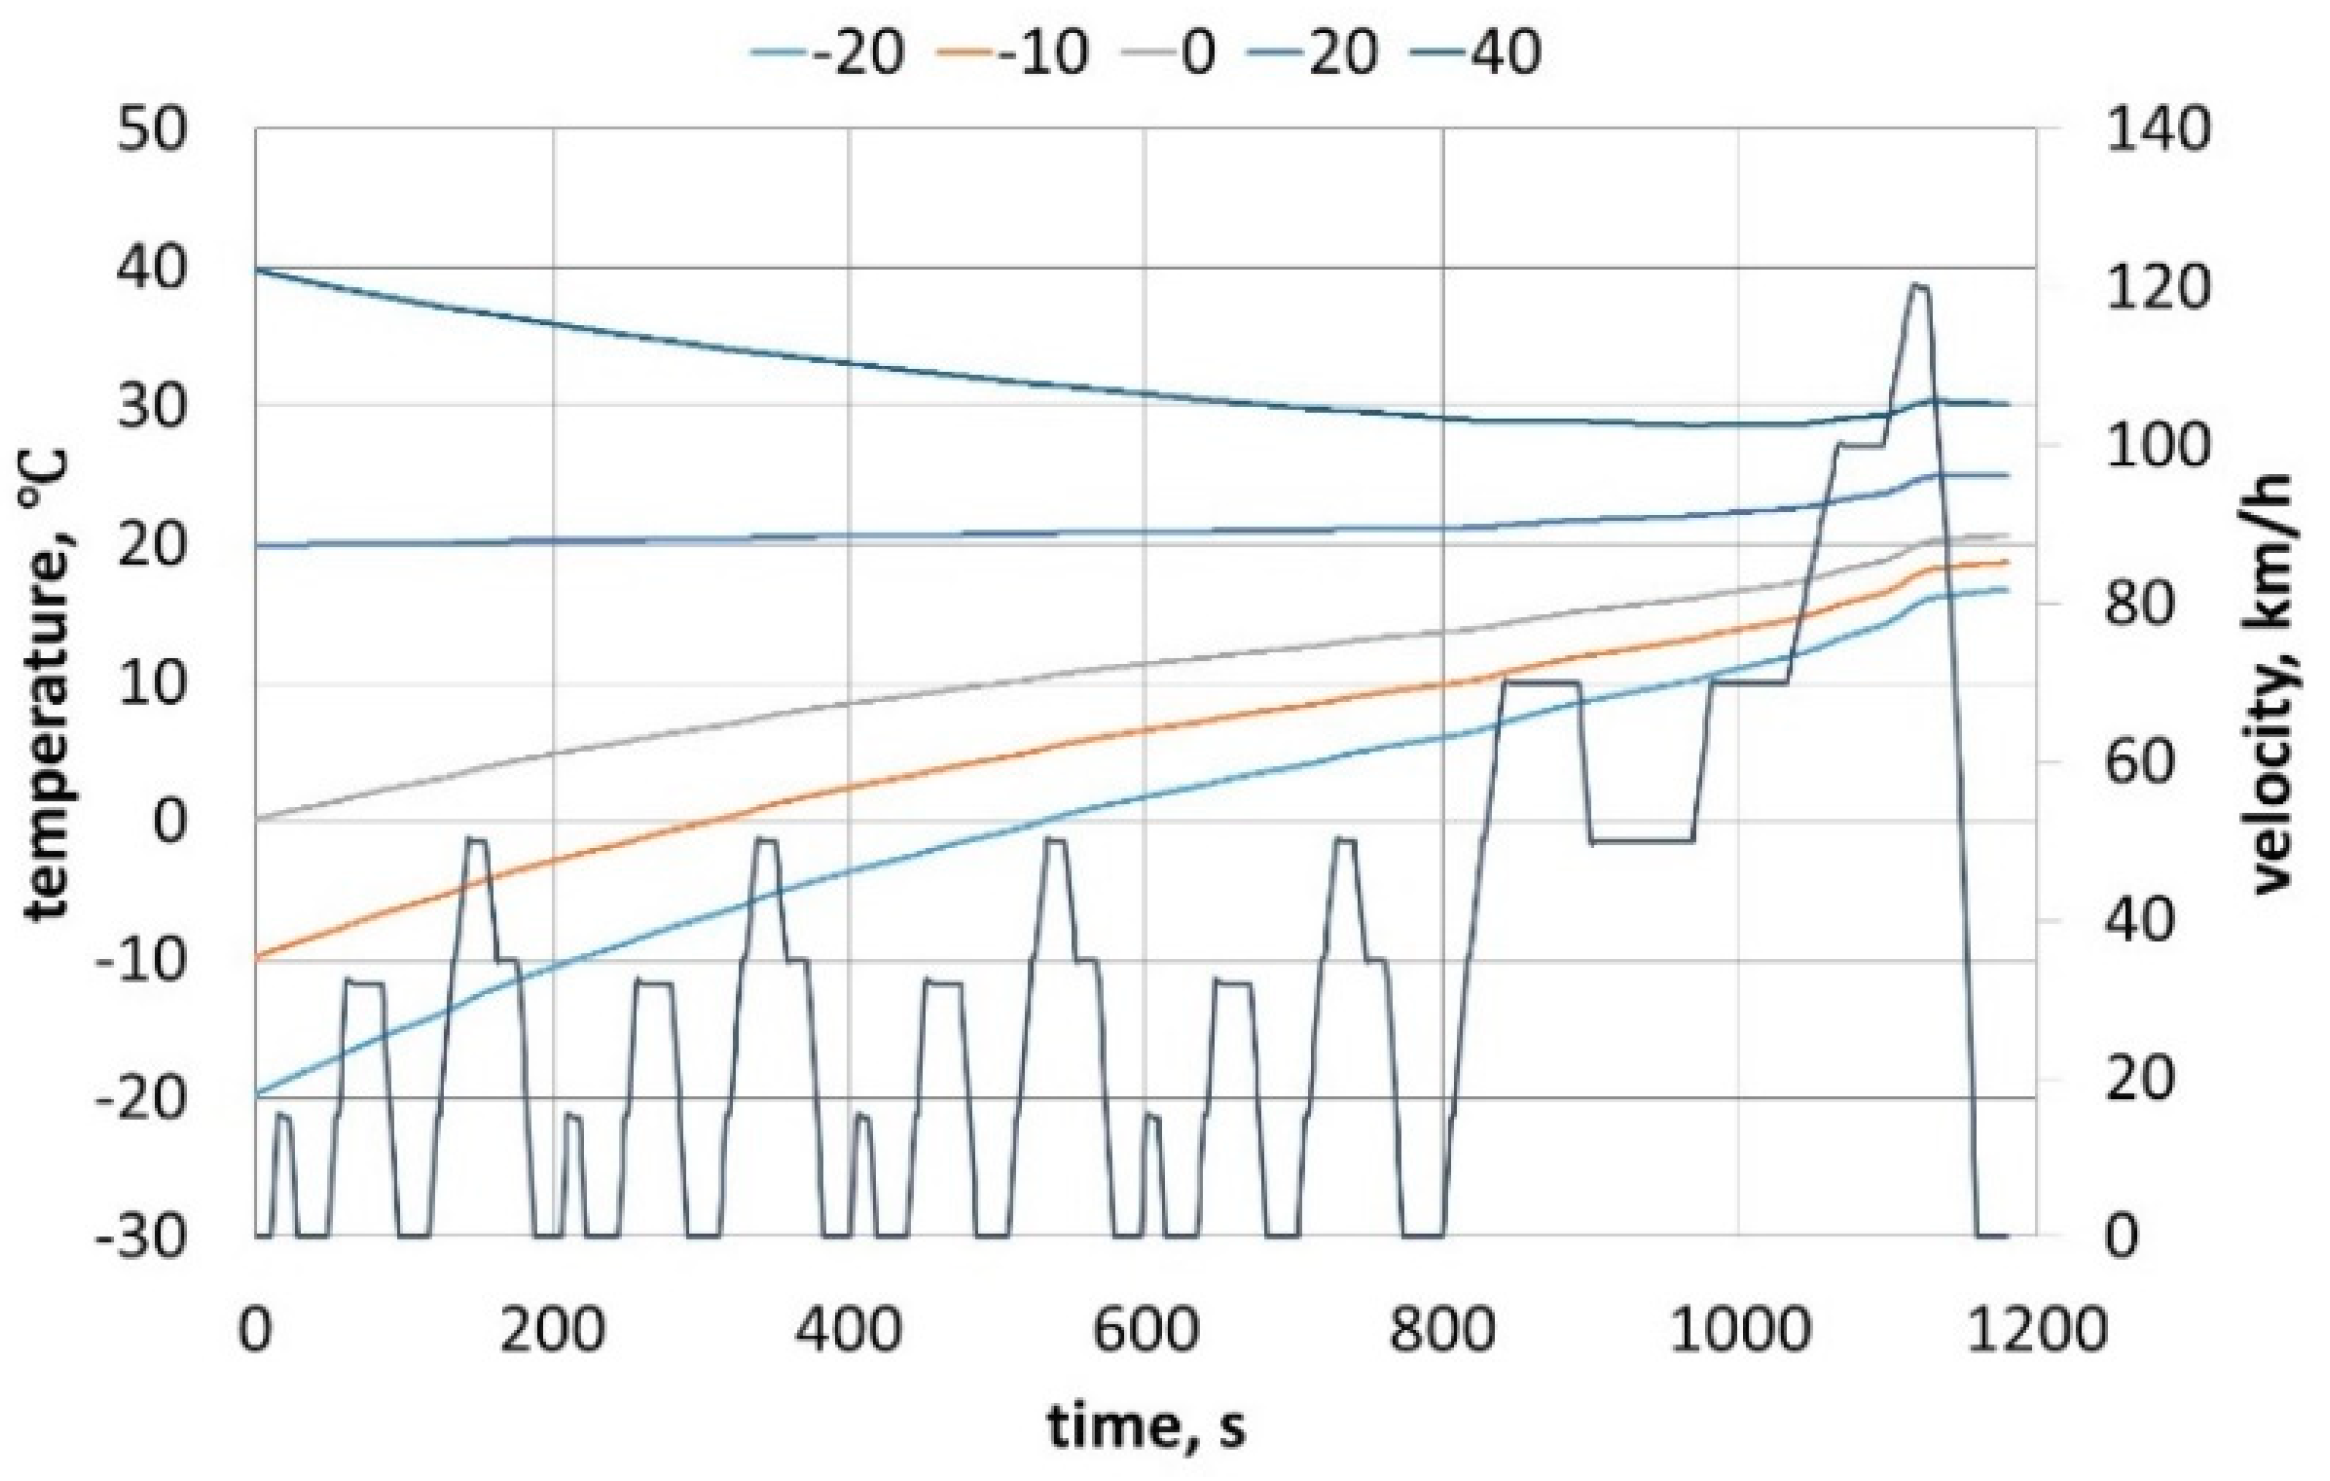
The depth of discharge of the battery assumes the highest values at negative temperatures. For temperatures above 20 °C, the DOD takes comparable values. As previously mentioned, in an electric vehicle model, the drive components are cooled using a cooling system where the coolant is liquid. The coolant temperature during the NEDC cycle at a given ambient temperature is shown in Figure 13.
The battery thermal management system (BTMS) tries to keep the battery temperature at a certain level. In the case of high ambient temperature, the BTMS is designed to prevent overheating. Hence, as seen in Figure 12, the temperature of the liquid decreases and thus cools the batteries. When the ambient temperature is below 0 °C, the task of the system is to heat the battery. This can be observed in the figure. The temperature of the coolant in the system increases.

7. Discussion

The aim of the analyses undertaken was to determine how various factors affect the depth of discharge. Drivers’ awareness of how a car’s battery discharges, what actions to avoid while driving, or what actions are desirable can significantly offset concerns about electric vehicle use.
Thus, this paper analyzes the effects of distance, the initial state of charge, load, and external temperature.
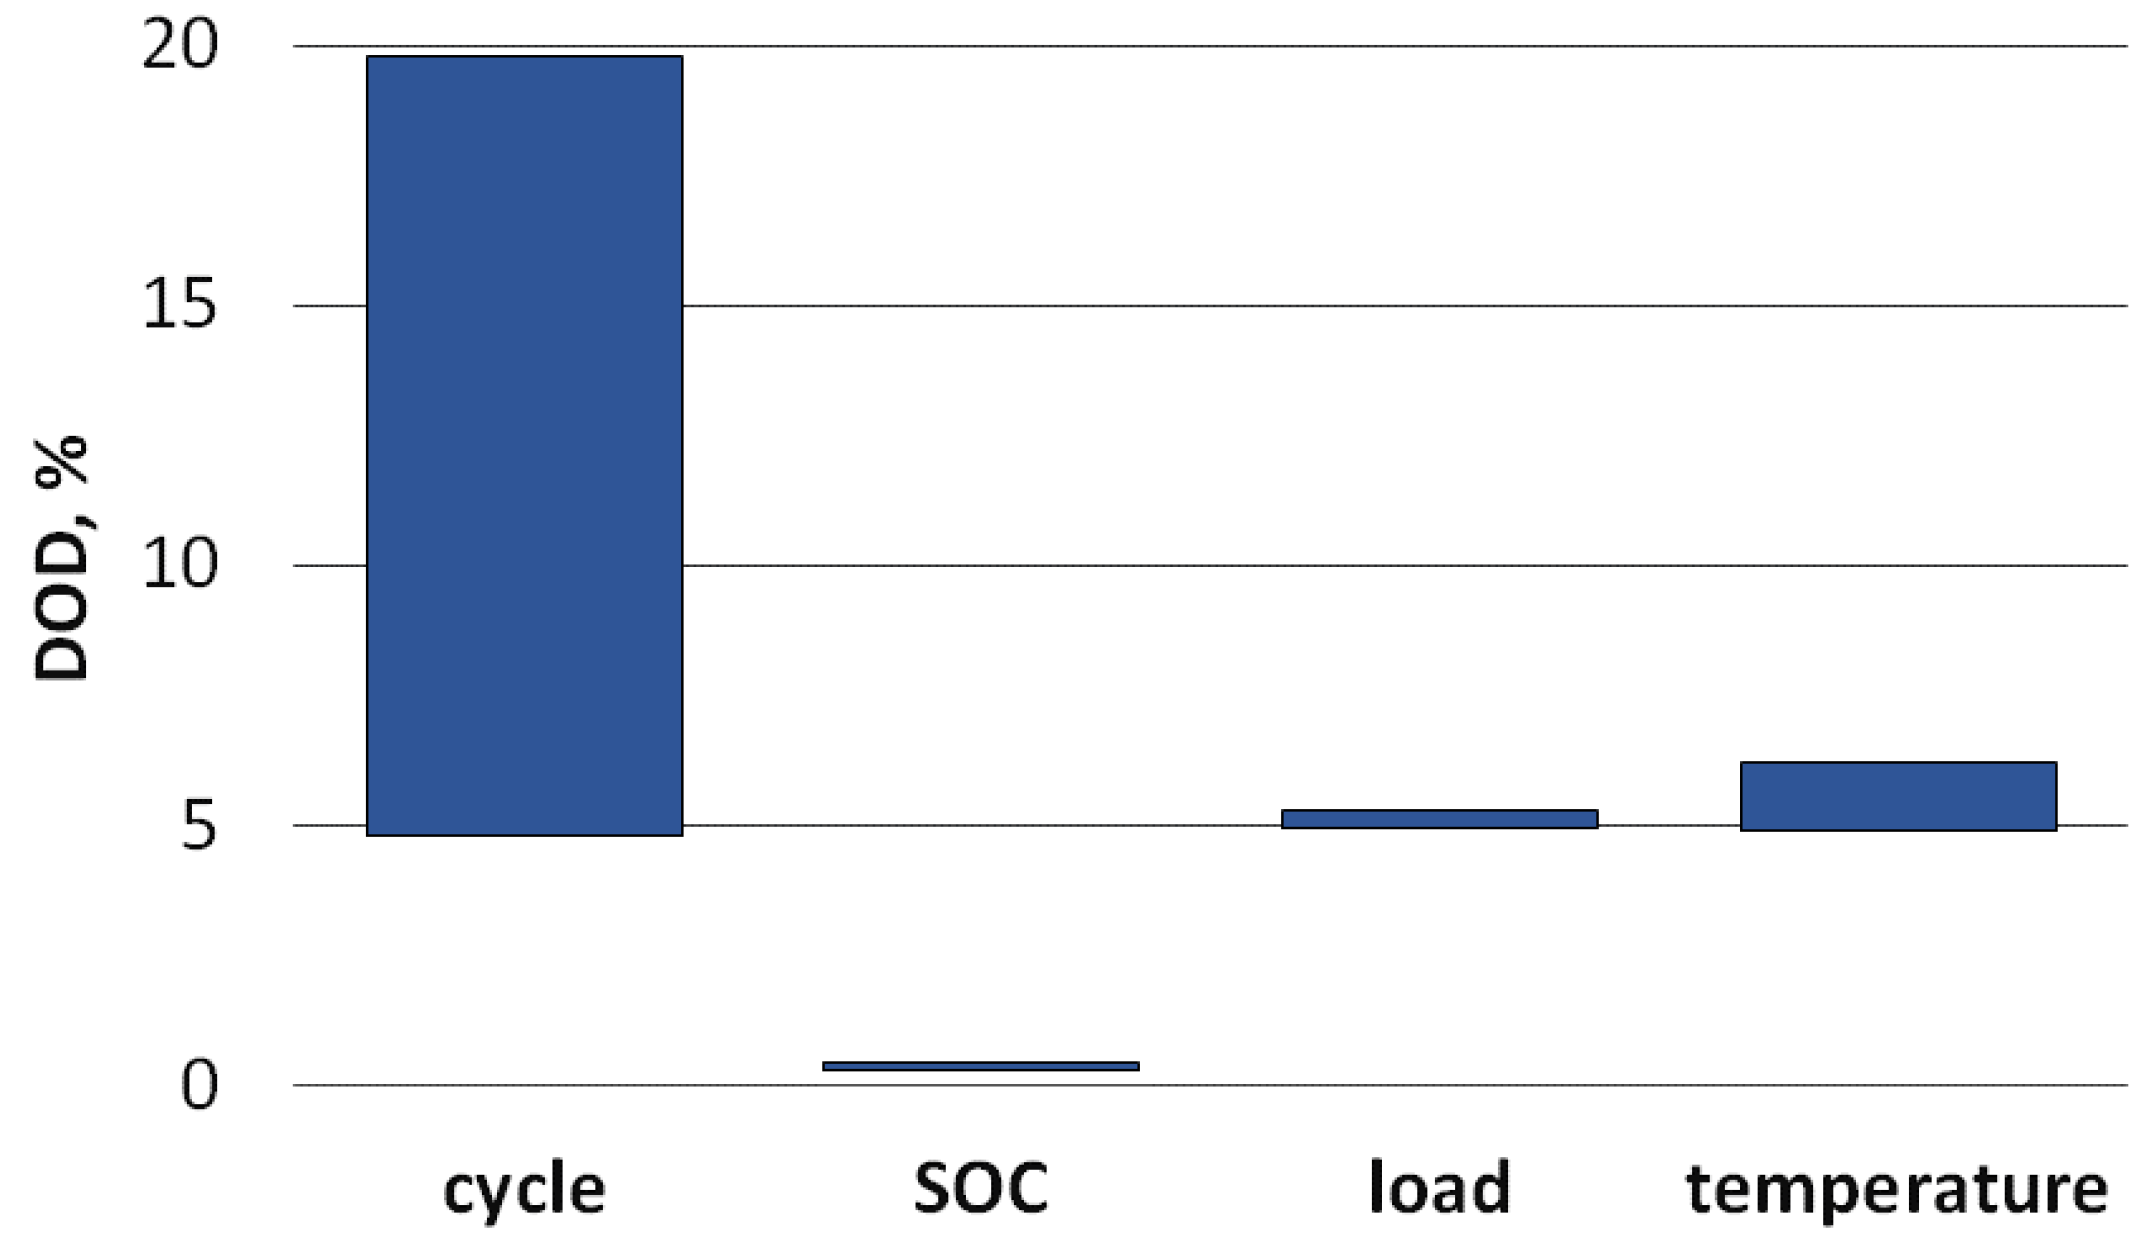
Of the factors analyzed, the battery energy level is most affected by the driving cycle. On the basis of the presented results concerning the level of depth of discharge of the accumulator, it can be concluded that the length, the shape of the road, the route, and thus the driving dynamics significantly affect energy consumption. This, in turn, can translate into vehicle range. In this paper, three driving cycles characterized by different driving dynamics were analyzed. The NEDC cycle is the shortest of the cycles analyzed. It is 11 km long and 66% of the route reflects urban conditions. Average energy consumption on the NEDC cycle is 0.20 kWh/km and DOD is 4.95%. Another cycle, WLTC, has a more dynamic velocity profile and higher average speed than the NEDC cycle. The WLTC cycle measures 23 km, and with 52% urban driving represents the routes of the cycle. Average energy consumption for this cycle was 0.21 kWh/km (DOD is 10.75%). In a cycle reflecting highway driving, average energy consumption was 0.24 kWh/km. This cycle measures 35 km with an average speed of 104 km/h. In this cycle, DOD was 18.8%. The discrepancy of the depth of discharge, as shown in the simulations, is quite significant. Table 3 shows the values of energy consumption in the analyzed cycles with a load of 50 kg and an initial state of charge of the accumulator equal to 60%. The ambient temperature was 20 °C.
Table 4 shows the energy consumption values and the depth of discharge for the NEDC cycle with an accumulator’s initial state of charge of 60% and a load of 50 kg.
The ambient temperature also has a significant impact on energy consumption. In the analyzed driving cycle at temperatures below 0 °C, average energy consumption can increase by up to 24% compared to an ambient temperature of 20 °C. At negative ambient temperatures, the DOD was 6.2%. Average energy consumption is less affected by high ambient temperatures. The energy consumption values at 40 °C are similar to the energy consumption values at 20 °C.
Table 5 shows the energy consumption values and discharge rate of the battery in the NEDC cycle with an initial state of charge of the accumulator of 60% and an ambient temperature of 20 °C.
To a lesser extent, DOD levels are affected by vehicle load. The average energy consumption of an electric vehicle with a load of 250 kg is 7% higher than when the vehicle load is 50 kg. With a maximum load of 250 kg, the discharge rate of the accumulator is 5.3%.
Table 6 shows the energy consumption values and discharge rate of the battery in the NEDC cycle at a different state of charge of the accumulator with a load of 50 kg and an ambient temperature of 20 °C.
Power consumption is slightly affected by the initial state of charge of the battery. The differences in the average energy expended per driving cycle with different initial battery state of charge are about 1%.
A summary of the effects of the factors in this article on the range of depth of discharge is shown in Figure 14.

8. Conclusions

Recently, range anxiety has been observed among electric vehicle users. The limited range of an electric vehicle makes EV users worry that the battery will drain while driving and the vehicle will stall on the road. The results of the research presented in the papers cited in Section 2 show that range anxiety affects driving behavior at the emotional, psychological, behavioral, and physiological levels. Seeing low energy levels makes drivers feel anxious, and under stress, they may change their driving style. Drivers mostly choose to reduce speed to save energy and thus increase range. Moreover, the change in driving style includes behaviors that are considered dangerous and aggressive, such as tapping your fingers on the steering wheel, yelling, honking, or aggressive gestures to other road users.
So, it is worth exploring the factors that further reduce range during daily electric vehicle operation that EV users are often unaware of. The range of an electric vehicle is affected by many factors, primarily the route taken, the load on the vehicle, and the ambient temperature. The purpose of this study was to determine the effect of selected parameters on a battery’s depth of discharge (DOD). In the simulation study of an electric vehicle, the effects of the driving cycle, ambient temperature, load, and the initial state of charge of the accumulator on the energy consumption pattern and a battery’s depth of discharge (DOD) were analyzed. The presented results show how significantly the operating conditions of an electric vehicle affect the energy life. This translates into the distance the vehicle can travel on a single charge.
Simulation results confirmed that the route significantly affects energy consumption. Urban driving involves frequent acceleration and braking phases which can contribute to a significant increase in energy consumption, but also provide the possibility of energy recuperation during braking. Higher energy consumption is observed at high speeds, i.e., when driving on a highway or in extra-urban driving conditions, at a fixed speed, without the possibility of energy recovery. In the NEDC cycle, urban driving accounts for 66%. The average energy consumption in NEDC was 2.20 kWh (DOD—4.95%). In the WLTC, the urban driving portion of the cycle accounts for 52%. Average energy consumption was 0.21 kWh (DOD was 10.75%). In a cycle representing highway driving, average energy consumption was 0.24 kWh (DOD was 18.8%). The differences in the values of the average energy consumption between the NEDC cycle and the cycle reflecting driving on the highway is 16%. Therefore, it can be concluded that as the average speed of the driving cycle increases, the energy consumption also increases and therefore the range decreases.
The ambient temperature has also an impact on the energy consumption of an electric vehicle. Simulation studies have shown that the highest energy consumption occurs during negative ambient temperature. At temperatures below 0 °C, average energy consumption can increase by up to 24% compared to an ambient temperature of 20 °C. On the other hand, energy consumption is less affected by high ambient temperatures. Based on simulation results, when the ambient temperature was 40 °C, the average energy consumption was 2% higher than at an ambient temperature of 20 °C. Therefore, it can be pointed out that the anxiety of drivers that the range of an electric vehicle is significantly reduced at negative ambient temperatures can be confirmed.
Based on the simulation results, the load affected on energy consumption of EV. Driving with a maximum load can result in an increase in average energy consumption of 7% compared to driving with a load of 50 kg. It can be observed that the energy consumption increases in a linear manner with the load.
The range of an electric vehicle depends on many factors. Based on the results of the simulation research, it can be concluded that the users of electric vehicles should take additional factors into account when estimating the vehicle range and planning the route. Such factors should mainly include the type of route, ambient temperature, and vehicle load, as these factors can affect energy consumption and thus reduce the range. The authors are aware that, apart from the analyzed parameters, there are many other factors influencing the range of an electric vehicle. More research is needed to deepen our understanding of the parameters that may limit the range of an EV. In further work, the authors want to investigate the impact of driving style, traffic intensity, and infrastructure elements on the operational parameters of an electric vehicle.

Author Contributions

Conceptualization, E.M.S. and R.S.J.; methodology, E.M.S.; software, E.M.S.; validation, E.M.S.; formal analysis, E.M.S. and R.S.J.; investigation, E.M.S.; resources, E.M.S.; data curation, E.M.S.; writing—original draft preparation, E.M.S. and R.S.J.; writing—review and editing, E.M.S. and R.S.J.; visualization, E.M.S. and R.S.J.; supervision, E.M.S. and R.S.J.; project administration, E.M.S.; funding acquisition, R.S.J. Both authors have read and agreed to the published version of the manuscript.

Funding

This research received no external funding.

Institutional Review Board Statement

Not applicable.

Informed Consent Statement

Not applicable.

Data Availability Statement

Not applicable.

Conflicts of Interest

The authors declare no conflict of interest.

References

  1. New Passenger Car Registrations in the EU by Alternative Fuel Type, European Automobile Manufacturers’ Association (ACEA). Available online: https://www.acea.be/press-releases/article/fuel-types-of-new-cars-electric-10.5-hybrid-11.9-petrol-47.5-market-share-f (accessed on 20 March 2021).
  2. Vehicle in Use; ACEA Report; European Automobile Manufacturers’ Association (ACEA): Brussels, Belgium, 2021.
  3. Global EV Outlook 2020 Entering the Decade of Electric Drive? International Energy Agency (IEA): Paris, France, 2020.
  4. The Global Electric Vehicle Market in 2021: Statistics & Forecasts. Available online: https://www.virta.global/global-electric-vehicle-market (accessed on 20 March 2021).
  5. Turoń, K.; Sierpiński, G. Car-Sharing in Urban Transport Systems—Overview of Europe and Asia. In Challenges of Urban. Mobility, Transport. Companies and Systems; (Springer Proceedings in Business and Economics); Springer: Berlin/Heidelberg, Germany, 2019; pp. 89–99. [Google Scholar] [CrossRef]
  6. Münzel, K.; Boon, W.; Frenken, K.; Blomme, J.; van der Linden, D. Explaining carsharing supply across Western European cities. Int. J. Sustain. Transp. 2019, 14, 243–254. [Google Scholar] [CrossRef] [Green Version]
  7. Ramos, É.M.S.; Bergstad, C.J.; Chicco, A.; Diana, M. Mobility styles and car sharing use in Europe: Attitudes, behaviours, motives and sustainability. Eur. Transp. Res. Rev. 2020, 12, 13. [Google Scholar] [CrossRef] [Green Version]
  8. Study on Passenger Transport by Taxi, Hire Car with Driver and Ridesharing in the EU, European Commission Directorate-General for Mobility and Transport. 2016. Available online: https://ec.europa.eu/transport/modes/road/studies/study-passenger-transport-taxi-hire-car-driver-and-ridesharing-eu_cs (accessed on 21 March 2021).
  9. Mathieu, L.; Poliscanova, J. Mission (Almost) Accomplished. Carmakers’ Race to Meet the 2020/21 CO2 Targets and the UE Electric Cars Market; Transport & Environment: Brussels, Belgium, 2020. [Google Scholar]
  10. Merkisz-Guranowska, A.; Maciejewski, M. The Implementation of the Electric Taxi Fleet in the City of Poznan, Poland. WIT Trans. Built Environ. 2015, 146, 243–254. [Google Scholar] [CrossRef] [Green Version]
  11. Moniot, M.; Rames, C.; Burrell, E. Feasibility Analysis of Taxi Fleet Electrification using 4.9 Million Miles of Real-World Driving Data. SAE Tech. Pap. 2019, 1–10. [Google Scholar] [CrossRef]
  12. Tamis, M.; van den Hoed, R. Moving a Taxi Sector to Become Electric: Characterizing Taxi Drivers Interested in Purchasing a Full Electric Vehicle. World Electr. Veh. J. 2020, 11, 20. [Google Scholar] [CrossRef] [Green Version]
  13. Wang, G.; Zhang, Y.; Fang, Z.; Wang, S.; Zhang, F.; Zhang, D. FairCharge: A Data-Driven Fairness-Aware Charging Recommendation System for Large-Scale Electric Taxi Fleets. Proc. ACM Interact. Mob. Wearable Ubiquitous Technol. 2020, 4, 25. [Google Scholar] [CrossRef] [Green Version]
  14. Hall, D.; Moultak, M.; Lutsey, N. Electric Vehicle Capitals of the World: Demonstrating the Path to Electric Drive. International Council on Clean Transportation. 2017. Available online: https://theicct.org/publications/EV-capitals-of-the-world (accessed on 21 March 2021).
  15. Maffei, L.; Masullo, M. Electric Vehicles and Urban Noise Control Policies. Arch. Acoust. 2014, 39, 333–341. [Google Scholar] [CrossRef] [Green Version]
  16. Pallas, M.-A.; Kennedy, J.; Chatagnon, R.; Berengier, M.; Czuka, M.; Conter, M.; Muirhead, M. Towards a model for electric vehicle noise emission in the European prediction method CNOSSOS-EU. Appl. Acoust. 2016, 113, 89–101. [Google Scholar] [CrossRef] [Green Version]
  17. Łebkowski, A. Electric Vehicles—The Sound Of Silence. Masz. Elektr. Zesz. Probl. Nr 1 2016, 109, 155–159. [Google Scholar]
  18. Bekker, A. Influences of Electric Propulsion on Vehicle Vibro-acoustics. R D J. South. Afr. Inst. Mech. Eng. 2014, 30, 47–54. [Google Scholar]
  19. Szumska, E.; Jurecki, R.; Pawełczyk, M. Assessment of Total Costs of Ownership for Midsize Passenger Cars with Conventional and Alternative Drive Trains. Commun. Sci. Lett. Univ. Zilina 2019, 21, 21–27. [Google Scholar] [CrossRef]
  20. Hagman, J.; Ritzén, S.; Janhager Stier, J.; Susilo, Y. Total cost of ownership and its potential implications for battery electric vehicle diffusion. Res. Transp. Bus. Manag. 2016, 18, 11–17. [Google Scholar] [CrossRef] [Green Version]
  21. Kumar, P.; Chakrabarty, S. Total Cost of Ownership Analysis of the Impact of Vehicle Usage on the Economic Viability of Electric Vehicles in India. Transp. Res. Rec. 2020, 2674, 563–572. [Google Scholar] [CrossRef]
  22. Letmathe, P.; Suares, M. A consumer-oriented total cost of ownership model for different vehicle types in Germany. Transp. Res. Part D Transp. Environ. 2017, 57, 314–335. [Google Scholar] [CrossRef]
  23. Stevic, Z.; Radovanovic, I. Energy Efficiency of Electric Vehicles, New Generation of Electric Vehicles. In New Generation of Electric Vehicles; Stevic, Z., Ed.; Intech-Open: Belgrade, Serbia, 2012; pp. 93–134. [Google Scholar] [CrossRef]
  24. Mirchevski, S. Energy Efficiency in Electric Drives. Electronics 2012, 16, 46–49. [Google Scholar] [CrossRef] [Green Version]
  25. Gu, J.; Ouyang, M.; Lu, D.; Li, J.; Lu, L. Energy efficiency optimization of electric vehicle driven by in-wheel motors. Int. J. Automot. Technol. 2013, 14, 763–772. [Google Scholar] [CrossRef]
  26. Kobayashi, S.; Plotkin, S.; Ribeiro, S.K. Energy efficiency technologies for road vehicles. Energy Effic. 2009, 2, 125–137. [Google Scholar] [CrossRef]
  27. Han, J.; Vahidi, A.; Sciarretta, A. Fundamentals of energy efficient driving for combustion engine and electric vehicles: An optimal control perspective. Automatica 2019, 103, 558–572. [Google Scholar] [CrossRef]
  28. Albatayneh, A.; Assaf, M.; Alterman, D.; Jaradat, M. Comparison of the Overall Energy Efficiency for Internal Combustion Engine Vehicles and Electric Vehicles. Environ. Clim. Technol. 2020, 24, 669–680. [Google Scholar] [CrossRef]
  29. Ehsani, M.; Gao, Y.; Emadi, A. Modern Electric, Hybrid Electric, and Fuel Cell Vehicles—Fundamentals, Theory, and Design, 2nd ed.; CRC Press: Boca Raton, FL, USA, 2017. [Google Scholar]
  30. Liu, H.; Chen, X.; Wang, X. Overview and Prospects on Distributed Drive Electric Vehicles and Its Energy Saving Strategy. Przegląd Elektrotechniczny Electr. Rev. 2012, 88, 122–125. [Google Scholar]
  31. Wang, J.; Besselink, I.; Nijmeijer, H. Electric Vehicle Energy Consumption Modelling and Prediction Based on Road Information. World Electr. Veh. J. 2015, 7, 447–458. [Google Scholar] [CrossRef] [Green Version]
  32. Musabini, A.; Nguyen, K.; Rouyer, R.; Lilis, Y. Influence of Adaptive Human–Machine Interface on Electric-Vehicle Range-Anxiety Mitigation. Multimodal Technol. Interact. 2020, 4, 4. [Google Scholar] [CrossRef] [Green Version]
  33. Yuan, Q.; Hao, W.; Su, H.; Bing, G.; Gui, X.; Safikhani, A. Investigation on Range Anxiety and Safety Buffer of Battery Electric Vehicle Drivers. J. Adv. Transp. 2018, 2018, 8301209. [Google Scholar] [CrossRef] [Green Version]
  34. Jung, M.F.; Sirkin, D.; Gür, T.M.; Steinert, M. Displayed Uncertainty Improves Driving Experience and Behavior: The Case of Range Anxiety in an Electric Car. In Proceedings of the 33rd Annual ACM Conference on Human Factors in Computing Systems (CHI ’15), Seoul, Korea, 18–23 April 2015; pp. 2201–2210. [Google Scholar] [CrossRef]
  35. Graham-Rowe, E.; Gardner, B.; Abraham, C.; Skippon, S.; Dittmar, H.; Hutchins, R.; Stannard, J. Mainstream consumers driving plug-in battery-electric and plug-in hybrid electric cars: A qualitative analysis of responses and evaluations. Transp. Res. Part A Policy Pract. 2012, 46, 140–153. [Google Scholar] [CrossRef]
  36. Valentine-Urbschat, M.; Bernhart, W. Powertrain 2020—The Future Drives Electric; Roland Berger Strategy Consultants: Munich, Germany, 2009. [Google Scholar]
  37. Pevec, P.; Babic, J.; Carvalho, A.; Ghiassi-Farrokhfal, Y.; Ketter, W.; Podobnik, W. Electric Vehicle Range Anxiety: An Obstacle for the Personal Transportation (R)evolution? In Proceedings of the 4th International Conference on Smart and Sustainable Technologies (SpliTech), Split, Croatia, 18–21 June 2019; pp. 1–8. [Google Scholar] [CrossRef]
  38. Rauh, N.; Franke, T.; Krems, J.F. Understanding the Impact of Electric Vehicle Driving Experience on Range Anxiety. Hum. Factors 2014, 57, 177–187. [Google Scholar] [CrossRef] [PubMed]
  39. El-Fedany, I.; Kiouach, D.; Alaoui, R. Application Design Aiming to Minimize Drivers’ Trip Duration through Intermediate Charging at Public Station Deployed in Smart Cities. World Electr. Veh. J. 2019, 10, 67. [Google Scholar] [CrossRef] [Green Version]
  40. Tannahill, V.R.; Sutanto, D.; Muttaqi, K.M.; Masrur, M.A. Future vision for reduction of range anxiety by using an improved state of charge estimation algorithm for electric vehicle batteries implemented with low-cost microcontrollers. IET Electr. Syst. Transp. 2015, 5, 24–32. [Google Scholar] [CrossRef]
  41. Chen, R.; Liu, X.; Miao, L.; Yang, P. Electric Vehicle Tour Planning Considering Range Anxiety. Sustainability 2020, 12, 3685. [Google Scholar] [CrossRef]
  42. Guo, F.; Yang, J.; Lu, J. The battery charging station location problem: Impact of users’ range anxiety and distance convenience. Transp. Res. Part E Logist. Transp. Rev. 2018, 114, 1–18. [Google Scholar] [CrossRef]
  43. Cui, S.; Zhao, H.; Wen, H.; Zhang, C. Locating Multiple Size and Multiple Type of Charging Station for Battery Electricity Vehicles. Sustainability 2018, 10, 3267. [Google Scholar] [CrossRef] [Green Version]
  44. Liu, G.; Kang, L.; Luan, Z.; Qiu, J.; Zheng, F. Charging Station and Power Network Planning for Integrated Electric Vehicles (EVs). Energies 2019, 12, 2595. [Google Scholar] [CrossRef] [Green Version]
  45. Akbari, M.; Brenna, M.; Longo, M. Optimal Locating of Electric Vehicle Charging Stations by Application of Genetic Algorithm. Sustainability 2018, 10, 1076. [Google Scholar] [CrossRef] [Green Version]
  46. Pagany, R.; Marquardt, A.; Zink, R. Electric Charging Demand Location Model—A User- and Destination-Based Locating Approach for Electric Vehicle Charging Stations. Sustainability 2019, 11, 2301. [Google Scholar] [CrossRef] [Green Version]
  47. Ramachandran, A.; Balakrishna, A.; Kundzicz, P.; Neti, A. Predicting Electric Vehicle Charging Station Usage: Using Machine Learning to Estimate Individual Station Statistics from Physical Configurations of Charging Station Networks. arXiv 2018, arXiv:1804.00714. [Google Scholar]
  48. Sarker, M.R.; Pandžić, H.; Ortega-Vazquez, M.A. Electric vehicle battery swapping station: Business case and optimization model. In Proceedings of the 2013 International Conference on Connected Vehicles and Expo (ICCVE), Las Vegas, NV, USA, 2–6 December 2013; pp. 289–294. [Google Scholar] [CrossRef] [Green Version]
  49. Mak, H.; Rong, Y.; Shen, Z. Infrastructure Planning for Electric Vehicles with Battery Swapping. Manag. Sci. 2013, 59, 1557–1575. [Google Scholar] [CrossRef] [Green Version]
  50. Varga, B.O.; Sagoian, A.; Mariasiu, F. Prediction of Electric Vehicle Range: A Comprehensive Review of Current Issues and Challenges. Energies 2019, 12, 946. [Google Scholar] [CrossRef] [Green Version]
  51. Rezvanizaniani, S.M.; Liu, Z.; Chen, Y.; Lee, J. Review and recent advances in battery health monitoring and prognostics technologies for electric vehicle (EV) safety and mobility. J. Power Sources 2014, 256, 110–124. [Google Scholar] [CrossRef]
  52. Mruzek, M.; Gajdáč, I.; Kučera, L.; Barta, D. Analysis of Parameters Influencing Electric Vehicle Range. Procedia Eng. 2016, 134, 165–174. [Google Scholar] [CrossRef] [Green Version]
  53. Berjoza, D.; Jurgena, I. Influence of batteries weight on electric automobile performance. Eng. Rural Dev. 2017, 16, 1388–1394. [Google Scholar] [CrossRef]
  54. Weiss, M.; Cloos, C.K.; Helmers, E. Energy efficiency trade-offs in small to large electric vehicles. Environ. Sci. Eur. 2020, 32, 46. [Google Scholar] [CrossRef] [Green Version]
  55. Iclodean, C.; Varga, B.; Burnete, N.; Cimerdean, D.; Jurchiş, B. Comparison of Different Battery Types for Electric Vehicles. IOP Conf. Ser. Mater. Sci. Eng. 2017, 252, 012058. [Google Scholar] [CrossRef] [Green Version]
  56. Long, B.; Lim, S.T.; Ryu, J.H.; Chong, K.T. Energy-Regenerative Braking Control of Electric Vehicles Using Three-Phase Brushless Direct-Current Motors. Energies 2014, 7, 99–114. [Google Scholar] [CrossRef] [Green Version]
  57. Xu, G.; Li, W.; Xu, K.; Song, Z. An Intelligent Regenerative Braking Strategy for Electric Vehicles. Energies 2011, 4, 1461–1477. [Google Scholar] [CrossRef] [Green Version]
  58. Scheepmaker, G.M.; Goverde, R.M.P. Energy-efficient train control using nonlinear bounded regenerative braking. Transp. Res. Part C Emerg. Technol. 2020, 121, 102852. [Google Scholar] [CrossRef]
  59. Rakov, V. Determination of optimal characteristics of braking energy recovery system in vehicles operating in urban conditions. Transp. Res. Procedia 2020, 50, 566–573. [Google Scholar] [CrossRef]
  60. Oleksowicz, S.; Burnham, K.; Gajek, A. On the legal, safety and control aspects of regenerative braking in hybrid/electric vehicles. Czas. Tech. Mechatronika Tech. Trans. Mech. 2012, 8, 139–155. [Google Scholar]
  61. Brady, J.; O’Mahony, M. Development of a driving cycle to evaluate the energy economy of electric vehicles in urban areas. Appl. Energy 2016, 177, 165–178. [Google Scholar] [CrossRef]
  62. Hao, X.; Wang, H.; Lin, Z.; Ouyang, M. Seasonal effects on electric vehicle energy consumption and driving range: A case study on personal, taxi, and ridesharing vehicles. J. Clean. Prod. 2020, 249, 119403. [Google Scholar] [CrossRef]
  63. Ma, R.; Heb, X.; Zheng, Y.; Zhoud, B.; Lu, S.; Wu, Y. Real-world driving cycles and energy consumption informed by large-sized vehicle trajectory data. J. Clean. Prod. 2019, 223, 564–574. [Google Scholar] [CrossRef]
  64. Badin, F.; Le Berr, F.; Briki, H.; Dabadie, J.-C.; Petit, M.; Magand, S.; Condemine, E. Evaluation of EVs energy consumption influencing factors, driving conditions, auxiliaries use, driver’s aggressiveness. World Electr. Veh. J. 2013, 6, 112–123. [Google Scholar] [CrossRef] [Green Version]
  65. Çeven, S.; Albayrak, A.; Bayır, R. Real-time range estimation in electric vehicles using fuzzy logic classifier. Comput. Electr. Eng. 2020, 83, 106577. [Google Scholar] [CrossRef]
  66. Zhao, X.; Ma, J.; Wang, S.; Ye, Y.; Wu, Y.; Yu, M. Developing an electric vehicle urban driving cycle to study differences in energy consumption. Environ. Sci. Pollut. Res. 2019, 26, 13839–13853. [Google Scholar] [CrossRef]
  67. Jung, H.; Silva, R.; Han, M. Scaling Trends of Electric Vehicle Performance: Driving Range, Fuel Economy. Peak Power Output Temp. Effect. World Electr. Veh. J. 2018, 9, 46. [Google Scholar] [CrossRef] [Green Version]
  68. De Gennaro, M.; Paffumi, E.; Martini, G.; Manfredi, U.; Scholz, H.; Lacher, H.; Kuehnelt, H.; Simic, D. Experimental investigation of the energy efficiency of an electric vehicle in different driving conditions. SAE Tech. Pap. 2014, 1–11. [Google Scholar] [CrossRef]
  69. Iora, P.; Tribioli, L. Effect of Ambient Temperature on Electric Vehicles’ Energy Consumption and Range: Model Definition and Sensitivity Analysis Based on Nissan Leaf Data. World Electr. Veh. J. 2019, 10, 2. [Google Scholar] [CrossRef] [Green Version]
  70. Meyer, N.; Whittal, W.; Christenson, M.; Loiselle-Lapointe, A. The impact of driving cycle and climate on electrical consumption & range of fully electric passenger vehicles. In Proceedings of the EVS26—International Battery, Hybrid and Fuel Cell Electric Vehicle Symposium, Los Angeles, CA, USA, 6–9 May 2012; pp. 1–11. [Google Scholar]
  71. Donkers, A.; Yang, D.; Viktorović, M. Influence of driving style, infrastructure, weather and traffic on electric vehicle performance. Transp. Res. Part D Transport. Environ. 2020, 88, 102569. [Google Scholar] [CrossRef]
  72. Jafari, M.; Gauchia, A.; Zhang, K.; Gauchia, L. Simulation and Analysis of the Effect of Real-World Driving Styles in an EV Battery Performance and Aging. IEEE Trans. Transp. Electrif. 2015, 1, 391–401. [Google Scholar] [CrossRef]
  73. Rolim, C.C.; Gonçalves, G.N.; Farias, T.L.; Rodrigues, Ó. Impacts of Electric Vehicle Adoption on Driver Behavior and Environmental Performance. Procedia Soc. Behav. Sci. 2012, 54, 706–715. [Google Scholar] [CrossRef] [Green Version]
  74. Jurecki, R.S.; Stanczyk, T.L. A Methodology for Evaluating Driving Styles in Various Road Conditions. Energies 2021, 14, 3570. [Google Scholar] [CrossRef]
  75. Jurecki, R.S.; Stanczyk, T. Analysis of vehicle moving parameters in various road conditions. Commun. Sci. Lett. Univ. Zilina 2021, 23, F58–F70. [Google Scholar] [CrossRef]
  76. Hu, K.; Wu, J.; Liu, M. Exploring the Energy Efficiency of Electric Vehicles with Driving Behavioral Data from a Field Test and Questionnaire. J. Adv. Transp. 2018, 2018, 1074817. [Google Scholar] [CrossRef]
  77. Fetene, G.M.; Kaplan, S.; Mabit, S.L.; Jensen, A.F.; Prato, C.G. Harnessing big data for estimating the energy consumption and driving range of electric vehicles. Transp. Res. Part D Transp. Environ. 2017, 54, 1–11. [Google Scholar] [CrossRef] [Green Version]
  78. Miri, I.; Fotouhi, A.; Ewin, N. Electric vehicle energy consumption modelling and estimation—A case study. Smart Energy Technol. 2021, 45, 501–520. [Google Scholar] [CrossRef]
  79. Chew, K.W.; Yong, Y.R. Effectiveness Comparison of Range Estimator for Battery Electric Vehicles. Adv. Automob. Eng. 2016, 5, 1000128. [Google Scholar]
  80. Kim, E.; Lee, J.; Shin, K.G. Real-time prediction of battery power requirements for electric vehicles. In Proceeding of the ACM/IEEE International Conference on Cyber-Physical Systems (ICCPS), Philadelphia, PA, USA, 8–11 April 2013; pp. 11–20. [Google Scholar]
  81. Sarrafan, K.; Sutanto, D.; Muttaqi, K.M.; Town, G. Accurate range estimation for an electric vehicle including changing environmental conditions and traction system efficiency. IET Electr. Syst. Transp. 2017, 7, 117–124. [Google Scholar] [CrossRef] [Green Version]
  82. Hong, J.; Park, S.; Chang, N. Accurate remaining range estimation for Electric vehicles. In Proceedings of the 21st Asia and South Pacific Design Automation Conference (ASP-DAC), Macao, China, 25–28 January 2016; pp. 781–786. [Google Scholar] [CrossRef]
  83. All Answers Ltd. November 2018. Electric Vehicle Energy Consumption Modelling for Range Estimation. Available online: https://ukdiss.com/examples/electric-vehicle-energy-consumption-modelling-for-range-estimation.php?vref=1 (accessed on 22 March 2021).
  84. Chew, K.W.; Gan, Y.H.; Leong, C.K. Contour Positioning System—New Traveling Distance Estimation Method for Electric Vehicle. Appl. Mech. Mater. 2013, 284–287, 451–455. [Google Scholar] [CrossRef]
  85. Kuew, C.; Yong, W.; Rong, Y.; Morris, S. Simulation of a distance estimator for battery electric vehicle. Alex. Eng. J. 2015, 54, 359–371. [Google Scholar] [CrossRef] [Green Version]
  86. Zhang, Y.; Wang, W.; Kobayashi, Y.; Shirai, K. Remaining driving range estimation of electric vehicle. In Proceedings of the 2012 IEEE International Electric Vehicle Conference, Greenville, SC, USA, 4–8 March 2012; pp. 1–7. [Google Scholar] [CrossRef]
  87. Ferreira, J.; Monteiro, V.; Afonso, J. Dynamic range prediction for an electric vehicle. In Proceedings of the EVS27—International Electric Vehicle Symposium & Exhibition, Barcelona, Spain, 17–20 November 2013; pp. 1–11. [Google Scholar] [CrossRef] [Green Version]
  88. Lee, C.; Wu, C. A Novel Big Data Modeling Method for Improving Driving Range Estimation of EVs. IEEE Access 2015, 3, 1980–1993. [Google Scholar] [CrossRef]
  89. Bi, J.; Wang, Y.; Zhang, J. A data-based model for driving distance estimation of battery electric logistics vehicles. J. Wirel. Commun. Netw. 2018, 2018, 251. [Google Scholar] [CrossRef]
  90. Ondruska, P.; Posner, I. Probabilistic attainability maps: Efficiently predicting driver-specific electric vehicle range. In Proceedings of the IEEE Intelligent Vehicles Symposium, Dearborn, MI, USA, 8–11 June 2014; pp. 1169–1174. [Google Scholar] [CrossRef]
  91. Loyson, T.; Konworthy, J.; Austin, P.; Newman, P. The development of driving cycle for fuel consumption and emissions evaluation. Transp. Res. 1986, 20, 447–462. [Google Scholar]
  92. Chindamo, D.; Gadola, M. What is the Most Representative Standard Driving Cycle to Estimate Diesel Emissions of a Light Commercial Vehicle? IFAC Pap. OnLine 2018, 51, 73–78. [Google Scholar] [CrossRef]
  93. Gołębiewski, W.; Lisowski, L. Theoretical analysis of electric vehicle energy consumption according to different driving cycles. IOP Conf. Ser. Mater. Sci. Eng. 2018, 421, 022010. [Google Scholar] [CrossRef]
  94. Andrade, G.M.S.D.; Araújo, F.W.C.D.; Santos, M.P.M.D.N.; Magnani, F.S. Standardized Comparison of 40 Local Driving Cycles: Energy and Kinematics. Energies 2020, 13, 5434. [Google Scholar] [CrossRef]
  95. Regulation (EC) No 443/2009 of the European Parliament and of the Council of 23 April 2009 setting emission performance standards for new passenger cars as part of the Community’s integrated approach to reduce CO 2 emissions from light-duty vehicles (Text with EEA relevance). Off. J. Eur. Union 2009, L 140, 1–15.
  96. Berzi, L.; Delogu, M.; Pierini, M. Development of driving cycles for electric vehicles in the context of the city of Florence. Transp. Res. Part D Transp. Environ. 2016, 47, 299–322. [Google Scholar] [CrossRef]
  97. Zhao, X.; Yu, Q.; Ma, J.; Wu, Y.; Yu, H.; Ye, Y. Development of a Representative EV Urban Driving Cycle Based on a k-Means and SVM Hybrid Clustering Algorithm. J. Adv. Transp. 2018, 2018, 1890753. [Google Scholar] [CrossRef]
Figure 1. NEDC cycle; (a) velocity profile (average velocity indicated by red line), (b) velocity distribution over the cycle.
Energies 14 04821 g001
Figure 2. WLTC cycle; (a) velocity profile (mean velocity indicated by red line), (b) velocity distribution over the cycle.
Energies 14 04821 g002
Figure 3. Highway Cycle; (a) velocity profile (mean velocity indicated by red line), (b) velocity distribution over the cycle.
Energies 14 04821 g003
Figure 4. Energy consumption of the analyzed driving cycles at different SOC.
Energies 14 04821 g004
Figure 5. Average energy consumption of the analyzed driving cycles.
Energies 14 04821 g005
Figure 6. State of charge (SOC) under analyzed driving cycles; (a) NEDC, (b) WLTC, (c) Highway Cycle.
Energies 14 04821 g006
Figure 7. Depth of discharge (DOD) under the cycle.
Energies 14 04821 g007
Figure 8. Battery current in analyzed driving cycles; (a) NEDC, (b) WLTC, (c) Highway Cycle.
Energies 14 04821 g008aEnergies 14 04821 g008b
Figure 9. State of charge (SOC) under the vehicle load.
Energies 14 04821 g009
Figure 10. Depth of discharge (DOD) under the vehicle weight.
Energies 14 04821 g010
Figure 11. Coolant temperature in battery during NEDC.
Energies 14 04821 g011
Figure 12. Depth of discharge (DOD) under different ambient temperature in NEDC.
Energies 14 04821 g012
Figure 13. Battery coolant temperature during NEDC.
Energies 14 04821 g013
Figure 14. Influence of selected parameters on battery energy level.
Energies 14 04821 g014
Table 1. Vehicle parameters.
Type of ParametersParameters, UnitsValue
Vehiclecurb weight, kg1700
gross weight, kg1980
frontal area, m21.97
wheel base, m2.77
height of gravity center, m0.5
drag coefficient0.36
Electric motor
(asynchronous motor)
maximum speed, rpm3000
maximum power, kW102
Li-Ion batteryenergy capacity, kWh45
maximum power, kW160
maximum charge, Ah60
maximum voltage, V320
number of cell per row120
number of cell rows5
Table 2. Comparison of test cycles.
ParametersNEDCWLTCHighway Cycle
duration, s118018001200
distance, km1123.2535
average velocity, km/h3446104
maximum velocity, km/h120131131
average acceleration, m/s20.530.531.34
maximum acceleration, m/s21.061.671.58
average deceleration, m/s2−0.75−0.58−1.41
maximum deceleration, m/s2−1.39−1.50−1.49
Table 3. Energy consumption of the analyzed cycles.
CycleEnergy ConsumptionDOD, %
Total, kWhAverage, kWh/km
NEDC2.230.204.95
WLTC4.740.2110.75
Highway Cycle8.430.2418.74
Table 4. Energy consumption and depth of discharge at different temperatures.
Temperature, °C−20−100102040
total energy consumption, kWh2.932.812.642.602.232.27
average energy consumption, kWh/km0.270.260.240.240.200.21
differences in average energy consumption, %23.8920.6415.5314.231.76
DOD, %6.236.226.155.654.954.92
Table 5. Energy consumption and depth of discharge under different loads.
Load, kg50100150200250
total energy consumption, kWh2.232.262.292.362.39
average energy consumption, kWh/km0.200.210.210.220.22
differences in average energy consumption, %1.332.625.516.69
DOD, %4.955.025.095.175.24
Table 6. Energy consumption and depth of discharge at a different initial SOC.
SOC, %405060708090100
total energy consumption, kWh2.262.252.232.242.242.252.25
average energy consumption, kWh/km0.210.210.200.200.200.210.21
differences in average energy consumption, %−1.35−0.90−0.45−0.45−0.90−0.90
DOD, %5.035.014.954.964.985.005.01
Publisher’s Note: MDPI stays neutral with regard to jurisdictional claims in published maps and institutional affiliations.