1. Introduction
More trains are running than ever before. New units are replacing trains which are several decades old. Railway undertakings, thanks to multi-million-euro subsidies from the European Union, have record amounts of money and can afford to carry out bold, large-scale rolling stock projects. An increase in the pace of such investments has been noticeable in Europe in recent years.
The economic crisis caused in the late 1970s and early 1980s by the inefficiency of the centrally planned economy was exacerbated by economic transformations in the early 1990s. At that time, the state did not invest in railways. There was a lack of funding. The neoliberal approach to the state-owned mass railways maintained by public funds did not give any chance for the development of this mode of transport. Many sections of the railway line, totalling several thousand kilometres in length in Poland alone, were closed. Individual transport was promoted very strongly. The motorisation rate increased significantly. At the time, the railways were carrying a record low number of passengers. The deteriorating state of the infrastructure discouraged new passengers. Worn-out trains were not replaced by younger units. In recent years, we have been struggling with the consequences of the lack of funding at that time. Many of the trains running on the tracks are reaching the end of their useful lives and so-called technical death. This has necessitated the replacement, or at least modernisation, of the rolling stock.
Thanks to external funding, new trains can be purchased. Railway lines are also being repaired and modernised. Due to the measures taken, the number of rail passengers is gradually increasing and new transport needs are appearing, both of which generate demand for rolling stock. Modern rolling stock is being rolled out on tracks in ever greater numbers. In some parts of Poland, usually in urban agglomerations, a record number of connections is starting to be recorded.
Modern trains increase the comfort of travel. They provide passengers with a completely different quality of rail travel. They are designed according to modern standards. They are also better adapted to the type of connections they serve. They are equipped with more powerful drive units. Electric units designed for regional and agglomeration connections have several times more installed power in comparison to trains manufactured several decades ago. This allows more dynamic driving and greater acceleration [
1,
2]. This greater acceleration leads to shorter journey times because of stops. This is particularly noticeable on railway lines with large numbers of intermediate stops. On the other hand, long-distance passenger trains are designed to achieve higher maximum speeds. Due to the exponential nature of the train’s resistance to motion (in regard to size), increasing the permissible speed must also involve increasing the power of the power unit [
3,
4]. On agglomeration and regional lines, units with several hundred kilowatts of power are being replaced by electric multiple units with 2–3 MW of power. Long-distance trains are increasingly being driven by 3–6 MW motive power units instead of locomotives with an installed power of 2–3 MW [
5]. Besides, systems that were not used in the old trains, such as air-conditioning, also generate additional load on the electricity systems associated with the railway lines. The standard nowadays is also not equipping every seat with an electric socket with 230 V AC voltage.
In the case of the 3 kV DC power supply system used on the Polish railway network, such an increase in energy consumption by trains and the installation of additional equipment onboard railway vehicles may lead to overloading the power supply infrastructure [
6]. The relatively low voltages (in comparison to the 15 kV AC and 25 kV AC supply systems) and the accumulation of higher-powered units mean very high current values [
7]. These are too high for the overhead contact line cross-sections used—hence the necessity of introducing restrictions on the maximum loads of individual traction substations. An overload may result in a temporary voltage drop in the overhead contact line due to the tripping of fast circuit breakers. Such an undesirable event generates delays in rail traffic, which are particularly acute on lines with high train loads.
Electrified with 3 kV DC, Poland’s railway network faces the difficult challenge of raising the speed of train traffic and allowing traction units to run at far higher power levels than those originally used. The DC power system allows for speeds of up to 230–250 km/h [
5,
7,
8]. The powers of traction units exceed by several times the values known even a few years ago. More and more often, it is necessary to take into account not only the capacity of railway lines but also the permissible load of the power supply network when designing the timetable. The passage of units with high installed capacity disrupts traffic, especially in conurbations, or significantly reduces the capacity of railway lines [
6]. In the absence of plans to change the railway supply system, it is reasonable to check the extent to which the supply network generates critical points, which must be taken into account in the process of scheduling the use of the railway system.
The problem of power quality in the DC rail power system is particularly significant in situations where there are scheduling disruptions. The overlap of several trains with significant power consumption can cause an excessive load on the traction substation. This can consequently exacerbate delays and make the railway system unable to regain punctuality. Additionally, the problem of the resilience of the railway system to adverse events and their consequences has been described [
9,
10].
In this article, the power supply system used in Poland is described. Potential critical points in the railway infrastructure in the context of the power supply system are pointed out. Next, a model of traction vehicle movement is discussed. The built model is then adapted for the case study. Next, calculations of the power supply system load are illustrated based on the train timetable for a representative railway line running through one of the major Polish agglomerations and starting from a junction station. The loads are investigated in several variants, taking into account different types of rolling stock operating the connections. Operating situations are identified which—due to significant current loads—may lead to overloading of the power network. This, in turn, can result in a temporary stop of traffic due to a voltage drop in the traction network. The results are discussed and commented on.
2. Literature Review
Several works have been produced on the subject of powering trains. They deal with problems related to power supply systems for electric railways, which are different for DC and AC systems. The justification for the development of this type of power supply was emphasised in [
1], by stating that electric railways are characterised by high traffic speeds, reliability, and the possibility of using large amounts of power. It was pointed out in [
11] that railway power supply systems are among the largest end-users of electricity networks, generating high power demands. The choice of the power system is determined by historical, geographical, and economic considerations [
12]. DC technology is used in systems with lower requirements and lower capacities, pointing mainly to urban railways, metros, tramway networks, and light rail systems [
11]. However, there are several DC power systems in place for full-scale railways [
13] in Italy, Poland [
5], Spain (3 kV voltage), and France (1.5 kV voltage). In these countries, however, in the construction of high-speed railway lines with the highest energy demands, separate lines are being built (or in the case of Poland—are planned to be built) that are supplied with AC at higher voltages.
The main problems associated with DC power supply include, in addition to the limitation of the transmitted power to about 10 MW [
7,
8], primarily: waveform transients, system asymmetry, voltage and current harmonics, low power factor [
11], and the occurrence of stray currents [
2,
12,
14]. Another problem identified for electric traction is that of substation harmonics [
15,
16,
17,
18]. The occurrence of stray currents is related to the fact that the currents—instead of running on the rail—flow through the ground and re-enter the rails. This phenomenon can lead to electrochemical corrosion of metallic equipment, and to the occurrence of step voltages near the railway line [
19,
20,
21,
22,
23].
The problem of traction substation loading in a DC power system has been addressed [
24]. The loading of an electrical substation feeding a metro system was studied. A simulation model mimicking a 51 km long line with 27 traction substations supplying the line with 750 V DC was built and calculations were carried out for a so-called minimum-time run. The Matlab tool was used for this. However, only one type of rolling stock was modelled; the trains ran cyclically. Previous work constructed a simulation model representing the power supply of a tramway network [
25]. The model was implemented in Matlab. Relating the conditions for the tram system to the railway system is difficult, due to the specifics of the two systems—different voltages, powers, and higher schedule rigidity for the railway. In the case of a DC rail system, the problem of electricity demand was addressed [
26]. The energy consumption of trains moving on a long gradient (in the uphill and downhill variants) was studied. However, the total energy demand was not considered, but focused on the possibility of recovering braking energy from the downhill train and using it to accelerate the uphill train. The energy demand and other parameters characterising train running were also addressed in [
27], where, however, the profile of the railway line and the specifics of the train formation were not taken into account. Another study [
13] looked at how to improve the energy efficiency of DC railway power supply systems.
Many microsimulation models, which are based on solving the equation of motion, focus on minimising the energy demands of a vehicle (among other works: [
28,
29,
30,
31,
32,
33,
34]) or a small grid—mainly by using braking energy recovery and supplying it through the power system to the accelerating vehicle, or using an energy storage tank [
35,
36,
37]. However, these models ignore issues related to the permissible load on the power supply network, focusing instead on its ability to accommodate the electricity returned by the train.
3. Specifics of the Supply System
Electric multiple units EN57 produced in the years 1961–1993 had continuous power of 580 kW [
38]. Contemporary units, however, have a power requirement several times higher. For example, the Newag Impuls 31WE MEU, designed to operate regional trains, was equipped with engines of 2 MW [
39]. The Impuls has a similar capacity to the EN57 unit and is often used as a replacement for the EN57 when replacing rolling stock. The ET41 locomotive, built in the 1980s and designed to handle the heaviest goods trains, and regarded in the past as one of the most powerful of those in service in Poland, has engines with a total power of 2.6 MW less than the modern locomotive EU44 “Siemens EuroSprinter”. Increased engine power allows trains to develop higher maximum speeds (a desirable postulate for long-distance trains with a small number of stops) and ensures greater acceleration of start-up, which in turn significantly shortens the travel time of agglomeration and local trains [
40].
The current drawn from the overhead line by the electric train is proportional to the power and inversely proportional to the voltage:
The 3 kV DC [
41,
42,
43] power supply system used in Poland is the reason for the occurrence of significant current loads on the network, an order of magnitude higher than in Western countries. Low supply voltage means very high current consumption and requires—especially in the case of using heavy networks (such networks are mainly present on the PKP PLK SA network)—appropriately frequent sectioning [
44].
Enclosure 2.12 of the Network Statement of PKP PLK SA [
45] contains a tabular list of catenary network parameters; information regarding catenary network type, e.g., YC150–2CS150, C120–2C, or YwsC120–2C; maximal speed a train on a part of the railway line with the specified type of network; maximal current-carrying capacity—that is, the maximal current which can be drawn during train passage; and the minimal distance between operating current collectors. These relations result directly from the overhead contact line design, especially from [
46]:
The cross-sectional area of contact wires, suspension cables and hangers [
46,
47];
The working temperature of the overhead contact line [
48,
49];
Vibrations occurring in the overhead contact line and dynamic interaction of the current collector with the overhead contact line [
50,
51,
52].
In the national rail infrastructure manager’s network, there are traction networks in which the admissible train current capacity is between 1010 and 2730 A—most often 1725 A. This means that in practice, trains with acceptable power ratings for traction (
P = 8 MW) can run on Polish railway tracks, which translates into the fact that in the case of Polish power system it is possible to operate trains with maximal speeds of up to 250 km/h [
7,
8]. Modern power units of high-speed trains, used in Western Europe and Asia, are characterized by traction power, even reaching 10–15 MW [
7,
8,
44]. In the case of the Western European power supply system, this means that the current drawn by such a train does not exceed the value of 500 A, whereas in Poland such a train would draw the current of 4 kA. However, national technical standards [
43] foresee running trains—after [
50]—with current up to 2.5 kA and even—in the case of newly built lines—4 kA. The above was confirmed by tests carried out on the national network [
44]. The electrification of the Warsaw junction carried out before the war [
51,
52] and the extension after the war of the voltage applied there to the whole country, together with the failure of the communist authorities to decide on a change in the power supply system, is now a considerable obstacle to the introduction of a high-speed railway in the country.
The heavy current network type commonly used in Poland (C120–2C) may be easily overloaded. Significant current loading may expose the contact wire to high temperatures and even to reductions in mechanical parameters [
44].
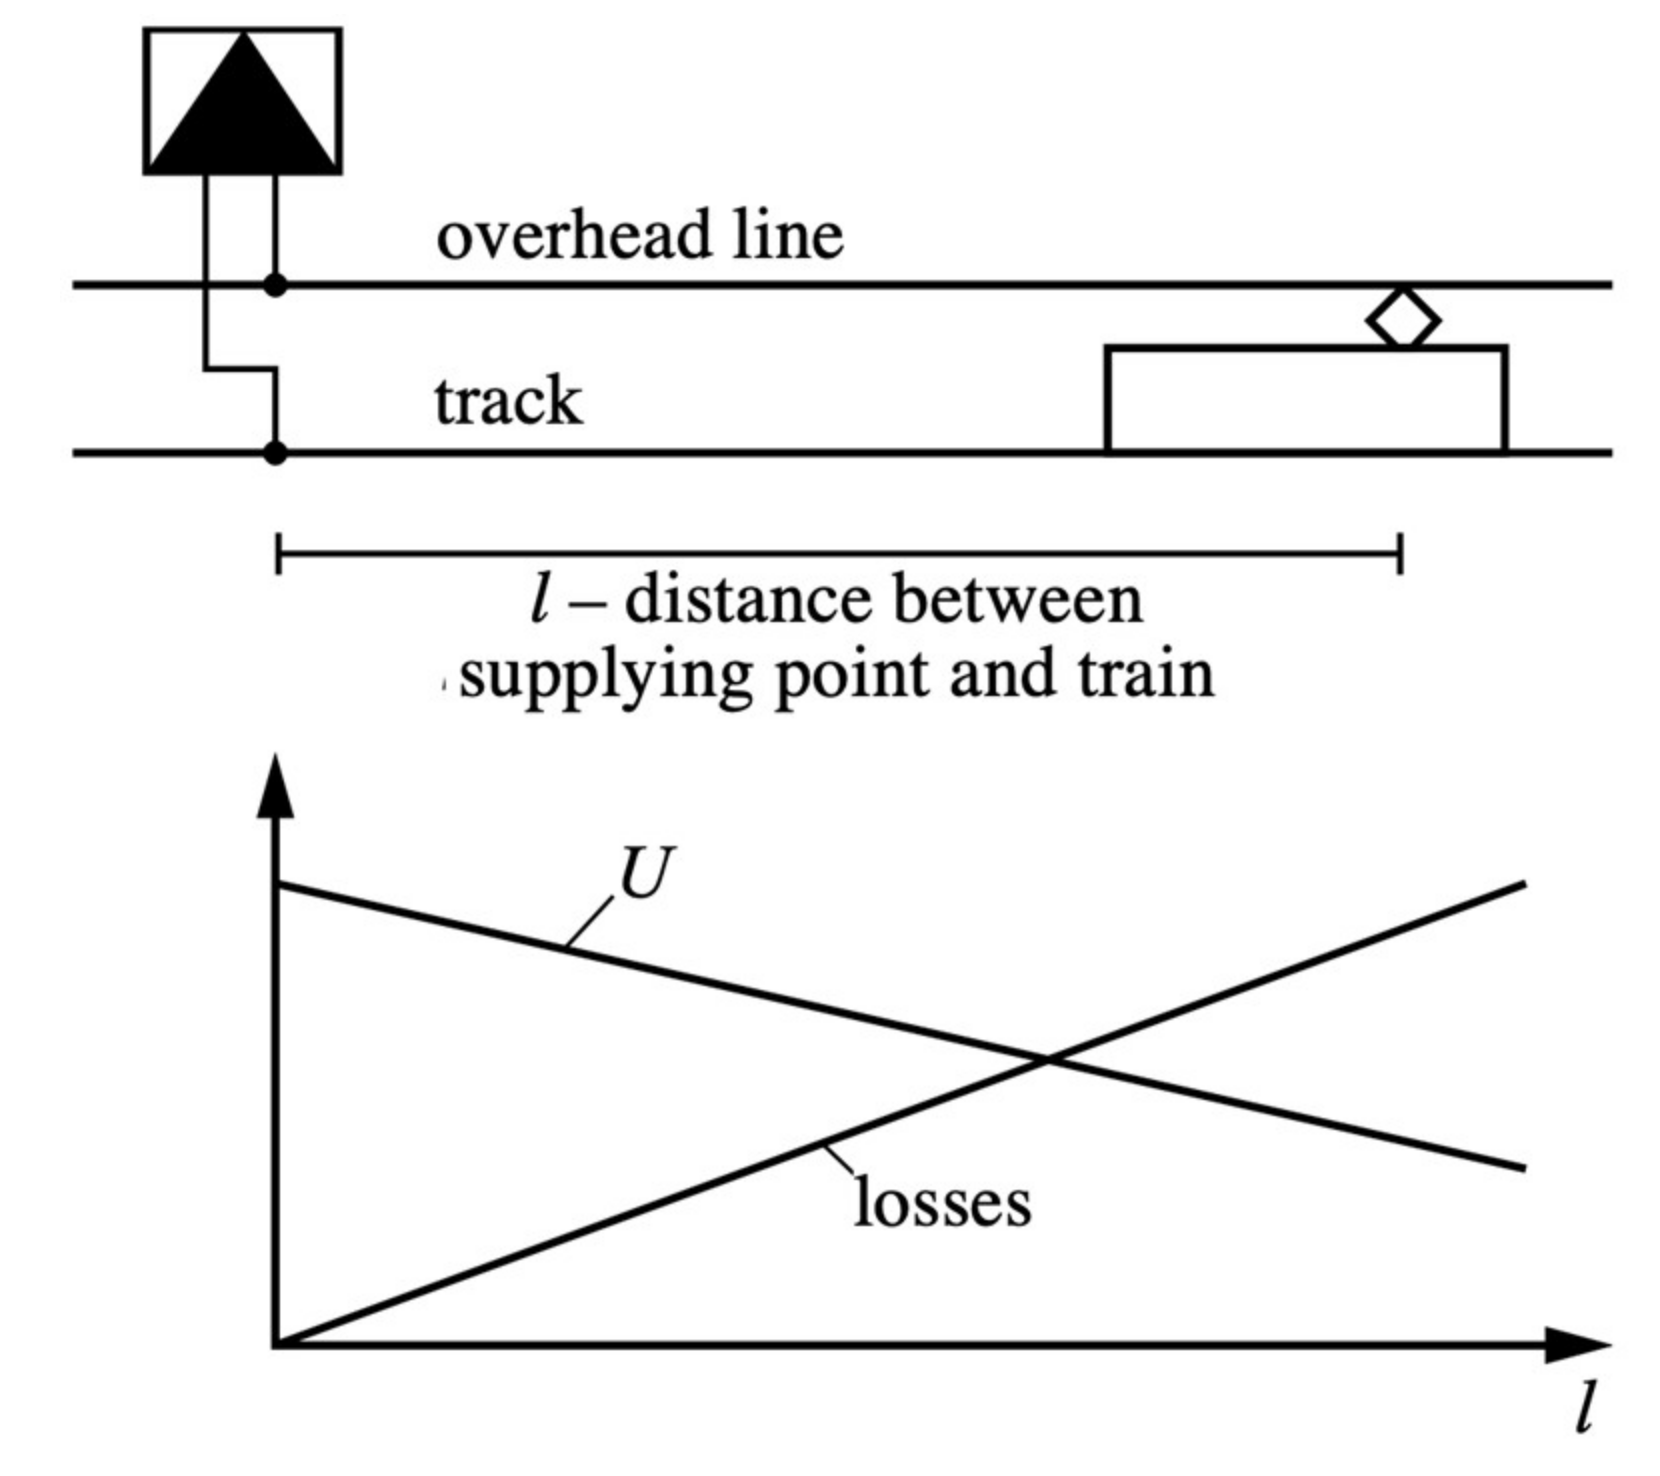
Power supply distances of many kilometres determine the occurrence of voltage drops in contact wires. These are directly proportional to the rated current and the distance between the power source and the load, and inversely proportional to the conductivity and contact wire area:
The voltage on the overhead contact line, therefore, varies linearly with increasing distance between the train and the substation (
Figure 1):
As previously communicated, the railway line is divided into shorter sections, the so-called traction sections [
44,
46]. Each section is supplied by an electrical substation, the task of which is to change the voltage from—usually—15 kV AC (where the national power grid operates at medium voltages) to 3 kV DC (flowing in the contact wires). The length of one section does not exceed 30 km [
43] but is usually between 7 and 20 km [
44].
Each of the tracks is powered independently of the others, simultaneously from two sides, i.e., from two different power substations. The use of such a solution allows one to limit the voltage drops occurring on the network and makes it possible to connect neighbouring sections in emergencies.
4. Computational Model
The characteristics of the driving parameters of a railway vehicle can be obtained by solving the equation of motion of a train [
3,
4,
53,
54,
55]. The equation of motion of a train is based on Newton’s second law of dynamics. It is described by a second-order differential equation [
3,
4,
53,
54]:
where
F is the resultant force,
m the mass and
k the coefficient of swirling mass.
Equation of motion can be noted as:
or:
After the transformation of Equation (1) and subrogation of Equations (3) and (6), the formula for train run amperage can be obtained:
The magnitude of current consumption recorded in an electrical substation is higher than that derived from the solved equation of train movement. This is due to current transmission losses and the inefficiency of technical equipment, especially traction motors, and the presence of other consumers on the train—air conditioning, heating, lighting, passenger information systems, brake compressor drive, propulsion control system, etc. It is, therefore, necessary to account for these factors when determining the actual load on an electrical substation. For this purpose, the value determined by Equation (7) has to be corrected:
where:
η1 is the efficiency, considering other energy consumers (0.96);
is the efficiency counting train’s interior heating (0.93);
is the efficiency of contact line (0.91);.
is the efficiency, counting aberrant movement work (0.98);
η5 is the efficiency of the electricity substation (0.94) [
3,
54]. The values given above are averages taken globally for the entire electric traction at 3 kV DC. Railway administrations adopt—from experience—values similar to those given above. In practice, electric traction efficiency values are given in ranges of a few percent [
3].
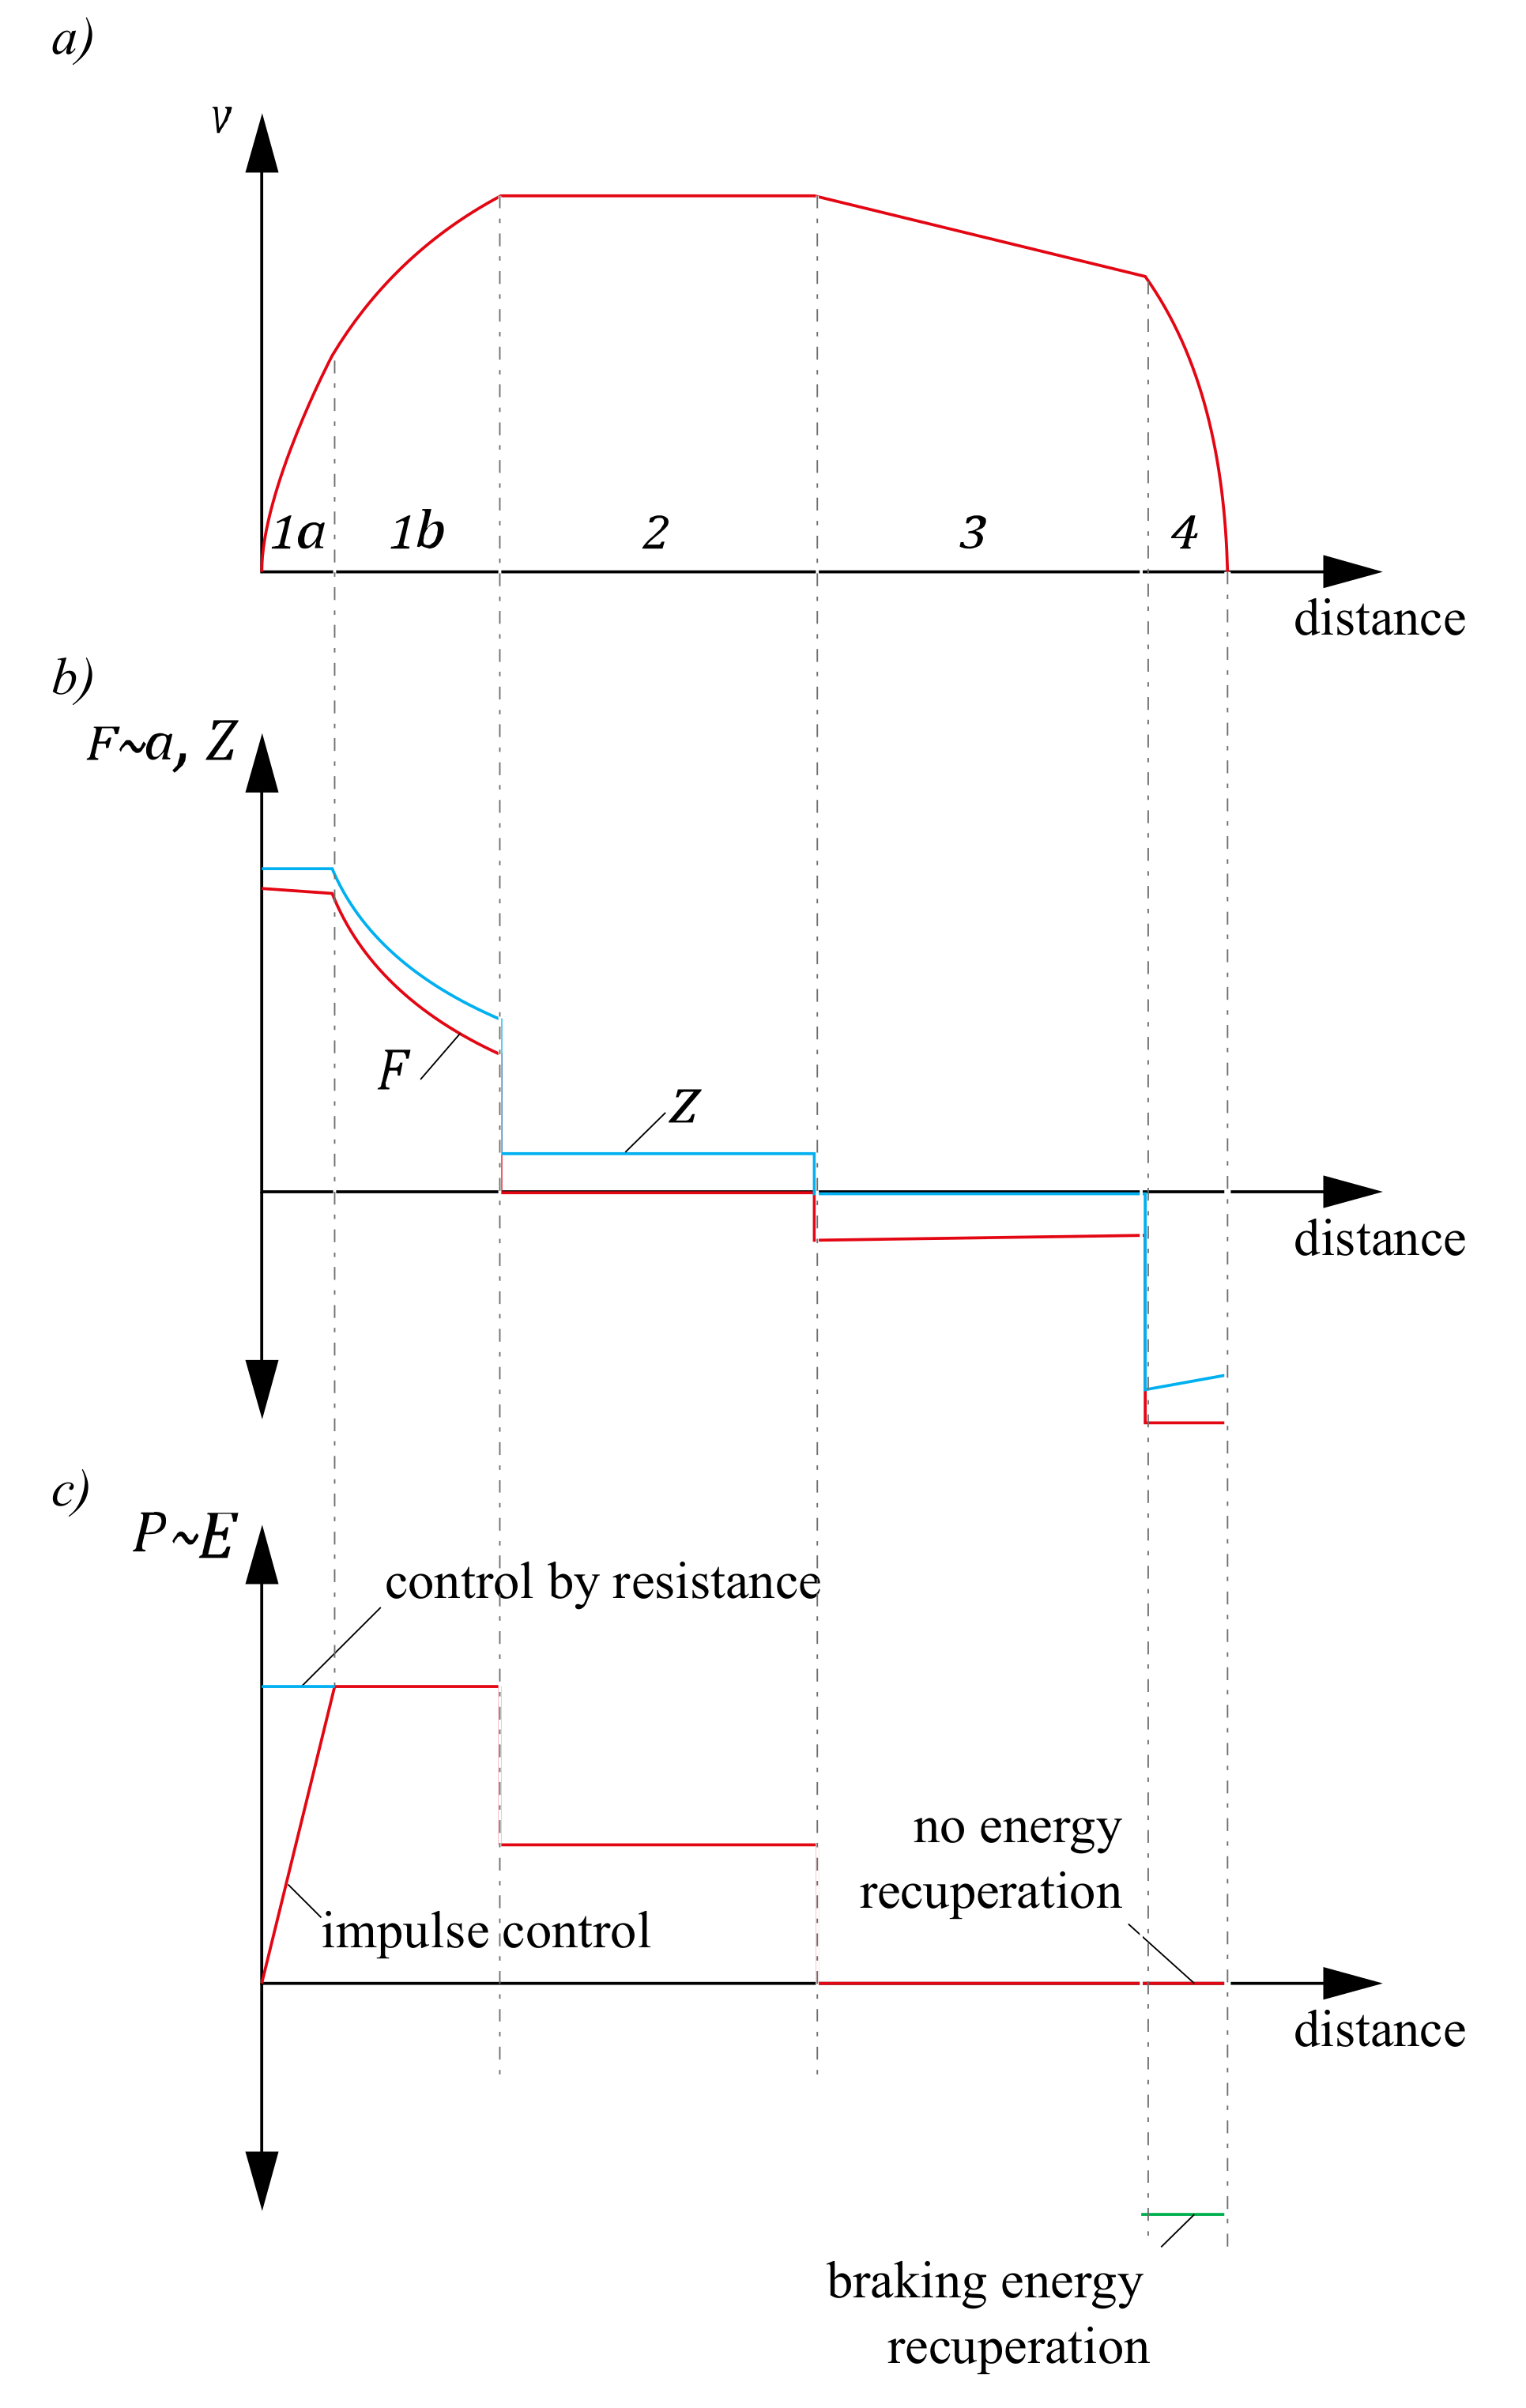
The increasing speed phase consists of switching on the traction motors and thus overcoming the forces resisting movement. Maintaining a constant speed consists of balancing, through the traction force, the sum of the resistance to motion of the vehicle and the local resistances determined by the course of the railway line. In this case, the acceleration force is zero. Cruising is moving with the engines not taking up any energy (driving force Z = 0)—the accelerating force F takes negative values equal to the opposite of the sum of the resistances to motion and the railway line resistance. During breaking, the accelerating force is the opposite of the sum of the resistance of motion, the resistance of the railway line, and the braking forces generated by applying the brakes. The existing resistance to motion contributes de facto to faster deceleration of the trainset. The value of the force accelerating the train depending on the phase of motion is described by the following Equation [
4]:
where Z is the tractive effort, B is the braking force, W is the movement resistance force, and I is the sum of the resistance forces, which are dependent on the tenor of the railway line.
Equation (9) is assumed for the mode in which the train increases its speed (so-called pull mode). Equation (10) is true for constant speed operation. Equation (11) shows running with the engine off. The value of the acceleration force takes the form of Equation (12) for braking. Running modes are shown in
Figure 2.
The value of the driving force is determined by the traction characteristics of the vehicle. It is a curve of the dependence of the tractive force on the wheels of the traction vehicle as a function of the running velocity.
The magnitude of the resistance to train movement is determined using the so-called Strahl’s formula. It is a quadratic equation with three coefficients: A, B, and C. It approximates the value of resistance to motion acting on a train as a function of its speed [
3,
4]:
This formula is also called the “Davis equation”, or “Leitzmann formula”, or “Barbier function”, or “von Borries formula”.
Railway research centres all over the world commonly use the quadratic equation to approximate the resistance to motion. They empirically determine the values of coefficients A, B, and C for different types of trains. The determination of coefficient values for the Strahl equation was also handled by Armstrong and Swift [
56]. In Poland the values for this formula were determined by the Railway Institute.
The publications [
57,
58] contain sets of formulas for the specific resistance of train movement designated by centres from around the world, including German, French, Spanish, Japanese, and Chinese centres. The total resistance to motion is the sum of the resistance to motion of the traction vehicle and the resistance to motion of all types of cars in the train [
59]:
The total resistance of the locomotive movement is determined by the equation [
3,
59]:
where
jl is the number of locomotives,
QL is the locomotive weight [kN], and
n is the number of axles on the locomotive [–].
The resistances of wagons of the i-th type are [
58]:
where
QWi is the weight of wagons of i-th type [kN],
χ is the number of axles of wagon group i-th type [–],
β is the braking weight [kN], and
j is the number of wagons of type
i [–].
Equation (14) (and therefore, also Equations (15) and (16)) is applicable for trains consisting of locomotives and cars. However, if the service is operated by multiple units, Equation (17) is applicable [
56]:
where
K is the bearing type factor, which for roller bearings is
K = 6.5 [–] and for plain bearing is
K = 9.0 [–];
mj is the weight of motive power unit with passengers [
44];
no is the number of axles in the unit [–];
n is the number of coaches in the unit [–].
There is also local resistance to train movement when the traction vehicle is moving. The local resistance is defined in [
51] as additional resistance to motion occurring in specific places or sections of a route. These resistances include the resistance of the medium (air) in a tunnel, resistance caused by crossing hills, the resistance of running on curved tracks, and wind resistance (in mountainous and coastal areas).
The occurrence of bow resistance results directly from the fact that both wheels of a wheelset are seated on a common axis. An obvious consequence of this design solution is that both wheels have the same angular velocity. In a curve, when the outer wheels of a rail vehicle travel a longer distance than the inner wheels, this leads to partial slippage of one or both wheels. The resulting resistance of the curve is taken into account by adding the equivalent of the additional resistance of the train to the actual gradient of the profile.
To replicate train movement, a model was built in the MATLAB Simulink environment to determine the technical transit time of the train. In the model, the train movement parameters described above were taken into account.
Each train in the microsimulation model was mapped as a multiblock with a timetabled start time for the simulation. From each of the multiblocks, information is given about the position of the train on the railway line and the current measured at the contact between the catenary and the current collector. This allows the determination of the load of the substations supplying electricity to the train located in the area of the respective supply section. To correct for the performance of the overhead contact line, the train current consumption values recorded at the substation are added together. The result is information about the total load of the electrical substation by trains on the considered railway line.
5. Case Study
This section describes the case study under consideration. The railway infrastructure is presented together with its operational constraints. The specifics of the supply network are also defined. The vehicles running on the network are characterised and the scenarios studied are presented.
5.1. The Rolling Stock
The most important components of the system are the traction vehicles. They generate the load on the electrical substations through their movement and the resulting demand for electricity. The model was designed to investigate how much load is generated by different operating situations depending on the type of rolling stock used. Trains (power units) differ from one another. Modern trainsets are characterised by higher installed capacities, and therefore higher start-up acceleration. They, therefore, generate higher current consumption. On the other hand, the value of motive power for old locomotives and multiple units, still quite commonly used in Poland to run trains, is regulated using a reluctance control. As a result, during the start-up phase, the current consumption of such a vehicle is higher than when implementing control using an inverter.
This case study investigates the loading of feeder stations by trains operated by: EN57 electric multiple units—an old-type unit, most often used for regional services on electrified lines; old-type locomotives: EU07 carrying mainly fast trains and EP09 carrying express trains; a modern Newag Impuls 31WE electric multiple unit for regional services; ES64U4 locomotive carrying long-distance trains; an ED250 electric multiple unit carrying express trains.
The modern Newag Impuls traction unit has been adapted for regional travel thanks to its high starting acceleration value (
a = 1 m/s
2) in the speed range from 0 to 40 km/h. The electric multiple unit weighs 172 t and is 74.4 m long. It is driven by traction engines with a total power of 2 MW. They ensure the possibility of moving at a speed of 160 km/h. These—and more detailed data on the said unit—are contained in [
39] and in the vehicle’s markings. The operating parameters of the unit are presented below in
Figure 3a. These units commonly replace 31 WE electric multiple units.
The EN57 was produced between 1961 and 1993 and was the backbone of the regional electric traction rolling stock. The applied speed control (resistive) is characterised by maximum current consumption regardless of the acceleration phase. The excess energy is dissipated in the form of heat by resistors connected to the main circuit of the EMU. The vehicle has a mass of 126.5 t and a length of 64.97 m. The engines with a total power of 580 kW give the unit a maximum speed of 110 km/h [
38]. The basic, simplified characteristics of this EMU are illustrated in
Figure 3b.
Like the EN57, the EU07 locomotive controls speed using resistance. Engines with a power of 2 MW give it a maximum speed of 125 km/h. It is, therefore, widely used to run long-distance trains on routes where—due to technical parameters of the line or economic issues—trains are not run at top speeds. The locomotive weighs 80 t. Traction characteristics of the electric locomotive are shown in
Figure 3c.
The EP09 locomotive was designed to run high-speed passenger trains. It has a higher installed power (2.92 MW) than the EU07 locomotive and reaches a maximum speed of 160 km/h. It was manufactured in 1986–1997, and its weight is 83.5 t. Initially used to service only express trains, it now also operates high-speed trains for which the parameters of the EU07 locomotive are insufficient. A graph of the traction characteristics of this locomotive is shown in
Figure 3d.
The EU44 Siemens Eurosprinter locomotive is a unit equipped with 6 MW engines. It operates long-distance and express trains. The weight of the locomotive is 87 t [
60]. It is the most powerful locomotive used to service passenger trains in Poland. The traction characteristics of the locomotive are illustrated in
Figure 3e.
The fastest passenger trains of the highest-quality category are operated with ED250 electric multiple units produced by Alstom, Saint-Ouen-sur-Seine (France)—Pendolino (EMU250). In Poland, they operate at speeds of up to 200 km/h. The trains have eight asynchronous engines, each with a power of 708 kW. The traction characteristics are shown in
Figure 3f.
5.2. Railway Line
The rail line framework considered in the case study starts with a large passenger interchange station, serving a total of several hundred regional, long-distance, and express trains each day. Freight traffic operates on the initial section of the railway line in question very rarely and only in emergencies—in terms of the timetable it is a strict passenger railway line. The line departs in an easterly direction from the start station and continues in a south-easterly direction. The first boundary between supply sections is located approximately 2.8 km downstream of the junction station. In this section the railway line is multi-tracked; much of it runs alongside the extended eastern head of the station. Moreover, it runs alongside several groups of tracks. On these tracks, trains wait to be substituted before starting their service routes [
45].
The railway line forks at approximately a km 3.4 from the junction station. A double-track line with regional and long-distance passenger traffic branches off to the south. It consists of 21 pairs of regional connections and one pair of long-distance connections (of which 18 pairs of trains are operated by electric multiple units, and the rest by diesel multiple units). The railway line considered in this case study leads towards a passenger stop less than 2 km away [
45].
After leaving the passenger station, where only regional trains stop, the railway line leads towards a branch station. At the branch station, the railway line is connected to the railway switch, which is generally freight-oriented. In addition, a mixed passenger/freight line departs from the railway line under consideration in this case study. The freight railway line mentioned earlier is the freight bypass of a large nodal station from which the railway line under consideration in this case study starts. At least several dozen pairs of trains pass through the freight ring every day. The passenger-freight line diverging from this line operates 21 pairs of regional trains per day, and freight (several dozen pairs daily) departs from the line in the case study. The railway line continues for c.a. 2.1 km to the next station. Only the regional ones stop at this station. Directly behind the eastern head of the station is another boundary between supply sections [
45].
The next feeder section is an unbranched line. It has two passenger stops. On this feeder section of the line, 27 pairs of passenger trains, 25 pairs of long-distance trains, and 2 pairs of fast trains run daily in each direction. Several pairs of freight trains also run on the line. The low load of freight traffic on this railway line results from the fact that it is a railway line dedicated to passenger transport. There is a priority line for freight traffic running parallel to this line at a distance of approximately 10 km.
Another section of power supply (about 12 km long) covers only one railway station, where regional trains and most of the fast (long-distance) trains stop.
The last supply section under consideration has one passenger stop and one station where some long-distance trains stop. This section has a total length of approximately 13 km. The occupancy of passenger electric trains of this section is the same as the occupancy of the previous supply section.
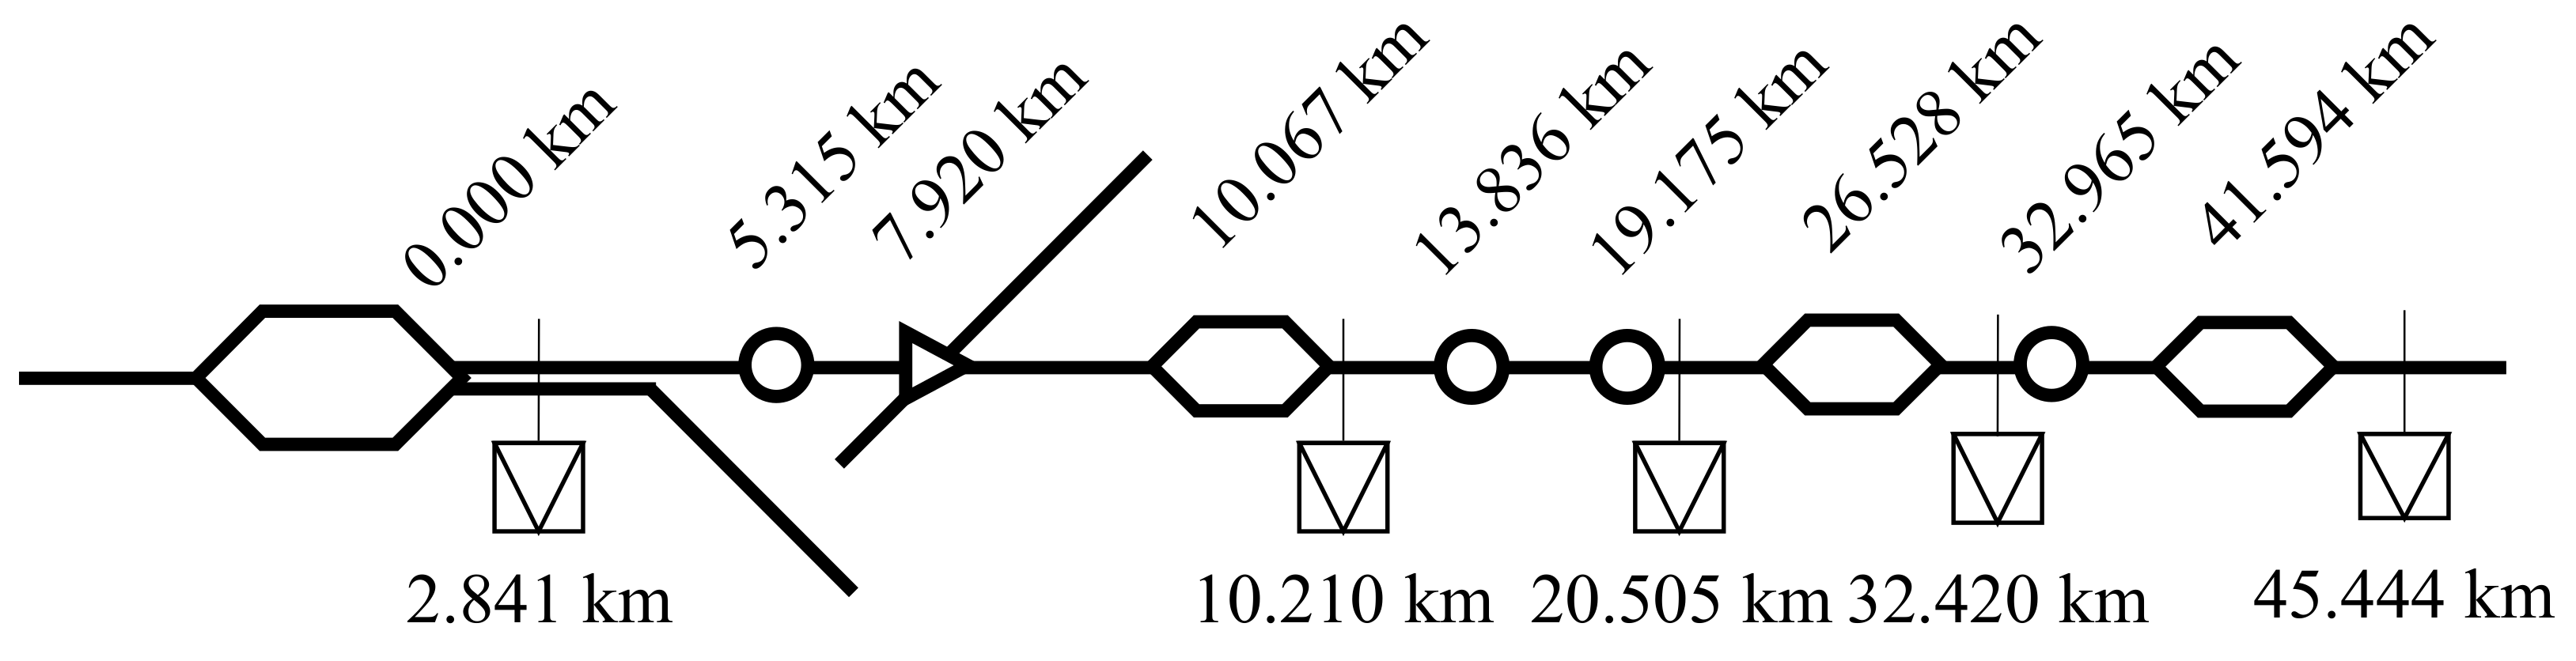
The railway line under consideration in this case study is part of a European railway trunk line. Government documents that plan connection offers indicate a target of increasing the load on the line with additional long-distance connections, including international connections, in the next few years. The railway line is double tracked, fully electrified, and suitable for a maximum speed of 160 km/h [
45]. A diagram of the railway line under consideration is shown in
Figure 4.
The characteristics of the different sections of the railway line supply are shown in
Table 1.
The maximum current consumption of trains moving along the railway line is also conditioned by the speed of movement of the trains under consideration. The train accelerates until it reaches its target speed, which is conditioned either by the technical possibilities of the rolling stock or by the speed restriction of a section of the railway line.
According to Equation (11), a train that is moving at a constant speed will normally use only part of its available motive power. Such a train has to overcome only specific resistance (mainly rolling resistance and aerodynamic resistance) [
3] and resistance of place, which results from overcoming hills and horizontal curves [
4]. For this reason, the sections where many trains are accelerating but have already reached speeds that allow the use of constant power hyperbolas are valuable in terms of considering the amount of current consumption (for modern trainsets whose speed is not controlled by resistance).
In the case of the railway line under consideration, traversing the head of the junction station (located at the beginning of the line) is carried out at maximum speeds of 80 to 100 km/h [
45]. In practice, however, due to the numerous switches, when traversing the eastern head of the junction station, trains usually travel at a maximum speed of 40 km/h.
In the case of trains moving through switches according to the main direction, permissible traffic speeds on the considered railway line are summarized in the table below (
Table 2).
As can be seen from the table above, the permitted maximum traffic speeds on the route in question are relatively high. Passenger trains can reach speeds of up to 160 km/h; goods trains—up to 120 km/h. This means that the railway line under consideration is of M160 standard (according to the nomenclature PKP PLK S.A.).
The line is over flat terrain, with maximum gradients ranging from −3‰ to +3‰. Such gradients are almost negligible from the perspective of traction calculations.
5.3. Tested Scenarios
The railway line considered in the case study was tested for several different options for assigning units to timetabled connections. The simulations were intended to verify how the load on the network changes depending on the types of trainsets serving particular connections. It was assumed that the offer to passengers will not change. The variants were intended to reflect the different stages at which passenger carriers replace the old-type rolling stock with new-type rolling stock.
5.3.1. Tested Scenarios
The baseline option analysed the operation of old-type vehicles only. Regional services were simulated using EN57 multiple units. In this variant, the long-distance trains were set up with the EU07 locomotive and wagons (from 4 to 16). Express trains were set up with an EP09 locomotive and six cars.
Subsequent variants assumed an increasing share of new trains in passenger service until the complete replacement of vehicles several decades old by modern rolling stock.
The first option assumed replacing every third regional train with a modern train and express trains with ED250 units. The second option assumed also replacing 1/3 of regional trains with modern electric multiple units and replacing some long-distance trains with modern trains. The third option assumed replacing all regional trains with new multiple units without introducing additional changes into the long-distance train service concerning the second option. The last option assumed the replacement of all trainsets with modern trainsets.
5.3.2. Tested Variants
Simulations were conducted for traffic situations occurring on the considered railway line that can potentially generate significant loads for the power infrastructure, i.e., situations where increased train traffic takes place. For this reason, traffic situations were selected in which the highest number of trains in motion and travelling at non-start-up speeds accompanied by start-ups were noted. The non-starting speeds were considered to be those at which the motive power unit uses a traction characteristic section with the shape of a constant power hyperbola.
Five traffic situations have been identified on the section of railway line under consideration, which may be characterised by significant loads on the power network:
Situation I
- ◦
In section A: 1 express train and 3 local trains;
- ◦
In section B: 1 accelerating long-distance train and 1 local train;
- ◦
In section C: 2 accelerating long-distance trains and 1 accelerating local train;
- ◦
In section D: 1 express train and 1 local train.
Situation II
- ◦
In section A: 1 long-distance train and 2 local trains;
- ◦
In section B: 1 accelerating express train, 1 accelerating long-distance train, and 1 long-distance train;
- ◦
In section C: 1 accelerating long-distance train and 2 local trains;
- ◦
In section D: 1 express train and 1 accelerating long-distance train.
Situation III
- ◦
In section A: 2 long-distance trains and 2 local trains;
- ◦
In section B: 1 long-distance train and 2 local trains;
- ◦
In section C: 1 express train and 2 accelerating long-distance trains;
- ◦
In section D: 1 accelerating long-distance train and 2 local trains.
Situation IV
- ◦
In section A: 1 express train, 1 long-distance train and 3 local trains;
- ◦
In section B: 1 accelerating long-distance train and 3 local trains;
- ◦
In section C: 1 accelerating long-distance train and 2 local train;
- ◦
In section D: 1 express train and 2 accelerating local trains.
Situation V
- ◦
In section A: 1 long-distance train and 1 accelerating local train, 2 local trains;
- ◦
In section B: 1 long-distance train, 1 accelerating local train, and 1 local train;
- ◦
In section C: 2 accelerating long-distance trains and 1 accelerating local train and 1 local train;
- ◦
In section D: 1 accelerating express train (long train set) and 1 accelerating local train.
5.4. Results of the Simulation
The results of the loading of the individual supply sections by trains were obtained for four different variants and four operating situations and for four supply sections to which electricity is supplied from five traction substations. The simulation results are summarised in the following tables (
Table 3 for one-section-load and
Table 4 for multi-section-load).
An electric traction rail vehicle draws current simultaneously from two traction substations, thereby reducing the load on the substation, except that the rated primary busbar current in the traction substation shall not exceed [
43]:
2 kA for P80 lines;
4 kA for new and upgraded lines T40, M80, T80, P120, M120, M120, T120, P160, and M160; and for upgraded lines P200, M200, and P250;
6 kA for the newly constructed P200, M200, and P250 lines.
These markings—used by PKP Polskie Linie Kolejowe S.A.—the Polish national railway infrastructure manager—indicate the purpose of the railway line and the maximum speed of traffic. The letter P indicates the passenger character of the line, T—the freight character, and M—mixed. The number indicates the permissible speed expressed in kilometres per hour.
Considering the above guidelines, the current load on substations on the considered railway line must not exceed 4 kA. At the same time—due to the two-sided supply of sections—the current load generated by trains in one supply section shall not exceed 8 kA. It is then necessary that adjacent (and subsequent) feeder sections are not loaded to a greater extent than by trains drawing 4 kA in total (measured on the feeder rails of electrical substations).
The simulation carried out indicated that the current load on the sections of the railway line under consideration did not exceed the limit value. However, a significant (even fourfold) increase in the value of the currents necessary to supply the trains is noticeable. It is also noted that the power supply network in some variants of the experiment (e.g., traffic situation II, variant 4) was loaded to more than 90%, assuming that in the next supply section, which was not covered by traction calculations, the current consumption from the traction substation common to it and section D was 2 kA (and in total did not exceed 6 kA). In such a situation, the occurrence of traffic disturbances or additional trains may result in exceeding the current limit values. Traction calculations showed, however, that exceeding the permissible current consumption in the D supply section from the substation occurred in the variant V (when the express connection was performed by two electric multiple units). Such a situation is unacceptable in train operation design, as it results in a planned overload of the traction substation and consequently in disconnection of the voltage. National experience confirms that in the case of a 3 kV DC power supply, such a train must be the only one running on a given power supply section.
These results indicate that in situations of disturbing traffic or when an additional (unscheduled) transport operation is carried out, overloads can occur, leading to tripping of the fast circuit breakers in the substation and a voltage drop in the catenary.
Due to the above simulation results, it should be stated that in the case of the process of replacing the rolling stock with new, higher-powered rolling stock, it is necessary to take into account the power consumption of trains on the network at the stage of timetable construction. Modern trains—thanks to the possibility of accelerating faster through a higher power—cover a fragment of a railway line between two stops faster. This in turn means that they occupy a given railway line for less time—i.e., the capacity of the line is increased. However, trains with the highest installed power have to move on their own due to very high current values recorded at individual power sections. This in turn reduces the capacity of the railway line.
6. Conclusions
This article discussed the problem of powering trainsets with the use of a 3 kV DC power supply network, which is among those used in Poland. The influence of the modernisation of the rolling stock of the railway on the loads on the power infrastructure was described. To check the influence of replacing trains with speed-controlled using impulse control, a microsimulation model was made to solve many equations of trains’ movements. It takes into account power parameters and current intensities generated by trains in motion. A case study was performed which reflected the traffic on a section of one of the most important railway lines in the southwest of Poland. The results show that as carriers upgrade their rolling stock, the nature of the loads on the network feeding the railway line changes significantly. The start-up phase of modern vehicles loads traction substations less than vehicles that are several decades old. However, as the speed of traffic continues to increase, trains with impulse control will place a greater load on the power supply infrastructure. Once the preset scheduled speed is reached, the loads on the rail power supply network are at similar levels.
As a result of the higher-power engines installed on today’s trains, the durations of the largest loads on the network are different. In the case of lower-powered vehicles, it takes longer to reach the target (scheduled) velocity, so the train switches to the constant-speed phase later. On the other hand, a high-powered train reaches its scheduled speed more quickly and thus switches to constant speed mode more quickly. However, the greater acceleration of starting, resulting from the higher power engines installed in the rail vehicles, determines a greater demand for electricity, which in turn results in larger currents being recorded in the relevant electrical substation.
It should be recognised that as operators continue to replace rolling stock, the rail supply network will be increasingly stressed and could become a critical element.


