Article

Bioh2, Heat and Power from Palm Empty Fruit Bunch via Pyrolysis-Autothermal Reforming: Plant Simulation, Experiments, and CO2 Mitigation

School of Chemical and Process Engineering, University of Leeds, Leeds LS2 9JT, UK
*
Author to whom correspondence should be addressed.
Energies 2021, 14(16), 4767; https://doi.org/10.3390/en14164767
Submission received: 21 June 2021 / Revised: 22 July 2021 / Accepted: 26 July 2021 / Published: 5 August 2021
(This article belongs to the Special Issue Bioproducts & Environmental Sustainability)

Abstract

:
Empty fruit bunch, a significant by-product of the palm oil industry, represents a tremendous and hitherto neglected renewable energy resource for many countries in South East Asia and Sub-Saharan Africa. The design and simulation of a plant producing pure hydrogen through autothermal reforming (ATR) of palm empty fruit bunch (PEFB) was carried out based on successful laboratory experiments of the core process. The bio-oil feed to the ATR stage was represented in the experiments and in the simulation by a surrogate bio-oil mixture of 11 organic compounds shown to be main constituents of PEFB oil from previous work, and whose combined elemental composition and volatility was determined to be as close as possible to that of the real PEFB bio-oil. The experiments confirmed that H2 yields close to equilibrium predictions were achievable using an in-house synthetised Rh-Al2O3 catalyst in a packed bed reactor. Initial sensitivity analysis on the plant revealed that feed molar steam to carbon ratio should not exceed 3 for the optimal design of the ATR hydrogen production plant. An overall plant efficiency of 39.4% was obtained for the initial design, this value was improved to 67.5% by applying pinch analysis to enhance the integration of heat in the design. The proposed design renders CO2 savings of about 0.56 kg per kg of raw PEFB processed. The proposed design and accompanying experimental studies together make a strong case on the possibility of polygeneration of H2, heat, and power from an otherwise discarded agricultural waste.

1. Introduction

The use of fossil fuels continues to draw increasing concerns regarding their environmental impact and finite nature [1]. A significant amount of research and published literature clearly points to the fact that the development of alternative energy sources is a sound sustainable solution and benefits the environment [2,3,4]. According to the Renewables 2020 Global Status Report, bioenergy accounted for about 12% of the total global energy supply in 2018, from which the share of traditional biomass was 6.9% and the rest coming from modern bioenergy sources [5]. A few reasons accounting for the low share of biomass as a primary source of energy are its low energy content, bulkiness, slow rates of combustion due to its solid state, and the low efficiency associated with direct combustion processes. By using physical, chemical, thermal, or biological methods, it is possible to convert biomass into heat energy, electricity, solid fuels, liquid fuels (bio-oil, biodiesel and ethanol) and gas fuels [6]. These different biomass conversion technologies all have their advantages and disadvantages. Most authors agree that thermochemical conversion processes, such as pyrolysis, provide an efficient and cleaner way to harness and store biomass energy when compared to direct combustion of the solid biomass resource.
Bio-oil (or pyrolysis oil) is a dark-brown liquid obtained during the thermal decomposition of biomass in the absence of oxygen and at temperatures ranging from 400 to 600 °C [7]. Bio-oil can be upgraded on-site and used as a fuel/chemical feed or it can be transported using existing distribution infrastructure to a different site for further processing. This therefore eliminates the high cost associated with the transport of wet biomass, making it possible to process low-cost/low-energy-density biomass resources [8]. It also provides the opportunity to further process bio-oil into higher value fuels and products such as hydrogen and/or syngas, whose utilisation as an energy source or chemical feedstock offer better efficiencies than direct biomass combustion.
Steam reforming (SR) is the most common technology used to produce hydrogen or syngas from organic fuels. Its main advantage is that it gives a high hydrogen yield (70–80 vol.%, dry basis) compared to 40–50 vol.% for autothermal reforming (ATR) and partial oxidation (POX) [9]. Despite its lower hydrogen yield, ATR offers the possibility of an energy sufficient process with a relatively high overall process efficiency. It is expected that ATR will eventually gain favour with the gas-to-liquids industry due to syngas gas composition favourable for the Fischer–Tropsch synthesis, lower capital cost, and potential for economies of scale [10,11]. Moreover, some investigations have been devoted to study the oxidative steam reforming of raw bio-oil samples reporting hydrogen yields in the range 57–92% for Rh-based catalysts [12,13] and 10% for Ni-based catalysts [13].
Several authors have proposed Aspen Plus based simulation models for biomass pyrolysis and gasification to produce hydrogen rich syngas [14,15,16]. Aspen Plus uses unit operation blocks to model specific process operations and supports user-defined Fortran codes which can be used to modify the properties of existing blocks [17,18]. One advantage of using this software is that it allows the user to define non-conventional fuels like coal and biomass in terms of their ultimate and proximate analysis. Onarheim et al. [19] developed fluidised-bed based models for pine and forest residue pyrolysis using Aspen Plus. An overall process efficiency of 69.3% was determined for pine residue pyrolysis, which was higher than the 55.8% obtained for the forest residue. The higher carbon to bio-oil efficiency for pine residue most likely caused its higher process efficiency. Ward et al. [20] developed a computational fluid dynamic model using Aspen Plus to analyse and optimise the pyrolysis process of four types of biomass: shredded green waste, pine chips, wood, and birch. They obtained a maximum bio-oil yield of 58% for shredded green waste. Doherty et al. [21] performed an Aspen Plus simulation of biomass gasification featuring a steam blown dual fluidised bed. The influence of key parameters such as gasification temperature, biomass moisture, steam to biomass ratio, air to biomass ratio and steam temperature on syngas composition were investigated. Their study established that biomass moisture is the most important factor influencing the efficiency of the process. Erlach et al. [22] proposed an Aspen Plus model of conversion of PEFB to bio-coal pellets via the hydrothermal carbonisation (HTC) process and their subsequent gasification via entrained gasification (EG) with carbon capture which they compared to raw wood gasification via fluidised bed for power generation via IGCC. They found significantly higher exergetic efficiencies for the PEFB HTC-EG process. Gautam and Chaurasia [23] developed a conceptual plant model for the pyrolysis of rice husk, rice straw, bamboo, sugarcane bagasse and neem bark in Aspen Plus and applied the model to simulate a pilot-scale plant. Ighalo and Adeniyi [24] utilised Aspen Plus to simulate the pyrolysis, reforming and gasification of switchgrass and reported an optimum bio-oil yield of 70.2 wt.% at 450 °C, and an optimum 11.2 wt.% of syngas containing 70 mole% of H2 produced in the steam reformer at 700 °C and 1 bar. However, the pre-processing of the biomass was not considered. Mohammed et al. [25] modelled the thermochemical conversion of Napier grass bagasse by pyrolysis and reported a similar yield of bio-oil of 68 wt.% at 480 °C. Wang et al. [26] investigated the production of syngas from the pyrolysis of corn straw and husk rice, followed by the gasification of the char and reported molar ratios of H2/CO in the range 0.97–1.59. Yun et al. [16] presented an integrated Aspen Plus model to produce methane from the pyrolysis of palm empty fruit bunch. The model accounted for the energy requirements of the biomass pre-processing, including the chopping, milling, and drying of the feedstock. They reported an efficiency of conversion of PEFB to methane in the range 74.7–80.6%.
This work focuses on the use of palm empty fruit bunch (PEFB) as a source of hydrogen via the autothermal reforming of its pyrolysis oil. The low bulk density of PEFB necessitates on-site processing (minimal drying and sizing) and pyrolysis provides a convenient and efficient way for possible long-term storage and distribution of an intermediate hydrogen feedstock. A simplified technique to simulate bio-oil composition is applied in an Aspen Plus model based on preliminary experimental tests of ATR of surrogate PEFB bio-oil, and a sensitivity analysis of parameters influencing the ATR plant’s efficiencies is then performed, including bio-oil composition. The initial design is enhanced by heat integration using pinch analysis coupled with a combined heat and power generation unit used for heat and possible work recovery. This study contributes to demonstrating the technical feasibility of using PEFB waste as a sustainable source of syngas and hydrogen based on the autothermal reforming process applied to bio-oil and is complemented by an extensive experimental study.

2. Methods

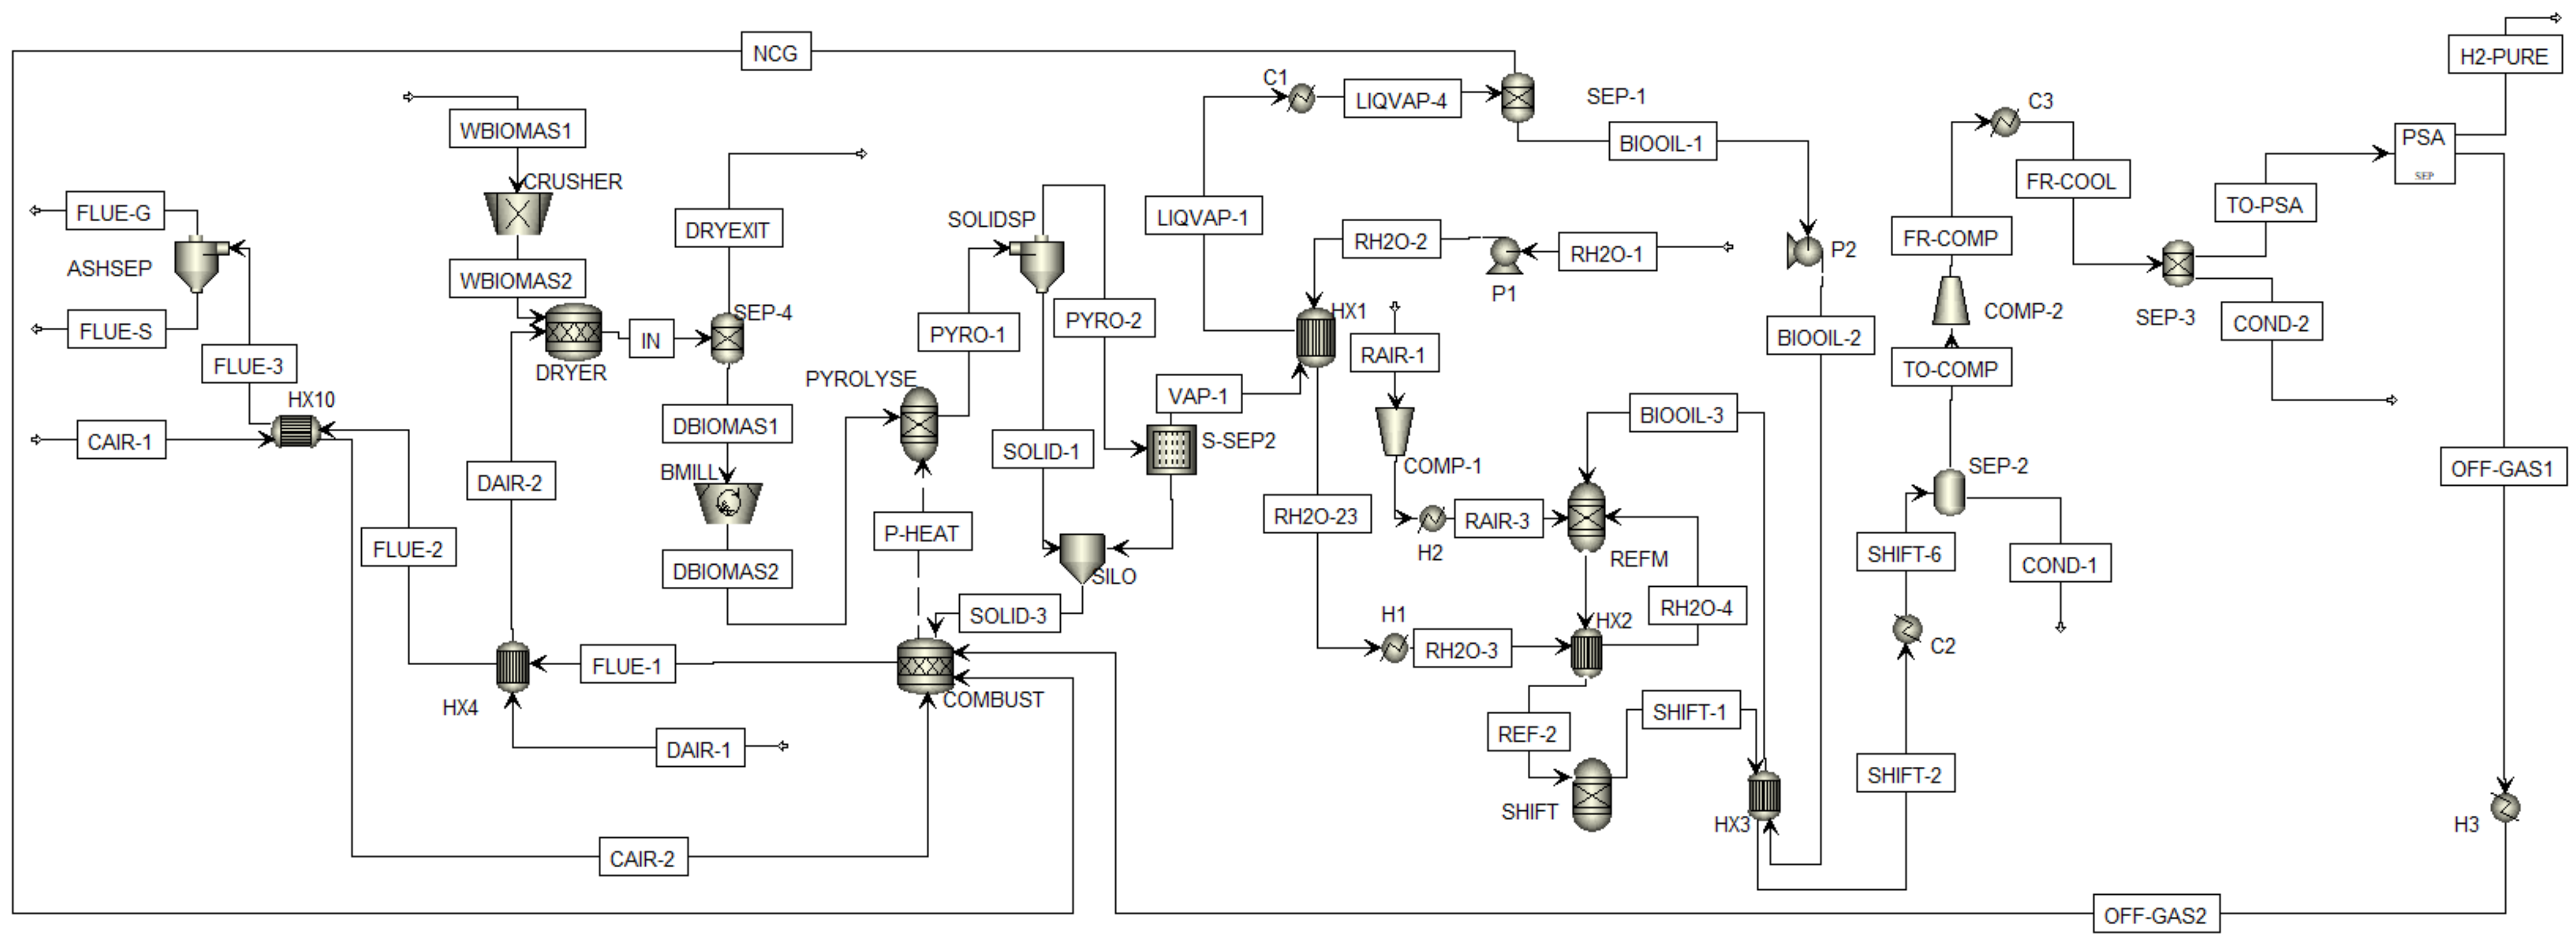
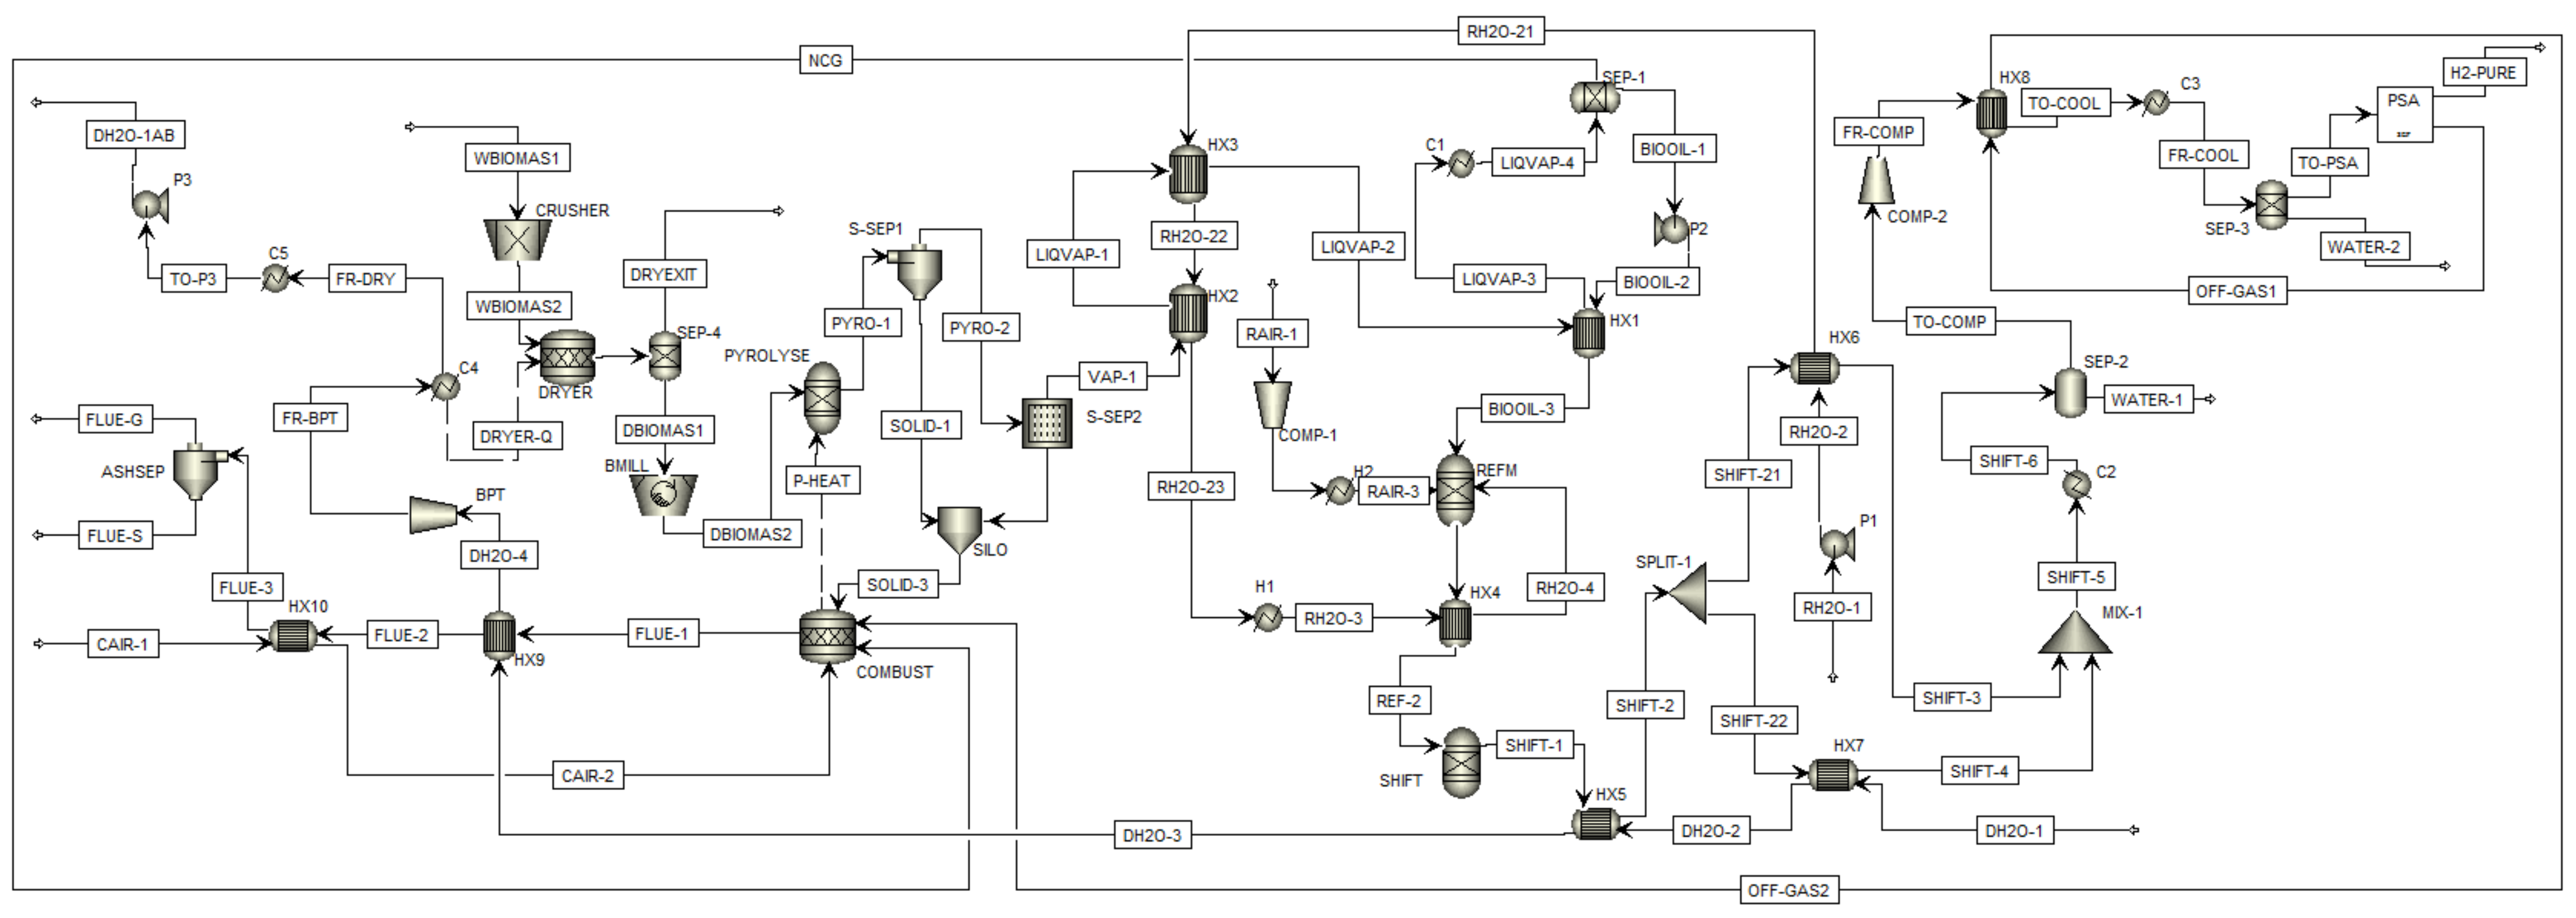
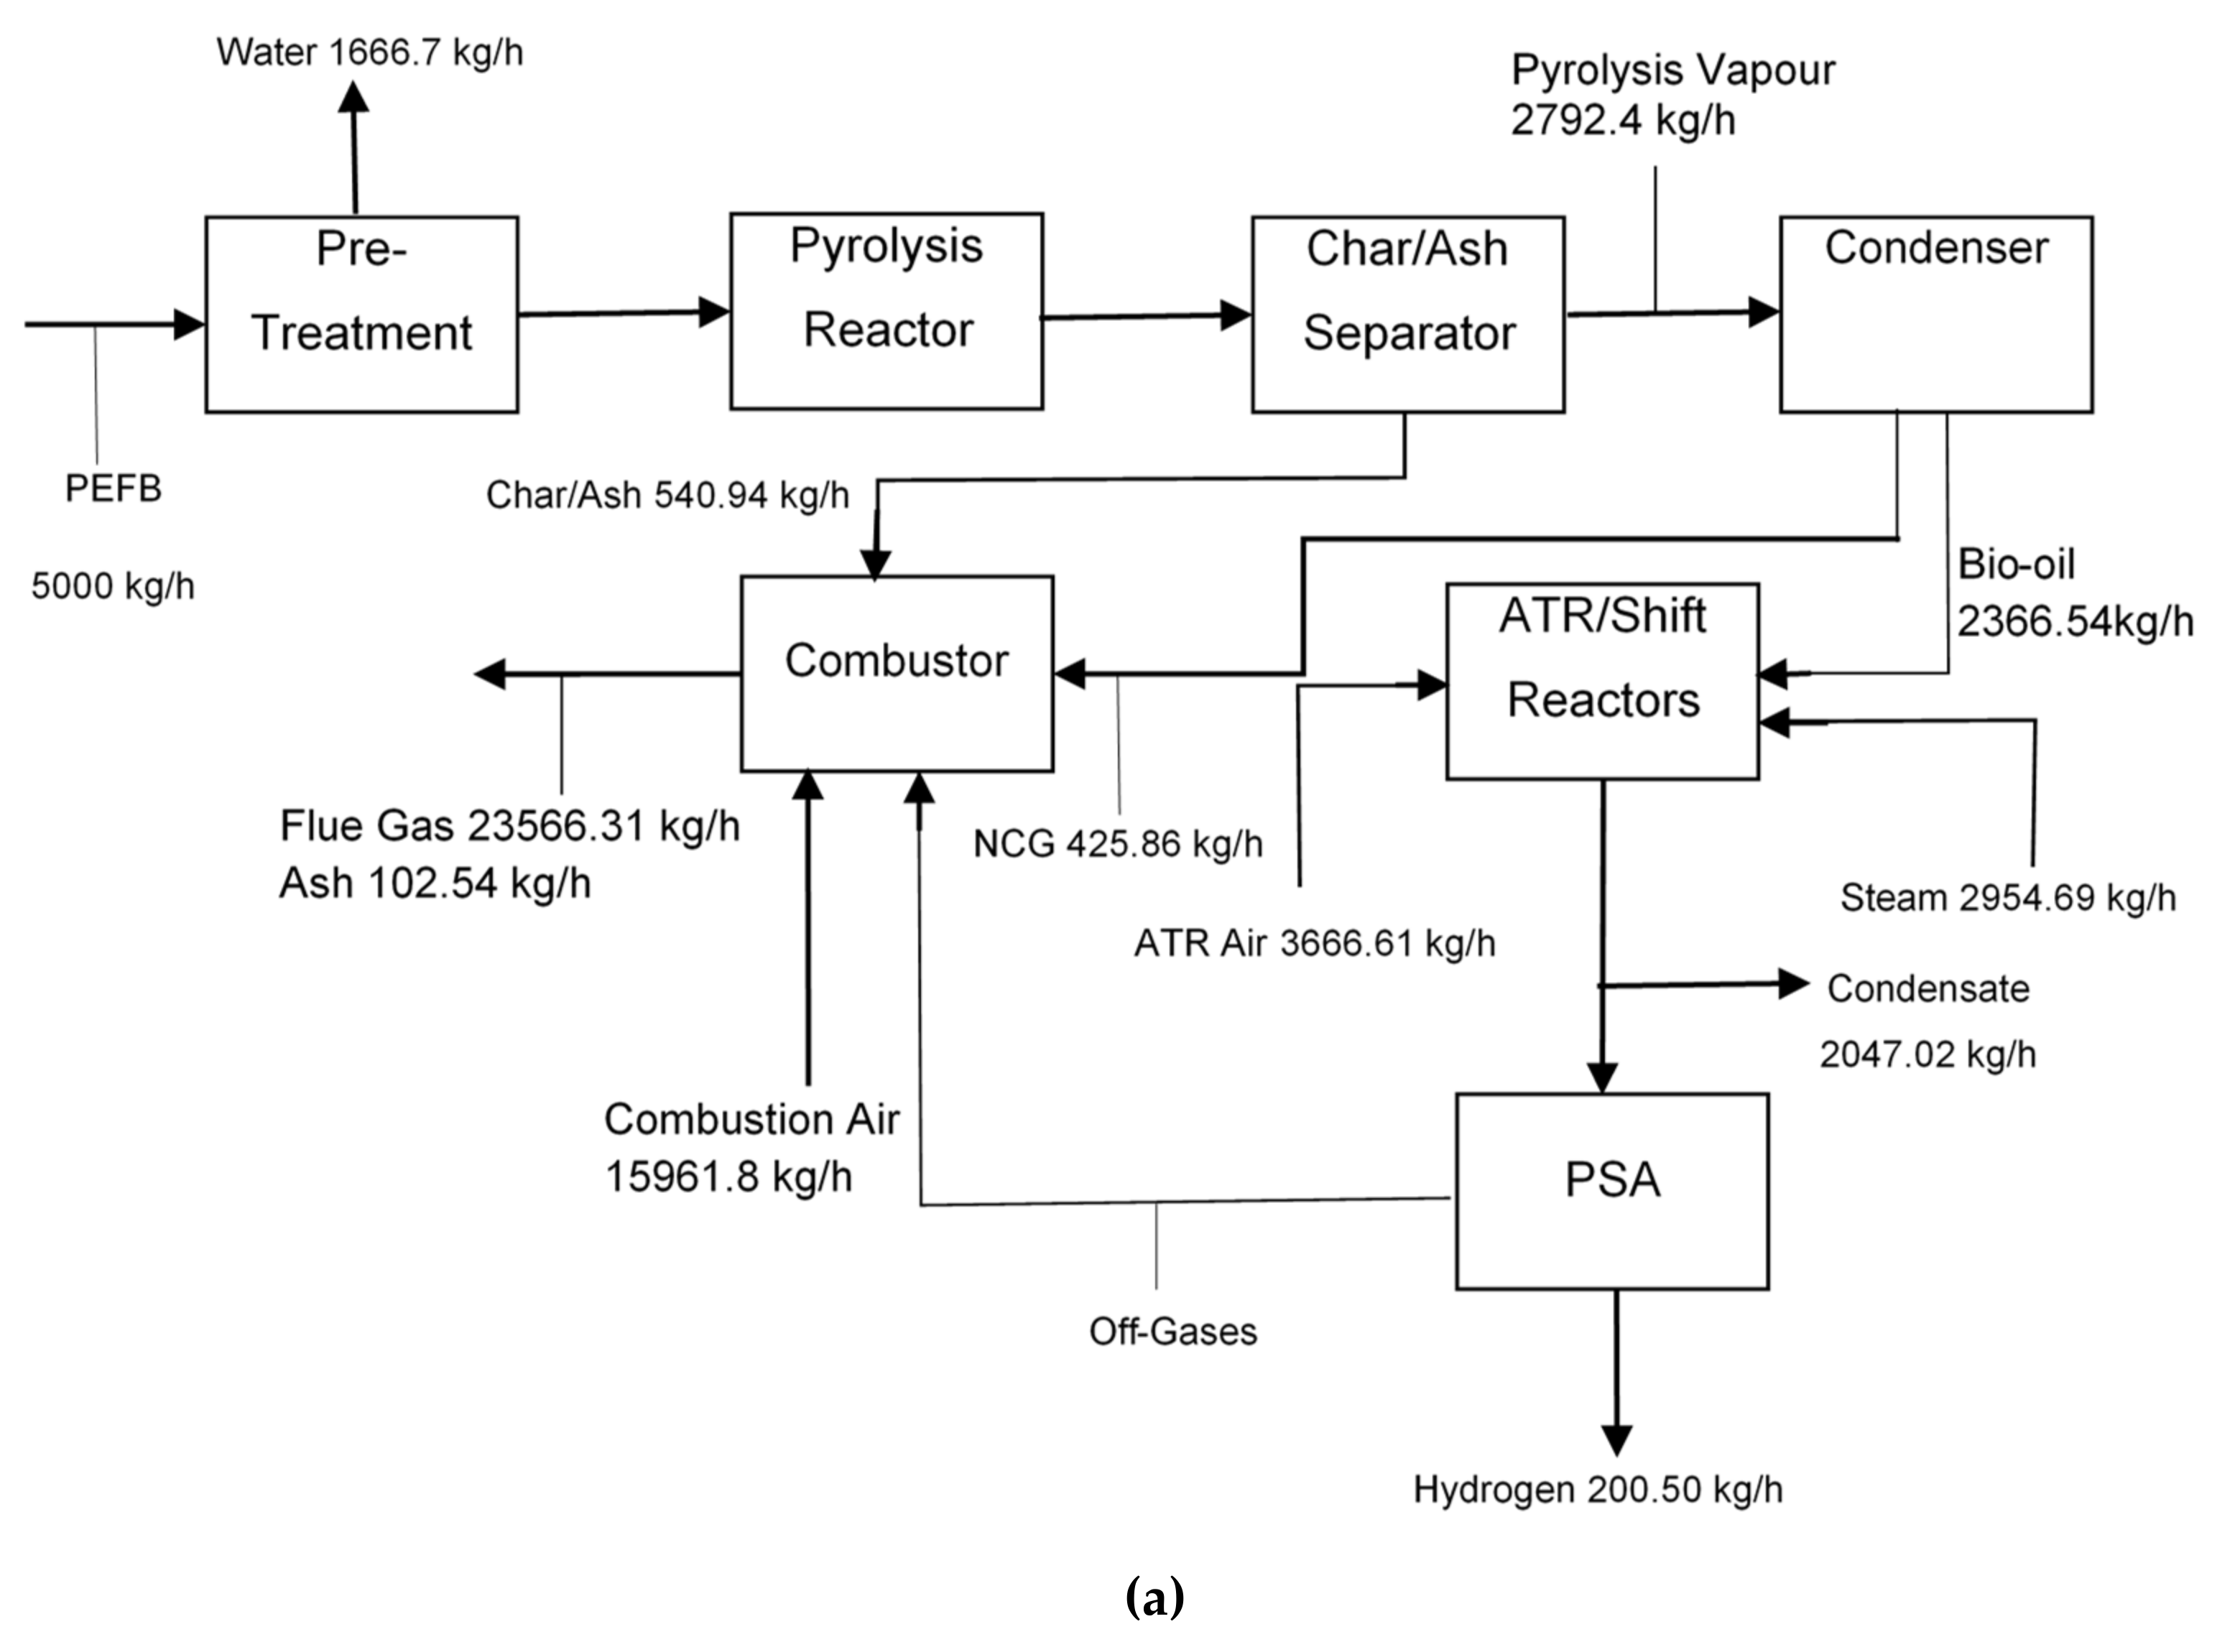
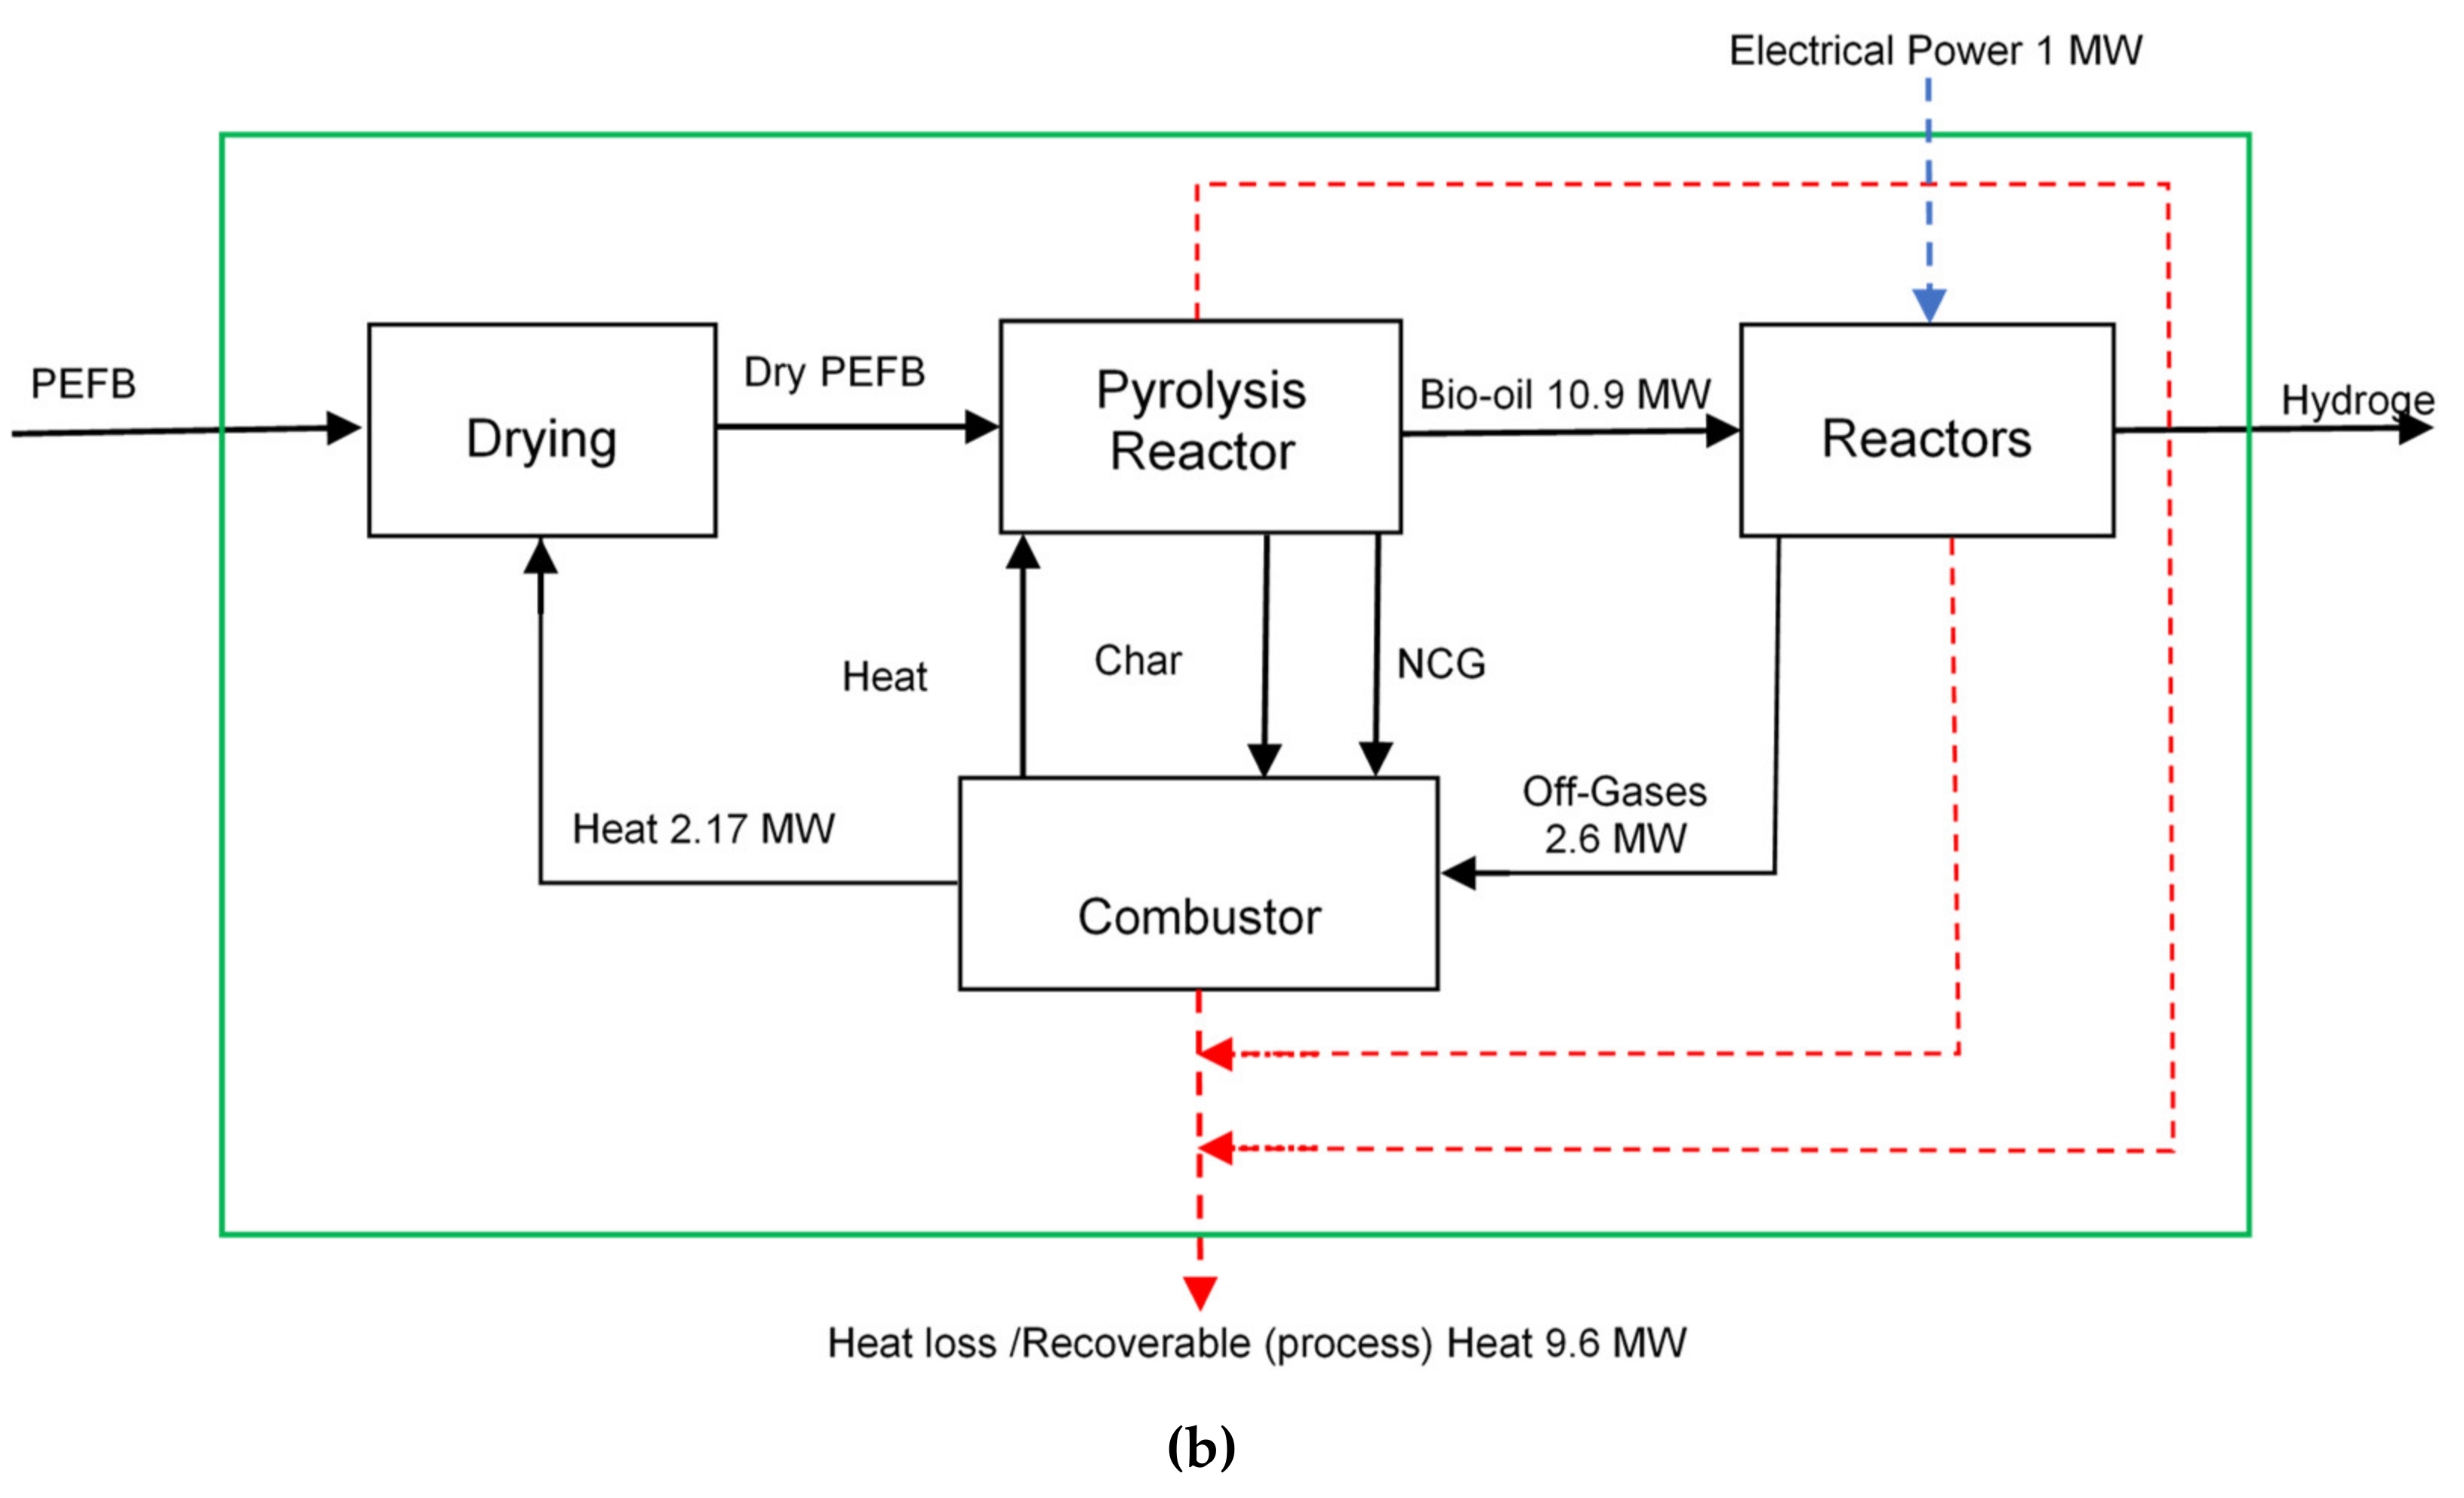
2.1. Process Description

Figure 1 shows a simplified block diagram of the production of syngas and eventual upgrading to hydrogen using fresh PEFB biomass as feedstock. The overall process consists of four main stages: pre-processing, pyrolysis, autothermal reforming (ATR) of bio-oil and hydrogen purification. Fresh (wet) PEFB obtained from a near-by oil palm processing plant is chopped from an initial size of 400 mm to 15 mm. The chopped feedstock then has its moisture reduced from 40% to 10% in a dryer before undergoing further size reduction in a mill to obtain an average of 2–3 mm particle size, making it suitable for pyrolysis [27]. Fast pyrolysis takes place in a fixed bed reactor at 500 °C and yields a mixture of solid char and volatile organics which are further separated using cyclones. Upon cooling, the volatile stream separates into a condensable liquid (bio-oil) and a non-condensable gas (NCG) stream. The bio-oil produced can be stored and transported out of site or reformed on site, proposed herein, to obtain syngas or pure hydrogen. The choice of reforming technology can influence the profitability and sustainability of the entire process. The proposed process model uses an autothermal reformer operated adiabatically at 3 bar with steam, air, and bio-oil as input streams. The main reactions and accompanying side reactions taking place in the reformer are listed in Table 1. The reformate is cooled to 250°C and sent to a carbon monoxide (CO)-shift reactor where most of the carbon monoxide reacts with water and converts to CO2 and H2 via the water gas shift (WGS) reaction. Upon cooling, the resulting stream containing mostly N2, H2, CO2, water, and some CO moves into a hydrogen purification unit.
A pressure swing adsorption (PSA) unit is used to purify the syngas leaving the shift reactor. The hot syngas is cooled down to 30 °C to condense and remove water. The presence of water negatively affects the functioning of a PSA unit [9]. Typical PSA hydrogen recovery can range from 50% to about 85% [9,28]. For this simulation, the PSA unit is implemented using a splitter block which separates the incoming syngas into two streams comprising pure hydrogen during adsorption and off-gases during desorption and purging. Depending on pressure, hydrogen recoveries of 75%, 85% and 90% are selected for PSA units operating at 10, 20 and 30 bar, respectively. The off-gas from the PSA is preheated to 150 °C and together with the NCG and recovered char from the pyrolysis unit are all sent to a fired heat exchanger (combustor) operating at 1100 °C. The combustion enthalpy and hot flue gases generated at the combustor are then used in three main ways: to sustain the pyrolysis reaction, dry the fresh PEFB, and preheat the furnace’s combustion air. Other heat demands of the plant, such as vaporisation of the bio-oil as well as steam generation and reformer air preheat prior to the autothermal reformer are met using heat integration measures.

2.2. Process Design in Aspen Plus

Assumptions made for this process design and all ensuing analyses include steady state process; no heat losses across pipes, reactors, and other related process equipment; negligible pressure drop during solid/fluid transport throughout the process; char (biochar) contains only carbon; biomass contains only C, H and O.

2.3. Thermodynamic Method

The Peng–Robinson equation of state with Boston–Mathias modification (PR-BM) is the global thermodynamic property method selected for this simulation. This method is particularly applicable to high temperature and pressure gas-processing, chemical and petrochemical processes [21,29]. This property method is comparable to the Soave–Redlich–Kwong equation of state, which other authors have used to simulate biofuel and coal thermochemical conversion processes [9,29]. The steam table property method (STEAM-TA) was used to calculate the thermodynamic properties of water when this was used on either the hot side or cold side of shell and tube heat exchangers. PEFB biomass and ash (obtained after pyrolysis) were defined as non-conventional solids and the Aspen HCOALGEN and DCOALIGT property models were used to calculate enthalpy, density and other thermodynamic properties based on the ultimate and proximate analyses of PEFB (see Table 2).

2.4. Biomass Specification

PEFB composition depends on palm variety, region, and age of plant [30]. The analyses of PEFB shown in Table 2 and used for this simulation, are based on average values [31,32,33,34].

2.5. Aspen Plus Blocks Specification

The complete flow sheet based on the process description is shown in Figure 2. This process is referred to as the ‘PAPS’ process, which is short for ‘pyrolysis and autothermal reforming process with hydrogen separation by PSA’. Fresh (wet) PEFB biomass, specified as stream WBIOMAS1 with an initial moisture of 40%, is received and enters the process with a mass flow rate of 5000 kg/h for the base case. Table 3 provides a brief description of the major Aspen Plus blocks used for the simulation.
The Aspen RYield block was used to simulate the decomposition of the dry PEFB biomass into desired products via fast pyrolysis. The pyrolysis component yield for the base case simulation was set at 15, 70, 12 and 3% for char, bio-oil, NCG and ash, respectively. Actual bio-oil composition was specified using the values given by Dupont et al. [35] who proposed a list of compounds grouped into six macro-chemical families to model the PEFB bio-oil used in the work carried out by Pimenidou and Dupont [36]. A calculator block was used to specify the product yield from the PYROLYSE reactor, based on the values listed in Table 4. Two calculator blocks were used to determine the amount of steam and air needed for ATR based on the desired feed molar steam to carbon (S/C) ratio and air–fuel equivalence ratio (λ). Another calculator block was used to determine the amount of excess air needed in the combustor to meet minimum environmental regulations and to ensure the combustor’s enthalpy matches the pyrolysis heat requirement while maintaining a flue gas temperature of 1100 °C.

2.6. Equations

The air–fuel equivalence ratio, λ, is calculated as:
λ = A F R a c t u a l A F R s t o i c
where AFRactual is the feed air to fuel mass ratio considered and AFRstoic is the stoichiometric feed air to fuel mass ratio for complete oxidation (combustion) according to reaction R2 in Table 1. The value of λ is the same if using molar ratios for AFRactual and AFRstoic.
The process (or net) hydrogen yield, YH2 in wt.% of feed is calculated as:
Y H 2 = m ˙ H 2 m ˙ B M   10 %   m o i s t u r e × 100
The process (or net) water conversion X H 2 O is calculated as:
X H 2 O = m ˙ H 2 O i n m ˙ H 2 O o u t m ˙ H 2 O i n × 100
Biomass-to-bio-oil conversion efficiency:
η B M = m ˙ B O · L H V B O m ˙ B M · L H V B M × 100
The hydrogen (or thermal) efficiency, η H 2 , was determined by comparing the lower heating value (LHV) of hydrogen produced to the LHV of both biomass (BM) and bio-oil (BO), when considered as input fuels. The LHV of biomass and bio-oil are assumed to be 3.06 kWh/kg (11 MJ/kg) and 4.61 kWh/kg (16.6 MJ/kg), respectively [37]:
η H 2 B M = m ˙ H 2 · L H V H 2 m ˙ B M · L H V B M × 100
η H 2 B O = m ˙ H 2 · L H V H 2 m ˙ B O · L H V B O × 100
The mechanical work produced by a turbine is calculated as:
W ˙ i = m ˙ T × 1 S T × η T
The overall plant (or process) efficiency, η p r , is calculated using the following equation [38]:
η p r = m ˙ H 2 · L H V H 2 + P ˙ + + Q ˙ + m ˙ P E F B · L H V P E F B + P ˙ + Q ˙ × 100
P ˙ +   o r   P ˙ = W ˙ i E ˙
Q ˙ +   o r   Q ˙ = H ˙ r e H ˙ p r
where:
η H 2 B M is the hydrogen efficiency calculated using biomass (PEFB) as input fuel.
η H 2 B O is the hydrogen efficiency calculated using bio-oil as input fuel.
m ˙ H 2 is the mass flow of the hydrogen gas product, kg h−1.
m ˙ P E F B is the mass flow of input PEFB, kg h−1.
m ˙ H 2 O is the mass flow of water, kg h−1.
LHV is the lower heating value (for H2, bio-oil or biomass) in kWh kg−1.
m ˙ T is the steam flow into the turbine, kg h−1.
W ˙ i is the isentropic work generated by a turbine, kW.
S T is the specific steam consumption of the turbine, kg (kWh)−1.
η T is the isentropic efficiency of the turbine.
P ˙ +   o r   P ˙ correspond to the net power/electricity generated or demanded by the process (MW). This term appears only once in the equation; either as a numerator, P ˙ + , in case of net (positive) work or power generation, or as a denominator, P ˙ , in the case of net (negative) electricity consumption by the process.
Q ˙ +   o r   Q ˙ correspond to the net heat produced or required by the process (MW). This term appears only once in the equation; either as a numerator, Q ˙ + , in case of net (positive) heat produced or as a denominator, Q ˙ , in the case of net (negative) heat required by the process.
E ˙ is the electrical energy needed to power all electrical equipment in MW.
H ˙ r e is the residual heat recovered from cooling the dryer exit stream in MW.
H ˙ p r is the required process heat obtained by adding heat demand for heaters H1, H2 and H3 on Figure 2 in MW.

2.7. Experimental

The autothermal reforming of bio-oil represented the most innovative and riskiest aspect of this work making it the most critical process step for the eventual success of the proposed plant design. Therefore, this stage was investigated at laboratory scale using optimum conditions identified by prior equilibrium predictions performed using the Aspen RGibbs model selected for both highest syngas yield and autothermal operation. The aim here was to gain as much insight as possible on how an actual reactor may perform during ATR of bio-oil.
A 1 wt.% Rh/γ-Al2O3 catalyst (‘Rh-Al’) was prepared by wet impregnation and used for autothermal reforming experiments. γ-Al2O3 pellets (1/8”) obtained from Alfa Aesar were crushed and sieved to a particle size ranging from 0.355 to 1 mm and used as support for catalyst preparation. A known amount of rhodium (III) nitrate hydrate, (Rh(NO3)3·H2O with ~36% rhodium), supplied by Sigma-Aldrich, was dissolved in 50 mL of deionised water in a 500 mL beaker. The crushed γ-Al2O3 support was then added to the salt solution and the resulting slurry slowly stirred using a magnetic stir bar on a hotplate stirrer maintained at 60 °C until most of the water was evaporated. In a typical preparation, 3 g of γ-Al2O3 was used with 0.0833 g of Rh salt for the 1 wt.% Rh catalyst.
A tubular stainless-steel reactor with an inner diameter of 10 mm was loaded with 0.2 g of the prepared catalyst and electrically heated in a tube furnace under constant N2 flow of 200 cm3 min−1 until the reaction temperature was achieved. The bio-oil surrogate flow was set by choosing a constant carbon flow of 1.5 × 10⁻⁵ mol s−1. This value was then used to determine the air and water flow based on the desired feed molar steam to carbon ratio (S/C) and equivalence ratio (λ), respectively, for the ATR operation.
Aspen plus software was used to perform equilibrium analysis to determine optimal conditions for the ATR. The individual bio-oil component flow values listed in Table 5 were entered as input into the Aspen software for S/C molar ratios of 2.2 and 3, while λ was varied from 0 to 1 for each case. The main contributors in the feed were, in decreasing order, catechol, furfural, guaiacol, formaldehyde, acetic acid and creosol, which accounted jointly for 86% of the molar carbon feed rate.
According to Equation (11), the moles of O2 required for stoichiometric complete oxidation (i.e., combustion), O 2 C O X , is given by:
O 2 C O X = F m f × n + m 4 k 2
where F m f is the flow rate of the moisture free (m.f.) bio-oil in mol s−1.
n, m, and k are the coefficients for carbon, hydrogen, and oxygen in the molecular formula of the bio-oil.
The moisture free bio-oil composition corresponding to the composition given in Table 5 was C0.38H0.45O0.17. Using the constant carbon flow of 1.5 × 10⁻⁵ mol s−1, the value of F m f was determined to be 3.95 × 10⁻⁵ mol s−1 corresponding to an actual bio-oil liquid feed flow rate of 1.291 mL h−1. Substituting known values into Equation (11) gave an O2 feed flow of 1.60 × 10⁻⁵ mol s−1 which in turn corresponded to an air feed flow of 7.63 × 10⁻⁵ mol s−1 (32.6 cm3 min−1, STP). The amount of carbon deposited on used catalyst was determined using a Thermo Scientific Flash 2000 Elemental Analyzer and converted to a carbon selectivity via the carbon balance.

3. Results

The results on the plant design are presented first, based on idealised processes allowing to determine the technological viability of the proposed ATR of fast pyrolysis bio-oils from wet palm empty fruit bunch, and determining potential CO2 emissions savings from such an integrated process of conversion of waste biomass to syngas in comparison to syngas generated by conventional steam methane reforming. This is then followed by the experimental feasibility study of bio-oil ATR on rhodium catalyst at laboratory scale.

3.1. Process and Plant Modelling

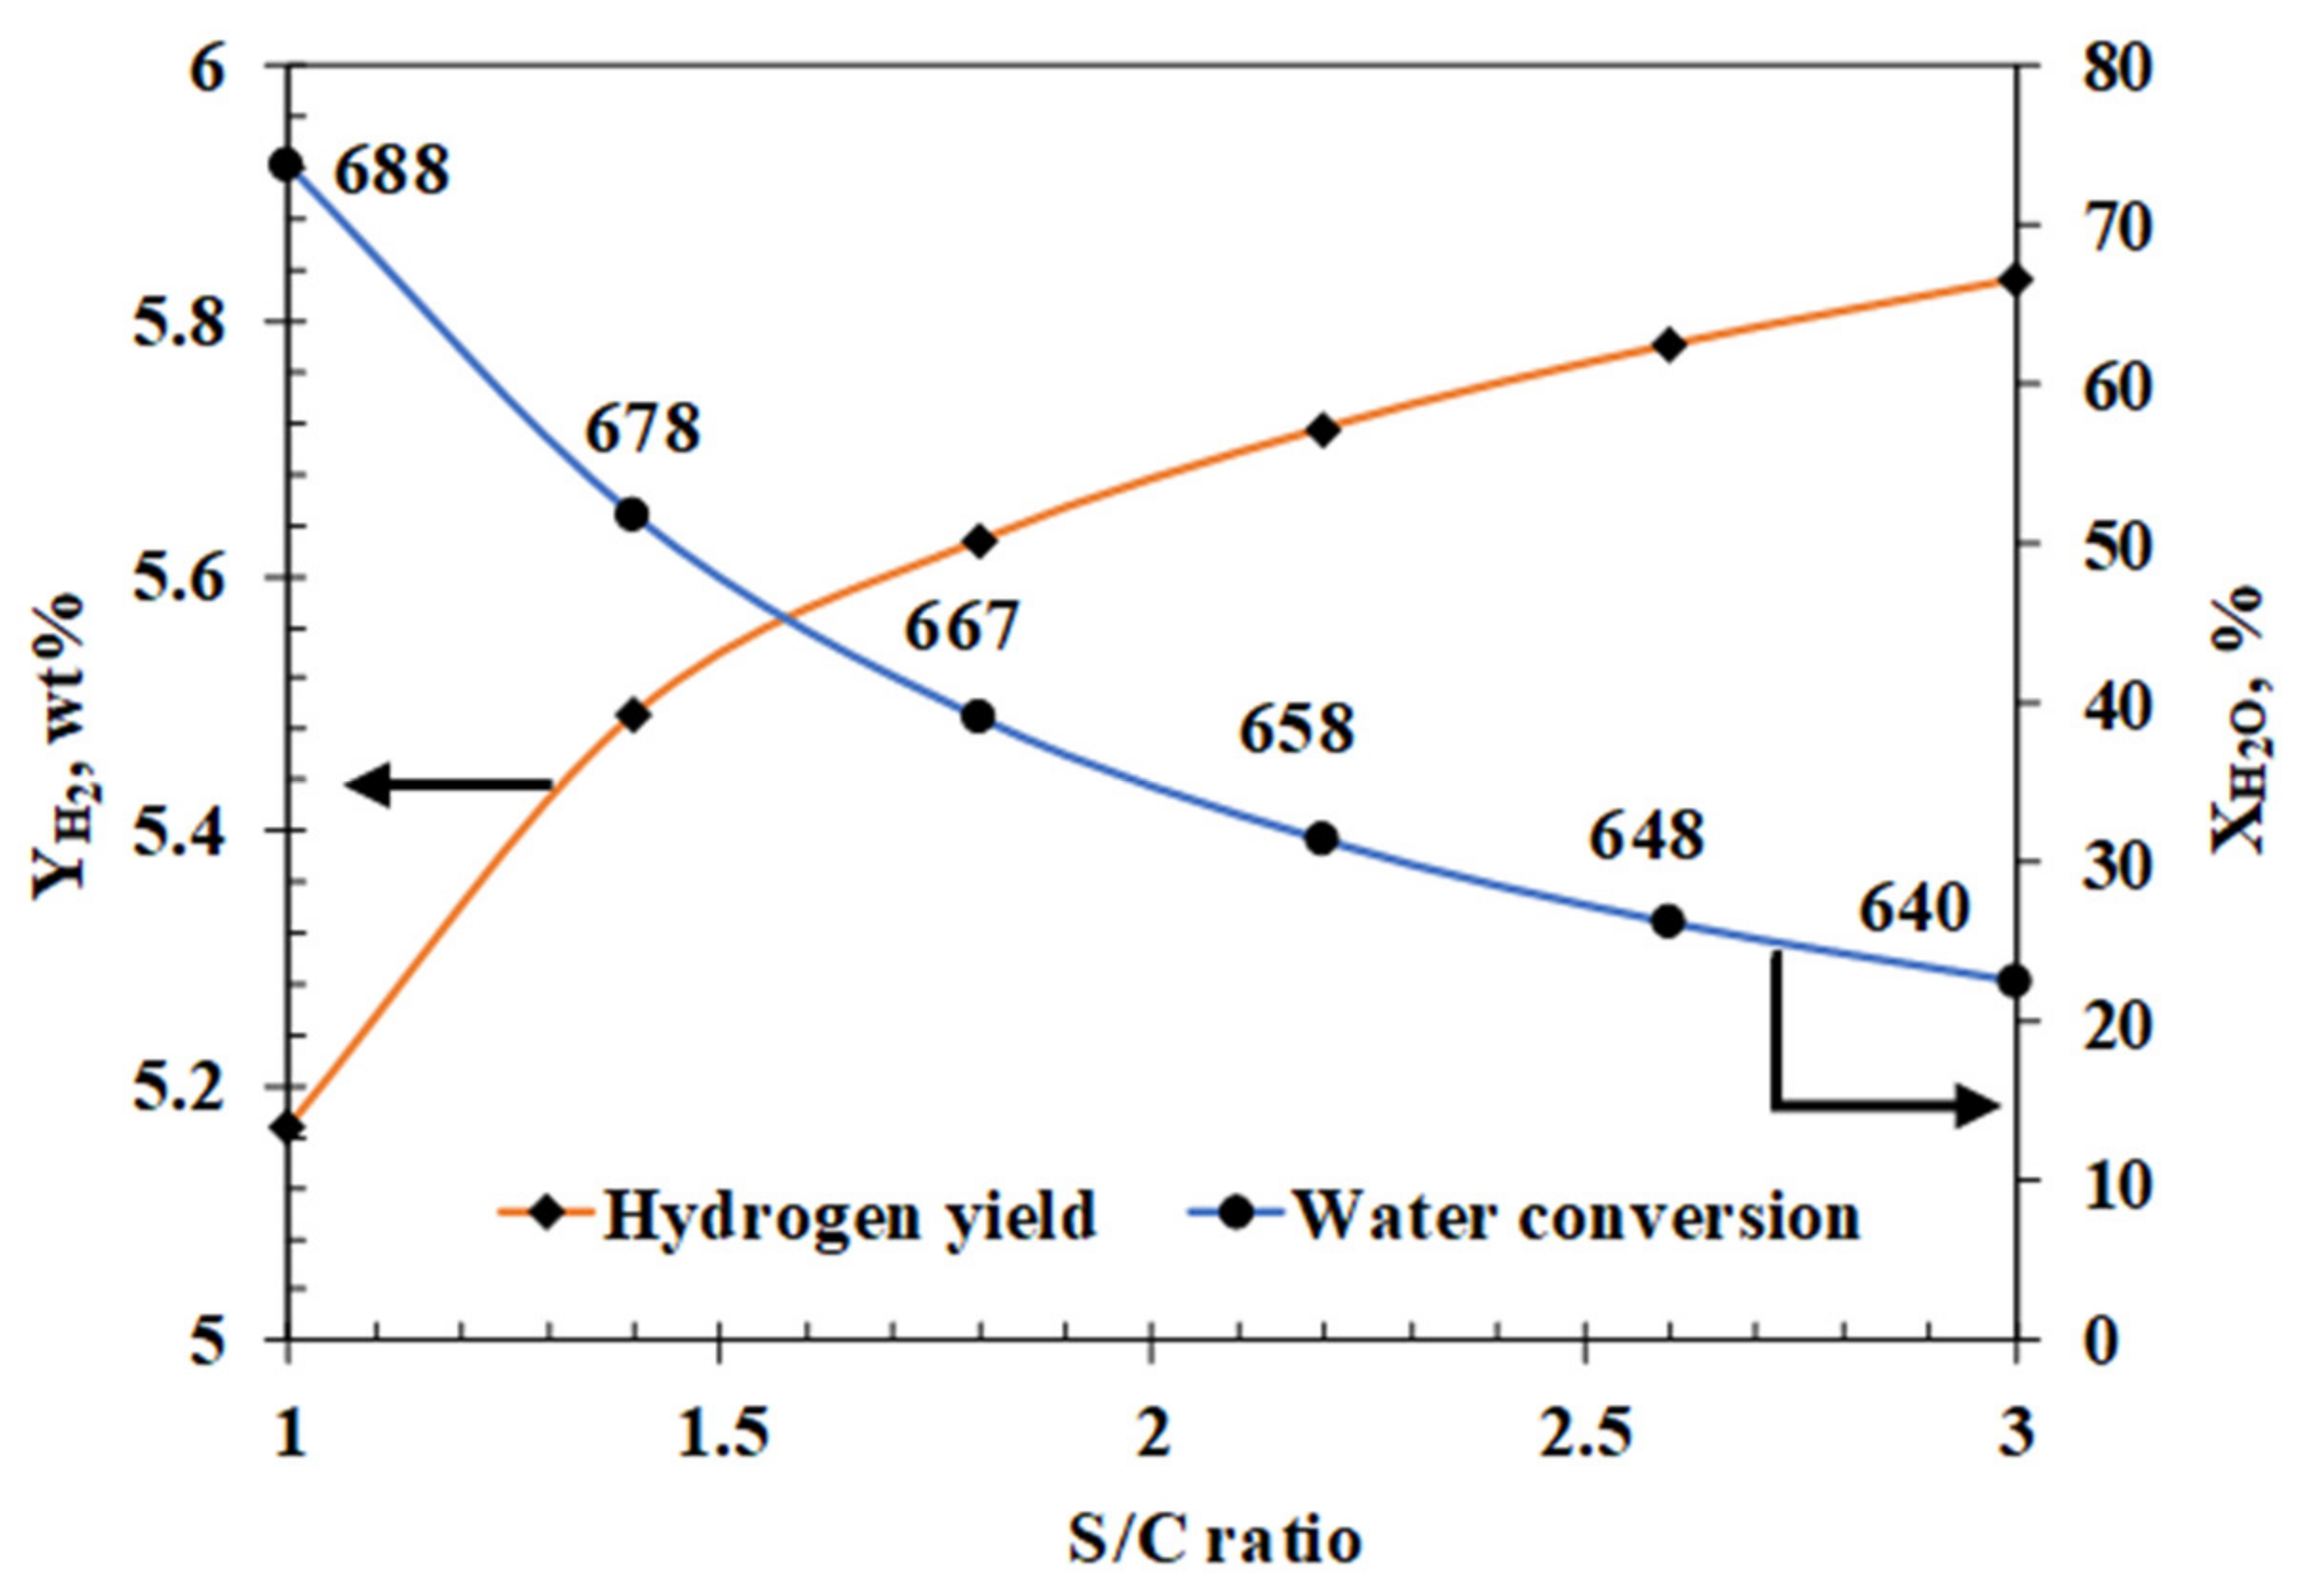
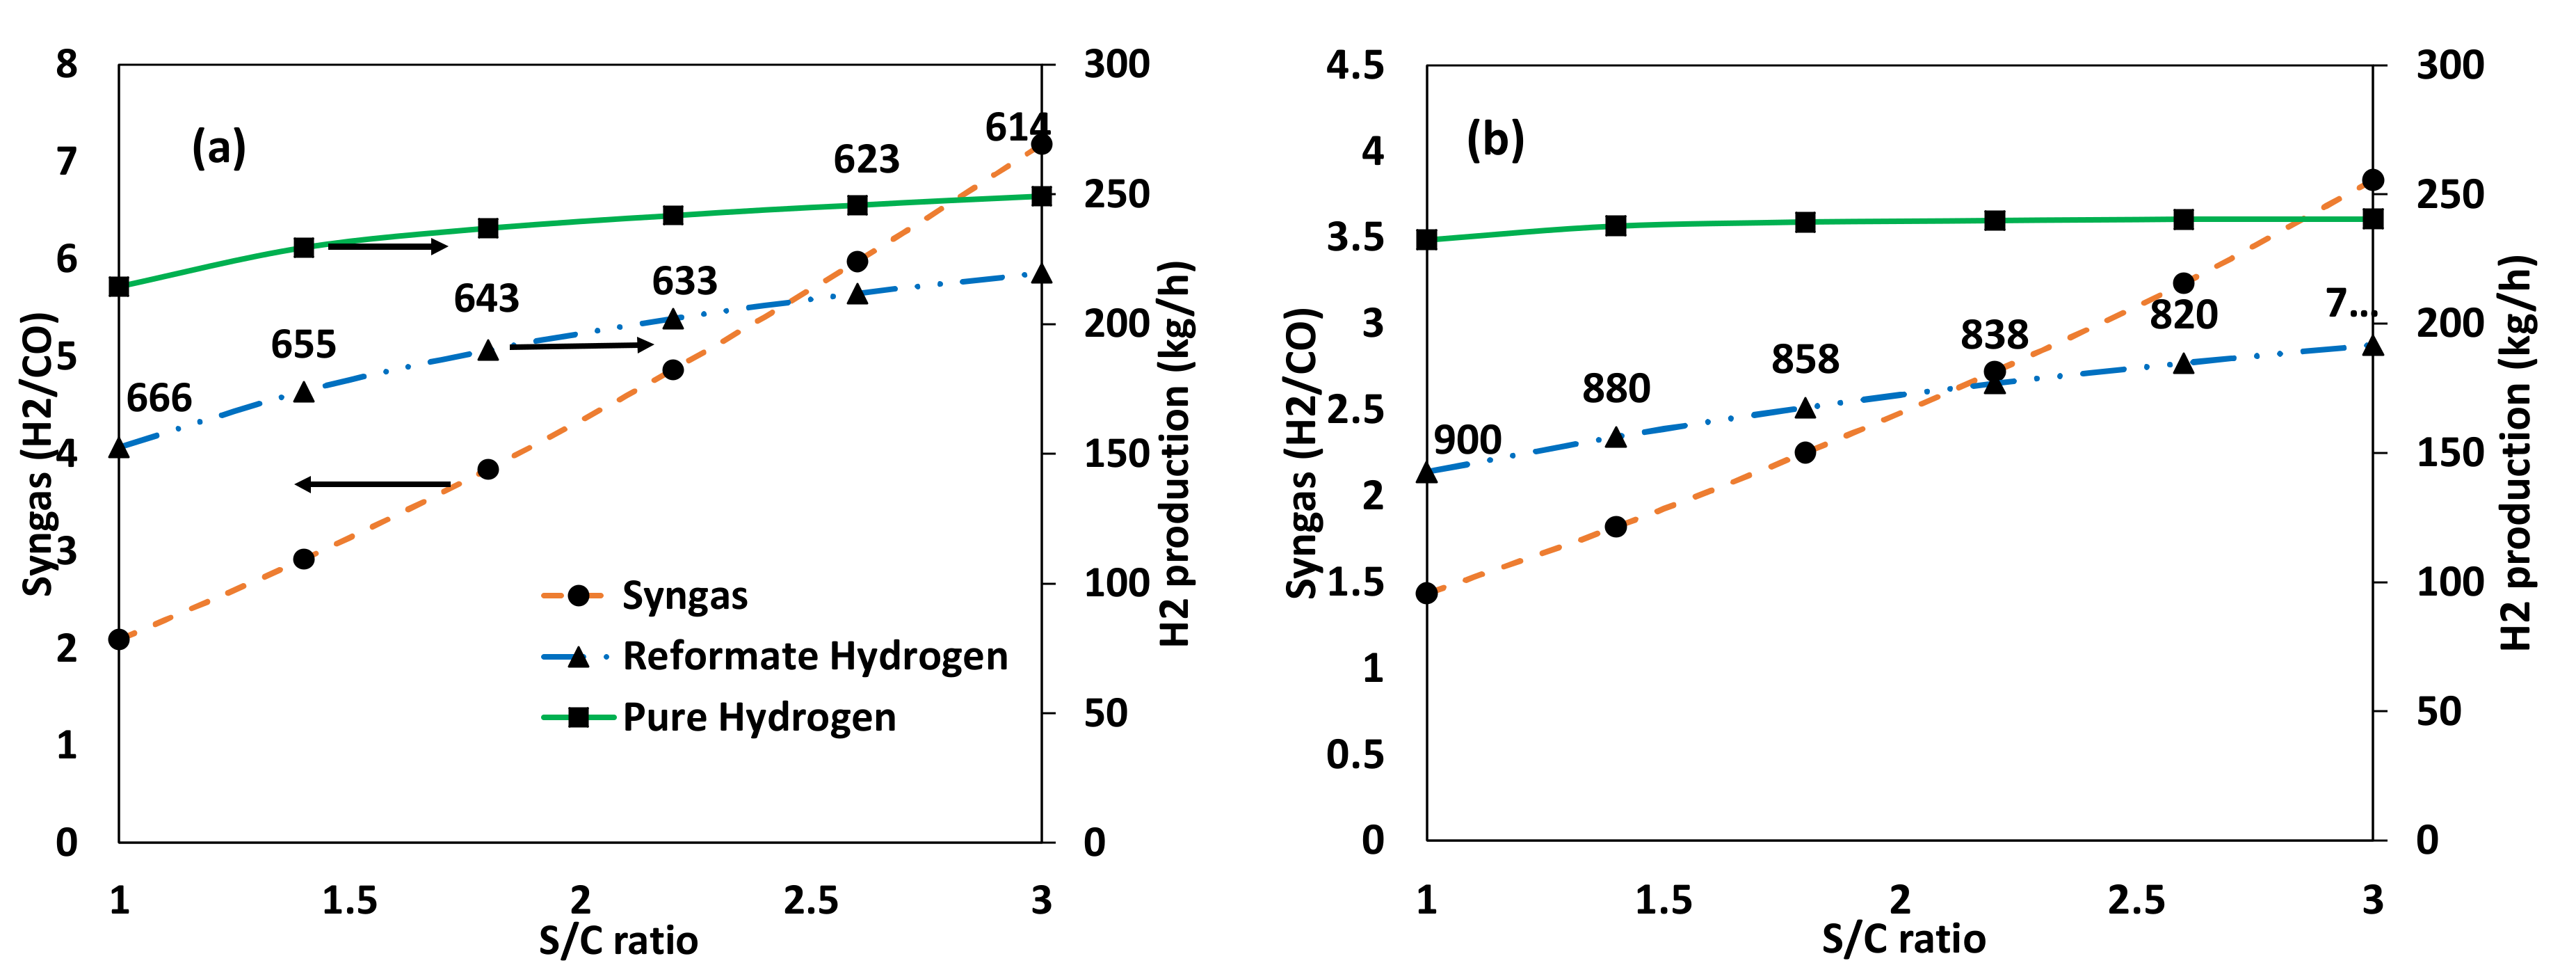
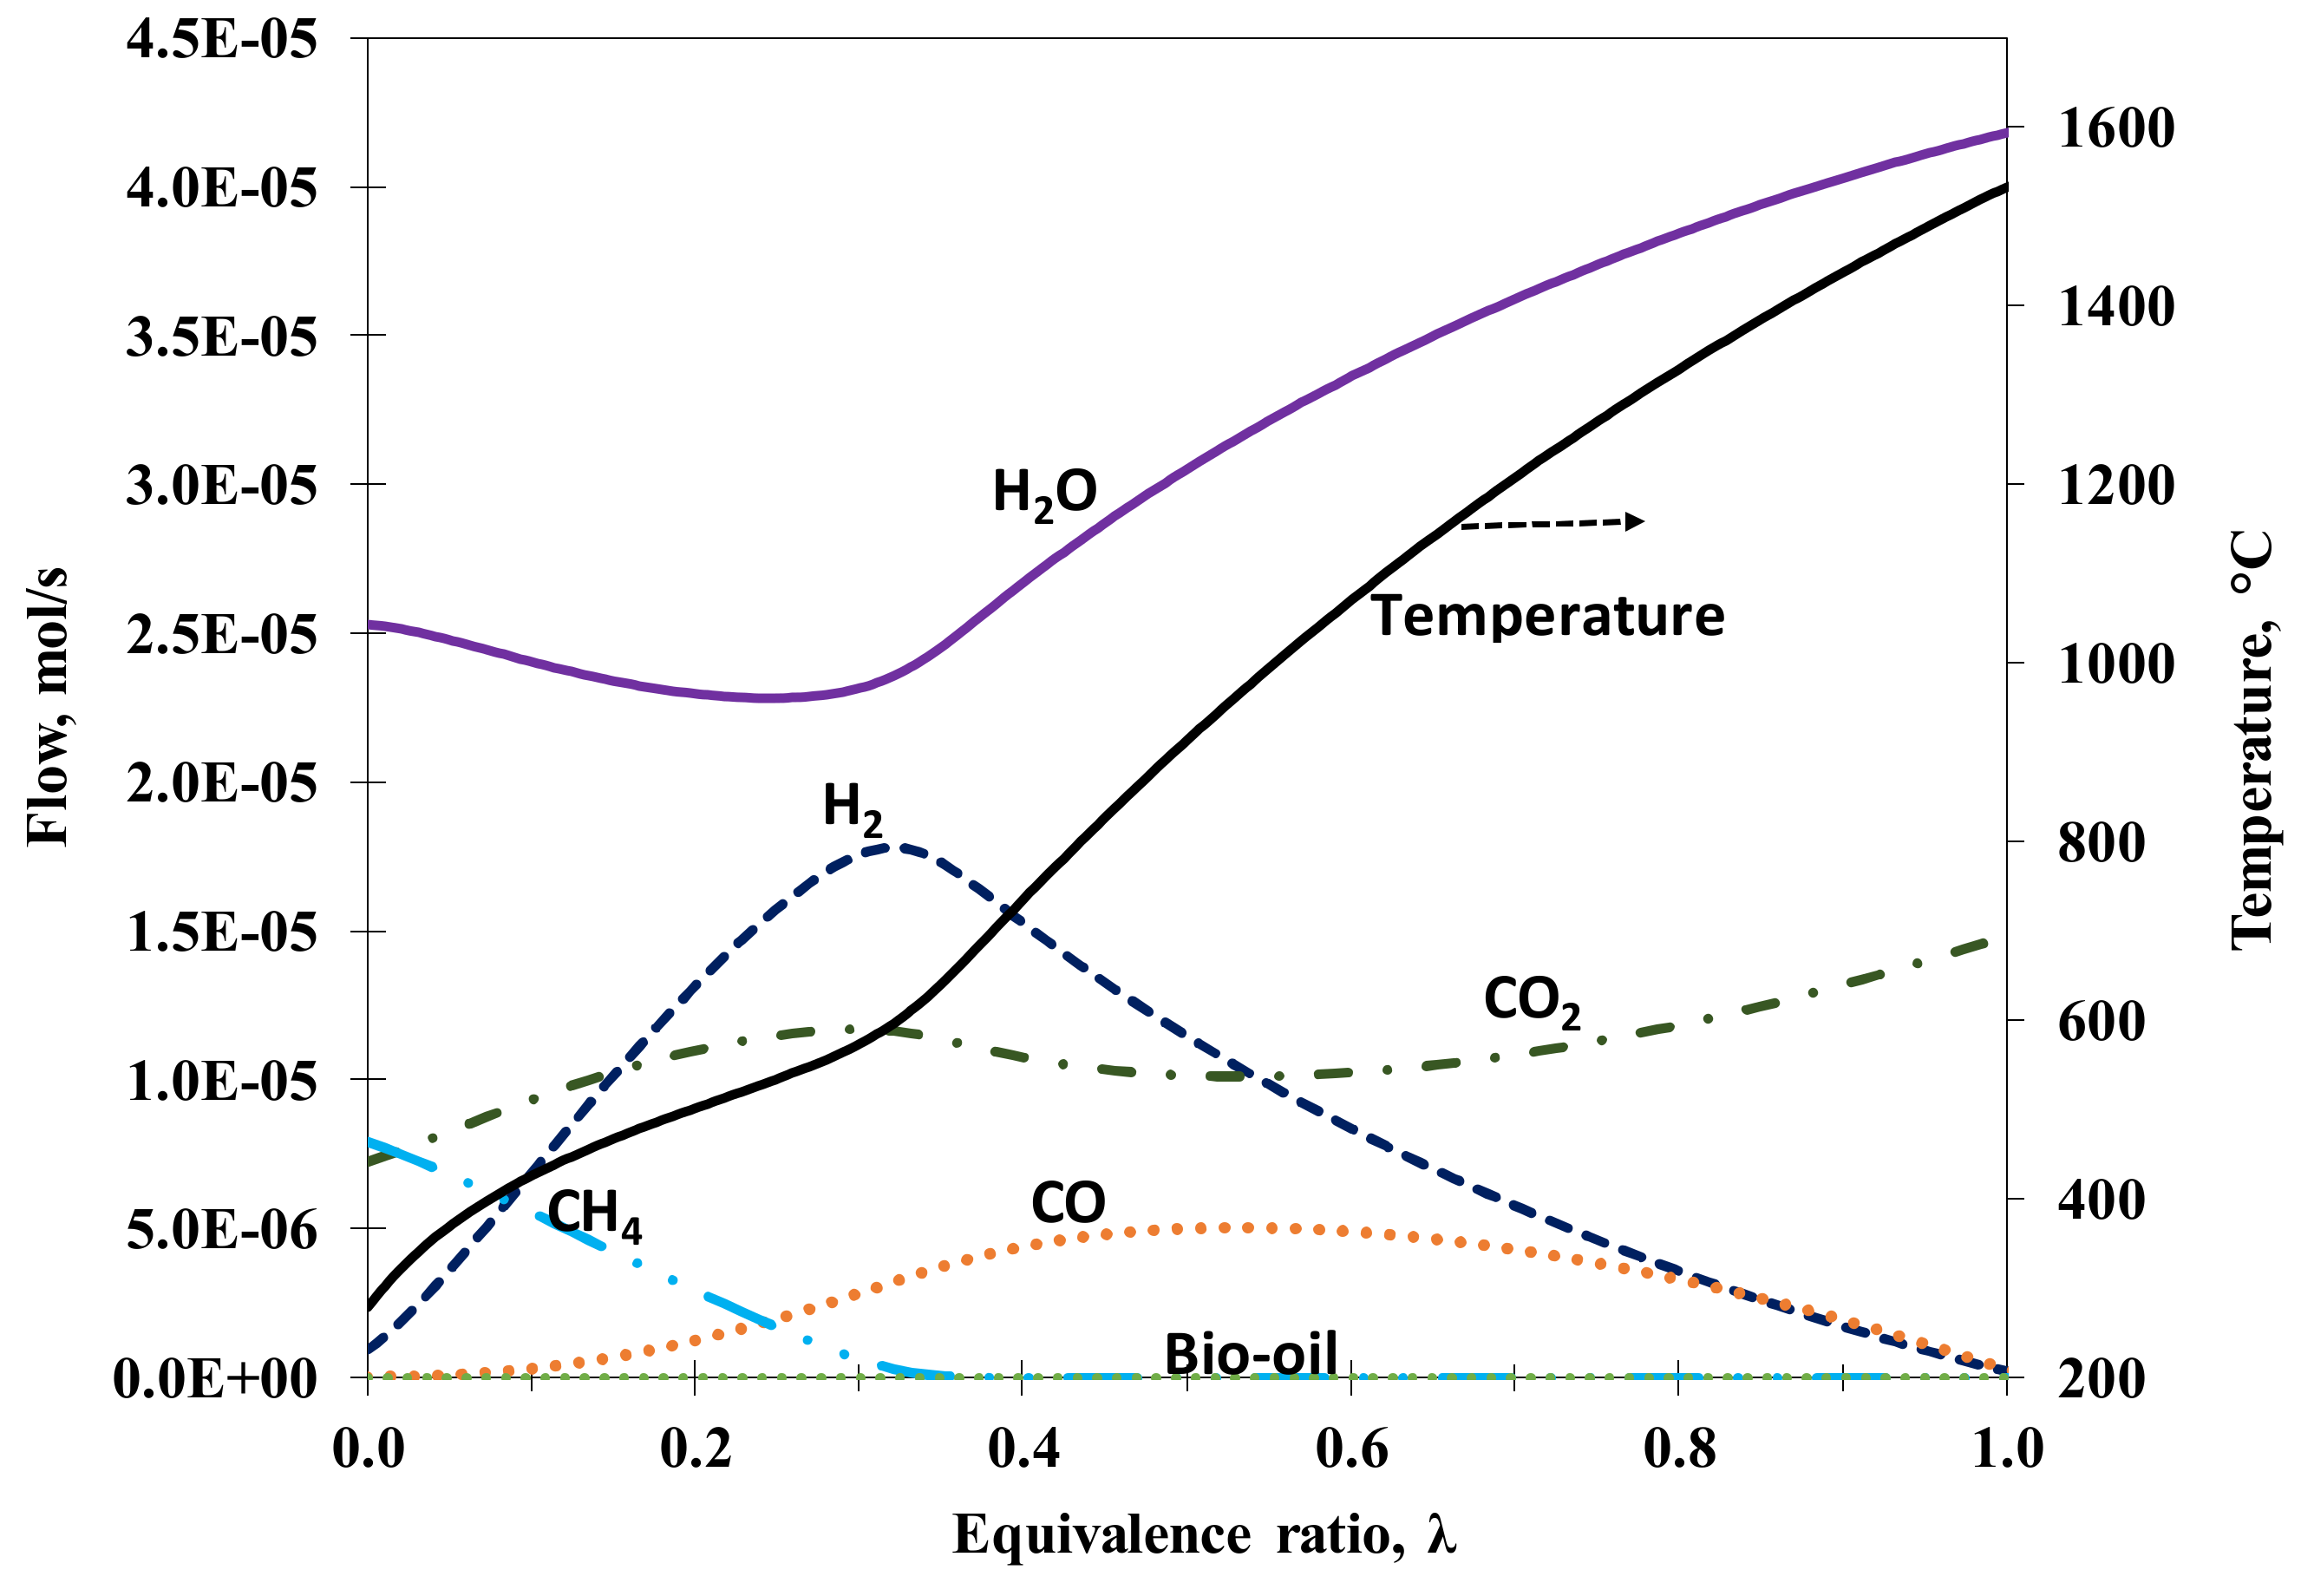
3.1.1. Influence of Steam and Air Feeds at the Autothermal Reformer

Full Plant’s Hydrogen Yield

Figure 3 shows the effect of increasing the reformer feed molar steam to carbon ratio (S/C) on the plant’s hydrogen (process hydrogen) yield (Equation (2)). The equivalence ratio for this plot corresponds to the amount of oxygen required for stoichiometric partial oxidation of bio-oil according to reaction R1 on Table 1 and is calculated to be λ = 0.255. Under this condition, there is just enough oxygen present to convert all the carbon (C) in the biofuel to CO without hydrogen (H) oxidation and no side reactions. As expected, increasing S/C at the reformer resulted in an increase in hydrogen yield. This increase in hydrogen is due to two factors. Firstly, the presence of more water with increasing S/C, compounded with the slight reduction in the equilibrium temperature (from about 690 to 640 °C) promoting the WGS reaction inside the reformer.
The second effect occurs in the CO-shift reactor where the increase in feed water shifts the equilibrium of WGS, forming more H2 and CO2. Figure 3 also shows that water conversion drops from an initial value of 73.9%, at S/C = 1, to about 22.6% at S/C =3 as conditions move from lack of steam for the complete steam reforming process consisting of combined reactions R3 and R5 (S/C < 1.55) to large excess of steam (S/C >1.55).
The initial benefit of having more water in the system almost ceases for S/C greater than 2.5. In typical isothermal SR processes, high S/C help prevent the accumulation of coke on the catalyst [39]. This is not necessarily the case for an adiabatic ATR process, as the high steam content lowers the equilibrium temperature, which might have the undesirable effect of promoting coke formation reactions while deactivating coke gasification reactions.
Working at very high S/C, though thermodynamically beneficial, also makes a process more energy intensive and increases the cost of the H2 or syngas produced. Therefore, based on Figure 3, the maximum S/C to consider when operating an efficient ATR process should be equal to or below 3. Moreover, above this value, an external fuel source is required to generate the excess superheated steam (higher duty for heater H1 on Figure 2) leading to a more complex heat exchange network and larger downstream separation equipment.

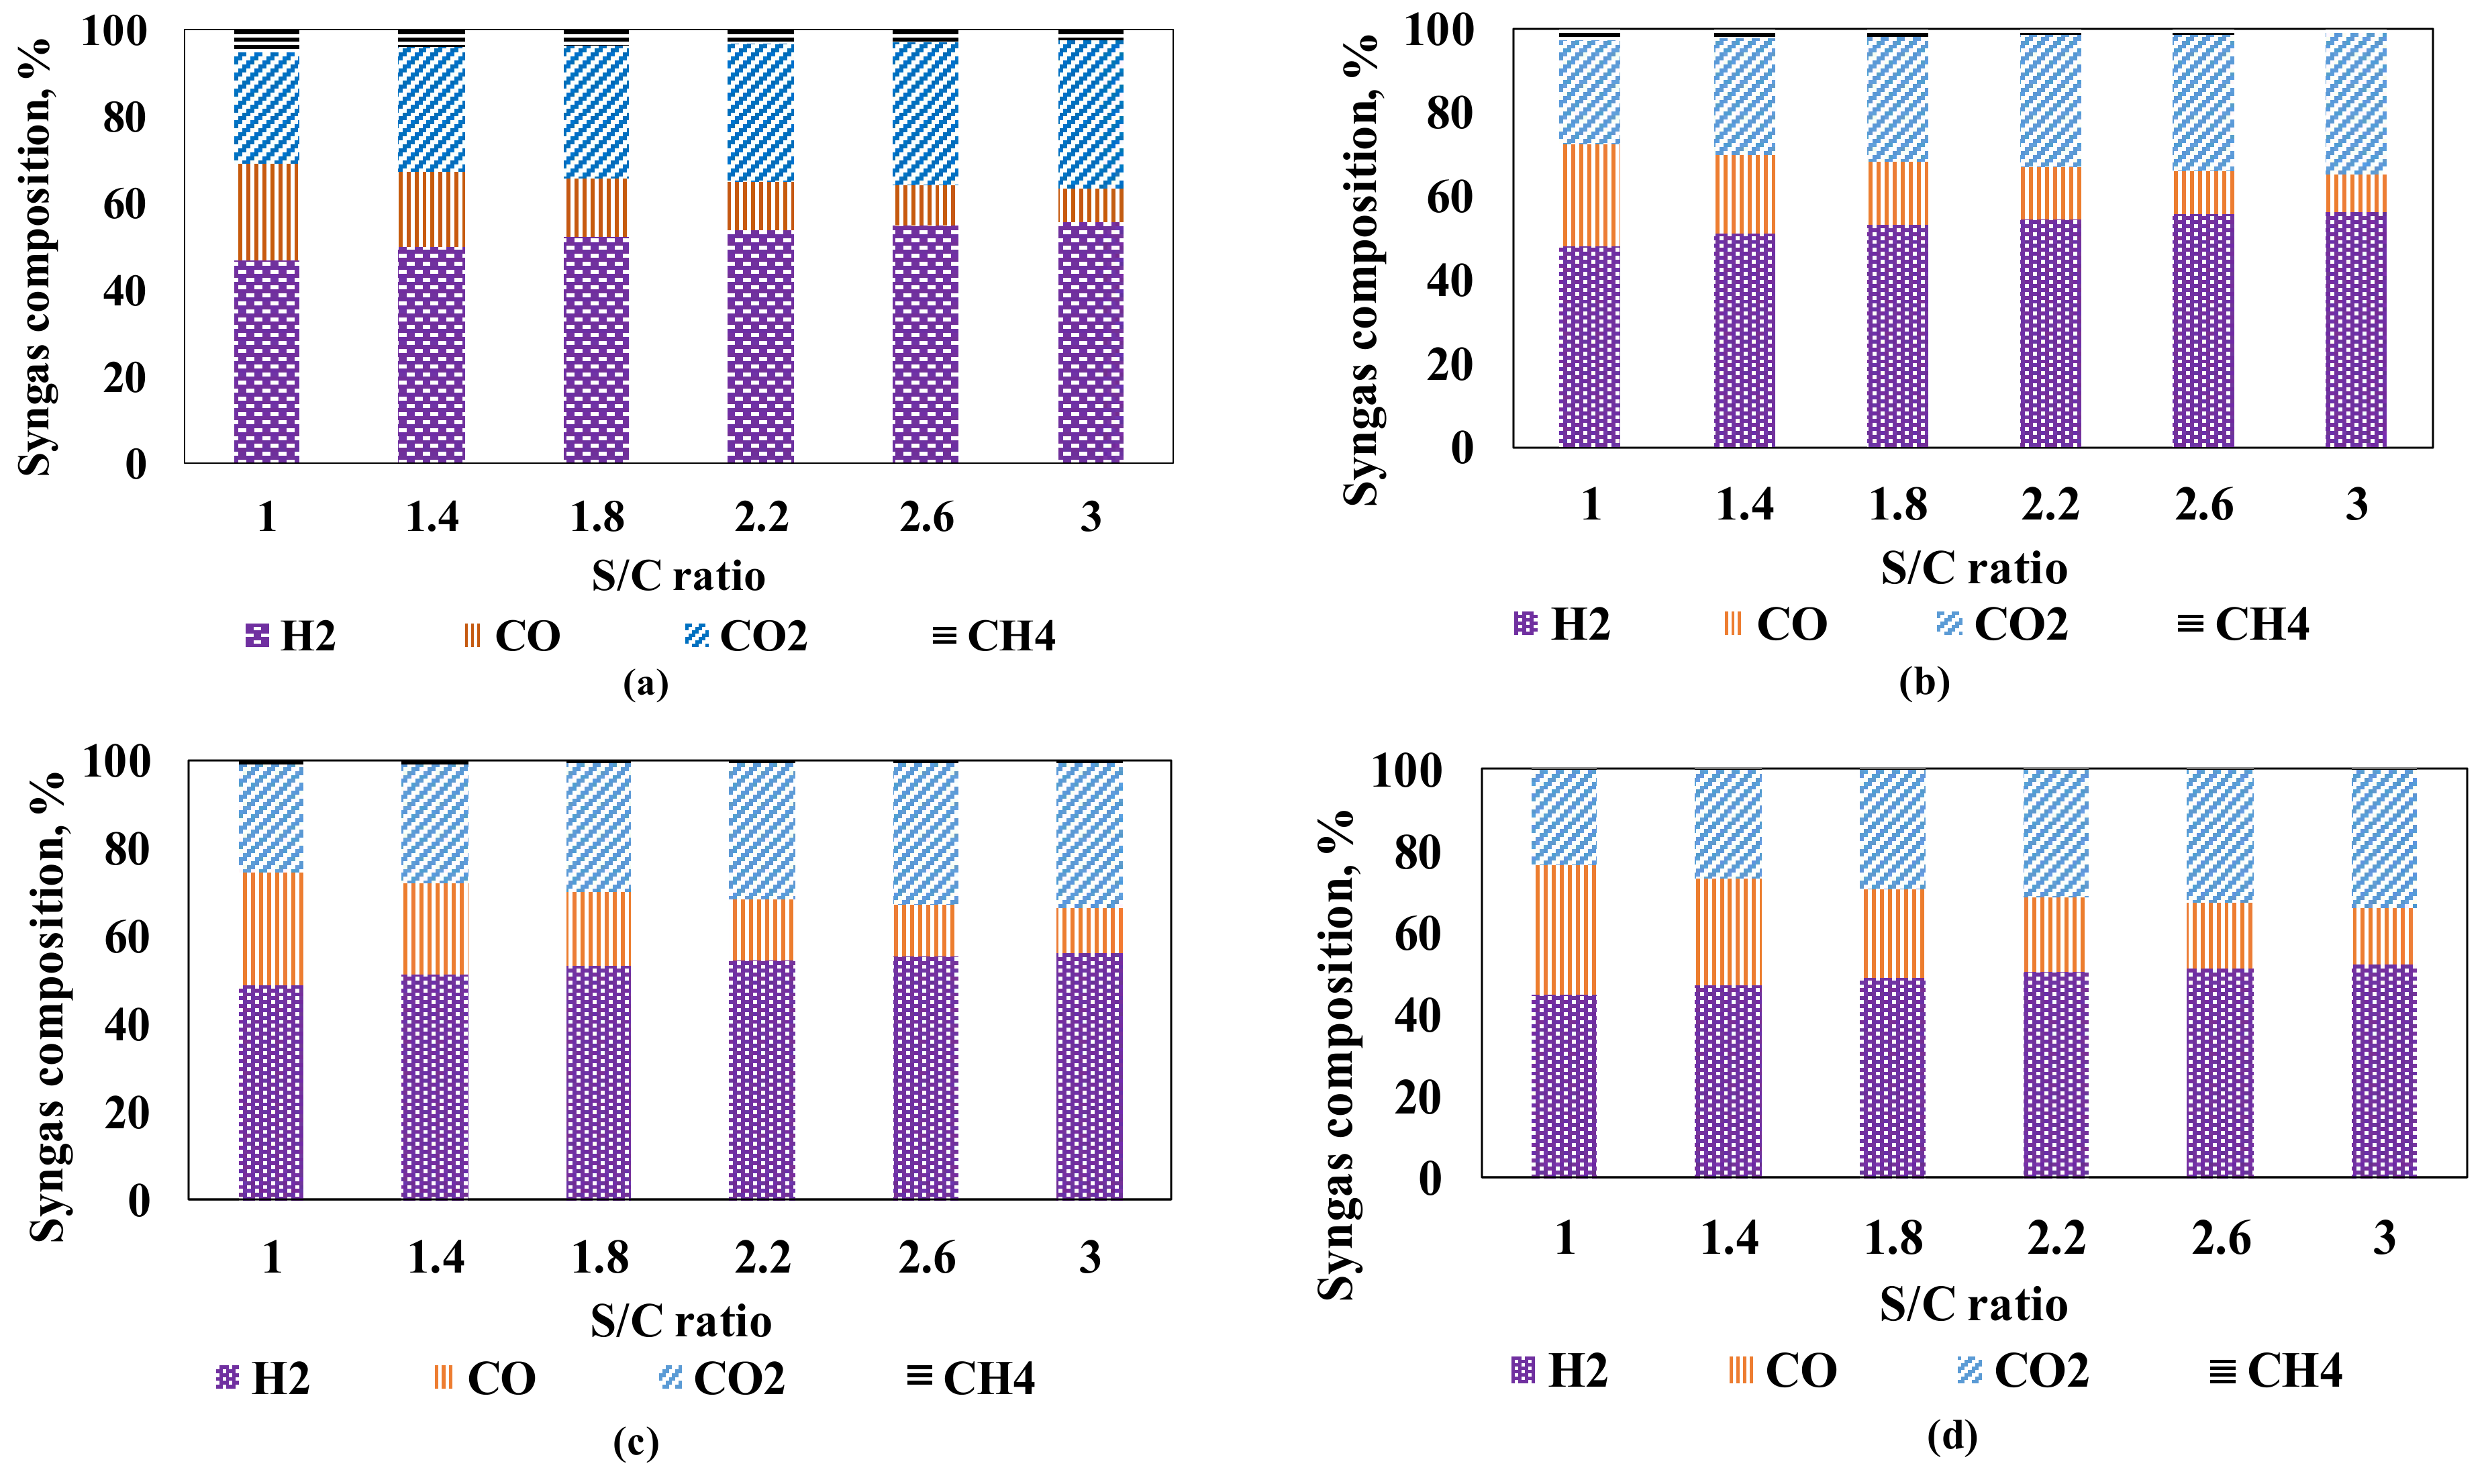
Dry Gas Composition at the Autothermal Reformer (Syngas Composition)

One advantage of ATR is the variability in product gas composition achieved by changing process variables such as λ, S/C, and temperature [10]. Figure 4 shows the nitrogen-free dry gas reformate product obtained by varying S/C from 1 to 3 for four different λ at the ATR reactor’s inlet. Values of λ chosen were 0.23, simulating a lack of O2 for partial oxidation (R1); 0.25, i.e., just sub-stoichiometric O2 for R1; two excess O2 conditions for R1 (0.28 and 0.36). As mentioned in the previous section, increasing S/C increases the reformate H2 yield. This also has a concomitant effect on CO2 while the amounts of CO and CH4 (when thermodynamically possible) decrease. This is expressed as reformate gas composition in Figure 4a–d.
It is also discernible from Figure 4 that for the same S/C, the hydrogen content of the syngas reduces as the amount of oxygen (or air, expressed as λ) increases. If the amount of oxygen present in the reactor feed (fuel and air) is lower than that required to convert all C in the fuel to CO (λ < 0.255), the H2 yield obtained is lower than the possible maximum.
For the four λ values examined, hydrogen production in the reformer peaks at λ = 0.28 with a dry syngas composition of 56% and S/C = 3. This value then decreases as more O2 (air) is added to the reformer due to increased oxidation of fuel to CO2 and H2O. Figure 5 shows the different syngas compositions (expressed as the H2/CO ratio) that can be obtained depending on the S/C ratio and λ used. For the different combinations of air and water considered for this simulation, the reformate H2/CO ratio varied from 2 to 7 (at λ = 0.23) and from 1.5 to 4 (at λ = 0.36). The reformate, in this case, can be used either directly (no CO-shift required) or after upgrading as feed for synthesising chemicals either by direct combination or by Fischer–Tropsch synthesis. Different chemicals have different feed requirements, with H2/CO = 2 for many Gas-to-Liquid Fischer–Tropsch processes and H2/CO = 1 for higher alcohol syntheses [40,41,42]. However, the syngas obtained from this process will require an addition of pure plant product H2 to meet the feed requirement for synthesising methanol and dimethyl ether. This is because these syntheses require a stoichiometric mixture of H2, CO and CO2 defined by the value of M, which is called the module and is defined as per Equation (12). The module is equal to 2 for methanol and dimethyl ether syntheses. The maximum value of M obtained for this process was 0.54 for λ = 0.25 and S/C = 3.
M = H 2 C O 2 C O + C O 2

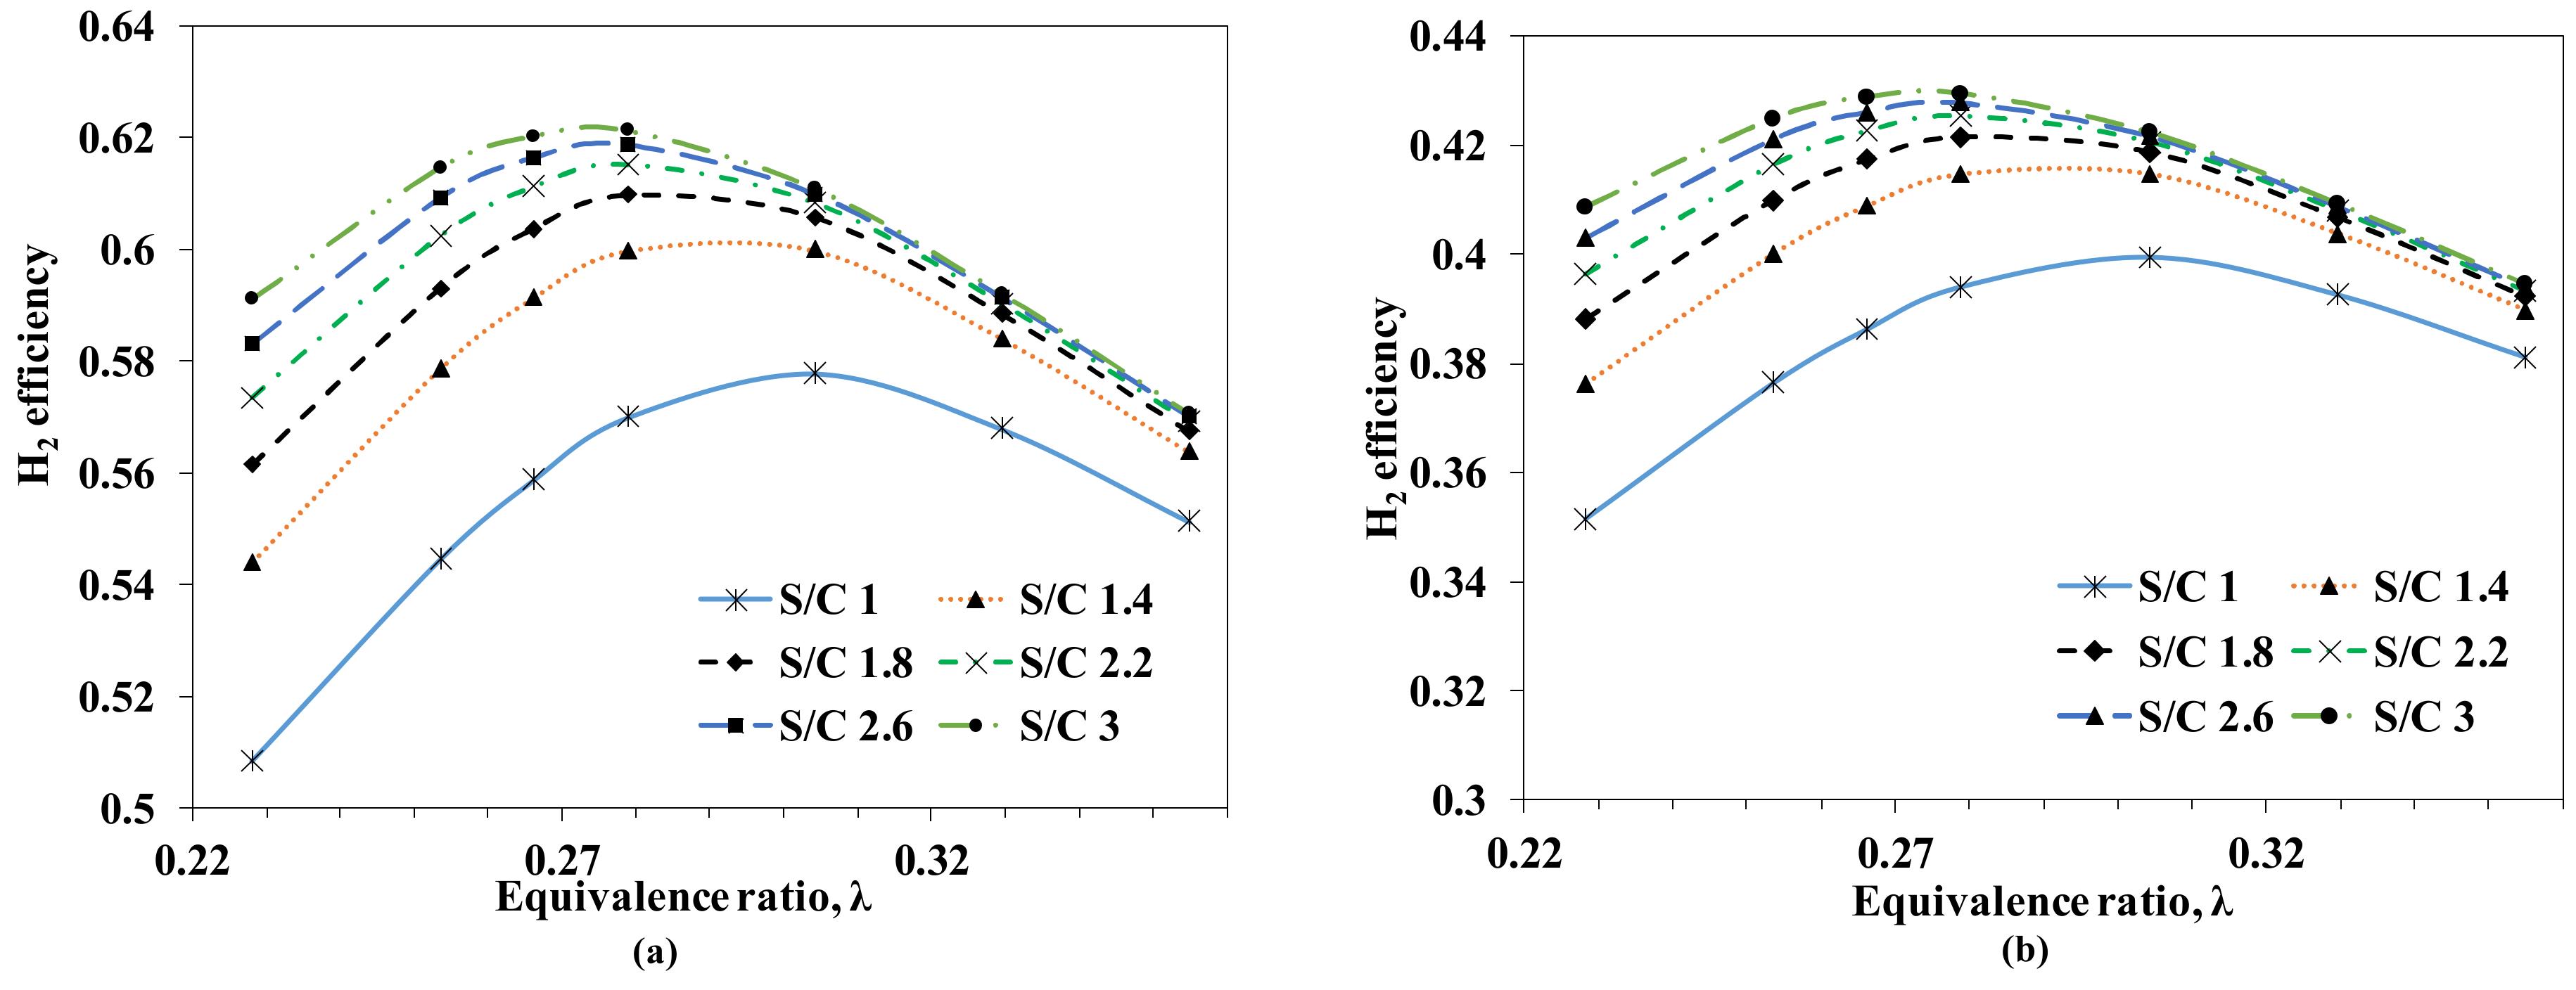
Hydrogen (Thermal) Efficiency

One parameter used to evaluate reforming processes is the hydrogen (or thermal) efficiency (Equations (5) and (6)). Figure 6 shows the effect of varying steam and air at the ATR on the plant’s hydrogen efficiency using PEFB biomass and bio-oil as starting fuels to the plant and ATR process, respectively. Overall, the hydrogen efficiency increases with increase in S/C ratio. This increase is expected as more hydrogen is produced via the WGS and steam reforming reactions. Varying the equivalence ratio has first a positive and later a negative effect on the hydrogen efficiency as λ increases for a given S/C. λopt is the optimum equivalence ratio occurring for a given S/C and corresponds to both maximum hydrogen efficiency and hydrogen yield. The value for λopt reduces as more steam is added, dropping from 0.31 to 0.27 as the S/C increases from 1 to 3. Being an adiabatic process, a minimum amount of energy is required to obtain equilibrium reforming products. This energy comes from the partial oxidation of the bio-oil, which is favoured as more oxygen is added to the reformer. The reformer eventually gets to the point (beyond λopt) where the addition of oxygen favours the production of CO2 and H2O over that of CO and H2 [43].
For S/C greater than 2.2, the maximum efficiency obtained is almost constant irrespective of the λ used. This therefore eliminates the need to use higher S/C ratios, with 2.2 selected in this case as optimum.
Considering the 75% H2 recovery for the base case PAPS process, the maximum hydrogen efficiencies obtained are 62% (Equation (6)) and 43% (Equation (5)) with respect to using bio-oil and biomass as feedstocks. The hydrogen efficiency calculated using PEFB biomass feedstock is quite low because the lower heating value (LHV) of char and of the non-condensable gases (NCG) obtained during pyrolysis are not included in the calculation since these two products do not directly contribute to hydrogen yield and are used instead as fired heat exchanger fuel. Martin and Wörner [43] obtained maximum hydrogen efficiencies of 85.6% and 84.6% for their simulation of an ATR process using biodiesel and bioethanol, respectively, as feedstock.

3.1.2. Overall Process Plant Efficiency

The overall process efficiency is determined for a heat integrated plant designed using pinch analysis. The mass and energy balances for the base case examined are given in Figure 7. Pre-treatment and combustion occur at 1 bar while ATR and CO-shift are carried out at 3 bar and hydrogen separation occurs at 10 bar. ATR is carried out with a S/C of 2.2 and λ of 0.28 (corresponding to 110% of the amount of air need for stoichiometric POX). To facilitate heat recovery and generate electricity, the hot air stream used for biomass drying in the initial non-optimised heat-integrated PAPS process in Figure 2 is replaced with water that becomes superheated as it cools other hot streams. The hot and cold composite curves for the heat integrated design are shown in Figure 8. These composite curves are constructed by adding the corresponding enthalpy changes of hot and cold process streams for a given temperature interval [44]. The pinch, which represents the region of closest approach between both curves, occurs at a hot stream temperature of 94 °C and cold stream temperature of 74 °C for the base case examined.
The pinch effectively divides the system into two distinct regions: the region above the pinch acts as a heat sink while the region below the pinch acts like a cold sink. For minimum utilities (heating/cooling duties), the only admissible heat transfer above the pinch should be heat flowing in from the hot utility (no cooling). Below the pinch the opposite is true with the only admissible heat transfer being heat flowing out to the cold utility (no heating) [44]. No heat can flow across the pinch.
The composite curve in Figure 8 imposes heating and cooling duty targets of 0.023 and 0.939 MW, respectively, for maximum heat exchange corresponding to a recoverable value of 11.38 MW. A combined heat and power (CHP) unit equipped with a backpressure turbine (BPT) was incorporated in the design to recover work and heat from the superheated steam generated by the process. The heat integrated process with CHP using a backpressure turbine is referred to here as the PAPS-BT process and is shown in Figure 9. The fuel side of the boiler forming part of CHP unit consists of the combustor (block COMBUST) while the steam side consists of the heat exchanger HX9. HX9 has three separate sections, HX9-E, HX9-V, and EX9-S (not shown). Hot water leaving heat exchanger HX5 (stream DH2O-3) enters the first section, HX9-E called the economiser where it is heated to just below its boiling point. This then flows to the second section, HX9-V called the vaporiser where the hot water is completely vaporised to a saturated vapour.
The saturated vapour then moves into the third section, HX9-S called the superheater where it is brought to the desired temperature, 400 °C in this case. The input water stream DH2O-1 enters the process at an initial pressure and temperature of 40 bar and 20 °C. The heating and cooling duties for the PAPS-BT process shown in Figure 9 are 127 and 1448 kW with a corresponding heat recovery 11.38 MW. The heat exchange network proposed therefore represents complete heat recovery but comes at the cost of requiring more heating and cooling than the target values suggested by the composite curves.
The superheated steam produced at 40 bar and 400 °C (stream DH2O-4) is sent into a backpressure turbine (block BPT) operating with a specific steam consumption of 6.9 kg/kW-h (corresponding to an efficiency of 0.9) and exits essentially as a saturated vapour at 3 bar and 133.5 °C (with a quality of 0.99). The work generated by the BPT, W ˙ P B , is determined to be 988 kW which is obtained by substituting the following values into Equation (7): m ˙ T = 7571.3   kg / h , S T = 6.9   kg/kW-h and η T = 0.9 . The turbine exhaust is sent to the dryer and leaves as a saturated liquid–vapour mixture at 133.5 °C and 3 bar with a quality of 0.58. Cooling this stream further to subcooled water at 120 °C and 3 bar yields an additional 2.76 MW which can be used both for process and district heating.
The energy demands for the principal process operations for the PAPS-BT process are listed in Table 6. The overall process efficiency for this process is then calculated to be 62.3% obtained by substituting the following values into Equation (8): m ˙ H 2 = 200.5   kg / h , W ˙ = 0.988   MW , Q ˙ + = 2.63   MW , E ˙ = 0.821   MW , P ˙ + = 0.167   MW , m ˙ PEFB ×   LHV PEFB = 15.3   MW , thus making the plant a poly-generation process with hydrogen, heat and power net productions.
This shows a marked improvement when compared to the overall efficiency of the initial PAPS process of 39.4% (Figure 2). The low efficiency of the simpler PAPS process is due to the high electrical demand needed to move the large air flow required to dry the PEFB at 101 °C (110,000 kg/h) and the additional heating necessary to increase the temperature of the steam and PSA off gas to their required temperatures (heaters H1 and H3). The most significant loss of energy for the PAPS process stems from the fact that little heat is recovered from the dryer exhaust air that exits at 150 °C. In the PAPS-BT process, exhaust steam from the dryer is cooled to recover 2.76 MW of energy, which represents about twice the value required for drying. The relatively high process efficiency of the PAPS-BT process relies on the effective use of this energy, which in most cases cannot be guaranteed, as it depends on locating the hydrogen production plant next to another plant that requires low temperature heating (less than 120 °C). However, an excellent example of such an adjacent plant would be that of an oil palm mill, thus also minimising transport and storage costs and environmental impacts of the PEFB waste.

3.2. Model Sensitivity Analyses

3.2.1. Pyrolysis Product Distribution
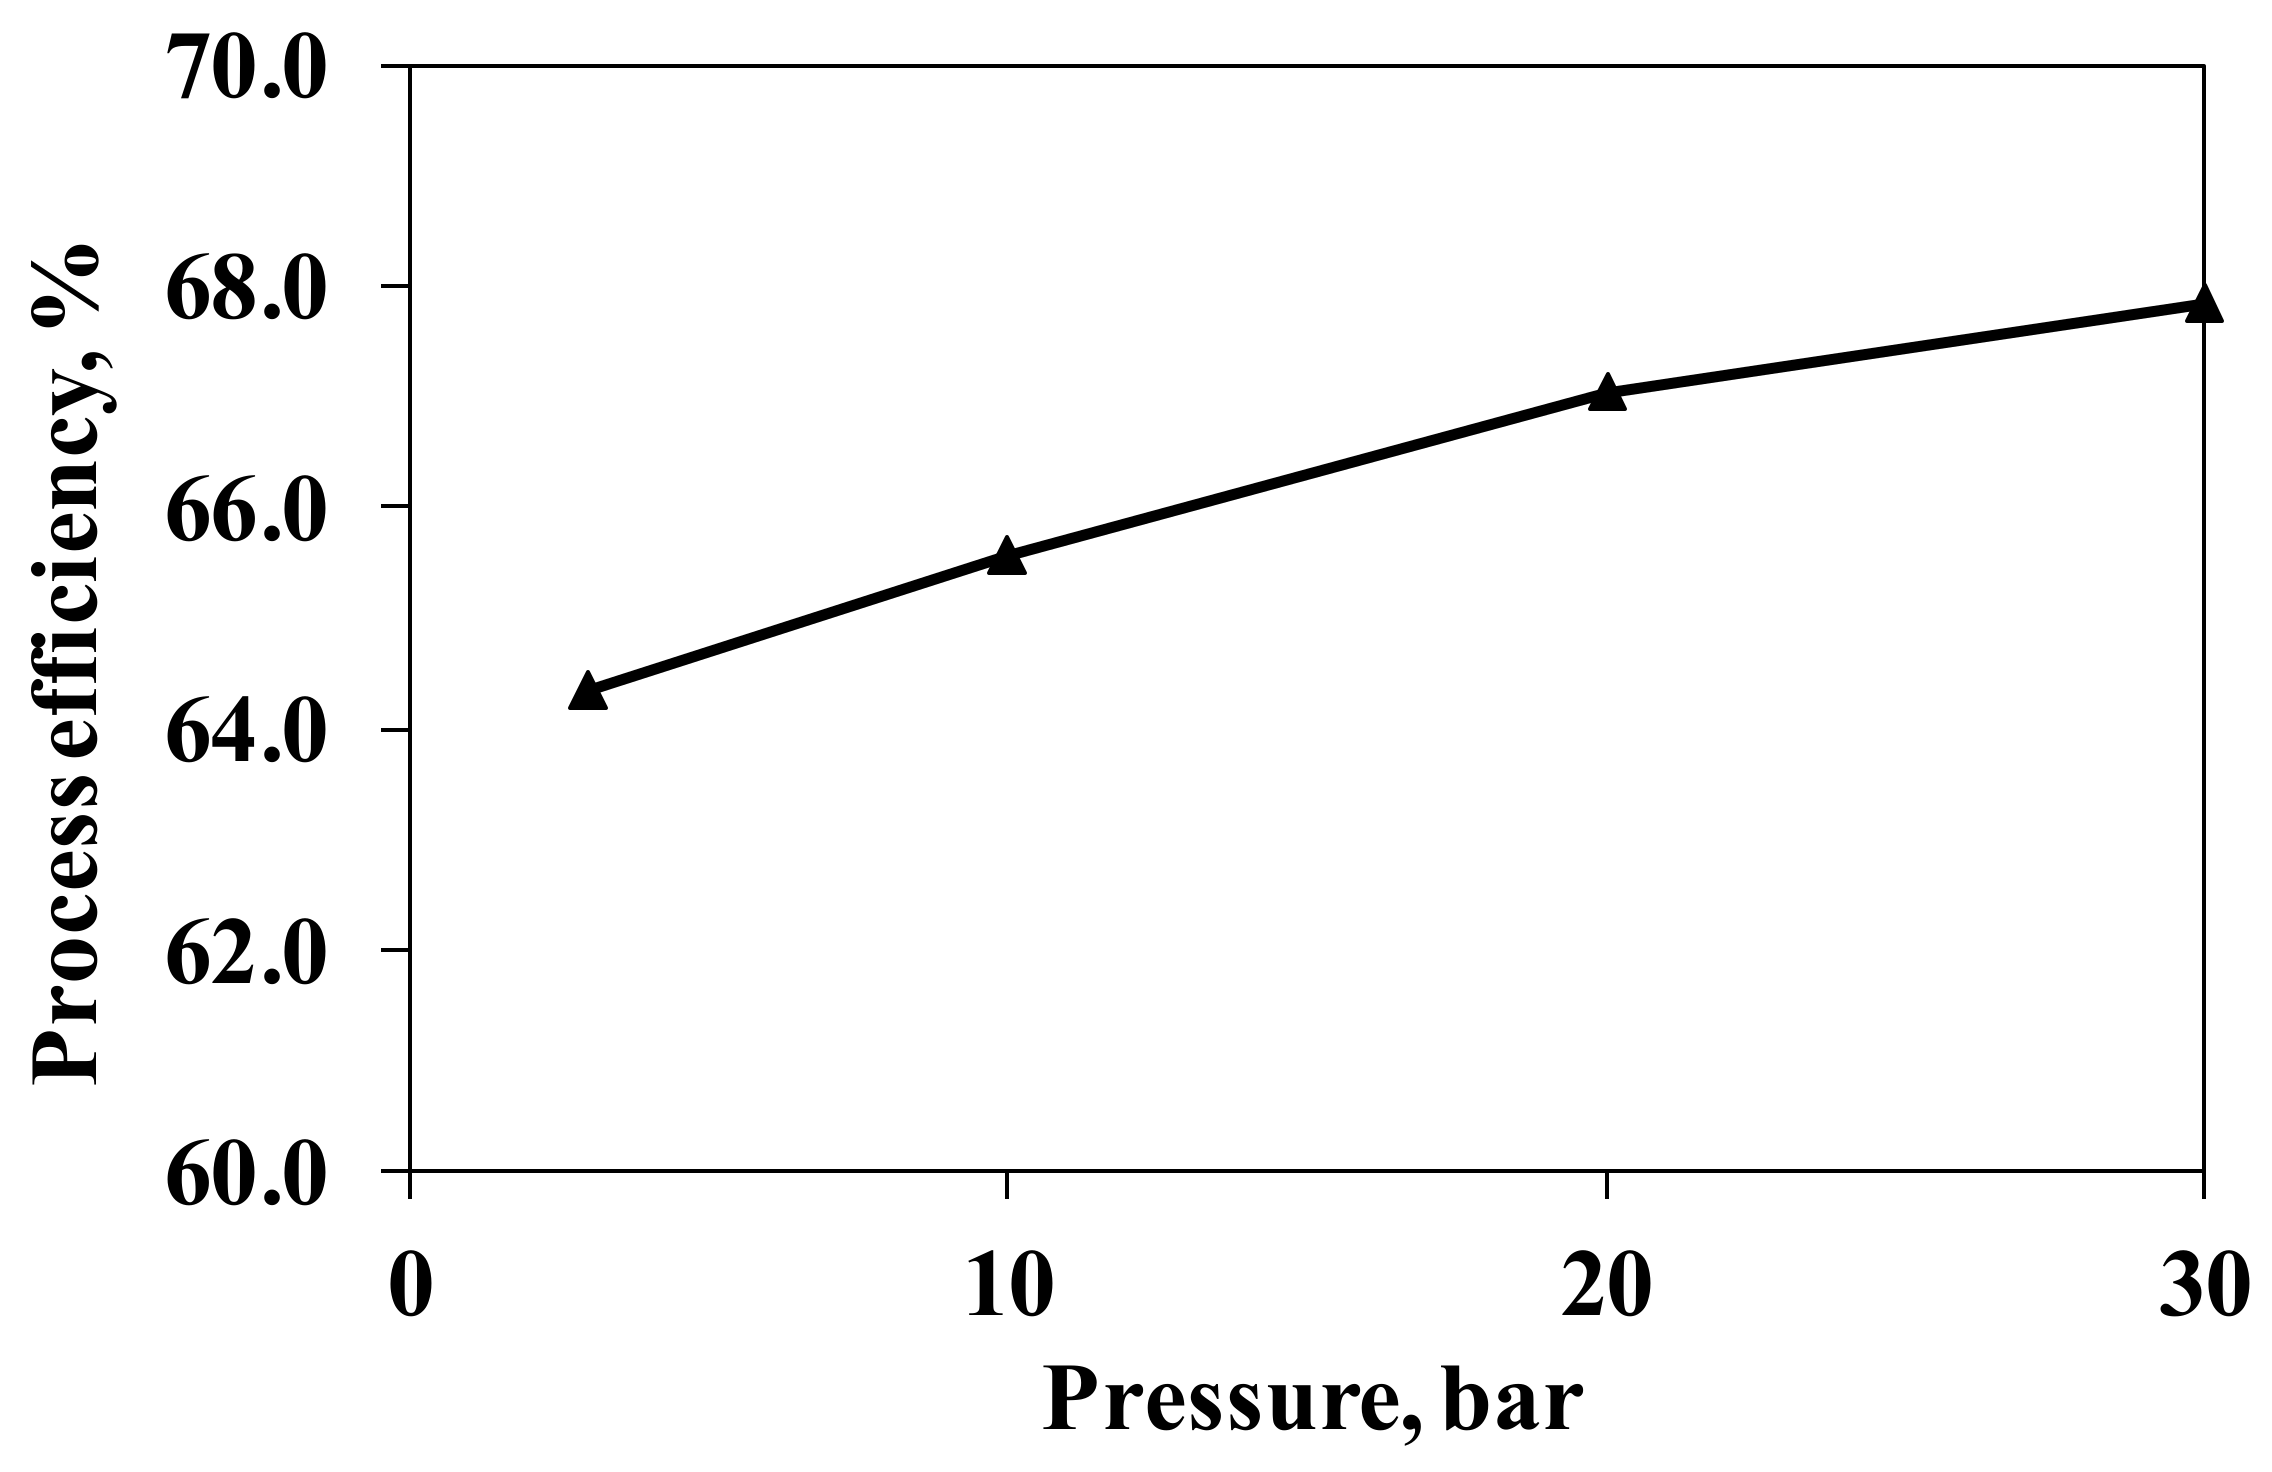
For the base case, the biomass-to-bio-oil conversion efficiency based on LHV is 71.2% (for a 70 wt.% yield in bio-oil compounds at the pyrolysis unit, with LHVs of 11 and 16.6 MJ/kg for the wet biomass and bio-oil, respectively). Demirbas [47] suggested that the conversion of biomass to bio-oil can have efficiencies up to 70%. This value for biomass-to-bio-oil conversion affects the hydrogen efficiency of the process (hydrogen yield), the thermal load/output and the electrical load/output.
The effect of the plant working with different pyrolysis yields across the gaseous, liquid and char products on these factors was examined here by setting five realistic cases representative of less-to-more performant fast pyrolysis processes (including the base case). Table 7 shows the different cases examined for pyrolysis product distribution. The cases are numbered from 1 to 5 in order of increasing bio-oil (pyrolysis liquid) yield. This numbering ultimately corresponds to plant hydrogen yield; with 1 being low and 5 the maximum possible for the plant configuration examined. Figure 10a shows the influence of the various bio-oil pyrolysis yields studied on the process efficiency. The process efficiency increases slightly as we move from case 1 to 4 with the value for case 5 being almost equal to that of case 3. This overall increase in efficiency coincides with the increase in bio-oil fraction in the pyrolysis product.
As shown in Figure 10b, the PAPS-BT process can theoretically satisfy its electrical demand (E) by using the power generated by the turbine (W). This is accompanied by a large thermal production (H) that can be exported for all the pyrolysis cases examined. As expected, the available heat (H) and work (W) produced by the turbine reduce as the bio-oil yield increases from case 1 to 5 since less char is burnt in the combustor. At the same time, the amount of electricity consumed by the process is shown to be independent of the bio-oil yield. Care must be taken in selecting what will be considered the ‘ideal’ pyrolysis yield. A very high bio-oil yield may lead to dependence on grid electricity, W < E, and less exported heat, H. On the other hand, a lower bio-oil yield guarantees plant power independence (W>E) and the possibility of electrical exportation (e.g., to the national grid or a local mini-grid, if any), together with the excess heat for process and district heating. It is therefore imperative for the PAPS-BT plant be situated near a process or community that can fully utilise the hot stream produced at 120 °C.

3.2.2. Pressure

The effect of pressure on the overall process efficiency was determined for the PAPS-BT process. The pressure change was only applied to the reforming and hydrogen separation sections of the plant. Figure 11 shows the influence on overall process efficiency as pressure is increased from the base case, 3 bar, to 10, 20 and 30 bar. In all, process efficiency grew with increase in pressure mainly due to enhanced output of the CHP unit and improved performance of the PSA unit at higher pressures leading to better H2 recovery. The increase in heat and power output is achieved as heat is recovered by cooling the reforming air and water as they are compressed and pumped, respectively, to higher pressures.
The increment in efficiency as pressure is increased to 20 and 30 bar is mostly attributed to the improved performance of the PSA, with 85% and 90% hydrogen recovery, respectively.

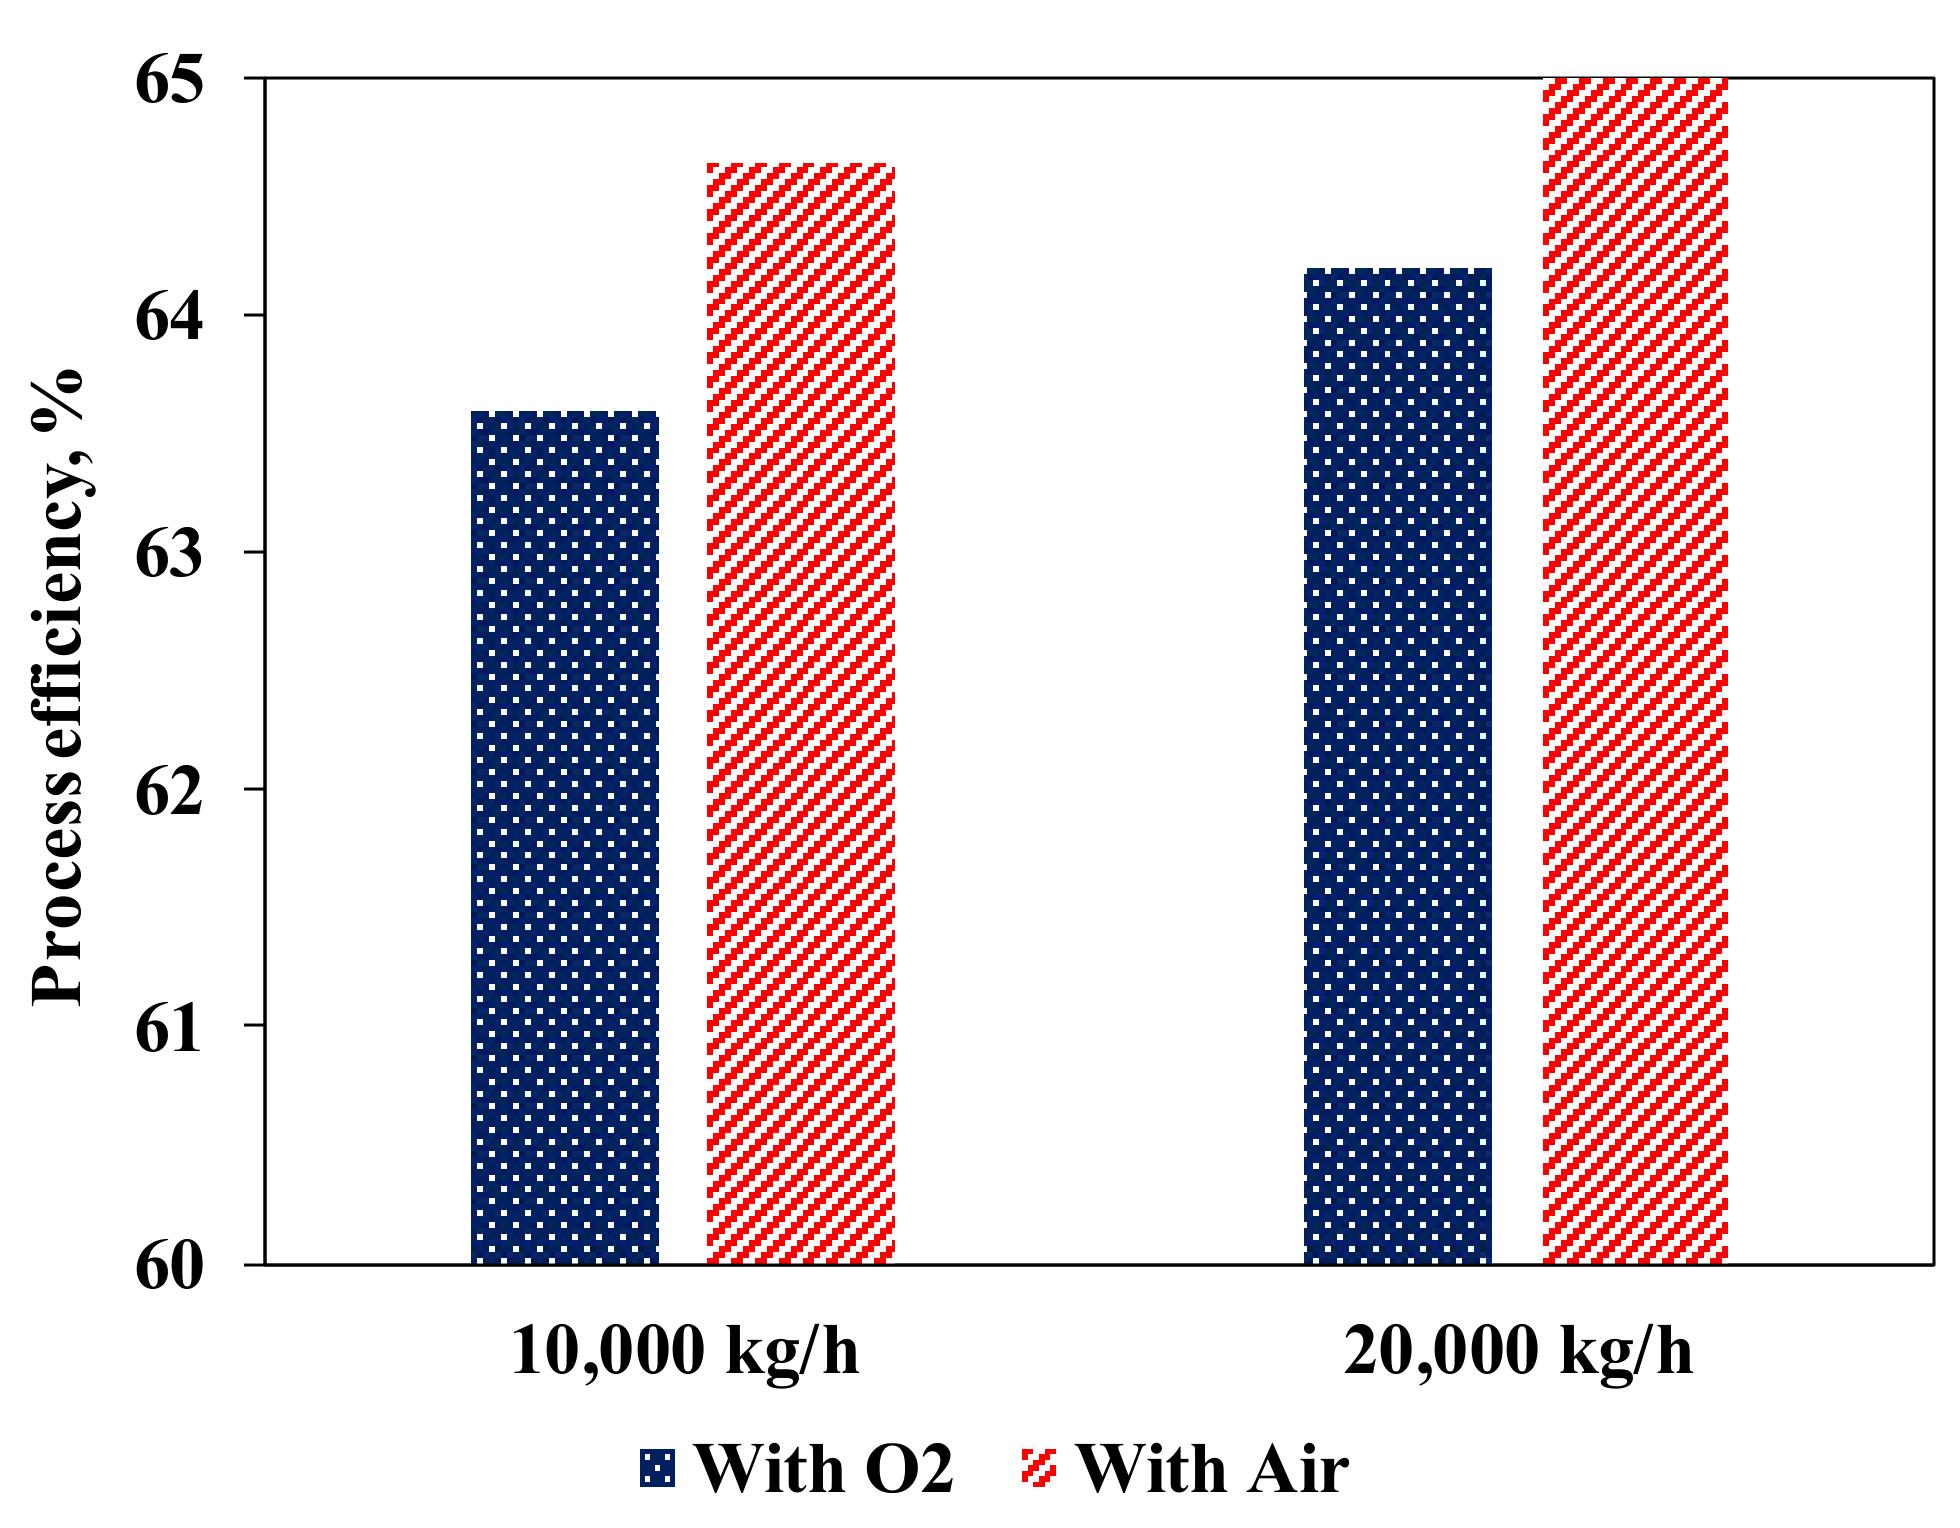
3.2.3. Oxygen Feed to ATR from an Air Separation Unit (ASU)

Even though air can be used directly in ATR processes as a source for oxygen, the presence of nitrogen in air feed reduces fuel conversion and increases the size and cost of the reactor and other downstream equipment such as heat exchangers and separation units [48]. The use of pure oxygen or oxygen rich gas (>90 vol%), obtained from an air separation unit (ASU) allows the process to deal with less volume of gas for compression but this comes with an accompanying energy and capital cost. The influence of using oxygen produced from an on-site ASU on the process efficiency was investigated for a 10,000 and 20,000 kg/h PEFB biomass throughput PAPS-BT process. The ATR oxygen demand for both processes is calculated to be 1709 kg/h (41.0 ton per day or ‘TPD’) and 3418 kg/h (82 TPD), respectively. Considering both values correspond to production from a mid-size ASU (less than 100 TPD), the energy cost of producing oxygen by either a cryogenic or non-cryogenic process will be almost the same with a slight advantage for non-cryogenic process [49]. The additional power consumed by the ASU is calculated for each process and added to the value of E ˙ . A stand-alone ASU with a power consumption of 500 kWh/t O2 was assumed in this case. Katikaneni et al. [50] assumed a power consumption of 450 kWh/t O2 for a 1000 kg/h hydrogen producing plant using a PSA based ASU for POX of various transport fuels (heavy naphtha, kerosene, and diesel). A comparison of the process efficiencies of the air-based processes with oxygen-based ones for the two PEFB biomass flows mentioned is presented in Figure 12. There is a decrease in overall process efficiency associated with the switch from air to O2 from an ASU. This is mainly due to the increased power consumption associated with the ASU.
The efficiency for the 10,000 kg/h process drops from 64.6 to 63.6% with the switch from air to oxygen while for the 20,000 kg/h plant, it drops from 65.0 to 64.2%. The approximate 1% drop in efficiency witnessed in both cases must be weighed with the capital investment of installing an ASU versus the cost of having larger reactors and auxiliary equipment when air is used.

3.3. CO2 Emission Savings

A benefit of using PEFB as feedstock for hydrogen production is its reduced level of CO2 emissions in comparison with the steam reforming of fossil fuels. To estimate the CO2 savings and environmental impact advantage gained by using PEFB biomass as a source of hydrogen, a simple approach is adopted in which the effect on the environment of producing an equivalent amount of hydrogen by steam reforming (SR) of natural gas (simplified as pure methane) as feedstock is considered. It is also assumed that any net electrical power or heat generated by the PEFB based processes could have been produced by one using methane (as simplified representative of natural gas) as energy source and an equivalence is determined based on current energy conversion efficiencies. The CO2 emission savings then correspond to that eliminated by substituting a fossil, methane in this case, with biomass as feedstock for the hydrogen production. The net CO2 emission for biomass-based processes is very low, almost zero. For plant capacities of 5 and 20 ton/h, the biogenic CO2 emissions were 2.73 and 11.78 ton/h. These values are obtained based on a rate of CO2 emissions of 9.5 kg CO2/kg of H2 for a conventional SR [51,52]; CO2 emissions for net electricity generation/consumption is taken as 149.9 g/MJ for a thermal plant operating at 40% efficiency [53]; heat exported as steam is assumed to be generated by a natural gas fired boiler operating at 75% efficiency and corresponds to 58.3 g CO2/MJ of natural gas.
To put this value in perspective, a 20,000 kg/h PEFB plant operating for 1 year (300 days) provides fossil CO2 emission savings of 85,000 tonnes while producing 5,774,400 kg of H2 (70 million Nm3/year). This value for H2 production represents only 0.01% of the estimated global value of 667 billion m3/year [54]. To have any real global impact in reducing the CO2 emissions, the number of biomass-based hydrogen producing plants of similar throughputs would need to increase to between 100 and 1000 to raise its share in hydrogen production to between 1 and 10 % if current production levels remain constant.

3.4. Experiments of Bio-Oil ATR

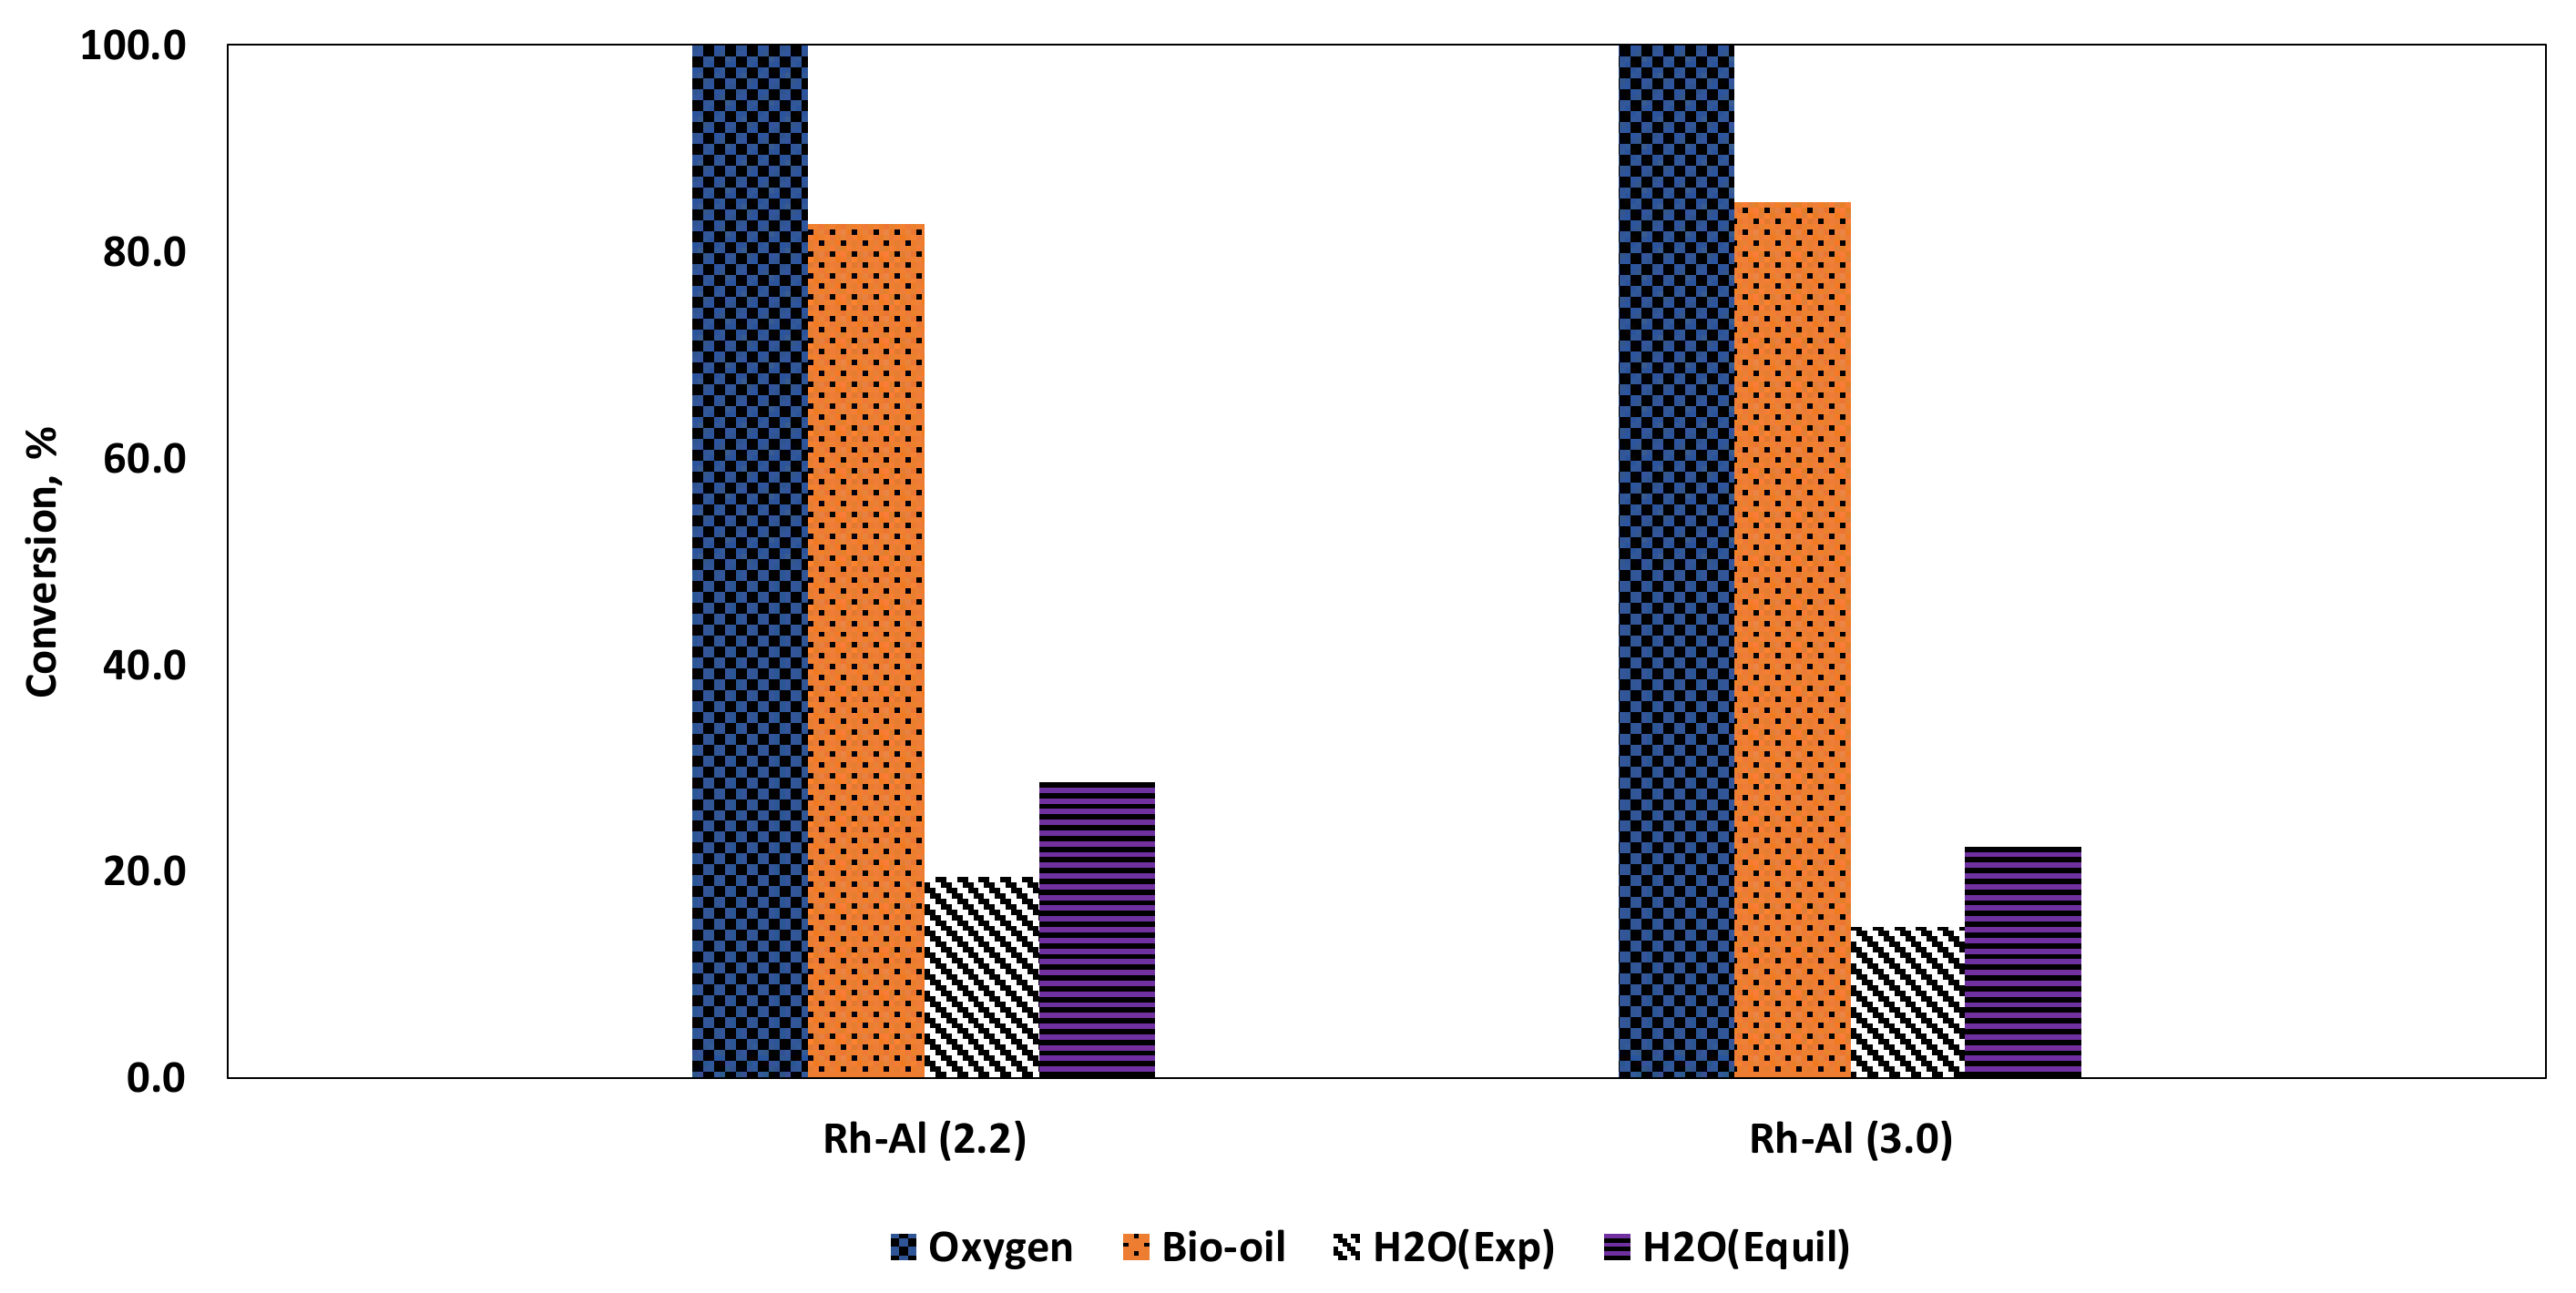
3.4.1. Feed Flows Conversion

The equilibrium plot for ATR carried out for S/C = 2.2 is shown in Figure 13. Maximum H2 equilibrium yield is obtained at λ = 0.318 on moisture free basis (or 0.233 on whole bio-oil basis) at an adiabatic temperature of 593 °C. A similar plot for S/C = 3 gives a maximum hydrogen production at λ = 0.391 (not shown).
Figure 14 depicts the bio-oil, oxygen and water conversions obtained. The bio-oil conversion was 84 and 87% at S/C ratios 2.2 and 3 while the water conversion was 70 and 65% of the equilibrium value for S/C ratios of 2.2 and 3, respectively. One major reason accounting for the overall low bio-oil conversion was the formation of carbon deposits on the reactor wall. This was mainly because some bio-oil fractions decomposed and polymerised even under mild heating conditions and most components have different vaporisation temperatures [55]. This remained a critical challenge in using bio-oil as feedstock for bioenergy production. Creative measures in feed supply and distribution to a fixed bed reactor will certainly be required for this problem to be averted. Another approach to improve bio-oil feed distribution is to use a fluidised bed reactor instead since it will improve homogenous mixing and heat distribution amongst the various bio-oil components.

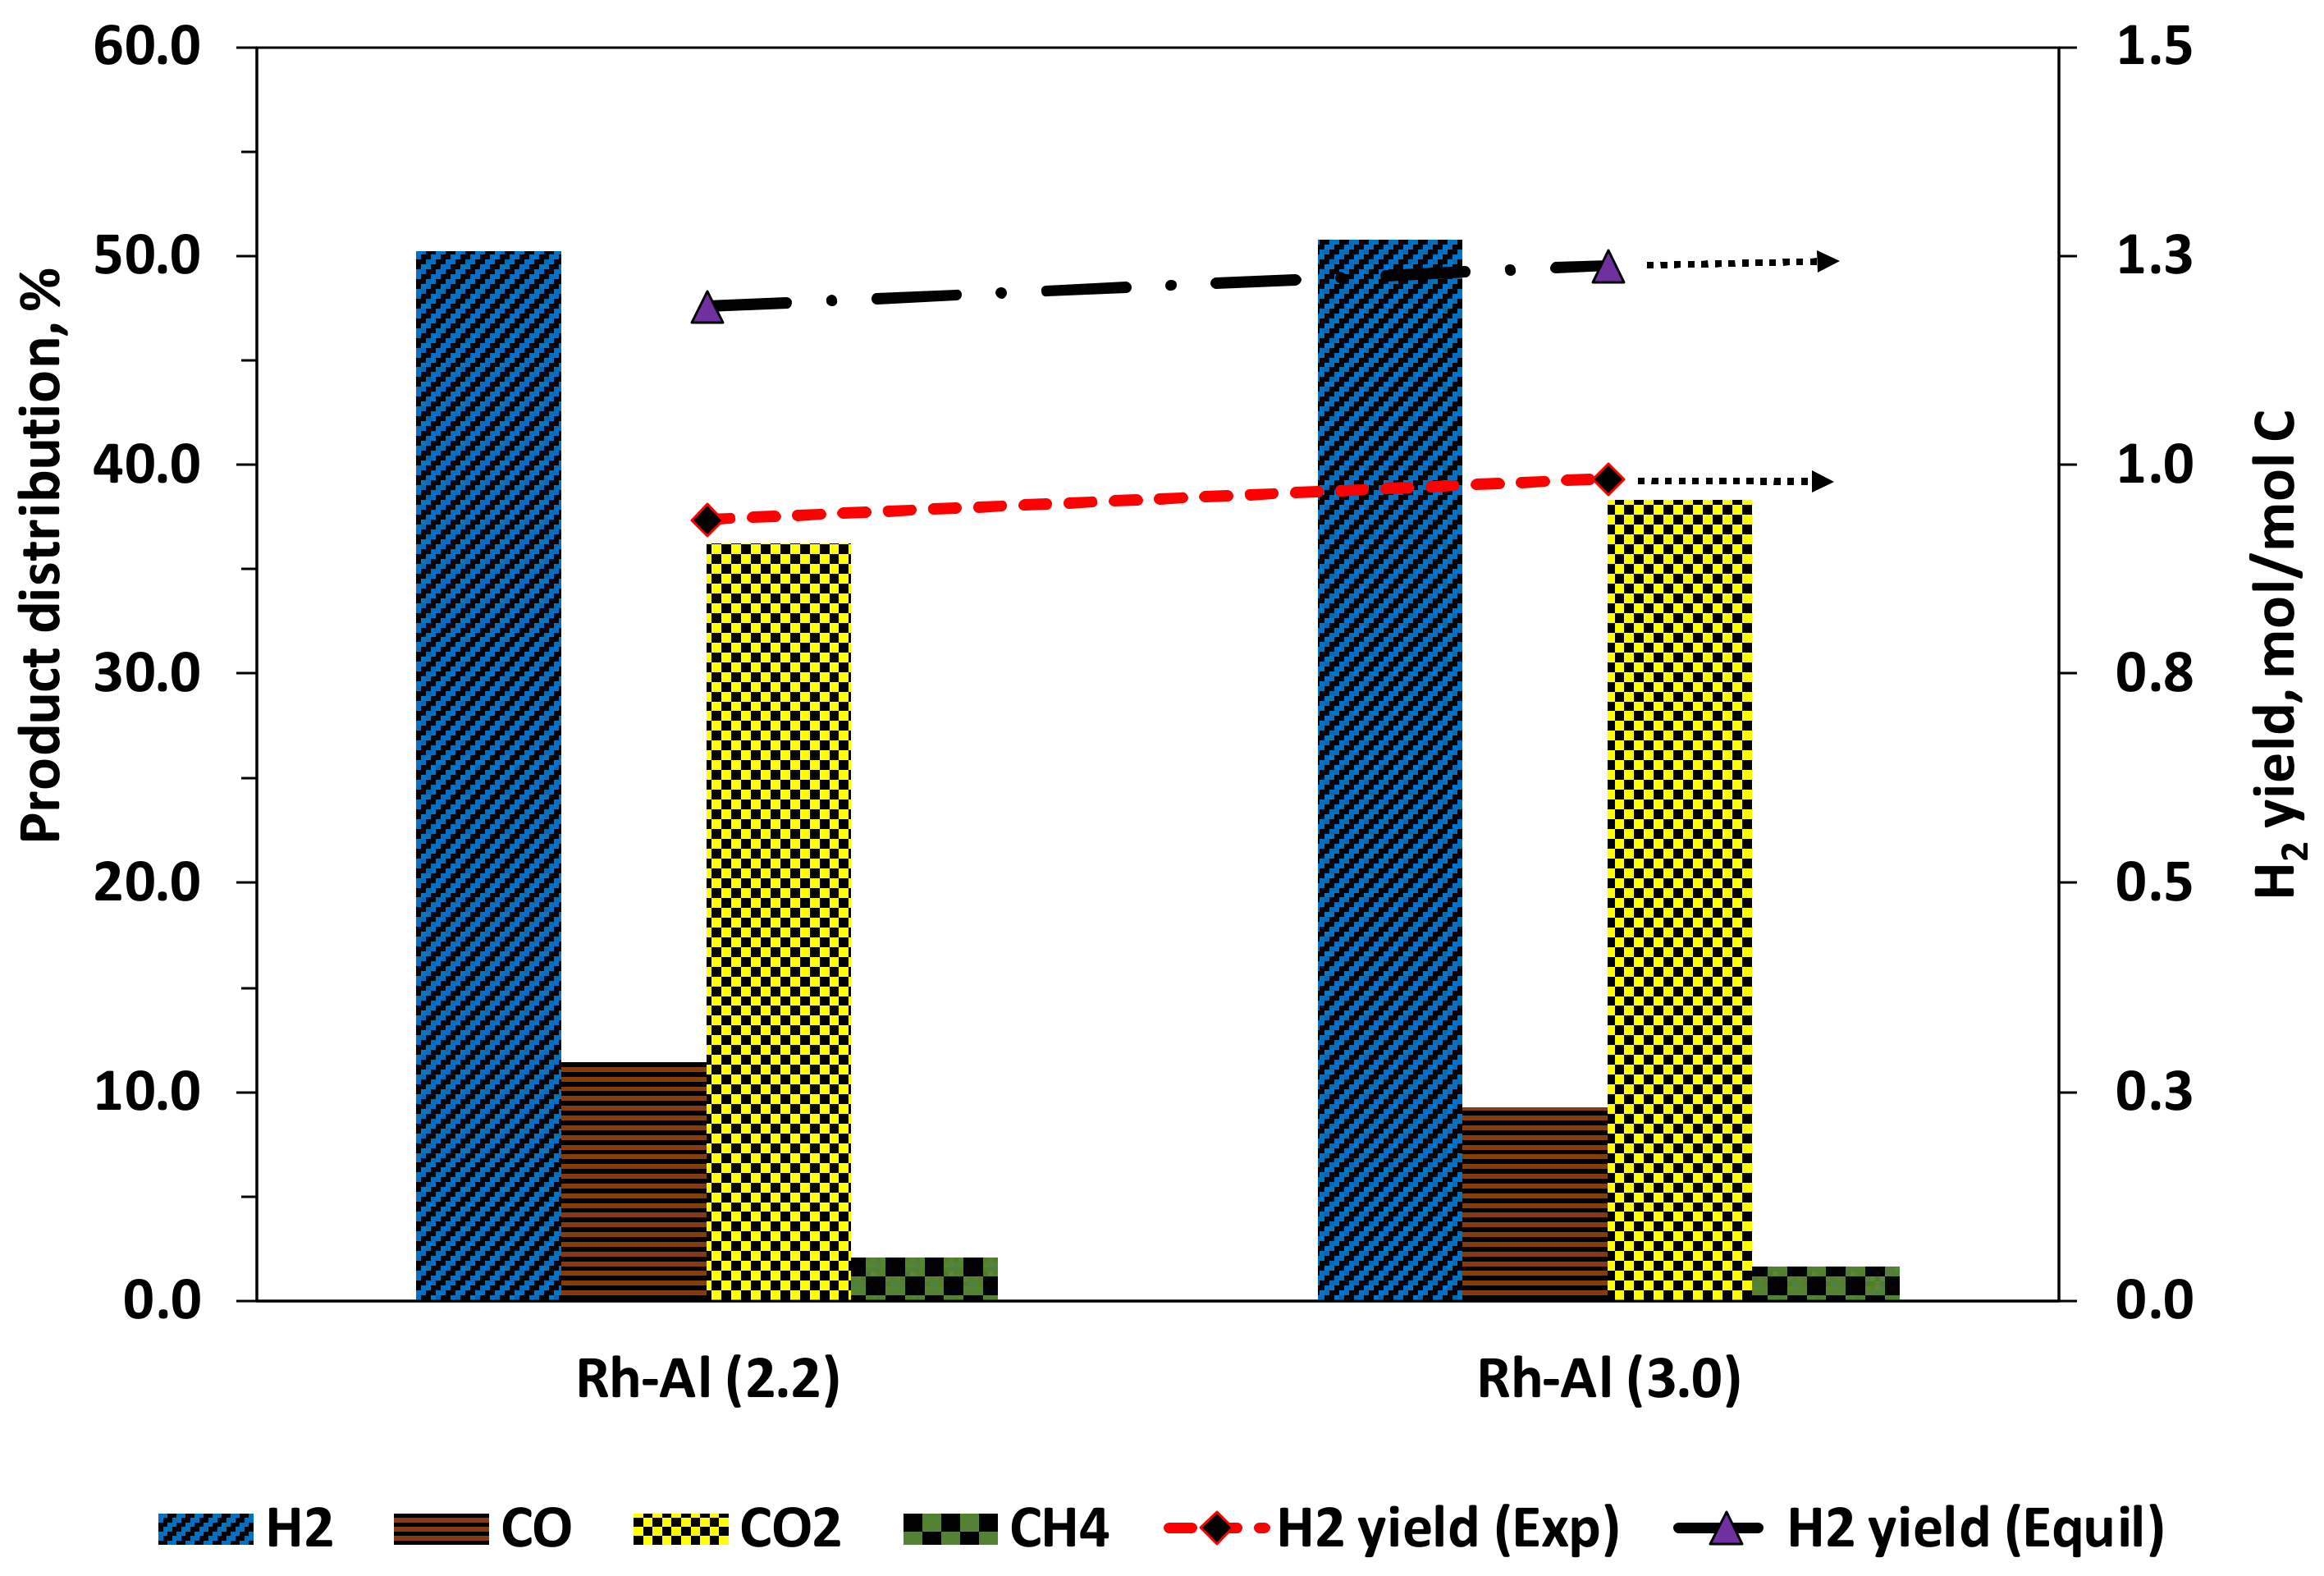
3.4.2. Product Distribution and Selectivity

The product distribution and hydrogen yield obtained during bio-oil ATR experiments is shown in Figure 15. Hydrogen yield (expressed as mol H2/mol C in feed) was about 80% of the equilibrium value for the different conditions shown in the figure. No C2 or C3 gases were detected, confirming the high activity and selectivity of the Rh based catalyst in forming equilibrium products. Other researchers have reported a similar behaviour for Rh based catalysts in SR, POX and ATR experiments. Aupretre et al. [56] obtained only C1 gases (CO, CO2 and CH4) during the SR of ethanol using 1%Rh/Al2O3 catalyst at the stoichiometric S/C ratio of 1.5, 700 °C and 1 atm. They obtained 0.5% ethane (dry gas mixture) when the reaction temperature was reduced to 600 °C. Cavallaro et al. [57] detected acetaldehyde together with C1 gases in the ATR of ethanol at 650 °C only for O/C < 0.62 mol/mol with a 5% Rh/Al2O3 catalyst.
Increasing the S/C resulted in an increase in H2 selectivity as expected. However, working at the lower temperature imposed by the higher S/C resulted in a higher carbon formation on the catalyst of 71.6 mg/g(cat).h (see Table 8). The increase in S/C ratio from 2.2 to 3 did not yield a proportional increase in H2 selectivity as the H2/CO ratio obtained was 50% less than the expected equilibrium value. Comparatively the H2/CO ratio for the S/C 2.2 was only 25% lower than the equilibrium value. These two observations confirm that working at S/C less than 3 would be optimal for an ATR of bio-oil process as determined in the modelling study.

3.4.3. Optimisation of Bio-Oil Conversion by Increased Air Feed

To increase the bio-oil conversion to gases and possibly the H2 yield, the amount of air used during the ATR experiment was increased by 10% and 15% above the optimal value determined in the thermodynamic equilibrium calculations. The bio-oil and water conversions together with product distribution are presented in Table 9. The bio-oil surrogate conversion increased with increase in air flow. This increase in conversion, in excess of 95% for the 15% air feed increase from the equilibrium optimum is attributed to increase in volatilisation and eventual decomposition of high molecular weight bio-oil fractions at the higher temperatures used. The negative effect of increasing the air flow is the resulting decrease in H2 production represented by the lower fraction in syngas composition on Table 9. The additional oxygen in air reacts with H2 and CO to produce water and CO2 (cf. 2.3.1). The increase in bio-oil conversion, however, did counter the decrease in H2 production in some cases at higher air flow. To investigate this, the hydrogen yield was calculated as a fraction of input carbon (mol of H/mol of C). Thus, for S/C 3, a 10% increase in air, corresponding to λ of 0.368, resulted in the highest hydrogen yield of 1.02 moles per mol of carbon in the feed (see Table 9).
This therefore means the choices between the S/C, air flow and reactor type are optimisation challenges which merit to be investigated further. Based on this preliminary experimental result, it is reasonable to conclude that conditions close to the equilibrium assumed in the Aspen Plus process design are achievable in a properly designed and operated ATR reactor.

4. Conclusions

Process design and simulation in Aspen were used to establish the feasibility of producing H2 from an agro-industrial waste of high lignocellulosic and moisture content such as wet palm empty fruit bunch (PEFB). The process design included for the first time the coupling of fast pyrolysis of the PEFB to produce bio-oil as the main product, and autothermal reforming of this bio-oil to obtain a syngas which was then CO-shifted and separated to give pure H2. Initial sensitivity analysis on process factors was performed on a process that featured pressure swing adsorption as H2 purification step, and this indicated that the maximum molar feed steam to carbon ratio to use should be between 2 and 3 for any optimal design. Maximum hydrogen efficiencies of 43% and 62% were obtained from wet PEFB and bio-oil, respectively, at 3 bar. A backpressure turbine and heat integration were considered in a bid to increase energy recovery and process efficiency. Overall plant efficiency for the heat integrated process increased to 62.3%, from the base case’s 39.3%. Experimental ATR studies in a packed bed reactor were performed using a 1 wt% Rh/γ-Al2O3 catalyst using the surrogate bio-oil and optimum S/C and λ determined by the equilibrium model. Bio-oil conversion was about 80% and could be increased to 95% at slightly higher air flow. Syngas product distribution obtained was close to equilibrium concentration. Higher H2 yield was obtained at S/C of 3 but the value was below the equilibrium value compared to that corresponding to the optimum S/C of 2.2.
The proposed design and accompanying experimental studies together make a strong case of poly-generation of H2, heat, and power from an otherwise discarded agricultural waste. This is a robust example of value addition to a major agro-industrial sector with the possibility of competing with fossil-based processes.

Author Contributions

Conceptualisation, L.N.T. and V.D.; methodology, L.N.T.; software, L.N.T.; formal analysis, L.N.T.; investigation, L.N.T.; writing—original draft preparation, L.N.T. and E.R.-M.; writing—review and editing, E.R.-M. and V.D.; supervision, V.D.; funding acquisition, V.D. All authors have read and agreed to the published version of the manuscript.

Funding

This research was funded by EPSRC, grant number EP/R030243/1.

Institutional Review Board Statement

Not applicable.

Informed Consent Statement

Not applicable.

Data Availability Statement

The data associated to the figures can be downloaded from https://doi.org/10.5518/1032.

Conflicts of Interest

The authors declare no conflict of interest.

References

  1. Kırtay, E. Recent advances in production of hydrogen from biomass. Energy Convers. Manag. 2011, 52, 1778–1789. [Google Scholar] [CrossRef]
  2. Balat, H.; Kırtay, E. Hydrogen from biomass—Present scenario and future prospects. Int. J. Hydrogen Energy 2010, 35, 7416–7426. [Google Scholar] [CrossRef]
  3. Demirbas, M.F. Biofuels from algae for sustainable development. Appl. Energy 2011, 88, 3473–3480. [Google Scholar] [CrossRef]
  4. Chattanathan, S.A.; Adhikari, S.; Abdoulmoumine, N. A review on current status of hydrogen production from bio-oil. Renew. Sustain. Energy Rev. 2012, 16, 2366–2372. [Google Scholar] [CrossRef]
  5. REN21. REN12 Renewables 2020 Global Status Report; REN21 Secretariat: Paris, France, 2020. [Google Scholar]
  6. Chang, A.C.; Chang, H.F.; Lin, F.J.; Lin, K.H.; Chen, C.H. Biomass gasification for hydrogen production. Int. J. Hydrogen Energy 2011, 36, 14252–14260. [Google Scholar] [CrossRef]
  7. Bridgwater, A.V.; Meier, D.; Radlein, D. An overview of fast pyrolysis of biomass. Org. Geochem. 1999, 30, 1479–1493. [Google Scholar] [CrossRef]
  8. Czernik, S.; Evans, R.; French, R. Hydrogen from biomass-production by steam reforming of biomass pyrolysis oil. Catal. Today 2007, 129, 265–268. [Google Scholar] [CrossRef]
  9. Martin, S.; Albrecht, F.G.; Van der Veer, P.; Lieftink, D.; Dietrich, R.U. Evaluation of on-site hydrogen generation via steam reforming of biodiesel: Process optimization and heat integration. Int. J. Hydrogen Energy 2016, 41, 6640–6652. [Google Scholar] [CrossRef]
  10. Holladay, J.D.; Hu, J.; King, D.I.; Wang, Y. An overview of hydrogen production technologies. Catal. Today 2009, 139, 244–260. [Google Scholar] [CrossRef]
  11. Tande, L.N.; Dupont, V. Autothermal reforming of palm empty fruit bunch bio-oil: Thermodynamic modelling. AIMS Energy 2016, 4, 68–92. [Google Scholar] [CrossRef]
  12. Arandia, A.; Remiro, A.; Oar-Arteta Gonzalez, L.; Bilbao, J.; Gayubo, A.G. Reaction conditions effect and pathways in the oxidative steam reforming of raw bio-oil on a Rh/CeO2-ZrO2 catalyst in a fluidized bed reactor. Int. J. Hydrogen Energy 2017, 42, 29175–29185. [Google Scholar] [CrossRef]
  13. Remiro, A.; Arandia, A.; Bilbao, J.; Gayubo, A.G. Comparison of Ni Based and Rh Based Catalyst Performance in the Oxidative Steam Reforming of Raw Bio-Oil. Energy Fuels 2017, 31, 7147–7156. [Google Scholar] [CrossRef]
  14. Acevedo-Paez, J.C.; Duran, J.M.; Posso, F.; Arenas, E. Hydrogen production from palm kernel shell: Kinetic modeling and simulation. Int. J. Hydrogen Energy 2020, 45, 25689–25697. [Google Scholar] [CrossRef]
  15. Ishaq, H.; Dincer, I. A new energy system based on biomass gasification for hydrogen and power production. Energy Rep. 2020, 6, 771–781. [Google Scholar] [CrossRef]
  16. Yun, H.A.H.; Ramirez-Solis, S.; Dupont, V. Bio-CH4 from palm empty fruit bunch via pyrolysis-direct methanation: Full plant model and experiments with bio-oil surrogate. J. Clean. Prod. 2020, 244, 118737. [Google Scholar] [CrossRef]
  17. Doherty, W.; Reynolds, A.; Kennedy, D. Computer simulation of a biomass gasification-solid oxide fuel cell power system using Aspen Plus. Energy 2010, 35, 4545–4555. [Google Scholar] [CrossRef] [Green Version]
  18. Dufour, A.; Authier, O.; Mauviel, G.; Corriou, J.P.; Verdier, G.; Abdelouahed, L. Detailed Modeling of Biomass Gasification in Dual Fluidized Bed Reactors under Aspen Plus. Energy Fuels 2012, 26, 3840–3855. [Google Scholar]
  19. Onarheim, K.; Solantausta, Y.; Lehto, J. Process Simulation Development of Fast Pyrolysis of Wood Using Aspen Plus. Energy Fuels 2015, 29, 205–217. [Google Scholar]
  20. Ward, J.; Rasul, M.G.; Bhuiya, M.M.K. Energy Recovery from Biomass by Fast Pyrolysis. Procedia Eng. 2014, 90, 669–674. [Google Scholar] [CrossRef] [Green Version]
  21. Doherty, W.; Reynolds, A.; Kennedy, D. Aspen Plus Simulation of Biomass Gasification in a Steam Blown Dual Fluidised Bed, Book Chapter in Materials and Processes for Energy: Communicating Current Research and Technological Developments; Méndez-Vilas, A., Ed.; Formatex Research Centre: Badajoz, Spain, 2013. [Google Scholar]
  22. Erlach, B.; Harder, B.; Tsatsaronis, G. Combined hydrothermal carbonization and gasification of biomass with carbon capture. Energy 2012, 45, 329–338. [Google Scholar] [CrossRef]
  23. Gautam, N.; Chaurasia, A. Study on kinetics and bio-oil production from rice husk, rice straw, bamboo, sugarcane bagasse and neem bark in a fixed-bed pyrolysis process. Energy 2020, 190, 116434. [Google Scholar] [CrossRef]
  24. Ighalo, J.O.; Adeniyi, A.G. Modelling of thermochemical energy recovery processes for switchgrass (Panicum virgatum). Indian Chem. Eng. 2020, 63, 240–251. [Google Scholar] [CrossRef]
  25. Mohammed, I.Y.; Abakr, Y.A.; Mokaya, R. Integrated biomass thermochemical conversion for clean energy production: Process design and economic analysis. J. Environ. Chem. Eng. 2019, 7, 103093. [Google Scholar] [CrossRef]
  26. Wang, X.Y.; Panahi, A.; Qi, H.X.; Zhai, M.; Dong, P.; Levendis, Y.A. Product Compositions from Sequential Biomass Pyrolysis and Gasification of Its Char Residue. J. Energy Eng. 2020, 146, 04020049. [Google Scholar] [CrossRef]
  27. Bridgwater, A.V. Review of fast pyrolysis of biomass and product upgrading. Biomass Bioenergy 2012, 38, 68–94. [Google Scholar] [CrossRef]
  28. Sarkar, S.; Kumar, A. Large-scale biohydrogen production from bio-oil. Bioresour. Technol. 2010, 101, 7350–7361. [Google Scholar] [CrossRef] [PubMed]
  29. Halvorsen, B.M.; Adhikari, U.; Eikeland, M.S. Gasification of Biomass for Production of Syngas for Biofuel. In Proceedings of the 56th Conference on Simulation and Modelling, Linköping, Sweden, 7–9 October 2015. [Google Scholar]
  30. Omar, R.; Idris, A.; Yunus, R.; Khalid, K.; Aida Isma, M.I. Characterization of empty fruit bunch for microwave-assisted pyrolysis. Fuel 2011, 90, 1536–1544. [Google Scholar] [CrossRef]
  31. Chang, S.H. An overview of empty fruit bunch from oil palm as feedstock for bio-oil production. Biomass Bioenergy 2014, 62, 174–181. [Google Scholar] [CrossRef]
  32. Abdullah, N.; Gerhauser, H. Bio-oil derived from empty fruit bunches. Fuel 2008, 87, 2606–2613. [Google Scholar] [CrossRef] [Green Version]
  33. Abdullah, N.; Sulaiman, F.; Gerhauser, H. Characterisation of Oil Palm Empty Fruit Bunches for Fuel Application. J. Phys. Sci. 2011, 22, 1–24. [Google Scholar]
  34. Khor, K.; Lim, K.; Zainal, Z. Characterization of bio-oil: A by-product from slow pyrolysis of oil palm empty fruit bunches. Am. J. Appl. Sci. 2009, 6, 1647–1652. [Google Scholar] [CrossRef] [Green Version]
  35. Dupont, V.; Yun, H.A.H.; White, R.; Tande, L.N. High methane conversion efficiency by low temperature steam reforming of bio-feedstock. In Proceedings of the REGATEC 2017 4th International Conference on renewable Energy gas Technology, Verona, Italy, 22–23 May 2017. [Google Scholar]
  36. Pimenidou, P.; Dupont, V. Characterisation of palm empty fruit bunch (PEFB) and pinewood bio-oils and kinetics of their thermal degradation. Bioresour. Technol. 2012, 109, 198–205. [Google Scholar] [CrossRef] [Green Version]
  37. Quaak, P.; Knoef, H.; Stassen, H. Energy from biomass: A review of combustion and gasification technologies. In Energy Series; Paper, W.B.T., Ed.; World Bank: Washington, DC, USA, 1999. [Google Scholar]
  38. Lind, F.; Heyne, S.; Johnson, F. What Is the Efficiency of a Biorefinery? 2012, pp. 59–71. Available online: https://publications.lib.chalmers.se/records/fulltext/local_162671.pdf (accessed on 26 July 2021).
  39. Martin, S.; Kraaij, G.; Ascher, T.; Wails, D.; Wörner, A. An experimental investigation of biodiesel steam reforming. Int. J. Hydrogen Energy 2015, 40, 95–105. [Google Scholar] [CrossRef] [Green Version]
  40. Rostrup-Nielsen, J.R.; Sehested, J.; Nørskov, J.K. Hydrogen and Synthesis Gas. by steam and CO2 reforming. Adv. Catal. 2002, 47, 65–139. [Google Scholar] [CrossRef]
  41. Aasberg-Petersen, K.; Dybkjær, I.; Ovesen, C.V.; Schjødt, N.C.; Sehested, J.; Thomsen, S.G. Natural gas to synthesis gas—Catalysts and catalytic processes. J. Nat. Gas Sci. Eng. 2011, 3, 423–459. [Google Scholar] [CrossRef]
  42. Wilhelm, D.J.; Simbeck, D.R.; Karp, A.D.; Dickenson, R.L. Syngas production for gas-to-liquids applications: Technologies, issues and outlook. Fuel Process. Technol. 2001, 71, 139–148. [Google Scholar] [CrossRef]
  43. Martin, S.; Wörner, A. On-board reforming of biodiesel and bioethanol for high temperature PEM fuel cells: Comparison of autothermal reforming and steam reforming. J. Power Sources 2011, 196, 3163–3171. [Google Scholar] [CrossRef]
  44. Kemp, I.C. Reducing Dryer Energy Use by Process Integration and Pinch Analysis. Dry. Technol. 2005, 23, 2089–2104. [Google Scholar] [CrossRef]
  45. Peryoga, Y.; Dewi Solikhah, M.; Agus Raksodewanto, A. Production Cost Assessment of Palm Empty Fruit Bunch Conversion to Bio-oil via Fast Pyrolysis. Int. J. Adv. Sci. Eng. Inf. 2014, 4, 6–12. [Google Scholar] [CrossRef] [Green Version]
  46. Spliethoff, H.; Hein, K.R.G. Effect of co-combustion of biomass on emissions in pulverized fuel furnaces. Fuel Process. Technol. 1998, 54, 189–205. [Google Scholar] [CrossRef]
  47. Demirbas, A. Biomass resource facilities and biomass conversion processing for fuels and chemicals. Energy Convers. Manag. 2001, 42, 1357–1378. [Google Scholar] [CrossRef]
  48. Lange, J.P. Methanol synthesis: A short review of technology improvements. Catal. Today 2001, 64, 3–8. [Google Scholar] [CrossRef]
  49. Banaszkiewicz, T.; Chorowski, M.; Gizicki, W. Comparative analysis of cryogenic and PTSA technologies for systems of oxygen production. AIP Conf. Proc. 2014, 1573, 1373–1378. [Google Scholar]
  50. Katikaneni, S.P.; Al-Muhaish, F.; Harale, A.; Pham, T.V. On-site hydrogen production from transportation fuels: An overview and techno-economic assessment. Int. J. Hydrogen Energy 2014, 39, 4331–4350. [Google Scholar] [CrossRef]
  51. Ewan, B.; Allen, R. A figure of merit assessment of the routes to hydrogen. Int. J. Hydrogen Energy 2005, 30, 809–819. [Google Scholar] [CrossRef]
  52. Spath, P.L.; Mann, M.K. Life cycle assessment of hydrogen production via natural gas steam reforming. In National Technical Information Service; National Renewable Energy Laboratory, Ed.; US Department of Energy: Golden, CO, USA, 2000. [Google Scholar]
  53. Granovskii, M.; Dincer, I.; Rosen, M. Greenhouse gas emissions reduction by use of wind and solar energies for hydrogen and electricity production: Economic factors. Int. J. Hydrogen Energy 2007, 32, 927–931. [Google Scholar] [CrossRef]
  54. Voldsund, M.; Jordal, K.; Anantharaman, R. Hydrogen production with CO2 capture. Int. J. Hydrogen Energy 2016, 41, 4969–4992. [Google Scholar] [CrossRef]
  55. Rioche, C.; Kulkarni, S.; Meunier, F.C.; Breen, J.P.; Burch, R. Steam reforming of model compounds and fast pyrolysis bio-oil on supported noble metal catalysts. Appl. Catal. B. Environ. 2005, 61, 130–139. [Google Scholar] [CrossRef]
  56. Aupretre, F.; Descorme, C.; Duprez, D. Bio-ethanol catalytic steam reforming over supported metal catalysts. Catal. Commun. 2002, 3, 63–267. [Google Scholar] [CrossRef]
  57. Cavallaro, S.; Chiodo, V.; Vita, A.; Freni, S. Hydrogen production by auto-thermal reforming of ethanol on Rh/Al2O3 catalyst. J. Power Sources 2003, 123, 10–16. [Google Scholar] [CrossRef]
Figure 1. Process flow diagram for hydrogen production from 40 wt.% moist PEFB biomass.
Energies 14 04767 g001
Figure 2. Aspen Plus process flow diagram showing pre-processing, pyrolysis, ATR and hydrogen purification by PSA (PAPS process).
Energies 14 04767 g002
Figure 3. Influence of the amount of steam, expressed as S/C ratio, on hydrogen yield for equivalence ratio, λ = 0.25. For the base case, ATR and CO-shift occur at 3 bar and H2 recovery is carried out at 10 bar. Equilibrium temperatures in Celsius degrees (°C) are included as data labels.
Energies 14 04767 g003
Figure 4. Syngas yield on a dry nitrogen-free basis. For the base case, ATR and shifting occur at 3 bar and H2 recovery is carried out at 10 bar (a) λ = 0.23; (b) λ = 0.25; (c) λ = 0.28; (d) λ = 0.36.
Energies 14 04767 g004
Figure 5. Effect of S/C ratio and equivalence ratio λ on syngas ratio H2/CO and hydrogen production. For the base case, ATR occur at 3 bar (a) λ = 0.23; (b) λ = 0.36. Equilibrium temperatures in Celsius degrees (°C) are included as data labels.
Energies 14 04767 g005
Figure 6. Hydrogen efficiency for different equivalence ratios and S/C ratios for the PAPS processes. For the base case, ATR and shifting occur at 1 bar and H2 recovery is carried out at 10 bar. (a) Using bio-oil (LHV 16.6 MJ/kg) as starting material (Equation (5)). (b) Using wet PEFB (40% moisture, LHV 11.0 MJ/kg) as starting material (Equation (6)).
Energies 14 04767 g006
Figure 7. (a) Mass and (b) energy flows for 5000 kg/h biomass PAPS process plant with 75% H2 recovered as pure gas at 10 bar. S/C = 2.2, λ = 0.28. Energy balance is based on LHV for 5000 kg/h biomass.
Energies 14 04767 g007aEnergies 14 04767 g007b
Figure 8. Hot and cold composite curves for base case simulation PAPS process.
Energies 14 04767 g008
Figure 9. Flowsheet for a heat integrated PAPS-BT process: pyrolysis and autothermal reforming process with hydrogen separation by PSA, featuring combined heat (HX9) and power by backpressure turbine (BPT).
Energies 14 04767 g009
Figure 10. (a) Influence of pyrolysis product yield on the overall process efficiency and the hydrogen efficiency. The five cases examined are labelled from 1 to 5 in order of increasing bio-oil yield. (b) Turbine work output ‘W’, heat output ‘H’ and electrical input ‘E’ for the various pyrolysis yield cases examined in this study.
Energies 14 04767 g010
Figure 11. Influence of pressure on overall process efficiency for a 5000 kg/h PEFB plant operating at 3, 10, 20 and 30 bar.
Energies 14 04767 g011
Figure 12. Overall process efficiencies for systems using air and systems using oxygen. (left) 10,000 kg/h PEFB plant, (right) 20,000 kg/h PEFB plant.
Energies 14 04767 g012
Figure 13. Thermodynamic equilibrium plots showing syngas composition and temperature obtained at S/C = 2.2 and 1 bar while varying λ from 0 to 1 for bio-oil surrogate (m.f.) ATR.
Energies 14 04767 g013
Figure 14. Conversion of oxygen, bio-oil, and water (experiment and equilibrium) using Rh-Al catalyst at 1 bar with reactor bed temperatures of 593 °C (λ = 0.318) and 572 °C (λ = 0.391) for S/C ratios of 2.2 and 3, respectively (S/C ratio in brackets next to catalyst name).
Energies 14 04767 g014
Figure 15. Product distribution for bio-oil surrogate ATR using the Rh-Al catalyst at 1 bar and S/C of 2.2 (with 593 °C and λ = 0.318) and S/C of 3 (with 572 °C and λ = 0.391), respectively.
Energies 14 04767 g015
Table 1. List of all possible global reactions taking place in the reformer and shift reactor.
ReactionReactionDescription
R1CnHmOk + (n–k)/2 O2 → nCO + m/2 H2Partial oxidation
R2CnHmOk + (n + m/4–k/2)O2 → nCO2 + m/2 H2OComplete oxidation
R3CnHmOk + (n – k) H2O ⇆ nCO + (2n+m–2k)/2 H2Steam reforming
R4CnHmOk → kCO + m/2 H2 + (n – k) CDecomposition
R5CO + H2O ⇆ CO2 + H2Water gas shift
R62CO ⇆ CO2 + CBoudouard reaction
R7C + 2H2 ⇆ CH4Methanation of carbon
R8C + H2O ⇆CO + H2Carbon gasification 1
R9C + 0.5O2 → COCarbon gasification 2
R10CH4 + H2O ⇆ CO + 3H2Methane steam reforming
R11CO + 0.5O2 → CO2Carbon monoxide oxidation
R12H2 + 0.5O2 → H2OHydrogen oxidation
Table 2. Ultimate and proximate analysis (wt.%) of PEFB used for Aspen Plus simulation.
UltimateWt%ProximateWt%
C51.7Moisture40.0
H5.9Fixed carbon (FC) 113.3
O42.4Volatile matter (VM) 183.4
Cl0.0Ash 13.3
S0.0
N0.0
1 dry moisture free.
Table 3. Aspen Plus unit blocks used for the simulation and their description.
UnitBlock IDTypeSpecifications
CrusherCRUSHERCrusherUsed to reduce initial PEFB size from 400 mm to about 15 mm; specified using a particle size distribution (PSD).
DryerDRYERRStoicAir drying at 1 bar and 101 °C. PEFB’s moisture reduced from 40 to 10%. Drying reaction: Biomass(wet)→0.0555084H2O
MillBMILLCrusherUsed to further reduce the size of the dried PEFB from 15 mm to 2 mm.
Pyrolysis reactorPYROLYSERYieldUses product yield distribution data. Operated at 500 °C and 1 bar. Reaction heat supplied by the heat stream, P-HEAT, from the combustor.
Solids removalSOLIDSP1 & S-SEP2Cyclone and ESP99% solid removal
Bio-oil recoverySEP-1Sep Cooling and condensation to 40 °C at 1 bar.
ReformerREFMRGibbsCalculates equilibrium composition of the reformer by minimisation of Gibbs free energy. Operated at 3 bar under adiabatic conditions.
Shift reactorSHIFTRGibbs3 bar and 250 °C (isothermal). CH4 set as inert.
PSAPSASep75% H2 recovery at 10 bar (base case).
CombustorCOMBUSTRStoic1100 °C and 1 bar with sufficient excess air to match the combustor’s enthalpy to the P-HEAT stream used for pyrolysis (fired heat exchanger).
Ash removalASHSEPCyclone99% ash removal.
CoolersC1, C2 and C3HeaterCool inputs streams to 30, 40 and 30 °C, respectively
HeatersH1, H2 and H3HeaterSupply heating duties of 436 kW, 11 kW and 257 kW resp. (for the base case).
Heat exchangersHX1-HX5HeatXMinimum temperature of approach set at 20 °C.
Phase separatorsSEP-2, 3 and 4SepTwo phase flash adiabatic separators at input stream temperature and pressure. Actual output stream composition specified in some cases.
CompressorsCOMP-1 and 2 ComprIncrease the pressure of air and syngas to 3 and 10 bar, respectively.
PumpsP1 and P2PumpIncrease bio-oil and water pressure, respectively, to reformer value.
Table 4. Pyrolysis yield at 500 °C and 1 bar for 10% moisture PEFB (3333.3 kg/h).
PhaseYield (wt.%)PhaseYield (wt.%)
Solid (char and ash)15Liquid (bio-oil)70
Gas12Ash3
Bio-Oil CompoundMass FractionBio-Oil CompoundMass Fraction
Acetic acid0.055Levoglucosan0.027
Formaldehyde0.060Palmitic acid0.005
Acetaldehyde0.005H20.006
2-butanol0.005CH40.003
Furfural0.098CO0.063
Phenol0.005CO20.052
Creosol0.022C (char)0.123
Guaiacol0.087Ash0.031
Catechol0.180H2O0.172
Table 5. Bio-oil surrogate feed component flow values used in Aspen Plus simulation and experiments.
Bio-Oil CompoundFeed (mol s−1)Carbon in Feed (mol s−1)% C in Feed
Formaldehyde1.07 × 10−61.18 × 10−67.80
Acetaldehyde6.97 × 10−81.54 × 10−71.02
2-butanone4.36 × 10−81.92 × 10−71.27
Acetic acid4.88 × 10−71.08 × 10−67.14
Water5.14 × 10−600.00
Furfural5.49 × 10−73.02 × 10−619.97
Phenol3.49 × 10−82.30 × 10−71.52
Creosol8.71 × 10−87.68 × 10−75.08
Guaiacol2.53 × 10−71.95 × 10−612.89
Catechol8.80 × 10−75.82 × 10−638.48
Palmitic acid8.71 × 10−91.54 × 10−71.02
Levoglucosan8.71 × 10−85.76 × 10−73.81
Total8.71 × 10−61.51 × 10−5100
Table 6. Energy demand for different process operations determined for the base case 5000 kg/h PEFB plant.
Unit or ProcessValueNotes/Reference(s)
Crushing and milling120 kWPeryoga, et al. [45] and Spliethoff and Hein [46]
Drying (with steam at 101 °C)1.86 MW For a 70 % efficient stream heated dryer
Pyrolysis2.055 MWCorresponds to a heat requirement of 2219 kJ/kg. This heat requirement is satisfied completely by the combustor’s enthalpy
Compression682 kWValue includes the energy required by a blower or compressor for combustion air transport (not included in Figure 9)
Pumping14.3 kWThis includes cooling water circulation with a calculated flow of 315 m3/h and pump to recirculate water for CHP unit
Electrostatic precipitator4.8 kW1 kWh per 1000 m3 of treated gas
Table 7. Possible pyrolysis yields listed as cases.
PhaseCase 1Case 2Case 3Case 4 *Case 5
Liquid5055607075
Char2520151512
Gas2020221210
Ash55333
* Case 4 is the pyrolysis yield used for the base case.
Table 8. Products selectivity and carbon formation for bio-oil surrogate ATR at 1 bar and S/C molar ratio of 2.2 and 3 (corresponding to reaction temperatures of 593 and 572 °C, respectively). λ = 0.318 and 0.391 for S/C ratios of 2.2 and 3, respectively.
Selectivity Carbon
(mg/g(cat).h)
CatalystS/CH2COCO2CH4H2/COCO2/CO
Rh-Al2.296.022.972.94.24.43.265.4
Equilibrium 2.298.220.877.12.25.73.70.0
Rh-Al396.818.877.83.45.54.171.6
Equilibrium 398.614.084.21.88.86.00.0
Table 9. Conversion and product distribution for ATR of bio-oil at S/C ratios of 2.2 and 3 for different air flows at 1 bar, includes Fischer–Tropsch H2/CO and module M values.
Conversion,
%
Dry Gas Composition,
Mol%
SyngasF-T ModuleH2 Yield,
mol H/mol C
S/Cλ *T (°C)Bio-oilH2OH2COCO2CH4H2/COM
2.20.318 159383.720.450.311.436.22.14.420.2960.93
0.35 264191.716.348.816.134.50.63.040.2830.89
0.366 367095.216.548.714.636.40.33.340.2410.91
30.3351 157287.114.850.89.238.31.75.490.2630.98
0.3682 262093.717.052.76.740.10.47.820.2691.02
0.3853 364795.311.750.69.439.80.25.360.2190.89
* Equivalence ratio values calculated on moisture free basis. 1 optimal/equivalence ratio. 2 10% increase of optimal equivalence ratio. 3 15% increase of optimal equivalence ratio.
Publisher’s Note: MDPI stays neutral with regard to jurisdictional claims in published maps and institutional affiliations.

